
the Creative Commons Attribution 4.0 License.
the Creative Commons Attribution 4.0 License.
 | 12 Oct 2026
Characterizing lightning NOx production in the Ebro Valley with meteosat 12 LI and LMA observations
Francisco J. Pérez-Invernón

Francisco J. Gordillo-Vázquez
Oscar van der Velde
Joan Montanyà
Jesús Alberto López Trujillo
Nicolau Pineda
Diego Loyola
Christoph Knote
Alexandre O. Fierro
Heidi Huntrieser
Lightning is one of the main sources of NOx in the Earth's atmosphere, yet there is considerable variability in NOx production during thunderstorms. In this study, we combined optical lightning data from the Meteosat Third Generation (MTG) Lightning Imaging (LI) instrument, which provides information on the occurrence rate and physical characteristics of lightning flashes, measurements from an extended Lightning Mapping Array (LMA) consisting of 24 sensors, lightning measurements from the Lightning Location System (LLS) of the Meteorological Service of Catalonia (MSC), and TROPOspheric Monitoring Instrument (TROPOMI) cloud and NO2 research products to investigate lightning NOx emissions in the Ebro Valley (Spain). WRF-Chem simulations were used to calculate the necessary air mass factors and to subtract the NOx not produced by lightning from the TROPOMI measurements, allowing a more accurate estimation of lightning-induced NOx. We found positive relationships between lightning-produced NOx per flash and several lightning properties, including flash channel length, radiance, footprint, duration and the length of the optical continuous signal detected from space. These results highlight the importance of combining detailed lightning observations with atmospheric modeling to quantify NOx emissions from thunderstorms.
- Article
(5296 KB) - Full-text XML
-
Supplement
(20347 KB) - BibTeX
- EndNote


Lightning produces nitrogen oxides (NOx= NO + NO2) by following the Zeldovich mechanism (Zel'dovich, 1946). Lightning accounts for about 10 % of total emissions of NOx (Schumann and Huntrieser, 2007) in the atmosphere, producing between 3 and 7 Tg N in NOx per year (Pickering et al., 2026), or between 150 and 350 mol NOx per flash. These emissions are even more important in the tropics, accounting for up to 20 % of the total NOx production (Schumann and Huntrieser, 2007; Pickering et al., 2026, and references therein). Lightning-produced NOx (LNOx) is about 6 times more efficient in driving ozone production than anthropogenic NOx emissions, producing about 100 molecules of ozone per molecule of lightning-emitted NOx molecule (Schumann and Huntrieser, 2007; Dahlmann et al., 2011). In turn, LNOx affects the oxidizing capacity of the atmosphere and the tropospheric budget of carbon monoxide and methane (Wu et al., 2007; Murray et al., 2012; Gordillo-Vázquez et al., 2019; Pérez-Invernón et al., 2025a).
The LNOx Production Efficiency (PE), defined as the total production of NOx mol or molecules per lightning flash, exhibits substantial variability across different measurements, likely reflecting both measurement uncertainties and influences of lightning flash characteristics. Precise determination of the variability of LNOx PE is essential to determine the role of lightning in the chemical composition of the atmosphere (Price et al., 1997; Allen and Pickering, 2002; Tost et al., 2007; Murray et al., 2012; Jöckel et al., 2016; Gordillo-Vázquez et al., 2019; Luhar et al., 2021; Pérez-Invernón et al., 2023a, 2025a). Airborne campaigns have significantly contributed to set the current estimations of LNOx PE, such as The Deep Convective Clouds and Chemistry (DC3) field campaign (Barth et al., 2015) in the USA, the TROCCINOX campaign in the tropics (Huntrieser et al., 2008) and the EULINOX campaign in Europe (Huntrieser et al., 2002; Fehr et al., 2004). Combination of airborne campaign with ground-based instruments suggest that there is a proportional relationship between LNOx PE and the flash channel lengths (Stith et al., 1999; Schumann and Huntrieser, 2007; Huntrieser et al., 2008; Pickering et al., 2024, 2026). In turn, laboratory and modeling studies have reported a positive relationship between lightning flash energy and flash channel length with LNOx PE (Stark et al., 1996; Wang et al., 1998; Ripoll et al., 2014; Jenkins et al., 2021; Pérez-Invernón et al., 2025b). According to estimates reported in the literature, the NOx production per unit discharge of energy ranges from 1.4×10¹⁶ to , while the NOx production per unit flash channel length spans from 0.5×10²¹ to (Schumann and Huntrieser, 2007). Estimations of LNOx PE from triggered lightning reported by Rahman et al. (2007) found a production of LNOx per flash channel length in three measured flashes, with values ranging between 2.0×10²² and . According to Rahman et al. (2007), slow discharge processes occurring on time scales ranging from milliseconds to hundreds of milliseconds, such as continuing currents and other steady currents lasting for tens to hundred milliseconds, account for approximately 80 % of the total NOx production per lightning flash. However, the possible relationship between continuing current and LNOx production has never been confirmed using systematic measurements in storms, mostly because of difficulties in monitoring the occurrence of lightning with continuing currents over large areas. Recent efforts have been made to detect the presence of continuing current in lightning from space (Bitzer, 2017; Fairman and Bitzer, 2022). However, space-based optical sensors have a low detection efficiency for continuing currents occurring below clouds (Ding et al., 2024; Roncancio et al., 2025; Wemhoner et al., 2025). The combination of space-based measurements with ground radio detections could serve to monitor and characterize the continuing currents over large areas (Bozóki et al., 2025; Camino-Faillace et al., 2026). Recent results have already shown that global Extremely Low Frequency (ELF) magnetic field signals, which are strongly influenced by the presence of continuing current in lightning, can serve as a proxy for estimating inter-annual variations in LNOx (Wang et al., 2025).
Nadir-viewing satellites have provided significant advances in the estimations of LNOx PE (e.g., Pickering et al., 2016; Laughner and Cohen, 2017; Bucsela et al., 2019; Allen et al., 2019; Lapierre et al., 2020; Allen et al., 2021a; Zhang et al., 2022; Pérez-Invernón et al., 2022). In particular, systematic retrievals of LNOx from the Ozone Monitoring Instrument (OMI) by Bucsela et al. (2019); Allen et al. (2019) and from the Sentinel-5P TROPOspheric Monitoring Instrument (TROPOMI) by Allen et al. (2021a) have reported an inverse relationship between lightning flash rates and the LNOx PE. Bucsela et al. (2021) presented a revised evaluation of TROPOMI-based LNOx PE estimates by incorporating lightning observations from the Geostationary Lightning Mapper (GLM) and a new set of atmospheric chemistry simulations to account for the influence of background-NOx not produced by fresh lightning on the retrievals. This study reported a weaker relationship than that found by Bucsela et al. (2019), particularly for weak to moderately active thunderstorms (defined as fewer than 3000 flashes per hour and degree).
Using a combination of GLM lightning observations and TROPOMI measurements, Allen et al. (2021b) and Allen et al. (2021a) reported a weak positive relationship between LNOx PE and lightning flash optical energy. In addition, Pérez-Invernón et al. (2023b) and Pickering et al. (2024) estimated LNOx PE per flash by combining Lightning Mapping Array (LMA) observations with satellite-based and aircraft-based NOx measurements, respectively. These studies found that thunderstorms with higher lightning flash rates tend to produce shorter lightning channel lengths and lower LNOx PE per flash, consistent with earlier findings. This behavior can be reconciled by the inverse relationship between lightning channel length and flash occurrence frequency within storms (Bruning and MacGorman, 2013; Bruning and Thomas, 2015).
More recently, Seiler et al. (2025) assessed the uncertainty of satellite-based LNOx PE estimates by comparison with aircraft measurements, reporting differences between satellite-retrieved and aircraft-retrieved lightning-NOx columns ranging from approximately 20 % to 50 %.
The Ebro Valley, located in the North of Spain, is an area of high lightning activity. Airflows over the Ebro Valley are shaped by the Mediterranean Sea and Atlantic Ocean, the Pyrenean mountain range, cold fronts traversing Europe, and a thermal low over the Iberian Peninsula (Pineda et al., 2010). Pérez-Invernón et al. (2022) provided the first TROPOMI-based LNOx PE estimations over the Ebro Valley using different lightning location systems and TROPOMI products. Pérez-Invernón et al. (2023b) combined lightning measurements from the Ebro LMA (eLMA) with TROPOMI cloud and NO2 products, as well as Earth Networks Lightning Total Network (ENTLN) lightning measurements, to report a positive relationship between lightning flash channel lengths and LNOx PE. Pérez-Invernón et al. (2023b) estimated the background-NOx not produced by lightning by using TROPOMI-derived tropospheric NOx over TROPOMI pixels without lightning in the previous 5 h. In this study, to reduce uncertainties in estimates of LNOx PE, we investigate relationships between lightning flashes and LNOx PE in the Ebro Valley to contribute to reduce current uncertainties in the measured variability of LNOx PE. We use optical measurements of lightning provided by the Meteosat Third Generation (MTG) Lightning Imager (LI) onboard Meteosat-12 satellite (Dobber and Grandell, 2014; Holmlund et al., 2021) and Very High Frequency (VHF) Lightning Mapping Arrays (LMAs) (Rison et al., 1999) measurements of lightning from the recently upgraded extended Catalonia LMA system (XCALMA) (van der Velde and Montanyà, 2013; Rodriguez et al., 2025) together with the Deutsches Zentrum für Luft- und Raumfahrt (DLR) TROPOMI operational cloud and TROPOMI research NO2 products, also known as TROP-DLR (Liu et al., 2021; Loyola et al., 2018). Meteosat 12 LI lightning space-based measurements include geometric and temporal metrics of lightning that are influenced by cloud cover, such as the area illuminated by the discharge, named flash footprint, the detected total radiance of the flash, the optical duration and the temporal evolution of the optical signal detected from space. In turn, XCALMA provides estimations of the total flash channel length, volume and duration of flashes from Very High Frequency (VHF) sources without the effect of cloud distortion. Additionally, we employ the Weather Research and Forecasting (WRF) coupled with chemistry (WRF-Chem) (Grell et al., 2005), version 4.3., to estimate the case-based background-NOx not produced by lightning and to extract the average LNO2 and LNOx vertical profiles that are needed to calculate the air mass factor with simulations nudged towards lightning data from Meteosat 12 LI. The WRF-Chem model has demonstrated effectiveness in calculating UV-visible air mass factors, which are crucial for deriving vertical column densities of NOx from nadir-viewing satellite measurements of NO2 slant column densities (Laughner and Cohen, 2017).
This paper is organized as follows: Sect. 2 describes the data and methodology; Sect. 3 presents the main results, discusses their implications and limitations; and Sect. 4 concludes with final remarks and future research directions.
This Section describes the data and methodology. Section 2.1 describes the TROPOMI operational and research cloud and NO2 products. The lightning measurements are described in Sect. 2.2. Section 2.3 presents the case study selection. Section 2.4 describes the air mass factor and bakcground-NOx calculations based on WRF-Chem model simulations. Finally, Sect. 2.5 presents the method to calculate the LNOx PE. The complete methodology is summarized in Fig. 1.
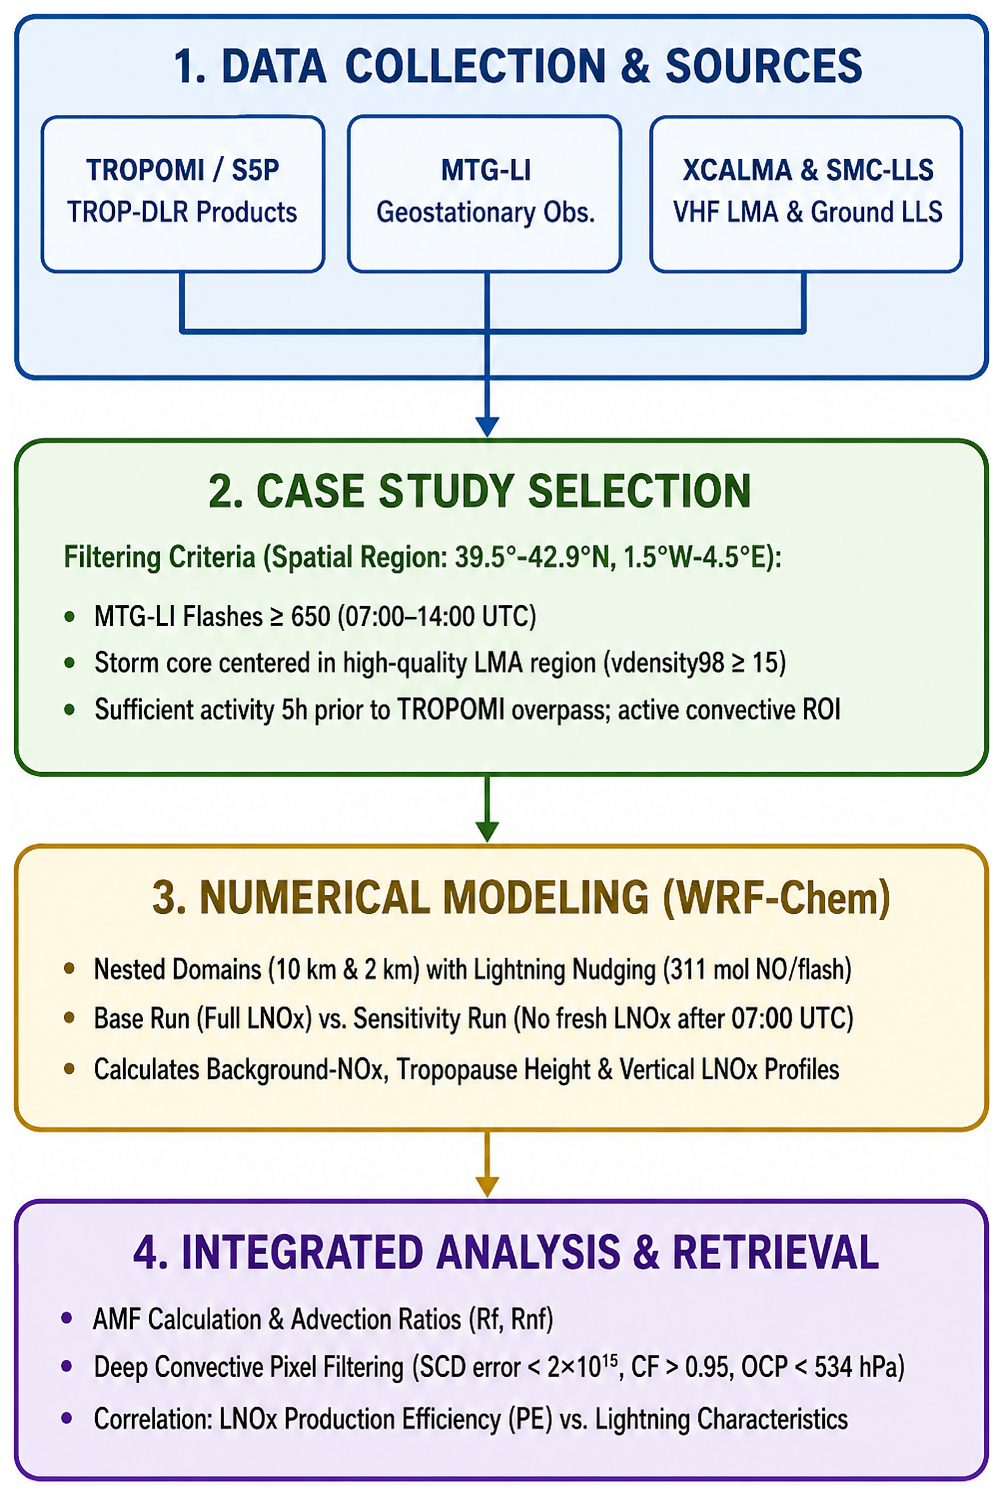
Figure 1 Overview of the methodological framework used to investigate lightning-produced NOx using satellite observations, ground-based lightning measurements, and numerical modeling.
2.1 TROP-DLR Operational and Research Products
TROPOMI, operating since 13 October 2017 from a low Earth polar orbit onboard the European Space Agency Sentinel-5 Precursor satellite, is a passive imaging spectrometer with eight spectral bands from ultraviolet (UV) to shortwave infrared (SWIR). It provides daily global measurements of cloud properties and several trace gases (Veefkind et al., 2012), with overpasses at approximately 13:30 local solar time.
In this study, we used the TROP-DLR operational cloud and NO2 research products (Liu et al., 2021; Loyola et al., 2018), which were recently applied by Pérez-Invernón et al. (2022, 2023b) for LNOx PE estimates. The TROP-DLR operational cloud and NO2 research products provide the slant column density (SCD) of NO2, the associated SCD error, the quality assurance (QA) value, the stratospheric vertical column density (VCD) of NO2, the stratospheric air mass factor (AMF) of NO2, the cloud fraction (CF), the cloud optical thickness (COT), and the optical centroid pressure (OCP), with a horizontal resolution at nadir of 3.5 km×5.5 km. The TROP-DLR NO2 research product is better suited for estimating LNOx than the operational TROPOMI NO2 product, as it provides more reliable cloud properties and NO2 retrievals over bright surfaces, such as thunderclouds. Cloud properties are derived using the OCRA/ROCINN algorithms within the Clouds-As-Layers (CAL) model (Loyola et al., 2018), which treats clouds as optically uniform layers and employs a more realistic cloud scattering approach than the Cloud as Reflecting Boundaries (CRB) model implemented in the operational TROPOMI NO2 product (Lindfors et al., 2018; Pérez-Invernón et al., 2022; Van Geffen et al., 2022).
The TROP-DLR NO2 research product further applies the Directionally dependent STRatospheric Estimation Algorithm from Mainz (DSTREAM) to separate the contributions of the troposphere and stratosphere to the NO2 column density (Liu et al., 2021), without relying on atmospheric model inputs. Following Pérez-Invernón et al. (2022, 2023b), we selected TROPOMI pixels with SCD NO2 errors below . Pixels with deep convection were defined as those with an effective cloud fraction greater than 0.95 and an OCP below 534 hPa (Pérez-Invernón et al., 2022, 2023b).
2.2 Lightning measurements
The MTG-LI onboard Meteosat-12 satellite (Dobber and Grandell, 2014; Holmlund et al., 2021) was launched on 13 December 2022. Pre-operational Meteosat 12 LI (previously Meteosat Third Generation, MTG) L2 data were publicly released 4 July 2024, and are declared operational on 31 October 2024 at 10:00 UTC (Enno et al., 2025). Meteosat 12 LI detects continuously optical signal emitted by lightning from geostationary orbit focused around 0° longitude, providing near-continuous views of the Earth's full disk, including Europe, Africa, the Atlantic Ocean and parts of South America (Gedik et al., 2025; Bližňák and Sokol, 2026). The CMOS detector of Meteosat 12 LI detects light at 1 kHz sampling frequency within a 1.9 nm wide band centered on the atomic oxygen triplet at 777 nm, with a 4.5 km resolution at sub-satellite point (0° latitude, 0° longitude) (Enno et al., 2025). Meteosat 12 LI L2 data include lightning detections at three hierarchical levels: events, groups, and flashes. Events are pixels illumined by lightning during one frame. Events are clustered into a group if they are within one LI frame and spatially contiguous. Finally, flashes are formed by groups separated by less than 330 ms and within about 16 km of each other. Relevant physical information about flashes and groups provided by Meteosat 12 LI L2 data is used in this study, such as flash and groups id, flash and group time, flash duration, flash and group coordinates, total flash radiance, number of groups in a flash, and flash footprint. It is important to note that flash and group properties, such as radiance, duration, and footprint, are influenced not only by the intrinsic characteristics of the lightning but also by the cloud structure (Luque et al., 2020). Apart from the flash and group explicitly included in the Meteosat 12 LI L2 data, we have produced two new variables to account for the time continuity of the optical signal of flashes detected by Meteosat 12 LI. These variables are the total number of time-contiguous groups per flash and the ratio of flashes containing at least 5 ms of time-contiguous optical signal to the total number of flashes reported by Meteosat 12 LI in each flash. The reason for defining these new variables is that the duration of flashes reported by Meteosat 12 LI does not contain information about the total time in which the discharge is optically active. It is important to note that time contiguous optical signal of flashes reported by Meteosat 12 LI could be a proxy for continuing current in CG, but also for in-cloud lightning activity. Bitzer (2017) classified lightning flashes reported by the Lightning Imaging Sensor (LIS) as CG flashes with continuing current using a criterion of at least 10 ms of time-continuous signal. However, the GLM, in geostarionary orbit as Meteosat 12 LI, has a low detection efficiency for the optical signal emitted by continuing currents (Montanyà et al., 2021; Ding et al., 2024; Roncancio et al., 2025; Camino-Faillace et al., 2026) and is more sensitive to in-cloud activity associated with CG lightning (Fairman and Bitzer, 2022; Wemhoner et al., 2025). Therefore, we cannot use Meteosat 12 LI solely to distinguish the LNOx produced by continuing currents or by time contiguous in-cloud activity to determine if continuing currents lasting more than 5 ms produce more LNOx in CG strokes than shorter CG strokes, as proposed by Rahman et al. (2007). However, we can analyze possible relationships between LNOx and the time continuity of the optical signal of lightning detected by Meteosat 12 LI to better understand the role of continuing currents and in-cloud continuous activity in the emissions of LNOx. The total number of time-contiguous groups per flash and the ratio of flashes containing at least 5 ms of time-contiguous optical signal to the total number of flashes are determined by using Meteosat 12 LI L2 group data. A time-contiguous group is defined as a set of groups within the same flash where at least one group occurs with a time difference of less than 1.1 ms.
The Ebro Lightning Mapping Array (eLMA) (van der Velde and Montanyà, 2013; Montanyà et al., 2014) is a VHF time-of-arrival network (Rison et al., 1999) that was initially established in the Ebro Valley in 2011 and has been operational since then. Between 2023 and 2025, the eLMA network expanded up to 30 stations. The now so-called XCALMA (eXtended CAtalonia Lightning Mapping Array) extends the eLMA coverage mostly to the northern and eastern regions of Catalonia, with 15 new rev. 5 stations deployed by the Meteorological Service of Catalonia (Rodriguez et al., 2025). Furthermore, the initial 15 eLMA stations were enhanced to the LMA rev. 5 version (Van Der Velde et al., 2023; Montanya et al., 2024; van der Velde et al., 2024). In this study, we use lightning data reported by XCALMA between 4 July 2024 and 4 May 2025, based on measurements from the 24 active stations shown in Fig. 2. Lightning sources are located using a minimum of 5 or 6 stations. The 3-dimensional locations of VHF sources in time reported by XCALMA are clustered into flashes in a different way than the previous study Pérez-Invernón et al. (2023b), which used eLMA data. The data are initially processed using a simple filter to remove scattered sources (fewer than 3 sources in a km grid cell within a 100 ms interval). A DBSCAN-based flash clustering method (Fuchs et al., 2016) was refined (Van Der Velde et al., 2023; Montanya et al., 2024; van der Velde et al., 2024) using two passes in order to perform better for both convective and stratiform flashes. The first pass groups sources at 300 ms and 4 km separation criteria. The second pass identifies convective and stratiform flash regions, and proceeds to recluster the associated sources with longer time and distance criteria to prevent the large stratiform flashes from being broken into multiple small flashes. At greater distances from the LMA network continuous leader activity within a flash (Van Der Velde et al., 2023) is no longer detectable, and the vertical position accuracy is reduced. For this reason, maps of quality metrics were produced to select storms used for this study. Pineda et al. (2025) compared lightning detection between XCALMA and Meteosat 12 LI, revealing that the DE of Meteosat 12 LI and XCALMA are comparable for thunderstorms with low lightning activity (below 15 flashes per minute). However, the DE of Meteosat 12 LI decreases significantly for more active thunderstorms. Conversely, the study also reported an increase in the DE of Meteosat 12 LI for higher intracloud (IC) flash rates.
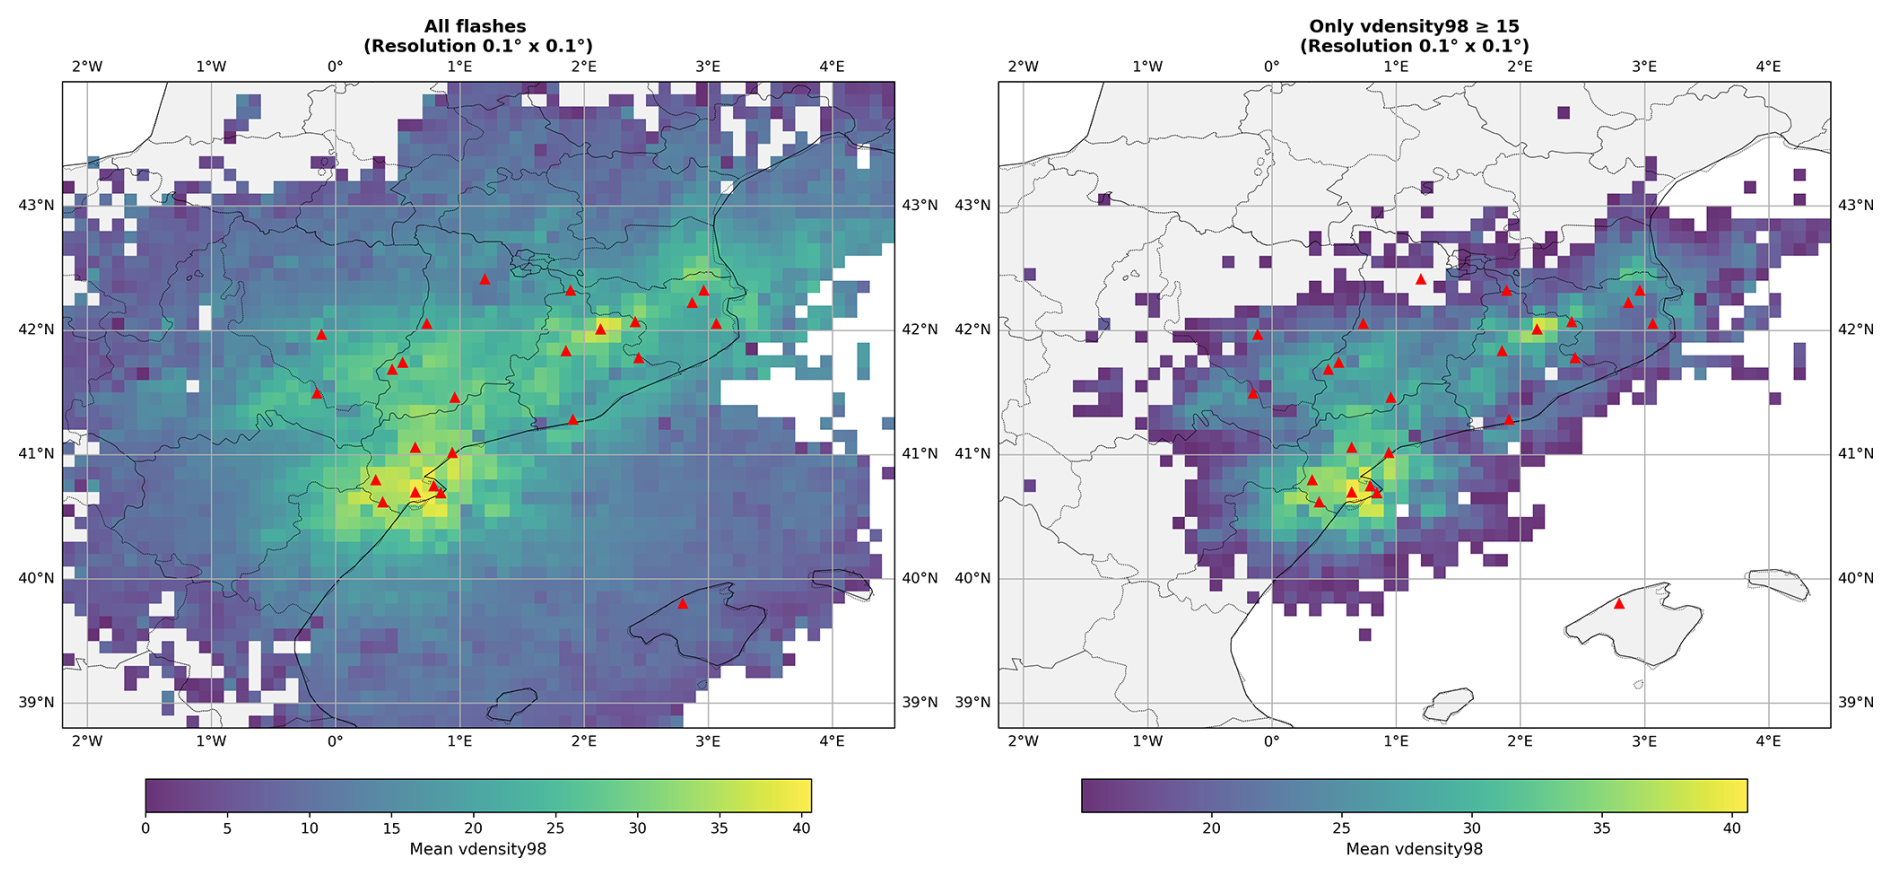
Figure 2 Left panel: 98th percentile vertical density score (vdensity98) averaged over all the flashes analyzed in this study and contained in each 0.1°×0.1°. Right panel: Masked data showing only pixels with vdensity98 ≥15, showing the region with the best quality XCALMA data. Locations of the XCALMA sensors are included (red triangles).
The variables of each flash extracted from XCALMA for this study include the median flash latitude and longitude, flash start time, flash channel length, flash volume, flash duration, and the 98th percentile vertical density score (vdensity98). The vdensity is calculated using the standard deviation of altitude in 10 ms time steps. It clusters horizontally within every 10 ms, and for each cluster, the metric is defined as the square root of the number of sources in the cluster divided by the variance of their altitudes. This metric correlates inversely with the horizontal and, in particular, the vertical dispersion of points around the true location. Subsequently, vdensity98 is calculated per flash, indicating the quality of the best part of the flash. The vdensity98 ranges approximately up to 100, with higher values indicating better quality. In Fig. 2, we show the 98th percentile vertical density score averaged over all the flashes analyzed in this study and contained in each 0.1°×0.1° latitude and longitude grid boxes.
We incorporate CG lightning data provided by the Lightning Location System (LLS) operated by the Meteorological Service of Catalonia (SMC) (San Segundo et al., 2020). In particular, we calculate the ratio of CG flashes detected by the SMS-LLS to the total number of flashes reported by XCALMA. The SMC-LLS is composed of four LS8000 and three LS-7002 stations (Vaisala Inc.) covering the region of Catalonia, including the Ebro Valley. CG strokes are detected by a Low Frequency (LF) sensor and located using a combination of the Time-of-Arrival/Magnetic Direction Finding techniques (Cummins et al., 1998; Cummins and Murphy, 2009). Like other Vaisala's LLSs based on this technology, the flash algorithm implemented in the SMC-LLS relies on the criteria of the U. S. National Lightning Detection Network (NLDN). Throughout the years of operation, the SMC-LLS performance has been experimentally evaluated in successive campaigns by means of electromagnetic field measurements and video recordings of natural lightning (Montanyà et al., 2006; Pineda and Montanyà, 2009; Montanyà et al., 2012), with a CG flash detection efficiency around 90 % and a location accuracy below 1 km. The method selected for grouping CG strokes into flashes significantly impacts the annual count of lightning flashes. Grouping algorithms primarily depend on two key characteristics of a lightning flash: its spatial extent and total duration. Since the mid-1990s upgrade of the U.S. NLDN, other LLSs based on the same technology have adopted the “NLDN” grouping criteria (Cummins et al., 1998). Under these criteria, a subsequent stroke is grouped with the first return stroke to form a flash if the stroke occurs within 1 s of the first return stroke, its location is within 10 km of the first return stroke, and the time interval between successive strokes is less than or equal to 500 ms. These criteria have remained largely unchanged through subsequent processor upgrades and changes in NLDN ownership (Cummins and Murphy, 2009; Schulz et al., 2005; Murphy and Nag, 2015; Schulz et al., 2016). More recently, the International Standard IEC 62858 (International Electrotechnical Commission, 2019) has also adopted this flash algorithm.
2.3 Case study selection
The case study selection is done by the following method. First, we identify candidate dates by filtering days between 4 July 2024, and 4 May 2025, with at least 650 flashes reported by Meteosat 12 LI within the latitude range of 39.5 to 42.9° N and the longitude range of 1.5° W to 4.5° E, and between 07:00 and 14:00 UTC. This spatial region is chosen as it encompasses most of the area where the LMA vdensity98 exceeds 15 (see Fig. 2). The 07:00–14:00 UTC time window is selected because the TROPOMI overpass occurs approximately between 12:00 and 14:00 UTC in all cases. This yields 35 candidate dates, as shown in Table S1 in the Supplement.
After this preselection of dates, we analyze the spatial distribution of lightning activity and discard dates where no electrical activity cores are centered in the area where the LMA vdensity98 exceeds 15. Twelve dates are excluded based on this criterion, as detailed in Table S1. We further analyze the remaining dates and exclude those with fewer than 650 flashes reported by Meteosat 12 LI in the 5 h preceding the TROPOMI overpass, or where the average flash age exceeds 3.5 h, thereby excluding an additional 4 dates (see Table S1). The age of each flash defined as the hours between the flash occurrence and the overpass of TROPOMI (Allen et al., 2021a). Finally, we exclude the date 17 October 2024, as TROPOMI NO2 observations indicated that the LNOx was advected outside the LMA-covered area, where most lightning occurred. This results in the selection of the 18 dates shown in Table S1. Finally, we define the region of interest (ROI) for each date based on the more active thunderstorm within the latitude range of 39.5 to 42.9° N and the longitude range of 1.5° W to 4.5° E from the spatial distribution of Meteosat 12 LI lightning flash activity, CF and OCP.
2.4 Air mass factor and background-NOx calculations
2.4.1 Simulated LNOx emissions
The model WRF‐Chem (Grell et al., 2005), version 4.3., is employed to estimate the case-based background-NOx not produced by lightning and to extract the average LNO2 and LNOx vertical profiles needed for calculating the air mass factor of LNOx in each TROPOMI pixel ().
Simulations were performed using two two-way nested domains. The outer domain (d01) had a horizontal grid spacing of 10 km (300 × 200 grid points) between 32 and 47° N latitude, and between 14.5° W and 16.5° E degrees longitude. The inner domain (d02) had a resolution of 2 km (406 × 366 grid points) between 37 and 42.9° N degrees latitude, and between 3.2° W and 5° E degrees longitude. To improve the vertical resolution of the simulation in both domains, the WRF preprocessing system was used to interpolate the meteorological input data from 34 to 37 vertical levels. This adjustment enhances the ability of the model to resolve atmospheric processes, particularly in the boundary layer and upper atmosphere, leading to more accurate and physically consistent simulations. The parent-child grid ratio was 5:1 in both space and time, and feedback from the inner to the outer domain was enabled. The model time step was 50 s in the outer domain. The base simulations with LNOx spanned three days, with the day of the TROPOMI overpass included as the final day of the integration, in order to ensure at least two days of model spin-up prior to the analysis period. Initial and boundary meteorological conditions were obtained from analyses of the NCEP GDAS/FNL 0.25 Degree Global Tropospheric Analyses and Forecast Grids (National Centers for Environmental Prediction, 2015) by using the WRF Preprocessing System (Skamarock et al., 2019). Boundary conditions were updated every 6 h. Model outputs were saved every 60 min (d01) and 10 min (d02).
Microphysics was represented using the WRF Single-Moment 6-class scheme (WSM6) scheme (Hong and Lim, 2006). Longwave and shortwave radiation were computed with the RRTM (Mlawer et al., 1997) and Goddard scheme (Chou and Suarez, 2026), respectively, with a radiation time step of 2 min. Surface layer fluxes were calculated using Monin-Obukhov similarity theory (Janjić, 1994), land surface processes were represented with the Noah Land Surface Model (Ek et al., 2003), and the planetary boundary layer was parameterized using the Yonsei University (YSU) scheme (Noh et al., 2003; Hu et al., 2013). Deep convection was parameterized only in the 10 km domain using the Grell 3D ensemble cumulus scheme (Grell and Dévényi, 2002), while convection was explicitly resolved in the 2 km domain. Upper-level damping was applied above 5 km. Grid nudging (FDDA) was applied during the first 2 d of simulation with relaxation coefficients of 3 × 10⁻⁴ s−1 for wind, temperature, and water vapor, excluding the planetary boundary layer.
Gas-phase and aerosol chemistry were simulated using MOZART gas-phase chemistry (Brasseur et al., 1998) coupled with GOCART aerosols (Chin et al., 2000). Photolysis rates and biogenic emissions were updated every 15 min, and gas-phase chemistry time steps were 5 s (d01) and 1 s (d02). Dry deposition of gases and aerosols, wet scavenging, vertical mixing, and convective transport (outer domain only) were enabled. The “wesely” utility from the WRF-Chem preprocessor tool (National Center for Atmospheric Research (NCAR), 2021) was used for calculating dry deposition rates. In turn, the “exo-coldens” utility was employed for calculating O2 and O3 column densities. Aerosol-radiation feedback was disabled. Anthropogenic emissions were prescribed hourly from external files interpolated by the “anthro-emiss” utility from EDGAR-HTAP anthropogenic emission files for the year 2010 (Janssens-Maenhout et al., 2015). Biogenic emissions were prepared by the “bio-emiss” usility and were computed online (Guenther et al., 2012). Biomass burning emissions were created by the “fire-emiss” utility from Fire INventory from NCAR (FINN) input (Wiedinmyer et al., 2011) and included with plume-rise parameterization (30 min update frequency). Chemical initial and lateral boundary conditions were produced by the “mozbc” utility from the Whole Atmosphere Community Climate Model (WACCM) (National Center for Atmospheric Research (NCAR), 2024; Buchholz et al., 2019).
Lightning nudging was applied in the nested domain with a 600 s interval (Fierro et al., 2012) by using Meteosat 12 LI lightning flash measurements to ensure that deep convection occurred at the location of observed flashes and to place lightning-NOx emissions. Lightning NO emissions are parameterized using the lightning nudging scheme in the nested domain, with an emission rate of 311 moles of NO per flash. We have defined a production of 311 moles of NO per flash, based on the widely used values of 1112 moles per flash for CG flashes (Price et al., 1997), 111.2 moles per flash for IC flashes (Price et al., 1997), and a CG-to-total flash ratio of 0.2 (Boccippio et al., 2001). Previous studies have reported substantially different estimates of the amount of NO produced per lightning flash (Schumann and Huntrieser, 2007). In the present study, the specific choice of the absolute LNOx production per flash is not expected to significantly affect our main conclusions, as our analysis focuses primarily on the relative variability of LNOx PE among individual thunderstorms, rather than on its absolute magnitude. Therefore, while the assumed emission factor influences the absolute LNOx concentrations simulated by WRF-Chem, it should have a limited impact on the relative differences in LNOx PE between the selected storm cases. In another set of simulations, the quantity of moles of NO emitted per flash is scaled using the ratio of the total number of flashes detected by the LMA to the total number of flashes detected by the Meteosat 12 LI within the region of interest. Given that the DE of XCALMA varies across the simulation domain, which extends beyond the region where vdensity98 exceeds 15, we adopted a simplified approach: rather than performing separate simulations with identical PE but differing total flash counts, we maintained a consistent total number of flashes in both simulations and adjusted the PE values accordingly. This method ensures a direct comparison of the impact of detection efficiency on the simulated outcomes. This approach enables the derivation of the background-NOx and the , which are subsequently used in the retrieval of LNOx PE using both the Meteosat 12 LI and LMA flash products. The vertical distribution of NO emissions follows the profiles described in Ott et al. (2010). To isolate the impact of fresh LNOx, we restarted the base simulations at 07:00 UTC (approximately 5 h before the TROPOMI overpass) and disabled LNOx emissions while preserving lightning nudging. This approach ensures that meteorological fields remain effectively unchanged.
The choice of a fixed amount of NOx per flash in the simulations may influence the mean LNOx per flash (LNOx PE) results obtained in this study, as the background NOx estimation will be strongly affected by this quantity. However, the primary goal of this study is to analyze the variability in LNOx production per flash among different storms. Therefore, any potential bias introduced by assuming a fixed amount of NOx per flash in the simulations will likely affect all storms in a similar manner, allowing us to explore correlations between this variability and the observed characteristics of the flashes.
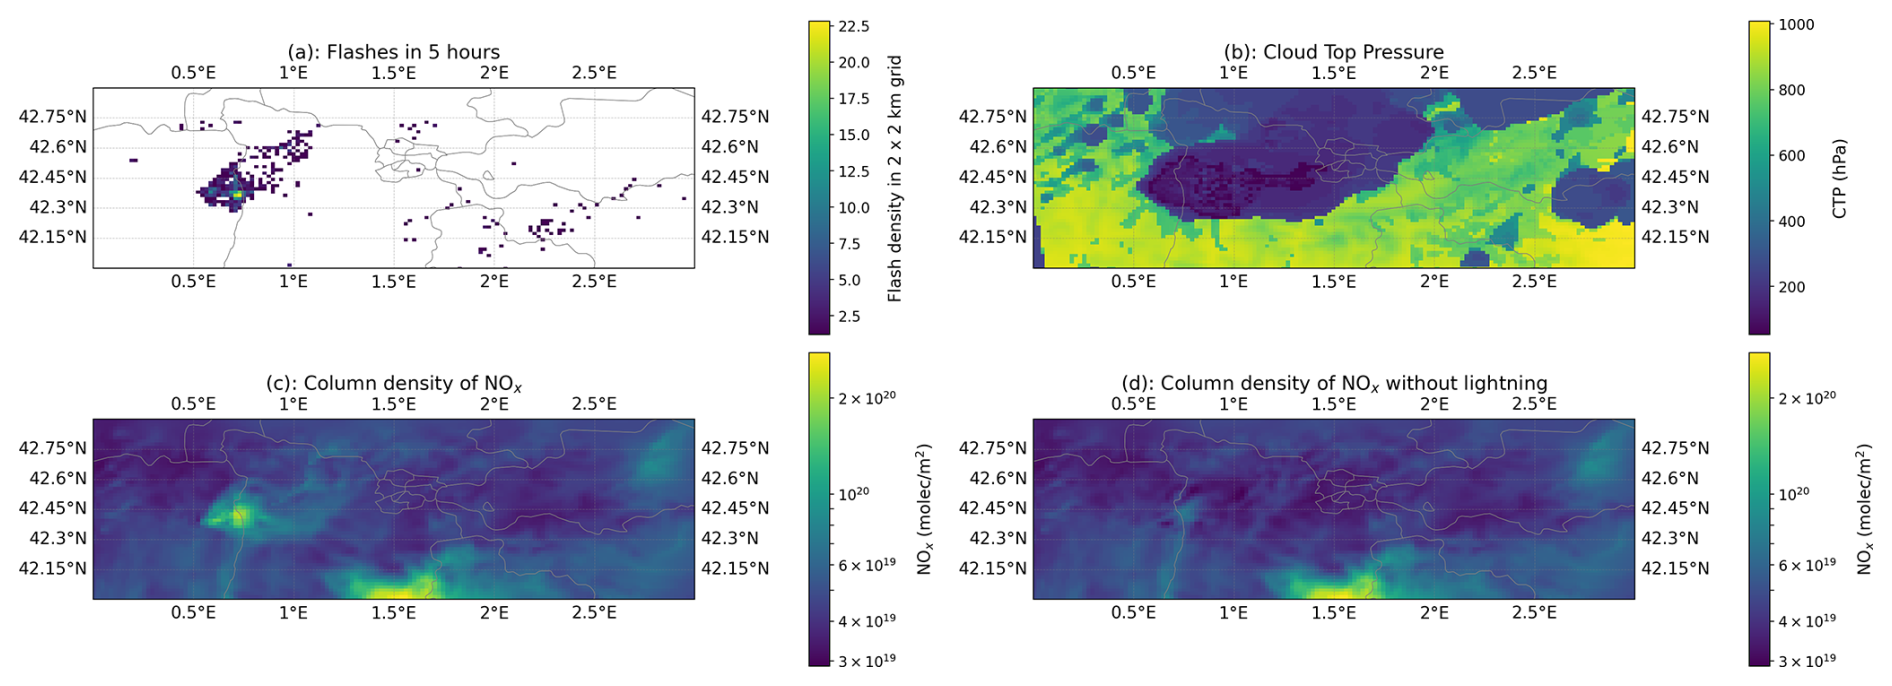
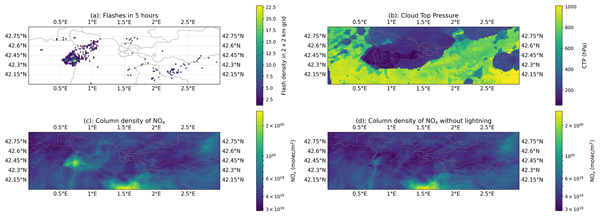
Figure 3 WRF-Chem simulation results for 6 July 2024 at 13:50 UTC, focused on the region of interest. (a) Assimilated lightning flashes between 08:50 and 13:50 UTC reported by Meteosat 12 LI. (b) Cloud Top Pressure (CTP). (c) Vertical Column Density of NOx. (d) Vertical column density of NOx in the simulation without fresh LNOx, i.e., with LNOx deactivated after 07:00 UTC. Meteosat 12 LI lightning data © EUMETSAT.
The “wrf-python” tool (Visualization & Analysis Systems Technologies, 2017) is used to obtain the cloud fraction, the cloud top temperature and the cloud top pressure at each grid point. In this study, the tropopause is defined according to the World Meteorological Organization (WMO) criteria as the lowest atmospheric level at which the vertical temperature lapse rate decreases to 2 °C km−1 or less, provided that this lapse rate is maintained over a minimum vertical extent of 2 km above this level (World Meteorological Organization, 1957). The tropopause height was calculated for each grid point in the model domain, integrating vertical profiles of temperature from the surface to the upper troposphere.
Figure 3 shows the simulation results for 6 July 2024 at 13:50 UTC, focused on the region of interest. The majority of the pixels with lightning activity in the previous 5 h (Fig. 3a) are located in regions with CTP below 534 hPa (Fig. 3b), indicating high convection. However, some lightning activity occurred in regions without significant convective activity at 13:50 UTC. The signal of LNOx can be clearly seen by comparison of Fig. 3c and d. The simulation results for other cases analyzed in this study can be seen in the Supplement (Figs. S1–S51).
2.4.2 Background-NOx and advection effects
The pairs of simulations with and without the effect of fresh LNOx emissions described in Sect. 2.4.1 were used to estimate the background-NOx not produced by lightning and the effect of advection in LNOx in each studied case, both for the case of Meteosat 12 LI and LMA flashes. We extracted simulation outputs from the nested domain for the 10 min window closest to the TROPOMI overpass and 5 h prior. We then calculated the VCD of LNOx for all pixels where the cloud fraction was ≥0.95 and the cloud top pressure was ≤534 hPa, integrating from the surface to the tropopause level. Finally, we compared simulations with and without fresh lightning NOx (LNOx) pixel by pixel to determine the ratio of the VCD attributable to fresh LNOx in pixels with lightning activity, named as Rf, and in pixels without lightning activity, named as Rnf, during the preceding 5 h. The ratios Rf and Rnf averaged over all the pixels with and without lightning will subsequently be used to estimate LNOx from TROPOMI measurements.
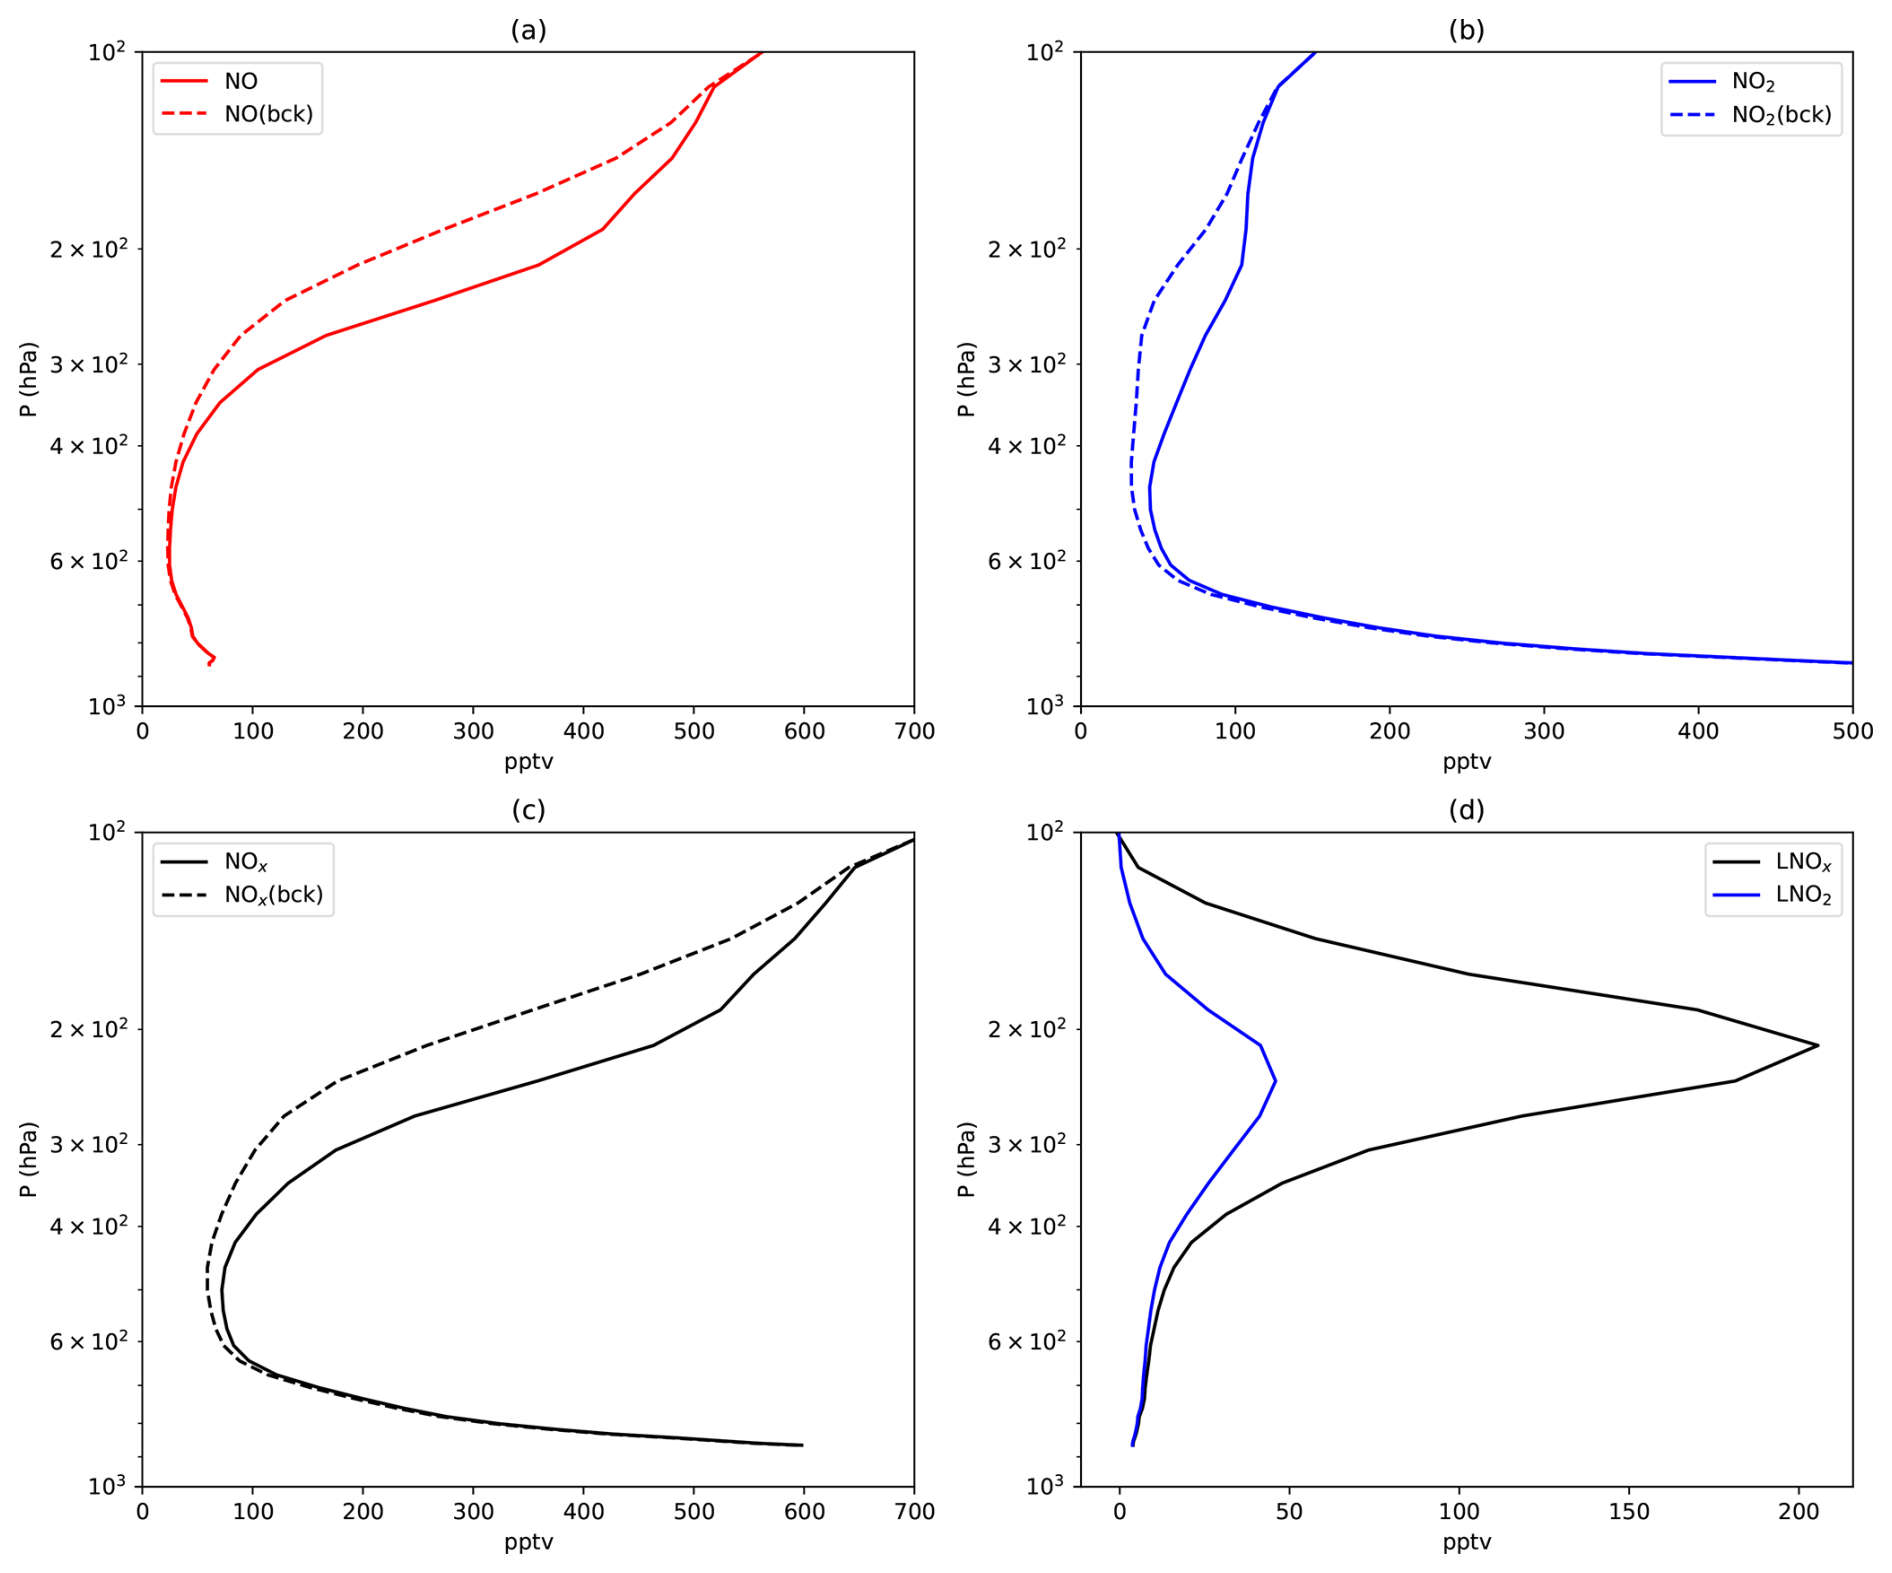
Figure 4 Vertical mixing ratio profiles of NO (a), NO2 (b), NOx (c), LNOx and LNO2 (d) extracted from WRF-Chem simulations with (solid lines) and without (dashed lines) fresh LNOx on 6 July 2024 at 13:50 UTC (close to the TROPOMI overpass (background: bck)).
Figure 4 shows the vertical mixing ratio profiles of NOx and LNOx from WRF-Chem simulations with and without fresh LNOx on 6 July 2024 at 13:50 (close to the TROPOMI overpass). These vertical profiles have been obtained by averaging over simulation grid boxes where the cloud fraction was ≥0.95 and the cloud top pressure was ≤534 hPa, and only over the ROI, that is, between 42 and 42.9° N degrees latitude, and between 0° W and 3.5° E degrees longitude. The tropopause height in this case is 16.7 km, and it is located at 99.8 hPa pressure level. The vertical mixing ratio profiles of NOx and LNOx from WRF-Chem simulations with and without fresh LNOx for other dates analyzed in this study can be seen in the Supplement (Figs. S1–S51).
Table 1Tropopause levels from the WRF-Chem simulation, ratio of the VCD attributable to fresh LNOx in pixels with lightning activity (Rf), and in pixels without lightning activity (Rnf) for each analyzed date.
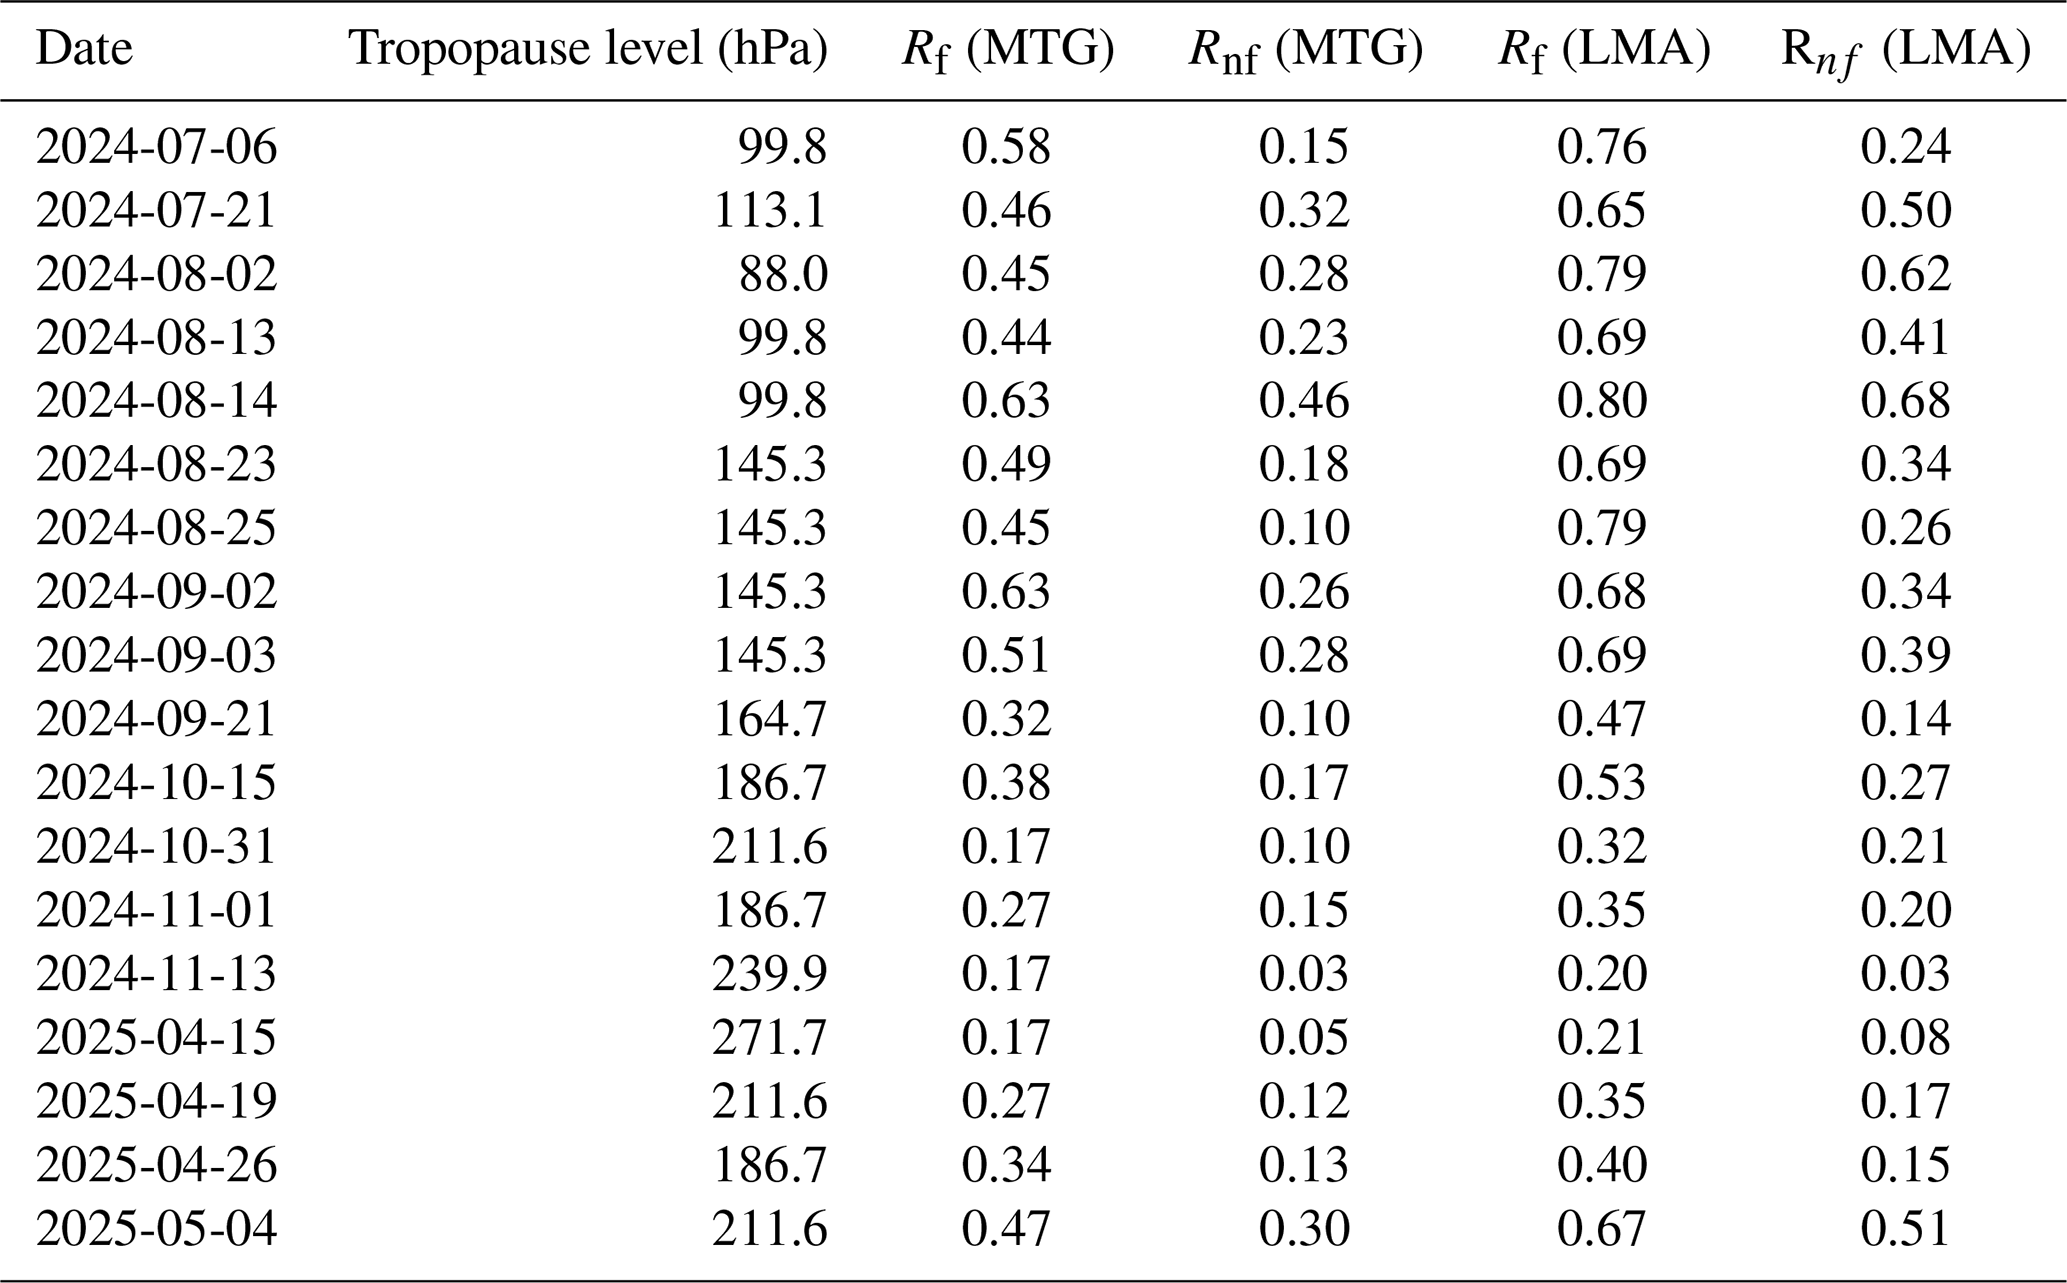
The obtained ratios Rf and Rnf, as well as the tropopause level, are shown in Table 1. The pressure at the tropopause is lower during summer months, as expected. The ratio of the tropospheric NOx produced by lightning is higher in simulation grid boxes with lightning than in boxes without lightning. In turn, the ratio is larger in simulations with LNOx emissions escalated with the total number of flashes reported by the LMA, which is larger than the total number of flashes detected by Meteosat 12 LI. Additionally, the ratio of tropospheric NOx produced by lightning is elevated during the summer months, potentially due to an increased planetary boundary layer height, which facilitates greater vertical mixing and accumulation of NOx in the troposphere.
2.4.3 Air mass factor of LNOx
The is required to calculate the VCD of LNOx from the SCD of NO2 (Beirle et al., 2009) provided by the TROP-DLR NO2 research product. The is calculated by following the method proposed by Bucsela et al. (2013) and later used by, for example, Pickering et al. (2016); Laughner and Cohen (2017); Allen et al. (2021a); Pérez-Invernón et al. (2022). We used the algorithm of Bucsela et al. (2013, 2019) to calculate the scattering weights for each of the studied cases using the viewing geometry and the cloud properties for each TROPOMI pixel, based on a look up table generated by Bucsela et al. (2013) with TOMRAD forward vector radiative transfer model. The calculated scattering weights at each TROPOMI pixel are combined with the LNO2 and LNOx vertical profiles from the WRF-Chem simulations (see Sect. 2.4.1) to calculate the at each TROPOMI pixel. The is calculated by integrating Eqs. (2) and (3) of Bucsela et al. (2013) between the surface and the tropopause level over all simulation grid points where the cloud fraction was ≥ 0.95 and the cloud top pressure was ≤534 hPa.
2.5 LNOx PE estimations
The calculation of the LNOx PE is based on a modification of the algorithm proposed by Allen et al. (2021a) and later used by Pérez-Invernón et al. (2022) and Pérez-Invernón et al. (2023b). The LNOx PE in units of mol of NOx produced per flash is calculated as
where F is the total number of flashes reported by Meteosat 12 LI or the LMA in the analyzed region and up to 5 h before the overpass of TROPOMI, ti is the age of each flash defined as the hours between the flash occurrence and the overpass of TROPOMI, A is the area (cm−2) of the thunderstorm, defined as the area of TROPOMI pixels satisfying the Deep Convective Constraint (DCC), which are the pixels with a cloud fraction equal or greater than 0.95 (Allen et al., 2021a; Pérez-Invernón et al., 2022, 2023b), and OCP equal or lower than 534 hPa (Pérez-Invernón et al., 2022, 2023b) or with undefined OCP. NA is the Avogadro's number (molec. mol−1). τ is the lifetime of NOx in the near-field of convection, in hours. The value of τ is uncertain and can vary between 2 h and 2 d (Pickering et al., 1998; Schumann and Huntrieser, 2007; Beirle et al., 2010; Nault et al., 2017; Allen et al., 2021a) depending on the altitude of LNOx emissions within the particular thunderstorm and subsequent transport. In this study, we primarily assume τ to be 5 h, as it is a commonly employed value in the literature (Allen et al., 2021a; Pérez-Invernón et al., 2022, 2023b), which also consider τ=3 h, and aligns with the temporal window of flashes included in Eq. (1). To account for the variability in results due to this choice, we also performed calculations using τ=3 h. DE stands for the flash detection efficiency, ranging between 0 and 1. We assume a DE of 1 for the LMA and 0.75 for Meteosat 12 LI (Enno et al., 2025; Gedik et al., 2025; Bližňák and Sokol, 2026). Finally, is the VCD NOx produced by recent lightning (molec. cm−2). Allen et al. (2021a); Pérez-Invernón et al. (2022) and Pérez-Invernón et al. (2023b) calculated as the median VCD NOx over TROPOMI pixels satisfying the DCC criteria minus a given value of background derived from measurements or TROPOMI pixels without flashes in the same day or before, or from previous aircraft measurements close to the investigated region. In this study, we calculate by using the WRF-Chem simulations as
where Nf and Nnf are the total number of TROPOMI pixels satisfying the DCC criteria that contain and do not contain Meteosat 12 LI flash groups, respectively. Rf and Rnf are derived from WRF-Chem simulations (Table 1). The advantage of using high-resolution WRF-Chem simulations over other methods is that, by emitting LNOx at the exact locations where lightning has been reported, the model faithfully reproduces the advection of LNOx and its interaction with other chemical species. This allows for the determination of the LNOx ratio relative to the total tropospheric NOx at each grid point. Although the horizontal resolution of the simulations and TROPOMI pixels is not exactly the same as the horizontal resolution of WRF-Chem simulations, we utilized the coefficients from the table because TROPOMI pixels do not exhibit significant variations from case to case. Additionally, their resolutions are of the same order of magnitude (2 km×2 km vs 3.5 km×5.5 km). and are the median values of VCD NOx over pixels satisfying the DCC criteria that contain and do not contain Meteosat 12 LI flash groups, respectively. Given that is the union of and , it is calculated as
where and AMFstrat are the SCD of NO2 and the stratospheric AMF from the TROP-DLR NO2 research product, respectively. Only TROPOMI pixels with SCD NO2 errors below are used (Pérez-Invernón et al., 2022, 2023b). Finally, is the AMF of LNOx derived from WRF-Chem simulations and using the algorithm of Bucsela et al. (2013, 2019) (see Sect. 2.4.3). stands for the average of the product .
Additionally, we have estimated the averaged LNOx PE in terms of molec NOx per meter, per second or per unit of radiance (mW m−2 sr−1) by modifying Eq. (1) to better account for the metrics of individual flashes and the influence of their ages as
where Mi is the metric representing the flash channel length, the radiance, or the duration of the flash i reported by Meteosat 12 LI or the LMA.
As an alternative approach, we modified Eq. (2) to calculate as the difference between the median VCD NOx over TROPOMI pixels satisfying the DCC criteria and the 10th and the 30th percentiles of the tropospheric VCD NOx over TROPOMI non-flashing pixels (i.e., pixels without detected lightning activity), as previously proposed by Allen et al. (2021a). This alternative formulation facilitates comparison with the results from Pérez-Invernón et al. (2022) and Pérez-Invernón et al. (2023b) for the same region.
This section presents the key results of the study, along with a detailed discussion of their implications. Section 3.1 presents the vertical column densities of LNOx derived from TROP-DLR product, alongside the corresponding lightning observations. Section 3.2 presents the LNOx estimates and analyzes their relationships with lightning characteristics. Finally, Sect. 3.3 discusses the uncertainties and limitations of this study, with a focus on how key input parameters in the LNOx retrieval process influence the observed relationships between LNOx and lightning characteristics.
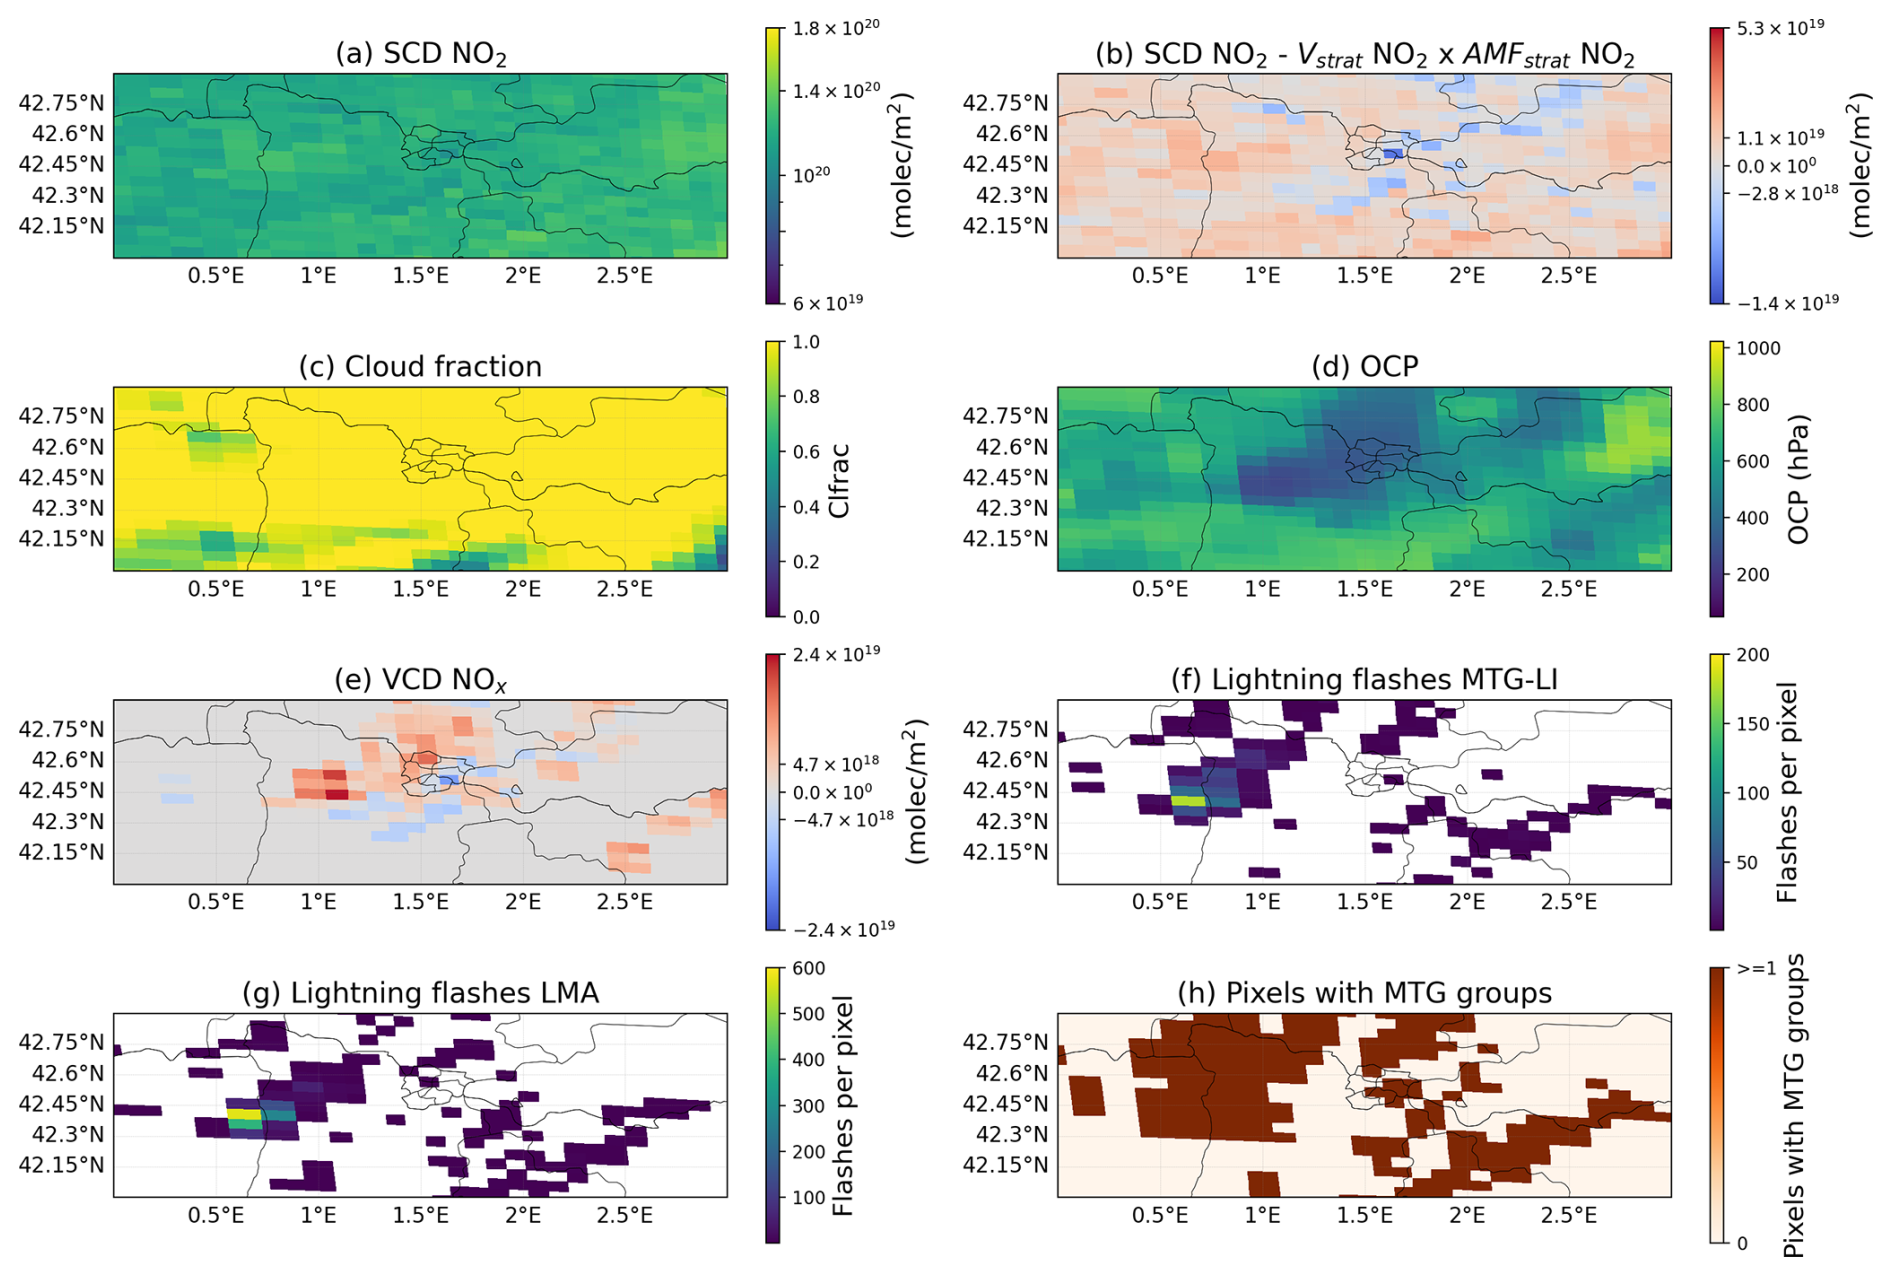
Figure 5 TROP-DLR product of orbit 34875, Meteosat 12 LI and LMA lightning data for the case 6 July 2024. (a) Slant Column Density (SCD) NO2 provided by the TROP-DLR NO2 research product. (b) SCD NO2 minus the stratospheric vertical column density multiplied by the stratospheric air mass factor of NO2 (AMFstrat) obtained from the TROP-DLR NO2 research product. (c) and (d) Cloud Fraction (CF) and Optical Centroid Pressure (OCP) from the TROP-DLR NO2 research product, respectively. (e) VCD NOx ( from Eq. 3) over pixels satisfying the Deep Convective Constraint (DCC). (f) and (g) Lightning flashes during the 5 h period per TROPOMI pixel before the TROPOMI overpass reported by Meteosat 12 LI and the LMA, respectively. (h) TROPOMI pixels containing at least one lightning group detected by Meteosat 12 LI. Sentinel-5P TROPOMI data © ESA, processed by DLR. Meteosat 12 LI lightning data © EUMETSAT.
3.1 Estimated Vertical column density of LNOx from TROP-DLR and lightning observations
Figure 5 shows the TROP-DLR products, lightning measurements and calculated for the case 6 July 2024, while the figures showing the rest of the analyzed dates are provided in Figs. S1–S51. In the majority of the analyzed cases, a distinct enhancement in the SCD NO2 (Fig. 5a, b) is observed in or near TROPOMI pixels characterized by high lightning activity in the last 5 h, as in the TROPOMI orbits analyzed in other studies (Allen et al., 2021a; Pérez-Invernón et al., 2022, 2023b). However, this enhancement is not evident in all cases, particularly on 6 July, 23 August, 25 August, 2 September, and 31 October 2024. Nevertheless, when the VCD NOx (Fig. 5e) is calculated using the , which incorporates cloud properties (Fig. 5c, d), observation geometry, and simulated LNOx vertical profiles, the enhancement in TROPOMI pixels with or near lightning activity becomes apparent. In turn, a clear similarity between the spatial distribution of the OCP (Fig. 5d) and the lightning activity (Fig. 5f, g) can be seen. The spatial distribution of flashes detected by Meteosat 12 LI and the LMA do not show large discrepancies (Fig. 5f, g), with the small differences observed likely attributable to the parallax correction applied in Meteosat 12 LI (Pineda et al., 2025). In fact, larger differences emerge when comparing the spatial distribution of individual flashes (Fig. 5f, g) and groups detected by Meteosat 12 LI (Fig. 5h). These differences suggest that relying solely on the flash product may introduce inaccuracies in distinguishing between TROPOMI pixels with and without lightning activity, as lightning flashes coordinates are estimated as the radiance-weighted geometrical centroid of the groups detected by Meteosat 12 LI (Dobber and Grandell, 2014; Holmlund et al., 2021; Enno et al., 2025) or by the median coordinates of the sources detected by the LMA. However, each lightning flash may not be fully contained within a single TROPOMI pixel. By using the flash groups reported by Meteosat 12 LI, we can access information about the TROPOMI pixels that actually contain at least a portion of a flash. Note that the VCD NOx (Fig. 5e) can have negative values, indicating that the average stratospheric column exceeds the local vertical column (Pérez-Invernón et al., 2022). The TROP-DLR products, lightning measurements and calculated for other cases analyzed in this study can be seen in the Supplement (Figs. S1–S51).
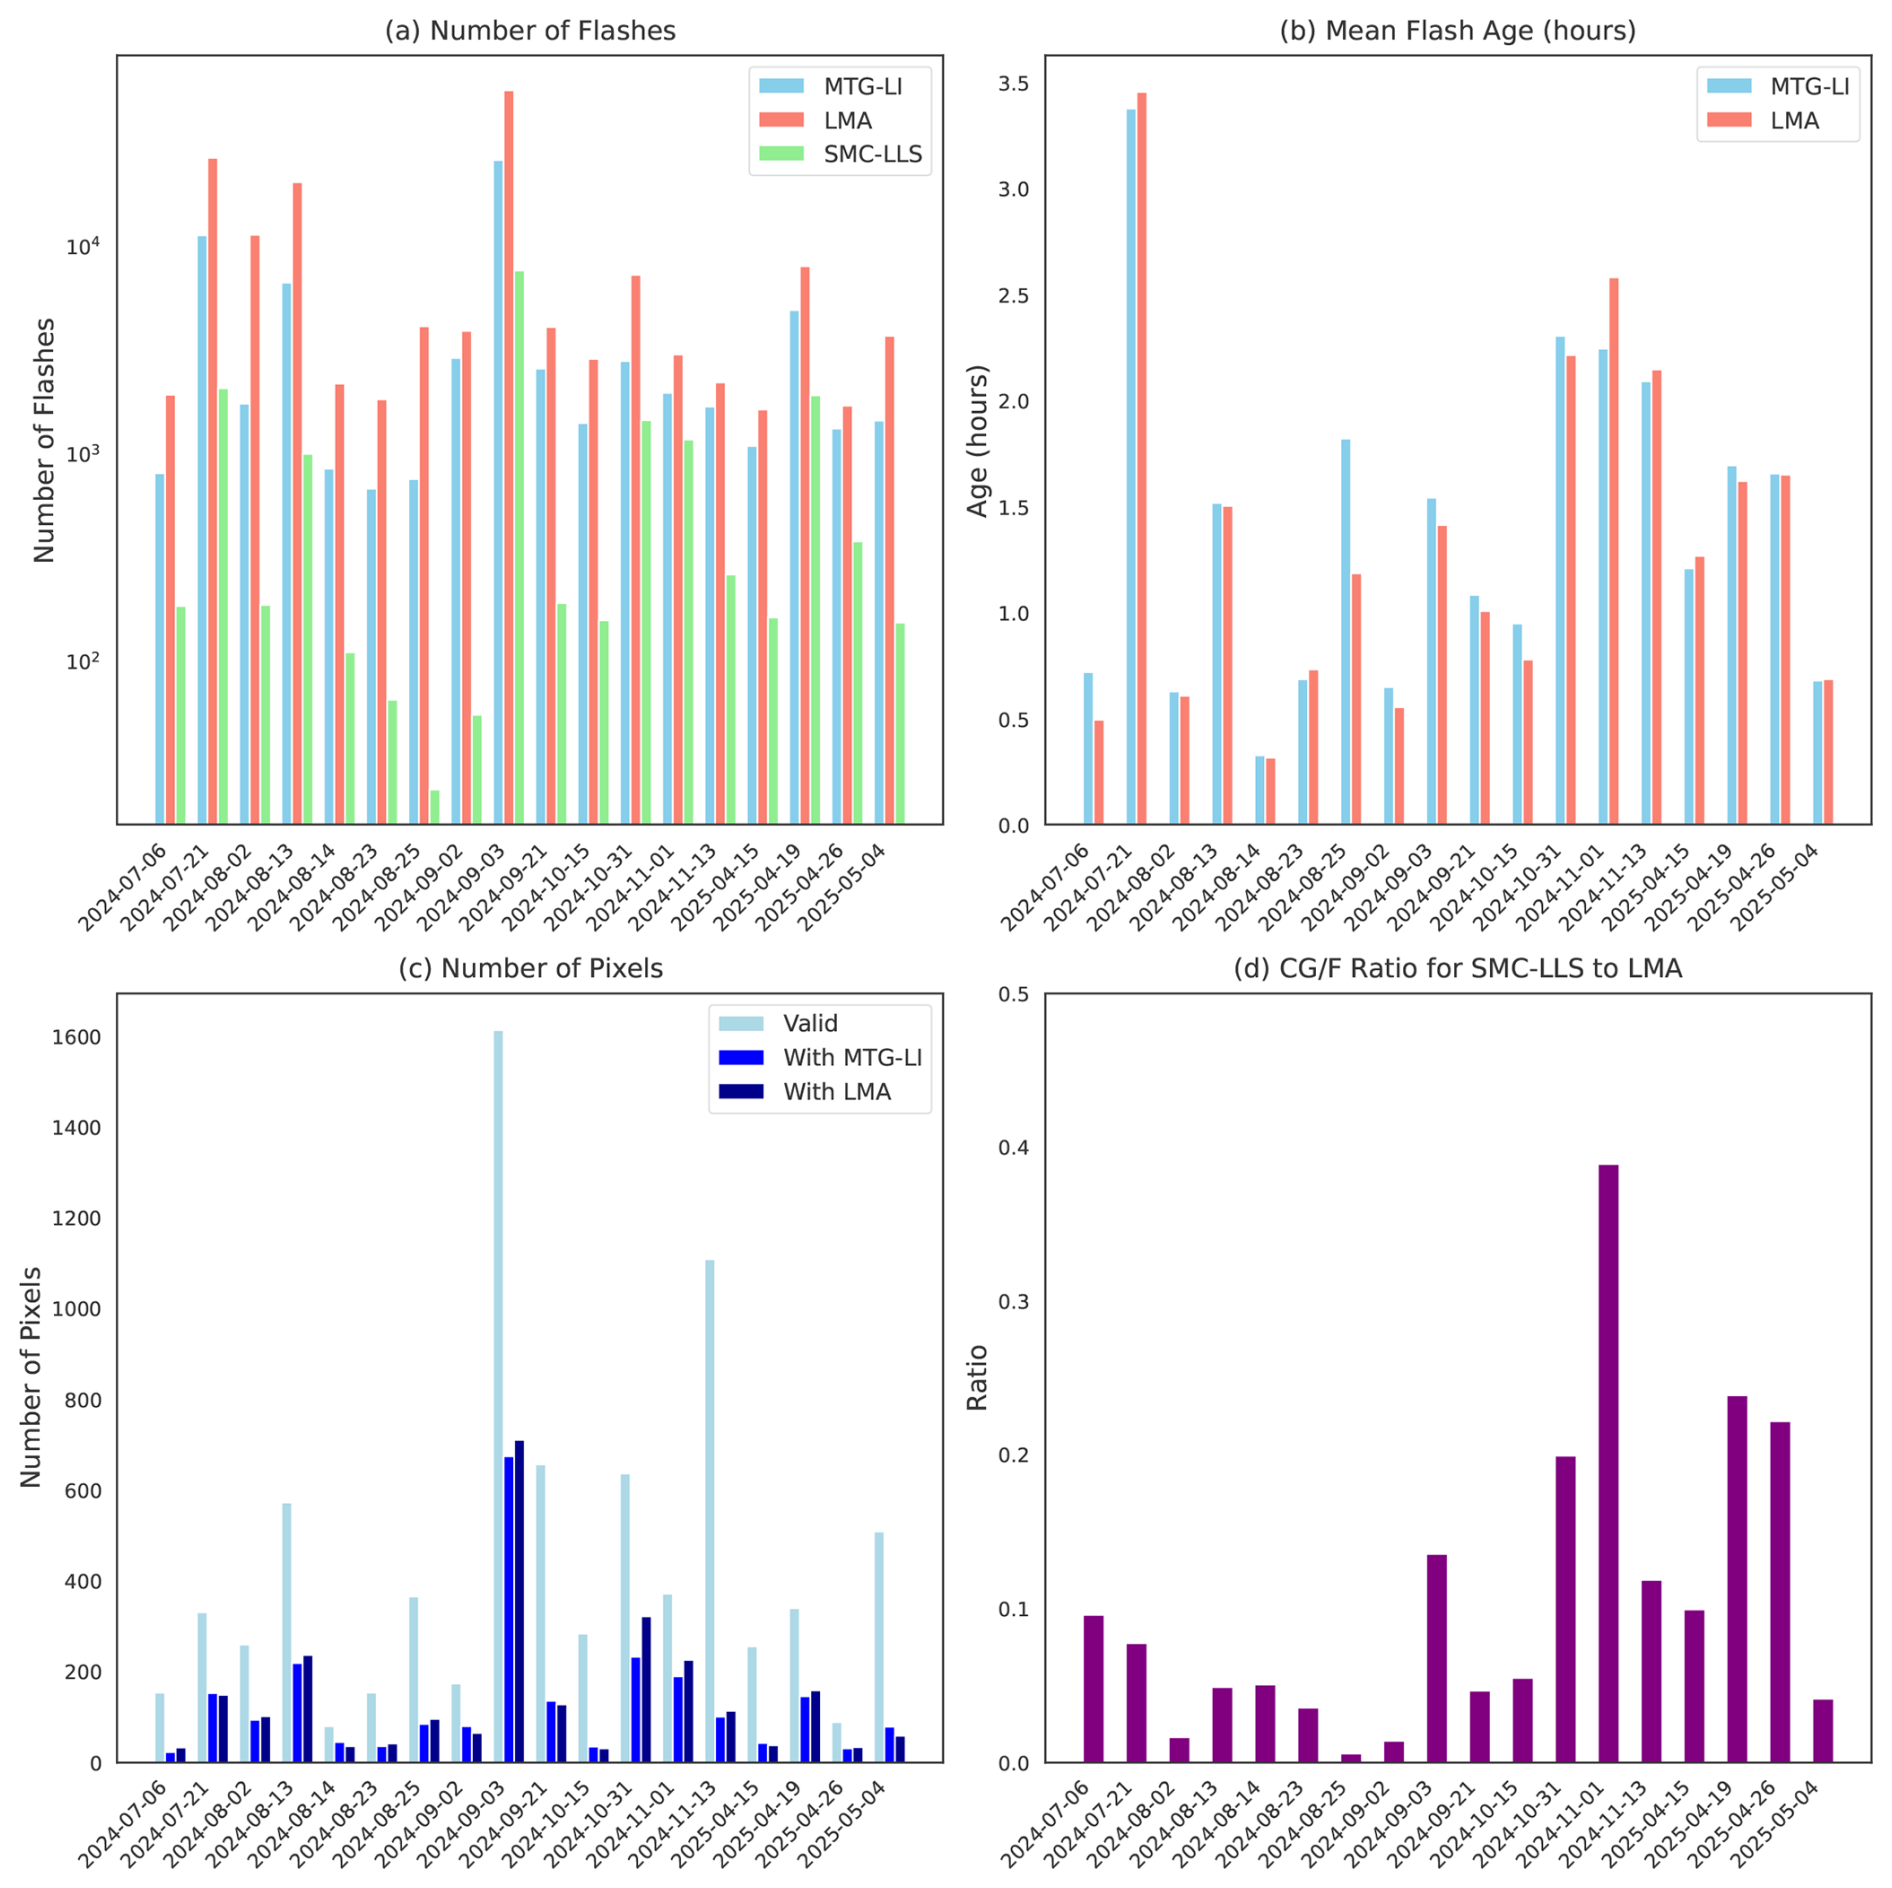
Figure 6 Total number flashes detected by Meteosat 12 LI, LMA and CG flashes detected by LLS-SMC up to 5 h before the overpass of TROPOMI (a), mean age of the flashes detected by Meteosat 12 LI and the LMA (b), total number of valid TROPOMI pixels satisfying the Deep Convective Constraint (DCC), total number of TROPOMI pixels with Meteosat 12 LI or LMA flashes satisfying the DCC (c), and ratio of the total number of CG flashes to all flashes detected by the LMA.
The comparison of WRF-Chem simulation and TROPOMI measurements indicates that the CTP (Fig. 3b) and the OCP (Fig. 5d) are nearly in agreement, with a slight displace of the simulated high clouds westward. The simulated tropospheric VCD NOx in areas with high convection (Fig. 3c) is consistently displaced westward, and lower in about 1 order of magnitude than the tropospheric VCD NOx calculated from measurements (Fig. 5e). The obtained disagreement in the maximum simulated and measurements-based tropospheric VCD NOx can be due to different horizontal resolutions in simulations and measurement, as well as the inherent uncertainties in the WRF-Chem model, such as emission inventories, chemical reaction rates, meteorological inputs, or parameterizations of physical processes.
Figure 6 and Table S2 shows the basic measurements for each analyzed date. The LMA detects 1.3 to 6.5 times more flashes than the Meteosat 12 LI. The ratio of CG flashes reported by the LLS-SMC to total flashes reported by the LMA ranges between 0.01 and 0.39. There are no significant differences in the average age of flashes reported by Meteosat 12 LI and the LMA. The average OCP ranges between 323.07 and 499.34 hPa, which are typical values in thunderstorms (Allen et al., 2021a). The percentage of valid TROPOMI pixels satisfying the DCC that contain Meteosat 12 LI lightning flashes with respect to pixels without flashes ranges between 9 % and 46 %. In turn, the ratio of the total number of TROPOMI pixels satisfying the DCC and containing flashes according to the Meteosat 12 LI to the pixels containing flashes according to the LMA ranges between 0.7 and 1.4, indicating that there are no significant differences in the spatial distribution of flashes detected by both instruments.
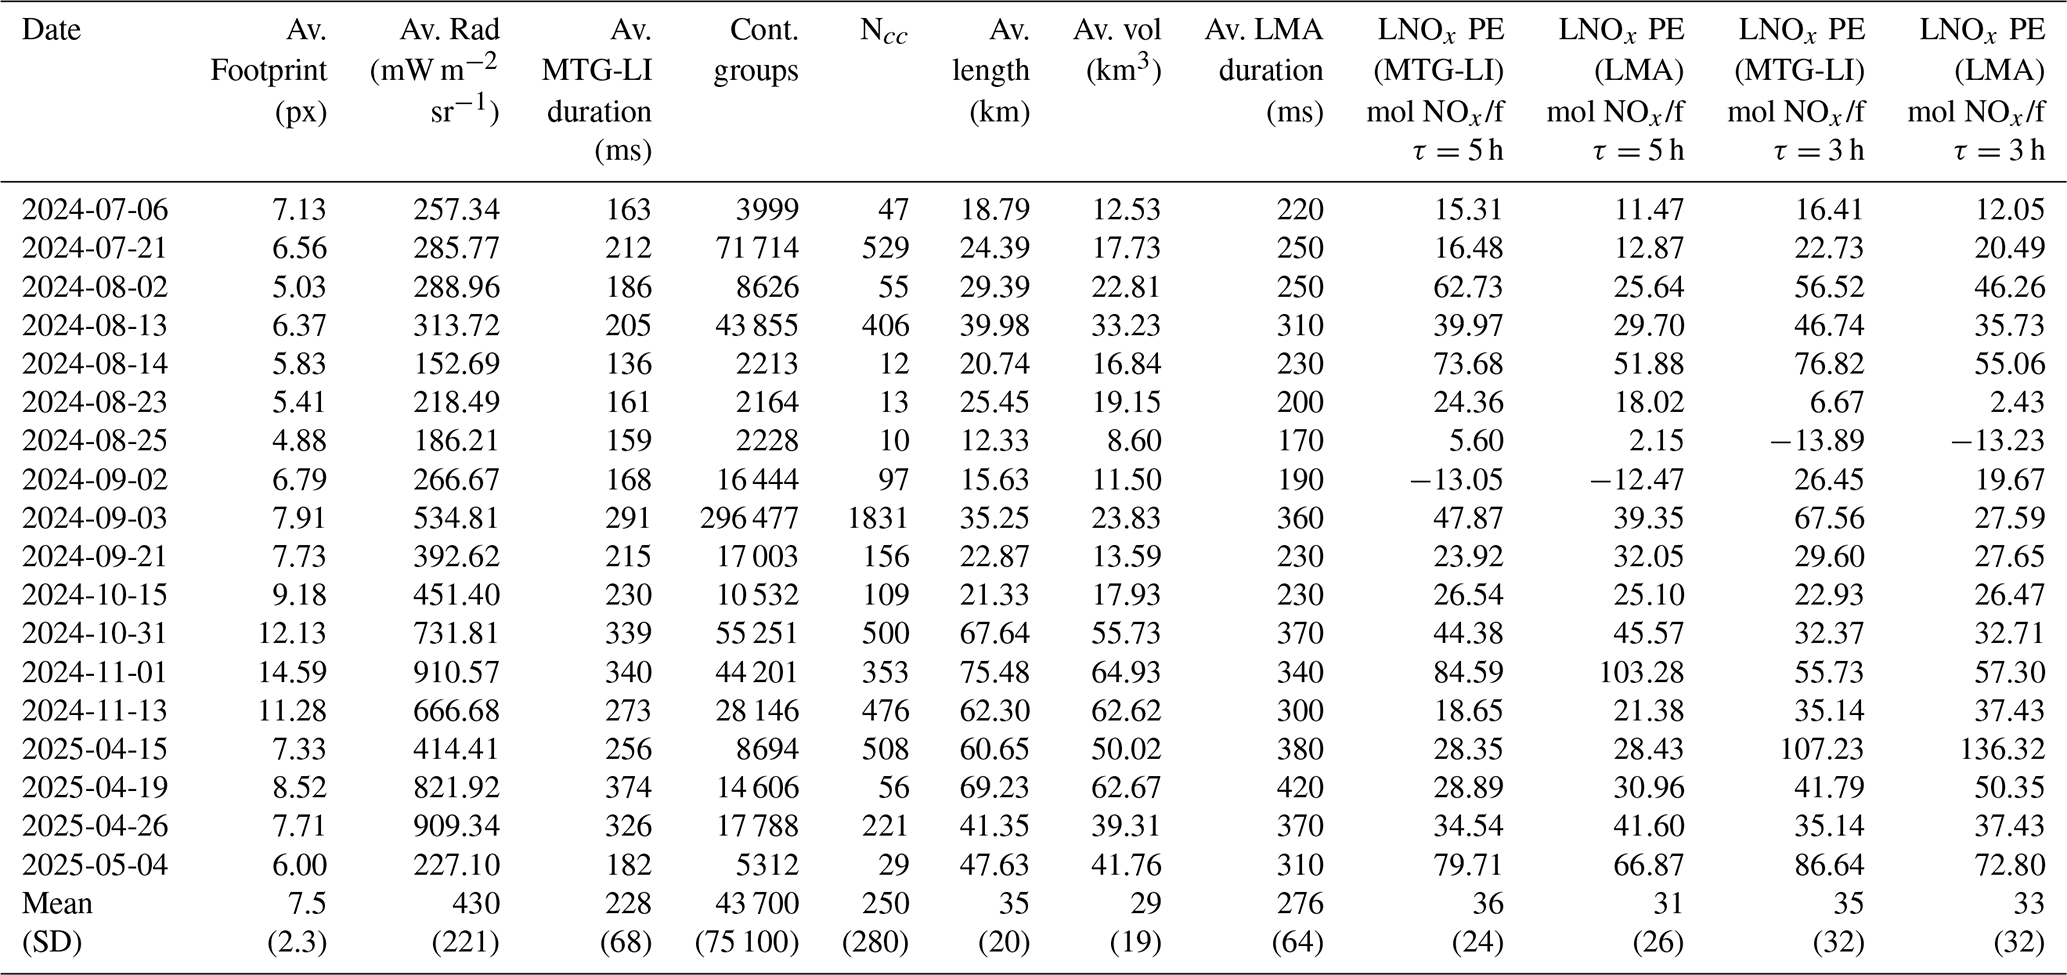
Table 2Analyzed dates, average footprint, average radiance, average duration from Meteosat 12 LI, average total number of time contiguous groups per flash, average flash channel length, average flash volume, average flash duration from LMA, LNOx PE based on Meteosat 12 LI and LMA lightning flash measurements with τ=5 and τ=3 h.
3.2 Relationships between LNOx and lightning characteristics
The characteristics of lightning flashes analyzed in this study and the LNOx PE estimates are shown in Table 2. There are notable variations in the characteristics of lightning flashes detected by Meteosat 12 LI. The average footprint ranges from 4.88 to 14.59 Meteosat 12 LI pixels, with a mean value of approximately 7.71 pixels, indicating spatial variability in the optical extent of detected events. The average radiance spans a broad range from 152.69 to 910.57 mW m−2 sr−1, reflecting substantial differences in the optical intensity of the flashes. This variability may be attributed to differences in the energy released during lightning events and to differences in the cloud opacity. Regarding the average duration of Meteosat 12 LI detected flashes, values range from 159 to 374 ms, with a mean duration of around 230 ms. The average flash channel length reported by the LMA ranges from 12.33 to 75.48 km, and the average flash volume spans from 8.60 to 64.93 km3 (number of km boxes), indicating substantial variability in the spatial extent of lightning channels. Additionally, the average duration of LMA-detected flashes ranges from 170 to 420 ms, with a mean duration of approximately 295 ms, slightly longer than the average duration provided by Meteosat 12 LI. The obtained average LNOx PE ± the standard deviation with Meteosat 12 LI flash data and τ=5 h is 37 ± 25 mol NOx per flash, while it is 31 ± 24 mol NOx per flash when using the LMA lightning flash data. When setting τ=3 h, we obtain 41 ± 29 mol NOx and 38 ± 31 per flash when using Meteosat 12 LI and LMA lightning data, respectively. The approximately similar LNOx PE obtained with both lightning data sources suggests that the WRF-Chem simulations used in the estimation of LNOx PE help mitigate the impact of the difference in the total number of flashes reported by Meteosat 12 LI and the LMA (see Fig. 6). The averaged LNOx PE obtained in this study falls at the lower end of the range of previous estimations in the same region, ranging between 42 and 108 mol NOx per flash (Pérez-Invernón et al., 2022, 2023b). In turn, the obtained LNOx PE falls at the lower end of the widely consensus value, ranging between 100 and 400 mol NOx per flash (Schumann and Huntrieser, 2007). However, it is important to mention that the obtained averaged LNOx PE value is significantly influenced by the production of NOx per flash assumed in WRF-Chem simulations, as shown in the last four columns of Table 2. Alternatively, we approximated the background-NOx by considering the 10th and the 30th percentiles of the tropospheric VCD NOx over TROPOMI non-flashing pixels (i.e., pixels without detected lightning activity) (Allen et al., 2021a). Based on LMA lightning data, we obtained 116 ± 89 and 49 ± 47 mol NOx per flash by considering the 10th and the 30th percentiles, respectively. These values are in agreement with Pérez-Invernón et al. (2022, 2023b), who employed similar methods to estimate the background-NOx.
Table 3Spearman and Pearson correlation coefficients (ρ and r, respectively) and corresponding p-values between (as defined in Eq. 2) and various lightning flash characteristics, computed across TROPOMI pixels included in the 18 analyzed dates. These results are based on calculations with τ=5 h.
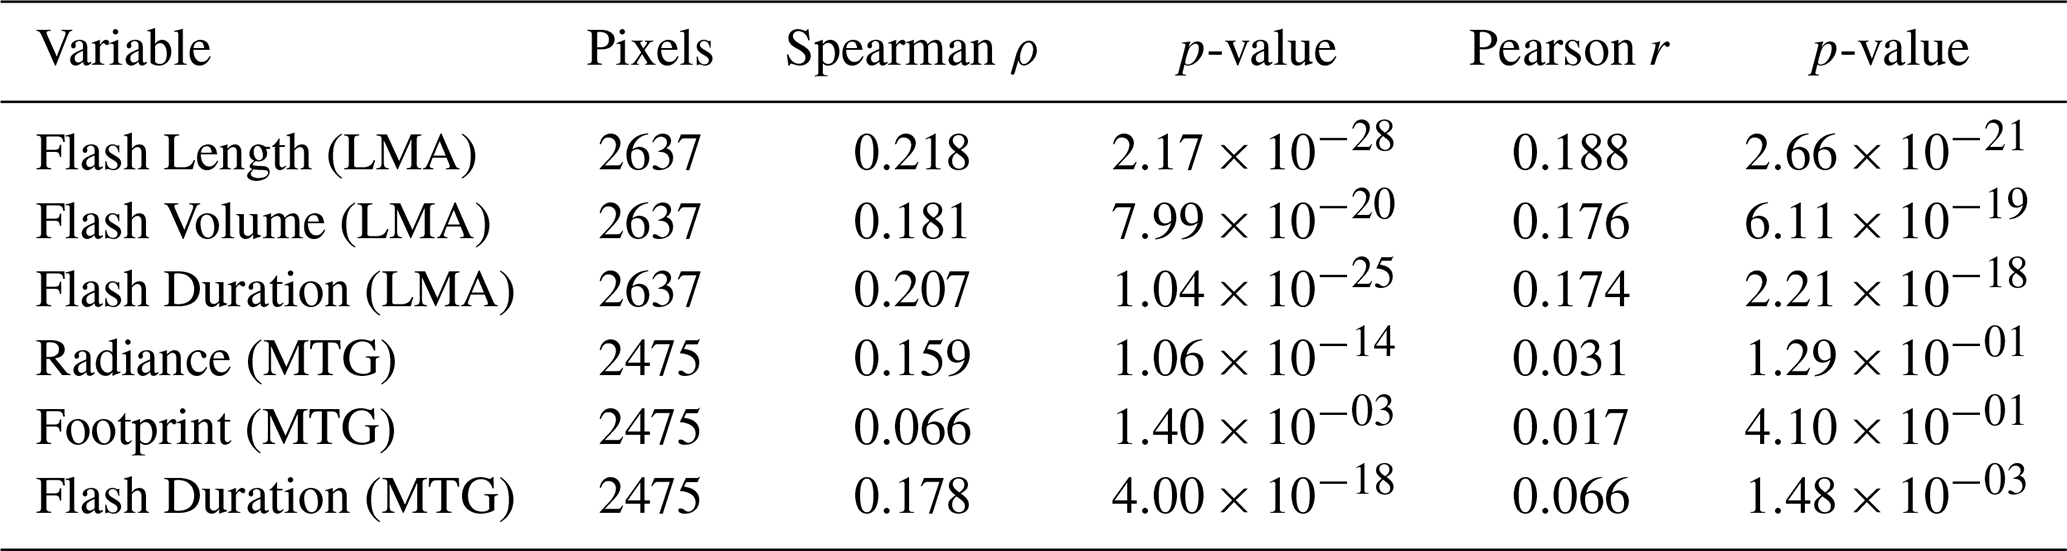
Table 3 shows the Spearman and Pearson correlation coefficients and corresponding p-values between (as defined in Eq. 2) and various lightning flash characteristics, computed across all TROPOMI pixels included in the 18 analyzed dates. Only pixels with values of between the 5th and the 95th percentiles are included in the calculation of the correlation coefficients in order to exclude outliers. The lightning characteristics for each TROPOMI pixel were derived by averaging the respective values over all lightning flashes occurring within that pixel. The Spearman correlation coefficients presented in Table 3 reveal measurable, albeit weak, associations between lightning flash characteristics and . Among the analyzed variables, footprint exhibits the weakest correlation with , suggesting a less pronounced influence compared to other flash characteristics. Nevertheless, the results indicate that the properties of lightning flashes, such as length, volume, duration, and radiance, play an appreciable role in the production of LNOx. The data employed to calculate the correlations presented in Table 3 are shown in Fig. S52.
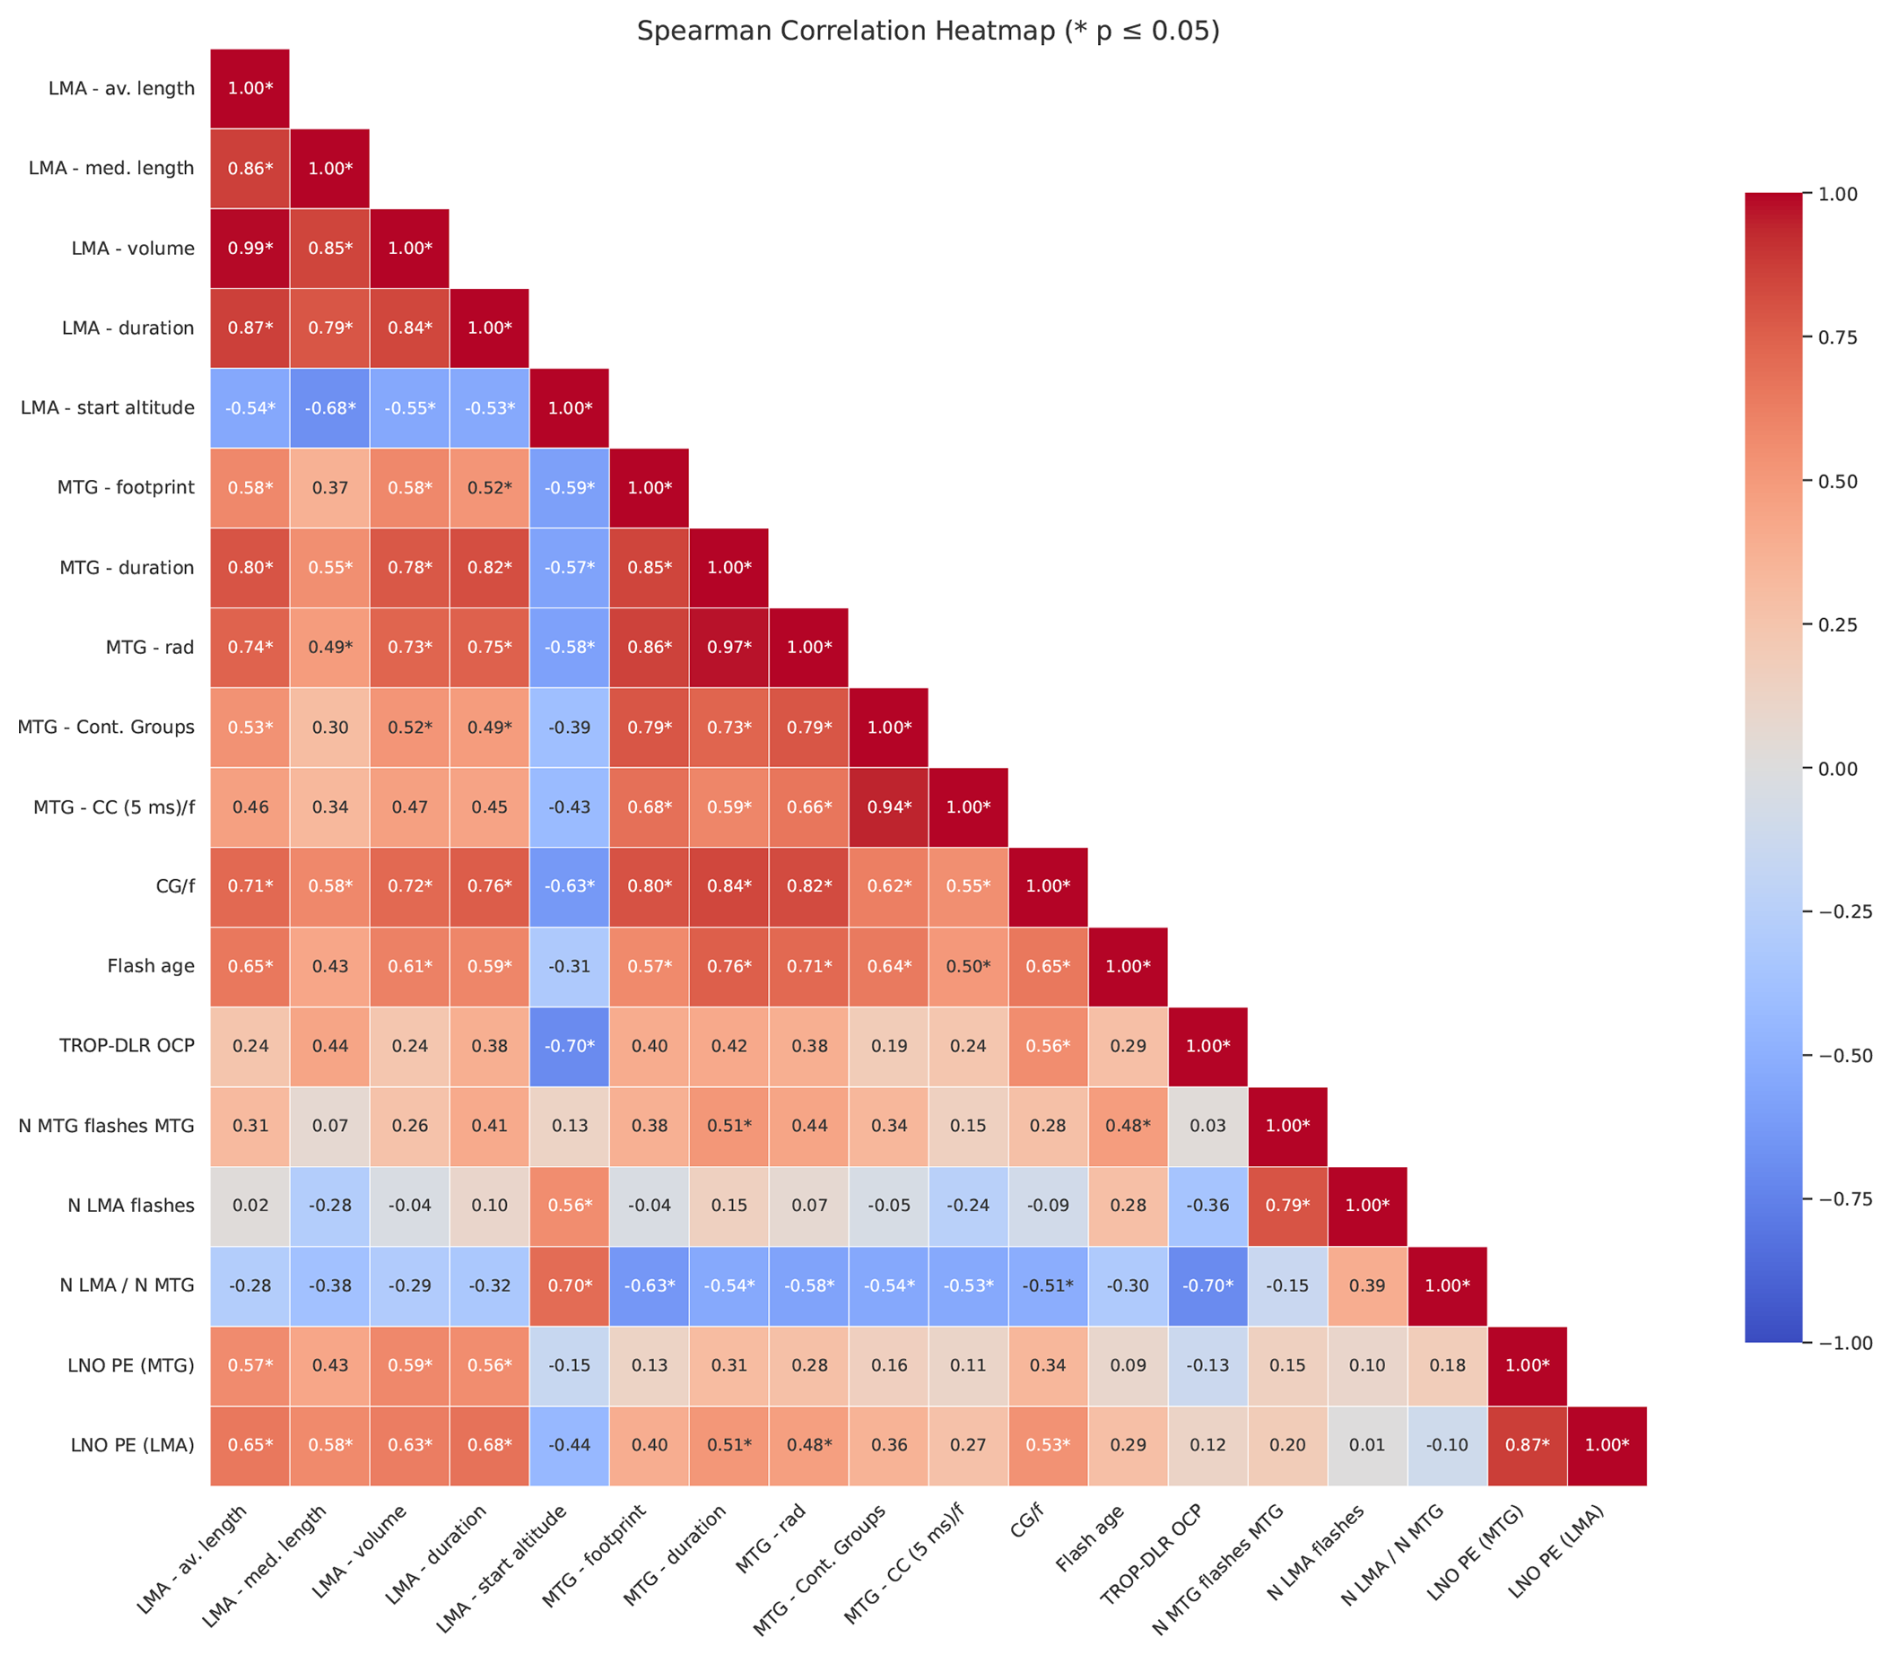
Figure 7 Spearman correlation heatmap of the most important lightning characteristics and LNOx PE estimates. These results are based on caculations with τ=5 h.
Figure 7 shows a Spearman monotonic correlation heatmap of the most important lightning characteristics and LNOx PE estimates with τ=5 h. There are strong direct relationships between the average flash channel length (LMA – av. Length), median flash channel length (LMA – med. length) flash volume (LMA – volume) and flash duration (LMA – duration) estimates by the LMA and the average footprint (MTG – footprint), radiance (MTG – rad) and duration (MTG – duration) reported by Meteosat 12 LI. These correlations indicates consistency in the methods used to cluster LMA sources into flashes and Meteosat 12 LI groups into flashes. In turn, the high correlation between durations and geometric variables, such as flash channel length, flash volume and duration, suggests that larger flashes then to have longer durations. There is a significant direct correlation between the flash length and the age of flashes (Flash age), showing that flashes that occur near the sunrise are longer than flashes that occur near the mid-day, which is consistent with previous findings of shorter flashes in more active thunderstorms (Bruning and Thomas, 2015; Chronis et al., 2015). In the same manner, there is an even stronger correlation between the age of the flashes and the footprint, radiance and duration reported by Meteosat 12 LI, indicating that Meteosat 12 LI is capable of reporting a longer and brighter signal of flashes during early morning than during the mid-day, due to the lower DE when the sun is close to the zenith. Conversely, a higher DE during the early morning could allow Meteosat 12 LI to capture more weak flashes that would otherwise be missed when the DE is lower. However, the effect of observing a larger portion of bigger flashes when the DE is higher ultimately dominates. As shown by the LMA measurements reported in Chronis et al. (2015), small flashes are typically less numerous than large flashes early in the day. The total number of time contiguous groups (MTG – Cont. Groups) and the ratio of flashes with at least 5 ms of time contiguous optical signal to the total number of Meteosat 12 LI (MTG – CC (5 ms)/f) flashes is moderately correlated with the flash channel length, the flash volume and the flash duration provided by the LMA, while they are strongly correlated with the footprint, radiance and duration measured by Meteosat 12 LI.
The ratio of CG flashes to total flashes (CG/f) is strongly correlated with the flash channel length, flash volume, duration, footprint and radiance (Fig. 7), indicating that CG flashes are longer in duration, larger and brighter from space than IC flashes. Similar results were obtained by Ringhausen et al. (2021) for GLM lightning measurements. The ratio of CG flashes to total flashes reported is moderately correlated with the total number of time contiguous groups and with the ratio of flashes with at least 5 ms of time contiguous optical signal, indicating that CG flashes reported by Meteosat 12 LI tend to have longer time contiguous optical signals detected by Meteosat 12 LI. This may be due to the presence of continuing currents in CG, or to longer in-cloud stroke activity in CG flashes than in IC flashes.
The ratio of the total number of flashes reported by the LMA (N LMA flashes) to the total flashes reported by Meteosat 12 LI (N MTG flashes) is inversely correlated with the OCP (TROP-DLR OCP) (Fig. 7), indicating that the detection efficiency of Meteosat 12 LI with respect to the LMA is higher when the cloud tops are lower, possibly due to lower cloud opacity in the travel of the light between the emitting source and Meteosat 12 LI. In turn, the ratio of the total number of flashes reported by the LMA to the total flashes reported by Meteosat 12 LI is inversely correlated with the average footprint and with the ratio of CG flashes to total flashes, indicating that the detection efficiency of Meteosat 12 LI with respect to the LMA is higher for brighter flashes, particularly for CG flashes. The positive correlation observed between the total number of flashes detected by the LMA and the ratio of this quantity to the total number of flashes reported by Meteosat 12 LI suggests that the DE of Meteosat 12 LI decreases for more active thunderstorms, in agreement with Pineda et al. (2025).
The analysis of the flash initiation altitude (LMA – start altitude) reveals that lightning initiated at lower altitudes exhibits greater spatial extent, longer duration, and higher radiance as observed by MTG, likely due to the predominance of CG flashes, which tend to be more energetic and prolonged (Fig. 7). Additionally, lower initiation altitudes correlate with a higher number of flashes lasting at least 5 ms and elevated OCP values (indicating lower cloud tops). Conversely, lightning initiated at higher altitudes, though typically smaller in size (Pérez-Invernón et al., 2023b), is more effectively detected by LMA than MTG, suggesting higher DE of LMA than MTG for smaller flashes.
The LNOx PE is positively correlated with the flash channel length, the flash volume and the flash duration estimates by the LMA and the footprint, radiance, duration and total number of contiguous groups per flash reported by Meteosat 12 LI (Fig. 7), indicating that larger, brighter and longer duration flashes produce more LNOx. The stronger correlations are obtained when comparing the LNOx PE based on LMA flash measurements with the average flash channel length, the flash volume and the flash duration, in agreement with previous studies (Pérez-Invernón et al., 2023b). There is a weak positive correlation between the LNOx PE and the total number of Meteosat 12 LI time contiguous groups, as well as with the ratio of flashes with at least 5 ms of time contiguous optical signal, indicating that time contiguous emissions could contribute to a larger LNOx PE.
The lack of significant correlations between the LNOx PE and the average flash age indicates that the assumption of a temporal window of 5 h and a τ=5 h do not introduce a significant bias in the LNOx PE estimates (Fig. 7). In turn, the lack of significant correlations between the LNOx PE and the average OCP suggests that the calculation of the does not introduce a significant bias (Figure 7). The Spearman monotonic correlation heatmap with τ=3 h is shown in Fig. S53, indicating minor differences with the results obtained by using τ=5 h.
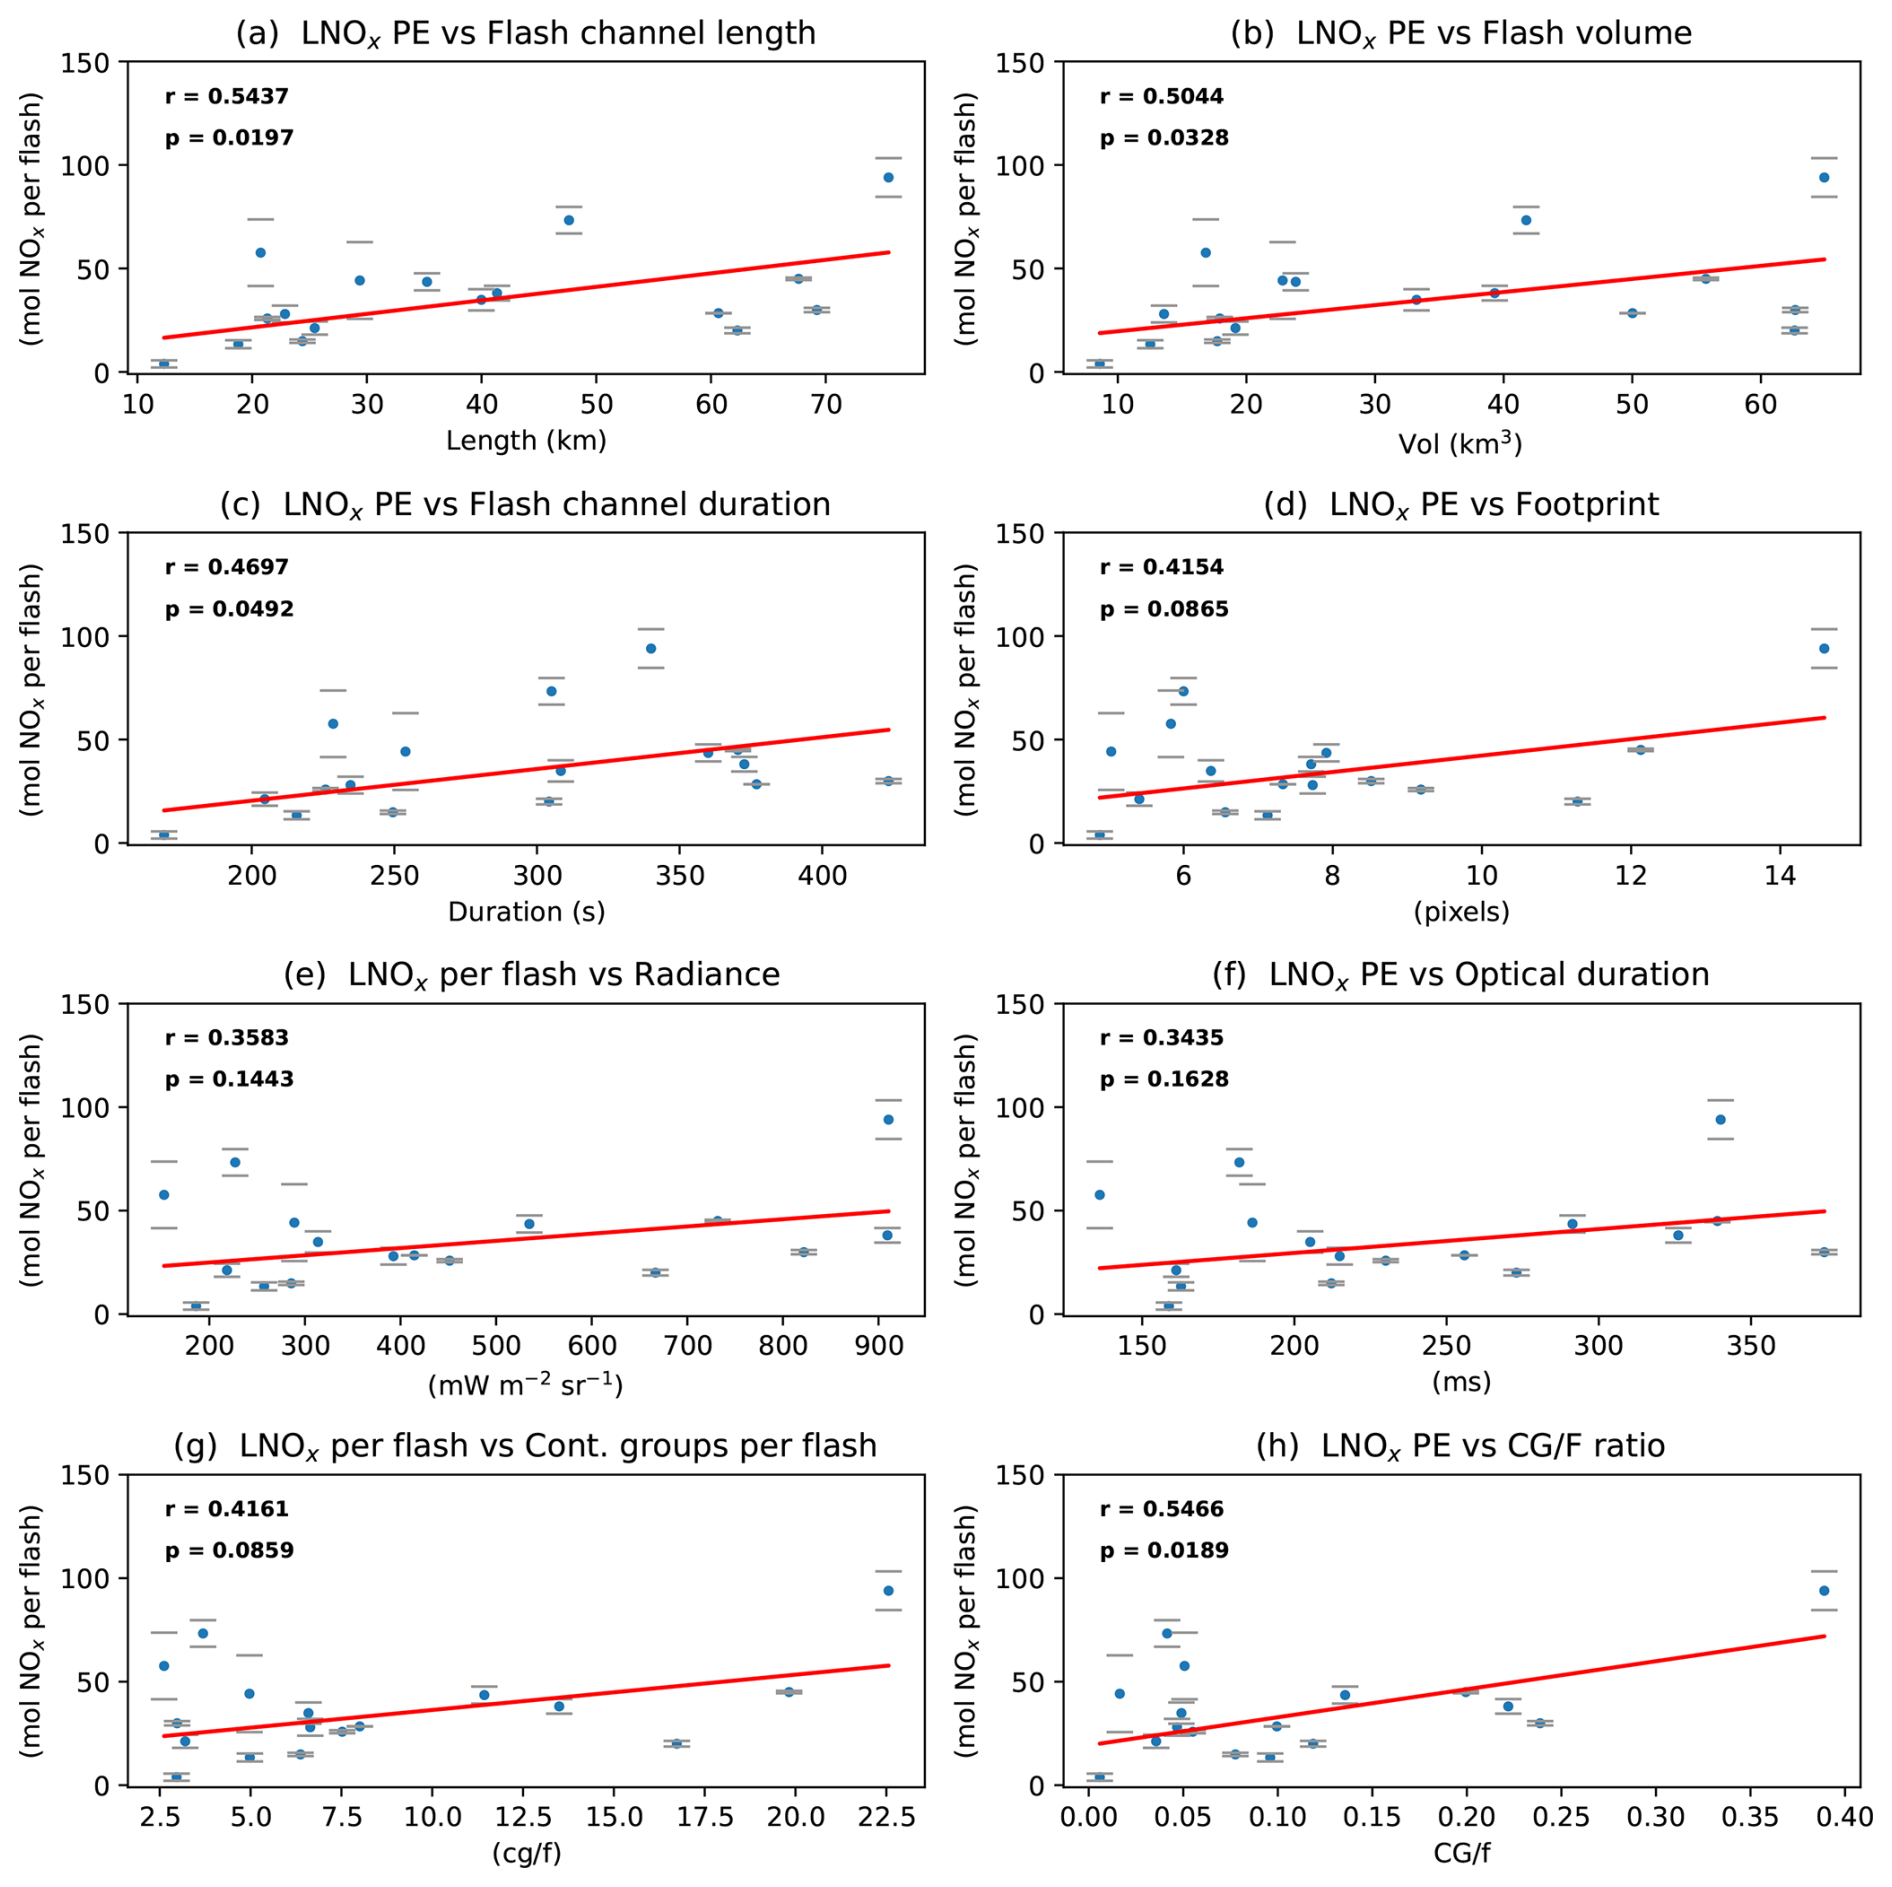
Figure 8 Pearson correlation between the LNOx PE and the most important lightning characteristics included in this study. The average LNOx PE (blue points) is obtained as the average between the LNOx PE estimates by using both Meteosat 12 LI and the LMA for each analyzed case, while each pair of grey bars are the values of the LNOx PE estimates by using Meteosat 12 LI and the LMA separately. The flash channel length, the flash volume and the flash durations in panels (a), (b) and (c) are the average values calculated from LMA measurements. The footprint, the radiance, the flash durations and the total number of contiguous groups per flash in panels (d), (e), (f) and (g) are the average values calculated from Meteosat 12 LI measurements. The average ratio of CG to total flashes in panel (h) is obtained from LLS-SMC and LMA lightning measurements. Each subplot includes the Pearson correlation coefficient r and its corresponding p-value, as well as a linear fitting of the blue points (red line). These results are based on caculations with τ=5 h.
Figure 8 shows the Pearson linear correlations between the average LNOx PE and the most important lightning characteristics with τ=5 h, while nearly similar results are shown in Fig. S54 with τ=3 h. The average LNOx PE is obtained as the average between the LNOx PE estimates by using both Meteosat 12 LI and the LMA. Figure 8a, b and c shows a positive linear correlation between the LNOx PE and the average flash channel length, volume and duration estimated from LMA measurements, respectively. In turn, Figure 8d, e and f show a positive but weaker linear correlation between the LNOx PE and the average footprint, radiance and duration based on the Meteosat 12 LI flash product, respectively. Allen et al. (2021b, a) reported that the correlation between LNOx PE and the flash energy reported by GLM ranged between 0.18 and 0.57, which is consistent with the 0.3578 correlation reported in this study (Fig. 8e).
There is a positively and moderate correlation between the total number of contiguous Meteosat 12 LI groups per flash and the LNOx PE Fig. 8d. The correlation between the LNOx PE and the total number of contiguous groups per flash is lower than the correlation with the total duration measured by the LMA (Fig. 8c, g). Geostationary lightning detection optical systems detect more efficiently in-cloud activity than cloud-to-ground processes, especially during the occurrence of continuing currents in CG strokes (Wemhoner et al., 2025). The lower correlation of the LNOx PE with the total number of contiguous groups per flash than with the total duration reported by the LMA (0.36 vs 0.68) indicates that there may be lightning activity below clouds not detected by Meteosat 12 LI that contributes to the production of LNOx. Finally, Fig. 8h indicates a positive linear correlation between LNOx PE and the ratio of CG to total flashes.
The linear positive correlations between the LNOx PE and the characteristics of lightning measured by the LMA (Fig. 8a–c) are stronger than the correlations with the lightning metrics reported by Meteosat 12 LI (Fig. 8d–g) especially due to differences in two particular cases, that are the 14 August 2024 and the 4 May 2025. These cases are characterized by medium flashes in terms of flash channel length, volume, duration from the LMA and LNOx PE, but small and short in terms of the optical signal detected by Meteosat 12 LI. This suggests that the lightning characteristics measured by the LMA are better proxies for the LNOx PE than Meteosat 12 LI flash properties, potentially due to the effect of cloud cover in the optical signals detected from space.
The obtained LNOx PE in molecules of NOx per meter obtained as the LNOx PE averaged over the 18 analyzed cases divided by the averaged flash channel length with τ=5 h (Table 2) is 0.56 × 10²¹ molec. NOx m−1, which falls in the lower range of previous estimates based on laboratory and aircraft measurements (Wang et al., 1998; Stith et al., 1999; Huntrieser et al., 2002; Skamarock et al., 2003), with theoretical results based on electrodynamical models ranging between 0.045 and 0.106 × 10²¹ molec. NOx m−1 (Pérez-Invernón et al., 2025b), and with TROPOMI based estimates in the same region, ranging between 0.8 × 10²¹ and 1.6 × 10²¹ molec. NOx m−1 (Pérez-Invernón et al., 2023b). In turn, we have estimated the averaged LNOx PE in terms of molec NOx per meter from Eq. (4), obtaining 0.48 × 10²¹ molec. NOx m−1. Additionally, we have estimated the averaged LNOx PE in terms of molec NOx per second of discharge by using Eq. (4), yielding 6.53 × 1025 molec. NOx s−1 of duration reported by Meteosat 12 LI, and 6.02 × 1025 molec. NOx s−1 of duration reported by the LMA. Finally, we have calculated the averaged LNOx PE in terms of molec NOx per flash radiance seen by Meteosat 12 LI from Eq. (4), obtaining a production of 9.79 × 10²² molec. NOx per mW m−2 sr−1.
3.3 Limitations and uncertainties
3.3.1 Uncertainty in the obtained LNOx PE and lightning observations
The main limitations and sources of uncertainties related with nadir-based estimations of LNOx discussed by Allen et al. (2021a); Pérez-Invernón et al. (2022) and Seiler et al. (2025), ranging from approximately 20 % to 50 %, applies to this study. However, in our present study some of them have been partially mitigated by introducing modifications to the methods developed to estimate the background-NOx, the , and the total number of flashes.
In this study, the uncertainty in the LNOx PE estimate was evaluated by addressing key sources of error identified by Pérez-Invernón et al. (2022). Specifically, we targeted the 29 % uncertainty attributed to the background-NOx estimate, the 30 % uncertainty attributed to the parameterization of lightning activity in atmospheric models, which affected the a priori profiles of LNOx and LNO2, scattering weights, and DCC definitions, and the 7 % uncertainty due to the lightning dataset DE. By running WRF-CHEM simulations nudged towards observed lightning data instead of relying on parameterizations, we expect the 30 % source of uncertainty to be significantly reduced. Additionally, we mitigated the 29 % influence of the background-NOx estimate by using Meteosat 12 LI reported groups combined with high horizontal spatial resolution simulations. Furthermore, the use of the upgraded Lightning Mapping Array (LMA) over the Ebro Valley, with its high detection efficiency (DE), allowed us to reduce the 7 % uncertainty associated with the lightning dataset. Assuming independent error sources, the total uncertainty was recalculated as the square root of the sum of the remaining squared contributions provided by Pérez-Invernón et al. (2022). If we only account for the maximum reduction in background-NOx and lightning dataset uncertainties, the overall uncertainty is reduced by up to 20 %. However, if we also consider the elimination of the 30 % uncertainty from lightning parameterization and related factors, the total uncertainty reduction could reach about 41 %. This means that the total uncertainty, ranging from approximately 20 % to 50 % according to Seiler et al. (2025), would be reduced to a range of 12 % to 40 % .This improvement underscores the critical role of accurate lightning and background estimations in constraining LNOx PE estimates.
3.3.2 Uncertainty in the obtained relationships between LNOx PE and lightning characteristics
More significant than the absolute LNOx PE values are the relationships between the case-to-case variability of LNOx PE and lightning characteristics. Figures S53 and S54 indicate that variation in the assumed lifetime of NOx in the near-field of convection (τ) does not significantly influence the obtained relationships between LNOx PE and lightning characteristics.
We analyze the influence of the background-NOx estimate in the obtained relationships between LNOx PE and lightning characteristics by applying different methods to estimate the background-NOx. In addition to estimating background NOx from WRF-Chem simulations (Table 1), we also approximated the background NOx by considering the 10th and the 30th percentiles of the tropospheric VCD NOx over TROPOMI non-flashing pixels (i.e., pixels without detected lightning activity) (Allen et al., 2021a), as well as without substracting the background-NOx. The results, presented in Fig. S55, indicate that the choice of method for calculating background NOx has no significant impact on the observed relationships between lightning characteristics and LNOx PE, as all obtained correlations are positive regardless of the method used to estimatethe background-NOx.
Regarding the uncertainty in the characteristics of lightning flashes, the upgraded LMA network XCALMA (van der Velde and Montanyà, 2013; Rodriguez et al., 2025) provides better estimations than the results reported by Pérez-Invernón et al. (2023b). In particular, Pérez-Invernón et al. (2023b) reported the average flash channel lengths for only a portion of the studied thunderstorms due to the limited and inhomogeneous coverage of the previous LMA network. However, in this study we have been able to explore the characteristics of lightning in the entire analyzed thunderstorm cells. In turn, the strong correlations obtained between the geometric and temporal lightning characteristics derived from both LMA and Meteosat 12 LI observations further reinforce the robustness of our results.
This study examined the correlations between the geometric and temporal characteristics of lightning flashes in the Ebro Valley in Spain, as measured by LSS, LMA and Meteosat 12 LI systems, and their impact on LNOx production efficiency (LNOx PE). The results reveal positive correlations between lightning properties, such as flash channel length, volume, duration, and radiance, the ratio of CG to total flashes, and LNOx production. While these correlations are moderate, their statistical significance underscores the relevance of lightning characteristics in tropospheric LNOx emissions.
Estimates of LNOx production per flash showed slight differences depending on the measurement system and the assumption of the lifetime of NOx in the near-field of convection (τ). For τ=5 h, the mean value is 37 ± 25 mol NOx per flash for Meteosat 12 LI flashes, while it is 31 ± 24 mol NOx per flash when using the LMA lightning flash data. When setting τ=3 h, we obtain 41 ± 29 and 38 ± 31 mol NOx per flash when using Meteosat 12 LI and LMA lightning data, respectively. The averaged LNOx PE derived in this work lies toward the lower bound of previously reported estimates for the same region, which span from 42 to 108 moles of NOx per flash (Pérez-Invernón et al., 2022, 2023b). However, it is important to note that this study primarily focuses on determining the storm-to-storm variability of LNOx. It does not aim to retrieve an absolute value for NOx produced per flash. This is because the background NOx was calculated from WRF-Chem simulations, which already incorporate an assumed LNOx PE as an input parameter.
The strong correlation between LMA and Meteosat 12 LI geometry and duration measurements reinforces the consistency and robustness of the results, validating the combined use of both systems for studying atmospheric electrical activity and its chemical impact. According to the results of this study, the lightning characteristics measured by the LMA are better proxies for the LNOx PE than Meteosat 12 LI flash properties, potentially due to the effect of cloud cover in the optical signals detected from space. Positive but weak correlations between contiguous optical signals detected from space and LNOx PE are lower than the correlation between the total duration of lightning flashes and LNOx PE. This suggests that there may be in- or below-cloud lightning processes with highly attenuated optical signals that are contributing to LNOx emissions. Overall, these findings contribute to a deeper understanding of LNOx emissions and their dependence on lightning properties, providing a solid foundation for improving atmospheric models and environmental impact assessments related to thunderstorms.
In this study, we have refined the method to estimate the LNOx PE and used an upgraded LMA (XCALMA) with respect to Pérez-Invernón et al. (2023b), as well as including new Meteosat 12 LI lightning data. We analyzed a new set of thunderstorms, obtaining results that are consistent with those reported by Pérez-Invernón et al. (2023b). However, significant sources of uncertainty remain that may influence the obtained results. The relationships between LNOx PE and lightning characteristics, such as flash channel length, volume, radiance, footprint, and duration, are consistently positive regardless of the approach used to estimate LNOx PE. Nevertheless, these uncertainties complicate the quantification of these relationships. Future research could address these challenges by exploring additional factors, such as thunderstorm temporal evolution, the vertical structure of LNOx emissions, or vertical profiles of relative humidity, to further refine these estimates. Combination of LNOx estimates with systematic monitoring of lightning with continuing current could provide valuable insights into the observed variability of LNOx PE (Wang et al., 2025; Camino-Faillace et al., 2026). The launch of the geostationary Tropospheric Emissions: Monitoring of Pollution (TEMPO) (Zoogman et al., 2017; Marchenko et al., 2025; Dang et al., 2026) provides air composition measurements over the Americas. Additionally, the Meteosat Third Generation (MTG) Sounder (Holmlund et al., 2021), launched in 2025, is equipped with the Copernicus Sentinel-4 Ultraviolet-Visible-Near-Infrared (UVN) imaging spectrometer, which will report air composition, including tropospheric NO2 estimates. Meanwhile, the MTG Infrared Sounder (IRS) will deliver vertical profiles of humidity and temperature over Europe. Together, these instruments will enable a deeper understanding of the relationships between thunderstorm evolution, lightning activity, and LNOx emissions. In particular, the combination of MTG-IRS and MTG-UVN (Holmlund et al., 2021) with the upgraded XCALMA network across the Ebro Valley could significantly advance our knowledge of the key factors contributing to LNOx emissions, thereby improving their representation in atmospheric models.
The official TROPOMI data are available via ESA's public data hub after registration (https://www.tropomi.eu/data-products, last access: 27 May 2026). The TROP-DLR operational cloud and NO2 research products are available on request. Meteosat 12 LI Level 2 lightning flashes and groups can be freely downloaded from EUMETSAT's webpage https://data.eumetsat.int/product/EO:EUM:DAT:0691, https://data.eumetsat.int/product/EO:EUM:DAT:0782 (EUMETSAT, 2024a, b). XCALMA lightning data are available from UPC Lightning Research Group (https://elma.upc.edu, last access: 27 May 2026) by e-mail to a member of the group (https://elma.upc.edu/contacto, last access: 27 May 2026) or by contacting the Servei Meteorològic de Catalunya. SMC-LLS data shall be requested from the Servei Meteorològic de Catalunya. The WRF-Chem model used, version 4.3.1, is freely available from the developers' website (https://github.com/wrf-model/WRF/releases, last access: 27 May 2026), with the pre-processor tools available from NCAR's website (https://www.acom.ucar.edu/wrf-chem/download.shtml, last access: 27 May 2026). National Centers for Environmental Prediction (NCEP) Final (FNL) Operational Global Analysis meteorological data used to drive the WRF-Chem simulations are downloaded from the National Center for Atmospheric Research (NCAR) Research Data Archive website (https://doi.org/10.5065/D6M043C6, NCEP/NWS/NOAA/USDC, (National Centers for Environmental Prediction/National Weather Service/NOAA/U.S. Department of Commerce, 2000)), with the chemistry data used to force WRF-Chem, the output of the Community Atmosphere Model with chemistry (CAM-Chem) model, extracted from NCAR's website (https://doi.org/10.5065/NMP7-EP60, Buchholz et al., 2019). The data of the simulations generated in this study have been deposited in the Zenodo repositories https://doi.org/10.5281/zenodo.20065621, https://doi.org/10.5281/zenodo.19588416 (Pérez-Invernón, 2026a, b).
The supplement related to this article is available online at https://doi.org/10.5194/acp-26-14277-2026-supplement.
FJPI: conceptualization, methodology, software, formal analysis, investigation, project administration, funding acquisition, writing (original draft). FJGV: conceptualization, project administration, funding acquisition, writing (review and editing). OVDV: methodology, software, investigation, data curation, writing (review and editing). JM: resources, project administration, funding acquisition, writing (review and editing). JALT: resources, writing (review and editing). NP: resources, funding acquisition, writing (review and editing). DL: resources, data curation, writing (review and editing). SS: resources, data curation, writing (review and editing). CK: methodology, writing (review and editing). AOF: software, writing (review and editing). HH: conceptualization, writing (review and editing).
The contact author has declared that none of the authors has any competing interests.
Publisher's note: Copernicus Publications remains neutral with regard to jurisdictional claims made in the text, published maps, institutional affiliations, or any other geographical representation in this paper. The authors bear the ultimate responsibility for providing appropriate place names. Views expressed in the text are those of the authors and do not necessarily reflect the views of the publisher.
This study is part of the project RYC2022-035821-I, funded by MCIN/AEI/10.13039/501100011033 and FSE+ (FJPI). Additionally, this work was supported by grants PID2022-136348NB-C31 and PID2025-169163NB-C31 funded by MCIN/AEI/10.13039/501100011033 and “ERDF A way of making Europe”. F.J.P.I. and F.J.G.V. acknowledge financial support from the grant CEX2021-001131-S funded by MCIN/AEI/10.13039/501100011033. The UPC work was supported by research grants from the Spanish Ministry (MCIN/AEI/10.13039/501100011033) PID2022-136348NB-C32, and EQC2021-006957-P. The high performance computing simulations (HPC) have been carried out on the DRAGO supercomputer of CSIC. We acknowledge use of the WRF-Chem preprocessor tool (mozbc, fire-emiss, etc.) provided by the Atmospheric Chemistry Observations and Modeling Lab (ACOM) of NCAR.
This research has been supported by the Agencia Estatal de Investigación (grant nos. RYC2022-035821-I, PID2022-136348NB-C31, PID2022-136348NB-C32, PID2025-169163NB-C31, EQC2021-006957-P, and CEX2021-001131-S).
The article processing charges for this open-access publication were covered in part by the CSIC Open Access Publication Support Initiative through its Unit of Information Resources for Research (URICI).
This paper was edited by James Lee and reviewed by two anonymous referees.
Allen, D., Pickering, K. E., Bucsela, E., Van Geffen, J., Lapierre, J., Koshak, W., and Eskes, H.: Observations of Lightning NOx Production From Tropospheric Monitoring Instrument Case Studies Over the United States, J. Geophys. Res.-Atmos., 126, e2020JD034174, https://doi.org/10.1029/2020JD034174, 2021a. a, b, c, d, e, f, g, h, i, j, k, l, m, n, o, p, q
Allen, D. J. and Pickering, K. E.: Evaluation of lightning flash rate parameterizations for use in a global chemical transport model, J. Geophys. Res.-Atmos., 107, ACH–15, https://doi.org/10.1029/2002JD002066, 2002. a
Allen, D. J., Pickering, K. E., Bucsela, E., Krotkov, N., and Holzworth, R.: Lightning NOx production in the tropics as determined using OMI NO2 retrievals and WWLLN stroke data, J. Geophys. Res.-Atmos., 124, 13498–13518, https://doi.org/10.1029/2018JD029824, 2019. a, b
Allen, D. J., Pickering, K. E., Lamsal, L., Mach, D. M., Quick, M. G., Lapierre, J., Janz, S., Koshak, W., Kowalewski, M., and Blakeslee, R.: Observations of Lightning NOx Production From GOES R Post Launch Test Field Campaign Flights, J. Geophys. Res.-Atmos., 126, e33769, https://doi.org/10.1029/2020JD033769, 2021b. a, b
Barth, M. C., Cantrell, C. A., Brune, W. H., et al.: The deep convective clouds and chemistry (DC3) field campaign, B. Am. Meteor. Soc., 96, 1281–1309, https://doi.org/10.1175/BAMS-D-13-00290.1, 2015. a
Beirle, S., Salzmann, M., Lawrence, M. G., and Wagner, T.: Sensitivity of satellite observations for freshly produced lightning NOx, Atmos. Chem. Phys., 9, 1077–1094, https://doi.org/10.5194/acp-9-1077-2009, 2009. a
Beirle, S., Huntrieser, H., and Wagner, T.: Direct satellite observation of lightning-produced NOx, Atmos. Chem. Phys., 10, 10965–10986, https://doi.org/10.5194/acp-10-10965-2010, 2010. a
Bitzer, P. M.: Global distribution and properties of continuing current in lightning, J. Geophys. Res.-Atmos., 122, 1033–1041, 2017. a, b
Bližňák, V. and Sokol, Z.: First validation of the Lightning Imager aboard Meteosat Third Generation satellite with Earth Networks Total Lightning Network, Int. J. Appl. Earth Obs., 147, 105205, https://doi.org/10.1016/j.jag.2026.105205, 2026. a, b
Boccippio, D. J., Cummins, K. L., Christian, H. J., and Goodman, S. J.: Combined satellite-and surface-based estimation of the intracloud–cloud-to-ground lightning ratio over the continental United States, Mon. Weather Rev., 129, 108–122, https://doi.org/10.1175/1520-0493(2001)129<0108:CSASBE>2.0.CO;2, 2001. a
Bozóki, T., Mlynarczyk, J., Prácser, E., Kulak, A., Sátori, G., Füllekrug, M., and Williams, E.: Modeling the global electromagnetic resonance field produced by lightning discharges with a continuing current, J. Geophys. Res.-Atmos., 130, e2025JD043989, https://doi.org/10.1029/2025JD043989, 2025. a
Brasseur, G. P., Hauglustaine, D., Walters, S., Rasch, P., Müller, J.-F., Granier, C., and Tie, X.: MOZART, a global chemical transport model for ozone and related chemical tracers: 1. Model description, J. Geophys. Res.-Atmos., 103, 28265–28289, https://doi.org/10.1029/98JD02397, 1998. a
Bruning, E. C. and MacGorman, D. R.: Theory and observations of controls on lightning flash size spectra, J. Atmos. Sci., 70, 4012–4029, https://doi.org/10.1175/JAS-D-12-0289.1, 2013. a
Bruning, E. C. and Thomas, R. J.: Lightning channel length and flash energy determined from moments of the flash area distribution, J. Geophys. Res.-Atmos., 120, 8925–8940, https://doi.org/10.1002/2015JD023766, 2015. a, b
Buchholz, R., Emmons, L., Tilmes, S., and Team, T.: CESM2. 1/CAM-chem instantaneous output for boundary conditions, UCAR/NCAR-Atmospheric chemistry observations and modeling Laboratory [data set], 10, https://doi.org/10.5065/NMP7-EP60, 2019. a, b
Bucsela, E. J., Krotkov, N. A., Celarier, E. A., Lamsal, L. N., Swartz, W. H., Bhartia, P. K., Boersma, K. F., Veefkind, J. P., Gleason, J. F., and Pickering, K. E.: A new stratospheric and tropospheric NO2 retrieval algorithm for nadir-viewing satellite instruments: applications to OMI, Atmos. Meas. Tech., 6, 2607–2626, https://doi.org/10.5194/amt-6-2607-2013, 2013. a, b, c, d, e
Bucsela, E., Pickering, K., Allen, D., Loyola, D., Eskes, H., Veefkind, P., van Geffen, J., Koshak, W., and Krotkov, N.: Improved Lightning NOx Production Estimates Using TROPOMI and GLM Data, AGU Fall Meeting 2021, New Orleans, LA, 13–17 December 2021, A24E–07, https://studio.m-anage.com/agu/fm21/meetingapp.cgi/Paper/983228 (last access: 5 October 2026), 2021. a
Bucsela, E. J., Pickering, K. E., Allen, D. J., Holzworth, R. H., and Krotkov, N. A.: Midlatitude lightning NOx production efficiency inferred from OMI and WWLLN data, J. Geophys. Res.-Atmos., 124, 13475–13497, https://doi.org/10.1029/2019JD030561, 2019. a, b, c, d, e
Camino-Faillace, P. A., Gordillo-Vázquez, F., Pérez-Invernón, F. J., Montanyà, J., Młynarczyk, J., Neubert, T., Chanrion, O., and Østgaard, N.: Optical and radio characterization of continuing current lightning with ASIM, GLM and ELF sensors, Atmos. Res., 108578, https://doi.org/10.1016/j.atmosres.2025.108578, 2026. a, b, c
Chin, M., Rood, R. B., Lin, S.-J., Müller, J.-F., and Thompson, A. M.: Atmospheric sulfur cycle simulated in the global model GOCART: Model description and global properties, J. Geophys. Res.-Atmos., 105, 24671–24687, https://doi.org/10.1029/2000JD900384, 2000. a
Chou, M.-D. and Suarez, M. J.: A solar radiation parameterization for atmospheric studies, Tech. rep., NASA Technical Report Series on Global Modeling and Data Assimilation, NASA/TM-1999-104606, Vol. 15, https://ntrs.nasa.gov/citations/19990060930 (last access: 5 October 2026), 2026. a
Chronis, T., Lang, T., Koshak, W., Blakeslee, R., Christian, H., McCaul, E., and Bailey, J.: Diurnal characteristics of lightning flashes detected over the São Paulo lightning mapping array, J. Geophys. Res.-Atmos., 120, 11–799, https://doi.org/10.1002/2015JD023960, 2015. a, b
Cummins, K. L. and Murphy, M. J.: An overview of lightning locating systems: History, techniques, and data uses, with an in-depth look at the US NLDN, IEEE T. Electromagn. C., 51, 499–518, 2009. a, b
Cummins, K. L., Murphy, M. J., Bardo, E. A., Hiscox, W. L., Pyle, R. B., and Pifer, A. E.: A combined TOA/MDF technology upgrade of the U.S. National Lightning Detection Network, J. Geophys. Res., 103, 9035, https://doi.org/10.1029/98JD00153, 1998. a, b
Dahlmann, K., Grewe, V., Ponater, M., and Matthes, S.: Quantifying the contributions of individual NOx sources to the trend in ozone radiative forcing, Atmos. Environ., 45, 2860–2868, https://doi.org/10.1016/j.atmosenv.2011.02.071, 2011. a
Dang, R., Jacob, D. J., He, M., Clifton, O. E., Li, K., and Liao, H.: Lightning Source of Nitrogen Oxides (NOx) Inferred From Geostationary Satellites: Global Implications for Oxidant Chemistry, Geophys. Res. Lett., 53, e2026GL124557, https://doi.org/10.1029/2026GL124557, 2026. a
Ding, Z., Zhu, Y., Lapierre, J., DiGangi, E., Ringhausen, J., Lauria, P. B., Saba, M. M., Rakov, V. A., Abbasi, R. U., da Silva, D. R., and da Silva, T. P.: Continuing current seen above and below the cloud: Comparing observations from GLM and high-speed video cameras, Geophys. Res. Lett., 51, e2024GL110099, https://doi.org/10.1029/2024GL110099, 2024. a, b
Dobber, M. and Grandell, J.: Meteosat Third Generation (MTG) Lightning Imager (LI) instrument performance and calibration from user perspective, in: The Characterization and Radiometric Calibration for Remote Sensing Annual Meeting (CALCON 2014), Logan, UT, USA, https://digitalcommons.usu.edu/calcon/CALCON2014/All2014Content/13/ (last access: 5 October 2026), 2014. a, b, c
Ek, M., Mitchell, K., Lin, Y., Rogers, E., Grunmann, P., Koren, V., Gayno, G., and Tarpley, J.: Implementation of Noah land surface model advances in the National Centers for Environmental Prediction operational mesoscale Eta model, J. Geophys. Res.-Atmos., 108, https://doi.org/10.1029/2002JD003296, 2003. a
Enno, S.-E., Viticchie, B., Navia, D., and Grandell, J.: Meteosat-12 Lightning Imager: first year of observations and the main performance characteristics, 12th European Conference on Severe Storms, Utrecht, The Netherlands, 17–21 Nov 2025, ECSS2025-152, https://doi.org/10.5194/ecss2025-152, 2025. a, b, c, d
EUMETSAT: LI Lightning Flashes – MTG – 0 degree (Version 1.0), https://data.eumetsat.int/product/EO:EUM:DAT:0691 (last access: 5 October 2026), 2024a. a
EUMETSAT: LI Lightning Flashes – MTG – 0 degree (Version 1.0), https://data.eumetsat.int/product/EO:EUM:DAT:0782 (last access: 5 October 2026), 2024b. a
Fairman, S. I. and Bitzer, P. M.: The detection of continuing current in lightning using the geostationary lightning mapper, J. Geophys. Res.-Atmos., 127, e2020JD033451, https://doi.org/10.1029/2020JD033451, 2022. a, b
Fehr, T., Höller, H., and Huntrieser, H.: Model study on production and transport of lightning-produced NOx in a EULINOX supercell storm, J. Geophys. Res.-Atmos., 109, https://doi.org/10.1029/2003JD003935, 2004. a
Fierro, A. O., Mansell, E. R., Ziegler, C. L., and MacGorman, D. R.: Application of a lightning data assimilation technique in the WRF-ARW model at cloud-resolving scales for the tornado outbreak of 24 May 2011, Mon. Weather Rev., 140, 2609–2627, https://doi.org/10.1175/MWR-D-11-00299.1, 2012. a
Fuchs, B. R., Bruning, E. C., Rutledge, S. A., Carey, L. D., Krehbiel, P. R., and Rison, W.: Climatological analyses of LMA data with an open-source lightning flash-clustering algorithm, J. Geophys. Res.-Atmos., 121, 8625–8648, https://doi.org/10.1002/2015JD024663, 2016. a
Gedik, E., Mansouri, E., Kohlmann, H., Schulz, W., and Rubinstein, M.: Performance Evaluation of Meteosat Third Generation Lightning Imager in Detecting Lightning Discharges, in: 2025 International Symposium on Lightning Protection (XVIII SIPDA), IEEE, 1–5, https://doi.org/10.1109/SIPDA68639.2025.11296657, 2025. a, b
Gordillo-Vázquez, F. J., Pérez-Invernón, F. J., Huntrieser, H., and Smith, A. K.: Comparison of Six Lightning Parameterizations in CAM5 and the Impact on Global Atmospheric Chemistry, Earth Space Sci., 6, 2317–2346, https://doi.org/10.1029/2019EA000873, 2019. a, b
Grell, G. A. and Dévényi, D.: A generalized approach to parameterizing convection combining ensemble and data assimilation techniques, Geophys. Res. Lett., 29, 38-1, https://doi.org/10.1029/2002GL015311, 2002. a
Grell, G. A., Peckham, S. E., Schmitz, R., McKeen, S. A., Frost, G., Skamarock, W. C., and Eder, B.: Fully coupled “online” chemistry within the WRF model, Atmos. Environ., 39, 6957–6975, https://doi.org/10.1016/j.atmosenv.2005.04.027, 2005. a, b
Guenther, A. B., Jiang, X., Heald, C. L., Sakulyanontvittaya, T., Duhl, T., Emmons, L. K., and Wang, X.: The Model of Emissions of Gases and Aerosols from Nature version 2.1 (MEGAN2.1): an extended and updated framework for modeling biogenic emissions, Geosci. Model Dev., 5, 1471–1492, https://doi.org/10.5194/gmd-5-1471-2012, 2012. a
Holmlund, K., Grandell, J., Schmetz, J., Stuhlmann, R., Bojkov, B., Munro, R., Lekouara, M., Coppens, D., Viticchie, B., August, T., Theodore, B., Watts, P., Dobber, M., Fowler, G., Bojinski, S., Schmid, A., Salonen, K., Tjemkes, S., Aminou, D., and Blythe, P.: Meteosat Third Generation (MTG): Continuation and innovation of observations from geostationary orbit, B. Am. Meteor. Soc., 102, E990–E1015, https://doi.org/10.1175/BAMS-D-19-0304.1, 2021. a, b, c, d, e
Hong, S.-Y. and Lim, J.-O. J.: The WRF single-moment 6-class microphysics scheme (WSM6), Asia-Pac. J. Atmos. Sci., 42, 129–151, 2006. a
Hu, X.-M., Klein, P. M., and Xue, M.: Evaluation of the updated YSU planetary boundary layer scheme within WRF for wind resource and air quality assessments, J. Geophys. Res.-Atmos., 118, 10–490, https://doi.org/10.1002/jgrd.50823, 2013. a
Huntrieser, H., Feigl, C., Schlager, H., Schröder, F., Gerbig, C., Van Velthoven, P., Flatøy, F., Théry, C., Petzold, A., Höller, H., and Schumann, U.: Airborne measurements of NOx, tracer species, and small particles during the European Lightning Nitrogen Oxides Experiment, J. Geophys. Res.-Atmos., 107, ACH–5, https://doi.org/10.1029/2000JD000209, 2002. a, b
Huntrieser, H., Schumann, U., Schlager, H., Höller, H., Giez, A., Betz, H.-D., Brunner, D., Forster, C., Pinto Jr., O., and Calheiros, R.: Lightning activity in Brazilian thunderstorms during TROCCINOX: implications for NOx production, Atmos. Chem. Phys., 8, 921–953, https://doi.org/10.5194/acp-8-921-2008, 2008. a, b
International Electrotechnical Commission: Lightning density – Methods for calculation using lightning location systems (LLS), https://cdn.standards.iteh.ai/samples/102016/9d0f88cdd88140a7859de60428d43d74/IEC-62858-2019.pdf (last access: 5 October 2026), 2019. a
Janjić, Z. I.: The step-mountain eta coordinate model: Further developments of the convection, viscous sublayer, and turbulence closure schemes, Mon. Weather Rev., 122, 927–945, https://doi.org/10.1175/1520-0493(1994)122<0927:TSMECM>2.0.CO;2, 1994. a
Janssens-Maenhout, G., Crippa, M., Guizzardi, D., Dentener, F., Muntean, M., Pouliot, G., Keating, T., Zhang, Q., Kurokawa, J., Wankmüller, R., Denier van der Gon, H., Kuenen, J. J. P., Klimont, Z., Frost, G., Darras, S., Koffi, B., and Li, M.: HTAP_v2.2: a mosaic of regional and global emission grid maps for 2008 and 2010 to study hemispheric transport of air pollution, Atmos. Chem. Phys., 15, 11411–11432, https://doi.org/10.5194/acp-15-11411-2015, 2015. a
Jenkins, J. M., Brune, W. H., and Miller, D. O.: Electrical discharges produce prodigious amounts of hydroxyl and hydroperoxyl radicals, J. Geophys. Res.-Atmos., 126, e2021JD034557, https://doi.org/10.1029/2021JD034557, 2021. a
Jöckel, P., Tost, H., Pozzer, A., Kunze, M., Kirner, O., Brenninkmeijer, C. A. M., Brinkop, S., Cai, D. S., Dyroff, C., Eckstein, J., Frank, F., Garny, H., Gottschaldt, K.-D., Graf, P., Grewe, V., Kerkweg, A., Kern, B., Matthes, S., Mertens, M., Meul, S., Neumaier, M., Nützel, M., Oberländer-Hayn, S., Ruhnke, R., Runde, T., Sander, R., Scharffe, D., and Zahn, A.: Earth System Chemistry integrated Modelling (ESCiMo) with the Modular Earth Submodel System (MESSy) version 2.51, Geosci. Model Dev., 9, 1153–1200, https://doi.org/10.5194/gmd-9-1153-2016, 2016. a
Lapierre, J. L., Laughner, J. L., Geddes, J. A., Koshak, W. J., Cohen, R. C., and Pusede, S. E.: Observing US regional variability in lightning NO2 production rates, J. Geophys. Res.-Atmos., 125, e2019JD031362, https://doi.org/10.1029/2019JD031362, 2020. a
Laughner, J. L. and Cohen, R. C.: Quantification of the effect of modeled lightning NO2 on UV–visible air mass factors, Atmos. Meas. Tech., 10, 4403–4419, https://doi.org/10.5194/amt-10-4403-2017, 2017. a, b, c
Lindfors, A. V., Kujanpää, J., Kalakoski, N., Heikkilä, A., Lakkala, K., Mielonen, T., Sneep, M., Krotkov, N. A., Arola, A., and Tamminen, J.: The TROPOMI surface UV algorithm, Atmos. Meas. Tech., 11, 997–1008, https://doi.org/10.5194/amt-11-997-2018, 2018. a
Liu, S., Valks, P., Pinardi, G., Xu, J., Chan, K. L., Argyrouli, A., Lutz, R., Beirle, S., Khorsandi, E., Baier, F., Huijnen, V., Bais, A., Donner, S., Dörner, S., Gratsea, M., Hendrick, F., Karagkiozidis, D., Lange, K., Piters, A. J. M., Remmers, J., Richter, A., Van Roozendael, M., Wagner, T., Wenig, M., and Loyola, D. G.: An improved TROPOMI tropospheric NO2 research product over Europe, Atmos. Meas. Tech., 14, 7297–7327, https://doi.org/10.5194/amt-14-7297-2021, 2021. a, b, c
Loyola, D. G., Gimeno García, S., Lutz, R., Argyrouli, A., Romahn, F., Spurr, R. J. D., Pedergnana, M., Doicu, A., Molina García, V., and Schüssler, O.: The operational cloud retrieval algorithms from TROPOMI on board Sentinel-5 Precursor, Atmos. Meas. Tech., 11, 409–427, https://doi.org/10.5194/amt-11-409-2018, 2018. a, b, c
Luhar, A. K., Galbally, I. E., Woodhouse, M. T., and Abraham, N. L.: Assessing and improving cloud-height-based parameterisations of global lightning flash rate, and their impact on lightning-produced NOx and tropospheric composition in a chemistry–climate model, Atmos. Chem. Phys., 21, 7053–7082, https://doi.org/10.5194/acp-21-7053-2021, 2021. a
Luque, A., Gordillo-Vázquez, F. J., Li, D., Malagón-Romero, A., Pérez-Invernón, F. J., Schmalzried, A., Soler, S., Chanrion, O., Heumesser, M., Neubert, T., Reglero, V., and Østgaard, N.: Modeling lightning observations from space-based platforms (CloudScat.jl 1.0), Geosci. Model Dev., 13, 5549–5566, https://doi.org/10.5194/gmd-13-5549-2020, 2020. a
Marchenko, S. V., Carr, J. L., Chong, H., Houck, J. C., Liu, X., Flittner, D. E., Joiner, J., Baker, B. D., Lasnik, J. K., and Nicks, D. K.: TEMPO at night: Lightning flashes and on-orbit instrument performance, Earth Space Sci., 12, e2025EA004513, https://doi.org/10.1029/2025EA004513, 2025. a
Mlawer, E. J., Taubman, S. J., Brown, P. D., Iacono, M. J., and Clough, S. A.: Radiative transfer for inhomogeneous atmospheres: RRTM, a validated correlated-k model for the longwave, J. Geophys. Res.-Atmos., 102, 16663–16682, https://doi.org/10.1029/97JD00237, 1997. a
Montanyà, J., Pineda, N., March, V., Illa, A., Romero, D., and Solà, G.: Experimental evaluation of the Catalan lightning detection network, in: 19th international lightning detection conference, Tucson, https://www.researchgate.net/profile/Nicolau-Pineda/publication/255570445 (last access: 5 October 2026), 2006. a
Montanyà, J., Van der Velde, O. A., March, V., Romero, D., Solà, G., and Pineda, N.: High-speed video of lightning and X-ray pulses during the 2009–2010 observation campaigns in northeastern Spain, Atmos. Res., 117, 91–98, https://doi.org/10.1016/j.atmosres.2011.09.013, 2012. a
Montanyà, J., van der Velde, O., Solà, G., Fabró, F., Romero, D., Pineda, N., and Argemí, O.: Lightning flash properties derived from Lightning Mapping Array data, in: 2014 International Conference on Lightning Protection (ICLP), IEEE, 974–978, https://doi.org/10.1109/ICLP.2014.6973264, 2014. a
Montanyà, J., López, J. A., Morales Rodriguez, C. A., van der Velde, O. A., Fabró, F., Pineda, N., Navarro-González, J., Reglero, V., Neubert, T., Chanrion, O., Goodman, S. J., Østgaard, N., Ladino-Rincon, A., Romero, D., Solà, G., Horta, R., and Freijó, M.: A Simultaneous Observation of Lightning by ASIM, Colombia-Lightning Mapping Array, GLM, and ISS-LIS, J. Geophys. Res.-Atmos., 126, e2020JD033735, https://doi.org/10.1029/2020JD033735, 2021. a
Montanya, J., Van Der Velde, O., López Trujillo, J. A., Pineda, N., Romero, D., Sola, G., Defer, E., Soula, S., Bruning, E. C., Viticchiè, B., Enno, S.-E., Grandell, J., Gordillo-Vazquez, F. J., Perez-Invernon, F. J., Neubert, T., Chanrion, O., Ostgaard, N., and Victor, R.: MTG Lightning Imager performance during the first days of public data with the Ebro Lightning Mapping Array and the ASIM instrument on the ISS, in: AGU Fall Meeting Abstracts, 2024, AE32A–01, https://ui.adsabs.harvard.edu/abs/2024AGUFMAE32A..01M/abstract (last access: 5 October 2026), 2024. a, b
Murphy, M. J. and Nag, A.: Cloud lightning performance and climatology of the US based on the upgraded US National Lightning Detection Network, in: Seventh Conf. on the Meteorological Applications of Lightning Data, https://ams.confex.com/ams/95Annual/webprogram/Manuscript/Paper262391/AMS2015_MALD_8.2_murphy.pdf (last access: 5 October 2026), 2015. a
Murray, L. T., Jacob, D. J., Logan, J. A., Hudman, R. C., and Koshak, W. J.: Optimized regional and interannual variability of lightning in a global chemical transport model constrained by LIS/OTD satellite data, J. Geophys. Res.-Atmos., 117, https://doi.org/10.1029/2012JD017934, 2012. a, b
National Center for Atmospheric Research (NCAR): WRF-Chem, Atmospheric Chemistry Observations & Modeling, University Corporation for Atmospheric Research, https://www2.acom.ucar.edu/wrf-chem (last access: 5 October 2026), 2021. a
National Center for Atmospheric Research (NCAR): Whole Atmosphere Community Climate Model (WACCM) Model Output, [data set], d313006, https://doi.org/10.5065/G643-Z138, 2024. a
National Centers for Environmental Prediction: NCEP GDAS/FNL 0.25 Degree Global Tropospheric Analyses and Forecast Grids, dataset: ds083.3, https://doi.org/10.5065/D65Q4T4Z, 2015. a
National Centers for Environmental Prediction/National Weather Service/NOAA/U.S. Department of Commerce: NCEP FNL Operational Model Global Tropospheric Analyses, continuing from July 1999, NSF National Center for Atmospheric Research [data set], https://doi.org/10.5065/D6M043C6, 2000. a
Nault, B. A., Laughner, J. L., Wooldridge, P. J., Crounse, J. D., Dibb, J., Diskin, G., Peischl, J., Podolske, J. R., Pollack, I. B., Ryerson, T. B., Scheuer, E., Wennberg, P. O., and Cohen, R. C.: Lightning NOx Emissions: Reconciling Measured and Modeled Estimates With Updated NOx Chemistry, Geophys. Res. Lett., 44, 9479–9488, https://doi.org/10.1002/2017GL074436, 2017GL074436, 2017. a
Noh, Y., Cheon, W., Hong, S., and Raasch, S.: Improvement of the K-profile model for the planetary boundary layer based on large eddy simulation data, Bound.-Lay. Meteorol., 107, 401–427, https://doi.org/10.1023/A:1022146015946, 2003. a
Ott, L. E., Pickering, K. E., Stenchikov, G. L., Allen, D. J., DeCaria, A. J., Ridley, B., Lin, R.-F., Lang, S., and Tao, W.-K.: Production of lightning NOx and its vertical distribution calculated from three-dimensional cloud-scale chemical transport model simulations, J. Geophys. Res.-Atmos., 115, https://doi.org/10.1029/2009JD011880, 2010. a
Pérez-Invernón, F. J.: High-resolution atmospheric simulations using a modified WRF-Chem v4.3: Lightning effects on air quality in the Ebro Valley – Lightning nudging towards MTG-LI, Zenodo [data set], https://doi.org/10.5281/zenodo.20065621, 2026a. a
Pérez-Invernón, F. J.: High-resolution atmospheric simulations using a modified WRF-Chem v4.3: Lightning effects on air quality in the Ebro Valley – Lightning nudging towards MTG-LI scaled to XCALMA, Zenodo [data set], https://doi.org/10.5281/zenodo.19588416, 2026b. a
Pérez-Invernón, F. J., Huntrieser, H., Erbertseder, T., Loyola, D., Valks, P., Liu, S., Allen, D. J., Pickering, K. E., Bucsela, E. J., Jöckel, P., van Geffen, J., Eskes, H., Soler, S., Gordillo-Vázquez, F. J., and Lapierre, J.: Quantification of lightning-produced NOx over the Pyrenees and the Ebro Valley by using different TROPOMI-NO2 and cloud research products, Atmos. Meas. Tech., 15, 3329–3351, https://doi.org/10.5194/amt-15-3329-2022, 2022. a, b, c, d, e, f, g, h, i, j, k, l, m, n, o, p, q, r, s, t, u, v
Pérez-Invernón, F. J., Gordillo-Vázquez, F. J., Huntrieser, H., and Jöckel, P.: Variation of lightning-ignited wildfire patterns under climate change, Nat. Commun., 14, 739, https://doi.org/10.1038/s41467-023-36500-5, 2023a. a
Pérez-Invernón, F. J., Gordillo-Vázquez, F. J., van der Velde, O., Montanyá, J., López Trujillo, J. A., Pineda, N., Huntrieser, H., Valks, P., Loyola, D., Seo, S., and Erbertseder, T.: Lightning-Produced Nitrogen Oxides Per Flash Length Obtained by Using TROPOMI Observations and the Ebro Lightning Mapping Array, Geophys. Res. Lett., 50, e2023GL104699, https://doi.org/10.1029/2023GL104699, 2023b. a, b, c, d, e, f, g, h, i, j, k, l, m, n, o, p, q, r, s, t, u, v, w, x, y
Pérez-Invernón, F. J., Gordillo-Vázquez, F. J., Huntrieser, H., Jöckel, P., and Bucsela, E. J.: Sensitivity of climate–chemistry model simulated atmospheric composition to the application of an inverse relationship between NOx emission and lightning flash frequency, Atmos. Chem. Phys., 25, 5557–5575, https://doi.org/10.5194/acp-25-5557-2025, 2025a. a, b
Pérez-Invernón, F. J., Ripoll, J.-F., Gordillo-Vázquez, F. J., Luque, A., Camino-Faillace, P. A., Li, D., Neubert, T., Chanrion, O., and Østgaard, N.: A comprehensive analysis of optical emissions, production of NOx, HOx, and other chemical species by lightning, J. Geophys. Res.-Atmos., 130, e2025JD043972, https://doi.org/10.1029/2025JD043972, 2025b. a, b
Pickering, K. E., Wang, Y., Tao, W.-K., Price, C., and Müller, J.-F.: Vertical distributions of lightning NOx for use in regional and global chemical transport models, J. Geophys. Res.-Atmos., 103, 31203–31216, https://doi.org/10.1029/98JD02651, 1998. a
Pickering, K. E., Bucsela, E., Allen, D., Ring, A., Holzworth, R., and Krotkov, N.: Estimates of lightning NOx production based on OMI NO2 observations over the Gulf of Mexico, J. Geophys. Res.-Atmos., 121, 8668–8691, https://doi.org/10.1002/2015JD024179, 2016. a, b
Pickering, K. E., Li, Y., Cummings, K. A., Barth, M. C., Allen, D. J., Bruning, E. C., and Pollack, I. B.: Lightning NOx in the 29–30 May 2012 Deep Convective Clouds and Chemistry (DC3) Severe Storm and Its Downwind Chemical Consequences, J. Geophys. Res.-Atmos., 129, e2023JD039439, https://doi.org/10.1029/2023JD039439, 2024. a, b
Pickering, K. E., Allen, D. J., and Huntrieser, H.: The role of lightning in atmospheric chemistry, J. Geophys. Res.-Atmos., 131, e2026JD046484, https://doi.org/10.1029/2026JD046484, 2026. a, b, c
Pineda, N. and Montanyà, J.: Lightning detection in Spain: the particular case of Catalonia, Lightning: Principles, Instruments and Applications: Review of Modern Lightning Research, 161–185, https://doi.org/10.1007/978-1-4020-9079-0, 2009. a
Pineda, N., Esteban, P., Trapero, L., Soler, X., and Beck, C.: Circulation types related to lightning activity over Catalonia and the Principality of Andorra, Phys. Chem. Earth, 35, 469–476, https://doi.org/10.1016/j.pce.2009.12.009, 2010. a
Pineda, N., Balagué, M., Fabró, F., Montanyà, J., van der Velde, O., Rodríguez, O., López, J. A., and Romero, D.: Validation of the MTG-LI with a Lightning Mapping Array (LMA): Evaluating Flash Rates within Intense Convective Storms, in: Proceedings of the 2025 EUMETSAT Meteorological Satellite Conference, Lyon, France, https://program-eumetsat2025.kuoni-congress.info/presentation/ (last access: 5 October 2026), 2025. a, b, c
Price, C., Penner, J., and Prather, M.: NOx from lightning: 1. Global distribution based on lightning physics, J. Geophys. Res., 102, 5929, https://doi.org/10.1029/96JD03504, 1997. a, b, c
Rahman, M., Cooray, V., Rakov, V. A., Uman, M., Liyanage, P., DeCarlo, B., Jerauld, J., and Olsen III, R.: Measurements of NOx produced by rocket-triggered lightning, Geophys. Res. Lett., 34, https://doi.org/10.1029/2006GL027956, 2007. a, b, c
Ringhausen, J., Bitzer, P., Koshak, W., and Mecikalski, J.: Classification of GLM flashes using random forests, Earth Space Sci., 8, e2021EA001861, https://doi.org/10.1029/2021EA001861, 2021. a
Ripoll, J.-F., Zinn, J., Jeffery, C. A., and Colestock, P. L.: On the dynamics of hot air plasmas related to lightning discharges: 1. Gas dynamics, J. Geophys. Res.-Atmos., 119, 9196–9217, https://doi.org/10.1002/2013JD020068, 2014. a
Rison, W., Thomas, R. J., Krehbiel, P. R., Hamlin, T., and Harlin, J.: A GPS-based three-dimensional lightning mapping system: Initial observations in central New Mexico, Geophys. Res. Lett., 26, 3573, https://doi.org/10.1029/1999GL010856, 1999. a, b
Rodriguez, O., van der Velde, O., Fabró, F., Pineda, N., Balagué, M., and Montanyà, J.: Severe storm signatures in three-dimensional lightning data (LMA): isolated lightning on the overshooting cloud tops, Tech. rep., Copernicus Meetings, https://doi.org/10.5194/ecss2025-109, 2025. a, b, c
Roncancio, J., Montanyà, J., López, J., Urbani, M., and van der Velde, O.: Investigation of GLM detections of negative continuing currents observed by high-speed video and narrow-band 777 nm photometer, Electr. Power Syst. Res., 239, 111250, https://doi.org/10.1016/j.epsr.2024.111250, 2025. a, b
San Segundo, H., López, J. A., Pineda, N., Altube, P., and Montanya, J.: Sensitivity analysis of lightning stroke-to-flash grouping criteria, Atmos. Res., 242, 105023, https://doi.org/10.1016/j.atmosres.2020.105023, 2020. a
Schulz, W., Cummins, K., Diendorfer, G., and Dorninger, M.: Cloud-to-ground lightning in Austria: A 10-year study using data from a lightning location system, J. Geophys. Res.-Atmos., 110, https://doi.org/10.1029/2004JD005332, 2005. a
Schulz, W., Diendorfer, G., Pedeboy, S., and Poelman, D. R.: The European lightning location system EUCLID – Part 1: Performance analysis and validation, Nat. Hazards Earth Syst. Sci., 16, 595–605, https://doi.org/10.5194/nhess-16-595-2016, 2016. a
Schumann, U. and Huntrieser, H.: The global lightning-induced nitrogen oxides source, Atmos. Chem. Phys., 7, 3823–3907, https://doi.org/10.5194/acp-7-3823-2007, 2007. a, b, c, d, e, f, g, h
Seiler, M., Pickering, K., Allen, D., Bucsela, E., and Huntrieser, H.: Evaluation of satellite-based lightning NOx columns using in-cloud aircraft measurements, J. Geophys. Res.-Atmos., 130, e2024JD043253, https://doi.org/10.1029/2024JD043253, 2025. a, b, c
Skamarock, W. C., Dye, J. E., Defer, E., Barth, M., Stith, J. L., Ridley, B. A., and Baumann, K.: Observational- and modeling-based budget of lightning-produced NOx in a continental thunderstorm, J. Geophys. Res.-Atmos., 108, 4305, https://doi.org/10.1029/2002JD002163, 2003. a
Skamarock, W. C., Klemp, J. B., Dudhia, J., Gill, D. O., Liu, Z., Berner, J., Wang, W., Powers, J. G., Duda, M. G., Barker, D. M., Duda, M. G., Huang, X.-Y., Wang, W., and Powers, J. G.: A description of the advanced research WRF version 4, NCAR tech. note ncar/tn-556+ str, 145, http://pfigshare-u-files.s3.amazonaws.com/14057147/WRF_TechNote_Jan2019.pdf (last access: 5 October 2026), 2019. a
Stark, M., Harrison, J., and Anastasi, C.: Formation of nitrogen oxides by electrical discharges and implications for atmospheric lightning, J. Geophys. Res.-Atmos., 101, 6963–6969, https://doi.org/10.1029/95JD03008, 1996. a
Stith, J., Dye, J., Ridley, B., Laroche, P., Defer, E., Baumann, K., Hübler, G., Zerr, R., and Venticinque, M.: NO signatures from lightning flashes, J. Geophys. Res.-Atmos., 104, 16081–16089, https://doi.org/10.1029/1999JD900174, 1999. a, b
Tost, H., Jöckel, P., and Lelieveld, J.: Lightning and convection parameterisations – uncertainties in global modelling, Atmos. Chem. Phys., 7, 4553–4568, https://doi.org/10.5194/acp-7-4553-2007, 2007. a
Van Der Velde, O., Montanya, J., López, J. A., Romero, D., and Pineda, N.: eLMA: The 2023 Upgrade of the Ebro 3D Lightning Mapping Array and UV-Intensified High-Speed Camera System, in: AGU Fall Meeting Abstracts, 2023, AE11B–2419, https://ui.adsabs.harvard.edu/abs/2023AGUFMAE11B2419V/abstract (last access: 5 October 2026), 2023. a, b, c
van der Velde, O., Romero, D., López, J., Montanyà, J., Pineda, N., and Fabró, F.: New visualization and analysis tools for 3D Lightning Mapping Array data, EMS Annual Meeting 2024, Barcelona, Spain, 1–6 Sep 2024, EMS2024-978, https://doi.org/10.5194/ems2024-978, 2024. a, b
van der Velde, O. A. and Montanyà, J.: Asymmetries in bidirectional leader development of lightning flashes, J. Geophys. Res.-Atmos., 118, 13–504, https://doi.org/10.1002/2013JD020257, 2013. a, b, c
van Geffen, J., Eskes, H., Compernolle, S., Pinardi, G., Verhoelst, T., Lambert, J.-C., Sneep, M., ter Linden, M., Ludewig, A., Boersma, K. F., and Veefkind, J. P.: Sentinel-5P TROPOMI NO2 retrieval: impact of version v2.2 improvements and comparisons with OMI and ground-based data, Atmos. Meas. Tech., 15, 2037–2060, https://doi.org/10.5194/amt-15-2037-2022, 2022. a
Veefkind, J., Aben, I., McMullan, K., Förster, H., De Vries, J., Otter, G., Claas, J., Eskes, H., De Haan, J., Kleipool, Q., van Weele, M., Hasekamp, O., Hoogeveen, R., Landgraf, J., Snel, R., Tol, P., Ingmann, P., Voors, R., Kruizinga, B., Vink, R., Visser, H., and Levelt, P. F.: TROPOMI on the ESA Sentinel-5 Precursor: A GMES mission for global observations of the atmospheric composition for climate, air quality and ozone layer applications, Remote Sens. Environ., 120, 70–83, https://doi.org/10.1016/j.rse.2011.09.027, 2012. a
Visualization & Analysis Systems Technologies: Geoscience Community Analysis Toolkit: WRF-Python, https://doi.org/10.5065/D6W094P1, 2017. a
Wang, X., Zhang, Y., Bozóki, T., Liang, R., Xie, X., Zhao, S., Wang, R., Zhao, Y., and Sun, S.: Contributions of lightning to long-term trends and inter-annual variability in global atmospheric chemistry constrained by Schumann resonance observations, Atmos. Chem. Phys., 25, 8929–8942, https://doi.org/10.5194/acp-25-8929-2025, 2025. a, b
Wang, Y., DeSilva, A., Goldenbaum, G., and Dickerson, R.: Nitric oxide production by simulated lightning: Dependence on current, energy, and pressure, J. Geophys. Res.-Atmos., 103, 19149–19159, https://doi.org/10.1029/98JD01356, 1998. a, b
Wemhoner, J., da Silva, C. L., Leal, A. F., Bandara, S., Pantuso, J. G., and Sonnenfeld, R. G.: Near-infrared atomic oxygen photometry of lightning, J. Geophys. Res.-Atmos., 130, e2024JD042256, https://doi.org/10.1029/2024JD042256, 2025. a, b, c
Wiedinmyer, C., Akagi, S. K., Yokelson, R. J., Emmons, L. K., Al-Saadi, J. A., Orlando, J. J., and Soja, A. J.: The Fire INventory from NCAR (FINN): a high resolution global model to estimate the emissions from open burning, Geosci. Model Dev., 4, 625–641, https://doi.org/10.5194/gmd-4-625-2011, 2011. a
World Meteorological Organization: Meteorology – A Three-Dimensional Science: Second Session of the Commission for Aerology, Tech. Rep. WMO Technical Note No. 8, World Meteorological Organization, Geneva, Switzerland, https://library.wmo.int/index.php?lvl=notice_display&id=1260 (last access: 6 July 2026), 1957. a
Wu, S., Mickley, L. J., Jacob, D. J., Logan, J. A., Yantosca, R. M., and Rind, D.: Why are there large differences between models in global budgets of tropospheric ozone?, J. Geophys. Res.-Atmos., 112, https://doi.org/10.1029/2006JD007801, 2007. a
Zel'dovich, Y. B.: The Oxidation of Nitrogen in Combustion Explosions, Acta Physicochimica U.S.S.R., 21, 577–628, 1946. a
Zhang, X., Yin, Y., van der A, R., Eskes, H., van Geffen, J., Li, Y., Kuang, X., Lapierre, J. L., Chen, K., Zhen, Z., Hu, J., He, C., Chen, J., Shi, R., Zhang, J., Ye, X., and Chen, H.: Influence of convection on the upper-tropospheric O3 and NOx budget in southeastern China, Atmos. Chem. Phys., 22, 5925–5942, https://doi.org/10.5194/acp-22-5925-2022, 2022. a
Zoogman, P., Liu, X., Suleiman, R., et al.: Tropospheric emissions: Monitoring of pollution (TEMPO), J. Quant. Spectrosc. Ra., 186, 17–39, https://doi.org/10.1016/j.jqsrt.2016.05.008, 2017. a