the Creative Commons Attribution 4.0 License.
the Creative Commons Attribution 4.0 License.
 | 04 Jun 2019
Temporal variations and trend of ground-level ozone based on long-term measurements in Windsor, Canada
Xiaohong Xu
Tianchu Zhang
Yushan Su
This study investigates temporal variations and long-term (1996–2015) trends of ground-level O3 (ozone) and its precursors, NOx (nitrogen oxides), and volatile organic compounds in Windsor, Ontario, Canada. During the 20-year study period, NOx, non-methane hydrocarbon concentrations, and ozone formation potential decreased significantly by 58 %, 61 %, and 73 %, respectively, while O3 concentrations increased by 33 % (20.3 ppb in 1996 vs. 27 ppb in 2015). Our analysis revealed that the increased annual O3 concentrations in Windsor were due to (1) decreased O3 titration (by 50 % between 1996 and 2015) owing to declining nitric oxide concentrations, which is suggested by a slightly decreasing trend of annual mean total O3 concentrations after the titration effect is removed, (2) reduced local photochemical production of O3 because of dwindling precursor emissions, and (3) an increased background O3 level that has a greater impact on the low-to-median concentrations. The net effect of those factors is decreasing peak O3 levels during the smog season from May to September but an overall increasing trend of annual means. These results indicate that the emission control measures are effective in reducing peak ozone concentrations. However, challenges in lowering annual O3 levels call for long-term collaborative efforts in the region and around the globe.
- Article
(4010 KB) - Full-text XML
-
Supplement
(248 KB) - BibTeX
- EndNote


Ozone (O3) at the ground level is a main component of smog. Exposure to high O3 concentrations causes wheezing and shortness of breath, resulting in absence from schools and hospital admissions (USEPA, 2018). People with respiratory diseases, children, and elders are at higher risk from O3 exposure. Recent studies suggest that long-term exposure to high O3 levels is associated with permanent lung damage and deaths from respiratory causes (USEPA, 2018). High O3 concentrations also result in reduced crop yields by inhibiting breathing ability of plants, slowing down the photosynthesis rates, and making plants more susceptible to diseases (IDNR, 2018).
As a secondary air pollutant, ground-level O3 is formed by photochemical reactions between nitrogen oxides (NOx) and volatile organic compounds (VOCs) in the presence of sunlight. Non-methane hydrocarbons (NMHCs) are more reactive than methane and other VOCs in forming ozone (NAS, 1999); therefore, NMHCs are used to represent O3 precursors (e.g., Jun et al., 2007; Akimoto et al., 2015). Because the reactivity of each NMHC is different, Carter (1994) and other researchers used O3 formation potential (OFP) to quantify contributions of individual NMHCs or a group of NMHCs (Jia et al., 2016). Similarly, a study in Hong Kong investigated associations between O3 and its precursors, i.e., NOx and 21 NMHCs, during 2005–2014 (Wang et al., 2017). O3 concentrations in Hong Kong increased (0.56 ppb yr−1, p<0.01), while NOx decreased (−0.71 ppb yr−1, p<0.01). The study further showed that there were no significant changes in NMHCs (−0.03 ppb yr−1, p>0.1) during the 10-year study period. Nevertheless, the calculated daytime average contribution to O3 concentrations by aromatics decreased (−0.23 ppb yr−1, p<0.05), while that by alkenes increased (0.14 ppb yr−1, p<0.05) and that by alkanes and biogenic VOCs did not change significantly (−0.04 ppb yr−1, 0.24 ppb yr−1, respectively, p>0.05; Wang et al., 2017).
In Ontario, Canada, emissions of NOx and VOCs decreased by 52 % (from 651 to 311 kt) and 54 % (from 789 to 363 kt), respectively, during 1996–2015 (ECCC, 2018a). However, the Ontario-wide O3 composite mean increased by 22 %, from 22.4 ppb in 1996 (MOE, 2006) to 27.4 ppb in 2015 (MOECC, 2017). Previous studies showed that changes in O3 concentrations were attributed to background O3 and changes in photochemical O3 production caused by the decrease in NOx and VOC concentrations (e.g., Shin et al., 2012). Because NO (nitric oxide) reacts with O3 to form NO2 (nitrogen dioxide) and O2, also known as NO titration, decreased NO concentrations may lead to increases in O3 concentrations due to weakened titration effect (Sicard et al., 2011; Akimoto et al., 2015). To remove the impact of the NO titration on ambient O3 concentrations, total ozone (TO) was previously employed in trend analysis. For example, Akimoto et al. (2015) used TO in their ambient ozone study in four areas in Japan where O3 concentrations were high (i.e., Tokyo, Nagoya, Osaka, and Fukuoka). During the 20-year study period, NO concentrations decreased from 16 ppb in 1990 to 6 ppb in 2010. The increasing rates of annual TO (0–0.22 ppb yr−1) were much smaller than those of O3 (0.22–0.37 ppb yr−1) in the four areas during 1990–2010. The authors concluded that the decrease in the NO titration effect was one of the causes for the increased O3 concentrations in Japan.
Recently, continuous O3 observations (2 years or longer) from more than 9600 stationary platforms around the world were assembled to assess a suite of metrics relevant to its impact on human health, vegetation, and climate under the International Global Atmospheric Chemistry (IGAC) Tropospheric Ozone Assessment Report (TOAR) project (Schultz et al., 2017; IGAC, 2018). Using 2010–2014 means from over 3300 vegetation sites, the highest ozone levels were found in midlatitudes of the Northern Hemisphere, including the southern USA; the Mediterranean Basin; northern India; northern, northwestern, and eastern China; the Republic of Korea, and Japan (Mills et al., 2018). In a study of over 2000 monitoring sites worldwide, negative (i.e. decreasing) trends in peak O3 concentrations (i.e. fourth-highest daily maximum 8 h average) were observed at most North American sites and at some European sites, with very few sites exhibiting positive trends (Fleming et al., 2018). Similar studies reported that O3 levels (monthly mean of the daytime average and monthly mean of the daily maximum 8 h average) continued to decrease significantly over eastern North America and Europe, while Asia experienced increasing O3 concentrations through the end of 2014 (Chang et al., 2017; Gaudel et al., 2018). In eastern North America, summertime daytime averages and daily maximum 8 h concentrations declined at a slower rate at urban sites than at rural sites during 2000–2014 (Chang et al., 2017). Those studies showed that, over North America and Europe, decreasing peak O3 levels are attributable to reduction in precursor emissions, and a relatively slower decreasing rate at urban locations suggests weakened O3 titration. In Asia, growing precursor emissions led to increasing ozone concentrations.
Built on our understanding of spatial variations (Fleming et al., 2018; Mills et al., 2018), this study evaluated temporal variations and trends of ground-level O3 and its precursors (NOx and VOC) in Windsor, an urban location in Southern Ontario, Canada, during the 20-year study period of 1996–2015. The main objective was to identify the driving force of long-term trends of O3 concentrations in Windsor during the past 20 years as well as seasonal and diurnal variations. Findings of this study will shed light on the effectiveness of emission control policies and help develop feasible approaches for reducing O3 concentrations in this region.
2.1 Selection of station in Windsor
There are two air quality monitoring stations in Windsor, Windsor Downtown and Windsor West, which are 3.5 km apart (Fig. 1). Both stations monitor O3 and a number of common air pollutions (e.g., NO, NO2, NOx, SO2, and PM2.5; MECP, 2018). The Windsor Downtown station was selected in this study due to (1) fewer invalid or missing O3 values (1824 vs. 2660 during 1996–2015) and (2) a longer record of NO, NO2, and NOx data available (1996–2015) compared to the Windsor West station (2001–2015); 24 h VOC samples were collected once every 6 d at the Windsor West station (ECCC, 2016).

Figure 1Air quality monitoring stations in Windsor, Ontario, Canada.
2.2 Data sources
Hourly O3, NO, NO2, and NOx concentrations in Windsor (1996–2015) were obtained from the Ontario Ministry of the Environment, Conservation and Parks (MECP); 24 h VOC data at the Windsor West station during 1996–2015 were downloaded from National Air Pollution Surveillance (NAPS) website (ECCC, 2018b).
2.3 Data processing
2.3.1 O3, NO, NO2, NOx, and VOC concentrations and ratios
Numbers of data flags “−999” (i.e., invalid data), blank cells, and “0” data points in hourly O3, NO, NO2, and NOx concentrations were counted by year. Then data flags −999 were replaced with blank cells to maintain consecutive date and time for individual pollutants. If the total percentage of data flags and blank cells is greater than 40 % (3504 h yr−1) in a year, data in that year are considered to be invalid and excluded from further analysis. This is the case for hourly NO, NO2, and NOx concentrations in 2003. Results of data screening can be found in Zhang (2016) and in the Supplement (Table S1).
There are 176 VOCs reported in the NAPS dataset, of which 118 were used in this study. Missing samples were identified by comparing the sampling schedule with the dates of available samples in each year. Blank and 0 cells were counted for individual compounds in each year. A compound is excluded from analysis if the total number of blank and 0 cells is greater than 70 % during the study period of 1996–2015. Blank and 0 cells were also counted for each sample. Samples with less than 60 % of compounds that registered valid readings were removed. To reduce the undue influence of a few unusual events with extremely high concentrations, outliers were identified and removed.
Sixteen NMHCs were excluded from analysis because less than 30 % of samples had valid readings. Thus, 102 compounds were retained for further analysis. Out of 877 samples, 14 were excluded. The remaining 863 samples each had at least 60 % compounds with valid readings (range of 64 %–100 %, mean of 88 %, and median of 91 %), and they were used to calculate total NMHCs and OFPs. Daily NOx-to-NMHC ratios (referred to as NOx-to-VOC ratios hereafter) were calculated for the dates when VOC data are available. Hourly NO2∕NOx ratios were calculated as well.
2.3.2 Total O3 concentrations
Following Akimoto et al. (2015), TO in Windsor was calculated with Eq. (1),
where [DO3] ([NO2]−0.1 × [NOx]) represents loss of O3 due to in situ NO titration; [O3], [NO2], and [NOx] are hourly concentrations; and the constant 0.1 is the fraction of NO2 in primary NOx emissions (Itano et al., 2007). In this study, the NO2 fraction was determined from the slopes of regression of [Ox] (= [O3] + [NO2]) vs. [NOx] in Windsor in each year during the morning NO and NO2 peak hours (from 05:00 to 08:00; all times are referred to in local time – LT) as described in Kurtenbach et al. (2012). The 20-year average fraction was 0.1, consistent with that in the previous O3 study in Japan (Itano et al., 2007).
2.4 NMHC concentrations and ozone formation potential
OFPs for individual VOCs were calculated using Eq. (2), as described in Yan et al. (2017),
where Conci (µg m−3) is the ambient concentration of the ith NMHC, and MIRi is the corresponding maximum incremental reactivity coefficient in the unit of grams of ozone formed per gram of VOC added in the system (Carter, 1999). OFPs for individual samples in each year were calculated.
2.5 Temporal variation and trend
The analysis of variance (ANOVA) was used to determine whether there were statistical differences in O3 and TO concentrations between weekdays and weekends. Linear regression was employed to examine long-term (1996–2015) trends of (1) annual means and means in the smog (May–September) and non-smog season (October–April) for O3 and TO; (2) the annual mean for NO, NO2, NOx, OFP, DO3, NMHC concentrations, and the ratio of NO∕NOx; and (3) various annual percentile levels (5th, 25th, 50th, 75th, and 95th) of hourly O3 and TO.
Hourly O3, TO, and DO3 concentrations do not follow a normal distribution. Thus, the Mann–Kendall test, a non-parametric trend detection method (Gilbert, 1987), was used to detect long-term trends in each month of a year and at each hour in a day. Sen's method (Sen, 1968) was used to estimate the slope of seasonal and diurnal trends when the trend is significant at the 95 % level. Long-term trends of O3 and TO in Windsor were compared to quantify the impact of the NO titration on O3 concentrations.
All analyses outlined in Sect. 2.3–2.4 were carried out in Minitab version 16 (Minitab Inc., State College, Pennsylvania, USA) and MATLAB release 2017a (The MathWorks, Inc., Natick, Massachusetts, USA).
3.1 General statistics
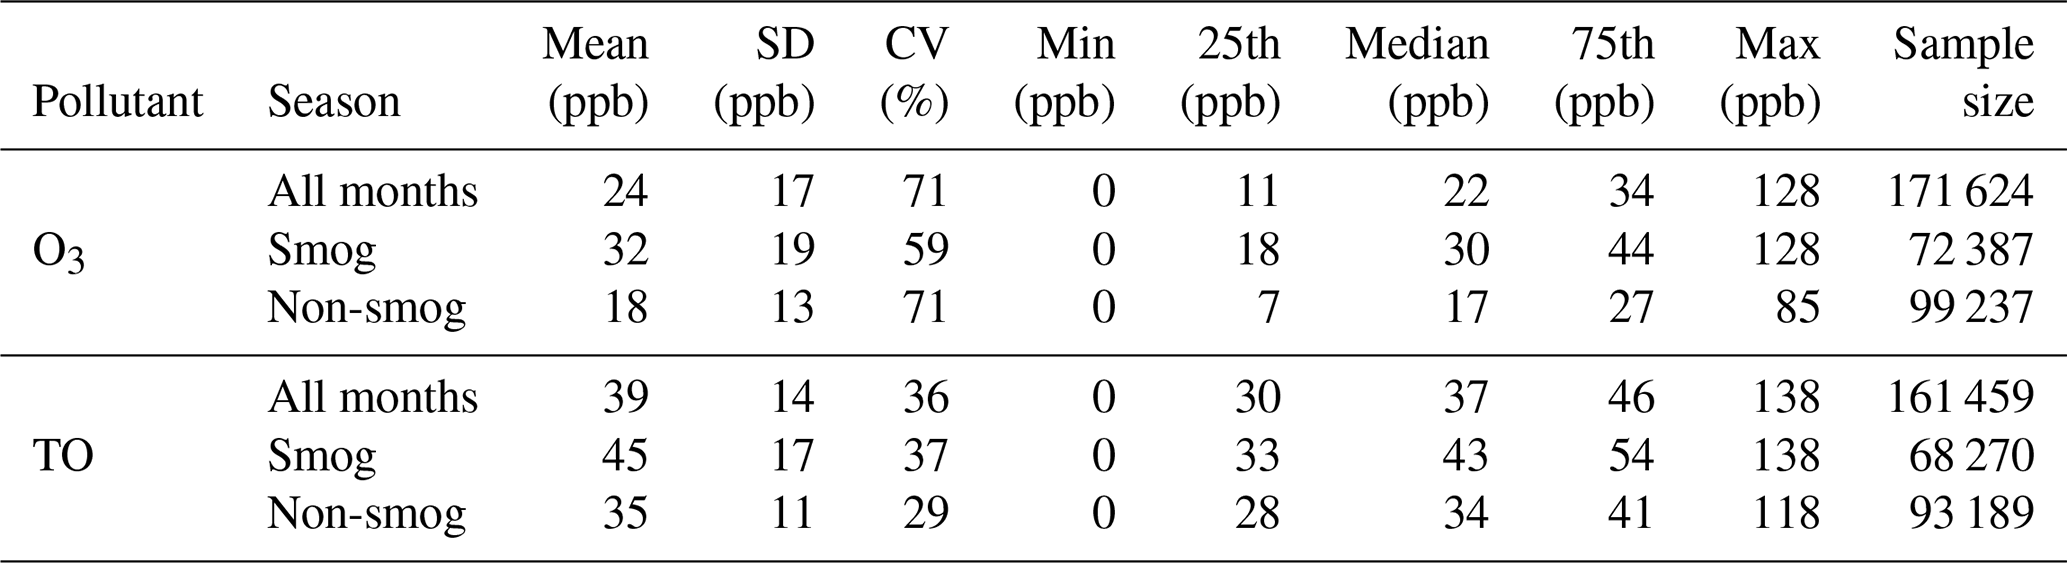
As shown in Table 1, the 20-year mean O3 concentration was 24 ppb in Windsor. Higher O3 levels were observed in the smog season than the non-smog season, reflecting photochemical production under sunny and warm conditions. TO concentrations were higher than O3 concentrations in all seasons and at all concentration percentile levels because TO includes the fraction of O3 lost through the NO titration. TO concentrations showed lower variability (i.e., lower coefficient of variation) than O3 concentrations, which is expected because O3 reacts with NO while TO is not affected by the NO titration (Akimoto et al., 2015).
Table 1General statistics of O3 and TO concentrations in Windsor during 1996–2015 (SD and CV stand for standard deviation and coefficient of variation, respectively).
3.2 Diurnal, seasonal, and weekday–weekend variation
3.2.1 Diurnal variation
Diurnal variation of O3 concentrations in Windsor during 1996–2015 is shown in Fig. 2a and Table S2. There was a gradual increase in O3 concentrations from 06:00 to 14:00 and a gradual decrease from 15:00 to 06:00 next day. A similar trend was observed for TO. The diurnal variations for O3 and TO indicate that O3 photochemical production was enhanced by increased solar radiation and temperature (So and Wang, 2003). DO3 followed an opposite trend than O3, i.e. lower at noon to afternoon (11.2 ppb from 11:00–15:00) than that at other hours of the day (16.2 ppb), suggesting that relative loss due to the titration effect was reduced when O3 concentrations were high.
O3 concentrations were higher during the smog season than in the non-smog season, especially around noon, due to photochemical production (Fig. 2b and c). DO3 levels were lower throughout the day in the smog season, suggesting that relative loss due to the titration effect was reduced when O3 concentrations were high. Furthermore, TO (O3+DO3) diurnal variation was rather smooth in the non-smog season due to weak photochemical production of O3.
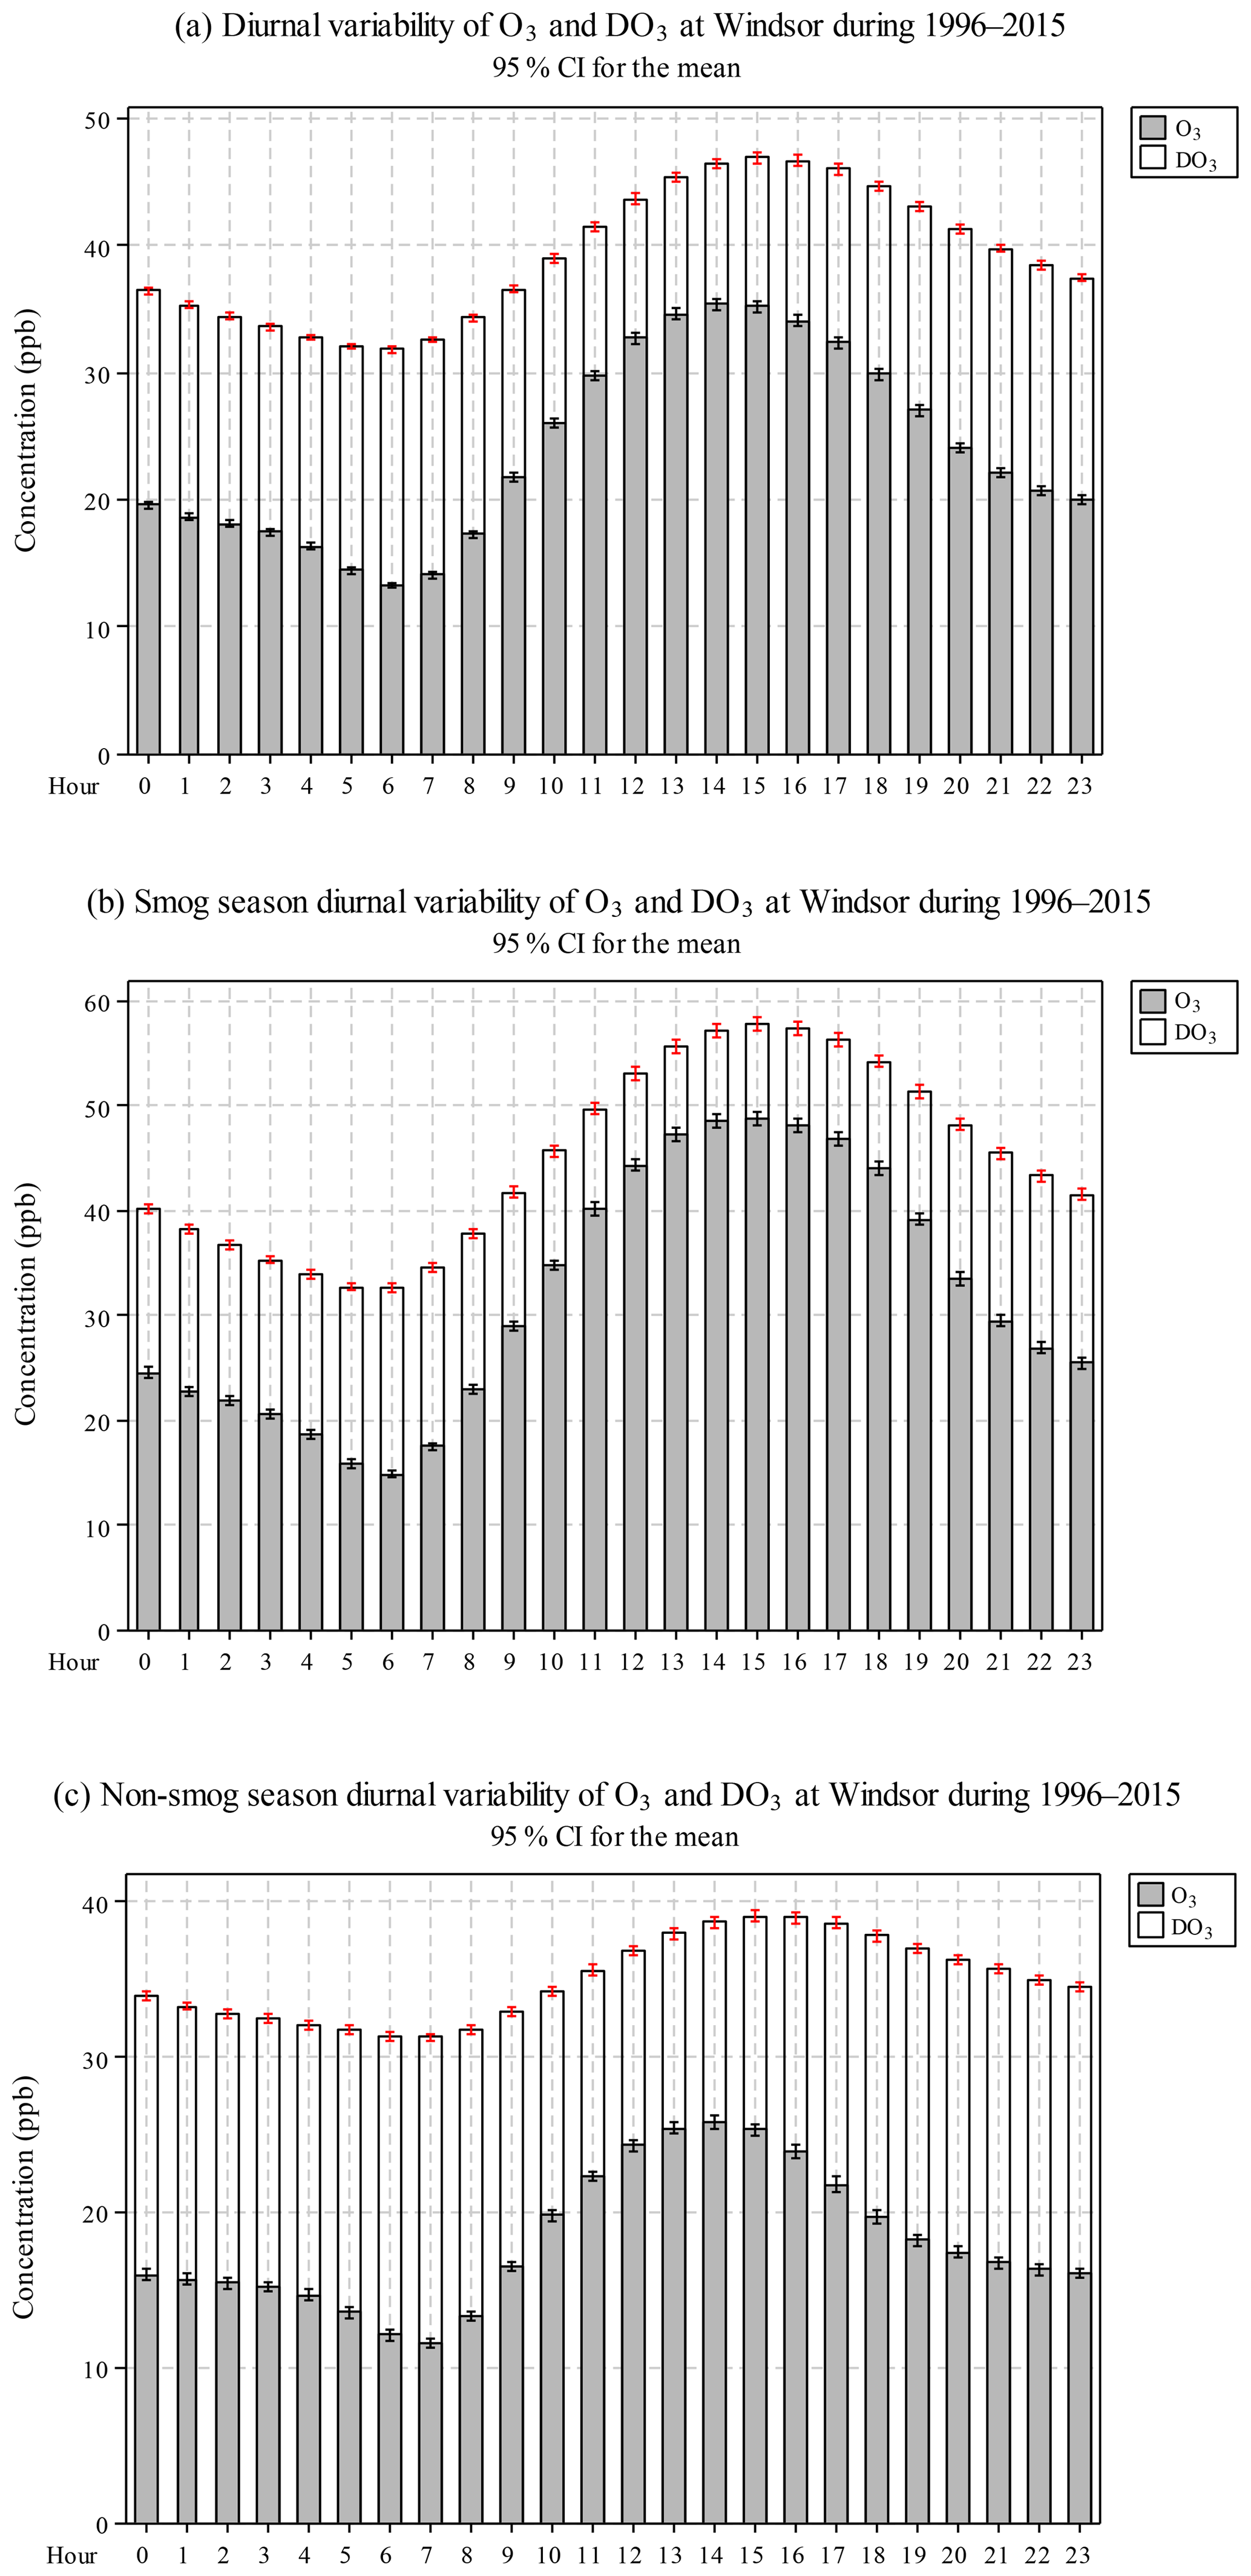
Figure 2Diurnal O3 and DO3 concentrations during 1996–2015 in Windsor for (a) all months, (b) smog season, and (c) non-smog season. CI stands for confidence interval.
3.2.2 Seasonal variation
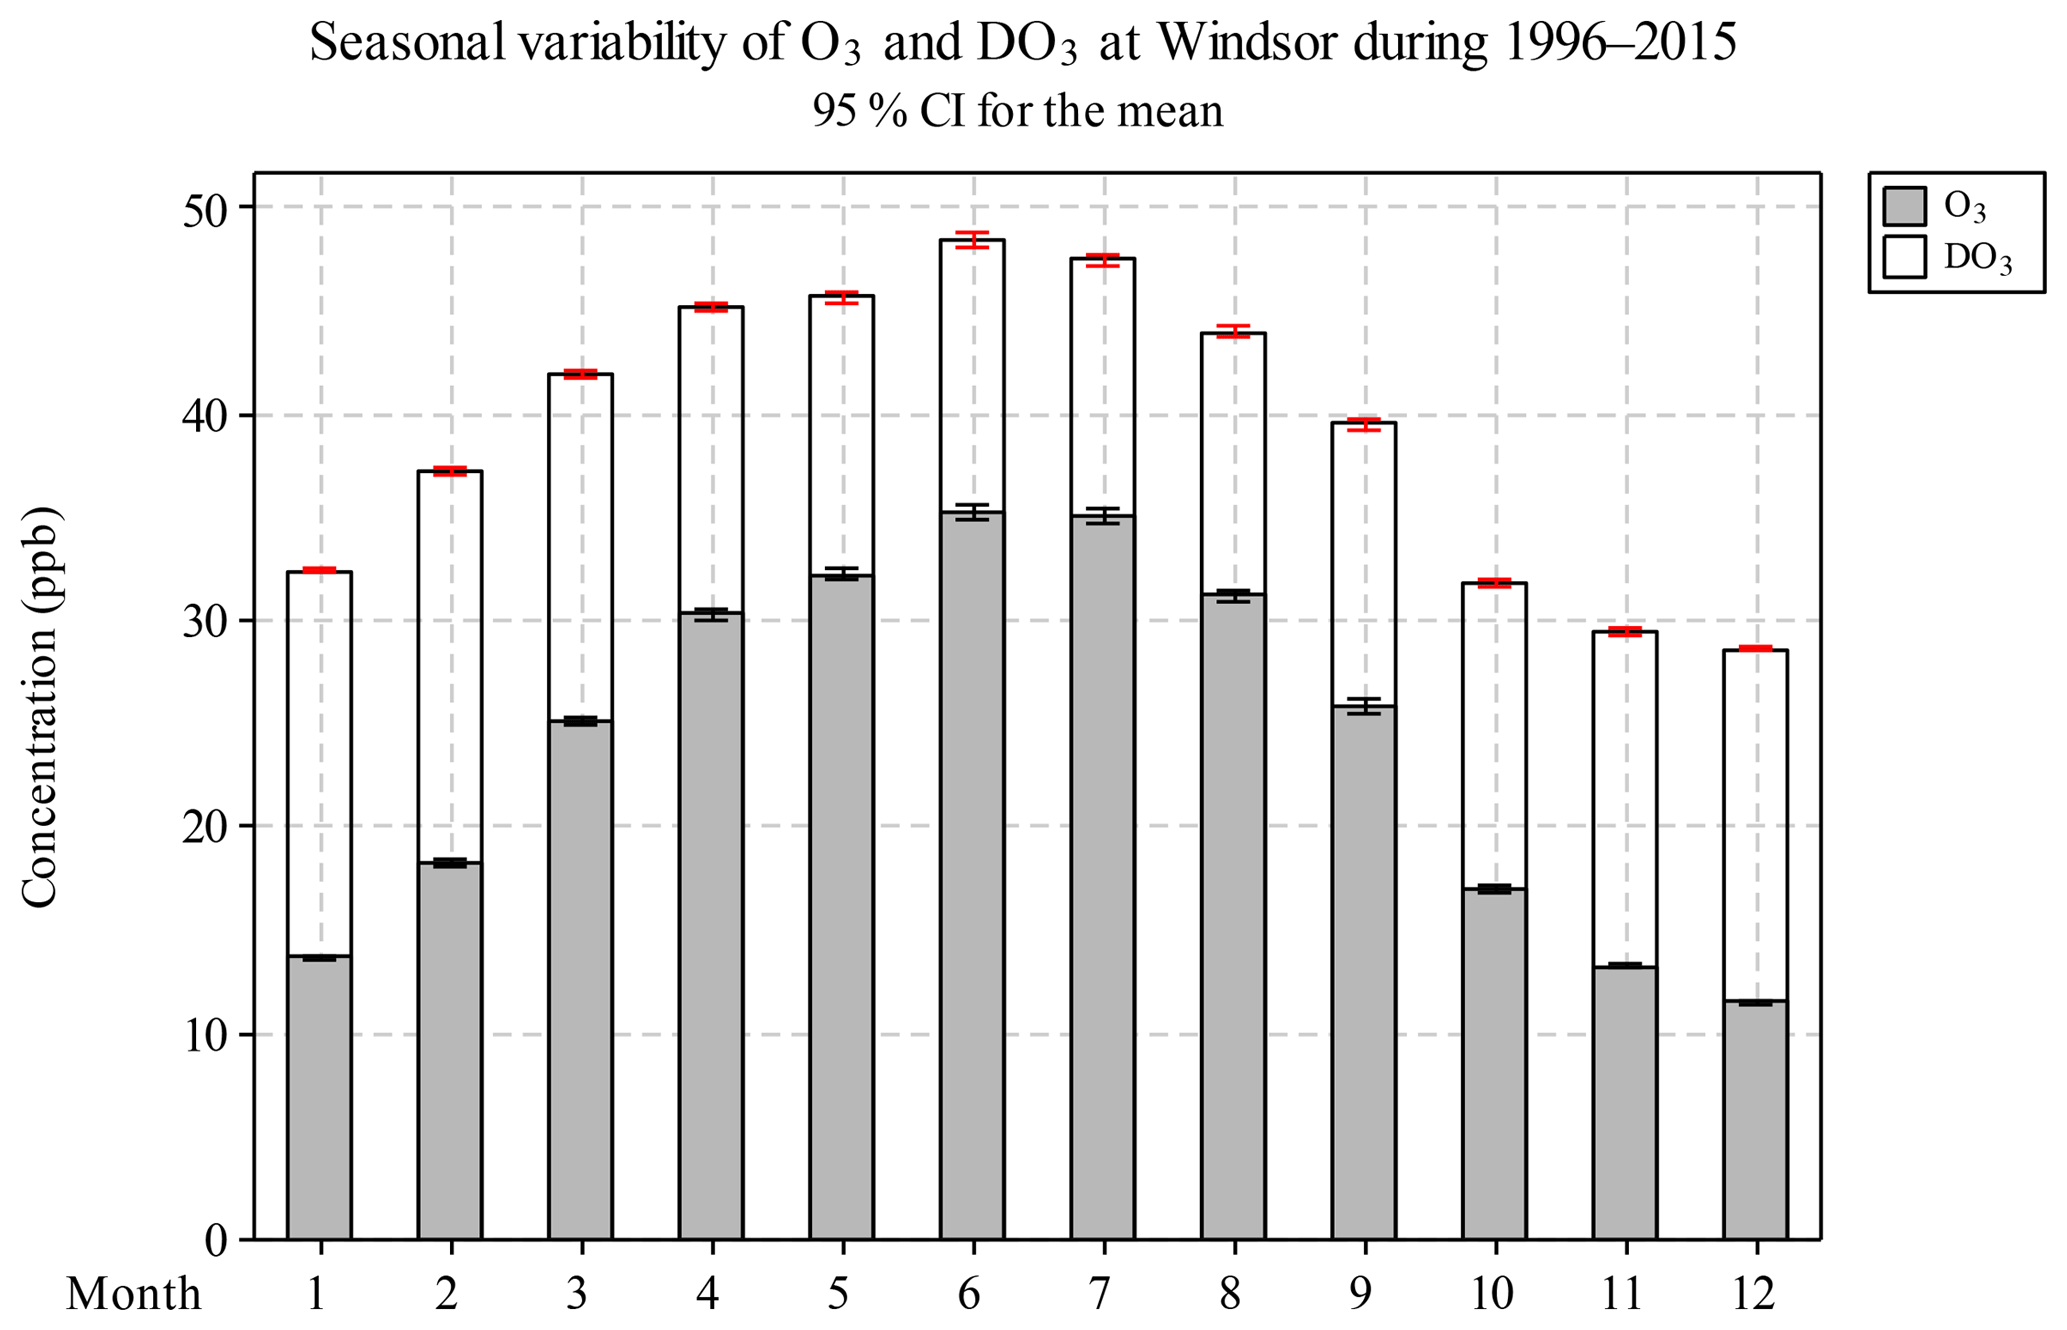
Monthly O3 concentrations increased from January to May, reaching peak values in June and July, then decreased from July until the minima in December (Fig. 3 and Table S3). This seasonal pattern is similar to that of solar radiation and ambient temperature, which control the photochemical production rate of O3. A similar seasonal variation was observed for TO, but DO3 followed an opposite trend than O3, i.e. higher in the non-smog season (16.6 ppb) and lower during the smog season (13.1 ppb). Similar to the diurnal variation, relative loss due to the titration effect appears to be reduced when weather conditions favored O3 formation. The seasonal O3 pattern observed in Windsor is consistent with the study by Gaudel et al. (2018) reporting that in North America, the maximum O3 daytime averages occurred in spring–summer and the minimum values were found in autumn–winter during 2010–2014.
3.2.3 Weekday–weekend variation
ANOVA indicates that O3 concentrations on weekends (25.9 ppb) were statistically higher (p<0.05) than on weekdays (23.3 ppb). NO concentrations were lower on weekends (6.5 ppb) than on weekdays (9.6 ppb) due to less vehicular and industrial activities. Therefore, high O3 concentrations on weekends were likely attributed to decreased NO emissions and the weakened titration effect as reported by other researchers (Koo et al., 2012). This is supported by comparable TO concentrations between weekdays and weekends (39.2 vs. 39.5 ppb, p<0.05) which remove the titration effect. Differences in O3 levels between the weekday and weekend were also reported in other studies, e.g., in Nepal (Pudasainee et al., 2006) and Ontario, Canada (Huryn and Gough, 2014).
3.3 Long-term trend
3.3.1 Trends of annual NOx, NMHC, ozone formation potential, O3 and TO
During 1996–2015, annual mean O3 concentrations increased significantly (0.452 ppb yr−1; Fig. 4a), while annual mean DO3 concentrations decreased at a greater rate (−0.524 ppb yr−1). Consequently, TO concentrations decreased slightly (−0.076 ppb yr−1, but not significant at p<0.05 level). In other words, O3 decreased slightly when the NO titration effect is removed, suggesting that the decreased NO titration effect is one of the reasons for the increased O3 concentrations in Windsor.
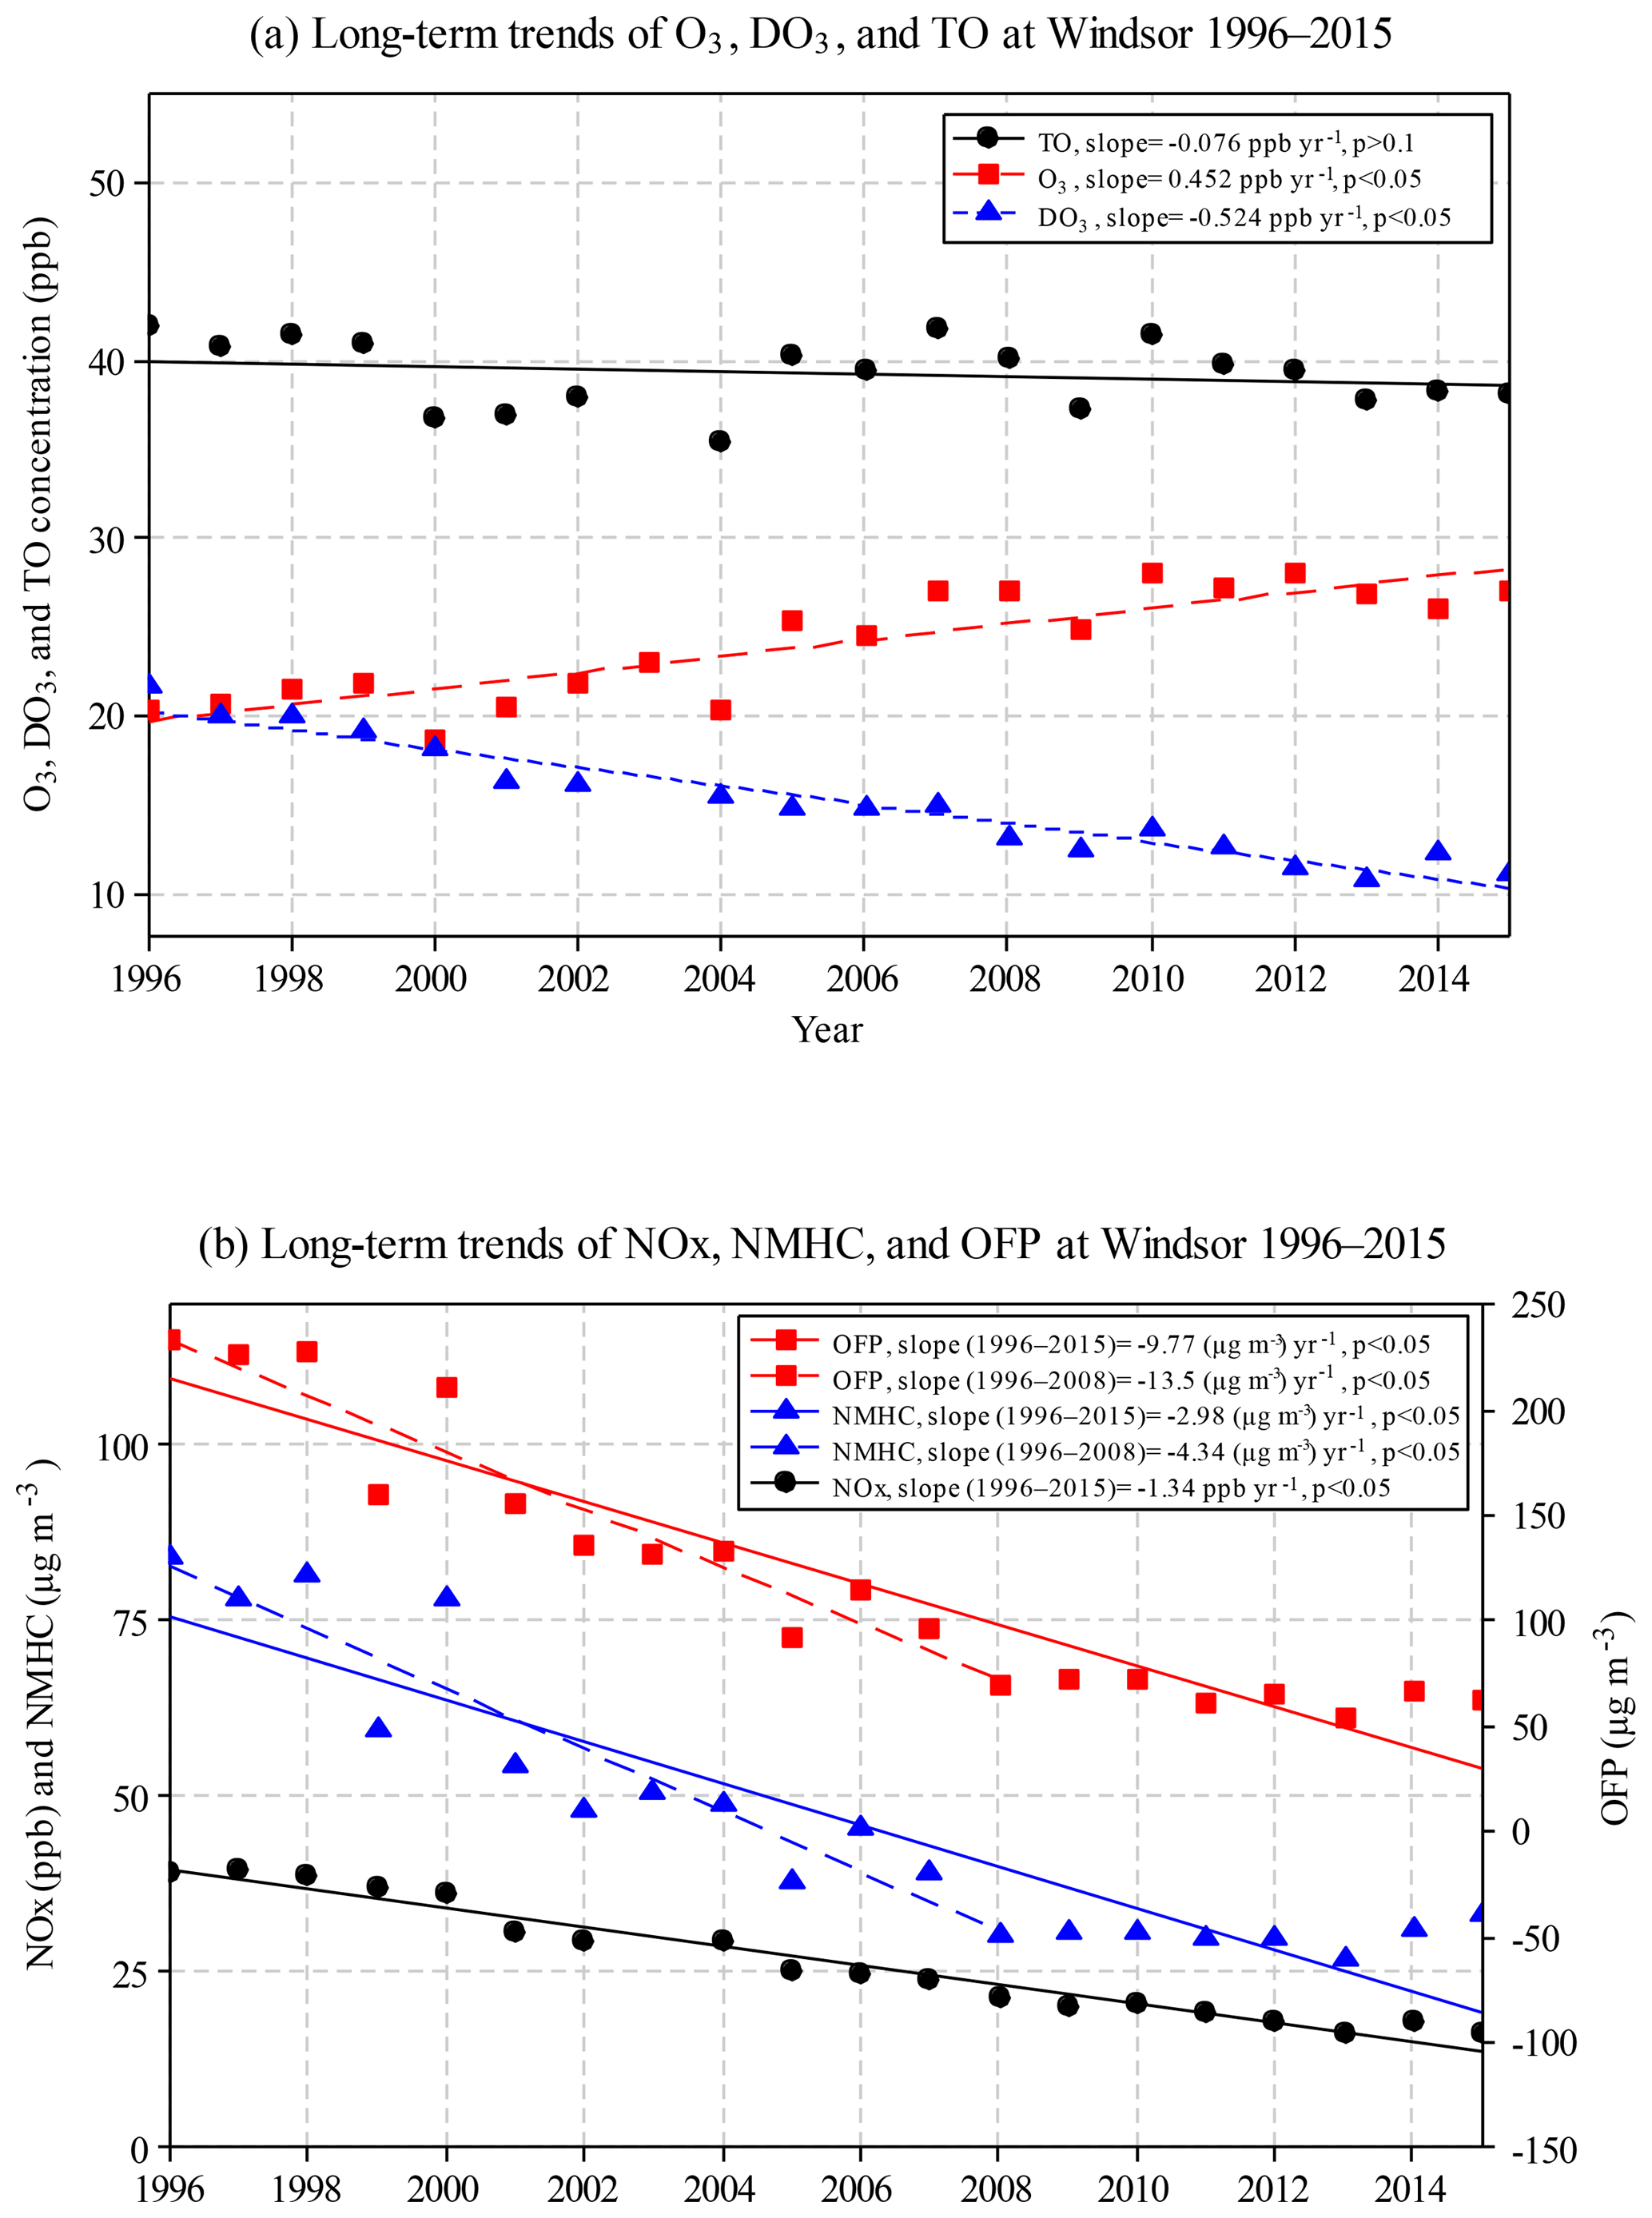
Figure 4Annual mean concentrations for (a) O3, DO3, and TO, and (b) NOx, NMHC, and ozone formation potential (OFP) in Windsor during 1996–2015.
Significantly decreasing trends were observed in Windsor for annual mean NOx (−1.34 ppb yr−1), NMHC (−2.98 µg m−3 yr−1), and OFP (−9.77 µg m−3 yr−1) during the 20-year study period (Fig. 4b). The percent decreases were 58 %, 61 %, and 73 % for NOx, NMHC, and OFP, respectively, indicating effective emission control. It should be noted that during 1996–2008, some pollutants were changing at greater rates compared with the 20-year trend, including O3 (0.55 ppb yr−1), NMHC (−4.34 µg m−3 yr−1), and OFP (−13.5 µg m−3 yr−1). After 2008, concentrations of O3, NMHC, and OFP leveled off, while NOx and DO3 concentrations continued to decrease.
The decreased NO titration effect was further investigated by examining the ratio of NO∕NOx (Fig. S1). Significantly decreased NO (−0.73 ppb yr−1) and NO2 (−0.66 ppb yr−1) were observed during the study period. Furthermore, the NO∕NOx ratio decreased from 0.34 in 1996 to 0.16 in 2015, with an average rate of −0.012 yr−1, supporting the decrease in the NO titration effect in Windsor. Our results are consistent with studies in other countries. For example, NO2∕NOx ratio increased from 0.08 in 2005 to 0.15 in 2010 in Japan (Itano et al., 2014), implying a decreased NO∕NOx ratio. The NMHC∕NOx ratios did not change much during the 20-year study period (min of 0.96, max of 1.3, and mean and median of 1.1). The low ratios of VOC to NOx (<5) suggest that the study area is VOC limited; thus reduced NOx emissions may lead to increased O3 concentrations (Sillman, 1999; USEPA, 2000).
3.3.2 Ozone and TO trends at various percentile levels
Figure S2 depicts long-term O3 and TO trends at 5th, 25th, 50th, 75th, and 95th percentiles in Windsor during 1996–2015. The slopes of linear regression in three scenarios (i.e., all months, the smog season, and the non-smog season) are summarized in Fig. 5 and Table S4. Peak O3 concentrations (i.e., 95th percentile) decreased during the smog season and for all months, suggesting that reduced precursor emissions and photochemical production. O3 at all other percentile levels in all three cases had increased, with higher rates at 25th and 50th percentiles. The 25th percentile of O3 concentrations was commonly considered to be a background value (Lin et al., 2000; Aleksic et al., 2011; Parrington et al., 2013). Peak TO concentrations (95th percentile) deceased, especially during the smog season, due to effective emission control of O3 precursors. TO concentrations increased at all other percentile levels during the non-smog season, when O3 photochemical production was limited, suggesting rising background O3 concentrations.
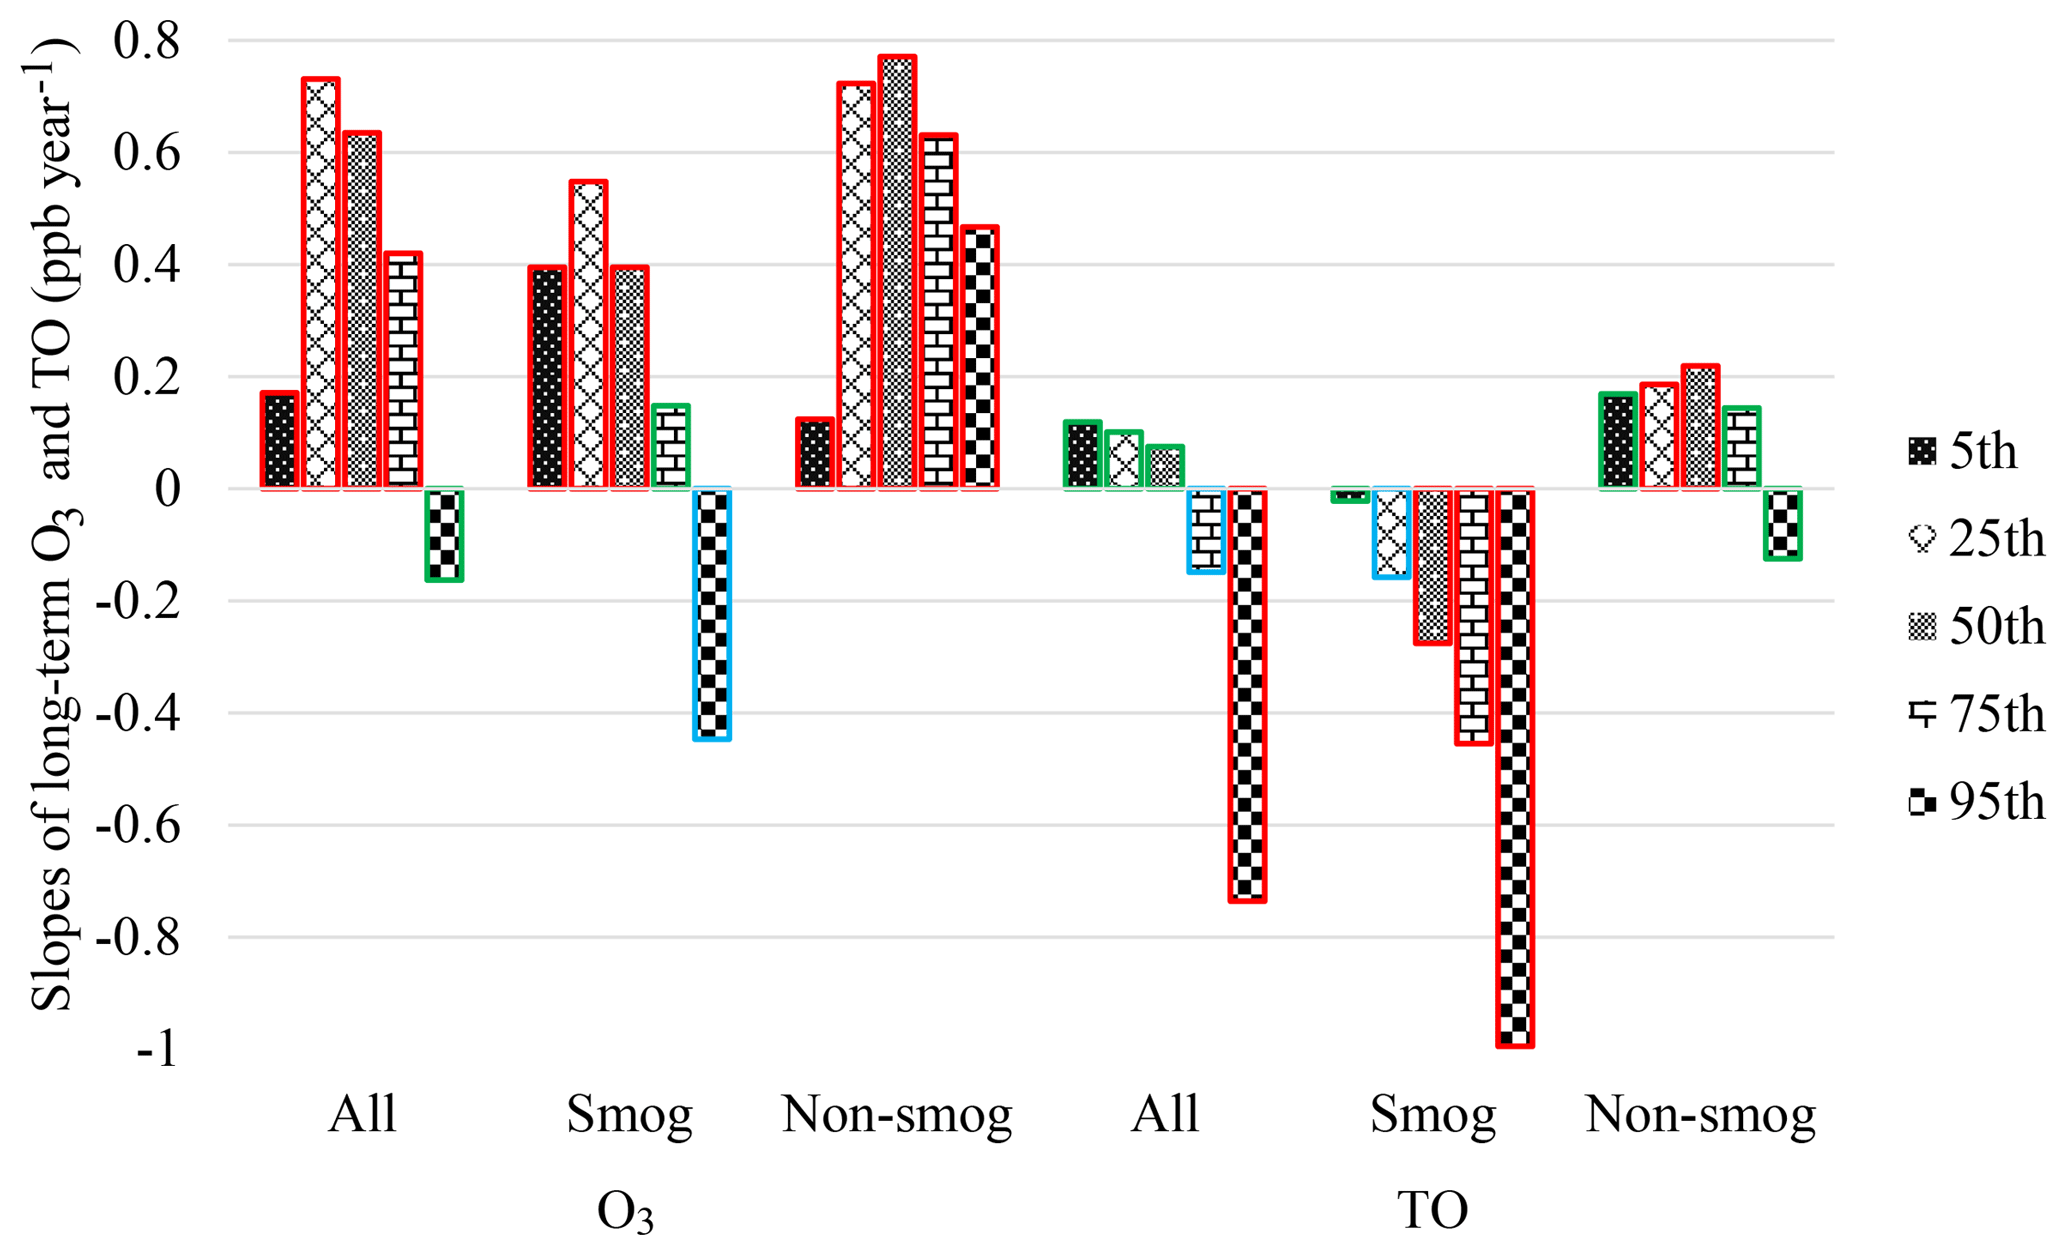
Figure 5Slopes of long-term O3 and TO trends at various percentile levels in all months, smog season, and non-smog season in Windsor during 1996–2015 (red border: significant at p<0.05; blue border: significant at p<0.1; green border: not significant, i.e. p>0.1).
In the smog season, O3 concentrations increased at the 5th–75th percentile levels, while TO concentrations decreased with a greater rate at higher percentile levels, suggesting that the decrease in NO titration is one of the causes of increasing O3 in Windsor. In terms of peak O3 concentrations (95th percentile), the decreasing rate of TO (−1.0 ppb yr−1) is more than twice that of O3 (−0.45 ppb yr−1). In other words, when the effect of NO titration is removed, peak O3 concentrations decreased more intensely due to reduced emissions of O3 precursors. During the non-smog season, the increasing rates of TO at 5–75th percentiles were much slower than those of O3. The results suggest that the decreased NO titration effect could be one of the causes for slower decrease in peak O3 in the smog season and increase in O3 at low-to-high percentiles during both the smog and non-smog seasons.
The decreasing trend of the 95th percentile O3 levels in Windsor is consistent with the decreasing concentrations at upper end of the distribution across the United States (Simon et al., 2015), which evaluated maximum daily 8 h average O3 at over 1000 sites during 1998–2013, when NOx and VOC emissions were decreasing. The declining peak O3 is also evident in the study of the fourth-highest daily maximum 8 h concentrations during 2000–2014 by Fleming et al. (2018), which indicated that up to 70 % of North American stations experienced significant negative trends (p<0.05). The results of the seasonal O3 trends in Windsor are consistent with previous studies. For instance, Simon et al. (2015) reported that the declining trends were more pronounced in summer than winter and that increasing O3 trends at all percentiles were found in both smog and non-smog seasons, except for decreasing peak values at urban sites of the East North Central region (close to Windsor; Simon et al., 2015). Moreover, Gaudel et al. (2018) reported the increasing O3 levels across North America in wintertime (December, January, and February).
3.3.3 Monthly and diurnal rates of change for ozone and TO
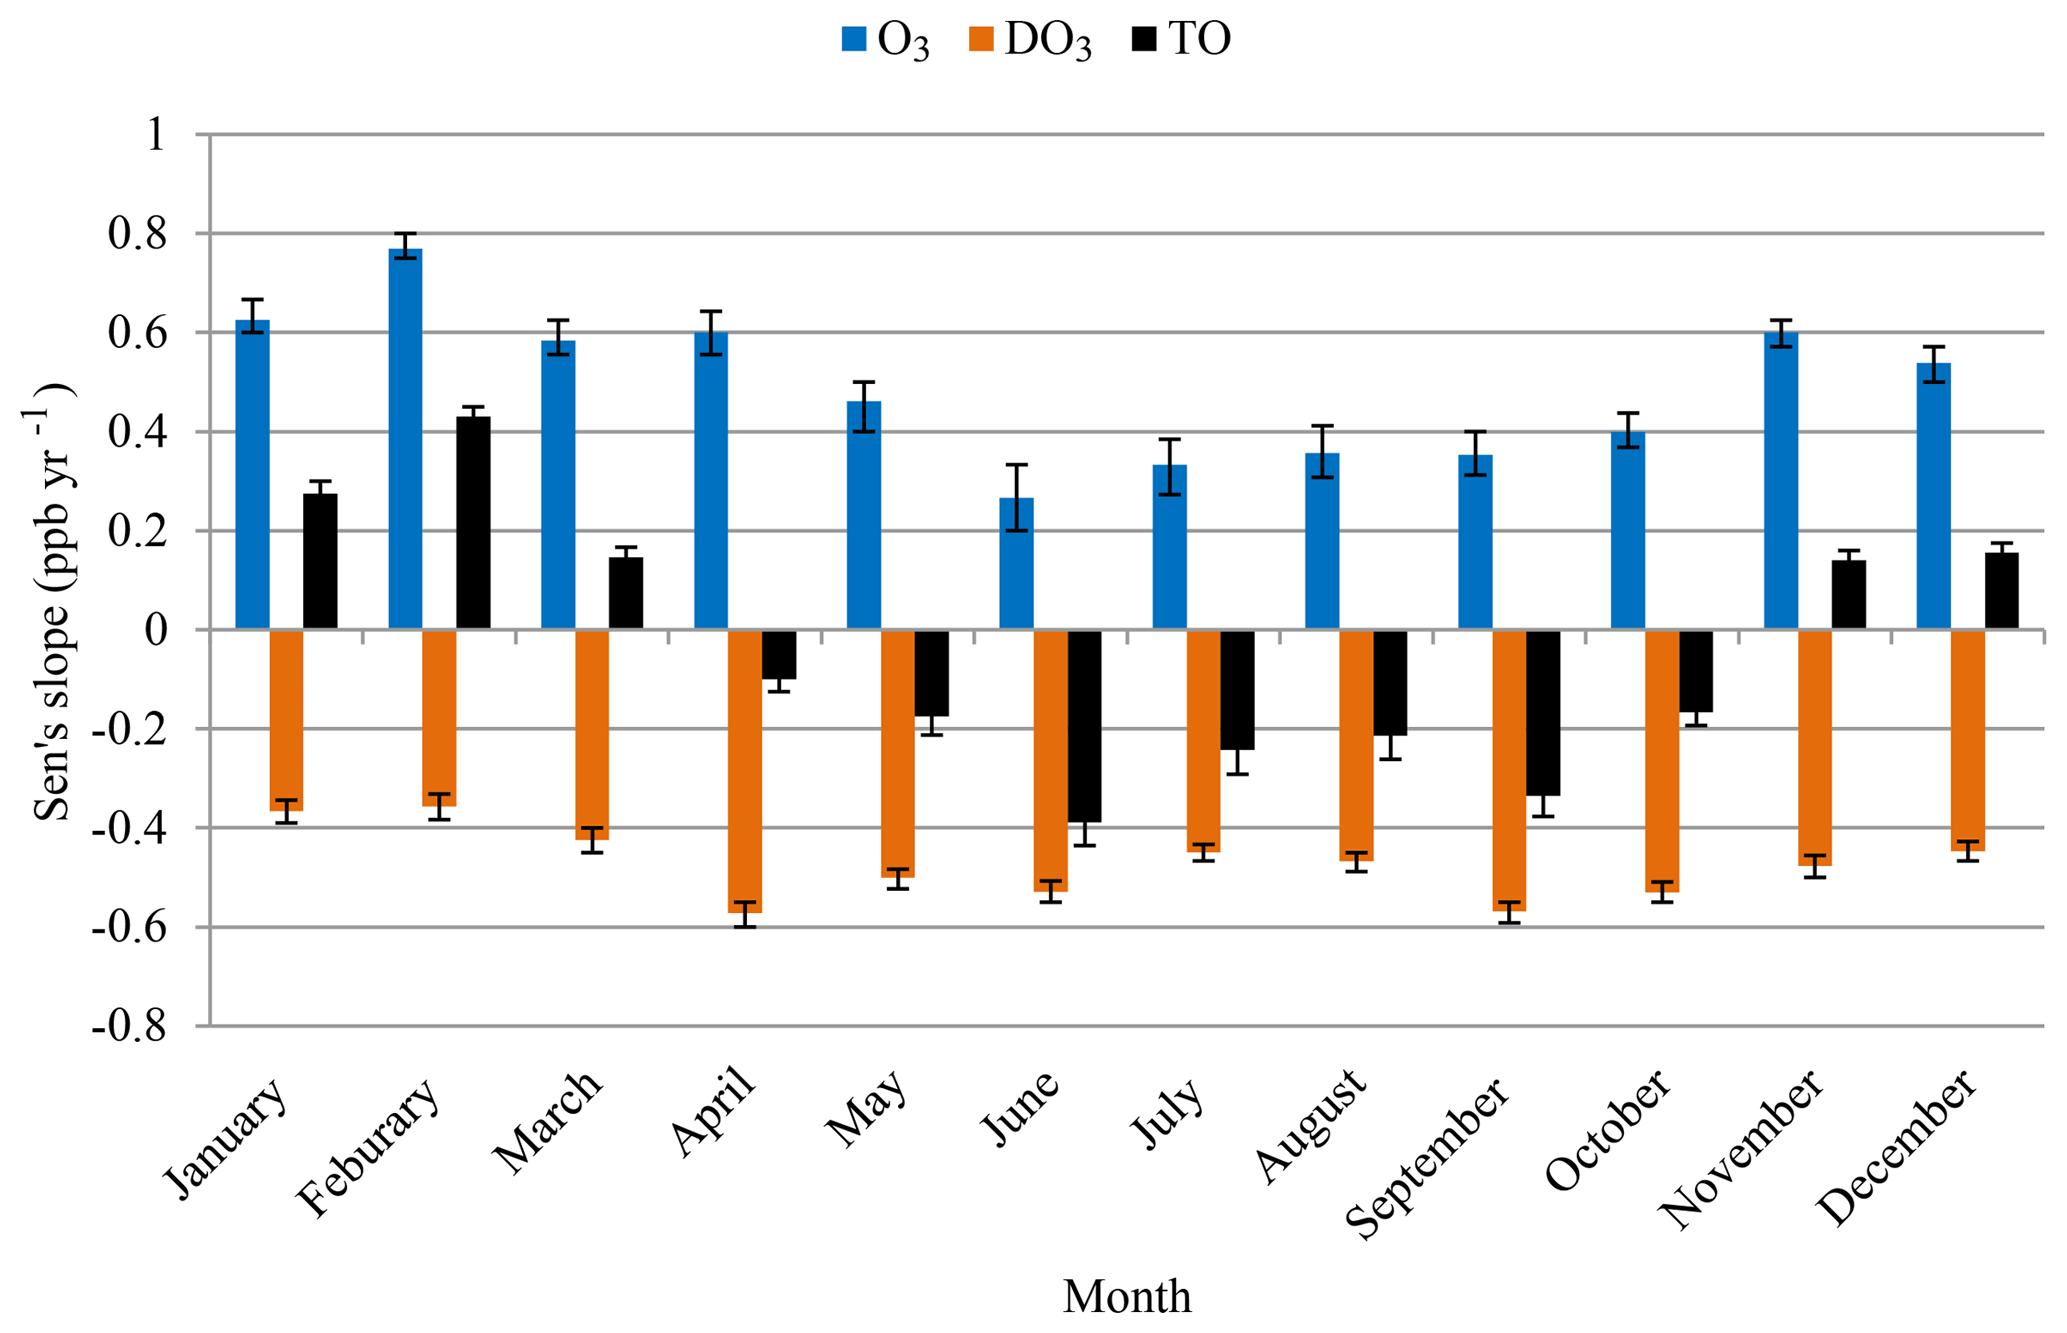
This section further investigates which hour or hours of a day and which month or months of a year experienced greater or fewer changes in O3 concentrations during the 20-year study period and to what degree those changes could be explained by the change in the NO titration effect. The estimated month-of-year slopes by Mann–Kendall and Sen's test during 1996–2015 are shown in Fig. 6. The rates of change during the smog and non-smog seasons are summarized in Fig. S3.
The increased O3 levels in the non-smog season (mean of 0.58 ppb yr−1; Fig. S3) suggest a reduced titration effect and rising background O3 levels, since local photochemical production of O3 is limited. Analysis of ambient data conducted by USEPA demonstrated that mid-tropospheric O3 concentrations in the US and globally have increased over the past two decades by 0.4 ppb yr−1 (USEPA, 2015). Along the Pacific Coast, the rate of increasing background O3 was estimated to be 0.5–0.8 ppb yr−1 during 1985–2002. This trend of ground-level O3 is consistent with the rate of increase (0.51 ppb yr−1, 1994 to 2002) derived using aircraft measurements (Jaffe et al., 2003). Another reason of increased O3 is the decreased titration effect. A study in southeastern France demonstrated that the decrease in the NO titration effect could be one of the reasons for increased O3 concentrations in cold months (Sicard et al., 2011). The slower increasing rate of O3 in smog season (0.32 ppb yr−1, Fig. S3) is a result of increased background O3 levels, a decreased titration effect, and reduced local photochemical O3 production and regional transport (MOECC, 2017). A similar trend of a greater rate of increasing composite mean at 19 sites across Ontario in summer (49 %) than in winter (14 %) during 1991–2010 was largely attributable to the reductions in local NOx emissions and the rising global background ozone levels (MOE, 2012).
O3 concentrations increased while DO3 concentrations decreased in all months during 1996–2015 (Fig. 6). During the non-smog season, the increasing rate of O3 (0.58 ppb yr−1; Fig. S3) was higher than the decreasing rate of DO3 (−0.46 ppb yr−1). In other words, there was an additional increase in O3 beyond the decreased titration effect. After the NO titration effect is removed, TO concentrations increased in non-smog season (0.13 ppb yr−1; Fig. 6), suggesting rising background O3 levels. In the smog season, the increasing rate of O3 (0.32 ppb yr−1) was lower than the decreasing rate of DO3 (−0.50 ppb yr−1). TO concentrations had decreased in the smog season (−0.27 ppb yr−1; Fig. 6), being attributable to the decreased regional O3 production.
On an hourly basis, greater increasing rates in O3 concentrations were observed at evening and nighttime hours (18:00–03:00) in comparison with the early morning and daytime (04:00–17:00), as shown in Fig. 7. The two minima in the morning at 06:00 and 13:00 coincided with the lowest and highest O3 concentrations in a day, which were caused by different rates of change in smog and non-smog seasons (see below). Overall, O3 increased while DO3 decreased at all hours in a day during 1996–2015. The diurnal pattern of increasing rates for O3 almost mirrored that of decreasing rates for DO3. In other words, the increase in O3 concentrations could be explained largely by the decreased NO titration effect. At most hours, the increasing rates of O3 were higher than the decreasing rates of DO3, especially in the morning hours (06:00–12:00). Overall, TO concentrations increased slightly during daytime while decreasing a little in the evening.

Figure 7Rate of change by hour of day for all months during 1996–2015 for (a) O3, (b) DO3, and (c) TO.
O3 and DO3 concentrations showed different diurnal patterns during the smog season (Fig. 8). O3 concentrations increased while DO3 concentrations decreased at all hours as in the case of all months. During the daytime (09:00–19:00), there was a sharp decline in the rates of change for O3 until peak O3 hours (14:00–16:00) followed by a speedy recovery. The peak hour O3 concentrations have not changed much during the last 20 years, and daytime ozone levels have increased with a much slower rate (09:00–19:00, mean = 0.15 ppb yr−1) compared with the nighttime (20:00–08:00, mean = 0.46 ppb yr−1). The daytime DO3 decreasing trend is similar, however with less variability. The increasing rate of O3 is lower than the decreasing rate of DO3, and TO concentrations decreased at all hours, especially during the afternoon and early evening (14:00–19:00). This suggested decreased photochemical O3 formation during the smog season due to emission reduction.
During the non-smog season (Fig. 9), the rates of change in O3 and DO3 were similar as in the case of all months, i.e. the increase in O3 concentrations could be explained largely by the decreased titration effect. Also similar to that of all months, the rates of change were lower in the early morning (05:00–07:00). The greater rates of change were observed in the late afternoon and evening (16:00–20:00), instead of at night, with all months. The increasing rates of O3 were higher than the decreasing rates of DO3 at all hours. The hour-of-day TO trend is overall increasing with less diurnal variation, indicating rising background O3 levels.

Figure 8Rate of change by hour of day in smog season during 1996–2015 for (a) O3, (b) DO3, and (c) TO.
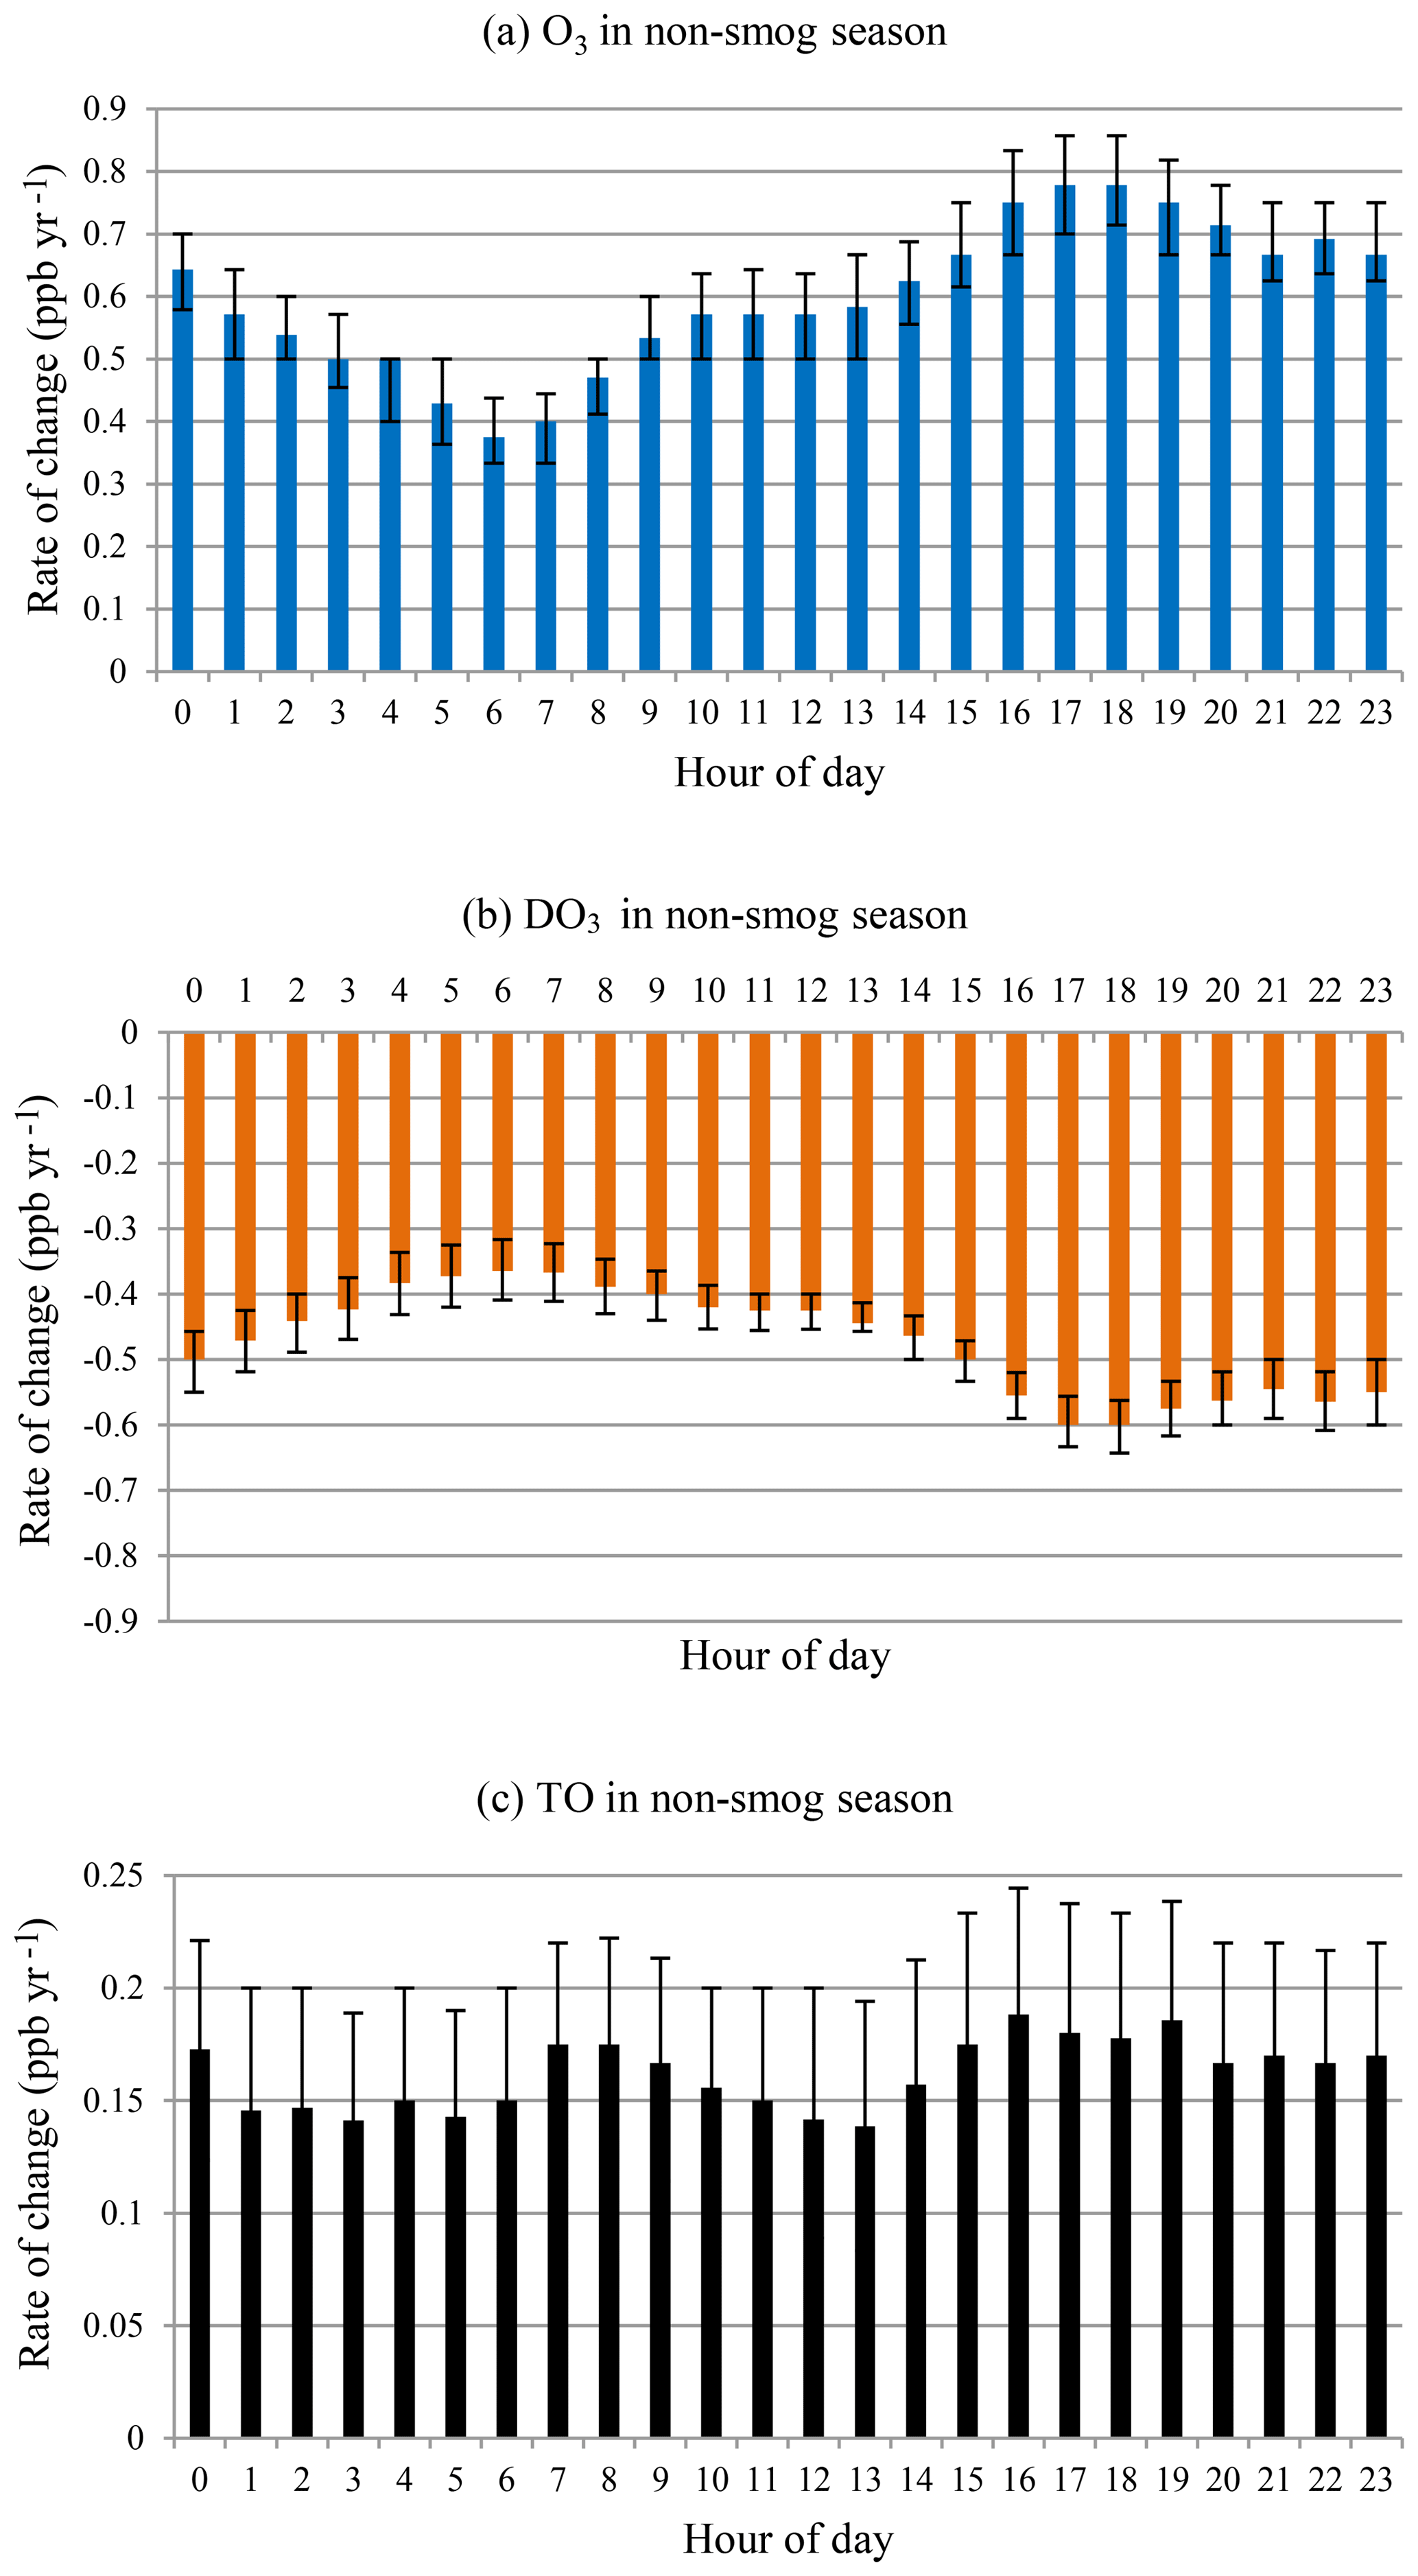
Figure 9Rate of change by hour of day in non-smog season during 1996–2015 for (a) O3, (b) DO3, and (c) TO.
This study investigates temporal variations and long-term trends (1996–2015) of ground-level O3 and its precursors, NOx and VOCs, in Windsor, Ontario, Canada. The driving force of the observed variations was assessed by studying precursor emissions, photochemical production, NO titration, and background O3 levels. One of the innovative approaches is the use of TO and trend analysis for different percentiles levels in different seasons and by hour of day.
O3 concentrations increased by 33 % during 1996–2015 (20.3 ppb in 1996 vs. 27 ppb in 2015) in Windsor, while concentrations of NOx (−58 %) and NMHCs (−61 %) and OFPs (−73 %) decreased significantly during the same time period, owing to effective emission control. Increased O3 concentrations were observed in all months in a year and all hours in a day and at all percentile levels, with a few exceptions.
Our analysis revealed that the increased annual O3 concentrations in Windsor were caused by the following reasons. First, there was decreased O3 titration and local photochemical production of O3, both of which being induced by reduced precursor emissions. The O3 loss due to the titration decreased by 50 % in the 20-year study period, and the declined O3 titration was observed in all months in a year and all hours in a day. Therefore, the observed increase in O3 concentrations can be largely explained by the decrease in the titration. By removing the titration effect, TO concentrations increased in the non-smog season and decreased in the smog season, resulting in a slightly decreasing trend of annual means during 1996–2015 (−0.076 ppb yr−1). The declining photochemical production of O3 is evident in decreased peak O3 levels (95th percentile) in the smog season as opposed to increased O3 concentrations at all other percentile levels and all percentiles in the non-smog season. Second, background O3 level was rising. This is supported by increasing O3 concentrations in all months in a year and all hours in a day and at all O3 percentile levels, with the exception of peak O3 hours and the 95th percentile O3 levels in the smog season. Furthermore, the increasing rates of O3 were higher than the decreasing rate of DO3 at all hours in a day and all percentile levels during the non-smog season, when O3 photochemical production is limited.
It is apparent that control measures implemented in Ontario and the surrounding regions were effective in curbing NOx and VOC emissions during the study period of 1996–2015. The reduced O3 precursors led to decreasing peak O3 values in the smog season over the past 20 years. However, those emission reductions also result in weakened O3 titration effect in all months in a year and at all hours in a day. Meanwhile, the background O3 concentrations appeared increasing in the study region, with a greater impact on the low-to-median levels (i.e. 25th and 50th percentiles) during the non-smog season and at night. The net effect of those factors is decreasing peak O3 levels but an overall increasing annual mean in Windsor. The increases in O3 concentrations in the non-smog season (0.58 ppb yr−1), at night (20:00–08:00, 0.46 ppb yr−1), and at low-to-median percentiles pose less of a risk on human health because those O3 levels are relatively low. The decreasing peak O3 levels during the smog season are rather beneficial, considering the detrimental effects of human exposure to high O3 concentrations.
Our long-term (1996–2015) trend analysis shows that annual O3, NMHC, and OFP levels leveled off after 2008, while NOx concentrations and the O3 titration effect appear to be continuously decreasing. Considering that O3 formation in Windsor remains to be VOC-limited, the weakened O3 titration by NO2 may lead to slightly increasing O3 annual means. Moreover, the regional background levels are not expected to decline. Therefore, it is anticipated that O3 concentrations in Windsor may level off or increase slightly in the next few years under similar weather conditions. Due to the complex nature of O3 formation, consumption, and regional transport, it is clear that long-term regional and international efforts are essential for lowering O3 concentrations and improving air quality. Results of this study provide insight into the causes of changing O3 levels in Windsor and how to mitigate O3 pollution and its adverse effects on human health and the environment. Future studies are warranted to quantify the background O3 level in Windsor area and its long-term trend and to explore regional transport of O3 to Windsor.
All data used in this study are publicly accessible. The hourly O3, NO, NO2, and NOx concentrations in Windsor can be accessed through the Ministry of the Environment, Conservation and Parks Ontario website, http://airqualityontario.com/history/index.php (last access: 26 May 2019); 24 h VOC data in Windsor can be accessed through Environment and Climate Change Canada website, http://maps-cartes.ec.gc.ca/rnspa-naps/data.aspx (last access: 26 May 2019).
The supplement related to this article is available online at: https://doi.org/10.5194/acp-19-7335-2019-supplement.
TZ conducted data analysis and drafted the paper. XX and YS designed the study and completed the paper.
The authors declare that they have no conflict of interest.
The authors would like to thank all who contributed to collection of air quality data at MECP and ECCC and Yun Zhou at University of Windsor for processing some VOC data. This project was funded by MECP and the Natural Sciences and Engineering Research Council of Canada.
This research has been supported by the Ontario Ministry of the Environment, Conservation and Parks and the Natural Sciences and Engineering Research Council of Canada.
This paper was edited by Min Shao and reviewed by two anonymous referees.
Akimoto, H., Mori, Y., Sasaki, K., Nakanishi, H., Ohizumi, T., and Itano, Y.: Analysis of monitoring data of ground-level ozone in Japan for long-term trend during 1990–2010: Causes of temporal and spatial variation, Atmos. Environ., 102, 302–310, 2015.
Aleksic, N., Sedefian, L., and Ku, M.: Empirical estimates of summer background ozone levels in New York State, New York State Department of Environmental Conservation, Albany, NY, 2011.
Carter, W. P. L.: Development of ozone reactivity scales for volatile organic compounds, J. Air Waste Manag. Assoc., 44, 881–899, 1994.
Carter, W. P. L.: Documentation of the SAPRC-99 chemical mechanism for VOC reactivity assessment, University of California, Riverside, CA, available at: http://www.engr.ucr.edu/~carter/pubs/s99doc.pdf (last access: 4 June 2018), 1999.
Chang, K. L., Petropavlovskikh, I., Cooper, O. R., Schultz, M. G., and Wang, T.: Regional trend analysis of surface ozone observations from monitoring networks in eastern North America, Europe and East Asia, Elem. Sci. Anth., 5, 50, https://doi.org/10.1525/elementa.243, 2017.
Environment and Climate Change Canada (ECCC): Data sources and methods for the air quality indicators, available at: https://www.ec.gc.ca/indicateurs-indicators/default.asp?lang=En&n=BA9D8D27-1&offset=4&toc=hide (last access: 4 June 2018), 2016.
Environment and Climate Change Canada (ECCC): Air pollutant emission inventory – online data search, available at: http://ec.gc.ca/inrp-npri/donnees-data/ap/index.cfm?lang=En, last access: 4 June 2018a.
Environment and Climate Change Canada (ECCC): NAPS data products, available at: http://maps-cartes.ec.gc.ca/rnspa-naps/data.aspx, last access: 4 June 2018b.
Fleming, Z. L., Doherty, R. M., von Schneidemesser, E., Malley, C. S., Cooper, O. R., Pinto, J. P., Colette, A., Xu, X., Simpson, D., Schultz, M. G., Lefohn, A. S., Hamad, S., Moolla, R., Solberg, S., and Feng, Z.: Tropospheric ozone assessment report: Present-day ozone distribution and trends relevant to human health, Elem. Sci. Anth., 6, 12, https://doi.org/10.1525/elementa.273, 2018.
Gaudel, A., Cooper, O. A., Ancellet, G., et al.: Tropospheric ozone assessment report: Present-day distribution and trends of tropospheric ozone relevant to climate and global atmospheric chemistry model evaluation, Elem. Sci. Anth., 6, 39, https://doi.org/10.1525/elementa.291, 2018
Gilbert, R. O.: Statistical methods for environmental pollution monitoring, Van Nostrand Reinhold Company Inc, New York, NY, 1987.
Huryn, S. and Gough, W.: Impact of urbanization on the ozone weekday/weekend effect in Southern Ontario, Canada, Urban Clim., 8, 11–20, 2014.
International Global Atmospheric Chemistry (IGAC), Tropospheric Ozone Assessment Report, available at: http://www.igacproject.org/activities/TOAR, last access: 16 October 2018.
Iowa Department of Natural Resources (IDNR): Effects of ground-level ozone, available at: http://www.iowadnr.gov/Environmental-Protection/Air-Quality/Air-Pollutants/Effects-Ozone, last access: 4 June 2018.
Itano, Y., Bandow, H., Takenaka, N., Saitoh, Y., Asayama, A., and Fukuyama, J.: Impact of NOx reduction on long-term ozone trends in an urban atmosphere, Sci. Total Environ., 379, 46–55, 2007.
Itano, Y., Yamagami, M., and Ohara, T.: Estimation of primary NO2∕NOx emission ratio from road vehicles using ambient monitoring data, Stud. Atmos. Sci., 1, 1–7, 2014.
Jaffe, D., Price, H., Parrish, D., Goldstein, A., and Harris, J.: Increasing background ozone during spring on the west coast of North America, Geophys. Res. Lett., 30, 1–4, 2003.
Jia, C., Mao, X., Huang, T., Liang, X., Wang, Y., Shen, Y., Jiang, W., Wang, H., Bai, Z., Ma, M. and Yu, Z.: Non-methane hydrocarbons (NMHCs) and their contribution to ozone formation potential in a petrochemical industrialized city, Northwest China, Atmos. Res., 169, 225–236, 2016.
Jun, T., Xia, Z. G., Wang, H. and Li, W.: Temporal variations in surface ozone and its precursors and meteorological effects at an urban site in China, Atmos. Res., 85, 310–337, 2007.
Koo, B., Jung, J., Pollack, A. K., Lindhjem, C., Jimenez, M., and Yarwood, G.: Impact of meteorology and anthropogenic emissions on the local and regional ozone weekend effect in Midwestern US, Atmos. Environ., 57, 13–21, 2012.
Kurtenbach, R., Kleffmann, J., Niedojadlo, A., and Wiesen, P.: Primary NO2 emissions and their impact on air quality in traffic environments in Germany, Environ. Sci. Europe., 24, 1–8, 2012.
Lin, C. Y. C., Jacob, D. J., Munger, J. M., and Fiore, A. M.: Increasing background ozone in surface air over the United States, Geophys. Res. Lett., 27, 3465–3468, 2000.
Mills, G., Pleijel, H., Malley, C. S., Sinha, B., Cooper, O. R., Schultz, M. G., Neufeld, H. S., Simpson, D., Sharps, K., Feng, Z., Gerosa, G., Harmens, H., Kobayashi, K., Saxena, P., Paoletti, E., Sinha, V., and Xu, X.: Tropospheric ozone assessment report: Present-day tropospheric ozone distribution and trends relevant to vegetation, Elem. Sci. Anth., 6, 47, https://doi.org/10.1525/elementa.302, 2018.
Ministry of the Environment (MOE): Air Quality in Ontario 2006 Report, Queen's Printer for Ontario, PIBS 6041e, 2006.
Ministry of the Environment (MOE): Air Quality in Ontario Report for 2010, Queen's Printer for Ontario, PIBS 8640e, 2012.
Ministry of the Environment and Climate Change (MOECC): Air Quality in Ontario 2015 Report, Queen's Printer for Ontario, ISSN 1710-8136, 2017.
Ministry of the Environment, Conservation and Parks (MECP): Search: air pollutant data, available at: http://airqualityontario.com/history/index.php, last access: 4 June 2018.
National Academy of Sciences (NAS): Ozone-forming potential of reformulated gasoline. The National Academies Press, Washington, DC, available at: https://www.nap.edu/read/9461/chapter/5 (last access: 4 June 2018), 1999.
Parrington, M., Palmer, P. I., Lewis, A. C., Lee, J. D., Rickard, A. R., Di Carlo, P., Taylor, J. W., Hopkins, J. R., Punjabi, S., Oram, D. E., Forster, G., Aruffo, E., Moller, S. J., Bauguitte, S. J.-B., Allan, J. D., Coe, H., and Leigh, R. J.: Ozone photochemistry in boreal biomass burning plumes, Atmos. Chem. Phys., 13, 7321–7341, https://doi.org/10.5194/acp-13-7321-2013, 2013.
Pudasainee, D., Sapkota, B., Shrestha, M. L., Kaga, A., Kondo, A., and Inoue, Y.: Ground level ozone concentrations and its association with NOx and meteorological parameters in Kathmandu Valley, Nepal, Atmos. Environ., 40, 8081–8087, 2006.
Schultz, M. G., Schroder, S., Lyapina, O., et al.: Tropospheric ozone assessment report: Database and metrics data of global surface ozone observations, Elem. Sci. Anth., 5, 58, https://doi.org/10.1525/elementa.244, 2017.
Sen, P. K.: Estimates of the regression coefficient based on Kendalls Tau, J. Am. Stat. Assoc., 63, 1379–1389, 1968.
Shin, H. J., Cho, K. M., Han, J. S., Kim, J. S., and Kim, Y. P.: The effects of precursor emission and background concentration changes on the surface ozone concentration over Korea, Aerosol Air Qual. Res., 12, 93–103, 2012.
Sicard, P., Dalstein-Richier, L., and Vas, N.: Annual and seasonal trends of ambient ozone concentration and its impact on forest vegetation in Mercantour National Park (South-eastern France) over the 2000–2008 period, Environ. Pollut., 159, 351–362, 2011.
Sillman, S.: The relation between ozone, NOx and hydrocarbons in urban and polluted rural environments, Atmos. Environ., 33, 1821–1845, 1999.
Simon, H., Reff, A., Wells, B. Xing, J., and Frank, N.: Ozone trends across the United States over a period of decreasing NOx and VOC Emissions, Environ. Sci. Technol., 49, 186–195, 2015.
So, K. L. and Wang, T.: On the local and regional influence on ground-level ozone concentrations in Hong Kong, Environ. Pollut., 123, 307–317, 2003.
United States Environmental Protection Agency (USEPA): The relationships between NOx, NOy, and ozone, available at: https://www3.epa.gov/ttnamti1/files/ambient/pams/97workbook10.pdf (last access: 16 August 2018), 2000.
United States Environmental Protection Agency (USEPA): Implementation of the 2015 primary ozone NAAQS: Issues associated with background ozone, available at: https://www.epa.gov/sites/production/files/2016-03/documents/whitepaper-bgo3-final.pdf (last access: 4 June 2018), 2015.
United States Environmental Protection Agency (USEPA): Health effects of ozone pollution, available at: https://www.epa.gov/ozone-pollution/health-effects-ozone-pollution, last access: 4 June 2018.
Wang, Y., Wang, H., Guo, H., Lyu, X., Cheng, H., Ling, Z., Louie, P. K. K., Simpson, I. J., Meinardi, S., and Blake, D. R.: Long-term O3-precursor relationships in Hong Kong: field observation and model simulation, Atmos. Chem. Phys., 17, 10919–10935, https://doi.org/10.5194/acp-17-10919-2017, 2017.
Yan, Y., Peng, L., Li, R., Li, Y., Li, L., and Bai, H.: Concentration, ozone formation potential and source analysis of volatile organic compounds (VOCs) in a thermal power station centralized area: A study in Shuozhou, China, Environ. Pollut., 223, 295–304, 2017.
Zhang, T.: Long-term trend of ground-level ozone through statistical and regional transport analysis, Master thesis, University of Windsor, Windsor, Ontario, Canada, available at: http://scholar.uwindsor.ca/etd/5880/ (last access: 4 June 2018), 2016.