
the Creative Commons Attribution 4.0 License.
the Creative Commons Attribution 4.0 License.
 | 29 Sep 2026
Origin of low ozone above western North America: an investigation of sources and trends
Ju-Mee Ryoo

Laura T. Iraci
Yu Yan Cui
Owen R. Cooper
Matthew S. Johnson
Kai-Lan Chang
Emma L. Yates
Valerie Thouret
Hanna Clark
Philippe Nedelec
Bastien Sauvage
While free-tropospheric ozone (O3) over western North America (WNA) has increased since the mid-1990s, research has primarily focused on the mean. We investigate the lower tail (O3 < 33rd percentile) to characterize the evolving remote background state. Because these air masses are minimally affected by episodic extremes, they offer a clearer window into long-term shifts in background O3, transport, and photochemistry. Using FLEXPART-ERA5 source–receptor relationships (SRRs) from 1994 to 2021, we analyze the transport history of air masses reaching WNA (25–55° N, 130–90° W). Despite no robust SRR trends within the lower and mid-troposphere (0–8 km), changing emission patterns suggest an intensifying remote influence. Specifically, WNA's surface NOx emissions have decreased while lower-tail O3 continues to rise, aligning with increasing surface emissions from Southeast Asia and intensified shipping. In contrast, UTLS (8–13 km) SRRs show a clear increase, indicating growing influence from high-altitude sources, including enhanced transport from Southeast Asia and the tropical Pacific, and rising global aircraft emissions. GMI chemical simulations corroborate these findings, revealing that net O3 production over Southeast Asia increased by 157 % in the lower troposphere and 7 % in the free troposphere between 2007 and 2019. The rise in WNA's low O3 percentiles is driven by the combined influence of intensified transport from Southeast Asia and the tropical Pacific, along with increasing global aircraft and shipping emissions. Ultimately, these trends reflect both the rapid growth of Southeast Asia emissions and shifting trans-Pacific transport.
- Article
(10517 KB) - Full-text XML
-
Supplement
(2914 KB) - BibTeX
- EndNote


Tropospheric ozone (O3) is an important trace gas because it has harmful impacts on human health and vegetation (Brauer et al., 2016; Fleming et al., 2018; Malashock et al., 2022; Mills et al., 2018). It is also an important greenhouse gas (Lacis et al., 1981; Ramaswamy, 2001; Gulev et al., 2021) categorized as a short-lived climate forcer (Szopa et al., 2021). Thus, it is essential to monitor tropospheric O3 trends, analyze O3 sources and sinks, and understand the associated atmospheric transport patterns and pathways.
The first phase of the Tropospheric Ozone Assessment Report (TOAR) and the sixth Intergovernmental Panel on Climate Change (IPCC) Assessment Report concluded that surface O3 has increased by 30 % to 70 % in the mid- and high latitudes of the Northern Hemisphere (NH) from the mid-20th century to the present day (Tarasick et al., 2019; Gulev et al., 2021). This finding aligns with ensembles of global atmospheric chemistry models that show increasing tropospheric O3 at northern mid-latitudes, primarily driven by fossil fuel combustion and emissions of O3 precursor gases (e.g., nitrogen oxides (NOx = nitric oxide (NO) + nitrogen dioxide (NO2)), volatile organic compounds (VOCs), carbon monoxide (CO), methane, CH4) (Szopa et al., 2021; Gulev et al., 2021; Fiore et al., 2022).
Since the mid-1990s O3 has increased in the free troposphere of the NH tropics and mid-latitudes (Verstraeten et al., 2015; Cooper et al., 2014, 2020, 2024; Gaudel et al., 2020; Gulev et al., 2021; Wang et al., 2022a; Chang et al., 2022, 2023a, 2024; Elshorbany et al., 2024; Froidevaux et al., 2025; van Malderen et al., 2025), although trends at the surface are highly variable (Cooper et al., 2020; Chang et al., 2023a, 2025; Putero et al., 2023). In particular, positive free-tropospheric O3 trends have been noted at the low end of the O3 distribution, for example at the 1st, 5th or 33rd percentiles, which have been observed in the tropics and the mid-latitudes of the NH (Cooper et al., 2010; Cohen et al., 2018; Gaudel et al., 2020; Chang et al., 2023a).
Understanding the lower tail end of the O3 distribution is critical as it is an important component of background O3 values. Furthermore, because low-O3 air masses are minimally affected by episodic processes – such as stratospheric intrusions and localized urban plumes – they provide a clearer view into long-term changes in background O3, transport, and photochemistry. This perspective is particularly important given the observed increase at the “clean” end of the O3 distribution. Analyzing IAGOS data from 1995 to 2013, Cohen et al. (2018) found that positive trends in the northern mid-latitude upper troposphere are driven by a significant rise in the lowest percentiles, a shift consistent with previous findings (Cooper et al., 2010; Lin et al., 2015). Very low O3 mixing ratios observed in the mid- and upper-troposphere of the mid-latitudes also originate in the lower troposphere of remote tropical regions, where O3 production is relatively low (Davies et al., 1998, Grant et al., 2000; Asman et al., 2003; Cooper et al., 2010; Chang et al., 2020; Gaudel et al., 2020). A range of atmospheric chemistry model simulations indicates that O3 production has increased in the lower troposphere of the western North Pacific Ocean, a region that was once dominated by O3 destruction (Zhang et al., 2016; Lin et al., 2017; Gaudel et al., 2020; Liu et al., 2022; Wang et al., 2022a).
As tropospheric O3 is an important greenhouse gas and air pollutant, understanding the changes of O3 production in remote regions of the world, especially in regions where O3 destruction once dominated, improves our understanding of the global tropospheric O3 budget. This area of research also improves our understanding of the baseline O3 levels that are advected into populated regions (Ryoo et al., 2017; Jaffe et al., 2018; Colombi et al., 2023), which impact surface O3 concentrations (Lin et al., 2017) and contribute to health impacts related to O3 exposure at high and moderate concentrations (U.S. EPA, 2020, 2023; WHO, 2021).
This analysis provides an update on tropospheric O3 trends above Western North America (WNA) and explores the recent changes of O3 production above Asia and the western North Pacific Ocean on the lower tail O3 values advected into WNA. The primary goal of this paper is to identify the origin of the air parcels containing the lower magnitudes of O3 above WNA, to understand how the lowest O3 values have changed over time, and to identify whether the observed trends are driven by transport, precursor emissions, or chemical processes. We aim to answer the following three science questions:
-
Where does the low O3 above WNA come from?
-
Have the transport pathways affecting O3 over WNA changed?
-
Have changes in O3 occurred due to chemical production?
We utilized a Lagrangian particle dispersion model to investigate trends (1994–2021; 28-year) in transport pathways of the air parcels influencing low O3 levels above WNA and employed the Global Model Initiative (GMI) dataset (Rotman et al., 2001; Ziemke et al., 2019) and Tropospheric Chemistry Reanalysis version 2 (TCR-2) chemical reanalysis (Miyazaki et al., 2019a, 2020) to analyze changes in net chemical O3 production in upwind source regions. For trend analysis of O3 precursor emissions, we also used the bottom-up Community Emissions Data System (CEDS; Hoesly et al., 2018; McDuffie et al., 2020) inventory for aircraft and anthropogenic emission datasets.
The paper is structured as follows: Sect. 2 outlines the data and methodology employed in the study. Section 3 presents the results, and Sect. 4 discusses the implications of the results and their broader significance.
This study examines WNA (25–55° N, 130–90° W) from 1994 to 2021 (28 years). Detailed data and methodology are presented below.
2.1 FLEXPART- ERA5 (1994–2021) model output
We utilize the FLEXible PARTicle dispersion model (FLEXPART) version 10.4 (Pisso et al., 2019), using meteorology from the European Centre for Medium-Range Weather Forecasts (ECMWF) Reanalysis v5 (ERA5). ERA5 is a fifth-generation ECMWF atmospheric meteorological reanalysis of the global atmosphere at hourly temporal resolution (Hersbach et al., 2020). Hourly and monthly data were available on a 0.25° longitude × 0.25° latitude grid with 137 vertical levels ranging from 1000 to 1 hPa. We utilized 3-D wind (), temperature, pressure, and other surface quantities (Cui et al.,2025).
FLEXPART–ERA5 generated the source–receptor relationship (SRR) quantity used in this study, which can be applied to represent the air mass residence time at specific times and grid locations. Thus, this is often referred to as the “surface influence factor”, “residence time”, or “retroplume” (e.g., Cooper et al., 2010; Cui et al., 2025). In this study, we refer to the SRR as residence time. A high SRR indicates a strong connection between the upwind source region and the observation location. These high SRR values indicate long residence time over source regions, resulting in greater surface emission influence, while a low SRR represents a weak connection between source regions and observations due to short residence times. The model is used to support our 28-year O3 analysis from 1994 to 2021, providing a set of outputs at hourly resolution extending from the observational O3 receptors back 15 d, with 1° × 1° spatial resolution globally (Cui et al., 2025). To track the vertical range of the SRR of trajectories associated with the O3 observation over WNA, we classify the trajectory layers into five vertical levels: 0–300 m, 300 m–3 km, 3–8 km, 8–13 km, and 13–20 km. These five levels refer to the retroplume assessment levels associated with observed O3 values over WNA, regardless of the original O3 measurement altitude. While the raw data contain detailed receptor and retroplume information (Cui et al., 2025), only retroplume data are retained when processing daily and monthly data.
The five vertical layers from the surface to 20 km are designed to support the investigation of the different sources associated with different altitudes and to understand their source contributions. To differentiate between source contributions, we utilize specific vertical layers: the 0–300 m and 0.3–3 km ranges quantify the respective contributions of surface-level and planetary boundary layer (PBL) emissions. The 3–13 km column accounts for the influence of lightning-induced ozone formation, while the 8–13 km range isolates the impact of aircraft emissions on downwind WNA O3 levels. The output unit of the SRR from the FLEXPART–ERA5 backward model simulation is s m3 kg−1, which represents the SRR weighted by the air mass volume. For more detailed model processing information, please see Cui et al. (2025).
Daily output with 15 d back-trajectories is aggregated into monthly data by normalizing the total SRR by the O3 receptor observations. Although our initial daily output spans the globe, we restrict our monthly analysis to the NH to reduce computational demands. We justify this by assuming that interhemispheric transport contributes relatively little to O3 levels over WNA. To represent different atmospheric layers, the 0–300 m and 300 m–3 km ranges were categorized as the lower troposphere, the 3–8 km range as the free troposphere, the 8–13 km range as the upper troposphere and lower stratosphere (UTLS), and the 13–20 km range as the stratosphere in the tropics and mid-latitude region.
2.2 Observational receptors and source regions selection
We used a data fusion technique to combine multi-platform O3 observations across 900–300 hPa above WNA (25–55° N, 130–90° W, Fig. 1a–c), to establish our receptor list over WNA (Chang et al., 2023a; Cui et al., 2025). Tropospheric O3 observations over WNA during 1994–2021 used in this study include (1) Ozonesonde measurements provided by the Canadian Ozonesonde Network (Environment and Climate Change Canada, 2022), and from the NOAA Global Monitoring Laboratory (NOAA GML, 2022), (2) Lidar measurements from Table Mountain (NASA JPL 2022), and (3) Aircraft measurements from IAGOS (In-Service Aircraft for a Global Observing System; Boulanger et al., 2022) and NASA AJAX/SNAX (Iraci and Yates, 2021; Yates et al., 2023). The availability of the observation periods varies slightly among the measurement sites during our study period from 1994–2021 (please refer to Fig. 1 of Cui et al., 2025 for more details). These efforts aim to enhance accuracy and precision of O3 trend estimates, building on earlier findings that sparse ozonesonde sampling – typically once per week – is insufficient for capturing accurate monthly means (Logan, 1999) or detecting reliable trends (Prinn, 1988). These findings were further evaluated and validated by using the densely sampled IAGOS dataset above Frankfurt, Germany (Chang et al., 2020; Saunois et al., 2012). More recently, Chang et al. (2024) demonstrated that trend estimates can vary significantly with sampling strategies, showing notable biases under sparse conditions. Gaudel et al. (2024) likewise emphasized the difficulty of detecting O3 trends in the tropics due to limited in-situ observations.
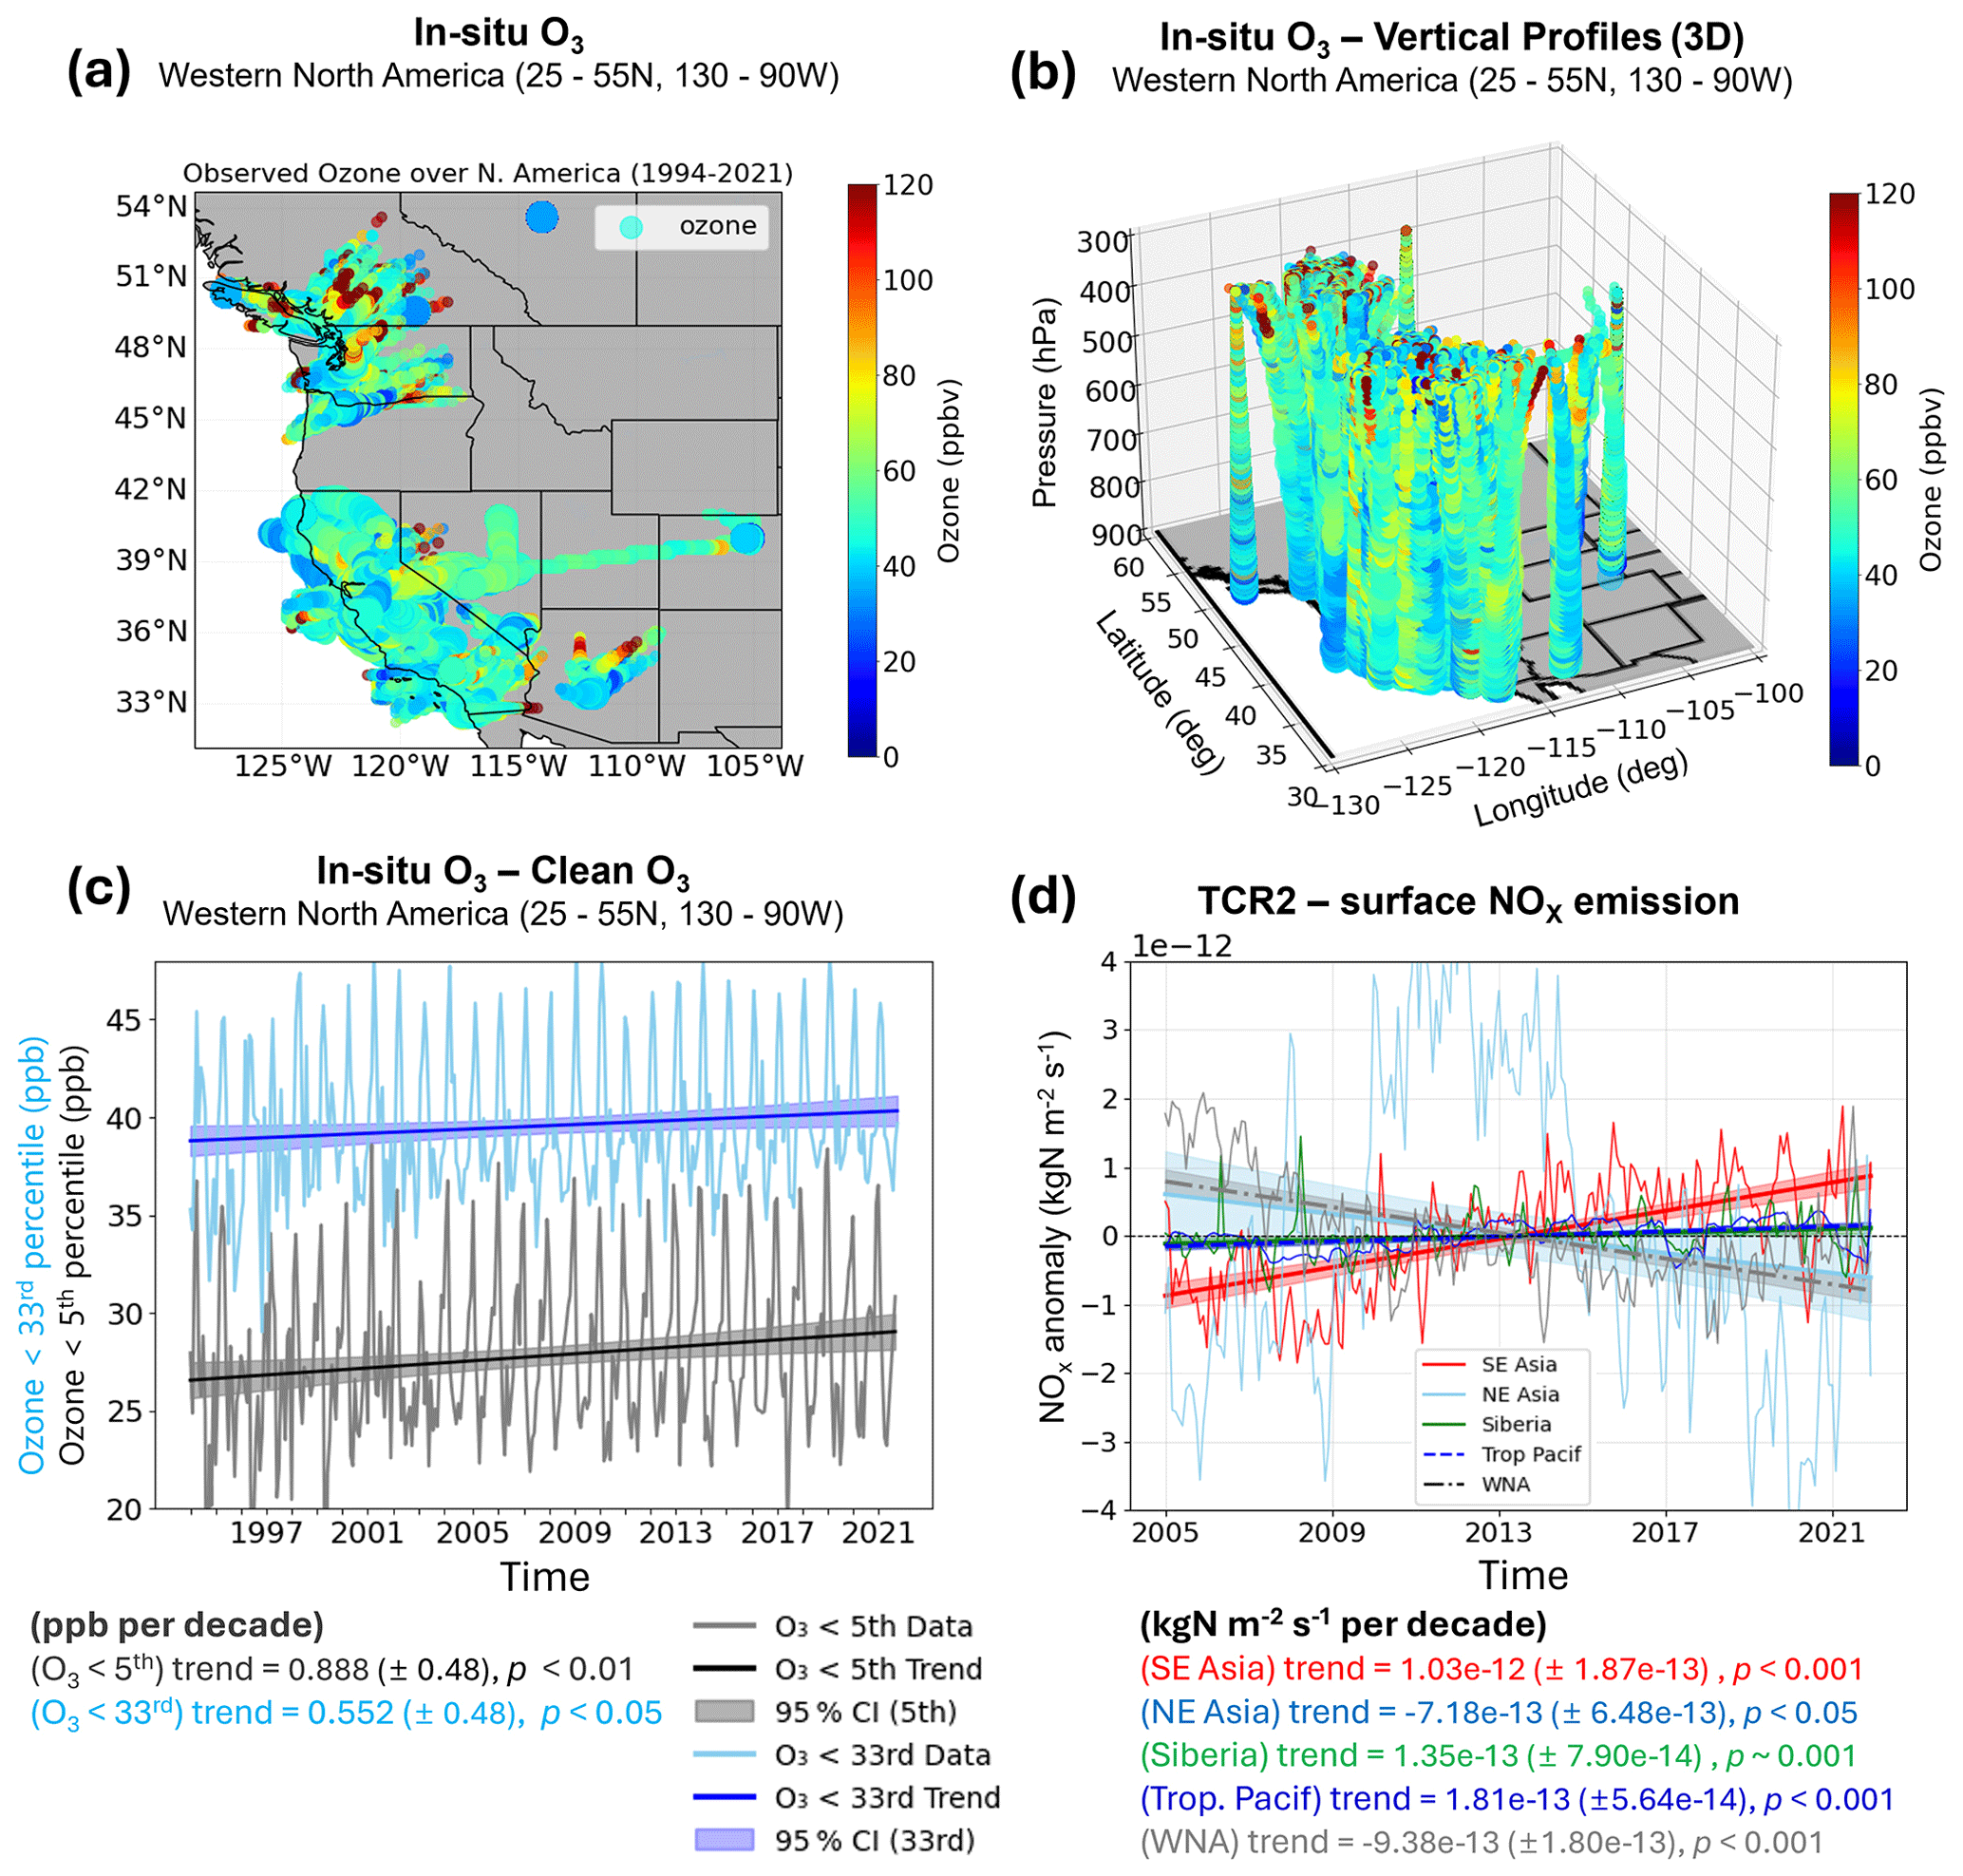
Figure 1Trends and uncertainty in observed O3 and chemical reanalysis NOx emissions: (a, b) Map of 2-D horizontal and 3-D vertical distribution of observed O3 (circle, ppb) over WNA used in this study (1994–2021). (c) Time series and trend (ppb per decade) of the low O3 (< 5th percentile (gray) and < 33rd percentile (light blue)) from 1994 to 2021. (d) Time series of monthly anomalies and trends (ppb per decade) with uncertainty (± 2 standard errors) in TCR-2 NOx emissions over SE Asia (solid red), NE Asia (solid cyan), Siberia (solid green), the tropical Pacific (dashed blue), and WNA (gray dash-dotted) from 2005 to 2021. Shading in panels (c) and (d) denotes the 95 % confidence intervals of the trends.
We focus on four major source regions affecting the levels over WNA: SE Asia (0–25° N, 60–130° E), NE Asia (26–46° N, 75–127° E), Siberia (50–75° N, 70–160° E), and Tropical Pacific Ocean (hereafter Tropical Pacific; 5–35° N, 180° E–130° W) because, (1) these regions reflect differing emission distributions linked to growing industries and emission control strategies (Zhang et al., 2008; Wang et al., 2019), (2) these regions are well known for significantly contributing to O3 precursor sources and sinks (Thorp et al., 2021), and (3) hemispheric-scale O3 production and loss and its transport (Jacob et al., 1999; Cooper et al., 2010), and biomass burning emissions transport acting as O3 precursor species often affect WNA through long-range transport (Johnson et al., 2021) from various vertical ranges (Ryoo et al., 2017). Although our “SE Asia” domain (0–25° N, 60–130° E) spans South Asia (including India and Pakistan), Southeast Asia (Indochina and maritime states), and southern East Asia, this macro-scale boundary was intentionally chosen to capture broad, interconnected transport pathways. Strong transboundary mixing across these neighboring zones (e.g., Samphutthanont et al., 2026) makes separating individual sub-regional signatures difficult over multi-day trajectories. Therefore, this domain is designed to capture the overarching regional transport footprint and ensure solid statistical sampling, rather than pinpoint localized source areas. In this analysis, we also selected the Tropical Pacific as a potential source region due to high SRR and close proximity to WNA. For examining anthropogenic shipping emissions, we categorize the domain into three oceanic regions – Tropical Indian (0–30° N, 60–150° E), Tropical Pacific (5–35° N, 180° E–130° W), and mid-latitude western Pacific (30–55° N, 127–152° E). More details are shown in Sect. 3.3.
2.3 Other datasets
-
GMI O3 chemical production and loss data. we utilized the GMI data for O3 (Fig. S1 in the Supplement), NO2 (Fig. S2), and chemical O3 production and loss to examine net O3 production (Rotman et al., 2001; Ziemke et al., 2019). The GMI simulations employed the Modern-Era Retrospective analysis for Research and Applications, Version 2 (MERRA-2; Gelaro et al., 2017) reanalysis meteorology and a combined stratospheric-tropospheric chemical mechanism. GMI simulations have been widely used in various tropospheric studies to interpret observations of O3 and NOx, analyze observed trends (Ziemke et al., 2019), and investigate processes influencing O3 (Kerr et al., 2021; Strode et al., 2015, 2016). We focused on the period from 1994 to 2019. The spatial resolution is 0.625° longitude by 0.5° latitude and monthly temporal resolution.
-
TCR-2 NOx emission data. the Tropospheric Chemistry Reanalysis version 2 (TCR-2) chemical reanalysis (Miyazaki et al., 2019a, 2020) constrained by satellite chemical observations provides a broad range of chemical components, including surface concentrations of various species including O3 and NOx and anthropogenic and natural (e.g., lightning, biomass burning) emissions (Lahoz and Schneider, 2014). TCR-2 data have been evaluated against independent observations (e.g., Miyazaki et al., 2019b; Thompson et al., 2019). We utilize NOx emission data across multiple sectors – including surface anthropogenic, lightning, and biomass burning sources (Figs. 1d and S2) – to demonstrate that the rising O3 over WNA is likely driven by remote transport rather than local emissions. Specifically, while surface NOx over WNA has trended downward, the lower tail of the O3 distribution shows an increase (Fig. 1c and d), suggesting a disconnect between local precursor trends and the evolving remote background. The spatial resolution of the data is 1.125° longitude × 1.125° latitude, with monthly data available from 2005 to 2021.
-
CEDS anthropogenic and aircraft NOx emissions. the Community Earth atmospheric Data System (CEDS) emissions inventory was used to estimate anthropogenic and aircraft NOx emissions over the source regions (Smith et al., 2015). The system focuses on emissions of aerosol (BC, OC), gases (SO2, NH3) and O3 precursor compounds (NOx, CH4, CO, VOC). The inventory resolution is monthly, 0.5° × 0.5° spatial resolution, and 25 altitude levels, ranging from 0.305 to 14.495 km above sea level (Hoesly et al., 2018; McDuffie et al., 2020).
Data from the GMI model and TCR-2 chemical reanalysis were applied to assess trends in O3 (Fig. S1) and its precursor species such as NOx (Figs. 1d and S2).
2.4 Analysis Methodology
The number of receptors varies across years due to sampling differences in observational data availability. To account for this variability, we normalized the monthly SRRs by dividing the total SRRs from the receptors by the total receptor count for each month across different altitudes. Monthly O3 concentration percentiles from 1994 to 2021 were then defined relative to the monthly percentiles determined during the 2004–2014 baseline period. This period was selected as a representative baseline for O3 values at receptors over WNA because O3 sampling during this time was relatively evenly distributed.
We categorized O3 values based on the following percentiles: O3 < 5th percentile, 5th ≤ O3 < 33rd percentile, 33rd ≤ O3 < 50th percentile, 50th ≤ O3 < 66th percentile, 66th ≤ O3 < 95th percentile, and O3 ≥ 95th percentile. We defined low O3 using the 33rd percentile threshold, as SRR patterns were largely similar to those below the 5th percentile. To avoid the air masses with the strongest impact from stratospheric intrusion, we also excluded the 95–100th percentiles in our analysis.
The total number of monthly non-zero SRRs across the full range of O3 values from 1994 to 2021 was N = 539 808 out of 553 608 total gridded O3 observation (Cui et al., 2025). Of this total, the number of SRRs associated with O3 values below the 5th percentile and the 33rd percentile is N = 26 858 and 173 538, respectively, while those above the 66th percentile total N = 187 597, across all vertical layers. Those for high O3 (66th–95th percentile), excluding the highest O3 levels that are typically associated with recent stratospheric intrusions, is N = 160 299.
To analyze trends in airmass transport associated with particular O3 levels above WNA, as represented by SRR, we applied a linear regression model. For each month, the monthly SRR values corresponding to the O3 percentile ranges, as described in Sect. 2.1, were input into the linear regression model, formulated as follows:
where x is longitude, y is latitude, z is the five vertical layers, is a monthly mean cycle, is the trend coefficient, which is shown in the results, t represents the total 336 months (12 months × 28 years), and ϵ represents the residual term. The p-value of the trend estimate was used to assess the trend reliably. We adopted the TOAR statistical guidelines where a trend with p-value ≤ 0.05 is considered to be high certainty (Chang et al., 2023b; Wasserstein et al., 2019).
Monthly average SRRs (M) were first calculated for the five vertical layers at each longitude and latitude grid point from 1994 to 2021. Trends were then determined using a deseasonalized dataset, by subtracting the 28-year mean for each month () from the corresponding monthly SRR (e.g., for January 2010, the anomaly was calculated by subtracting the average of each January from 1994 to 2021 from the January 2010 value). Similarly, the trend of net GMI O3 production is also computed following Eq. (1). Net O3 production was estimated by subtracting all O3 loss terms from all O3 production terms, based on the GMI dataset.
The percentage change in chemical net O3production (ΔO3_netp) is calculated in Eq. (2) based on the difference in the averages of the two periods (P1: 1994–2006 and P2: 2007–2019) normalized by their combined average during the P1 period:
O3_netp(1994–2006) represents the average net O3 production for P1, and O3_netp(2007–2019) represents the average net O3 production for P2 for the specified four source regions over the free and lower troposphere, respectively.
To quantify the spatial influence of different source regions on low O3 levels over WNA, we calculated the normalized mean density (we call this as “relative intensity”). This value represents the mean SRR of air masses with positive net O3 production for a specific region, normalized against the hemispheric average (0–90° N) – SE Asia, NE Asia, Siberia, and the Tropical Pacific – during two time periods: P1 (1994–2006) and P2 (2007–2021). These values were derived from two-dimensional joint probability density functions (2D joint PDFs), estimated using a non-parametric, gaussian kernel density estimation (KDE) method, to estimate the PDF of a variable (Chen, 2017), implemented via the SciPy library in Python v3.7. Specifically, the relative intensity of region i during a given time was computed as (KDE (region i, time) KDE (total, time)) × 100 (%), where region i ∈ {SE Asia, NE Asia, Siberia, Tropical Pacific}.
Results were also tested across multiple bandwidths (i.e., smoothing parameters for KDE). The optimal bandwidth values were determined using the leave-one-out cross-validation (LOOCV) method, also implemented via the SciPy library. This approach minimizes the estimated error of the KDE by iteratively computing the density estimator on all but one data point and then evaluating its ability to obtain the density of the left-out point, ultimately selecting the bandwidth that minimizes the total error across all data points. Uncertainty in the computed relative intensity for each sector was also assessed using bootstrap-estimated standard deviation (N = 1000).
3.1 Where does the low O3 come from?
Figure 2 illustrates the SRR maps for low (< 33rd percentile) and high (66th-95th percentile) O3 concentrations across the lower (0–3 km) and middle (3–8 km) troposphere. SRR maps are intrinsically linked to trans-Pacific maritime transport and are heavily influenced by a mixture of maritime pathways, continental air masses, and source signatures (Ryoo et al., 2017). From the map, we identify distinct transport corridors associated with varying O3 levels. In the lower troposphere (0–3 km), low O3 air masses exhibit high SRR values, with their peaks and dispersions aligned specifically with the southern regions of East Asia and the tropical Pacific (Fig. 2a and c); SRR is higher in the red and gray boxed regions on the map). Conversely, elevated O3 concentrations are primarily associated with air masses transiting through NE Asia (Fig. 2c).
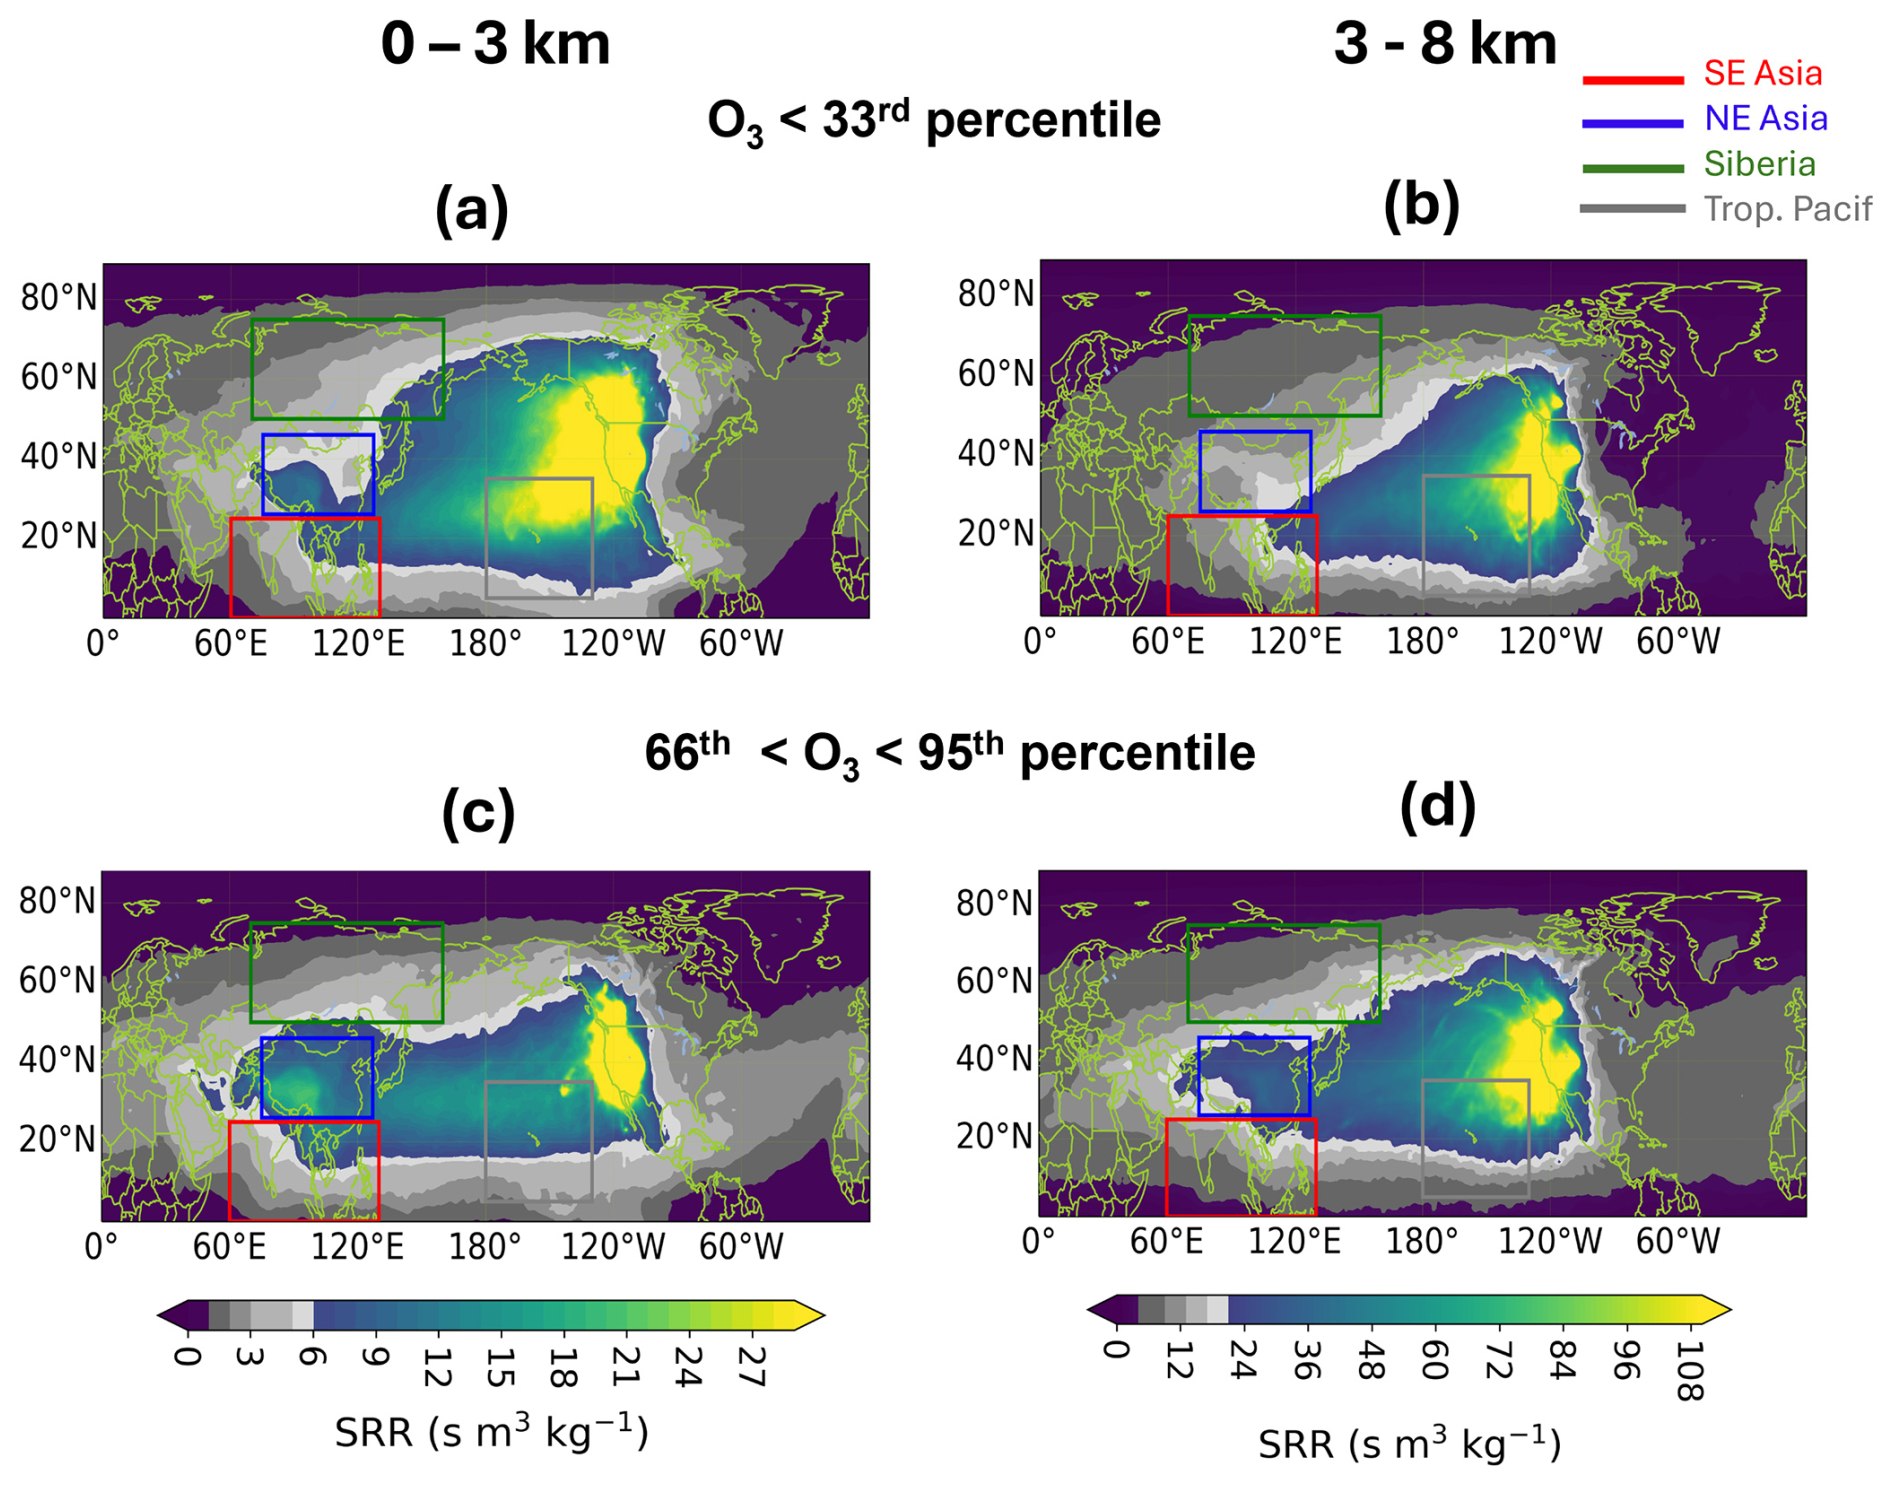
Figure 2Maps of the source–receptor relationship (SRR): (top) low O3 (< 33rd percentile), and (bottom) high O3 (66th–95th percentile) over the WNA for (a) and (c), 0–3 km level and (b) and (d) 3–8 km. The red, blue, green, and gray boxes in (a) represent SE Asia (0–25° N, 60–130° E), NE Asia (26–46° N, 75–127° E), Siberia (50–75° N, 70–160° E), and Tropical Pacific (5–35° N, 180° E–130° W), respectively.
This latitudinal contrast is further amplified in the free troposphere (3–8 km). While SRR values are generally larger in this layer compared to the lower troposphere, the spatial patterns remain consistent (Fig. 2b and d). For lower O3 percentiles, air parcels predominantly traverse the tropical eastern Pacific and SE Asia. In contrast, higher O3 percentiles are linked to air masses with extended SRR in the midlatitudes (15–45° N), exhibiting transport pathways that originate or pass through NE Asia. Similar patterns were reported by Cooper et al. (2010), who showed distinct transport features corresponding to different O3 levels, particularly in springtime.
These characteristic transport dynamics are also evident on a seasonal basis: transport patterns weaken slightly and become more localized over WNA during boreal summer (June–August; JJA), whereas they strengthen during boreal spring (March–May; MAM) and boreal winter (December–February; DJF) (Fig. S4).
This seasonal behavior aligns with findings by Ansari et al. (2025), who utilized explicit NOx and VOC emission tagging to demonstrate an increasing influence of foreign anthropogenic NOx and, to a lesser extent, global shipping NOx, over the northwestern United States between 2000 and 2018. Similarly, Li et al. (2023a) used the same explicit dual-tagging technique and found increasing contributions of Asian NOx emissions to Western US O3, particularly during winter from 1995 to 2019, further supporting our analysis. Taken together, these findings confirm that the geographic origin of an air mass is a key driver of O3 variability over WNA.
3.2 Have transport pathways changed?
To examine transport trends on decadal scales, we analyze the SRR patterns for air parcels containing low free tropospheric O3 amounts over WNA. Figure 3 illustrates trends in the SRR of low-O3 air parcels from the lower and the free troposphere to the UTLS. For low O3, SRRs show no clear trend in the lower troposphere (Fig. 3a and b) or in the free troposphere (Fig. 3c) in the regions of interest. In contrast, low O3 SRR exhibits an increasing tendency across all regions in the UTLS, though with large variability (Fig. 3d and e).
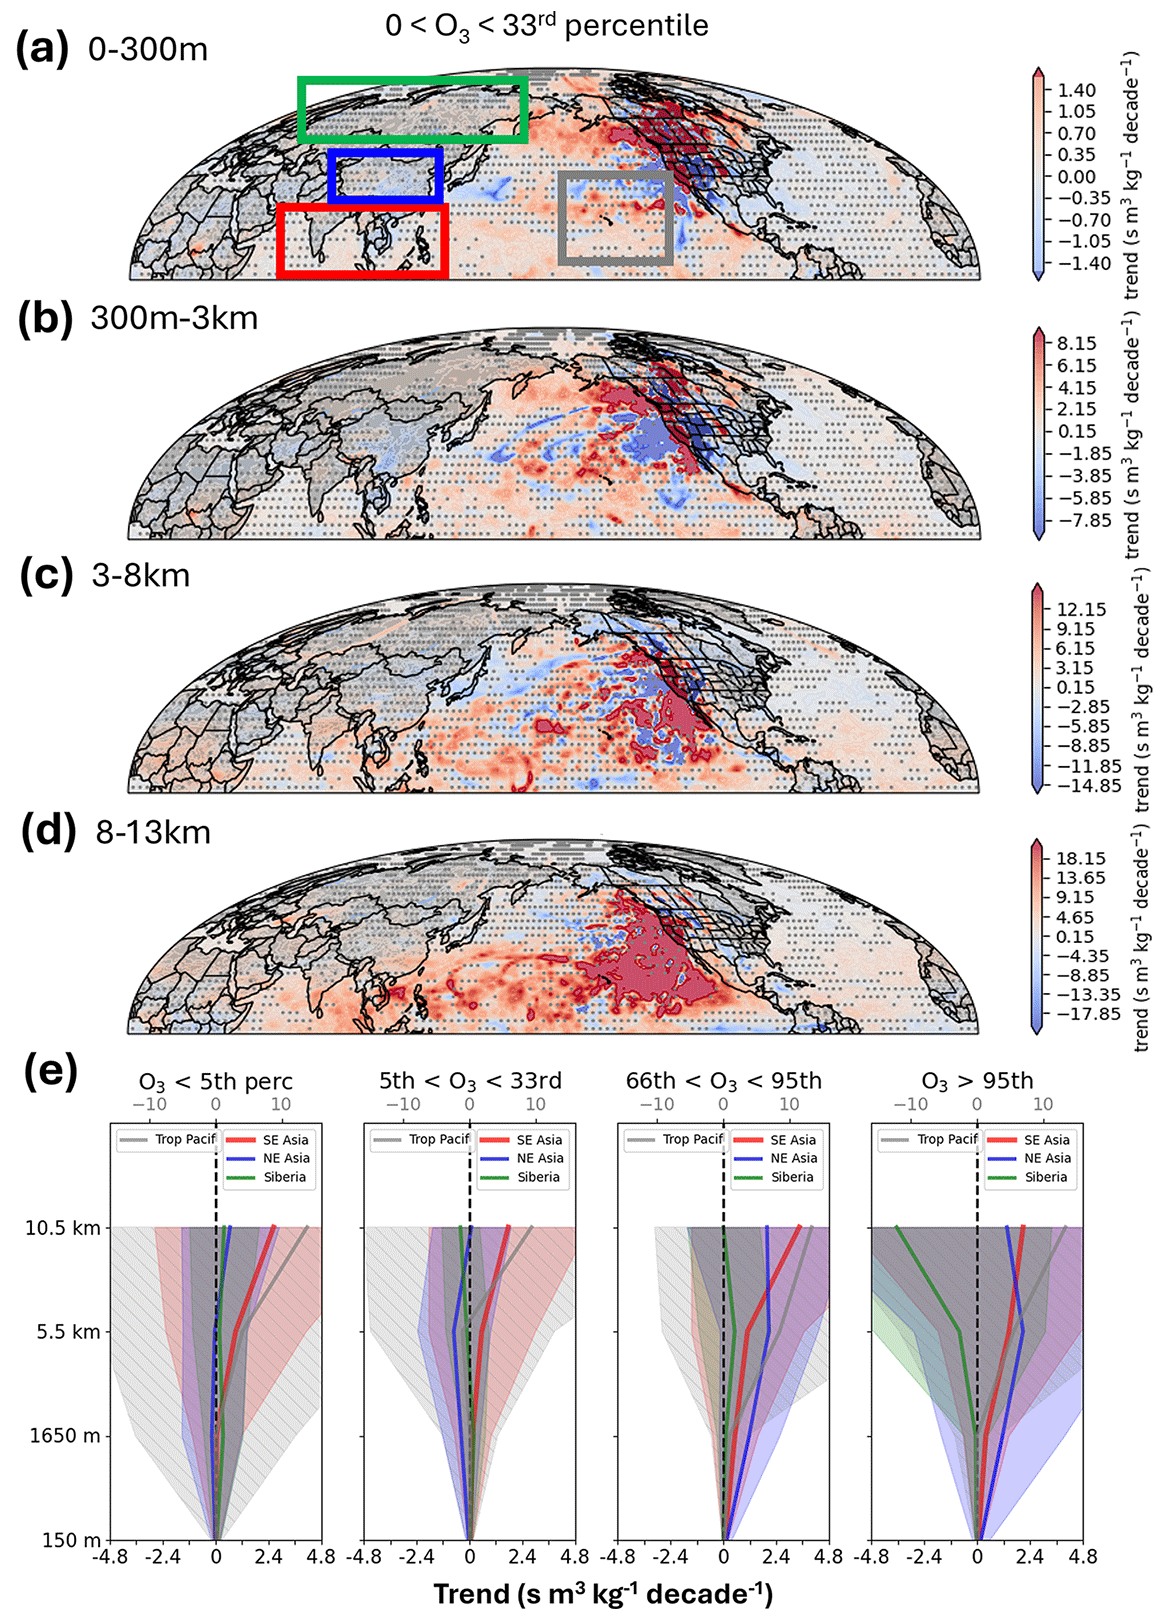
Figure 3Trends in SRR over the interval 1994–2021. Panels (a)–(d) show SRR trends for low O3 (5th to 33rd percentile range) over WNA for air parcels originating from four different layers: (a) 0–300 m, (b) 300 m–3 km, (c) 3–8 km, and (d) 8–13 km. Red colors identify regions of increasing influence. The dots on the maps represent the grid cells with a lower confidence value (p-value ≥ 0.05). The red, blue, green, and gray boxes in (a) represent SE Asia, NE Asia, Siberia, and Tropical Pacific, respectively. Panel (e) shows the vertical distribution of SRR trends for four regions (SE Asia, NE Asia, Siberia, and Tropical Pacific) and four categories of ozone amount: O3 < 5th percentile, 5th < O3 < 33rd percentiles, 66th O3 < 95th, and O3 > 95th percentile. The trend values for the tropical Pacific are shown on the upper x-axis (gray), while those for the other regions are shown on the lower x-axis (black). The shaded region in (e) represents the ± 2 standard deviation (2σ) of each trend value at the given level for the region. For ease of visualization, the mid-level height of each layer is shown on the y-axis in panel (e).
SRR for high O3 (66th–95th percentile, Fig. 3e) observations over WNA exhibit more positive trends and large variability. For example, SRR from NE Asia for high O3, both in the lower troposphere and the free troposphere, shows a distinct increasing trend (Figs. 2c, d, 3e, and S3). Conversely, high-O3 SRR shows a decreasing trend at higher latitudes (e.g., Siberia), while over the Tropical Pacific it exhibits increasing trend with substantial variability (Fig. 3e).
An increasing trend in the UTLS SRR of air masses is evident in Fig. 3 (8–13 km, Fig. 3d and e), influencing both low and high O3 over WNA. Although the 8–13 km altitude range corresponds to the UTLS region and influences stratosphere-troposphere exchange (STE), it also intersects commercial flight corridors and regions of frequent lightning activity. Therefore, the upward SRR trend in the 8–13 km layer cannot be uniquely attributed to STE. Furthermore, we intentionally excluded extreme O3 events from our primary analysis to mitigate STE influence. Investigating whether this increasing SRR trend points to a potential rise in STE activity requires further study and is beyond the scope of this work.
3.3 Are changes in O3 due to changes in emissions or chemical production?
To further investigate the potential cause of increasing amounts of O3 in the lowest percentiles at 8–13 km, we examine aircraft emissions averaged over 1994–2019, as shown in Fig. 4a. Notably, aircraft emissions – which have increased steadily across source regions (Fig. 4b) – typically peak within the 8–13 km range, coinciding with the primary cruising altitudes of commercial aviation. This finding aligns with Eastham et al. (2024), who demonstrated that the impact of civil aviation is driven primarily by a hemispheric-scale tropospheric O3 response to NOx rather than by localized effects.
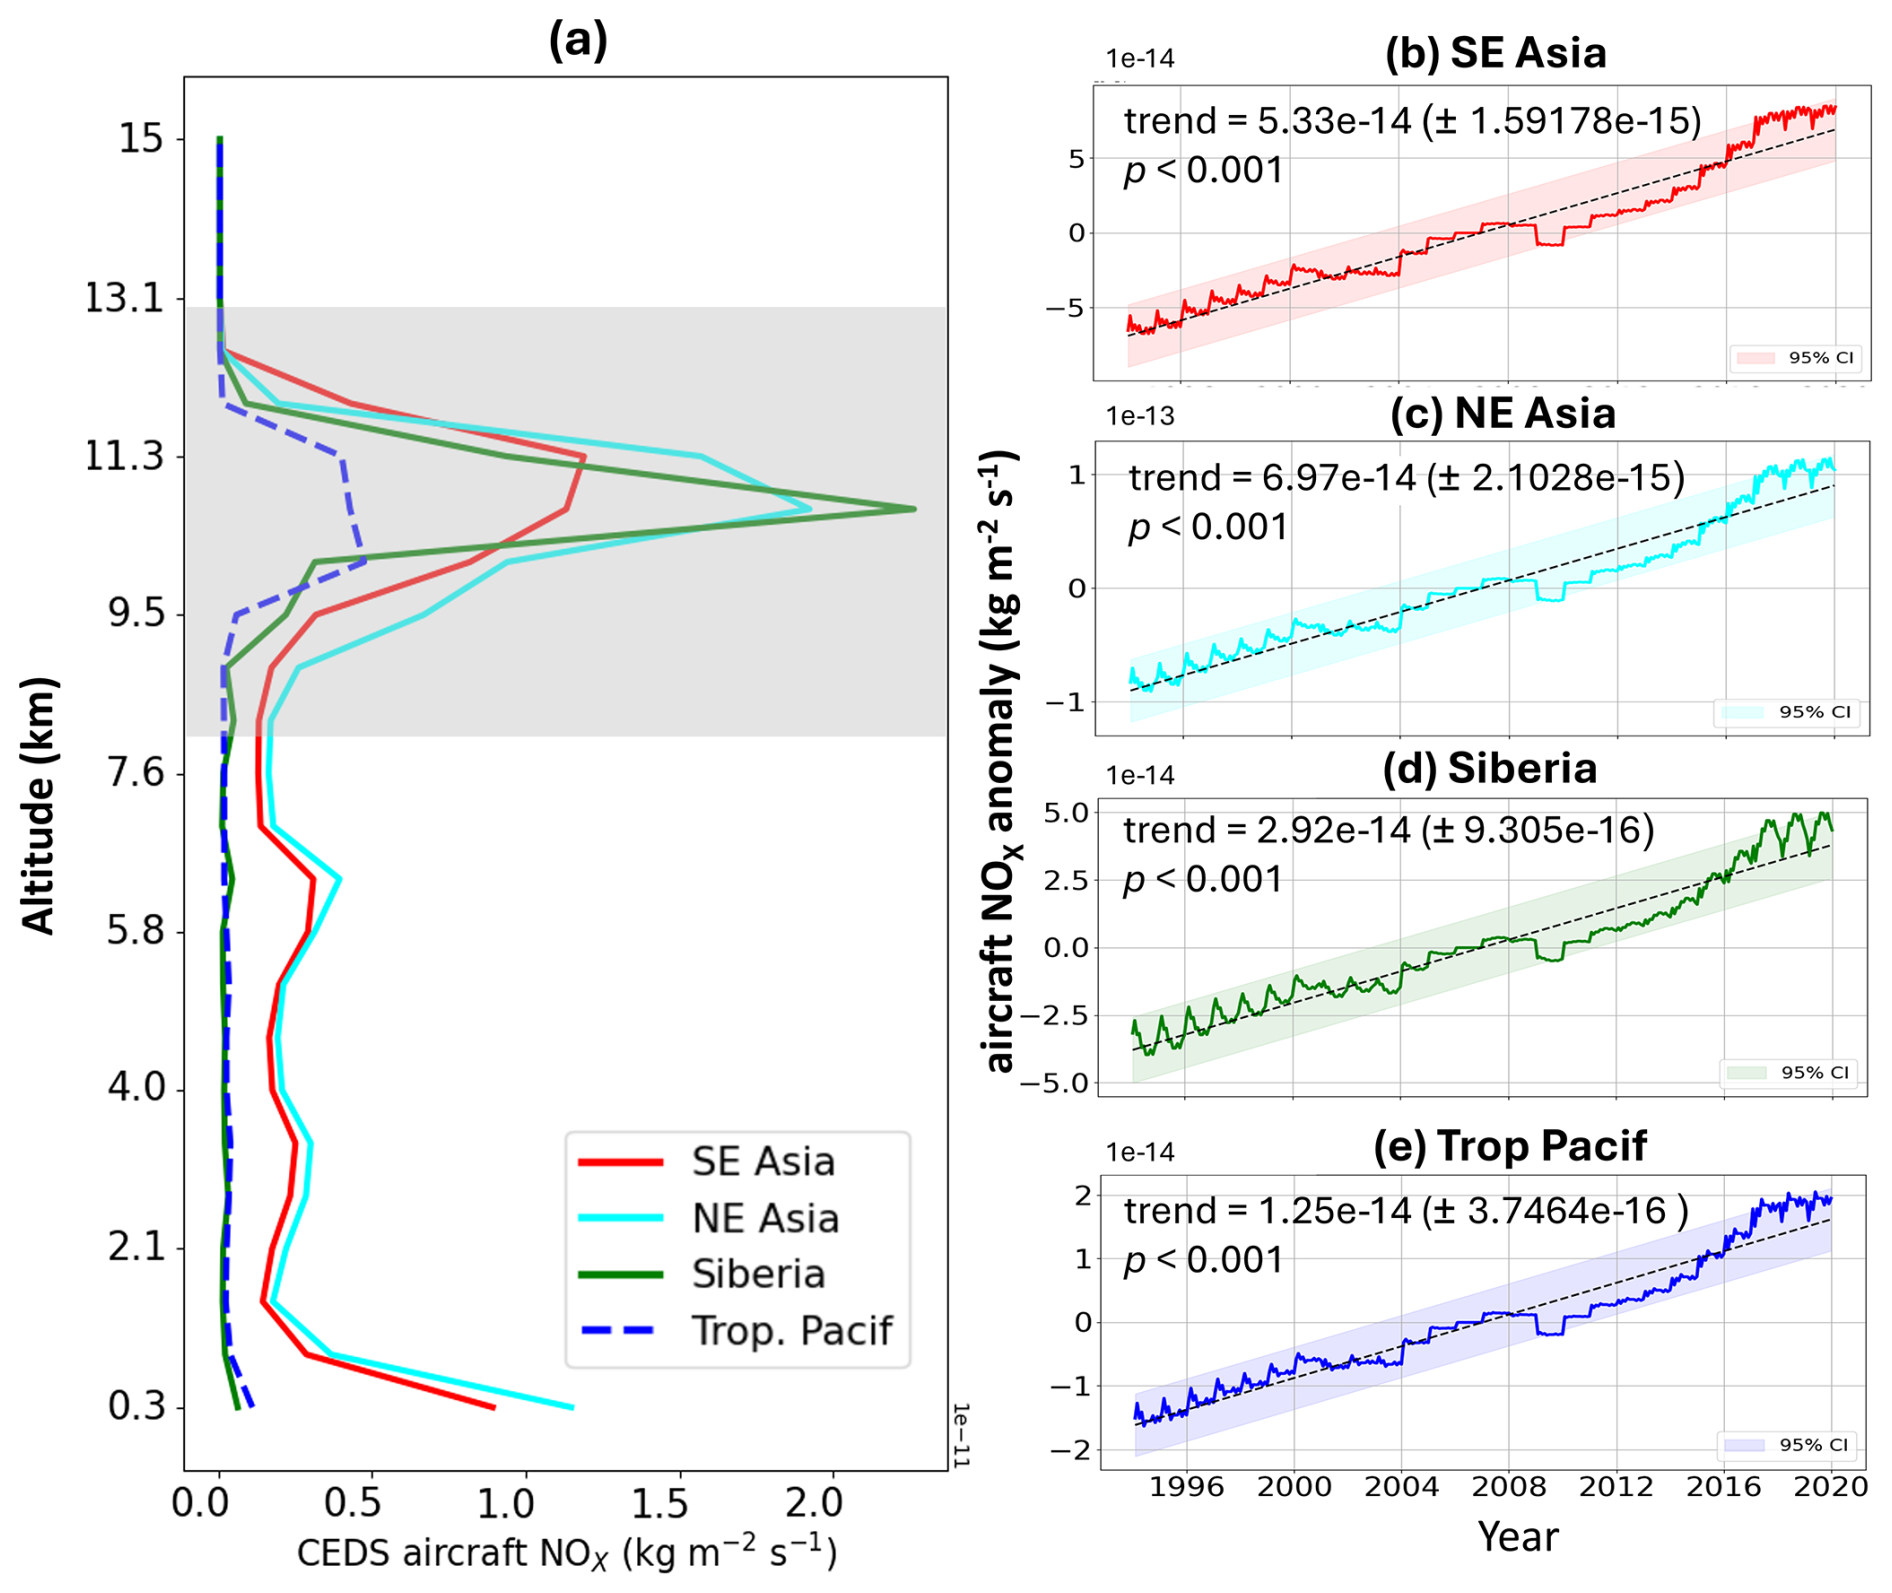
Figure 4(a) Vertical profiles of CEDS aircraft NOx emission () averaged over 1994–2019. (b–e) Time series of monthly anomaly and their linear trends (lines, per decade) with uncertainty (± 2 standard errors) of the CEDS aircraft NOx emissions in the UTLS (∼ 8–13 km) over the four source regions during 1994–2019. Shading in (b)–(e) denotes 95 % confidence intervals.
Beyond aviation emissions, we also find from GMI simulations that lightning-NOx shows increasing patterns over SE Asia and North America within the free troposphere and UTLS (3–13 km) (see Fig. 5 of Cui et al., 2025). These results further support the findings of Gressent et al. (2014), who identified additional sources – such as lightning-generated nitrogen oxides – as important contributors to O3 variability.
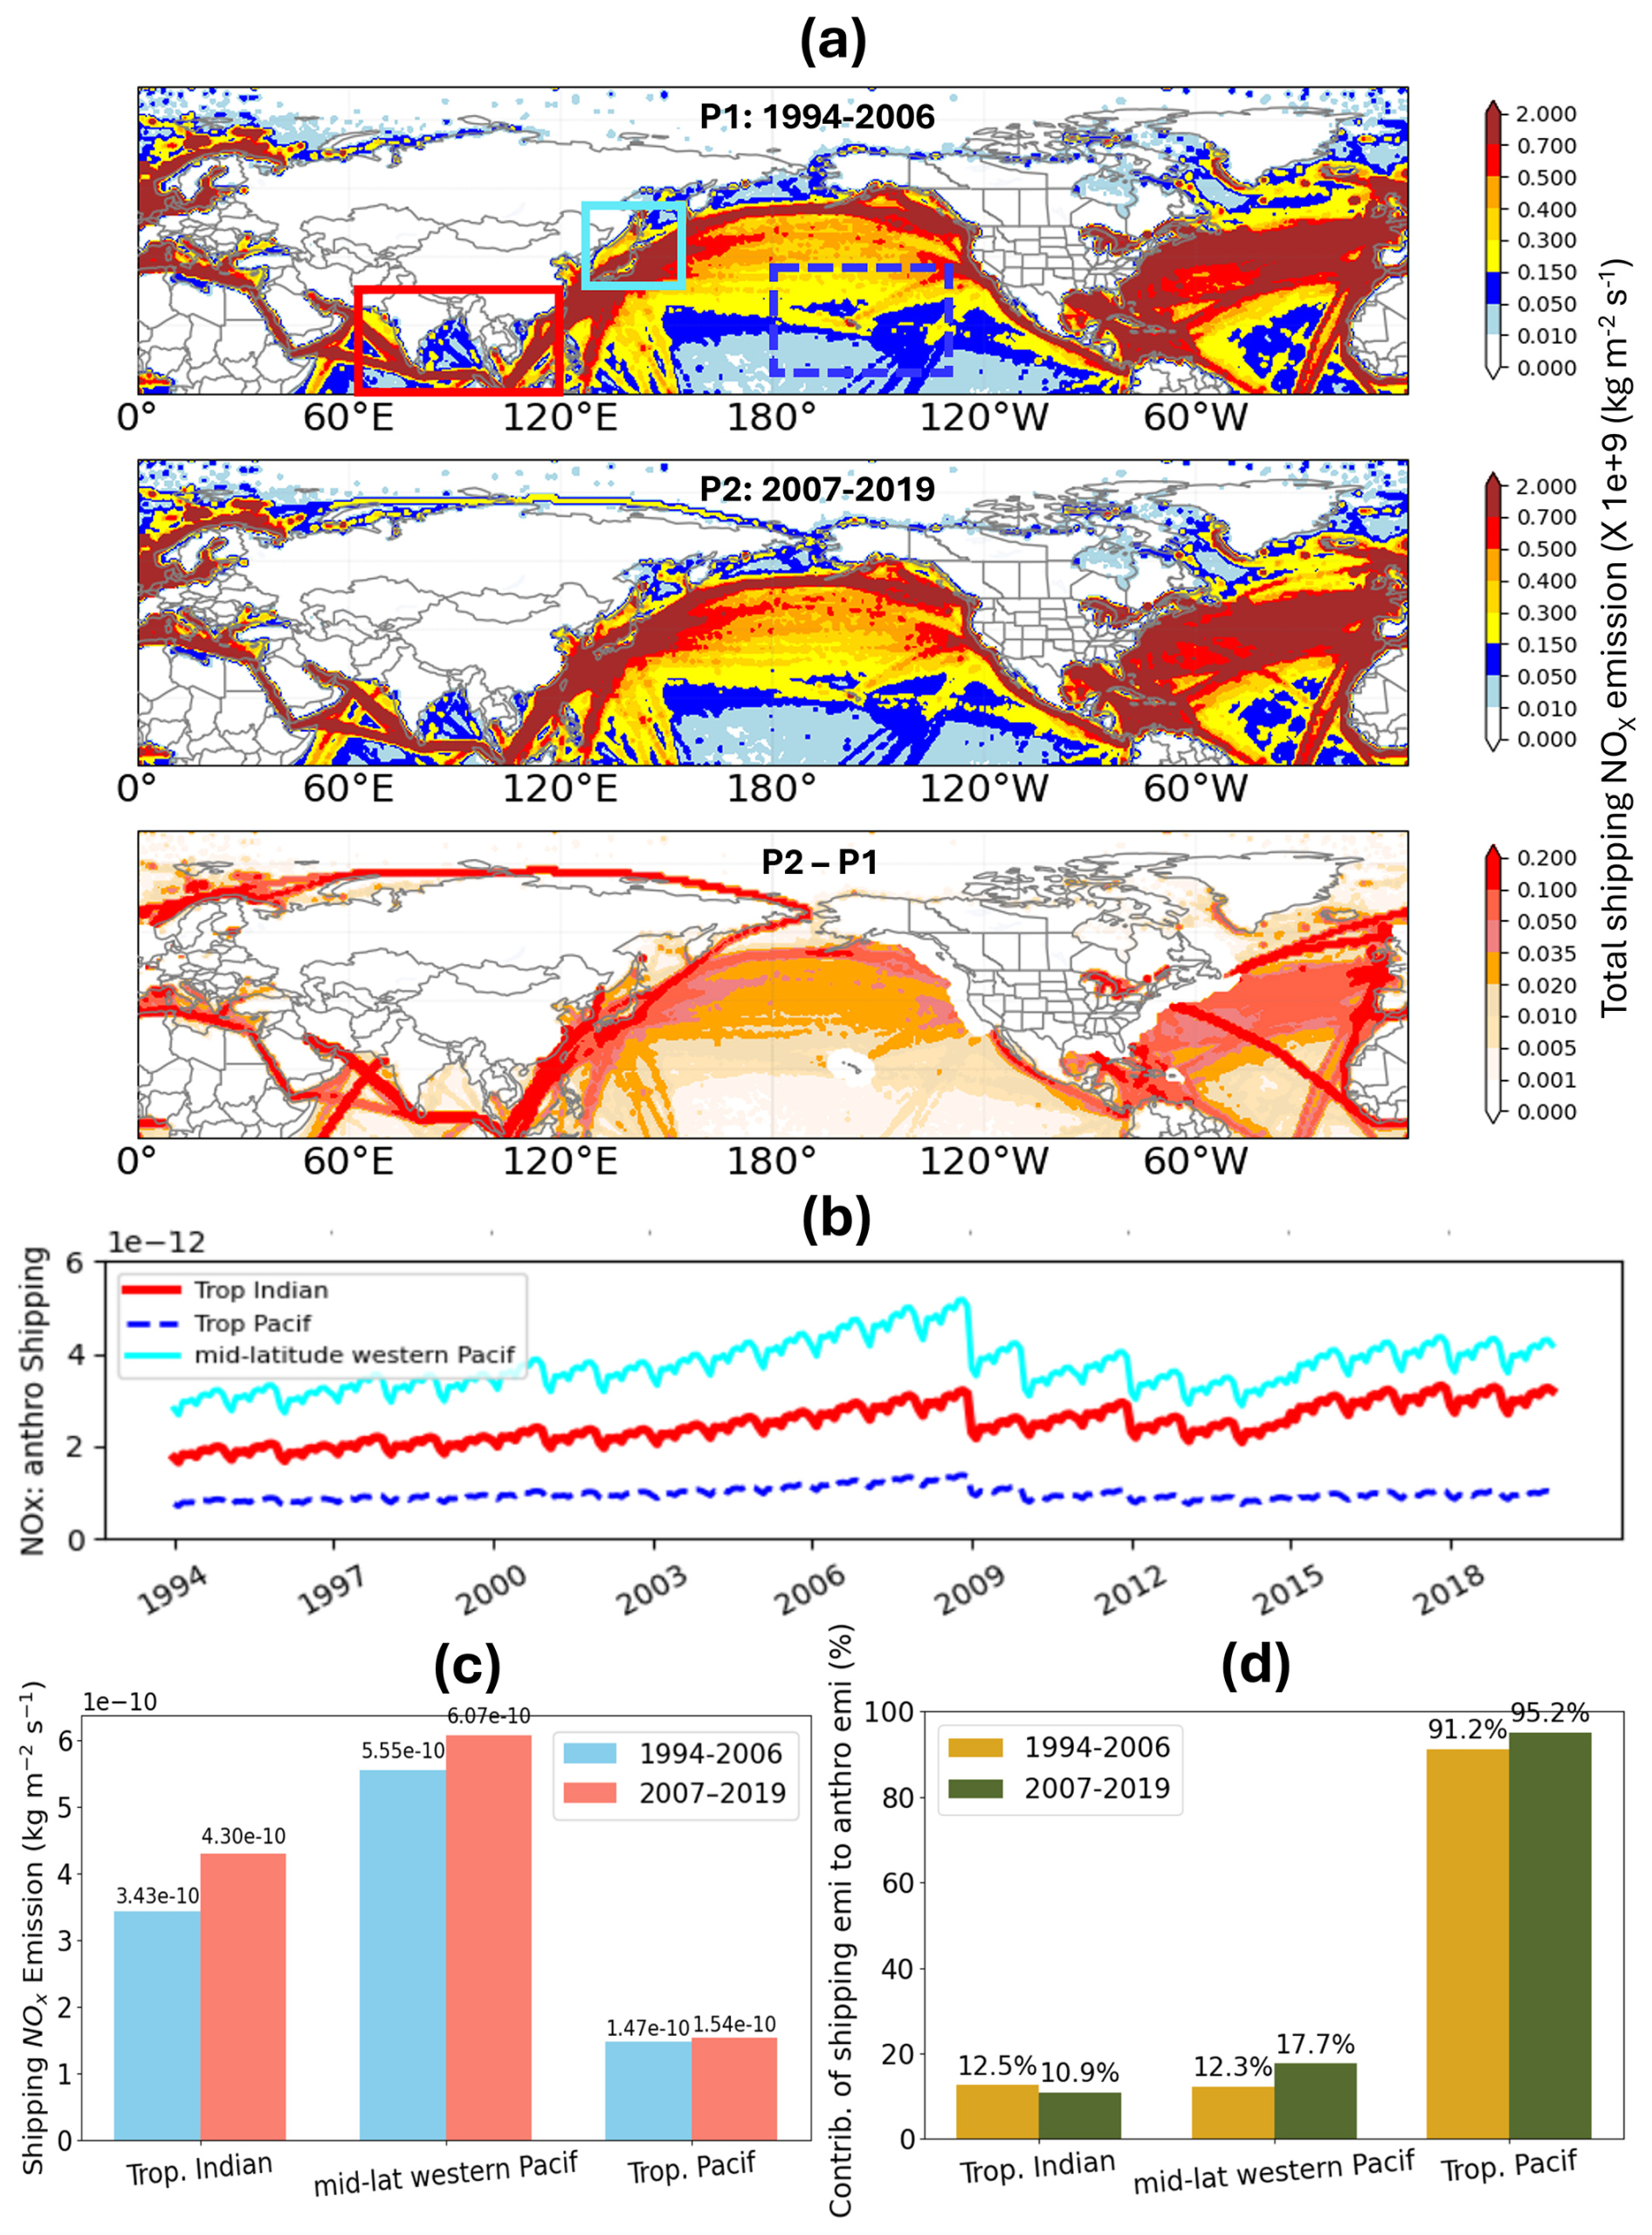
Figure 5(a) Maps of CEDS anthropogenic shipping NOx emissions () for (top) P1 (1994–2006), (middle) P2 (2007–2019), and (bottom) the difference (P2 − P1). (b) Time series of shipping NOx emissions for three source regions: the tropical Indian Ocean (0–30° N, 60–150° E; solid red), tropical Pacific (5–35° N, 180–130° W; dashed blue), and midlatitude western Pacific (30–55° N, 127–152° E; solid cyan). (c) Mean shipping emissions () and (d) the contribution of shipping emissions to total anthropogenic emissions (%) over the three source regions during P1 and P2. The tropical Indian, tropical Pacific, and midlatitude western Pacific regions are indicated in red, blue, and cyan, respectively.
While Fig. 3 shows an upward trend in transport from the tropical Pacific UTLS, the rise in low O3 over WNA is not solely driven by aircraft emissions. In fact, aircraft emissions are quite low in this specific area (Fig. 4a). This observation instead suggests the influence of other emission sources. To investigate additional anthropogenic emissions over our source regions, we particularly examined shipping emissions. As shown in Fig. 5, shipping emissions are high over the Tropical Indian Ocean (including the SE Asia region) and the Tropical Pacific (Li et al., 2023b). While the decrease in global shipping NOx emissions around 2009 was likely not driven by a single factor, the observed NOx reduction in 2009 has been reported to be partially associated with the 2008 global economic recession (Tong et al., 2016; Fig. 5b).
During the recent period (P2), total shipping emissions show a slight increase over the tropical Indian Ocean and the midlatitude western Pacific (including Northeast Asia), with minor changes over the tropical Pacific. Relative to total anthropogenic emissions, shipping contributes up to 10.9 %, 17.7 %, and 95.2 % in these regions, respectively, highlighting the growing role of shipping emissions there (Fig. 5d).
Given that both transport and chemical processes can influence O3 levels over WNA, we further analyze trends in net O3 chemical production to distinguish the role of chemical processes using GMI. Figure 6 represents the net O3 chemical production obtained by subtracting GMI O3 loss from GMI O3 production across the NH and the four distinct regions (Fig. S1) in both the free troposphere and the lower troposphere. In the lower troposphere, net O3 production is typically an order of magnitude higher than in the free troposphere, with positive values occurring predominantly over densely populated regions of the NH, while net destruction is mainly observed over the tropical ocean (Fig. 6a and b).
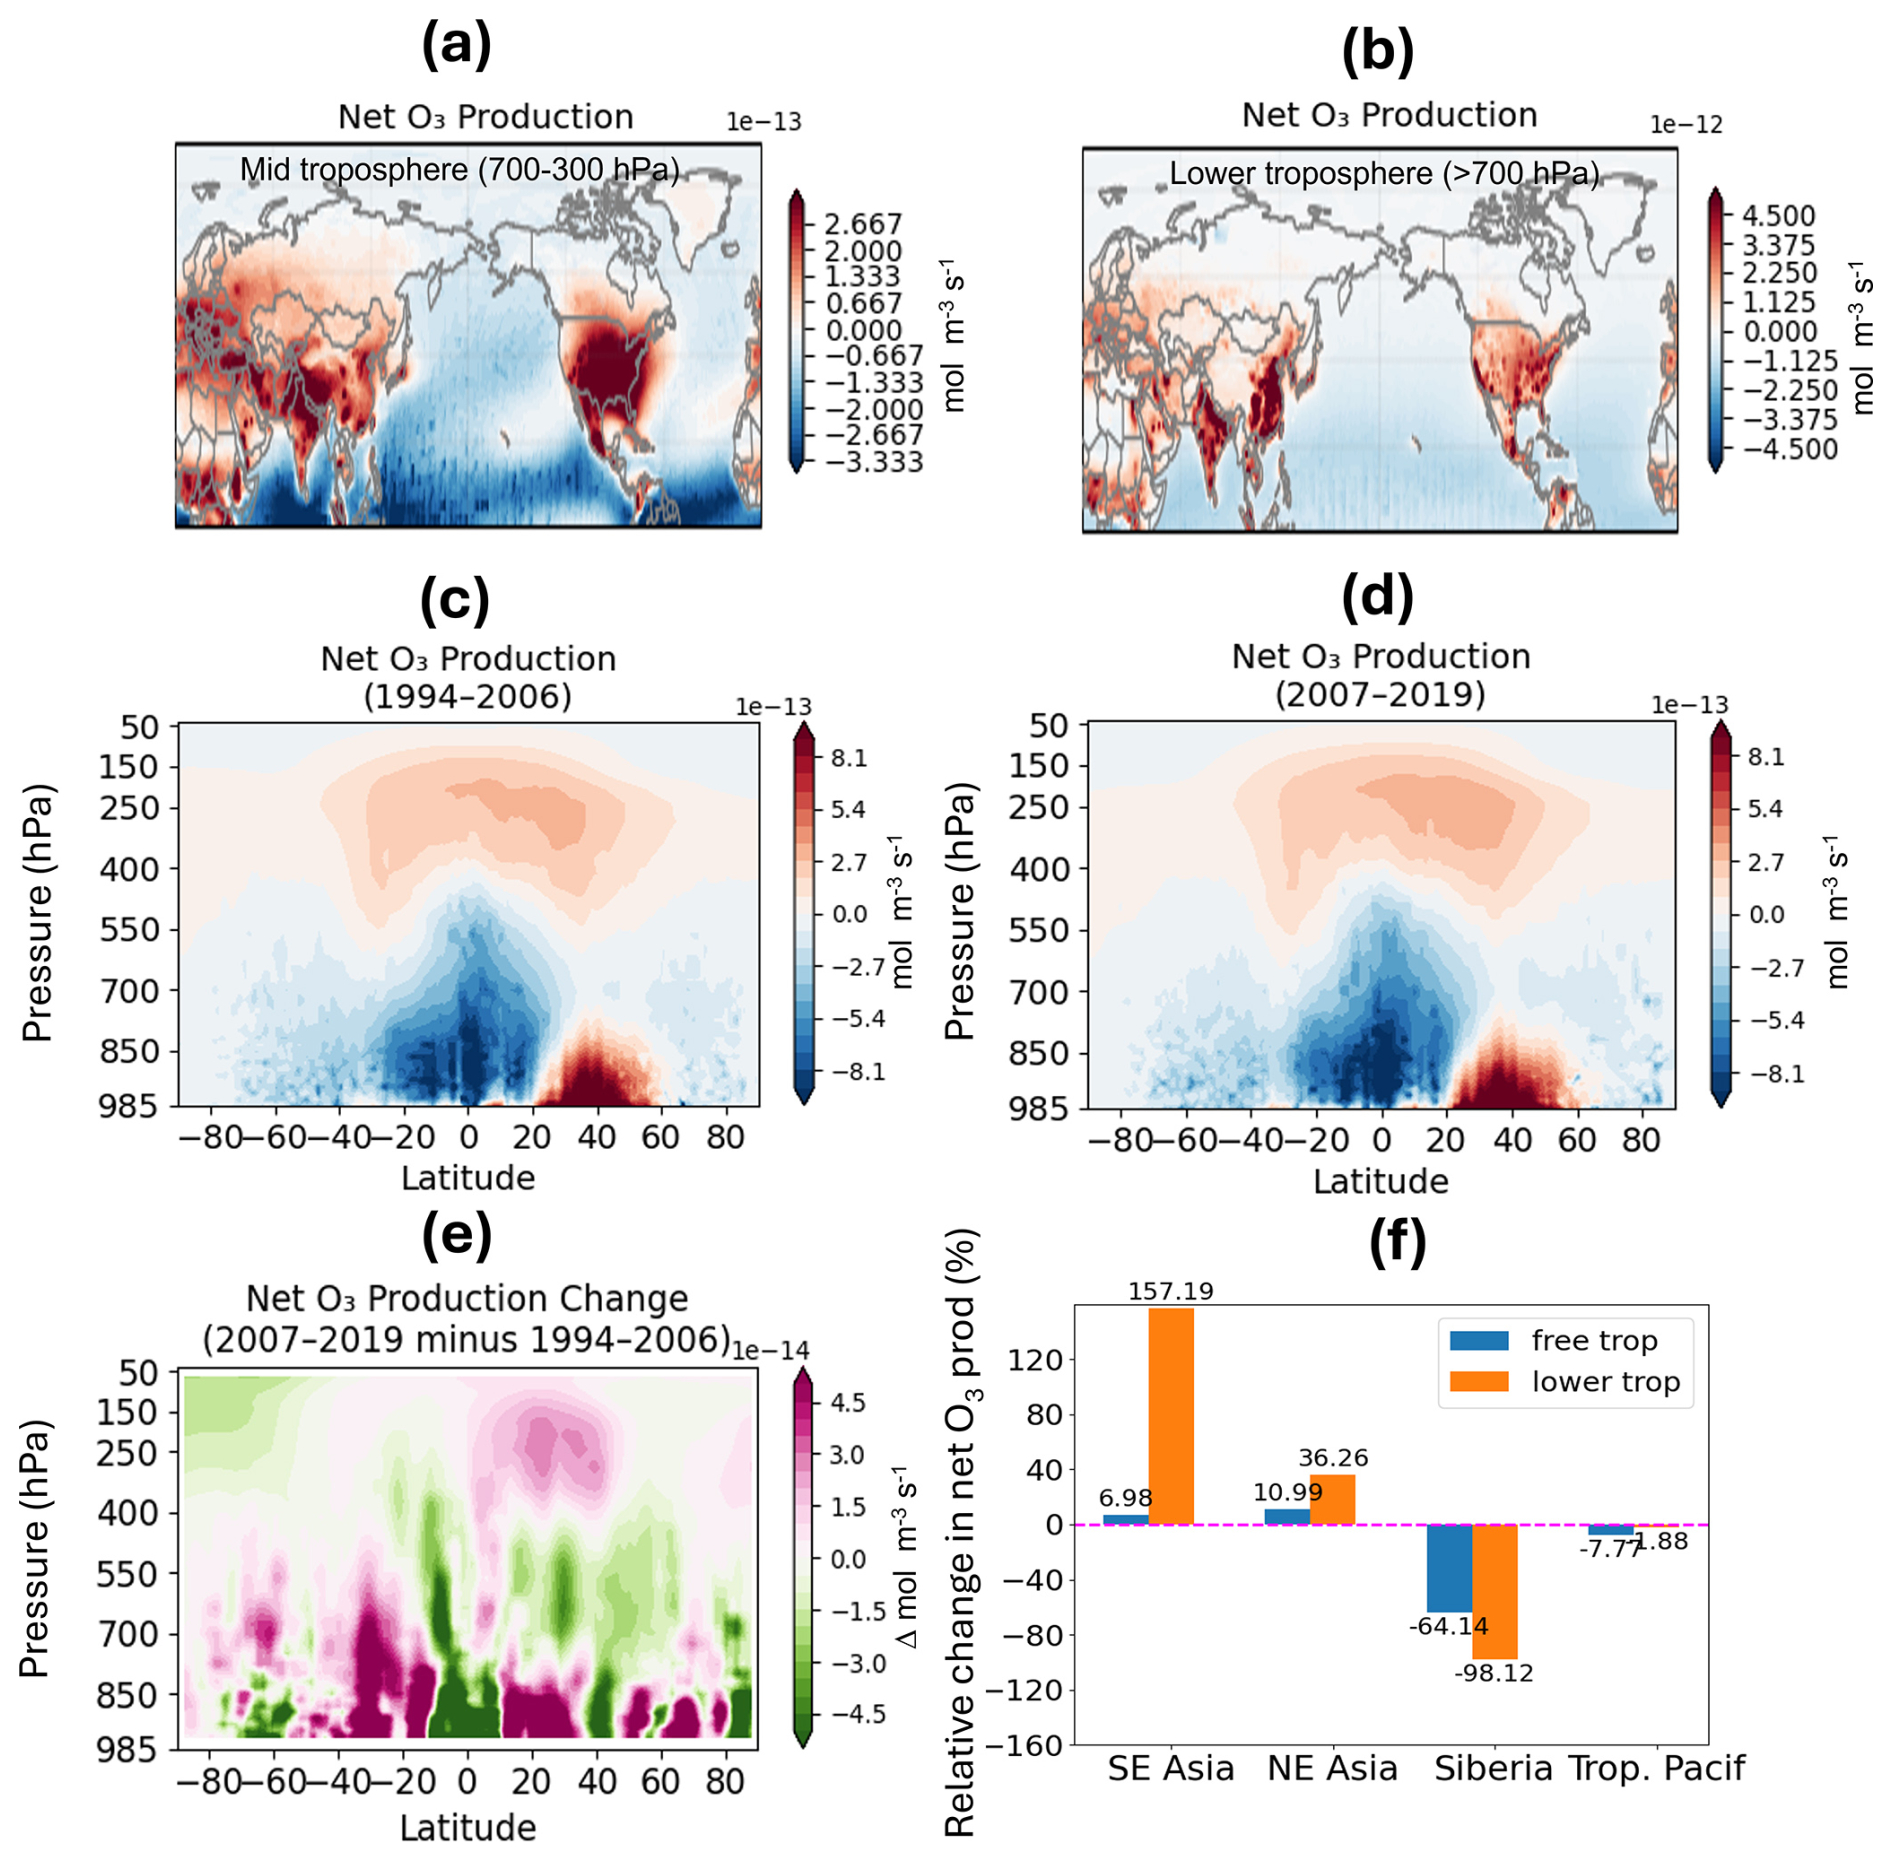
Figure 6(a) Map of GMI net chemical O3 production () in the (a) free-troposphere (700–288.88 hPa) and (b) lower troposphere (725–985 hPa) during 1994–2019. (c–e) Zonal-mean latitude–height cross sections of net O3 production during (c) the early period (P1: 1994–2006) and (d) the later period (P2: 2007–2019). (e) the difference from (d) to (c); contours are smoothed by averaging within a 5° latitude × 50 hPa grid cell. (f) relative percent change in zonal-mean GMI chemical net O3 production from P1 to P2.
To further assess temporal changes in net O3 production in the lower and free troposphere, we calculate the change in net O3 production between the early period (P1: 1994–2006) and the later period (P2: 2007–2019), as shown in Fig. 6e and f. The zonal-mean latitude–height cross sections of net O3 production during P1 and P2 reveal several key features: (i) a consistent positive net O3 production over 20–35° N in the lower troposphere during both periods (Figs. S5 and S6); (ii) a notable increase in net O3 production in the extended upper tropospheric and lower stratospheric region in recent years (pink color in Fig. 6e centered around 20° N and around 300–150 hPa) (P2, Fig. S6), along with a decrease in net O3 production over the tropical Pacific (green color extending up from the surface, centered on the equator). These results are broadly consistent with Archibald et al. (2020), who reported O3 production from the UK Chemistry and Aerosol Community Climate Model (UKCA; Luhar et al., 2018) for the year 2000. However, slight differences in the magnitude and pattern of extratropical zonal-mean net O3 production may stem from our study's longer analysis period (1994–2019) and the use of a different model. During the later period (P2), a significant increase and positive trend in ΔO3_netp (net O3 production difference) is observed, particularly at the low-tropospheric level over NE and SE Asia (Fig. S5), with the rate reaching up to ∼ 157 % over SE Asia (Fig. 6f).
O3 net production and destruction vary significantly by region (Fig. 6a and b), influenced by a combination of natural and human-caused factors. A study led by Thorp et al. (2021), for instance, found that in western Siberia, surface O3 is controlled by a dynamic interplay of seasonal atmospheric transport patterns, a dominant sink from dry deposition by forest vegetation, and the prevalence of anthropogenic emissions from the transport and energy sectors. However, note that this is the net O3 production in a particular model grid cell, and does not account for transport from the stratosphere, surface deposition or transport of O3 from one region to another.
Overall, Fig. 6 suggests that chemical ΔO3_netp over East Asia has shown a significant increase in recent years, particularly over SE Asia in the lower troposphere. To investigate the temporal evolution of O3 increases in more extended vertical layers, Fig. 7 illustrates the trends for O3 across the three vertical layers. In the tropics, tropospheric O3 exhibits an overall increasing trend, particularly over East Asia, consistent with the findings of Ziemke et al. (2019).
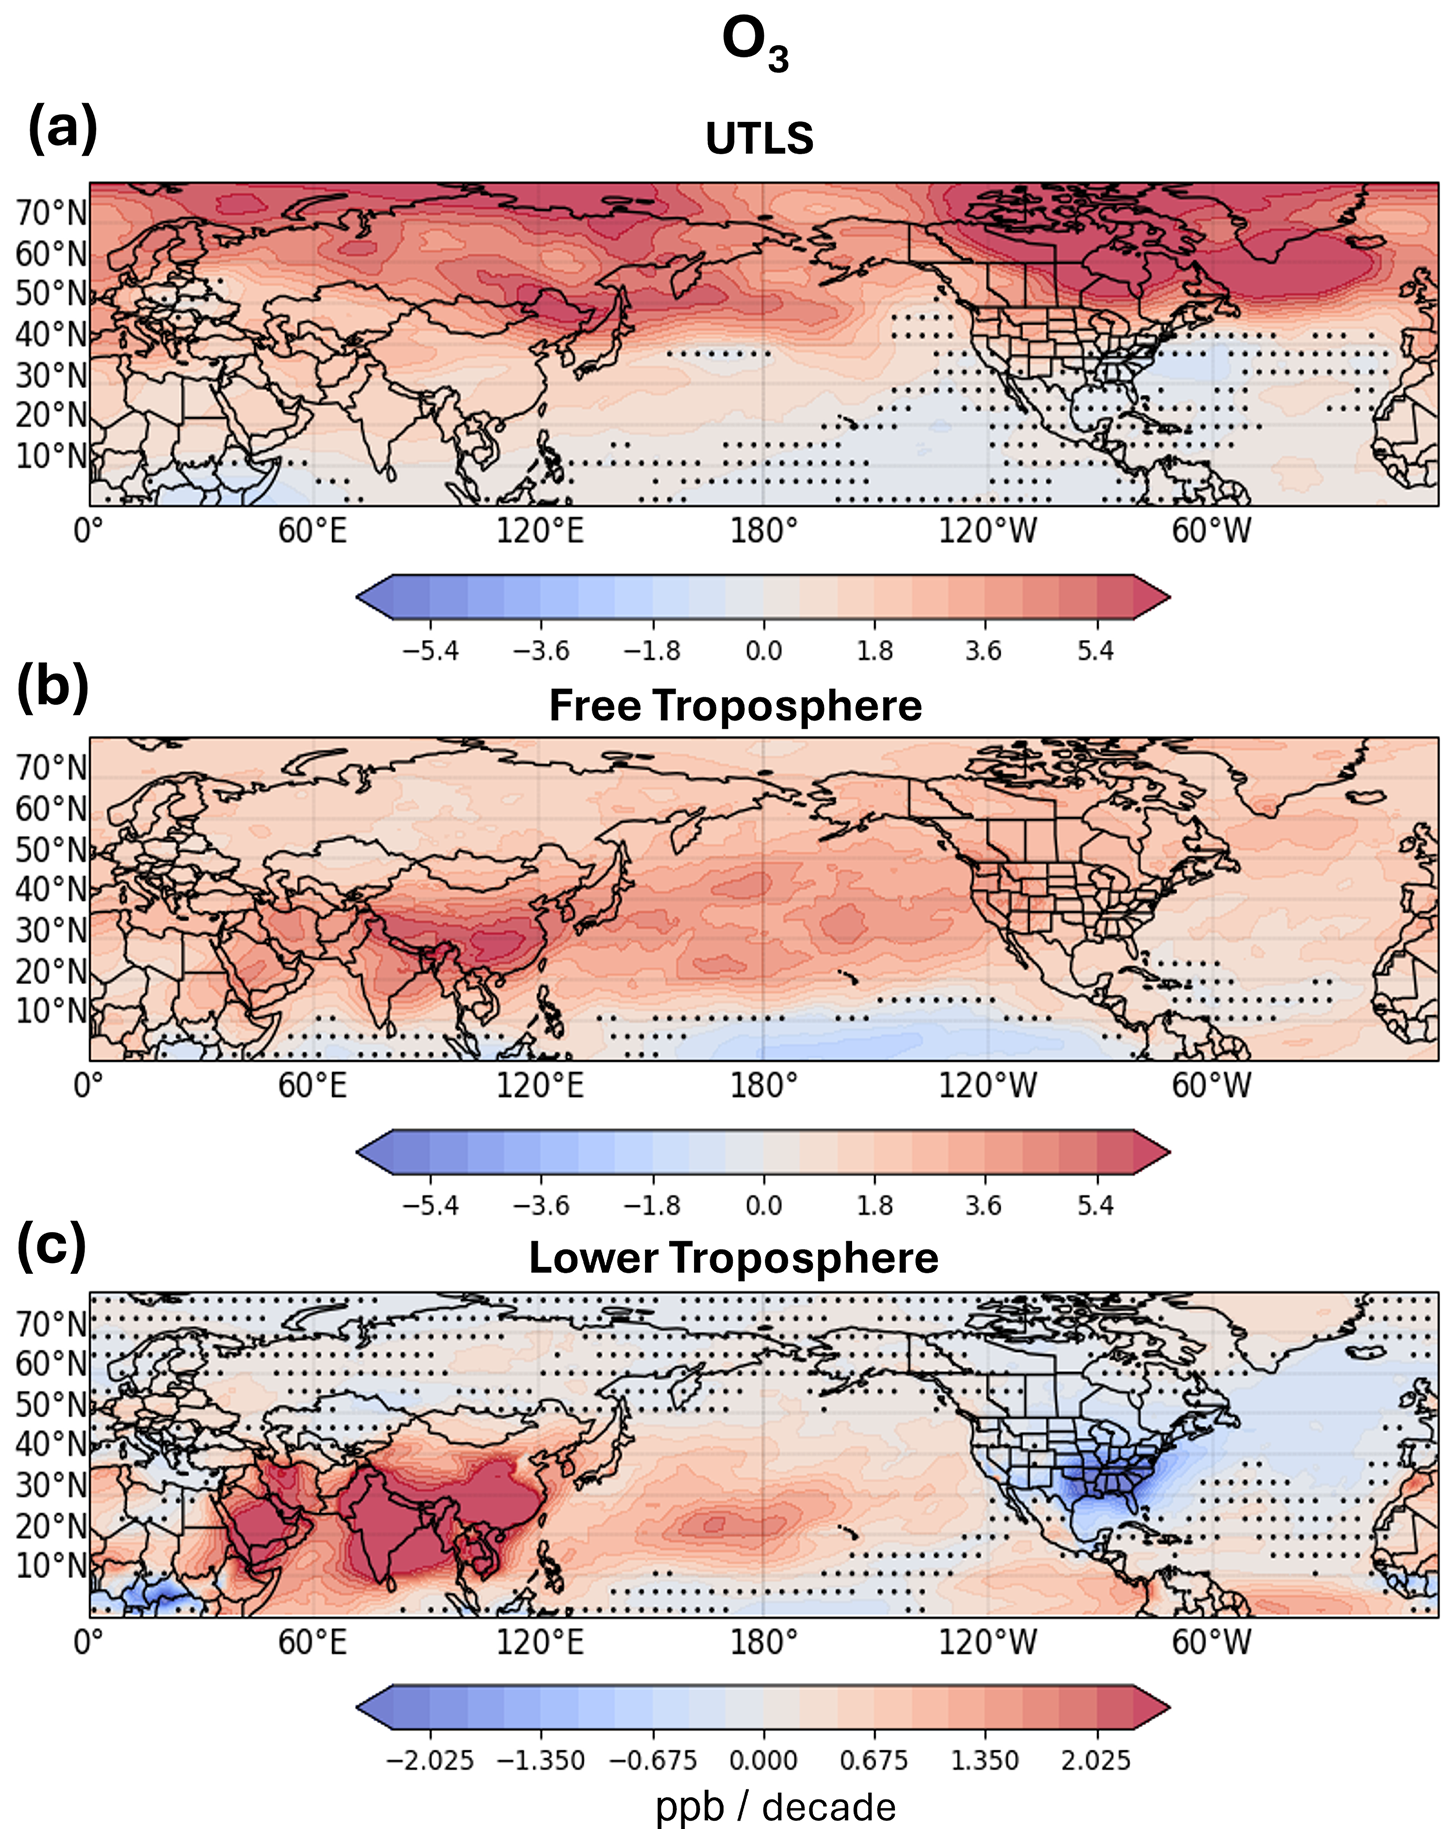
Figure 7GMI O3 trend (ppb per decade) in the (a) UTLS (244.88–176.93 hPa), (b) free troposphere (700–288.88 hPa), and (c) lower troposphere (725–985 hPa) calculated from 1994 and 2019. The dots on the maps represent the grid cells with a lower confidence value (p-value ≥ 0.05). The pressure shown here represents the midpoint of each GMI model level.
In the UTLS (Fig. 7a), O3 growth rates tend to increase at high latitudes, partially reflecting the influence of stratospheric processes. Conversely, large variability is observed in the extratropics due to a complex interplay between dynamic processes and O3 chemistry (Cooper et al., 2004; Bak et al., 2025). The pattern is different in the free troposphere with positive trends in O3 across most of the NH. Strongest increases stretch from South and East Asia across the North Pacific Ocean to WNA, while decreases are limited to the equatorial region (Fig. 7b). The increase in O3 growth rate in the free troposphere and the decrease in the lower troposphere shown in Fig. 7 are overall consistent with and supported by observed O3 trends (Chang et al., 2023a; Fig. S1). In addition, O3 shows increases over SE Asia and the Pacific Ocean but decreases over North America, aligning with IAGOS dataset trends reported by Gaudel et al. (2020). Similar patterns are also found in net O3 production trends (Figs. S5–S7).
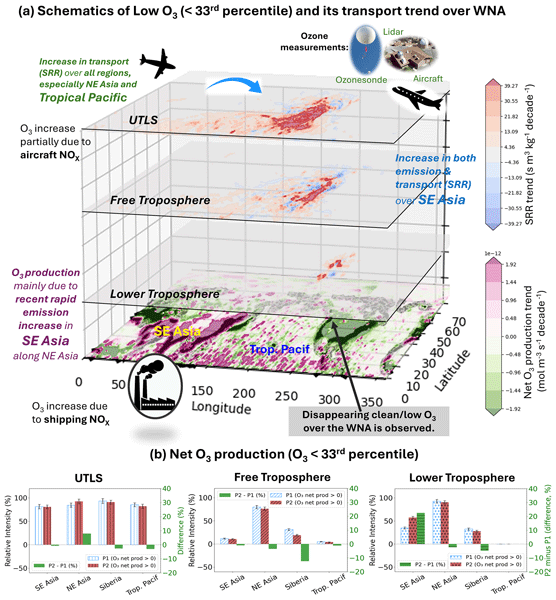
The schematics in Fig. 8 summarize our findings on the key regions contributing to low O3 over WNA. Regional net O3 production analysis indicates that SE Asia's contribution to low O3 (< 33rd percentile) levels over WNA – driven by both SRR and chemical production – has intensified in recent years (P2: 2007–2021) compared to the earlier period (P1: 1994–2006). This increase is most pronounced in the lower troposphere, where relative O3 production rose by approximately 23 % (Fig. 8b), with the highest positive net production centered over SE and NE Asia (Fig. S6). While net O3 production from SE Asia also increased within the free troposphere, the magnitude of change was less substantial (Fig. 8b). In contrast, the UTLS exhibits positive net O3 production across nearly all regions. This widespread increase is linked to rising aircraft emissions (Fig. 4) and enhanced SRR (Fig. 3) – a result consistent with the hemispheric-scale response described by Eastham et al. (2024). Notably, the tropical Pacific also shows entirely positive net O3 production within this upper layer.
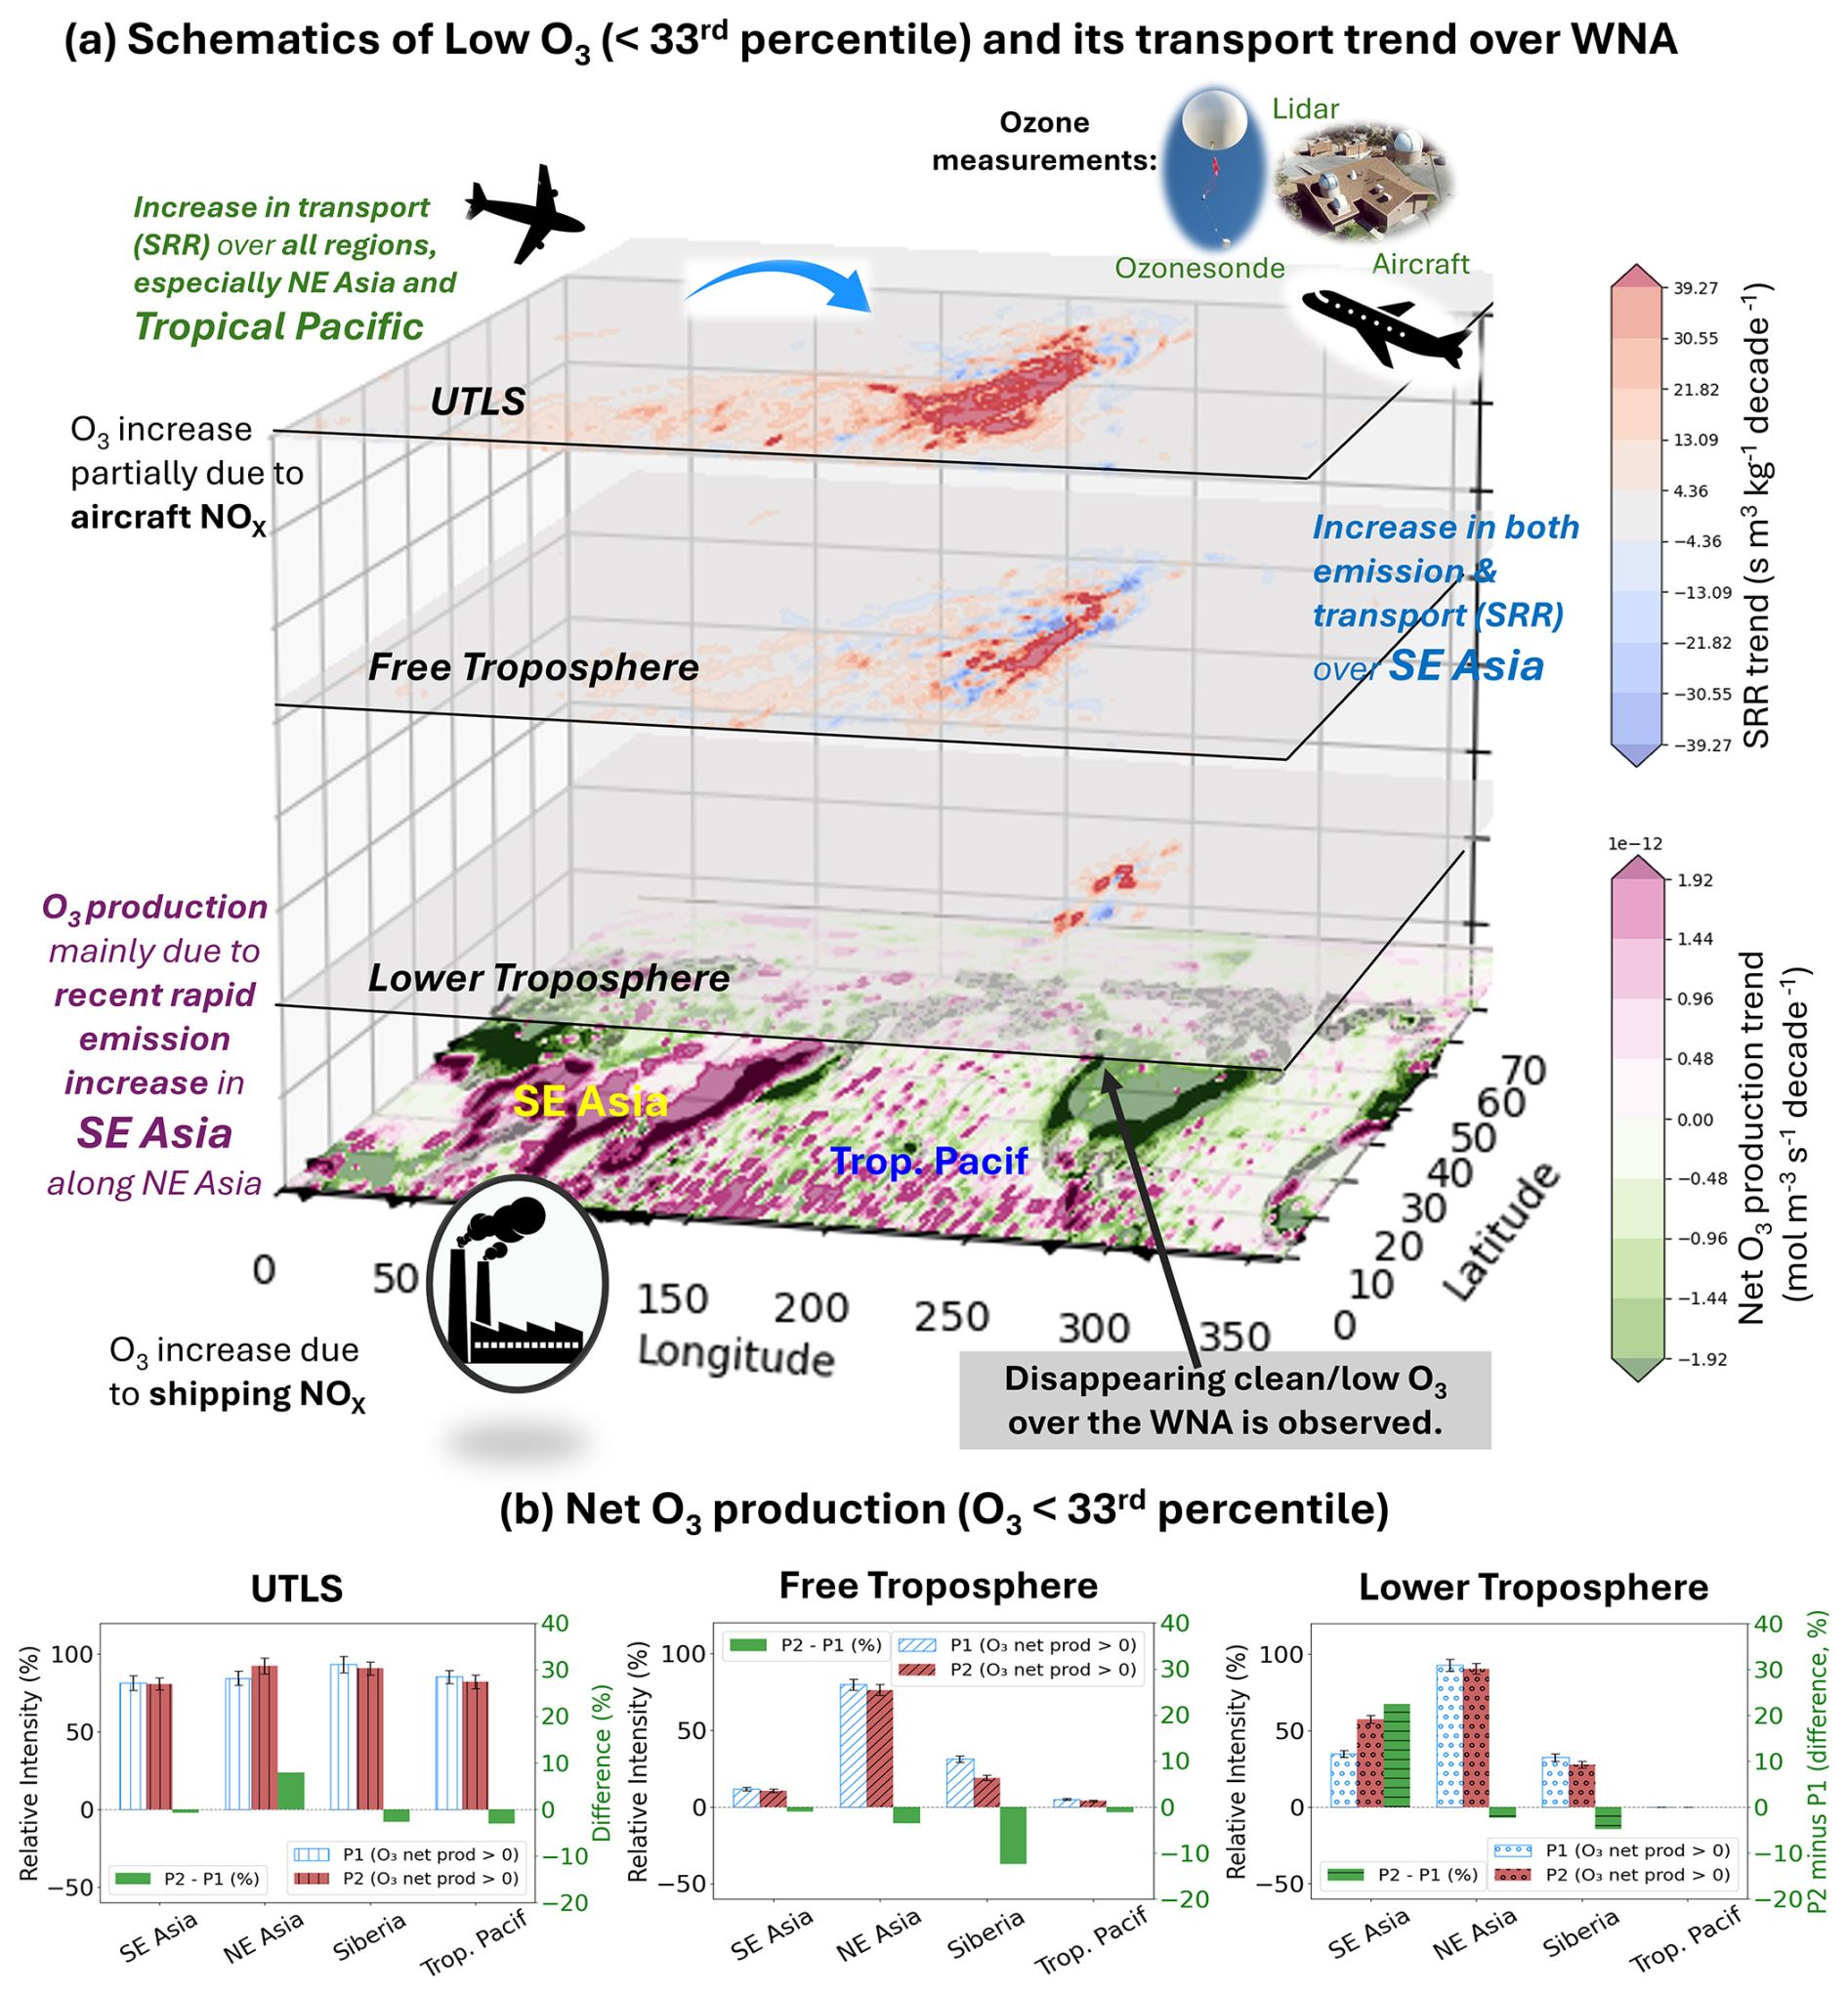
Figure 8(a) Trends in low O3 net production and transport (1994–2019). Decadal trends in net O3 production ( per decade) and transport (SRR; s m3 kg−1 per decade) specifically for the low O3 (< 33rd percentile) over western North America (WNA). (b) Normalized mean density of net O3 production associated with low O3 (< 33rd percentile) SRR, shown relative to the NH total across the (left) UTLS, (center) free troposphere, and (right) lower troposphere. Data are grouped by early (P1: 1994–2006; blue hatched) and later (P2: 2007–2019; brown hatched) periods, with their difference (P2–P1; green). Error bars indicate ± 1σ via bootstrap resampling.
There have been many studies linking rising emissions and increasing O3 in the tropics. Zhang et al. (2016) showed that increased O3 production in the tropics is driving the increase of O3 at mid-latitudes. This is consistent with our finding that positive net O3 production is also found across the UTLS, free-, and low tropospheric tropical region (∼ 5° N; Figs. 6 and 8). We also found that the influence of transport (SRR) tends to increase in the UTLS region for cases of both low and high O3 amounts (see Fig. 3).
Our analysis included the subtropical and mid-latitude regions, where atmospheric dynamics are more complex and not solely driven by convection, providing a broader, potentially dynamic impact on tropospheric O3 (Lin et al., 2014, 2015, 2017; Xue et al., 2021; Oman et al., 2011; 2013, Chandra et al., 1998; Ziemke et al., 2015; Cooper et al., 2013; Jeong et al., 2023). In this context, we also investigated the potential role of El Niño Southern Oscillation (ENSO) and Quasi Biannual Oscillation (QBO) effects on SRR and their impact on low tropospheric O3 over WNA, but with SRR only, we could not detect a significant influence (not shown). However, the role of emissions sectors, photochemical reactions during transport, climate variability, and meteorological factors (Xue et al., 2021) in both local and long-range transport warrants further exploration in future studies.
While we did not conduct a detailed investigation of seasonal variability in SRR, it was evident that SRR patterns shift northward from DJF (December–January–February) to JJA (June–July–August) due to synoptic variability and changes in the jet stream position (Figs. S8 and S9). For example, peak SRR and its variability align with the subtropical jet in DJF (∼ 30° N) but shift to the mid-latitude jet in JJA (∼ 45° N) (Fig. S9). Extended SRR and transport near the jet location are closely linked to O3 seasonality and variability. This aligns with Barnes and Fiore (2013), who found that a poleward shift in the jet stream results in a similar poleward shift in O3 variability, with lower standard deviations in O3 levels farther from the jet. The application of FLEXPART-ERA5 SRRs, along with our analysis method, could serve as a framework for future studies to further investigate seasonal variations in tropospheric O3 trends over WNA.
Regarding the increase in chemical O3 production, the increase in SE and NE Asia emissions, as shown in Fig. 6, coincides with a rapid rise in methane (CH4) concentrations (Nisbet et al., 2016, 2019). This trend may be linked to the overall increase in emissions across Asia (Kurokawa and Ohara, 2020) and a possible suppression of hydroxyl radical (OH) levels during that period. The CH4–OH feedback mechanism could have further contributed to rising CH4 concentrations (Zhao et al., 2020; He et al., 2026). However, given that the response of O3 to CH4 increases is relatively slow and modest (Fiore et al., 2008), further investigation is also needed. The chemical pathways involved in O3 formation are more complex and require further studies.
As discussed in Fig. 6, the increased O3 production in SE Asia is closely linked to rising anthropogenic emissions (Wang et al., 2022b; Li et al., 2023b; Li et al., 2024) and can largely be attributed to shipping as well as biomass burning (Fig. S2). A recent study by Liu et al. (2024) highlights the significant roles of biomass burning and urbanization in increasing NOx emissions over South, SE, and East Asia. Their findings, based on Ozone Monitoring Instrument (OMI) observations, indicate that biomass burning NOx emission levels are nearly double those reported in existing model inventories. As shown in Fig. S2, however, biomass-burning NOx from TCR-2 is relatively smaller than that from other sources, suggesting its overall impact is likely limited, although a more quantitative analysis is needed to assess its quantitative effect on O3.
We investigated the spatial and chemical origins of air parcels with observed low O3 over western North America (WNA; 25–55° N, 130–90° W) using the FLEXPART-ERA5 model for the period 1994–2021. We found that air masses associated with low O3 primarily originate from the tropical Pacific and Southeast (SE) Asia. While no clear long-term trends were identified in the source–receptor relationships (SRRs) for the lower and free troposphere, SRRs increased in the upper troposphere–lower stratosphere (UTLS; ∼ 8–13 km). This enhancement increases the potential influence of lightning (Cui et al., 2025) and aircraft emissions on low-O3 conditions over WNA.
Consistent with recent increases in aircraft emissions, the contribution of aviation to O3 over WNA under low-ozone conditions has strengthened. In addition, between 2007 and 2019, Global Model Initiative (GMI) simulations show a notable increase in net O3 chemical production over SE Asia, increasing up to 157 % in the lower troposphere and 7 % in the free troposphere. Furthermore, increasing SRRs from FLEXPART-ERA5 associated with positive net O3 chemical production over SE and Northeast (NE) Asia in the UTLS and free troposphere partially explain the observed increase in low O3 over WNA.
Another key novel contribution of our study is the focus on distinct O3 levels (based on percentiles) rather than the entire O3 distribution, with the significant finding that in the free troposphere, ozone amounts over WNA are increasing in even the smallest O3 percentiles – a trend closely linked to rising emissions in SE Asia. For example, during 2007–2021, the positive net O3 production associated with low O3 (< 33rd percentile) has increased by about 23 % over SE Asia in the lower troposphere. Additionally, we found consistently positive O3 production over the Tropical Pacific, with longer SRR affecting lesser O3 values over WNA. This coincides with increasing shipping emissions in the lower troposphere and aircraft emissions in the UTLS of the tropical Pacific.
We also extend the springtime analysis of Cooper et al. (2010) by incorporating the whole year (Fig. S3 with providing seasonal variation) and a longer study period, demonstrating a continuing trend of Asian emission influence on O3 levels over WNA. Our findings also highlight a distinctly different transport pattern, with enhanced transport from NE Asia contributing to high O3 levels over WNA. Furthermore, our combined analysis of SRR and chemical processes underscores the importance of monitoring O3 transport in conjunction with changes in atmospheric circulation, long-range transport, and shifts in both local and remote anthropogenic emissions at regional and global scales.
Finally, the gridded O3 database developed in this study – derived from a wide range of tropospheric O3 measurements (900–300 hPa) and combined with backward Lagrangian transport model simulations using FLEXPART-ERA5 (Cui et al., 2025) – enables investigation of the source regions associated with different O3 percentiles observed over WNA.
The data used in this study are openly available at the following URL/DOI: ERA5 meteorological reanalysis data are available from the Copernicus Climate Change Service (https://cds.climate.copernicus.eu/datasets, last access: 15 September 2026). The Tropospheric Chemistry Reanalysis (TCR-2) data for 2005–2021 is freely available at https://doi.org/10.25966/9qgv-fe81 (Miyazaki et al., 2019a). The MERRA-2 GMI simulation is available at https://acd-ext.gsfc.nasa.gov/Projects/GEOSCCM/MERRA2GMI/ (last access: 15 September 2026) (Ziemke et al., 2019) CEDS Aircraft Emissions (Version 2021-04-21) gridded over a 0.5° latitude × 0.5° longitude grid, with 25 altitude levels are available on https://doi.org/10.5281/zenodo.7846185 (Prime et al., 2023). The FLEXPART-ERA5 model outputs both daily and monthly data, associated receptor data, and post-processing scripts is available at NASA's ASDC (https://doi.org/10.5067/ASDC/WNA-BackTraj, Cui et al., 2025).
The supplement related to this article is available online at https://doi.org/10.5194/acp-26-13595-2026-supplement.
LI, JR, YC, MJ, and OC conceptualized and designed the research. YC and JR carried out the experiments, with initial field data collected and processed by KC and EY. YC developed and executed the model simulations, while JR conducted the data analysis and visualization. JR prepared the manuscript with contributions and revisions from all co-authors.
The contact author has declared that none of the authors has any competing interests.
Publisher's note: Copernicus Publications remains neutral with regard to jurisdictional claims made in the text, published maps, institutional affiliations, or any other geographical representation in this paper. The authors bear the ultimate responsibility for providing appropriate place names. Views expressed in the text are those of the authors and do not necessarily reflect the views of the publisher.
This work is supported at NASA Ames Research Center. We thank the NASA ACCDAM program for providing support and resources (20-ACCDAM20-0083). The authors would like to acknowledge the NASA High-End Computing (HEC) Program through the NASA Advanced Supercomputing (NAS) Division at Ames Research Center (award SMD-20-28429430). Kai-Lan Chang acknowledges additional support from NOAA cooperative agreement NA22OAR4320151. IAGOS data were created with support from the European Commission, national agencies in Germany (BMBF), France (MESR), and the UK (NERC), and the IAGOS member institutions (https://www.iagos.org/, last access: 15 September 2026). The participating airlines (Lufthansa, Air France, Austrian, China Airlines, Hawaiian Airlines, Air Canada, Iberia, Eurowings Discover, Cathay Pacific, Air Namibia, Sabena) supported IAGOS by carrying the measurement equipment free of charge since 1994. The data are available at http://www.iagos.fr (last access: 15 September 2026) thanks to additional support from AERIS. We also acknowledge NASA Award 80NSSC23M0230.
This research has been supported by the National Aeronautics and Space Administration (grant nos. 20-ACCDAM20-0083 and SMD-20-28429430) and the National Oceanic and Atmospheric Administration (grant no. NA22OAR4320151).
This paper was edited by Benjamin A Nault and reviewed by Juseon Bak and one anonymous referee.
Ansari, T., Nalam, A., Lupaşcu, A., Hinz, C., Grasse, S., and Butler, T.: Explaining trends and changing seasonal cycles of surface ozone in North America and Europe over the 2000–2018 period: a global modelling study with NOx and VOC tagging, Atmos. Chem. Phys., 25, 16833–16876, https://doi.org/10.5194/acp-25-16833-2025, 2025.
Archibald, A. T., Neu, J. L., Elshorbany, Y., Cooper, O. R., Young, P. J., Akiyoshi, H., Cox, R. A., Coyle, M., Derwent, R., Deushi, M., Finco, A., Frost, G. J., Galbally, I. E., Gerosa, G., Granier, C., Griffiths, P. T., Hossaini, R., Hu, L., Jöckel, P., Josse, B., Lin, M. Y., Mertens, M., Morgenstern, O., Naja, M., Naik, V., Oltmans, S., Plummer, D. A., Revell, L. E., Saiz-Lopez, P., Saxena, P., Shin, Y. M., Shahid, I., Shallcross, D., Tilmes, S., Trickl, T., Wallington, T. J., Wang, T., Worden, H. M., and Zeng, G.: Tropospheric Ozone Assessment Report: A critical review of changes in the tropospheric ozone burden and budget from 1850 to 2100, Elem. Sci. Anth., 8, 1, https://doi.org/10.1525/elementa.2020.034, 2020.
Asman, W. A. H., Lawrence, M. G., Brenninkmeijer, C. A. M., Crutzen, P. J., Cuijpers, J. W. M., and Nédélec, P.: Rarity of upper-tropospheric low O3 mixing ratio events during MOZAIC flights, Atmos. Chem. Phys., 3, 1541–1549, https://doi.org/10.5194/acp-3-1541-2003, 2003.
Bak, J., Kim, J., Koo, H., Pan, L. L., Ryoo, M., Newman, P. A., Franchin, A., Liu, X., Abad, G. G., Lee, J., Jeon, W., and Kim, H.: An Integrated Analysis of Ozone and Carbon Monoxide Over the Western Pacific Using Satellite and Aircraft Measurements During the ACCLIP Summer Campaign 2022, J. Geophys. Res.-Atmos., 130, e2024JD042771, https://doi.org/10.1029/2024JD042771, 2025.
Barnes, E. A. and Fiore, A. M.: Surface ozone variability and the jet position: Implications for projecting future air quality, Geophys. Res. Lett., 40, 2839–2844, https://doi.org/10.1002/grl.50411, 2013.
Boulanger, D., Thouret, V., and Petzold, A.: In-service Aircraft for a Global Observing System (IAGOS) Data Portal , IAGOS [data set], https://doi.org/10.25326/20, 2022.
Brauer, M., Freedman, G., Frostad, J., van Donkelaar, A., Martin, R. V., Dentener, F., van Dingenen, R., Estep, K., Amini, H., Apte, J. S., Balakrishnan, K., Barregard, L., Broday, D., Feigin, V., Ghosh, S., Hopke, P. K., Knibbs, L. D., Kokubo, Y., Liu, Y., Ma, S., Morawska, L., Sangrador, J. L., Shaddick, G., Anderson, H. R., Vos, T., Forouzanfar, M. H., Burnett, R. T., and Cohen, A.: Ambient Air Pollution Exposure Estimation for the Global Burden of Disease 2013, Environ. Sci. Technol., 50, 79–88, https://doi.org/10.1021/acs.est.5b03709, 2016.
Chandra, S., Ziemke, J. R., Min, W., and Read, W. G.: Effects of 1997–1998 El Niño on tropospheric ozone and water vapor, Geophys. Res. Lett., 25, 3867–3870, 1998.
Chang, K.-L., Cooper, O. R., Gaudel, A., Petropavlovskikh, I., and Thouret, V.: Statistical regularization for trend detection: an integrated approach for detecting long-term trends from sparse tropospheric ozone profiles, Atmos. Chem. Phys., 20, 9915–9938, https://doi.org/10.5194/acp-20-9915-2020, 2020.
Chang, K.-L., Cooper, O. R., Gaudel, A., Allaart, G., Ancellet, G., Clark, H., Godin-Beekmann, S., Leblanc, T., Van Malderen, R., Nédélec, P., Petropavlovskikh, I., Steinbrecht, W., Stübi, R., Tarasick, D. W., and Torres, C.: Impact of the COVID-19 economic downturn on tropospheric ozone trends: an uncertainty weighted data synthesis for quantifying regional anomalies above western North America and Europe, AGU Advances, 3, e2021AV000542, https://doi.org/10.1029/2021AV000542, 2022.
Chang, K.-L., Cooper, O. R., Rodriguez, G., Iraci, L. T., Yates, E. L., Johnson, M. S., and West, J. J.: Diverging ozone trends above western North America: Boundary layer decreases versus free tropospheric increases, J. Geophys. Res.-Atmos., 128, e2022JD038090, https://doi.org/10.1029/2022JD038090, 2023a.
Chang, K.-L., Schultz, M. G., Koren, G., and Selke, N.: Guidance note on best statistical practices for TOAR analyses, arXiv [preprint], https://doi.org/10.48550/arXiv.2304.14236, 2023b.
Chang, K.-L., Cooper, O. R., Gaudel, A., Petropavlovskikh, I., Effertz, P., Morris, G., and McDonald, B. C.: Technical note: Challenges in detecting free tropospheric ozone trends in a sparsely sampled environment, Atmos. Chem. Phys., 24, 6197–6218, https://doi.org/10.5194/acp-24-6197-2024, 2024.
Chang, K.-L., McDonald, B. C., Harkins, C., and Cooper, O. R.: Surface ozone trend variability across the United States and the impact of heat waves (1990–2023), Atmos. Chem. Phys., 25, 5101–5132, https://doi.org/10.5194/acp-25-5101-2025, 2025.
Chen, Y.-C.: A Tutorial on Kernel Density Estimation and Recent Advances, Biostatistics & Epidemiology, 1, 161–187, https://doi.org/10.1080/24709360.2017.1396742, 2017.
Cohen, Y., Petetin, H., Thouret, V., Marécal, V., Josse, B., Clark, H., Sauvage, B., Fontaine, A., Athier, G., Blot, R., Boulanger, D., Cousin, J.-M., and Nédélec, P.: Climatology and long-term evolution of ozone and carbon monoxide in the upper troposphere–lower stratosphere (UTLS) at northern midlatitudes, as seen by IAGOS from 1995 to 2013, Atmos. Chem. Phys., 18, 5415–5453, https://doi.org/10.5194/acp-18-5415-2018, 2018.
Colombi, N. K., Jacob, D. J., Yang, L. H., Zhai, S., Shah, V., Grange, S. K., Yantosca, R. M., Kim, S., and Liao, H.: Why is ozone in South Korea and the Seoul metropolitan area so high and increasing?, Atmos. Chem. Phys., 23, 4031–4044, https://doi.org/10.5194/acp-23-4031-2023, 2023.
Cooper, M. J., Martin, R. V., Livesey, N. J., Degenstein, D. A., and Walker, K. A.: Analysis of satellite remote sensing observations of low ozone events in the tropical upper troposphere and links with convection, Geophys. Res. Lett., 40, 3761–3765, https://doi.org/10.1002/grl.50698, 2013.
Cooper, O. R., Forster, C., Parrish, D., Dunlea, E., Hübler, G., Fehsenfeld, F., Holloway, J., Oltmans, S., Johnson, B., Wimmers, A., and Horowitz, L.: On the life-cycle of a stratospheric intrusion and its dispersion into polluted warm conveyor belts, J. Geophys. Res., 109, D23S09, https://doi.org/10.1029/2003JD004006, 2004.
Cooper, O. R., Parrish, D. D., Stohl, A., Trainer, M., Nédélec, P., Thouret, V., Cammas, J. P., Oltmans, S. J., Johnson, B. J., Tarasick, D., Leblanc, T., McDermid, I. S., Jaffe, D., Gao, R., Stith, J., Ryerson, T., Aikin, K., Campos, T., Weinheimer, A., and Avery, M. A.: Increasing springtime ozone mixing ratios in the free troposphere over western North America, Nature, 463, 344–348, https://doi.org/10.1038/nature08708, 2010.
Cooper, O. R., Parrish, D. D., Ziemke, J., Balashov, N. V., Cupeiro, M., Galbally, I. E., Gilge, S., Horowitz, L., Jensen, N. R., Lamarque, J.-F., Naik, V., Oltmans, S. J., Schwab, J., Shindell, D. T., Thompson, A. M., Thouret, V., Wang, Y., and Zbinden, R. M.: Global distribution and trends of tropospheric ozone: An observation-based review, Elem. Sci. Anth., 2, 000029, https://doi.org/10.12952/journal.elementa.000029, 2014.
Cooper, O. R., Schultz, M. G., Schröder, S., Chang, K.-L., Gaudel, A., Carbajal Benítez, G., Cuevas, E., Fröhlich, M., Galbally, I. E., Kubistin, D., Lu, X., McClure-Begley, A., Molloy, S., Nédélec, P., O'Brien, J., Oltmans, S. J., Petropavlovskikh, I., Ries, L., Senik, I., Sjöberg, K., Solberg, S., Spain, T. G., Spangl, W., Steinbacher, M., Tarasick, D., Thouret, V., and Xu, X.: Multi-decadal surface ozone trends at globally distributed remote locations, Elem. Sci. Anth., 8, 23, https://doi.org/10.1525/elementa.420, 2020.
Cooper, O. R., Ziemke, J. R., and Chang, K.-L.: Tropospheric Ozone [in “State of the Climate in 2023”], B. Am. Meteorol. Soc., 105, S94–S96, https://doi.org/10.1175/BAMS-D-24-0116.1, 2024.
Cui, Y. Y., Ryoo, J.-M., Johnson, M. S., Chang, K.-L., Yates, E. L., Cooper, O. R., and Iraci, L. T.: Global source–receptor-relationship database for integrated tropospheric ozone observations from multiplatform datasets in western North America during 1994–2021, [data set], https://doi.org/10.5067/ASDC/WNA-BackTraj, 2025.
Cui, Y. Y., Ryoo, J.-M., Johnson, M. S., Chang, K.-L., Yates, E. L., Cooper, O. R., and Iraci, L. T.: Global source–receptor-relationship database for integrated tropospheric ozone observations from multiplatform datasets in western North America during 1994–2021, Earth Syst. Sci. Data, 17, 5903–5914, https://doi.org/10.5194/essd-17-5903-2025, 2025.
Davies, W. E., Vaughan, G., and O'Connor, F. M.: Observation of near-zero ozone concentrations in the upper troposphere at mid-latitudes, Geophys. Res. Lett., 25, 1173–1176, 1998.
Elshorbany, Y., Ziemke, J. R., Strode, S., Petetin, H., Miyazaki, K., De Smedt, I., Pickering, K., Seguel, R. J., Worden, H., Emmerichs, T., Taraborrelli, D., Cazorla, M., Fadnavis, S., Buchholz, R. R., Gaubert, B., Rojas, N. Y., Nogueira, T., Salameh, T., and Huang, M.: Tropospheric ozone precursors: global and regional distributions, trends, and variability, Atmos. Chem. Phys., 24, 12225–12257, https://doi.org/10.5194/acp-24-12225-2024, 2024.
Eastham, S. D., Chossière, G. P., Speth, R. L., Jacob, D. J., and Barrett, S. R. H.: Global impacts of aviation on air quality evaluated at high resolution, Atmos. Chem. Phys., 24, 2687–2703, https://doi.org/10.5194/acp-24-2687-2024, 2024.
Environment and Climate Change Canada: Canadian ozonesonde network, World Ozone and Ultraviolet Radiation Data Centre (WOUDC), https://hegiftom.meteo.be/datasets/ozonesondes (last access: 15 September 2026), 2022.
Fiore, A. M., West, J. J., Horowitz, L. W., Naik, V., and Schwarzkopf, M. D.: Characterizing the tropospheric ozone response to methane emission controls and the benefits to climate and air quality, J. Geophys. Res., 113, D08307, https://doi.org/10.1029/2007JD009162, 2008.
Fiore, A. M., Hancock, S. E., Lamarque, J.-F., Correa, G. P., Chang, K.-L., Ru, M., Cooper, O. R., Gaudel, A., Polvani, L. M., Sauvage, B., and Ziemke, J. R.: Understanding recent tropospheric ozone trends in the context of large internal variability: A new perspective from chemistry-climate model ensembles, Environ. Res. Climate, 1, 025008, https://doi.org/10.1088/2752-5295/ac9cc2, 2022.
Fleming, Z. L., Doherty, R. M., von Schneidemesser, E., Malley, C. S., Cooper, O. R., Pinto, J. P., Colette, A., Xu, X., Simpson, D., Schultz, M. G., Lefohn, A. S., Hamad, S., Moolla, R., Solberg, S., and Feng, Z.: Tropospheric Ozone Assessment Report: Present-day ozone distribution and trends relevant to human health, Elem. Sci. Anth., 6, 12, https://doi.org/10.1525/elementa.273, 2018.
Froidevaux, L., Kinnison, D. E., Gaubert, B., Schwartz, M. J., Livesey, N. J., Read, W. G., Bardeen, C. G., Ziemke, J. R., and Fuller, R. A.: Tropical upper-tropospheric trends in ozone and carbon monoxide (2005–2020): observational and model results, Atmos. Chem. Phys., 25, 597–624, https://doi.org/10.5194/acp-25-597-2025, 2025.
Gaudel, A., Cooper, O. R., Chang, K.-L., Bourgeois, I., Ziemke, J. R., Strode, S. A., Oman, L. D., Sellitto, P., Nédélec, P., Blot, R., Thouret, V., and Granier, C.: Aircraft observations since the 1990s reveal increases of tropospheric ozone at multiple locations across the Northern Hemisphere, Sci. Adv., 6, eaba8272, https://doi.org/10.1126/sciadv.aba8272, 2020.
Gaudel, A., Bourgeois, I., Li, M., Chang, K.-L., Ziemke, J., Sauvage, B., Stauffer, R. M., Thompson, A. M., Kollonige, D. E., Smith, N., Hubert, D., Keppens, A., Cuesta, J., Heue, K.-P., Veefkind, P., Aikin, K., Peischl, J., Thompson, C. R., Ryerson, T. B., Frost, G. J., McDonald, B. C., and Cooper, O. R.: Tropical tropospheric ozone distribution and trends from in situ and satellite data, Atmos. Chem. Phys., 24, 9975–10000, https://doi.org/10.5194/acp-24-9975-2024, 2024.
Gelaro, R., McCarty, W., Suárez, M. J., Todling, R., Molod, A.,Takacs, L., Randles, C. A., Darmenov, A., Bosilovich, M. G., Reichle, R., Wargan, K., Coy, L., Cullather, R., Draper, C., Akella, S., Buchard, V., Conaty, A., da Silva, A. M., Gu, W., Kim, G.-K., Koster, R., Lucchesi, R., Merkova, D., Nielsen, J. E., Partyka, G., Pawson, S., Putman, W., Rienecker, M., Schubert, S. D., Sienkiewicz, M., and Zhao, B.: The Modern-Era Retrospective Analysis for Research and Applications, Version 2 (MERRA-2), J. Climate, 30, 5419–5454, https://doi.org/10.1175/JCLI-D-16-0758.1, 2017.
Grant, W. B., Browell, E. V., Butler, C. F., Fenn, M. A., Clayton, M. B., Hannan, J. R., Fuelberg, H. E., Blake, D. R., Blake, N. J., Gregory, G. L., Heikes, B. G., Sachse, G. W., Singh, H. B., Snow, J., and Talbot, R. W.: A case study of transport of tropical marine boundary layer and lower tropospheric air masses to the northern midlatitude upper troposphere, J. Geophys. Res., 105, 3757–3769, 2000.
Gressent, A., Sauvage, B., Defer, E., Pätz, H. W., Thomas, K., Holle, R., Cammas, J.-P., Nédélec, P., Boulanger, D., Thouret, V., and Volz-Thomas, A.: Lightning NOx influence on large-scale NOy and O3 plumes observed over the northern mid-latitudes, Tellus B, 66, 25544, https://doi.org/10.3402/tellusb.v66.25544, 2014.
Gulev, S. K., Thorne, P. W., Ahn, J., Dentener, F. J., Domingues, C. M., Gerland, S., Gong, D., Kaufman, D. S., Nnamchi, H. C., Quaas, J., Rivera, J. A., Sathyendranath, S., Smith, S. L., Trewin, B., von Schuckmann, K., and Vose, R. S.: Changing State of the Climate System, in: Climate Change 2021: The Physical Science Basis. Contribution of Working Group I to the Sixth Assessment Report of the Intergovernmental Panel on Climate Change, edited by: Masson-Delmotte, V., Zhai, P., Pirani, A., Connors, S. L., Péan, C., Berger, S., Caud, N., Chen, Y., Goldfarb, L., Gomis, M. I., Huang, M., Leitzell, K., Lonnoy, E., Matthews, J. B. R., Maycock, T. K., Waterfield, T., Yelekçi, O., Yu, R., and Zhou, B., Cambridge University Press, Cambridge, UK and New York, NY, USA, 287–422, https://doi.org/10.1017/9781009157896.004, 2021.
He, J., Naik, V., and Horowitz, L. W.: Interpreting changes in global methane budget in a chemistry-climate model constrained with methane and isotopic observations, AGU Advances, 7, e2025AV001822. https://doi.org/10.1029/2025AV001822, 2026.
Hersbach, H., Bell, B., Berrisford, P., Hirahara, S., Horányi, A., Muñoz-Sabater, J., Nicolas, J., Peubey, C., Radu, R., Schepers, D., Simmons, A., Soci, C., Abdalla, S., Abellan, X., Balsamo, G., Bechtold, P., Biavati, G., Bidlot, J., Bonavita, M., De Chiara, G., Dahlgren, P., Dee, D., Diamantakis, M., Dragani, R., Flemming, J., Forbes, R., Fuentes, M., Geer, A., Haimberger, L., Healy, S., Hogan, R. J., Hólm, E., Janisková, M., Keeley, S., Laloyaux, P., Lopez, P., Lupu, C., Radnoti, G., de Rosnay, P., Rozum, I., Vamborg, F., Villaume, S., and Thépaut, J.-N.: The ERA5 global reanalysis, Q. J. Roy. Meteor. Soc., 146, 1999–2049, https://doi.org/10.1002/qj.3803, 2020.
Hoesly, R. M., Smith, S. J., Feng, L., Klimont, Z., Janssens-Maenhout, G., Pitkanen, T., Seibert, J. J., Vu, L., Andres, R. J., Bolt, R. M., Bond, T. C., Dawidowski, L., Kholod, N., Kurokawa, J.-I., Li, M., Liu, L., Lu, Z., Moura, M. C. P., O'Rourke, P. R., and Zhang, Q.: Historical (1750–2014) anthropogenic emissions of reactive gases and aerosols from the Community Emissions Data System (CEDS), Geosci. Model Dev., 11, 369–408, https://doi.org/10.5194/gmd-11-369-2018, 2018.
Iraci, L. and Yates, E.: Alpha Jet Atmospheric eXperiment, NASA Langley Atmospheric Science Data Center Distributed Active Archive Center [data set], https://doi.org/10.5067/ASDC/AJAX_O3, 2021.
Jacob, D. J., Logan, J. A., and Murti, P. P.: Effect of rising Asian emissions on surface ozone in the United States, Geophys. Res. Lett., 26, 2175–2178, https://doi.org/10.1029/1999GL900450, 1999.
Jaffe, D. A., Cooper, O. R., Fiore, A. M., Henderson, B. H., Tonnesen, G. S., Russell, A. G., Henze, D. K., Langford, A. O., Lin, M., and Moore, T.: Scientific assessment of background ozone over the U. S.: Implications for air quality management, Elem. Sci. Anth., 6, 56, https://doi.org/10.1525/elementa.309, 2018.
Jeong, Y., Kim, S.-W., Kim, J., Shin, D., Kim, J., Park, J.-H., and An, S.-I.: Influence of ENSO on tropospheric ozone variability in East Asia, J. Geophys. Res.-Atmos., 128, e2023JD038604, https://doi.org/10.1029/2023JD038604, 2023.
Johnson, M. S., Strawbridge, K., Knowland, K. E., Keller, C., and Travis, M.: Long-range transport of Siberian biomass burning emissions to North America during FIREX-AQ, Atmos. Environ., 252, 118241, https://doi.org/10.1016/j.atmosenv.2021.118241, 2021.
Kerr, G. H., Waugh, D. W., and Miller, S. M.: Jet stream-surface tracer relationships: Mechanism and sensitivity to source region, Geophys. Res. Lett., 48, e2020GL090714, https://doi.org/10.1029/2020GL090714, 2021.
Kurokawa, J. and Ohara, T.: Long-term historical trends in air pollutant emissions in Asia: Regional Emission inventory in ASia (REAS) version 3, Atmos. Chem. Phys., 20, 12761–12793, https://doi.org/10.5194/acp-20-12761-2020, 2020.
Lacis, A., Hansen, J., Lee, P., Mitchell, T., and Lebedeff, S.: Greenhouse effect of trace gases, 1970–1980, Geophys. Res. Lett., 8, 1035–1038, https://doi.org/10.1029/GL008i010p01035, 1981.
Lahoz, W. A., and Schneider, P.: Data assimilation: making sense of Earth Observation, Front. Environ. Sci., 2, 16, https://doi.org/10.3389/fenvs.2014.00016, 2014.
Li, M., Kurokawa, J., Zhang, Q., Woo, J.-H., Morikawa, T., Chatani, S., Lu, Z., Song, Y., Geng, G., Hu, H., Kim, J., Cooper, O. R., and McDonald, B. C.: MIXv2: a long-term mosaic emission inventory for Asia (2010–2017), Atmos. Chem. Phys., 24, 3925–3952, https://doi.org/10.5194/acp-24-3925-2024, 2024.
Li, P., Yang, Y., Wang, H., Li, S., Li, K., Wang, P., Li, B., and Liao, H.: Source attribution of near-surface ozone trends in the United States during 1995–2019, Atmos. Chem. Phys., 23, 5403–5417, https://doi.org/10.5194/acp-23-5403-2023, 2023a.
Li, S., Yang, Y., Wang, H., Li, P., Li, K., Ren, L., Wang, P., Li, B., Mao, Y., and Liao, H.: Rapid increase in tropospheric ozone over Southeast Asia attributed to changes in precursor emission source regions and sectors, Atmos. Environ., 305, 119776, https://doi.org/10.1016/j.atmosenv.2023.119776, 2023b.
Lin, M., Horowitz, L. W., Oltmans, S. J., Fiore, A. M., and Fan, S.: Tropospheric ozone trends at Mauna Loa Observatory tied to decadal climate variability, Nat. Geosci., 7, 136–143, https://doi.org/10.1038/ngeo2066, 2014.
Lin, M., Fiore, A. M., Horowitz, L. W., Langford, A. O., Oltmans, S. J., Tarasick, D., and Rieder, H. E.: Climate variability modulates western US ozone air quality in spring via deep stratospheric intrusions, Nat. Commun., 6, 7105, https://doi.org/10.1038/ncomms8105, 2015.
Lin, M., Horowitz, L. W., Payton, R., Fiore, A. M., and Tonnesen, G.: US surface ozone trends and extremes from 1980 to 2014: quantifying the roles of rising Asian emissions, domestic controls, wildfires, and climate, Atmos. Chem. Phys., 17, 2943–2970, https://doi.org/10.5194/acp-17-2943-2017, 2017.
Liu, J., Strode, S. A., Liang, Q., Oman, L. D., Colarco, P. R., Fleming, E. L., Manyin, M. E., Douglass, A. R., Ziemke, J. R., Lamsal, L. N., and Li, C.: Change in tropospheric ozone in the recent decades and its contribution to global total ozone, J. Geophys. Res.-Atmos., 127, e2022JD037170, https://doi.org/10.1029/2022JD037170, 2022.
Liu, J., Cohen, J. B., He, Q., Tiwari, P., and Qin, K.: Accounting for NOx emissions from biomass burning and urbanization doubles existing inventories over South, Southeast and East Asia, Commun. Earth Environ., 5, 255, https://doi.org/10.1038/s43247-024-01424-5, 2024.
Logan, J. A.: An analysis of ozonesonde data for the troposphere: Recommendations for testing 3-D models and development of a gridded climatology for tropospheric ozone, J. Geophys. Res., 104, 16115–16149, 1999.
Luhar, A. K., Woodhouse, M. T., and Galbally, I. E.: A revised global ozone dry deposition estimate based on a new two-layer parameterisation for air–sea exchange and the multi-year MACC composition reanalysis, Atmos. Chem. Phys., 18, 4329–4348, https://doi.org/10.5194/acp-18-4329-2018, 2018.
Malashock, D. A., DeLang, M. N., Jacob, S. B., Serre, M. L., West, J. J., Chang, K.-L., Cooper, O. R., and Anenberg, S. C.: Estimates of ozone concentrations and attributable mortality in urban, peri-urban and rural areas worldwide in 2019, Environ. Res. Lett., 17, 054023, https://doi.org/10.1088/1748-9326/ac66f3, 2022.
McDuffie, E. E., Smith, S. J., O'Rourke, P., Tibrewal, K., Venkataraman, C., Marais, E. A., Zheng, B., Crippa, M., Brauer, M., and Martin, R. V.: A global anthropogenic emission inventory of atmospheric pollutants from sector- and fuel-specific sources (1970–2017): an application of the Community Emissions Data System (CEDS), Earth Syst. Sci. Data, 12, 3413–3442, https://doi.org/10.5194/essd-12-3413-2020, 2020.
Mills, G., Pleijel, H., Malley, C. S., Sinha, B., Cooper, O. R., Schultz, M. G., Neufeld, H. S., Simpson, D., Sharps, K., Feng, Z., Gerosa, G., Harmens, H., Kobayashi, K., Saxena, P., Paoletti, E., Sinha, V., and Xu, X.: Tropospheric Ozone Assessment Report: Present-day tropospheric ozone distribution and trends relevant to vegetation, Elem. Sci. Anth., 6, 47, https://doi.org/10.1525/elementa.302, 2018.
Miyazaki, K., Bowman, K., Sekiya, T., Eskes, H., Boersma, F., Worden, H., Livesey, N., Payne, V. H., Sudo, K., Kanaya, Y., Takigawa, M., and Ogochi, K.: Chemical Reanalysis Products, NASA Atmospheric Science Data Center (ASDC) [data set], https://doi.org/10.25966/9qgv-fe81, 2019a.
Miyazaki, K., Sekiya, T., Fu, D., Bowman, K., Kulawik, S., Sudo, K., Walker, T., Kanaya, Y., Takigawa, M., Ogochi, K., Eskes, H., Boersma, K. F., Thompson, A. M., Gaubert, B., Barre, J., and Emmons, L. K.: Balance of Emission and Dynamical Controls on Ozone During the Korea-United States Air Quality Campaign From Multiconstituent Satellite Data Assimilation, J. Geophys. Res.-Atmos., 124, 387–413, 2019b.
Miyazaki, K., Bowman, K., Sekiya, T., Eskes, H., Boersma, F., Worden, H., Livesey, N., Payne, V. H., Sudo, K., Kanaya, Y., Takigawa, M., and Ogochi, K.: Updated tropospheric chemistry reanalysis and emission estimates, TCR-2, for 2005–2018, Earth Syst. Sci. Data, 12, 2223–2259, https://doi.org/10.5194/essd-12-2223-2020, 2020.
NASA Jet Propulsion Laboratory: Table Mountain atmospheric lidar data, Network for the Detection of Atmospheric Composition Change (NDACC), https://www-air.larc.nasa.gov/missions/ndacc/ (last access: 15 September 2026), 2022.
Nisbet, E. G., Dlugokencky, E. J., Manning, M. R., Lowry, D., Fisher, R. E., France, J. L., Michel, S. E., Miller, J. B., White, J. W. C., Vaughn, B., Bousquet, P., Pyle, J. A., Warwick, N. J., Cain, M., Brownlow, R., Zazzeri, G., Lanoisellé, M., Manning, A. C., Gloor, E., Worthy, D. E. J., Brunke, E.-G., Labuschagne, C., Wolff, E. W., and Ganesan, A. L.: Rising atmospheric methane: 2007–2014 growth and isotopic shift, Global Biogeochem. Cy., 30, 1356–1370, https://doi.org/10.1002/2016GB005406, 2016.
Nisbet, E. G., Manning, M. R., Dlugokencky, E. J., Fisher, R. E., Lowry, D., Michel, S. E., Myhre, C. L., Platt, S. M., Allen, G., Bousquet, P., Brownlow, R., Cain, M., France, J. L., Hermansen, O., Hossaini, R., Jones, A. E., Levin, I., Manning, A. C., Myhre, G., Pyle, J. A., Vaughn, B. H., Warwick, N. J., and White, J. W. C.: Very strong atmospheric methane growth in the 4 years 2014–2017: Implications for the Paris Agreement, Global Biogeochem. Cy., 33, 318–342, https://doi.org/10.1029/2018GB006009, 2019.
NOAA Global Monitoring Laboratory (GML): Homogenized ozonesonde data archive, https://gml.noaa.gov/ozwv/ozsondes/ (last access: 15 September 2026), 2022.
Oman, L. D., Ziemke, J. R., Douglass, A. R., Waugh, D. W., Lang, C., Rodriguez, J. M., and Nielsen, J. E.: The response of tropical tropospheric ozone to ENSO, Geophys. Res. Lett., 38, L13802, https://doi.org/10.1029/2011GL047865, 2011.
Oman, L. D., Douglass, A. R., Ziemke, J. R., Rodriguez, J. M., Waugh, D. W., and Nielsen, J. E.: The ozone response to ENSO in Aura satellite measurements and a chemistry-climate simulation, J. Geophys. Res.-Atmos., 118, 965–976, https://doi.org/10.1029/2012JD018546, 2013.
Pisso, I., Sollum, E., Grythe, H., Kristiansen, N. I., Cassiani, M., Eckhardt, S., Arnold, D., Morton, D., Thompson, R. L., Groot Zwaaftink, C. D., Evangeliou, N., Sodemann, H., Haimberger, L., Henne, S., Brunner, D., Burkhart, J. F., Fouilloux, A., Brioude, J., Philipp, A., Seibert, P., and Stohl, A.: The Lagrangian particle dispersion model FLEXPART version 10.4, Geosci. Model Dev., 12, 4955–4997, https://doi.org/10.5194/gmd-12-4955-2019, 2019.
Prime, N., Smith, S. J., Ahsan, H., Hoesly, R. M., Mott, A., O'Rourke, P. R., McDuffie, E. E., Crippa, M., Klimont, Z., McDonald, B., Wang, S., Nicholson, M. B., and Feng, L.: CEDS Version 2021-04-21 Aircraft Emissions Fix, Zenodo [data set], https://doi.org/10.5281/zenodo.7846185, 2023.
Prinn, R. G.: Toward an improved global network for determination of tropospheric ozone climatology and trends, J. Atmos. Chem., 6, 281–298, https://doi.org/10.1007/BF00053861, 1988.
Putero, D., Cristofanelli, P., Chang, K.-L., Dufour, G., Beachley, G., Couret, C., Effertz, P., Jaffe, D. A., Kubistin, D., Lynch, J., Petropavlovskikh, I., Puchalski, M., Sharac, T., Sive, B. C., Steinbacher, M., Torres, C., and Cooper, O. R.: Fingerprints of the COVID-19 economic downturn and recovery on ozone anomalies at high-elevation sites in North America and western Europe, Atmos. Chem. Phys., 23, 15693–15709, https://doi.org/10.5194/acp-23-15693-2023, 2023.
Ramaswamy, V., Chanin, M.-L., Angell, J., Barnett, J., Gaffen, D., Gelman, M., Keckhut, P., Koshelkov, Y., Labitzke, K., Lin, J.-J. R., O'Neill, A., Nash, J., Randel, W., Rood, R., Shine, K., Shiotani, M., and Swinbank, R.: Stratospheric temperature trends: Observations and model simulations, Rev. Geophys., 39, 71–122, 2001.
Rotman, D. A., Tannahill, J. R., Kinnison, D. E., Connell, P. S., Bergmann, D., Proctor, D., Rodriguez, J. M., Lin, S. J., Rood, R. B., Prather, M. J., Rasch, P. J., Considine, D. B., Ramaroson, R., and Kawa, S. R.: Global Modeling Initiative assessment model: Model description, integration, and testing of the transport shell, J. Geophys. Res., 106, 1669–1691, https://doi.org/10.1029/2000JD900463, 2001.
Ryoo, J.-M., Johnson, M. S., Iraci, L. T., Yates, E. L., and Gore, W.: Investigating sources of ozone over California using AJAX airborne measurements and models: assessing the long-range transport, Atmos. Environ., 155, 53–67, https://doi.org/10.1016/j.atmosenv.2017.02.008, 2017.
Samphutthanont, R., Crawford, J. H., Pawarmart, I., ]Wisthaler, A., Swift, S. J. Piel, F., Wojnowski, W., Jimenez, J. L., Campuzano-Jost, P., Yun, S.,Symonds, G., Day,D. A., DiGangi, J. P., Diskin, G. S., Crounse, J. D., Ball, K.,Wennberg,P. O., Lee, M., Gil, J., and Choochuay, C.: A multi-platform validation of biomass burning emissions: Integrating ground, airborne, and satellite data to quantify regional haze health impacts in Thailand, Environ. Pollut., 405, 128576, https://doi.org/10.1016/j.envpol.2026.128576, 2026.
Saunois, M., Emmons, L., Lamarque, J.-F., Tilmes, S., Wespes, C., Thouret, V., and Schultz, M.: Impact of sampling frequency in the analysis of tropospheric ozone observations, Atmos. Chem. Phys., 12, 6757–6773, https://doi.org/10.5194/acp-12-6757-2012, 2012.
Smith, S. J., Zhou, Y., Kyle, P., Wang, H., and Yu, H.: A Community Emissions Data System (CEDS) for Historical Emissions, in: 2015 International Emission Inventory Conference: Air Quality Challenges: Tackling the Changing Face of Emissions, 13–16 April 2015, San Diego, California, US EPA, Washington, D.C., PNNL-SA-109670, 2015.
Strode, S. A., Rodriguez, J. M., Logan, J. A., Cooper, O. R., Witte, J. C., Lamsal, L. N., Damon, M., Van Aartsen, B., Steenrod, S. D., and Strahan, S. E.: Trends and variability in surface ozone over the United States, J. Geophys. Res.-Atmos., 120, 9020–9042, https://doi.org/10.1002/2014JD022784, 2015.
Strode, S. A., Worden, H. M., Damon, M., Douglass, A. R., Duncan, B. N., Emmons, L. K., Lamarque, J.-F., Manyin, M., Oman, L. D., Rodriguez, J. M., Strahan, S. E., and Tilmes, S.: Interpreting space-based trends in carbon monoxide with multiple models, Atmos. Chem. Phys., 16, 7285–7294, https://doi.org/10.5194/acp-16-7285-2016, 2016.
Szopa, S., Naik, V., Adhikary, B., Artaxo, P., Berntsen, T., Collins, W. D., Fuzzi, S., Gallardo, L., Kiendler-Scharr, A., Klimont, Z., Liao, H., Unger, N., and Zanis, P.: Short-Lived Climate Forcers, in: Climate Change 2021: The Physical Science Basis. Contribution of Working Group I to the Sixth Assessment Report of the Intergovernmental Panel on Climate Change, edited by: Masson-Delmotte, V., Zhai, P., Pirani, A., Connors, S. L., Péan, C., Berger, S., Caud, N., Chen, Y., Goldfarb, L., Gomis, M. I., Huang, M., Leitzell, K., Lonnoy, E., Matthews, J. B. R., Maycock, T. K., Waterfield, T., Yelekçi, O., Yu, R., and Zhou, B., Cambridge University Press, Cambridge, UK and New York, NY, USA, 817–922, https://doi.org/10.1017/9781009157896.008, 2021.
Tarasick, D., Galbally, I. E., Cooper, O. R., Schultz, M. G., Ancellet, G., Leblanc, T., Wallington, T. J., Ziemke, J., Liu, X., Steinbacher, M., Staehelin, J., Vigouroux, C., Hannigan, J. W., García, O., Foret, G., Zanis, P., Weatherhead, E., Petropavlovskikh, I., Worden, H., Osman, M., Liu, J., Chang, K.-L., Gaudel, A., Lin, M., Granados-Muñoz, M., Thompson, A. M., Oltmans, S. J., Cuesta, J., Dufour, G., Thouret, V., Hassler, B., Trickl, T., and Neu, J. L.: Tropospheric Ozone Assessment Report: Tropospheric ozone from 1877 to 2016, observed levels, trends and uncertainties, Elem. Sci. Anth., 7, 39, https://doi.org/10.1525/elementa.376, 2019.
Thompson, A. M., Stauffer, R. M., Boyle, T. P., Kollonige, D. E., Miyazaki, K., Tzortziou, M., Herman, J. R., Abuhassan, N., Jordan, C. E., and Lamb, B. T.: Comparison of Near-Surface NO2 Pollution With Pandora Total Column NO2 During the Korea-United States Ocean Color (KORUS OC) Campaign, J. Geophys. Res.-Atmos., 124, 13560–13575, https://doi.org/10.1029/2019JD030765, 2019.
Thorp, T., Arnold, S. R., Pope, R. J., Spracklen, D. V., Conibear, L., Knote, C., Arshinov, M., Belan, B., Asmi, E., Laurila, T., Skorokhod, A. I., Nieminen, T., and Petäjä, T.: Late-spring and summertime tropospheric ozone and NO2 in western Siberia and the Russian Arctic: regional model evaluation and sensitivities, Atmos. Chem. Phys., 21, 4677–4697, https://doi.org/10.5194/acp-21-4677-2021, 2021.
Tong, D., Pan, L., Chen, W., Lamsal, L., Lee, P., Tang, Y., Kim, H., Kondragunta, S., and Stajner, I.: Impact of the 2008 Global Recession on air quality over the United States: Implications for surface ozone levels from changes in NOx emissions, Geophys. Res. Lett., 43, 9280–9288, https://doi.org/10.1002/2016GL069885, 2016.
U.S. Environmental Protection Agency (EPA): Integrated Science Assessment for Ozone and Related Photochemical Oxidants, EPA/600/R-20/012, 2020.
U.S. Environmental Protection Agency (EPA): Policy Assessment for the Reconsideration of the Ozone National Ambient Air Quality Standards, External Review Draft Version 2, EPA-452/P-23-002, 2023.
Van Malderen, R., Zang, Z., Chang, K.-L., Björklund, R., Cooper, O. R., Liu, J., Maillard Barras, E., Vigouroux, C., Petropavlovskikh, I., Leblanc, T., Thouret, V., Wolff, P., Effertz, P., Gaudel, A., Tarasick, D. W., Smit, H. G. J., Thompson, A. M., Stauffer, R. M., Kollonige, D. E., Poyraz, D., Ancellet, G., De Backer, M.-R., Frey, M. M., Hannigan, J. W., Hernandez, J. L., Johnson, B. J., Jones, N., Kivi, R., Mahieu, E., Morino, I., McConville, G., Müller, K., Murata, I., Notholt, J., Piters, A., Prignon, M., Querel, R., Rizi, V., Smale, D., Steinbrecht, W., Strong, K., and Sussmann, R.: Ground-based tropospheric ozone measurements: regional tropospheric ozone column trends from the TOAR-II/HEGIFTOM homogenized datasets, Atmos. Chem. Phys., 25, 9905–9935, https://doi.org/10.5194/acp-25-9905-2025, 2025.
Verstraeten, W. W., Neu, J. L., Williams, J. E., Bowman, K. W., Worden, J. R., and Boersma, K. F.: Rapid increases in tropospheric ozone production and export from China, Nat. Geosci. 8: 690–695, https://doi.org/10.1038/ngeo2493, 2015.
Wang, H., Lu, X., Jacob, D. J., Cooper, O. R., Chang, K.-L., Li, K., Gao, M., Liu, Y., Sheng, B., Wu, K., Wu, T., Zhang, J., Sauvage, B., Nédélec, P., Blot, R., and Fan, S.: Global tropospheric ozone trends, attributions, and radiative impacts in 1995–2017: an integrated analysis using aircraft (IAGOS) observations, ozonesonde, and multi-decadal chemical model simulations, Atmos. Chem. Phys., 22, 13753–13782, https://doi.org/10.5194/acp-22-13753-2022, 2022a.
Wang, T., Dai, J., Lam, K. S., Nan Poon, C., and Brasseur, G. P.: Twenty-five years of lower tropospheric ozone observations in tropical East Asia: The influence of emissions and weather patterns, Geophys. Res. Lett., 46, 11463–11470, https://doi.org/10.1029/2019GL084459, 2019.
Wang, X., Fu, T.-M., Zhang, L., Lu, X., Liu, X., Amnuaylojaroen, T., Latif, M. T., Ma, Y., Zhang, L., Feng, X., Zhu, L., Shen, H., and Yang, X: Rapidly Changing Emissions Drove Substantial Surface and Tropospheric Ozone Increases Over Southeast Asia, Geophys. Res. Lett., 49, e2022GL100223, https://doi.org/10.1029/2022GL100223, 2022b.
Wasserstein, R. L., Schirm, A. L., and Lazar, N. A.: Moving to a world beyond p<0.05, Am. Stat., 73, 1–29, https://doi.org/10.1080/00031305.2019.1583913, 2019.
WHO: WHO global air quality guidelines. Particulate matter (PM2.5 and PM10), ozone, nitrogen dioxide, sulfur dioxide and carbon monoxide, World Health Organization, Geneva, 2021.
Xue, L., Ding, A., Cooper, O., Huang, X., Wang, W., Zhou, D., Wu, Z., McClure-Begley, A., Petropavlovskikh, I., Andreae, M. O., and Fu, C.: ENSO and Southeast Asian biomass burning modulate subtropical trans-Pacific ozone transport, Natl. Sci. Rev., 8, nwaa132, https://doi.org/10.1093/nsr/nwaa132, 2021.
Yates, E. L., Iraci, L. T., Kulawik, S. S., Ryoo, J.-M., Marrero, J. E., Parworth, C. L., St. Clair, J. M., Hanisco, T. F., Bui, T. P. V., Chang, C. S., and Dean-Day, J. M.: An extensive database of airborne trace gas and meteorological observations from the Alpha Jet Atmospheric eXperiment (AJAX), Earth Syst. Sci. Data, 15, 2375–2389, https://doi.org/10.5194/essd-15-2375-2023, 2023.
Zhang, L., Jacob, D. J., Boersma, K. F., Jaffe, D. A., Olson, J. R., Bowman, K. W., Worden, J. R., Thompson, A. M., Avery, M. A., Cohen, R. C., Dibb, J. E., Flock, F. M., Fuelberg, H. E., Huey, L. G., McMillan, W. W., Singh, H. B., and Weinheimer, A. J.: Transpacific transport of ozone pollution and the effect of recent Asian emission increases on air quality in North America: an integrated analysis using satellite, aircraft, ozonesonde, and surface observations, Atmos. Chem. Phys., 8, 6117–6136, https://doi.org/10.5194/acp-8-6117-2008, 2008.
Zhang, Y., Cooper, O. R., Gaudel, A., Thompson, A. M., Nédélec, P., Ogino, S.-Y., and West, J. J.: Tropospheric ozone change from 1980 to 2010 dominated by equatorward redistribution of emissions, Nat. Geosci., 9, 875–879, https://doi.org/10.1038/ngeo2827, 2016.
Zhao, Y., Saunois, M., Bousquet, P., Lin, X., Berchet, A., Hegglin, M. I., Canadell, J. G., Jackson, R. B., Deushi, M., Jöckel, P., Kinnison, D., Kirner, O., Strode, S., Tilmes, S., Dlugokencky, E. J., and Zheng, B.: On the role of trend and variability in the hydroxyl radical (OH) in the global methane budget, Atmos. Chem. Phys., 20, 13011–13022, https://doi.org/10.5194/acp-20-13011-2020, 2020.
Ziemke, J. R., Douglass, A. R., Oman, L. D., Strahan, S. E., and Duncan, B. N.: Tropospheric ozone variability in the tropics from ENSO to MJO and shorter timescales, Atmos. Chem. Phys., 15, 8037–8049, https://doi.org/10.5194/acp-15-8037-2015, 2015.
Ziemke, J. R., Oman, L. D., Strode, S. A., Douglass, A. R., Olsen, M. A., McPeters, R. D., Bhartia, P. K., Froidevaux, L., Labow, G. J., Witte, J. C., Thompson, A. M., Haffner, D. P., Kramarova, N. A., Frith, S. M., Huang, L.-K., Jaross, G. R., Seftor, C. J., Deland, M. T., and Taylor, S. L.: Trends in global tropospheric ozone inferred from a composite record of TOMS/OMI/MLS/OMPS satellite measurements and the MERRA-2 GMI simulation, Atmos. Chem. Phys., 19, 3257–3269, https://doi.org/10.5194/acp-19-3257-2019, 2019.