the Creative Commons Attribution 4.0 License.
the Creative Commons Attribution 4.0 License.
 | 10 Sep 2025
On the impact of ice formation processes and sedimentation on cirrus origin classification in warm conveyor belt outflow
Tim Lüttmer
Annette Miltenberger
Peter Spichtinger
Formation pathways of cirrus clouds are thought to differ in their dominant ice nucleation mechanism and thermodynamic regime: liquid-origin cirrus form at water saturation, and ice crystals form by freezing of liquid water drops, while in situ cirrus form below water saturation at low temperatures (T < 235 K), and ice crystals form without an intermediate, stable liquid phase.
Warm conveyor belts (WCBs) can transport liquid droplets and vapor from the boundary layer into the upper troposphere, where cirrus is formed in the outflow. The dominant ice formation pathway remains uncertain. We employ a two-moment multi-class cloud microphysics scheme that distinguishes between five ice classes. Each ice class represents ice formed by a unique formation mechanism. Thus, the formation signature is available even a long time after the formation process occurred.
Our analysis for a WCB case study shows that cirrus in the outflow consists predominantly of ice formed by processes only active below water saturation. From a nucleation perspective, this suggests in-situ-origin cirrus. However, Lagrangian trajectories show that the cirrus is derived from mixed-phase clouds. Hence, from a thermodynamic perspective, the cirrus is from a liquid origin. We found that sedimentation is a key process for the vertical redistribution of ice formed by different pathways. The main WCB ascent region was embedded in a slowly ascending air mass that resulted in in situ ice formation above the WCB. This in-situ-formed ice sedimented into mixed-phase clouds of the WCB below, which also altered the macrophysical properties of the outflow cirrus.
- Article
(5431 KB) - Full-text XML
- Companion paper
- BibTeX
- EndNote


One of the major cloud-producing synoptic-scale phenomena in the extratropical atmosphere is the so-called warm-conveyor belt (WCB), which is a coherent airstream that transports moist air masses from the planetary boundary layer to the upper troposphere. WCBs originate from the warm sector of extratropical cyclones and occur frequently in the Northern Hemisphere during all seasons (Madonna et al., 2014). They form long cloud bands during ascent, consisting of pure water, mixed-phase clouds and pure ice clouds. In the outflow region of the WCB, vast fields of high-altitude, pure ice clouds (cirrus) are formed.
WCBs affect weather evolution and the climate state in several ways. A large part of total and extreme precipitation in many parts of the extratropics can be attributed to WCBs (Pfahl et al., 2014; Joos et al., 2023). Latent heat released from cloud microphysics processes occurring in the WCB cloud band causes diabatic modification of potential vorticity (PV) (Wernli and Gray, 2024). These PV anomalies influence the upper-level flow downstream of the WCB (Grams et al., 2011; Rodwell et al., 2018; Grams et al., 2018) and affect cyclones' development by increasing their intensification rate (Reed et al., 1992; Binder et al., 2016).
The cloud fields of the WCB also influence the cloud radiative effect (CRE) in the extratropics (Joos, 2019). The CRE and changes thereof are an important component for determining the climate state but may also impact the thermodynamic structure of the extratropical tropopause region, upper-tropospheric flow, and exchange between the troposphere and the stratosphere (see, e.g., Hong et al., 2016; Matus and L'Ecuyer, 2017; Spreitzer et al., 2019). The sign of the CRE is determined by the net of two opposing effects (Ramanathan et al., 1989). The albedo effect describes the ability of clouds to (partly) scatter and reflect incoming solar radiation back to space, leading to a cooling effect on the Earth's surface temperature. The greenhouse effect describes the ability of clouds to (partly) absorb and re-emit terrestrial radiation toward the Earth's surface, hence warming it. For stratiform cirrus clouds, the sign of the net radiative effect is uncertain and depends on the bulk properties of the cirrus cloud (Zhang et al., 1999; Krämer et al., 2020). High ice water content (IWC) and large mean diameters of ice crystals result in a positive (warming) CRE, whereas small mean diameters and low IWC result in a negative (cooling) CRE (Zhang et al., 1999). These bulk properties of cirrus clouds depend on their formation pathway (Krämer et al., 2016; Luebke et al., 2016; Wolf et al., 2018; Krämer et al., 2020). Of course, CRE also depends on other components of the Earth–atmosphere system, e.g., surface albedo and coverage of lower-level clouds.
In general, we distinguish between two formation pathways of cirrus clouds (see, e.g., Krämer et al., 2016; Wernli et al., 2016): (i) liquid-origin and (ii) in situ cirrus. Liquid-origin cirrus (i) ice crystals are created by freezing of pre-existing water droplets. This requires ascent in a mixed-phase cloud that extends to low temperatures to attain complete glaciation and produce cirrus. The ascent can be slow and gradual, e.g., as part of a warm conveyor belt, or fast, driven by (embedded) convection. Freezing of (pure) water droplets can be induced by aerosols that show ice-nucleating (surface) properties, which are referred to as ice-nucleating particles (INPs). Here, we can distinguish between immersion and contact freezing modes (Vali et al., 2015). In the absence of active INPs, droplets will freeze homogeneously, particularly close to the homogeneous freezing temperature threshold (Tc = 235 K). The liquid-origin ice formation pathway occurs close to water saturation since (pure) water droplets would otherwise evaporate. In the other possible cirrus formation pathway, i.e., in situ cirrus (ii), ice crystals are formed directly from water vapor and (liquid or solid) aerosols without them being first activated to cloud droplets. Hence, this formation pathway occurs at lower temperatures and below water saturation. In subsaturated conditions with respect to liquid water, new ice crystals can be formed by deposition of water vapor onto a (solid) INP, like dust, soot or biological aerosols (deposition nucleation), or by freezing of aqueous solution droplets (homogeneous nucleation).
Previous studies have suggested that the different thermodynamic pathways and ice formation processes result in different bulk properties of the cirrus: liquid-origin cirrus are thought to be “thicker” than in situ cirrus; i.e., they are associated with high IWC and larger ice crystal diameters (see, e.g., Luebke et al., 2016; Wolf et al., 2018). These studies have also suggested that liquid-origin cirrus clouds likely consist of much more ice particles than in-situ-formed cirrus clouds. While in situ cirrus are typically optically thinner than liquid-origin cirrus, two subcategories of in situ cirrus with vastly different microphysical and radiative properties can be identified: cirrus forming in slow updrafts (< 10 cm s−1) are characterized by few large crystals from deposition nucleation. These clouds show a small net warming effect (Krämer et al., 2020). In contrast, in situ cirrus formed in fast updrafts are associated with homogeneous freezing of small liquid aerosols, resulting in many small ice crystals. These cirrus have either a small net warming effect or a small net cooling effect, depending on their altitude (Joos et al., 2014; Krämer et al., 2020).
Quantifying and understanding characteristic differences between cirrus formed via different pathways are contingent on a robust classification of observed or modeled cirrus clouds. In the past decade several approaches have been proposed, which largely rely on the investigation of air mass trajectories from models, cloud temperature or – indeed – the cloud properties themselves.
Lagrangian methods are used to identify formation pathways of cirrus in model simulations. Wernli et al. (2016) developed an algorithm that investigated backward trajectories originating from cirrus clouds until the air parcel contained no ice. If the segment contained any liquid water content (LWC), the cirrus cloud was classified as liquid origin; otherwise it was classified as in situ. Wernli et al. (2016) applied this classification to 12 years of ERA-Interim data for the North Atlantic storm track region. They found that the occurrence frequency of cloud types strongly varies with altitude, with liquid-origin cirrus typically found at lower altitudes. Moreover, their analysis suggests that more than 80 % of liquid-origin cirrus clouds are topped with an in situ cloud.
Differences in cirrus cloud properties due to the formation pathway can be identified by combining Lagrangian information about the thermodynamic history of ice crystal properties with observational data on ice crystal properties (which are not well represented in model and reanalysis data). Luebke et al. (2016) used airborne, in situ measurements of IWC; cloud ice number concentration (ni); and ice crystal size (Di) to demonstrate the differences between liquid-origin and in situ cirrus. Wolf et al. (2018) used balloon-borne, in situ observations to investigate ice crystal size distributions in Arctic cirrus clouds. Both studies utilized the CLaMS-Ice microphysics model (Spichtinger and Gierens, 2009) to simulate the cirrus cloud development. CLaMS-Ice was run along Lagrangian backward trajectories. ECMWF operational analysis data were used to drive the trajectory model. The observed cloud was classified as in situ if cloud ice (first) appeared at temperatures lower than the homogeneous freezing threshold Tc. Below Tc, the water and ice phases cannot coexist; thus, ice formation has to be in situ. The cloud was classified as liquid origin if the temperature at the first occurrence of cloud ice was higher than Tc, and the measurement was taken at pressure levels larger than 500 hPa.
A temperature-based classification of cirrus clouds can also be used without employing Lagrangian trajectories. Gasparini et al. (2018) compared cloud patterns from global simulations of the ECHAM-HAM general circulation model to CALIPSO satellite data. As in Luebke et al. (2016), they used a temperature-based criterion to distinguish between liquid-origin and in situ cirrus. Ice clouds with cloud bases extending to temperatures higher than 238 K were classified as liquid origin, and all other cirrus clouds were classified as in situ.
Another method for cirrus origin classification that does not rely on Lagrangian information is to utilize retrievals from remote sensing to estimate cirrus properties and then search for signatures that match the characteristics of the cloud types. Huo et al. (2020) utilized 4 years of ground-based radar measurements in Beijing to obtain cloud properties. They classified the cirrus origin by cloud temperature and reflectivity to match proposed cloud properties of previous studies (e.g. Krämer et al., 2016; Luebke et al., 2016). Urbanek et al. (2017) used backscatter ratio lidar from atmospheric cross sections to identify in-cloud and cloud-free regions. With ice supersaturation (Si) from synergistic lidar measurements and temperature fields derived from ECMWF model data, they determined the cloud type by application of Si threshold values. Observations processed from satellites (e.g., CALIPSO and CloudSat) provide multiple years of statistics on cirrus cloud properties (Sourdeval et al., 2018; Gryspeerdt et al., 2018). These data were used to derive a global climatology of ice number concentration ni based on agreement between remote sensing and in situ measurements (Krämer et al., 2020). The data of ni coupled with cloud temperatures gave an indication of the cirrus origin.
These approaches have their limitations. For classification with observations, measured cloud properties are compared with characteristic values of the cloud type. However, remote sensing methods do not report on the history of the cloud and cloud processes, like ice crystal growth, aggregation and sedimentation. Therefore, classification methods based only on instantaneous data cannot distinguish to what degree observed cloud properties are characteristic of the formation process and to what degree they are distorted by other cloud processes (Krämer et al., 2020). Further, a temperature-based classification can misidentify the cloud type when the horizontal dimension of the cloud is not considered (Gasparini and Lohmann, 2016). Lagrangian methods are subject to uncertainties as well, which arise due to uncertainties in the underlying wind field data or an inadequate representation of convection and mesoscale temperature fluctuations. Simulations at high resolution can help mitigate some of these issues (Wernli et al., 2016). Running a parcel microphysics model like CLaMS-Ice along the trajectory path to investigate the cloud history may improve the representation of ice cloud physics, but typically there is no (or very limited) feedback from the ensuing diabatic processes on the vertical velocity and thermodynamic evolution of the parcel itself. Additionally, in most parcel models, sedimentation of cloud ice from other regions into parcels is not considered. Therefore, trajectory-based classification can be “confused” if cloud ice from different formation pathways mixes through sedimentation and turbulence, thus altering the cloud properties (Wernli et al., 2016).
In this study, we utilize a recently developed ice mode microphysics scheme (Lüttmer et al., 2025) that retains information about the ice formation mechanisms throughout Eulerian simulations of cloud evolution to investigate ice formation mechanisms in WCB-related cirrus clouds and their impact on cirrus properties. The simulation and analysis were conducted for a WCB occurring between 3 and 6 October 2016 in the North Atlantic, which was investigated from a dynamical point of view in an earlier study by Oertel et al. (2023). The ice mode scheme introduces multiple ice classes (“ice modes”) into a two-moment microphysics scheme that are each unique in terms of their formation process. In Lüttmer et al. (2025), we employed the ice mode scheme to investigate ice formation in an idealized deep convection case. Consistent with expectations, we found that the convective ice clouds were of liquid origin, with traces of ice stemming from in situ formation in the overshoot. In this study, we employ the same microphysics scheme for a WCB case using high-resolution simulations with the Icosahedral Nonhydrostatic Weather and Climate Model (ICON). Therefore, we circumvent one key disadvantage of Lagrangian cirrus classification, as the new model allows for a proper representation of sedimentation effects.
In Sect. 2 we describe the model setup, including a brief introduction of the ice mode microphysics scheme, the employed cirrus classification algorithms and observational data used. In Sect. 3 we introduce the case study and investigate the contribution of different ice modes to the mixed-phase and cirrus clouds associated with the WCB airstream. In Sect. 4 we present an analysis of liquid-origin and in situ cirrus properties. Results for classifications based on information from the ice mode scheme and information on the thermodynamic history (i.e., according to Wernli et al., 2016) are compared and discussed. Finally, the key findings are summarized in Sect. 5, and implications for future work are discussed.
For our investigation of the physical link between ice formation mechanisms, thermodynamic cirrus formation pathways and cirrus properties, we choose a cyclone that occurred during the NAWDEX campaign between 3 and 6 October 2016 over the North Atlantic (Schäfler et al., 2018). This case has been studied in previous literature, with a focus on diabatic flow modifications (Oertel et al., 2023, 2025).
2.1 Model setup
Simulations of the meteorological evolution over the North Atlantic during the selected time period are conducted with the Icosahedral Nonhydrostatic Weather and Climate Model (ICON) version 2.6. The ICON configuration largely follows Heinze et al. (2017) in a limited-area mode and additionally employs the ice mode scheme (Lüttmer et al., 2025). We use an R03B08 model grid with an effective horizontal resolution of 6.5 km and a vertical grid with 90 levels in a terrain-following coordinate system (SLEVE). The model domain extends from 20 to 80° N and from 70° W to 50° E, respectively. The domain thus includes most of the North Atlantic and Europe. The model is integrated with a physics time step of 40 s. Initialization and boundary data are provided by ECMWF Integrated Forecasting System (IFS) reanalysis data (Bechtold et al., 2008). The simulation starts on 4 October 2016 at 00:00 UTC and is run for 54 h, including a 6 h spin-up phase. Model output is written every 0.5 h and is interpolated from the icosahedral model grid to a latitude–longitude grid (0.075° × 0.075°). These interpolated data are used for all analyses in our study.
We include most of the physics parameterizations commonly used in ICON: the TERRA surface model (Heise et al., 2016), a surface transfer scheme (Louis, 1979), subgrid-scale orographic drag (Lott and Miller, 1997), non-orographic gravity wave drag (Orr et al., 2010), vertical diffusion and transfer by turbulence (Raschendorfer, 2001), and a radiation transfer model (Mlawer et al., 1997) in conjunction with a simple cloud cover parameterization. Further discussions regarding this configuration can be found in Heinze et al. (2017). We use neither a deep nor a shallow convection scheme, as the assumptions and implementation are not compatible with the cloud microphysics scheme used and, in particular, its ice mode extension (see Lüttmer et al., 2025, and Sect. 2.2).
2.2 Ice mode scheme
The simulations employ the ice mode scheme, which is a derivation of the two-moment microphysics parameterization in ICON (Seifert and Beheng, 2006). The scheme expands the “standard” two-moment scheme by introducing additional hydrometeor classes; i.e., in addition to cloud droplets, raindrops, snow, graupel and hail, there are five ice classes (subsequently called ice modes), each with their own distinct formation pathway. The ice modes are described by the following additional prognostic variables:
-
HOM ice mode (nhom, qhom). Ice crystals are formed by homogeneous freezing of solution droplets.
-
FRZ ice mode (nfrz, qfrz). Ice crystals are formed by homogeneous freezing of cloud droplets.
-
IMM ice mode (nimm, qimm). Ice crystals are formed by immersion freezing of cloud and rain droplets.
-
DEP ice mode (ndep, qdep). Ice crystals are formed by deposition nucleation.
-
SEC ice mode (nsec, qsec). Ice crystals are formed by secondary ice formation processes.
Additionally we refer to TOT as the sum of all ice modes, representing all cloud ice:
Note that TOT is a diagnostic property and not a distinct ice mode in the model.
At each grid point, multiple unique ice formation processes can be active within a time step, providing ice to their associated ice modes. Ice modes can coexist,l and each ice mode is described by its own size distribution. The type of all size distributions is a generalized gamma distribution and is represented in the model by two prognostic moments, i.e., the number nx and mass densities qx. The shape of an ice crystal mainly depends on temperature and supersaturation, which control the growth behavior of the crystal through deposition of vapor. Therefore we assume the same shape, mass-diameter and fall speed relations for each ice mode. They are also treated equally in advection and depositional growth and can collide with each particle class, including itself and other ice modes. Note that aggregation of any ice mode contributes only to the same snow class.
The following parameterizations are used for primary and secondary ice formation processes in this ICON configuration. Homogeneous freezing of solution droplets (contributing to HOM) is described by the parameterization of Kärcher and Lohmann (2002). For homogeneous freezing of cloud droplets (contributing to FRZ), the fit of Cotton and Field (2002) is used. Immersion freezing of raindrops (contributing to IMM) is represented by the parameterization of Bigg (1953). Heterogeneous nucleation of ice contributes to both the IMM and the DEP ice modes and is governed by the number concentration, size distribution and activation scheme of ice-nucleating particles (INPs). In this study, we use the parameterization of Hande et al. (2015) for dust events over Europe. Here, deposition nucleation can only occur outside of mixed-phase clouds (). The only secondary ice mechanism considered in the present study is rime splintering (Hallett–Mossop process).
A detailed description of the ice mode scheme can be found in Lüttmer et al. (2025).
2.3 WCB trajectories
The main synoptic-scale cloud-producing feature in our case study is an extratropical cyclone and the associated WCB. In order to investigate the impact of this system on cirrus formation, we identify its position and spatio-temporal evolution by kinematic air mass trajectories calculated offline using half-hourly ICON wind field data with LAGRANTO software (Sprenger and Wernli, 2015). The gridded model data are interpolated onto the positions of the air mass trajectories at each output interval. The output interval of LAGRANTO is chosen such that it aligns with the output interval of the ICON model simulations.
Trajectories are started 6 h after model initialization on 4 October 2016 at 06:00 UTC in a large box around the cyclone from 30 to 65° N and from 50 to 20° W. Trajectories are started from a 7.5 km equidistant horizontal grid and at five altitude levels from the surface up to 1 km.
Trajectories constituting the WCB are identified by two conditions (Joos and Wernli, 2012; Madonna et al., 2014). First, they have to ascend at least 600 hPa within 48 h. Second, they need to start in or cross a cyclone. Cyclones are identified with a newly developed algorithm as two-dimensional features in the surface pressure field based on Wernli and Schwierz (2006) (see Appendix B). The newly developed algorithm contains a different approach for the calculation of the cyclone contours. We also added a new selection criterion for identifying cyclones.
After selecting WCB trajectories, we calculate a WCB area index, marking the grid cell and model level where a WCB trajectory is present for each time step. This allows us to investigate both the evolution of (micro-)physical quantities interpolated on the trajectories and the Eulerian model grid.
To characterize the flow and clouds above the WCB, additional trajectories were started at an hourly interval in a large region around the WCB from 32.5 to 75° N and from 50° W to 30° E, starting at eight altitude levels between approximately 7 km upward and the tropopause. This results in on average 15 000 trajectories starting per hour. These trajectories are computed backward in time until the start date of the simulation. Using the WCB area index, we selected all trajectories that passed above the WCB but did not intersect vertically with it and stayed above 5 km altitude at all times. This additional trajectory dataset characterizes the airflow in the upper troposphere above the WCB and excludes strongly ascending trajectories, which are part of the WCB itself.
2.4 Cirrus cloud origin classification
In line with the objective of our study to understand the impact of different ice formation mechanisms on cirrus properties, we follow the cirrus classification approach by Krämer et al. (2016) in combination with the novel ice mode scheme: liquid-origin cirrus are formed from freezing droplets transported into the cirrus temperature region (T<Tc = 235 K). Thus, they originate from liquid or mixed-phase clouds. Ice crystals of the homogeneous (FRZ) and immersion freezing (IMM) ice modes are classified as liquid-origin cirrus (if present at sufficiently low temperatures). In situ cirrus are formed directly as ice from the vapor phase onto the surface of ice-nucleating particles (INPs) or liquid aerosol particles. The homogeneous nucleation (HOM) and deposition nucleation (DEP) ice modes contribute to in situ ice.
Each grid point in the model likely contains a mixture of different ice modes; therefore we define the liquid-origin fraction fliq as the ratio of liquid-origin cloud ice content to the total cloud ice content:
This allows for a comprehensive description of the cirrus origin for grid-point data. fliq can change at each time step as cloud processes, most notably sedimentation and ice nucleation, modify the prognostic moments of the ice modes at each grid point. Note that we did not include the SEC mode since secondary ice cannot inherently be associated with either in situ or liquid-origin formation pathways. However, the only secondary ice mechanism included in this simulation, rime splintering, is only active at temperatures between 265 and 270 K (Hallett and Mossop, 1974). In a previous study we showed that for the case of (idealized) deep convection, secondary ice from rime splintering did not reach the cirrus regime (Lüttmer et al., 2025). In Sect. 3.4 we show that the contribution of the SEC ice mode to cirrus in the WCB outflow is also insignificant, with less than 0.01 %.
As an addition to the above classification scheme, we also consider the volume-integrated mass and number ratios for each ice mode x:
where ρ is the air density. The integration is done along the WCB trajectories from the start time t0 = 0 h to the end time tend = 48 h. To focus on specific regions of the cloud, integrals are evaluated over specific cloud regimes, which are defined as mixed-phase clouds containing both IWC and LWC. Cirrus clouds are pure ice clouds in the cirrus temperature region (T<Tc), and subcirrus clouds are pure ice clouds below the cirrus temperature region. All WCB trajectory data points outside the respective regime are ignored for the integration. Hence, the integrated mass and number ratios describe how much each ice mode contributes to the overall cloud ice mass content and number concentration in the respective cloud regime.
In addition to the above classification schemes, we also use a Lagrangian classification focusing on the thermodynamic air mass history with the aim of comparing the results from both. This approach closely follows the approach by Wernli et al. (2016): 48 h backward trajectories are started at all grid points with a cirrus cloud. The first point along the backward trajectory at which IWC falls below qcrit = 0.1 mg kg−1 is then identified, i.e., at the time of cirrus formation. If the LWC in this identified cirrus segment is larger than qcrit, the cirrus cloud is classified as liquid-origin cirrus and otherwise as in situ cirrus. Compared to the implementation by Wernli et al. (2016), we (i) apply the approach to the forward-trajectory dataset described in Sect. 2.3 and (ii) explicitly exclude secondary ice from the total cloud ice content considered for identifying cirrus formation. Secondary ice is excluded for consistency with the ice mode classification. Hence, both classification schemes analyze the same cirrus cloud segments, where and T<Tc.
2.5 Observational data used for comparison to simulations
To provide some basic checks on the physical realism of the simulations, we compare our ICON model simulations to the CLoud property dAtAset using SEVIRI, Edition 2 (CLAAS-2), observational products, with a focus on cloud water path (CWP) and cloud optical thickness (τopt) (Benas et al., 2017). The retrieval algorithm uses SEVIRI visible and near-infrared measurements to obtain τopt and the effective radius of cloud particles (rref) at the cloud top. We use the formulae of Stephens (1978) to estimate the liquid water path (LWP) and the ice water path (IWP):
with the cloud optical thickness τopt; the effective radius rref; and the liquid water and ice density, ρw and ρi, respectively. Only a single value of rref is used to represent all ice crystals in the entire atmospheric column in CLAAS-2. CWP is simply the sum of LWP and IWP. The CLASS-2 CWP data are interpolated onto the model grid for comparison. Only CLASS-2 observations that were recorded within 5 min of a model output time step are used. Cloud water path for the model simulation is simply computed by vertical integration and summation of all cloud particle classes at each grid point.
3.1 General overview of the cyclone evolution and comparison to observations
The surface cyclone began as a weak surface pressure depression on 2 October 2016 at approximately 45° N and moved over the North Atlantic (Oertel et al., 2023). The cyclone intensified while moving north toward Greenland and showed strong warm and cold sectors with an accompanying WCB from 4 to 6 October. WCB ascent led to the development of a vast cloud band with a large cirrus outflow region above Scandinavia. For a detailed discussion regarding the dynamic development of the cyclone and the vertical structure of the associated WCB, we refer to the study of Oertel et al. (2023).
The structure of the WCB-related cloud in the early mature stages (12:00 UTC on 4 October 2016) of the cyclone is visible in Fig. 1, which shows the total cloud water path (CWP) fields from CLAAS-2 retrieval and model data. The WCB-associated cloud band forms a characteristic comma-shaped region of high CWP southeast of Greenland. The WCB cloud band is most pronounced at this point in time (Oertel et al., 2023) and becomes slightly less sharp and well organized as the cyclone moves toward Europe in the next 48 h. The modeled and observed cloud fields show a very similar horizontal extent, geographic position and overall structure, although smaller and scattered clouds are not consistent everywhere between the model and observations. However, the modeled clouds contain higher values of CWP, while the CLAAS-2 data show a larger spatial coverage. Therefore we conclude that the general structure of the WCB-related cloud is captured by our ICON simulation, although the vertical water transport and condensate loading seem to be overestimated by the model.
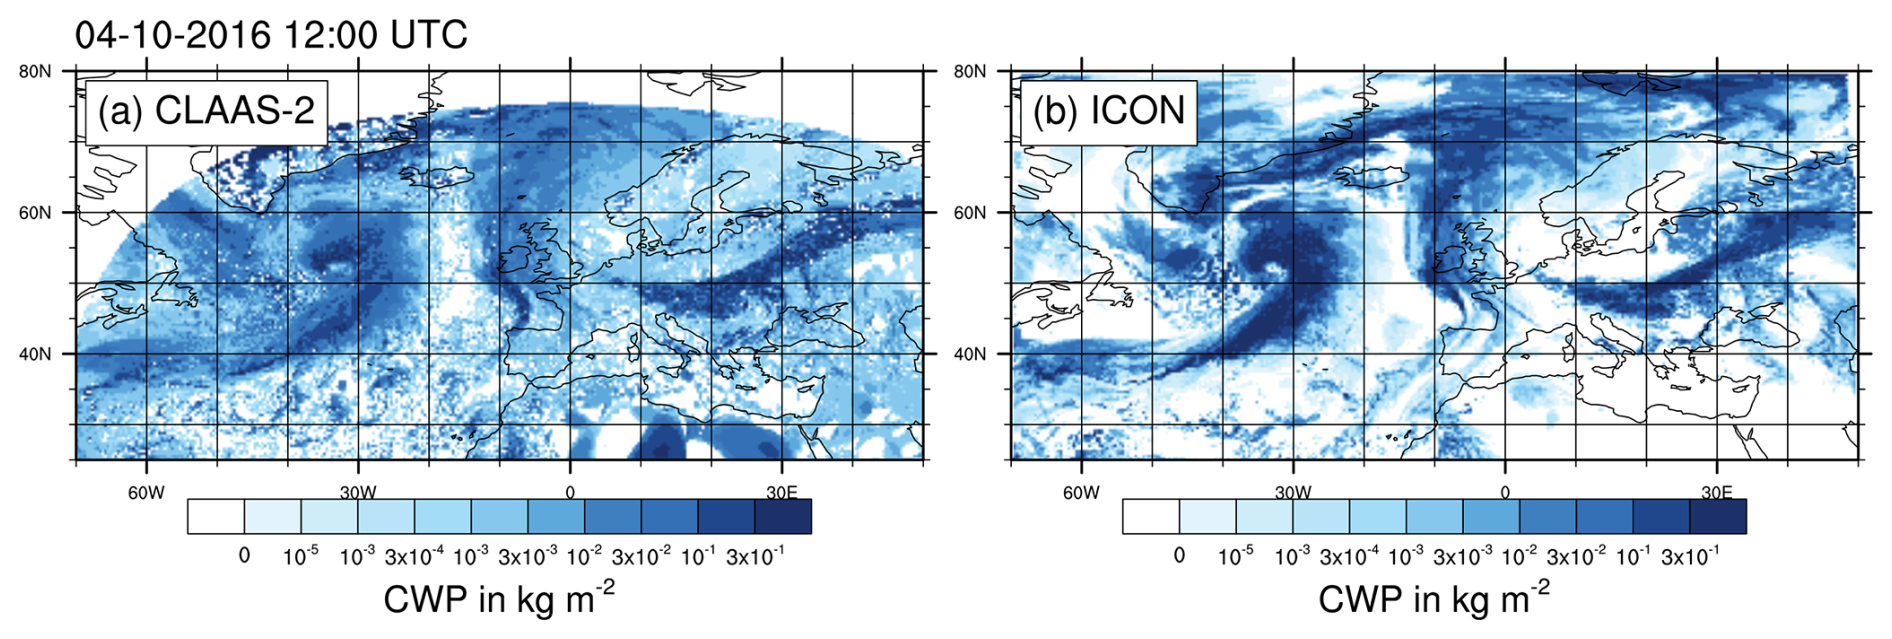
Figure 1Cloud water path (CWP) from CLAAS-2 and the ICON ice mode simulation on 4 October 2016 at 12:00 UTC. CLAAS-2 data were regridded to model grid size.
3.2 Structure and distribution of WCB clouds
The general spatial structure of the WCB is shown in Fig. 2a and b, which display the position of WCB trajectories. Overall, we identified 40 947 WCB trajectories according to our criteria for WCB ascent (see Sect. 2.3). WCB trajectories predominantly start south and east of the surface cyclone center within the warm sector. The WCB air parcels then ascend northward as a dense pack (Fig. 2a). Upon reaching Greenland, the WCB trajectories spread: the majority propagate eastward into an outflow region above Scandinavia, while the other trajectories move westward toward the cyclone center. High total cloud ice content (qtot) up to 5 ppmv is encountered in the first third of the trajectory paths, corresponding to the ascent phase, i.e., a region of large altitude changes (Fig. 2b).
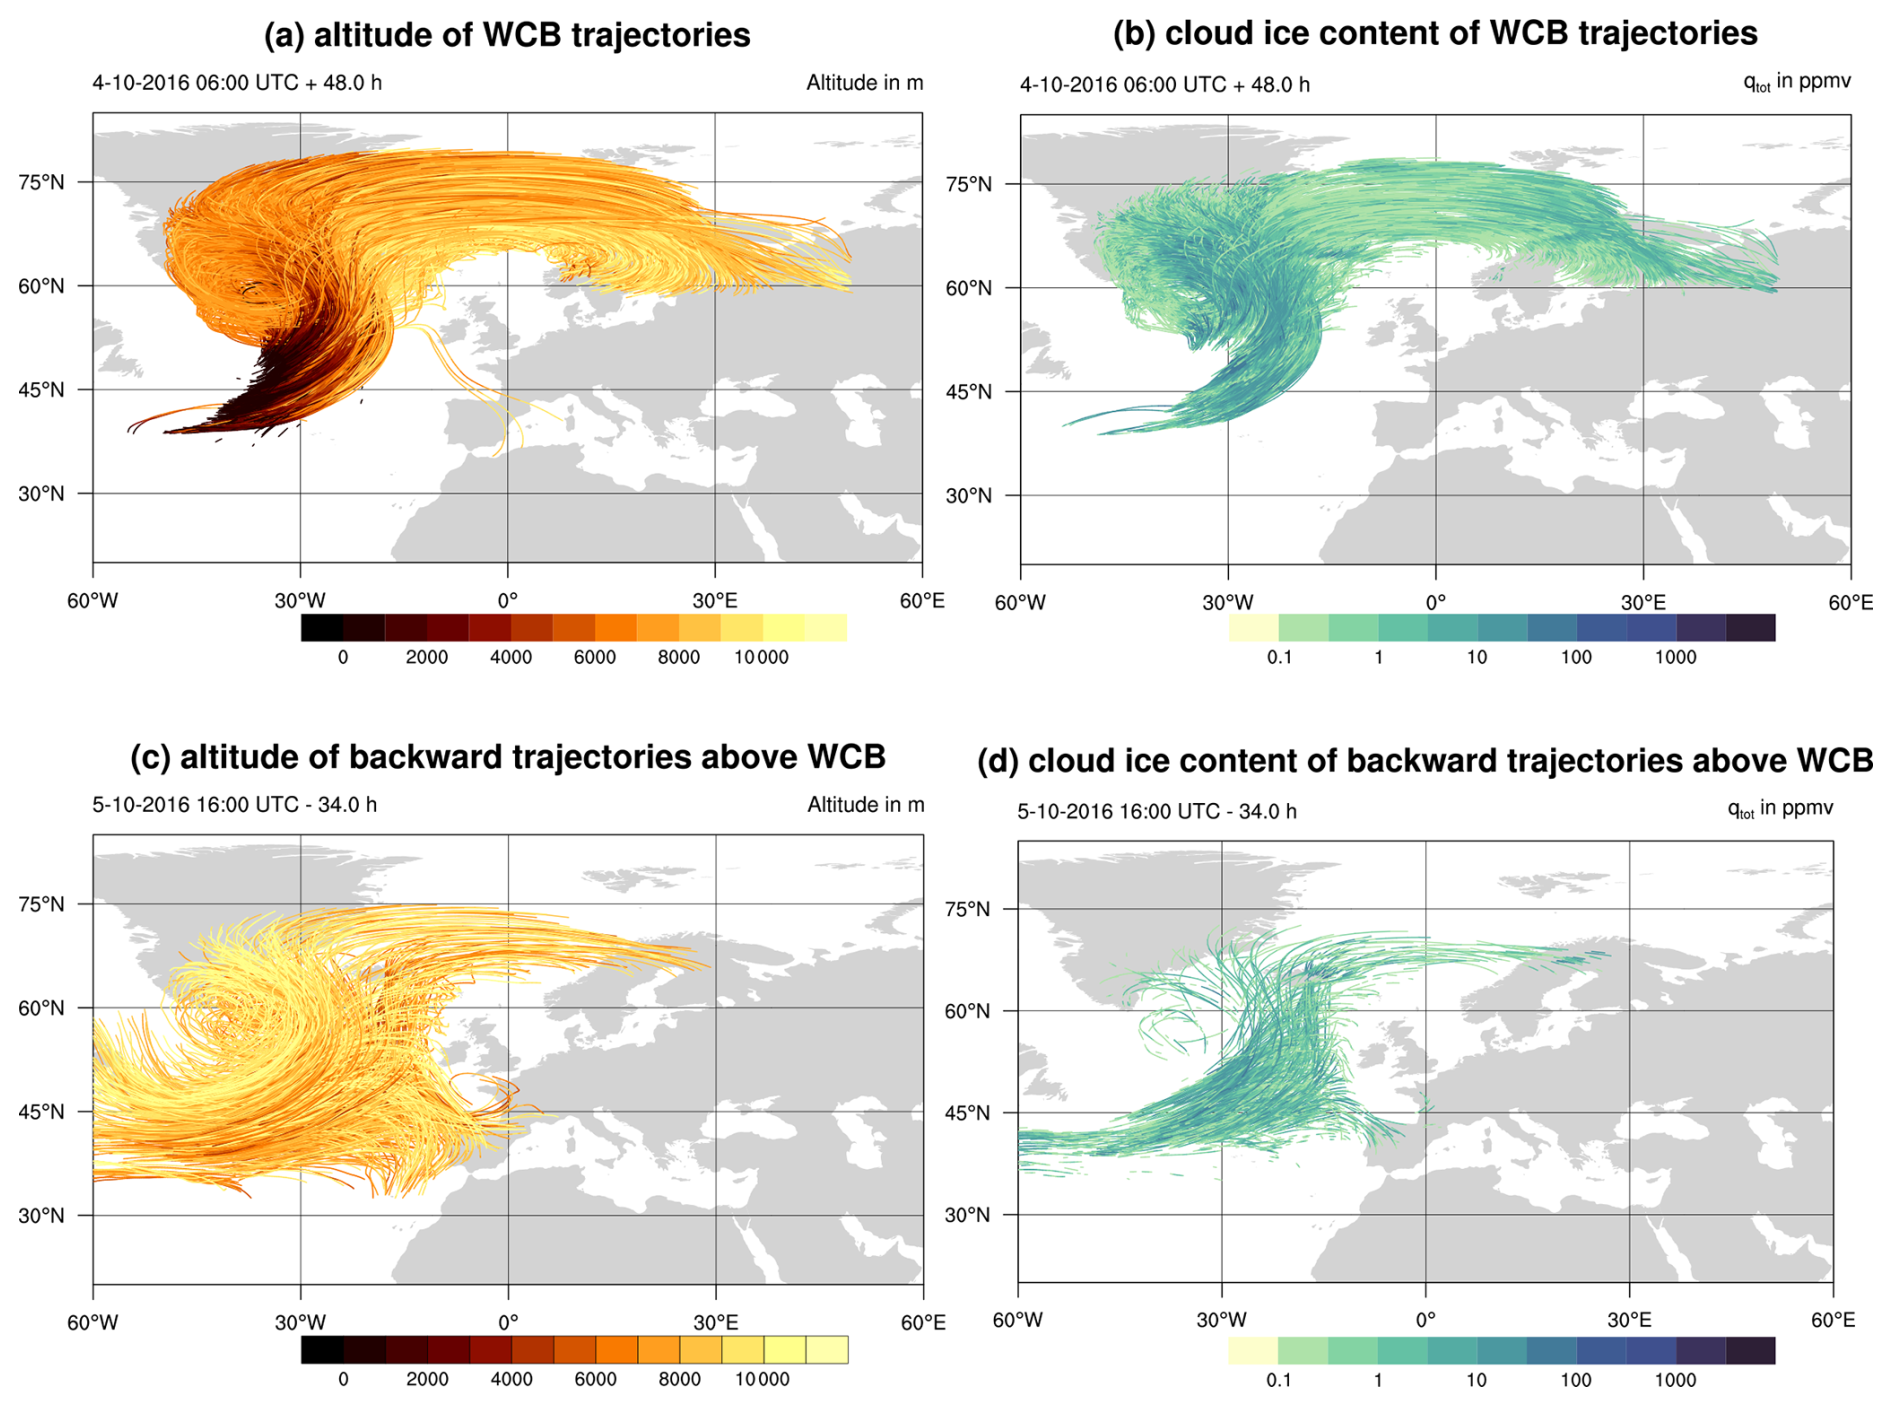
Figure 2WCB trajectories starting on 4 October at 06:00 UTC (a, b) and backward trajectories starting above the WCB on 5 October at 16:00 UTC (c, d). Trajectories are colored according to altitude (a, c) and total cloud ice content (b, d). Only a randomly selected 5 % of all trajectories used in the analysis are shown.
Figure 2c shows the spatial structure of exemplary backward trajectories above the WCB. As detailed in Sect. 2.3, these trajectories were started hourly on vertical levels above 7 km and chosen such that they intersect with WCB trajectories horizontally at least once and stay above 5 km at all times. Most sample trajectories in Fig. 2c stay at altitudes above 8 km for their entire 34 h duration. Similar to the WCB trajectories, parts of the trajectories propagate eastward into the outflow region or westward toward the cyclone center. However, a significant portion of trajectories deviates from the WCB trajectories and moves toward Spain. Figure 2c also shows two inflow regions: from the cold sector west of the cyclone center and from the mid-Atlantic Ocean. Figure 2d shows that the airstream above the WCB has a significant amount of cloud ice. However, it is not as widespread and area covering as for the WCB trajectories. The highest values of qtot (up to 5 ppmv) are located above the WCB ascent region from 35 to 15° W (compare Fig. 2a and d). Ice formed in this airstream can sediment and impact the composition and properties of WCB clouds below. We do not claim that this selection criterion captures all trajectories that might contribute to ice sedimenting into the WCB. However, it will serve as an indication of whether the sedimentation process is relevant.
The vertical velocity structure of the WCB has been identified in earlier studies to be of central importance for diabatic heating, PV modification, moisture transport pathways and precipitation formation pathways (Oertel et al., 2023; Schwenk and Miltenberger, 2024). A commonly used metric to quantify the vertical velocity structure is the WCB ascent timescale τ600, defined as the shortest time needed to complete the 600 hPa WCB ascent along a trajectory. For example, Oertel et al. (2023) showed that the fastest-ascending WCB trajectories (τ600 < 18 h) experienced stronger heating from liquid-phase cloud processes (droplet activation, riming, freezing). In contrast, for the slowest-ascending WCB trajectories (τ600 > 30 h), deposition growth of ice-phase particles was more pronounced. Likewise, the vertical velocities along the WCB, as characterized by τ600, may impact ice formation mechanisms and the outflow cirrus derived from particular regions of the ascent. This hypothesis is explored in later sections. Here we first show the τ600 distribution for our WCB trajectory dataset in Fig. 3a. Note that the histogram excludes trajectories that do not contain a cirrus cloud. Hence, trajectories which never show IWC>qcrit and T<Tc at the same time step are excluded. Thus it is not a complete picture of the dynamical structure of the WCB.
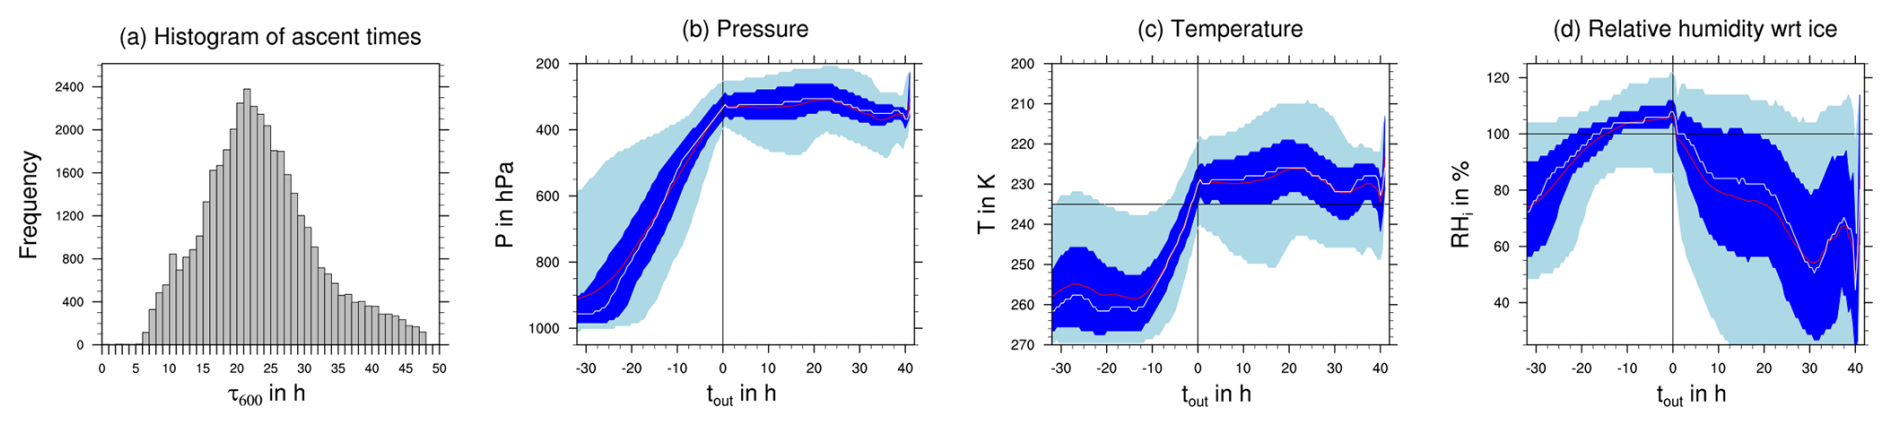
Figure 3(a) Histogram of WCB (fastest) ascent times τ600. Statistics along WCB trajectories for (b) pressure p, (c) temperature and (d) relative humidity with respect to ice RHi are shown as a function of outflow time tout. The median is indicated by the white line, and the mean is shown by the red line. The 25th to 75th percentile range is indicated by dark blue shading, and the 5th to 95th percentile range is shown in light blue shading.
The mean ascent time is 23.27 h. The fastest 5 % of trajectories need 10.5 h or less to ascend and represent convective-like ascents. Forming the tail of the distribution are the slowest 5 % of trajectories, requiring at least 31.5 h for the ascent. These trajectories represent a slow, gradual ascent. These statistics and the general shape of the distribution agree well with the distribution derived from high-resolution trajectories for the same case in Oertel et al. (2023) and is in broad agreement with distributions from other WCB cases (Rasp et al., 2016; Oertel et al., 2021; Schwenk and Miltenberger, 2024). Note that this study only uses offline-calculated trajectories, and therefore we are not able to resolve embedded convection. However, Oertel et al. (2023) found that this case only shows a small fraction of embedded convection.
Figure 3b–d show the statistical distribution of WCB trajectory pressure p, temperature T and relative humidity with respect to ice RHi as a function of outflow time tout. Outflow time refers to the time step at which the trajectory completes its ascent, as defined above. Hence, the trajectory time is shifted such that the outflow time is 0 when the τ600 ascent is completed. Outflow times with a negative sign correspond to the time during and before ascent, and those with a positive sign correspond to times after ascent. Figure 3a shows the air pressure of the trajectories as a surrogate for altitude. The trajectories rise steadily, predominantly starting between 975 and 900 hPa, as can be seen from the 25th to 75th percentiles shown in dark blue shading. The statistical distribution in the outflow (for tout = 0 h) is narrow, with most trajectories completing the ascent between 350 and 300 hPa. Most trajectories up to the 95th percentile (shaded in light blue) stay above 375 hPa for the entire period after ascent.
Figure 3c shows the temperature T distribution experienced by the WCB trajectories before, during and after ascent. Slowly ascending WCB trajectories (tout≤ − 18 h) show a broad distribution in starting T from 265 to 250 K. However, for the time period before completing ascent (−10 0 h), T falls rapidly and the statistical distribution becomes narrow. Almost all (> 95 %) WCB trajectories complete ascent at temperatures lower than the cirrus temperature level Tc = 235 K (horizontal black line). The majority of WCB trajectories (> 75 %) also stay below Tc for the entire period after ascent, although the distribution widens, as indicated by the percentile range shown (5th and 95th and 25th and 75th percentiles shown in light and dark blue shading, respectively).
Figure 3d shows the distribution of relative humidity with respect to ice RHi as a function of tout. Shortly before the end of ascent (−10 0 h), most trajectories (> 75 %) are supersaturated with respect to ice (RHi > 100 %). After ascent (tout > 0 h), RHi falls rapidly in the subsaturated regime, with a wide statistical distribution due to depletion of supersaturation through depositional growth and mixing with dry air.
In summary, most WCB trajectories experience a similar thermodynamic environment, as described by T and RHi shortly before the end of ascent (−10 0 h). T and RHi are the most important thermodynamic quantities governing growth through deposition of water vapor and activation of ice formation pathways (see, e.g., Lüttmer et al., 2025).
3.3 Occurrence of ice modes along exemplary WCB trajectory
Figure 4 shows an exemplary WCB trajectory along which all the different ice modes occur. This figure illustrates the information available from the ice mode scheme. The standard two-moment scheme would only provide information about the total cloud ice content (TOT) shown in Fig. 4a. For a detailed comparison between the standard and ice mode schemes, we refer to Lüttmer et al. (2025). Figure 4b–f show the ice mode mass content in a vertical cross section along this sample trajectory. Profiles are co-located in time and horizontal position with the air parcel, with the altitude indicated by the black line. The total ice mass content is shown in Fig. 4a: the considered air parcel starts its ascent close to the surface below 1 km altitude, and ice first occurs in the air parcel after 20 h at an altitude of about 3 km. This first ice belongs mainly to the SEC ice mode, consistent with the high-SEC-formation region in the Hallett–Mossop temperature range just below 0 °C (Fig. 4b). Here, graupel is also formed, which sediments from the deep WCB clouds extending to higher altitudes. As the parcel moves to higher altitudes and lower temperatures, it encounters frozen droplets primarily stemming from IMM (≈ 25 h, Fig. 4c). Following the parcel even further upward, it reaches an ice layer consisting predominantly of homogeneously frozen cloud droplets (FRZ; ≈ 28 h, Fig. 4d). Finally, at the lowest temperatures along the trajectory, ice crystals formed through deposition nucleation (DEP) are found (≈ 32 h, Fig. 4e). Between 30 and 40 h, we observe fall streaks of sedimenting ice stemming from the DEP mode. Hence, this clearly indicates that sedimentation connects upper-level ice formation regions with lower altitudes.
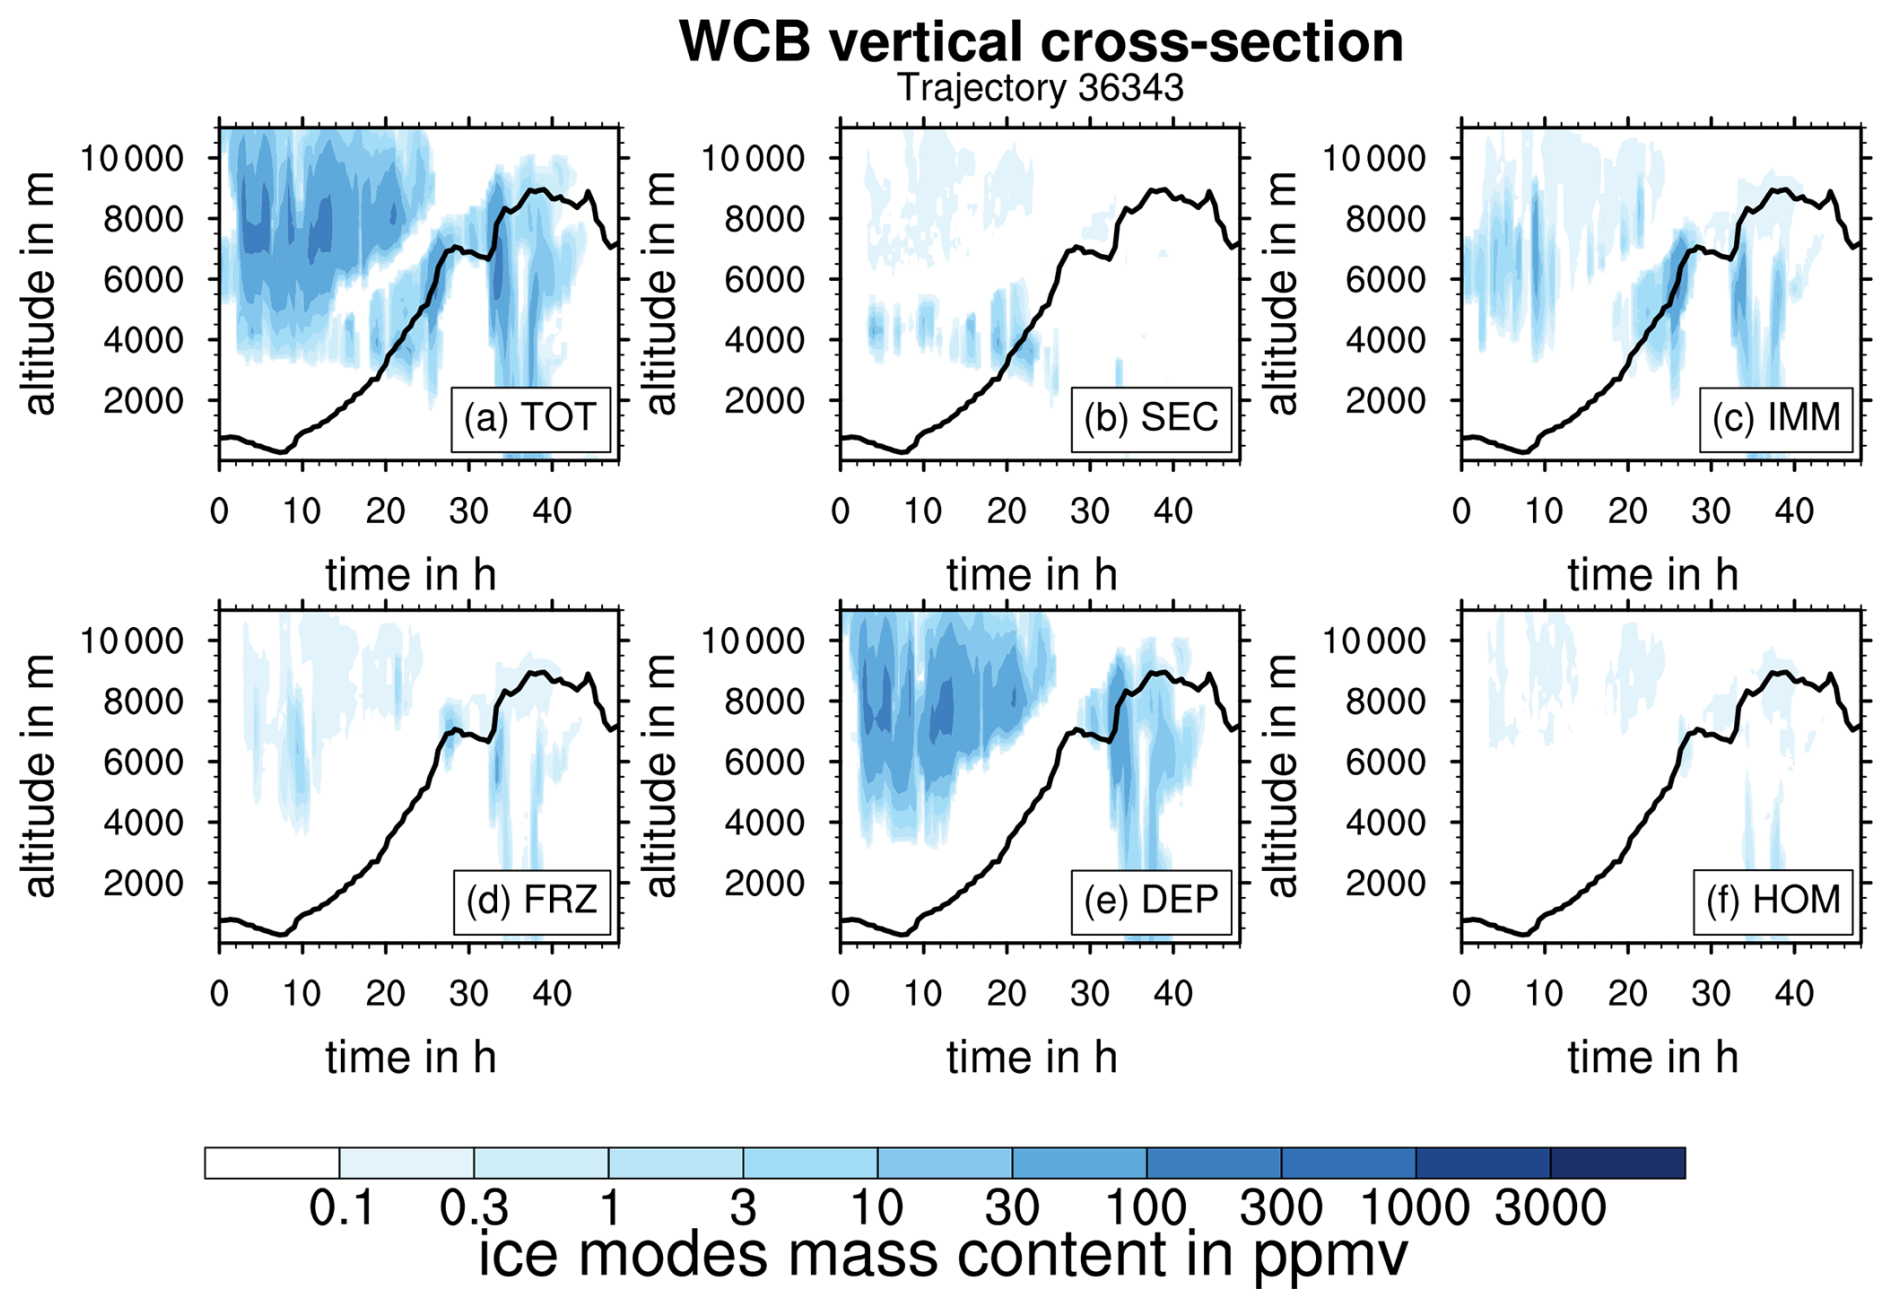
Figure 4Vertical cross section of the WCB along a sample trajectory. Profiles are co-located in time and horizontal position with the shown air parcel, with the altitude indicated by the black line. Cloud ice mass content for the five ice modes and the sum of all ice modes (TOT) are shown by the color coding in the different panels.
The vertical sequence of layers dominated by specific ice modes is overall similar to that found for the deep convection case in Lüttmer et al. (2025) and is broadly consistent with the temperature regimes, in which the different ice formation mechanisms are active albeit with (regionally) large modifications by sedimentation.
3.4 Statistics of ice mode distribution for WCB clouds
In the previous section, we have shown the vertical structure of mixed- and ice-phase WCB clouds along a single trajectory. We now evaluate the cloud structure and contribution of ice modes across all trajectories in our WCB dataset, which is stratified according to the WCB ascent time τ600. We further subdivide the data into mixed-phase clouds (with liquid and ice hydrometeors present), subcirrus clouds (with only ice hydrometeors present and T≥Tc) and cirrus clouds (T<Tc). These three categories cover all thermodynamic regimes in which ice can exist in clouds. Figure 5 shows the bulk mass and number partitioning for different cloud types and ascent times. The partitioning is quantified as the ratio of the mass content (or number concentration) of an ice mode (or microphysics class) to the integrated mass content (or number concentration) for all trajectories within that ascent time bin for the specified cloud regime (see Sect. 2.4 for details).
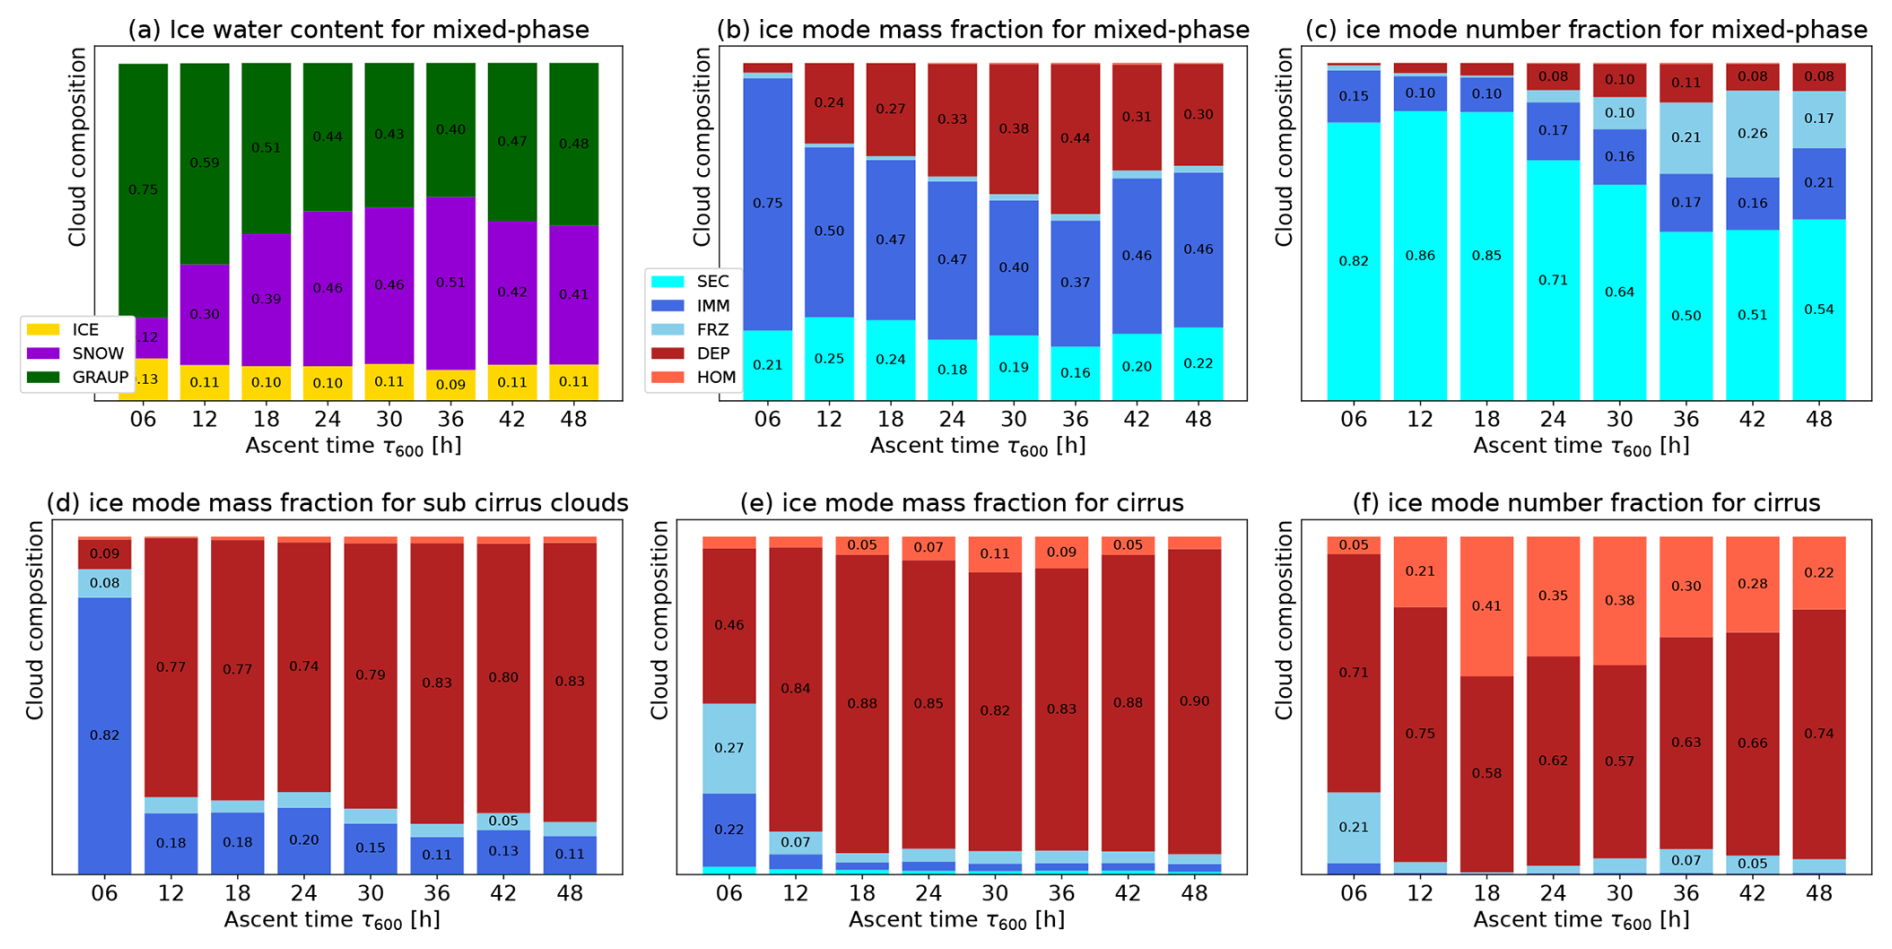
Figure 5Volume-integrated ratios of the different frozen hydrometeor types (a) and different ice modes (b–f) for the mass content (a, b, d, e) and number concentrations (c, f) as a function of the ascent timescale τ600. Panels (a)–(c) show the results for mixed-phase clouds, panel (d) shows the results for pure ice clouds at subcirrus temperatures, and panels (e) and (f) show the results for cirrus clouds. We only display value labels for relative contributions ≥ 0.05. The x-axis labels signify the upper limit of the respective ascent timescale bin.
3.4.1 Mixed-phase clouds
First, we discuss the microphysical composition of the mixed-phase WCB clouds (Fig. 5a–c). Although this is not the focus of our study, it is still important to quantify as the liquid-origin pathway is determined by the transport of liquid or already-frozen droplets into the cirrus temperature regime. About 90 % of the frozen particle mass in the mixed-phase clouds is found in the graupel and snow hydrometeor classes (Fig. 5a). Quickly ascending trajectories (≤ 18 h) have larger contributions by graupel than more slowly ascending parcels. This is consistent with larger riming rates for these trajectories found by Oertel et al. (2023). The smaller contribution of snow to quickly ascending trajectories is likely due to less time for aggregation to occur and enhanced loss of snow and ice particles through collisions with supercooled liquid, forming graupel.
In terms of the contribution of different ice formation mechanisms, frozen droplets (IMM and FRZ) provide the largest contribution to cloud ice mass in the mixed-phase cloud regime (≈ 40 %–75 % depending on τ600, Fig. 5b). However, FRZ takes up only a small portion of the mass budget. The IMM and FRZ modes compete for available cloud droplets. However, immersion freezing (IMM) is more efficient and is triggered at higher temperatures than homogeneous freezing (FRZ). In this case study, there are enough INPs available to freeze cloud droplets through immersion freezing before they are transported to low enough temperatures for homogeneous freezing of cloud droplets. There is a small trend toward an increasing contribution of IMM for shorter ascent timescales. This trend is the strongest for the fastest-ascending trajectories (τ600 < 6 h), which only constitute 0.001 % of all trajectories. This trend correlates with the decreasing snow contributions and is consistent with the hypothesis that aggregation is a major sink for the IMM ice mode (see also Lüttmer et al., 2025).
The second-largest contribution in terms of ice mass stems from the DEP mode. As deposition nucleation does not occur in mixed-phase clouds, this is a surprising finding and suggests substantial sedimentation from higher-altitude clouds into the WCB mixed-phase clouds. This is consistent with the fall streaks of DEP ice mode mass seen along the exemplary trajectory in Fig. 4. Note that the contribution of DEP to the total ice number concentration is comparatively small (Fig. 4c). This indicates that DEP ice particles are generally large, resulting in high fall speeds and sedimentation rates.
The next-largest contribution is secondary ice (SEC), accounting for about 20 % of the ice mass for all ascent times. For the ice number concentration, SEC is the dominant contribution at mixed-phase temperatures (Fig. 5c). The only source term for SEC in this study is a representation of rime splintering (Hallett–Mossop process). The strong SEC contribution is consistent with the large graupel contribution and therefore likely large riming rates (Fig. 5a). Recent studies suggest that a physical understanding of rime splintering is severely lacking (Korolev et al., 2020) and that rime splintering cannot be observed in a recent laboratory setup (Seidel et al., 2024). Thus, the model representation of SEC is highly uncertain and may be overestimated or have an unrealistic temperature structure. However, this does likely not impact our main results strongly, as the SEC mode does not reach the cirrus temperature regime.
Finally, the HOM mode is not present within the mixed-phase clouds as homogeneous nucleation only occurs at high supersaturations with respect to ice (Si > 1.35) and low temperatures. That is outside the thermodynamic regime of mixed-phase clouds. Although it is still possible for HOM to sediment into mixed-phase clouds, the homogeneous nucleation events above the WCB are mostly suppressed by DEP nucleation, as discussed later.
3.4.2 Ice-phase clouds at ≥ 235 K (subcirrus clouds)
Pure ice clouds with T≥Tc occur mainly in the upper part of the WCB ascent region. Hence, thermodynamically supercooled liquid would be supported, but clouds are already fully glaciated, and these clouds can be viewed as the transition regime between mixed-phase and cirrus clouds. We refer to these clouds as “subcirrus clouds” in the following. Figure 5d shows the contribution of different ice modes to the entire ice mass in the subcirrus WCB clouds. The DEP mode provides the largest ice mass contribution, with about 80 %, followed by IMM and then FRZ. In addition, there is a small contribution by homogeneous nucleation (HOM). The IMM ice mode dominates the ice mass only for the few trajectories with τ600≤ 6 h. Compared to the mixed-phase regime, sedimentation of DEP and HOM ice crystals (likely) becomes even more important. Sedimentation also strongly reduces the impact of the FRZ and IMM modes.
3.4.3 Ice-phase clouds at < 235 K (cirrus clouds)
Finally, we discuss the contribution of different ice modes to the ice mass content and number concentration of WCB-derived cirrus, i.e., pure ice-phase clouds for T<Tc. Figure 5e and f show the contributions of the different ice modes to the ice mass and number concentration, respectively. Ice formed through in situ pathways (DEP + HOM) dominates both the total ice mass content and the number concentration. In this temperature regime, DEP and HOM are in direct competition for available supersaturation since homogeneous nucleation requires lower temperatures and higher supersaturation over ice than deposition nucleation. The latter typically occurs first in an ascending WCB air parcel, provided INPs are available. Deposition on DEP ice can then suppress further (homogeneous) nucleation events by depleting the supersaturation. In this case, DEP dominates over HOM, especially with regard to the cloud ice mass budget. Notably, air parcels with intermediate ascent times (18 to 30 h) show a higher contribution of HOM ice than the more quickly and slowly ascending parcels.
For the fastest-ascending trajectories, there is still a substantial contribution of ice of liquid origin (IMM + FRZ), which makes up about 50 % of the ice crystal mass. However, note again that this category is populated only by very few trajectories.
Overall, the DEP ice mode provides a substantial contribution to the ice mass content and number concentration in all cloud regimes and ascent times. In situ ice is thus the main constituent of the cirrus in the WCB outflow. Quickly ascending trajectories show more efficient mixed-phase cloud processes (e.g., riming) and higher ratios of liquid-origin ice in the associated cirrus clouds. We investigate the contributions of liquid-origin and in situ formation pathways to the WCB cirrus in more detail in Sect. 4.1.
3.5 Structure and evolution of ice clouds forming above the WCB ascent region
The flow passing above the WCB often contains additional cirrus clouds that form in air masses lifted due to the strong vertical motion below but do not ascend sufficiently to meet the WCB criterion. The results in Sect. 3.4 indicate that sedimentation of ice crystals formed in these above-WCB clouds substantially influences WCB clouds. We therefore also consider in detail the spatio-temporal location and microphysical structure of the above-WCB clouds.
Figure 2c and d illustrate the airflow above the WCB for one exemplary start date. The trajectory dataset used to characterize the above-WCB flow is described in Sect. 2.3. The key ice-containing airstream starts over the North Atlantic and follows the movement of the surface cyclone northeastward. Some of the parcels follow in the WCB outflow region, while some take a more southerly path toward Spain. Many of the trajectories show high IWC, especially while located above the WCB. This is another indication that a substantial amount of ice is formed above the WCB. This ice can sediment into lower-lying WCB clouds and may be important for the microphysical composition of WCB clouds.
Figure 6 summarizes the microphysical and thermodynamic properties of the airstream above the WCB. For the statistics we only consider data points that are above a WCB trajectory at a given time step and where an ice-phase cloud is present (qtot≥qcrit). The statistics are shown as a function of temperature T, as this is a crucial parameter for ice microphysical processes. Above-WCB air parcels are found at temperatures between 250 and 215 K. This is related to the selection criterion that the trajectories have to stay above 5 km (see Sect. 2.3). The total ice water content generally decreases with altitude, as does the average size of ice particles (Fig. 6e and f). The majority of ice mass is allocated on particles formed by deposition nucleation (DEP mode, Fig. 6a–d). The fall streaks of ice from DEP, shown in Fig. 4, and the high contribution of DEP to the mixed-phase WCB clouds, shown in Fig. 5, are likely due to ice formed above the WCB.
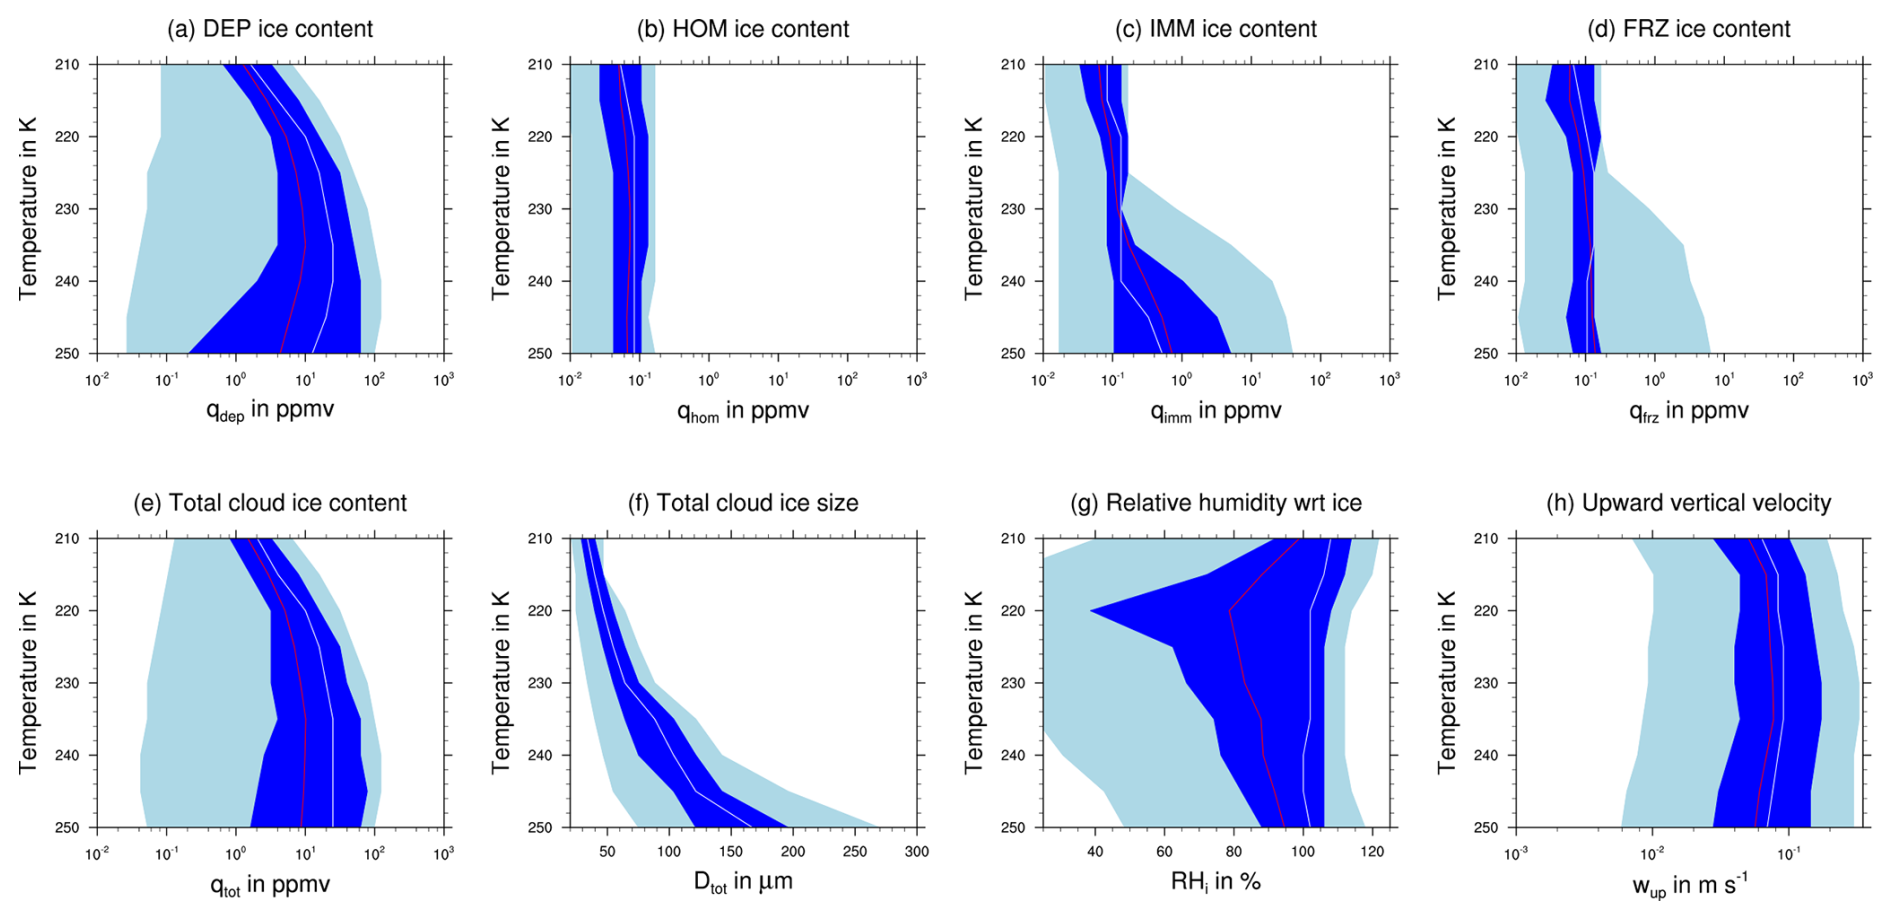
Figure 6Statistics of the mass content of the different ice modes: (a) qdep, (b) qhom, (c) qimm, (d) qfrz, (e) the total cloud ice mass content qtot, (f) the mean cloud ice size Dtot, (g) relative humidity with respect to ice RHi and (h) upward vertical velocity wup as a function of temperature. The median (mean) of each variable is shown by the white (red) line, the 25th to 75th percentile range by dark blue shading, and the 5th to 95th percentile range in light blue shading.
At temperatures above 235 K, the IMM mode contributes substantially to the total ice mass content. This suggests the presence of ice formed in mixed-phase clouds, likely due to air parcels ascending from the mid-troposphere but not fulfilling the 600 hPa ascent threshold used for identifying WCB ascent.
Key determinants for the activities of deposition and homogeneous nucleation are the vertical velocity and the supersaturation over ice. The median of vertical velocity lies mostly between 6 and 8 cm s−1, with the 75th percentile being larger than 10 cm s−1 (Fig. 6h). The median relative humidity with respect to ice RHi is between 100 % and 110 % (Fig. 6g). According to Krämer et al. (2020), the slow-updraft velocities would imply a cirrus with few but large ice crystals from heterogeneous nucleation. The relatively low RHi values are below the critical supersaturation needed for homogeneous nucleation (see Lüttmer et al., 2025). The RHi values are consistent with an existing cirrus cloud (Krämer et al., 2020) but may not be representative of the cirrus formation conditions. However, under the described thermodynamic conditions, the deposition nucleation parameterization (Hande et al., 2015) is active. This, together with the strong contribution from the DEP ice mode to the total hydrometeor mass, suggests that deposition nucleation is the key ice formation mechanism for above-WCB ice clouds.
Mean cloud ice diameter (Dtot) increases with increasing temperature and hence decreasing altitude. Larger ice crystals (mean size > 100 µm) sediment from the regime suitable for deposition nucleation into the WCB below. Overall, these statistics show that DEP ice is present above the WCB with a high mean mass content and that strong signatures associated with sedimentation are present.
The question of cirrus origin can be posed by either asking about the thermodynamic history of cirrus parcels or asking about the initial formation of the ice crystals found in a particular cirrus parcel. In the previous section, we have shown that the latter may be influenced substantially by sedimentation of ice crystals from low temperatures into mixed-phase ascending WCB parcels. The main motivation for a classification of cirrus clouds is to explain the wide variance in cirrus properties. Therefore, here we investigate the (modeled) cirrus properties and the differences between their in situ and liquid-origin parcels, where the classification is based on thermodynamic history (following W16) and our ice mode (IM) scheme.
4.1 Comparison of cirrus classification results
First, we compare the results from applying the W16 algorithm (modified for use with forward trajectories, as described in Sect. 2.4) and the ice mode (IM)-based classification. Figure 7a and b show histograms of (the fastest) WCB ascent times τ600 color-coded with the result of the classification. Trajectories are colored according to the first type of cirrus cloud encountered by the trajectory after fulfilling the 600 hPa ascent criterion. If a cirrus cloud is found at the end of the τ600 segment, the color corresponds to the classification of the cloud segment wherein τ600 is fulfilled for W16 and to the liquid-origin fraction fliq at the time step where τ600 is fulfilled for IM. If there is no cirrus cloud present at the end of ascent but cirrus forms later (qtot≥qcrit = 0.1 mg kg−1), the cloud type is projected back to the end of ascent. Note that in the IM classification, a cloud with fliq > 0.5 is considered a liquid-origin cirrus cloud and otherwise an in situ cirrus cloud.
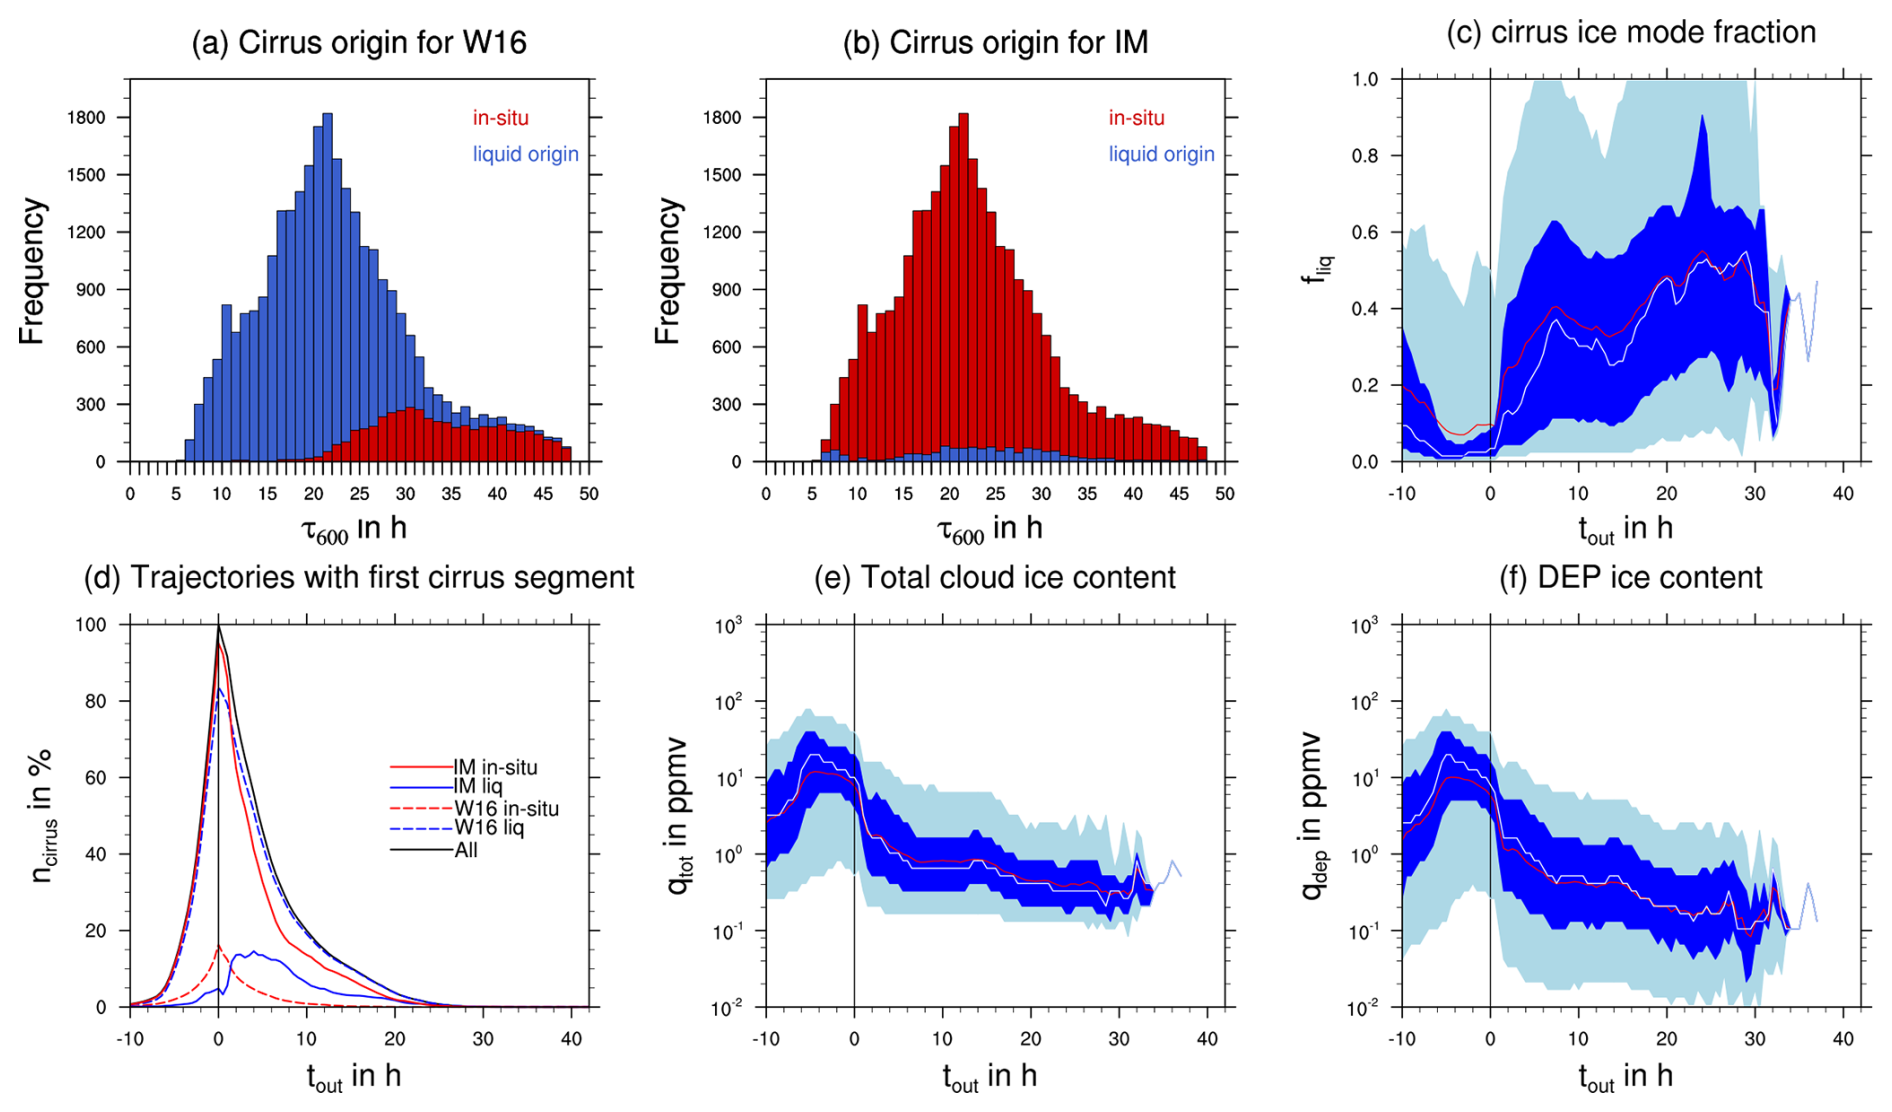
Figure 7Histogram of WCB ascent timescale τ600 colored by cirrus cloud origin according to (a) W16 and (b) our ice-mode-based classification, respectively. Panel (c) shows the liquid-origin fraction as a function of time after ascent tout, with the mean (median) indicated by the red (white) line and the 25th to 75th (5th to 95th) percentile range indicated by dark (light) blue shading. Panel (d) shows the percentage of trajectories containing a (first) cirrus segment in the outflow for all segments (black), an in situ ice mode (red), a liquid-origin ice mode (blue), W16 in situ segments (red dashed) and W16 liquid-origin (blue dashed) segments. Panels (e) and (f) show the total ice water content and the ice water content of DEP, respectively.
Figure 7a shows that W16 identifies the majority (84 %) of WCB cloud segments at the end of the τ600 segment as liquid-origin cirrus. In situ cirrus is mostly identified at large ascent times (> 25 h) and at the tail end of the distribution. This shows that many cloud segments extend from the mixed-phase regime into the cirrus cloud regime (without qtot dropping below qcrit), as only then are they classified as liquid origin by W16 (see Sect. 2.4).
Figure 7b shows the cirrus origin at the end of ascent as determined by the microphysical composition based on the IM scheme. The fraction of liquid-origin cirrus is very low (10 %), in stark contrast to the 84 % found with the W16 algorithm. The liquid-origin cirrus are found with substantial relative frequency only for the fast-ascent regime (τ600 < 18 h). In addition, some liquid-origin cirrus also appear in the intermediate-ascent regime. This is consistent with our earlier findings in Sect. 3.4, which showed that quickly ascending trajectories exhibit enhanced activity of mixed-phase processes (especially riming) and higher mass fractions of frozen droplets (IMM and FRZ). The results from the W16 classification suggest that many cloud segments show a continuous cloud from the mixed-phase regime deep into the cirrus regime, which would imply a dominance of liquid-origin cirrus at the end of ascent. However, sedimentation of DEP ice from clouds above the WCB is abundant (see Sect. 3.5). This makes DEP the predominant ice mode, leading to an in situ cirrus classification for the majority of parcels.
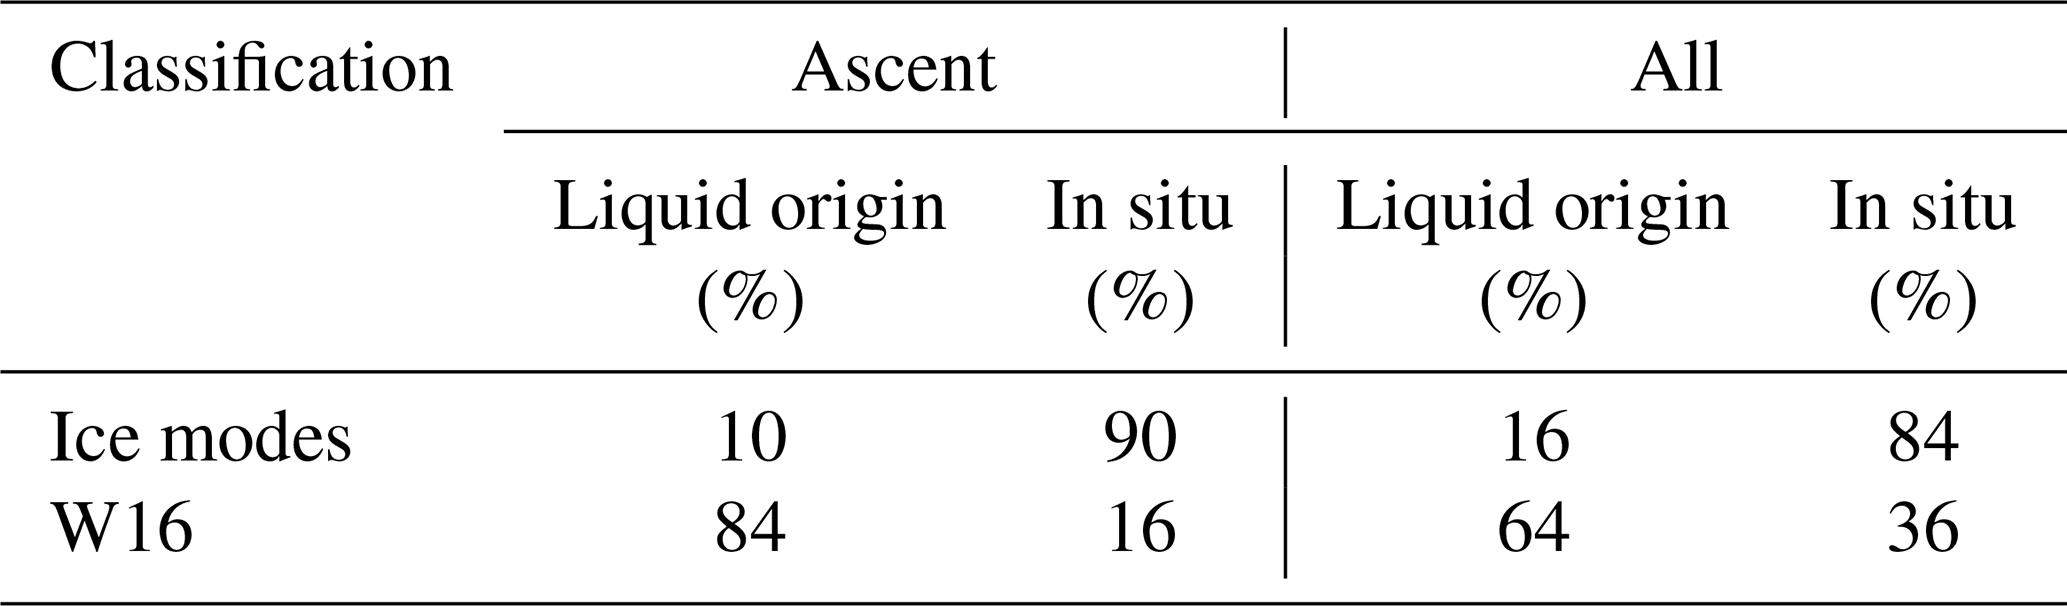
So far we have only considered the liquid-origin and in situ classification of the cloud segment directly after the end of the (fastest) ascent. In addition, Table 1 also shows the classification, including all cloud segments where cirrus clouds are present in the WCB trajectories, i.e., also including cloud segments that are separated by segments of clear-sky conditions from the cloud formed during WCB ascent. The IM classification only differs slightly, with a 6 % increase in in situ cirrus abundance and a corresponding decrease in liquid-origin cirrus. Hence, ice from the DEP and HOM modes dominates the cirrus composition at (almost) all times. Classification following W16 suggests an increase of 20 % in in situ cirrus abundance, as cirrus clouds forming disjunct from the WCB ascent cloud band are likely formed at low temperatures and below water saturation. Still, large disagreement with the IM scheme remains.
Table 1Cirrus cloud composition following the ice mode and W16 classification. “Ascent” includes the first type of cirrus encountered after WCB ascent, i.e., at the end of τ600. “All” includes all points of the WCB trajectory where cirrus is present.
In summary, the classifications of cirrus according to thermodynamic pathways (based on the W16 algorithm) and according to initial ice formation processes (based on the IM algorithm) do not agree. To interpret the differences and to understand their importance for cirrus properties, we have to consider the different definitions of in situ and liquid origin in both approaches. In this study the liquid-origin fraction is determined entirely by the formation mechanism of the ice particles. Whether that is the sole determinant of the cirrus properties or whether growth conditions and microphysical processes encountered along the trajectories are more important for the outflow cirrus properties needs to be determined. For example, if a parcel passed through mixed-phase clouds, it was subject to riming, aggregation and strong depositional growth (Wernli et al., 2016), which might lead to higher ice water content and larger ice crystals than for cirrus clouds that only experience the thermodynamic environment of the upper troposphere. In that case the W16 algorithm is useful for determining which cirrus clouds recently experienced mixed-phase cloud processes. By applying both classifications and then comparing the microphysical properties and their evolution for our case, we address this question in Sect. 4.3 after considering the temporal evolution of microphysical properties along all outflow trajectories (Sect. 4.2).
4.2 Evolution of cirrus properties in WCB outflow (incl. liquid fraction)
We now investigate the cirrus properties during and after ascent. For the analysis we only consider the first cirrus segment that exists at the end of ascent. Parcels with cirrus segments (qtot>qcrit and T<Tc) are included in the statistics for the time period in which they contain a cirrus cloud. We apply this additional selection criterion as we cannot clearly associate the (possible) formation of subsequent cirrus segments with the ascent of the WCB.
Figure 7d shows the percentage of WCB trajectories with cirrus segments ncirrus contributing to the statistics shown in the following as a function of outflow time tout. Here we are only interested in the black line that includes all cirrus segments independent of classification. We discuss the percentage of cirrus fragments belonging to the respective classifications in Sect. 4.3. As we only consider WCB trajectories with a cirrus segment at tout = 0 h, ncirrus equals 100 % for tout = 0 h by construction. At tout = 10 h, ncirrus falls to 20 % as most initial cirrus cloud segments have dissolved through sublimation or sedimentation. At tout = 24 h, ncirrus is below 1 %; thus the statistics after this time contain only few parcels with persistent cirrus clouds.
In Sect. 2.4 we introduced the liquid-origin (mass) fraction fliq, which quantifies the degree to which a (cirrus) cloud consists of ice formed by in situ or liquid-origin formation processes. We classify a cirrus as liquid origin if the liquid-origin fraction is close to 1 and as in situ if the liquid-origin fraction is close to 0. Figure 7c shows the statistical distribution of cirrus liquid-origin fraction as a function of tout. Before ascent (black line), most of the trajectories are dominated by in-situ-formed ice (median and 75th percentile below fliq = 0.15). The liquid-origin fraction rapidly drops further toward the end of ascent (tout = 0 h), where the distribution is very narrow. Liquid-origin ice has likely sedimented out of the trajectory at this point, and in situ ice formation processes within or above the WCB dominate the microphysical composition of the cirrus cloud. This also agrees with the results shown in Fig. 7b, which also show the dominance of in-situ-formed ice at tout = 0 h.
Almost none of the WCB trajectories reach liquid-origin fractions close to 1 after ascent. However, the liquid origin in general increases up to a mean (red line) of 0.5 for a few parcels, in which the cirrus segment persists longer than 20 h. This is likely a result of ice with large masses formed by in situ processes sedimenting out of the WCB trajectories, with remnants of ice formed by liquid-origin processes with very small masses remaining. Thus, a few hours after the end of ascent, the WCB trajectories contain only thin cirrus. This cirrus is a remnant of ice from different formation pathways. The thin nature of the outflow cirrus is also evident when considering the total ice mass content qtot shown in Fig. 7e: qtot decreases by more than 1 order of magnitude in the first 10 h after the end of ascent. The DEP ice mass content, the dominant in situ ice mode in the considered clouds, shown in Fig. 7f, behaves very similar to qtot, i.e., decreasing rapidly after tout = 0 h.
4.3 Evolution of microphysical properties along in situ and liquid-origin cirrus parcels
We now compare the evolution of microphysical properties in the subsets of cirrus parcels classified as either in situ or liquid origin by the W16 algorithm and our IM method. We contrast the in situ cirrus properties with the liquid-origin cirrus properties in both classification schemes and compare them to typical cirrus characteristics of strongly ascending WCB trajectories, as found in the literature (see Luebke et al., 2016; Wolf et al., 2018; Krämer et al., 2020). Note that the IM classification is a point-wise classification. Hence it can change at each time step, as opposed to the W16 classification, which considers only entire cirrus segments (see Sect. 2.4).
Figure 8 shows the time evolution of the total ice mass content (Fig. 8a–d), total ice number concentration (Fig. 8e–h) and liquid-origin fraction (Fig. 8i–l). The evolution is shown separately for cirrus classified as (i) liquid origin by W16 (Fig. 8a, e and i), (ii) liquid origin by IM (Fig. 8b, f and j), (iii) in situ by W16 (Fig. 8c, g and k) and (iv) in situ by IM (Fig. 8d, h and l).
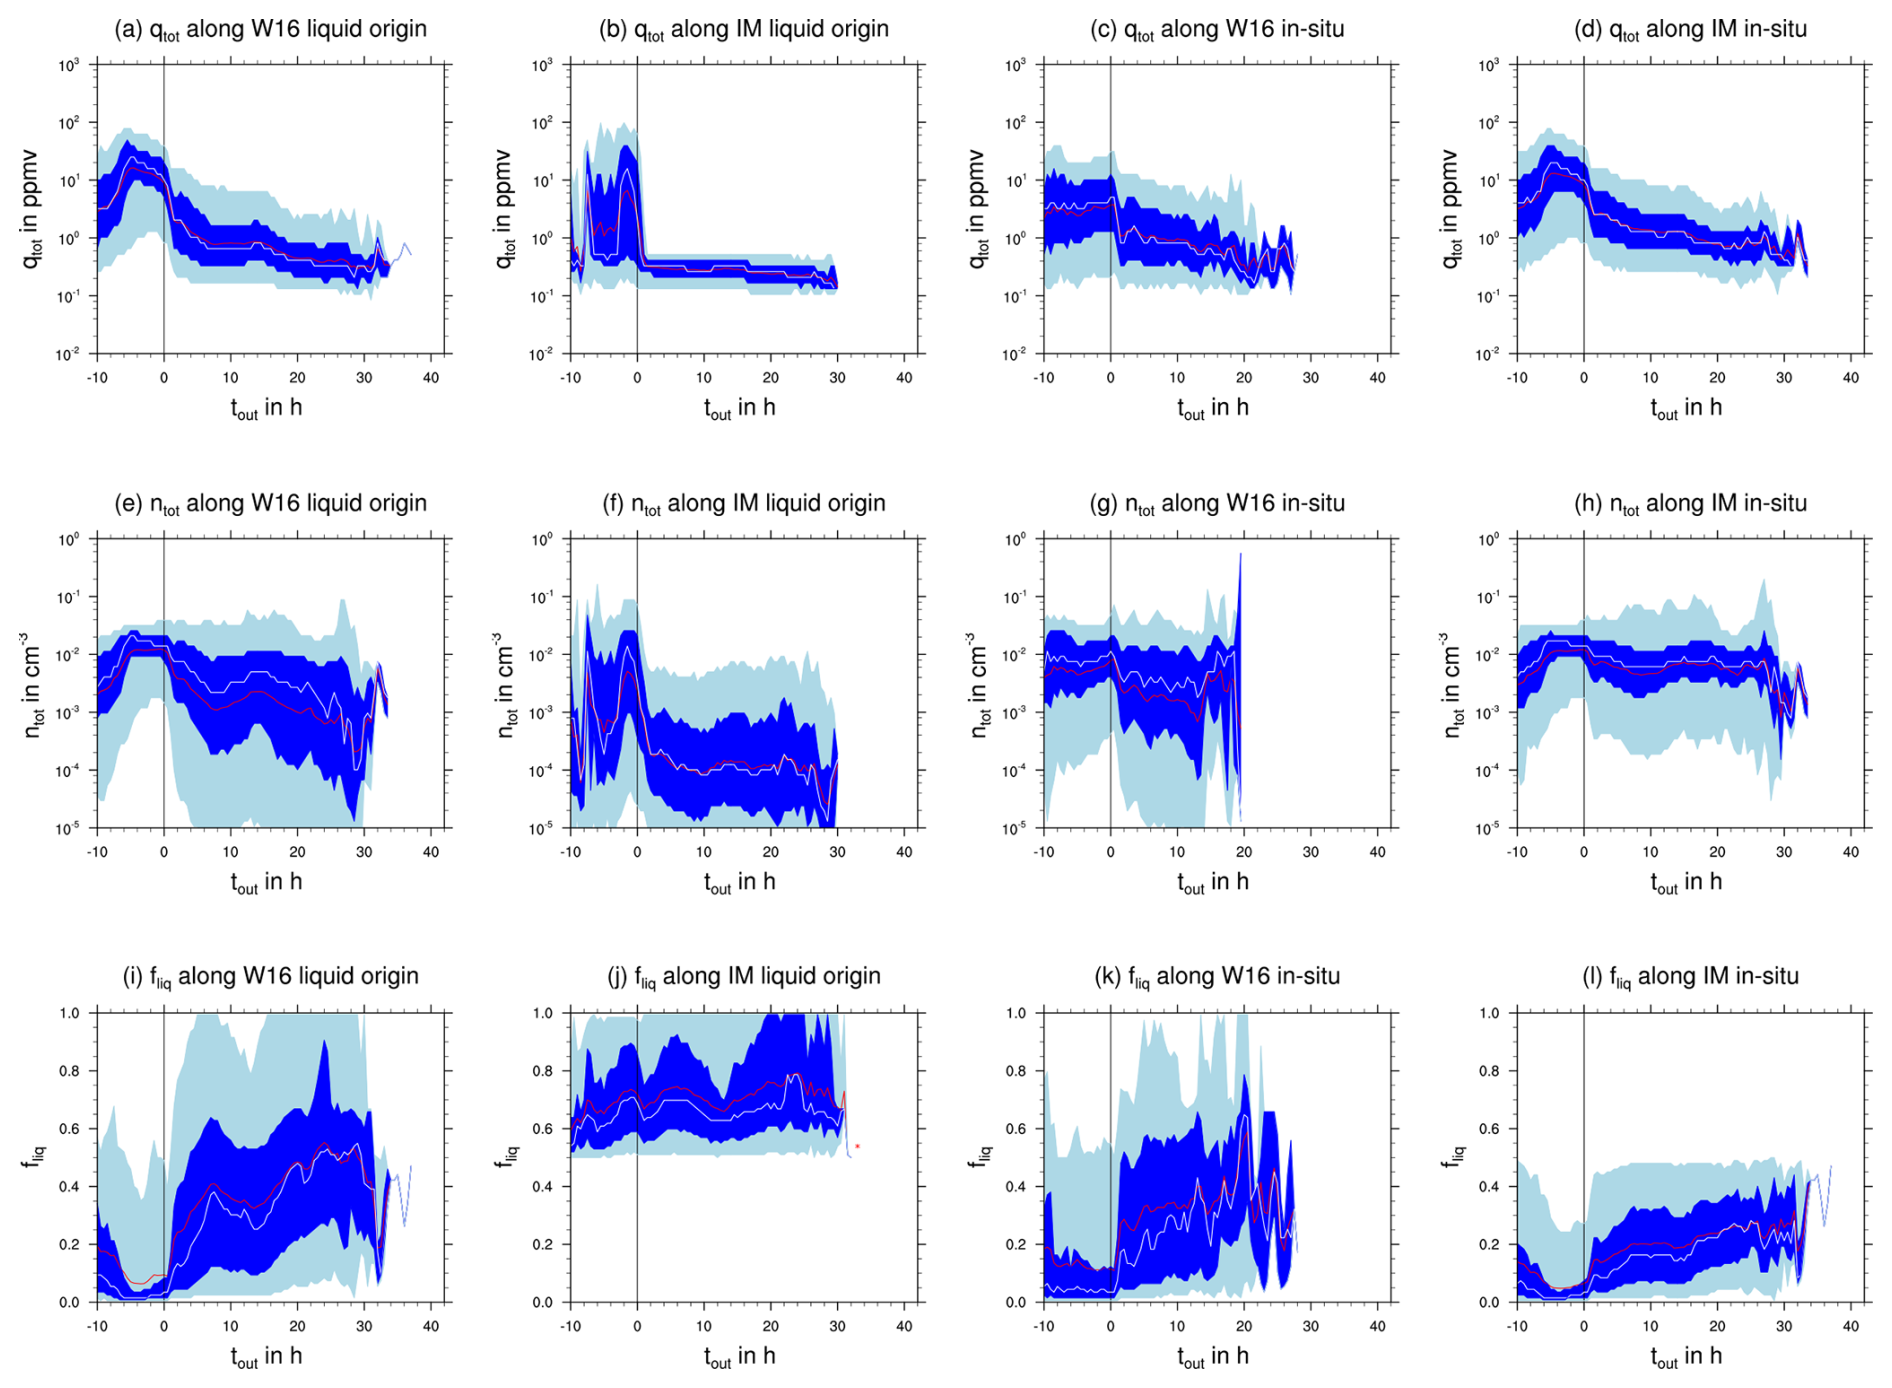
Figure 8Statistics of the total ice mass content qtot (a–d), total ice number concentration ntot (e–h) and liquid-origin fraction fliq (i–l) along liquid-origin and in situ sections, as identified by W16 (first and third columns) and the IM method (second and fourth columns) for the first cirrus segment after the end of ascent. The median (mean) of each variable is represented by the white (red) line, and the 25th to 75th (5th to 95th) percentile range is indicated by dark (light) blue shading.
4.3.1 W16 liquid origin
In cirrus segments classified as liquid origin by W16 (84 % of all WCB cirrus parcels; referred to as W16 liquid origin in the following), the total ice content qtot peaks −5 h before ascent is completed (Fig. 8a). At its peak, the median qtot is 20 ppmv, which is within the range given for ice content of liquid-origin cirrus in the literature (Krämer et al., 2020). The ice content rapidly falls below 10 ppmv after the end of ascent and continues to decrease until the end of the considered time period. However, the width of the distribution (quantified by the interquartile range) changes only slightly and remains within 1 order of magnitude of the median. Figure 8e shows the evolution of total ice number concentration ntot. ntot reaches its maximal value of 0.01 cm−3 during the ascent phase, which is below the values for (idealized) liquid-origin cirrus (0.05–2 cm−3) stated in the literature (Krämer et al., 2020). Similar to qtot, ntot also decreases after ascent but not as strongly. Finally, we consider the information on ice formation pathways from the ice mode schemes for the subsets of cirrus that are classified as liquid origin by W16. Figure 8i shows the liquid-origin fraction fliq. fliq is very low (close to 0) between −6 and 0 h. At −6 h, parcels are located in the mean at about 500 hPa, i.e., about 100–200 hPa below outflow level. Temperatures are about −30 °C, and parcels are typically fully glaciated (Fig. 3). During this time period, the total ice content qtot reaches its maximum along the trajectories (Fig. 8a). Under these conditions, one would expect a much stronger influence of ice formation processes operating at water saturation, but sedimentation of ice from higher altitudes and temperatures below the homogeneous freezing temperature (235 K) dominates the ice number concentration and thereby ice mass in this region of the WCB airstream (see also discussion in Sect. 4.1). Very efficient removal of ice formed at warmer temperatures through mixed-phase processes may further contribute to this signal (Schwenk and Miltenberger, 2024).
4.3.2 IM liquid origin
In cirrus segments classified as liquid origin by our IM-based method (10 % of all WCB cirrus parcels, referred to as ice mode liquid origin in the following), total ice content qtot also reaches its maximum before the end of ascent (tout = −2 h) (Fig. 8b). Despite a similar absolute value, qtot overall has large variability during the ascent phase compared to W16 liquid-origin cirrus. This may be a consequence of the small number of IM liquid-origin parcels or reflect large diversity in microphysical properties. After the end of ascent, the mean qtot very rapidly falls below 1 ppmv and remains almost 2 orders of magnitude below the maximum qtot value until the end of the considered time period. This is consistent with ice mode liquid-origin cirrus being optically very thin, as discussed in Sect. 4.2. Compared to W16 liquid-origin parcels, qtot is a factor of approximately 2 smaller in the first 24 h of the outflow cirrus lifetime. The total ice crystal number concentration ntot behaves similarly to qtot, with a peak in the ascent phase and rapid decrease afterward (Fig. 8f). In the outflow (tout > 0 h), ntot varies over about 2 orders of magnitude across parcels (interquartile range), with a mean ntot of about 10−4 cm−3. Hence, the mean ntot is about 1 order of magnitude lower than in W16 liquid-origin cirrus. By construction, all fliq values are above 0.5 for IM liquid-origin cirrus parcels (Fig. 8j). The median value is consistently around 0.75, indicating that at least 50 % of cirrus parcels are substantially influenced by ice formed by in situ formation processes.
4.3.3 W16 in situ origin
In cirrus segments classified as in situ origin by W16 (16 % of all WCB cirrus parcels, referred to as W16 in situ in the following), qtot in the ascent phase remains almost constant and with a mean value of around 3 ppmv, which is almost 1 order of magnitude smaller than the maximum value reached in W16 liquid-origin parcels (Fig. 8c). After the ascent, qtot decreases continuously, reaching similar values to those in W16 liquid-origin cirrus. The median of ntot remains lower in the ascent by a factor of approximately 2 compared to that of W16 liquid-origin parcels (Fig. 8g). In the outflow phase, the mean ntot is around 0.01 cm−3, which is similar to that of W16 liquid-origin parcels but much larger than that of IM liquid-origin cirrus. ntot is in the range expected for slow-updraft in situ cirrus (Krämer et al., 2020). The liquid-origin fraction fliq behaves qualitatively similarly to that of W16 liquid-origin parcels (Fig. 8k). Hence, differences between W16 liquid-origin and in situ cirrus are mainly found in the ascent phase (tout < 0 h), while in the outflow phase, cirrus in both categories show very similar properties.
4.3.4 IM in situ origin
Finally, we consider cirrus segments classified as in situ origin by our IM method (84 % of all WCB cirrus parcels at ascent, referred to as ice mode in situ in the following). qtot reaches its largest values of about 10 ppmv at tout = −6 h and decreases only slightly until tout = 0 h (Fig. 8d). These values are more consistent with those previously reported for liquid-origin cirrus (Krämer et al., 2020). After the end of ascent, qtot decreases continuously but remains above the values for both W16 cirrus categories by a factor of about 2 and above the values found for IM liquid-origin cirrus by a factor of about 3. The evolution of ntot in the ascent phase strongly resembles that of W16 liquid-origin cirrus, with a maximum value of 0.02 cm−3 reached at about tout = −6 h (Fig. 8h). At tout > 0 h, ntot decreases slowly but less strongly than in W16 liquid-origin cirrus. With mean and median values of around 0.007 cm−3, ntot is larger by a factor of about 2 compared to both W16 cirrus categories and almost an order of magnitude larger than in IM in situ cirrus. This value is consistent with ice number concentrations expected for slow-updraft in situ cirrus from observations and idealized scenarios (Krämer et al., 2020). Again, by construction, fliq is below 0.5 and stays between 0 and 0.2 for the majority of the IM in situ segments (Fig. 8l). Hence, the overall microphysical characteristics in the ascent phase resemble those of W16 liquid origin, while there are substantial differences in the outflow phase from both W16 cirrus categories and the IM in situ cirrus.
4.3.5 Summary
While the two cirrus categories identified by W16 differ substantially in the ascent phase (tout < 0 h), they have very similar properties in the outflow phase (tout > 0 h). In contrast, the two cirrus categories classified by our IM-based method differ more strongly in the outflow phase and somewhat less in the ascent phase. In the ascent phase, qtot values for both W16 and IM liquid-origin cirrus are consistent with those reported for liquid-origin cirrus in the existing literature; ntot values are lower than those reported for liquid-origin cirrus. For W16 in situ cirrus, qtot and ntot are also consistent with expectations, but IM in situ cirrus has substantially larger qtot. Approximately 2–4 h into the WCB outflow phase, qtot and ntot values for all considered cirrus categories are more consistent with previously reported values for slow-updraft in situ cirrus than for liquid-origin cirrus. The results suggest that efficient removal of mixed-phase condensate, along with sedimentation of ice formed at (very) low temperatures (DEP/HOM ice modes), is decisive for the microphysical properties of the cirrus in a large fraction WCB outflow parcels.
The WCB outflow cirrus, i.e., cirrus found in parcels that rise in the WCB core region, is found to be primarily formed by deposition nucleation (DEP). For most WCB outflow cirrus parcels, the DEP ice mode accounted for more than 50 % of the ice water content. Ice particles initially formed by liquid-origin processes are only relevant for quickly ascending WCB trajectories. After the end of the WCB ascent, the contribution of ice from liquid-origin processes becomes increasingly more important due to the efficient sedimentation of (large) DEP ice crystals. Hence, large parts of the outflow cirrus (in an Eulerian sense) are dominated by ice formed by liquid-origin processes, but outflow cirrus are relatively thin with a low ice water content and low ice number concentrations.
The ice mode scheme further allows us to revisit the question of what processes control cirrus microphysical properties. To this end, we classified WCB outflow cirrus once according to their thermodynamic history, following the classification method proposed by Wernli et al. (2016) (W16 classification), and once according to the dominant ice particle formation mechanism based on the information from the ice mode scheme (IM-based classification). The W16 classification identifies most WCB outflow cirrus segments as liquid origin because the corresponding air parcels contain ice continuously from the mixed-phase into the cirrus cloud regime. In contrast, the ice-mode-based classification identifies most trajectories as in situ origin due to the large fraction of ice water content associated with ice particles formed by deposition nucleation (DEP). These ice particles formed above the main WCB ascent region and sedimented into the ascending air mass. The study by Wernli et al. (2016) demonstrated that for two WCB case studies, the WCB outflow cirrus were embedded in a slowly ascending air mass, where ice formed in an in situ thermodynamic environment. They surmised that at the interface between these two air masses, sedimentation could possibly “confuse” the pure thermodynamic cirrus origin classification as it does not take sedimentation into account. The results from our study using the ice mode (IM) scheme confirm that such an interaction between an ascending WCB and an enveloping air mass occurs for the investigated WCB case.
Composite microphysical properties of different cirrus origin classes identified either with the W16 or the IM-based classification method are used to investigate the degree to which the sedimenting in situ ice impacts the properties of thermodynamically liquid-origin cirrus. While liquid- and in-situ-origin cirrus classified with W16 differ substantially in the ascent phase, they quickly attain a similar ice water content and number concentration after the end of the WCB ascent. In contrast, the two cirrus categories identified with the IM-based method differ more strongly in the outflow phase but somewhat less in the ascent phase compared to those identified by W16.
Hence, we can conclude that classification oriented toward sedimentation and ice formation processes is important for vertically deep and complex cloud systems. However, our analysis includes only cirrus formed in WCB trajectories, i.e., strongly ascending parcels. Therefore, our results do not discredit the idea that thermodynamic history is important for cirrus properties but rather suggest that different ice nucleation processes and sedimentation redistribution of ice may modulate cirrus origin and properties. Thermodynamical classification has proven useful for field campaign planning and for interpreting large datasets of cirrus observations (e.g., Krämer et al., 2020). It likely remains relevant when considering the large variety of cirrus clouds from a global perspective. For a detailed investigation of cirrus derived from complex, vertically deep cloud systems in particular and to understand cirrus evolution after initial formation, further subcategories are needed that account for sedimentation fluxes and ice formation processes in addition to thermodynamic information. This will lead to more clearly defined cirrus property categories. However, given that our current approach is computationally quite expensive, it is not easily applicable to, e.g., flight campaign planning and climatological analysis. In future studies we will explore a few possibilities of cheaper classification methods that take into account some of the information on particle sedimentation.
Limitations of the present study should be mentioned here: generally, the ice (formation) processes are not well understood, and their representation in numerical models is subject to large uncertainties. In the present study, the most important parameter choices are the prescribed distribution of ice-nucleating particles (INPs) and their activation parameterization. These choices vary widely between commonly used parameterizations of deposition and immersion freezing (e.g., Hawker et al., 2021; Lüttmer et al., 2025). Therefore, we will address the impact of these parameter choices for cirrus properties and their controls in a follow-up study.
Furthermore, the present study focused mainly on the cirrus formed in WCB trajectories, but we also found that ice formed in the more slowly rising airstream surrounding the main WCB ascent is important mainly as a source of ice formed by deposition nucleation. Future studies should consider the thermodynamic and microphysical evolution of this surrounding cirrus, as well as its interaction with the WCB outflow cirrus, in more detail. It would also be interesting to better understand the horizontal and spatial distribution of the various cirrus types in WCB outflow.
| Abbreviation | Description |
| DEP | deposition nucleation ice mode |
| FRZ | homogeneous freezing of clouddroplets ice mode |
| HOM | homogeneous freezing of solutiondroplets ice mode |
| IM | ice-mode-based classification |
| IMM | immersion freezing ice mode |
| IWC | ice water content |
| IWP | ice water path |
| LWC | liquid water content |
| SEC | secondary ice mode |
| TOT | sum of all ice modes |
| WCB | warm conveyor belt |
| W16 | thermodynamically basedclassification (Wernli et al., 2016) |
We developed an algorithm in Python 3 to detect cyclones in pressure fields on a regular grid. An object-oriented programming approach lends itself to identifying features. The principles are based on the work of Wernli and Schwierz (2006); however we do not include cyclone tracking as we are merely interested in the area where a cyclone is present at any given time. Similar to WS06, the algorithm is based on the analysis of pressure contours and minima. But instead of starting from (local) minima and consecutively calculating closed contours encapsulating them, we calculate all isobars and filter them using various criteria until we obtain the largest closed contour enclosing local minima.
The algorithm requires a pressure field and a topography file as input. When identifying a cyclone at the surface level, it is recommended to use data already reduced to mean sea level, but otherwise there is a (simple) pressure reduction option available in the program. At first, minima in the pressure field are detected by a simple comparison to their neighbors. The number of adjacent points taken into account depends on the resolution of the grid so that the search range is 5°. In a limited-area mode, points near the domain boundary are ignored. For global data, a cyclic boundary data mode is available. Values that are unrealistic for a surface level cyclone, such as minima below 900 hPa, are discarded. Similar minima that are located 1.5 km above sea level are filtered out.
Contours are calculated as isobars in 2 hPa intervals. All non-closed contours are discarded, which limits the applicability of the algorithm in a limited-area mode if the cyclone feature of interest is located close to the domain boundary. For model data with high spatial resolution in particular, there will be numerous closed contours that are connected to non-cyclone features like landmasses. Therefore, we additionally filter out contours that are too short (< 200 km) or only enclose a small area (100 000 km2), where for the latter we transform contour coordinates to a sinusoidal equal-area map projection and use Green's theorem for closed curves.
Next, the contours are associated with the minima that they enclose. Any minima without enclosing contours or contours without associated minima are discarded. The minima are now characterized depending on their distance to each other, their depth and if they share enclosing contours. Minima within the clustering distance (< 2000 km) and with a shared contour are attributed to the same cyclone, with the deepest being the primary minima and the others being secondary minima. Contours that enclose multiple minima outside the clustering distance are discarded so that they are classified as different cyclones. Lastly, we take the largest contour enclosing the (deepest) minima and label every point within as being inside a cyclone. Note that the values of all selection criteria should be adjusted and tested for the specifics of the chosen dataset. The spatial resolution and smoothness of the surface pressure in particular vary strongly between atmospheric models. The algorithm was tested on ICON data with effective grid resolutions of 7.5 and 13 km and on ERA5 data with a resolution of 0.25°.
The NCL code for the data evaluation is available upon request. The Python code for the cyclone identification algorithm is available at https://github.com/tluettm/Cyclone-identification (Lüttmer, 2025).
Lagrangian trajectory data will be published upon publication but can also be sent to readers upon request.
TL, PS and AM designed the study; TL performed the simulations and carried out the data analyses; TL, PS and AM contributed to interpreting the results. TL and AM contributed to writing the paper.
The contact author has declared that none of the authors has any competing interests.
Publisher's note: Copernicus Publications remains neutral with regard to jurisdictional claims made in the text, published maps, institutional affiliations, or any other geographical representation in this paper. While Copernicus Publications makes every effort to include appropriate place names, the final responsibility lies with the authors.
This article is part of the special issue “The tropopause region in a changing atmosphere (TPChange) (ACP/AMT/GMD/WCD inter-journal SI)”. It is not associated with a conference.
The research leading to these results was funded by the German Research Foundation (DFG, Deutsche Forschungsgemeinschaft) through (1) the Transregional Collaborative Research Center SFB/TRR 165 (grant no. 257899354; Waves to Weather) subproject B7 and (2) the TRR 301 (grant no. 428312742; The Tropopause Region in a Changing Atmosphere) subproject B08. Parts of this research were conducted using the supercomputer MOGON 2 and/or advisory services offered by Johannes Gutenberg University Mainz (https://hpc.uni-mainz.de, last access: 19 May 2025), which is a member of the Alliance for High Performance Computing in Rhineland Palatinate (AHRP; https://www.ahrp.info, last access: 19 May 2025) and the Gauss Alliance e.V. We thank Blaž Gasparini and the anonymous reviewer for their insightful comments on the original paper.
This research has been supported by the Deutsche Forschungsgemeinschaft (Waves to Weather, TRR 165, grant no. 257899354, and The Tropopause Region in a Changing Atmosphere, TRR 301, grant no. 428312742).
This open-access publication was funded by Johannes Gutenberg University Mainz.
This paper was edited by Guy Dagan and reviewed by Blaž Gasparini and one anonymous referee.
Bechtold, P., Köhler, M., Jung, T., Doblas-Reyes, F., Leutbecher, M., Rodwell, M. J., Vitart, F., and Balsamo, G.: Advances in simulating atmospheric variability with the ECMWF model: From synoptic to decadal time-scales, Q. J. Roy. Meteor. Soc., 134, 1337–1351, https://doi.org/10.1002/qj.289, 2008. a
Benas, N., Finkensieper, S., Stengel, M., van Zadelhoff, G.-J., Hanschmann, T., Hollmann, R., and Meirink, J. F.: The MSG-SEVIRI-based cloud property data record CLAAS-2, Earth Syst. Sci. Data, 9, 415–434, https://doi.org/10.5194/essd-9-415-2017, 2017. a
Bigg, E.: The formation of atmospheric ice crystals by the freezing of droplets, Q. J. Roy. Meteor. Soc., 79, 510–519, https://doi.org/10.1002/qj.49707934207, 1953. a
Binder, H., Boettcher, M., Joos, H., and Wernli, H.: The Role of Warm Conveyor Belts for the Intensification of Extratropical Cyclones in Northern Hemisphere Winter, J. Atmos. Sci., 73, 3997–4020, https://doi.org/10.1175/JAS-D-15-0302.1, 2016. a
Cotton, R. and Field, P.: Ice nucleation characteristics of an isolated wave cloud, Q. J. Roy. Meteor. Soc., 128, 2417–2437, https://doi.org/10.1256/qj.01.150, 2002. a
Gasparini, B. and Lohmann, U.: Why cirrus cloud seeding cannot substantially cool the planet, J. Geophys. Res.-Atmos., 121, 4877–4893, https://doi.org/10.1002/2015JD024666, 2016. a
Gasparini, B., Meyer, A., Neubauer, D., Münch, S., and Lohmann, U.: Cirrus Cloud Properties as Seen by the CALIPSO Satellite and ECHAM-HAM Global Climate Model, J. Climate, 31, 1983–2003, https://doi.org/10.1175/JCLI-D-16-0608.1, 2018. a
Grams, C. M., Wernli, H., Böttcher, M., Čampa, J., Corsmeier, U., Jones, S. C., Keller, J. H., Lenz, C.-J., and Wiegand, L.: The key role of diabatic processes in modifying the upper-tropospheric wave guide: a North Atlantic case-study, Q. J. Roy. Meteor. Soc., 137, 2174–2193, https://doi.org/10.1002/qj.891, 2011. a
Grams, C. M., Magnusson, L., and Madonna, E.: An atmospheric dynamics perspective on the amplification and propagation of forecast error in numerical weather prediction models: A case study, Q. J. Roy. Meteor. Soc., 144, 2577–2591, https://doi.org/10.1002/qj.3353, 2018. a
Gryspeerdt, E., Sourdeval, O., Quaas, J., Delanoë, J., Krämer, M., and Kühne, P.: Ice crystal number concentration estimates from lidar–radar satellite remote sensing – Part 2: Controls on the ice crystal number concentration, Atmos. Chem. Phys., 18, 14351–14370, https://doi.org/10.5194/acp-18-14351-2018, 2018. a
Hallett, J. and Mossop, S. C.: Production of secondary ice particles during the riming process, Nature, 249, 26–28, https://doi.org/10.1038/249026a0, 1974. a
Hande, L. B., Engler, C., Hoose, C., and Tegen, I.: Seasonal variability of Saharan desert dust and ice nucleating particles over Europe, Atmos. Chem. Phys., 15, 4389–4397, https://doi.org/10.5194/acp-15-4389-2015, 2015. a, b
Hawker, R. E., Miltenberger, A. K., Johnson, J. S., Wilkinson, J. M., Hill, A. A., Shipway, B. J., Field, P. R., Murray, B. J., and Carslaw, K. S.: Model emulation to understand the joint effects of ice-nucleating particles and secondary ice production on deep convective anvil cirrus, Atmos. Chem. Phys., 21, 17315–17343, https://doi.org/10.5194/acp-21-17315-2021, 2021. a
Heinze, R., Dipankar, A., Henken, C. C., Moseley, C., Sourdeval, O., Trömel, S., Xie, X., Adamidis, P., Ament, F., Baars, H., Barthlott, C., Behrendt, A., Blahak, U., Bley, S., Brdar, S., Brueck, M., Crewell, S., Deneke, H., Di Girolamo, P., Evaristo, R., Fischer, J., Frank, C., Friederichs, P., Göcke, T., Gorges, K., Hande, L., Hanke, M., Hansen, A., Hege, H.-C., Hoose, C., Jahns, T., Kalthoff, N., Klocke, D., Kneifel, S., Knippertz, P., Kuhn, A., van Laar, T., Macke, A., Maurer, V., Mayer, B., Meyer, C. I., Muppa, S. K., Neggers, R. A. J., Orlandi, E., Pantillon, F., Pospichal, B., Röber, N., Scheck, L., Seifert, A., Seifert, P., Senf, F., Siligam, P., Simmer, C., Steinke, S., Stevens, B., Wapler, K., Weniger, M., Wulfmeyer, V., Zängl, G., Zhang, D., and Quaas, J.: Large-eddy simulations over Germany using ICON: a comprehensive evaluation, Q. J. Roy. Meteor. Soc., 143, 69–100, https://doi.org/10.1002/qj.2947, 2017. a, b
Heise, E., Ritter, B., and Schrodin, R.: Operational implementation of the multilayer soil model, Deutscher Wetterdienst, Offenbach am Main, 2016. a
Hong, Y., Liu, G., and Li, J.-L. F.: Assessing the Radiative Effects of Global Ice Clouds Based on CloudSat and CALIPSO Measurements, J. Climate, 29, 7651–7674, https://doi.org/10.1175/JCLI-D-15-0799.1, 2016. a
Huo, J., Tian, Y., Wu, X., Han, C., Liu, B., Bi, Y., Duan, S., and Lyu, D.: Properties of ice cloud over Beijing from surface Ka-band radar observations during 2014–2017, Atmos. Chem. Phys., 20, 14377–14392, https://doi.org/10.5194/acp-20-14377-2020, 2020. a
Joos, H.: Warm Conveyor Belts and Their Role for Cloud Radiative Forcing in the Extratropical Storm Tracks, J. Climate, 32, 5325–5343, https://doi.org/10.1175/JCLI-D-18-0802.1, 2019. a
Joos, H. and Wernli, H.: Influence of microphysical processes on the potential vorticity development in a warm conveyor belt: a case-study with the limited-area model COSMO, Q. J. Roy. Meteor. Soc., 138, 407–418, https://doi.org/10.1002/qj.934, 2012. a
Joos, H., Spichtinger, P., Reutter, P., and Fusina, F.: Influence of heterogeneous freezing on the microphysical and radiative properties of orographic cirrus clouds, Atmos. Chem. Phys., 14, 6835–6852, https://doi.org/10.5194/acp-14-6835-2014, 2014. a
Joos, H., Sprenger, M., Binder, H., Beyerle, U., and Wernli, H.: Warm conveyor belts in present-day and future climate simulations – Part 1: Climatology and impacts, Weather Clim. Dynam., 4, 133–155, https://doi.org/10.5194/wcd-4-133-2023, 2023. a
Kärcher, B. and Lohmann, U.: A parameterization of cirrus cloud formation: Homogeneous freezing of supercooled aerosols, J. Geophys. Res.-Atmos., 107, AAC 4-1–AAC 4-10, https://doi.org/10.1029/2001JD000470, 2002. a
Korolev, A., Heckman, I., Wolde, M., Ackerman, A. S., Fridlind, A. M., Ladino, L. A., Lawson, R. P., Milbrandt, J., and Williams, E.: A new look at the environmental conditions favorable to secondary ice production, Atmos. Chem. Phys., 20, 1391–1429, https://doi.org/10.5194/acp-20-1391-2020, 2020. a
Krämer, M., Rolf, C., Luebke, A., Afchine, A., Spelten, N., Costa, A., Meyer, J., Zöger, M., Smith, J., Herman, R. L., Buchholz, B., Ebert, V., Baumgardner, D., Borrmann, S., Klingebiel, M., and Avallone, L.: A microphysics guide to cirrus clouds – Part 1: Cirrus types, Atmos. Chem. Phys., 16, 3463–3483, https://doi.org/10.5194/acp-16-3463-2016, 2016. a, b, c, d
Krämer, M., Rolf, C., Spelten, N., Afchine, A., Fahey, D., Jensen, E., Khaykin, S., Kuhn, T., Lawson, P., Lykov, A., Pan, L. L., Riese, M., Rollins, A., Stroh, F., Thornberry, T., Wolf, V., Woods, S., Spichtinger, P., Quaas, J., and Sourdeval, O.: A microphysics guide to cirrus – Part 2: Climatologies of clouds and humidity from observations, Atmos. Chem. Phys., 20, 12569–2608, https://doi.org/10.5194/acp-20-12569-2020, 2020. a, b, c, d, e, f, g, h, i, j, k, l, m, n, o
Lott, F. and Miller, M. J.: A new subgrid-scale orographic drag parametrization: Its formulation and testing, Q. J. Roy. Meteor. Soc., 123, 101–127, 1997. a
Louis, J.-F.: A parametric model of vertical eddy fluxes in the atmosphere, Bound.-Lay. Meteorol., 17, 187–202, 1979. a
Luebke, A. E., Afchine, A., Costa, A., Grooß, J.-U., Meyer, J., Rolf, C., Spelten, N., Avallone, L. M., Baumgardner, D., and Krämer, M.: The origin of midlatitude ice clouds and the resulting influence on their microphysical properties, Atmos. Chem. Phys., 16, 5793–5809, https://doi.org/10.5194/acp-16-5793-2016, 2016. a, b, c, d, e, f
Lüttmer, T.: Cyclone-identification, GitHub [code], https://github.com/tluettm/Cyclone-identification, last access: 19 May 2025. a
Lüttmer, T., Spichtinger, P., and Seifert, A.: Investigating ice formation pathways using a novel two-moment multi-class cloud microphysics scheme, EGUsphere [preprint], https://doi.org/10.5194/egusphere-2024-2157, 2024. a, b, c, d, e, f, g, h, i, j, k, l
Madonna, E., Wernli, H., Joos, H., and Martius, O.: Warm Conveyor Belts in the ERA-Interim Dataset (1979–2010). Part I: Climatology and Potential Vorticity Evolution, J. Climate, 27, 3–26, https://doi.org/10.1175/JCLI-D-12-00720.1, 2014. a, b
Matus, A. V. and L'Ecuyer, T. S.: The role of cloud phase in Earth's radiation budget, J. Geophys. Res.-Atmos., 122, 2559–2578, https://doi.org/10.1002/2016JD025951, 2017. a
Mlawer, E. J., Taubman, S. J., Brown, P. D., Iacono, M. J., and Clough, S. A.: Radiative transfer for inhomogeneous atmospheres: RRTM, a validated correlated-k model for the longwave, J. Geophys. Res.-Atmos., 102, 16663–16682, https://doi.org/10.1029/97JD00237, 1997. a
Oertel, A., Sprenger, M., Joos, H., Boettcher, M., Konow, H., Hagen, M., and Wernli, H.: Observations and simulation of intense convection embedded in a warm conveyor belt – how ambient vertical wind shear determines the dynamical impact, Weather Clim. Dynam., 2, 89–110, https://doi.org/10.5194/wcd-2-89-2021, 2021. a
Oertel, A., Miltenberger, A. K., Grams, C. M., and Hoose, C.: Interaction of microphysics and dynamics in a warm conveyor belt simulated with the ICOsahedral Nonhydrostatic (ICON) model , Atmos. Chem. Phys., 23, 8553–8581, https://doi.org/10.5194/acp-23-8553-2023, 2023. a, b, c, d, e, f, g, h, i, j
Oertel, A., Miltenberger, A. K., Grams, C. M., and Hoose, C.: Sensitivities of warm conveyor belt ascent, associated precipitation characteristics and large-scale flow pattern: Insights from a perturbed parameter ensemble, Q. J. Roy. Meteor. Soc., e4986, https://doi.org/10.1002/qj.4986, 2025. a
Orr, A., Bechtold, P., Scinocca, J., Ern, M., and Janiskova, M.: Improved Middle Atmosphere Climate and Forecasts in the ECMWF Model through a Nonorographic Gravity Wave Drag Parameterization, J. Climate, 23, 5905–5926, https://doi.org/10.1175/2010JCLI3490.1, 2010. a
Pfahl, S., Madonna, E., Boettcher, M., Joos, H., and Wernli, H.: Warm Conveyor Belts in the ERA-Interim Dataset (1979–2010). Part II: Moisture Origin and Relevance for Precipitation, J. Climate, 27, 27–40, https://doi.org/10.1175/JCLI-D-13-00223.1, 2014. a
Ramanathan, V., Cess, R. D., Harrison, E. F., Minnis, P., Barkstrom, B. R., Ahmad, E., and Hartmann, D.: Cloud-Radiative Forcing and Climate: Results from the Earth Radiation Budget Experiment, Science, 243, 57–63, https://doi.org/10.1126/science.243.4887.57, 1989. a
Raschendorfer, M.: The new turbulence parameterization of LM, COSMO newsletter, 1, 89–97, 2001. a
Rasp, S., Selz, T., and Craig, G. C.: Convective and Slantwise Trajectory Ascent in Convection-Permitting Simulations of Midlatitude Cyclones, Mon. Weather Rev., 144, 3961–3976, https://doi.org/10.1175/MWR-D-16-0112.1, 2016. a
Reed, R. J., Stoelinga, M. T., and Kuo, Y.-H.: A Model-aided Study of the Origin and Evolution of the Anomalously High Potential vorticity in the Inner Region of a Rapidly Deepening Marine Cyclone, Mon. Weather Rev., 120, 893–913, https://doi.org/10.1175/1520-0493(1992)120<0893:AMASOT>2.0.CO;2, 1992. a
Rodwell, M., Forbes, R., and Wernli, H.: Why warm conveyor belts matter in NWP, ECMWF newsletter, 21–28, https://doi.org/10.21957/mr20vg, 2018. a
Schäfler, A., Craig, G., Wernli, H., Arbogast, P., Doyle, J. D., McTaggart-Cowan, R., Methven, J., Rivière, G., Ament, F., Boettcher, M., Bramberger, M., Cazenave, Q., Cotton, R., Crewell, S., Delanoë, J., Dörnbrack, A., Ehrlich, A., Ewald, F., Fix, A., Grams, C. M., Gray, S. L., Grob, H., Groß, S., Hagen, M., Harvey, B., Hirsch, L., Jacob, M., Kölling, T., Konow, H., Lemmerz, C., Lux, O., Magnusson, L., Mayer, B., Mech, M., Moore, R., Pelon, J., Quinting, J., Rahm, S., Rapp, M., Rautenhaus, M., Reitebuch, O., Reynolds, C. A., Sodemann, H., Spengler, T., Vaughan, G., Wendisch, M., Wirth, M., Witschas, B., Wolf, K., and Zinner, T.: The North Atlantic Waveguide and Downstream Impact Experiment, B. Am. Meteorol. Soc., 99, 1607–1637, https://doi.org/10.1175/BAMS-D-17-0003.1, 2018. a
Schwenk, C. and Miltenberger, A.: The role of ascent timescale for WCB moisture transport into the UTLS, EGUsphere [preprint], https://doi.org/10.5194/egusphere-2024-2402, 2024. a, b, c
Seidel, J. S., Kiselev, A. A., Keinert, A., Stratmann, F., Leisner, T., and Hartmann, S.: Secondary ice production – no evidence of efficient rime-splintering mechanism, Atmos. Chem. Phys., 24, 5247–5263, https://doi.org/10.5194/acp-24-5247-2024, 2024. a
Seifert, A. and Beheng, K. D.: A two-moment cloud microphysics parameterization for mixed-phase clouds. Part 1: Model description, Meteorol. Atmos. Phys., 92, 45–66, https://doi.org/10.1007/s00703-005-0112-4, 2006. a
Sourdeval, O., Gryspeerdt, E., Krämer, M., Goren, T., Delanoë, J., Afchine, A., Hemmer, F., and Quaas, J.: Ice crystal number concentration estimates from lidar–radar satellite remote sensing – Part 1: Method and evaluation, Atmos. Chem. Phys., 18, 14327–14350, https://doi.org/10.5194/acp-18-14327-2018, 2018. a
Spichtinger, P. and Gierens, K. M.: Modelling of cirrus clouds – Part 1a: Model description and validation, Atmos. Chem. Phys., 9, 685–706, https://doi.org/10.5194/acp-9-685-2009, 2009. a
Spreitzer, E., Attinger, R., Boettcher, M., Forbes, R., Wernli, H., and Joos, H.: Modification of potential vorticity near the tropopause by nonconservative processes in the ECMWF model, J. Atmos. Sci., 76, 1709–1726, https://doi.org/10.1175/JAS-D-18-0295.1, 2019. a
Sprenger, M. and Wernli, H.: The LAGRANTO Lagrangian analysis tool – version 2.0, Geosci. Model Dev., 8, 2569–2586, https://doi.org/10.5194/gmd-8-2569-2015, 2015. a
Stephens, G. L.: Radiation Profiles in Extended Water Clouds. II: Parameterization Schemes, J. Atmos. Sci., 35, 2123–2132, https://doi.org/10.1175/1520-0469(1978)035<2123:RPIEWC>2.0.CO;2, 1978. a
Urbanek, B., Groß, S., Schäfler, A., and Wirth, M.: Determining stages of cirrus evolution: a cloud classification scheme, Atmos. Meas. Tech., 10, 1653–1664, https://doi.org/10.5194/amt-10-1653-2017, 2017. a
Vali, G., DeMott, P. J., Möhler, O., and Whale, T. F.: Technical Note: A proposal for ice nucleation terminology, Atmos. Chem. Phys., 15, 10263–10270, https://doi.org/10.5194/acp-15-10263-2015, 2015. a
Wernli, H. and Gray, S. L.: The importance of diabatic processes for the dynamics of synoptic-scale extratropical weather systems – a review, Weather Clim. Dynam., 5, 1299–1408, https://doi.org/10.5194/wcd-5-1299-2024, 2024. a
Wernli, H. and Schwierz, C.: Surface Cyclones in the ERA-40 Dataset (1958–2001). Part I: Novel Identification Method and Global Climatology, J. Atmos. Sci., 63, 2486–2507, https://doi.org/10.1175/JAS3766.1, 2006. a, b
Wernli, H., Boettcher, M., Joos, H., Miltenberger, A. K., and Spichtinger, P.: A trajectory-based classification of ERA-Interim ice clouds in the region of the North Atlantic storm track, Geophys. Res. Lett., 43, 6657–6664, https://doi.org/10.1002/2016GL068922, 2016. a, b, c, d, e, f, g, h, i, j, k, l
Wolf, V., Kuhn, T., Milz, M., Voelger, P., Krämer, M., and Rolf, C.: Arctic ice clouds over northern Sweden: microphysical properties studied with the Balloon-borne Ice Cloud particle Imager B-ICI, Atmos. Chem. Phys., 18, 17371–17386, https://doi.org/10.5194/acp-18-17371-2018, 2018. a, b, c, d
Zhang, Y., Macke, A., and Albers, F.: Effect of crystal size spectrum and crystal shape on stratiform cirrus radiative forcing, Atmos. Res., 52, 59–75, https://doi.org/10.1016/S0169-8095(99)00026-5, 1999. a, b
- Abstract
- Introduction
- Methods
- Spatio-temporal structure of WCB-related clouds
- Characteristics of in situ and liquid-origin cirrus
- Discussion
- Appendix A: List of abbreviations
- Appendix B: Cyclone identification
- Code availability
- Data availability
- Author contributions
- Competing interests
- Disclaimer
- Special issue statement
- Acknowledgements
- Financial support
- Review statement
- References