the Creative Commons Attribution 4.0 License.
the Creative Commons Attribution 4.0 License.
 | 09 Feb 2022
Evaluation of interactive and prescribed agricultural ammonia emissions for simulating atmospheric composition in CAM-chem
Peter Hess
Money Ossohou
Corinne Galy-Lacaux
Ammonia (NH3) plays a central role in the chemistry of inorganic secondary aerosols in the atmosphere. The largest emission sector for NH3 is agriculture, where NH3 is volatilized from livestock wastes and fertilized soils. Although the NH3 volatilization from soils is driven by the soil temperature and moisture, many atmospheric chemistry models prescribe the emission using yearly emission inventories and climatological seasonal variations. Here we evaluate an alternative approach where the NH3 emissions from agriculture are simulated interactively using the process model FANv2 (Flow of Agricultural Nitrogen, version 2) coupled to the Community Atmospheric Model with Chemistry (CAM-chem). We run a set of 6-year global simulations using the NH3 emission from FANv2 and three global emission inventories (EDGAR, CEDS and HTAP) and evaluate the model performance using a global set of multi-component (atmospheric NH3 and , and wet deposition) in situ observations. Over East Asia, Europe and North America, the simulations with different emissions perform similarly when compared with the observed geographical patterns. The seasonal distributions of NH3 emissions differ between the inventories, and the comparison to observations suggests that both FANv2 and the inventories would benefit from more realistic timing of fertilizer applications. The largest differences between the simulations occur over data-scarce regions. In Africa, the emissions simulated by FANv2 are 200 %–300 % higher than in the inventories, and the available in situ observations from western and central Africa, as well as NH3 retrievals from the Infrared Atmospheric Sounding Interferometer (IASI) instrument, are consistent with the higher NH3 emissions as simulated by FANv2. Overall, in simulating ammonia and ammonium concentrations over regions with detailed regional emission inventories, the inventories based on these details (HTAP, CEDS) capture the atmospheric concentrations and their seasonal variability the best. However these inventories cannot capture the impact of meteorological variability on the emissions, nor can these inventories couple the emissions to the biogeochemical cycles and their changes with climate drivers. Finally, we show with sensitivity experiments that the simulated time-averaged nitrate concentration in air is sensitive to the temporal resolution of the NH3 emissions. Over the CASTNET monitoring network covering the US, resolving the NH3 emissions hourly instead monthly reduced the positive model bias from approximately 80 % to 60 % of the observed yearly mean nitrate concentration. This suggests that some of the commonly reported overestimation of aerosol nitrate over the US may be related to unresolved temporal variability in the NH3 emissions.
- Article
(6802 KB) - Full-text XML
-
Supplement
(3997 KB) - BibTeX
- EndNote


Volatilization of ammonia (NH3) from fertilizers and livestock wastes constitutes the largest source of atmospheric NH3. Once emitted to the atmosphere, NH3 reacts with oxides of sulfur and nitrogen to form secondary aerosols. Ammonia is often the limiting precursor for formation of ammonium nitrate, which is projected to become an increasingly important aerosol component with impacts on air quality and aerosol radiative forcing (Bauer et al., 2007; Hauglustaine et al., 2014). Similar to other reactive nitrogen species, ammonia may have adverse ecological effects when deposited on sensitive ecosystems (Duprè et al., 2010; Payne et al., 2017).
In Vira et al. (2020b), we introduced an updated version (FANv2) of the process model FAN (Flow of Agricultural Nitrogen), which simulates the physical mechanisms of ammonia volatilization interactively within an Earth system model. Incorporated into the Community Land Model (CLM), the land component of the Community Earth System Model (CESM), FANv2 evaluates NH3 emissions arising from fertilizer use, grazing livestock and manure management. Here we couple FANv2 and CLM with the Community Atmosphere Model (CAM-chem; Lamarque et al., 2012; Tilmes et al., 2015) to evaluate how interactive NH3 emissions affect the simulation of atmospheric composition and nitrogen deposition. Distinct from the earlier efforts (Bash et al., 2013; Zhu et al., 2015; Shen et al., 2020) to interactively simulate the NH3 emissions in atmospheric chemistry models, we include the NH3 emissions from both fertilizer applications and livestock manure. Including manure as an NH3 emission source increases the fraction of emissions resolved by the process model considerably, since globally about 60 %–80 % of the total agricultural NH3 emissions are estimated to originate from manure (Beusen et al., 2008; Paulot et al., 2014; Vira et al., 2020b).
The emission of NH3 is sensitive to soil temperature and moisture (Fenn and Hossner, 1985; Sommer et al., 2004), and evaluating the NH3 volatilization interactively through a process model can help resolve both long- and short-term emission variations driven by the meteorological forcing and agricultural activities, which are often linked to meteorology (e.g., planting dates). The emission inventories, on the other hand, are able to more easily incorporate details regarding regional fertilization and manure management practices, which also affect timing and magnitude of the emissions. However, the representation of these practices in the inventories is largely static. The present paper therefore aims to evaluate the tradeoff between the representation of process-level details in FANv2 and the representation of agricultural practices in the emission inventories. We evaluate the performance of FANv2 against measurements in simulating atmospheric gas-phase ammonia, ammonium () and nitrate () aerosols, and the wet deposition of ammonium. The CAM-chem simulations using ammonia emissions from FANv2 are compared to simulations based on three global, state-of-the-art ammonia emission inventories and evaluated using data from atmospheric observing networks covering parts of Africa, East Asia, Europe and the United States. The comparison for stations located in Africa is especially interesting, since as shown in Vira et al. (2020b), the NH3 emissions for Africa simulated by FANv2 are several times higher than previous estimates.
The volatility of NH3 in soils and the thermodynamic stability of ammonium nitrate in aerosols are oppositely affected by air temperature. While the temperature dependence of ammonium nitrate aerosols is usually included in atmospheric models, the temperature dependence of soil ammonia emissions is usually not represented, and the anticorrelation between the NH3 emissions and the nitrate formation is therefore not reproduced. We hypothesize that resolving the NH3 emissions' response to the meteorological forcing might reduce the positive bias in simulated airborne nitrate concentrations, which has been reported for some regions in both CAM (Lamarque et al., 2012) and other models (Heald et al., 2012; Walker et al., 2012; Paulot et al., 2016). We test this hypothesis by running a set of model experiments.
The model runs are performed using the Community Earth System Model (CESM) version 2. Only the land and atmospheric components (CLM and CAM-chem) are active, while the ocean and sea ice are prescribed. The NH3 FANv2 emissions in the CLM were analyzed previously in Vira et al. (2020b), and here we focus on how the emissions affect the simulated atmospheric composition. Specifically, we compare the atmospheric concentrations in CAM-chem using the NH3 emissions generated in FANv2 with three additional prescribed emission inventories.
2.1 The FANv2 process model
The FANv2 process model and its input data are described in Vira et al. (2020b). The model evaluates NH3 emissions from both synthetic fertilizers and livestock manure. Ammonia volatilization from livestock manure is evaluated separately for emissions from pastures, animal housings, and storage and the spreading of the manure. The emissions from synthetic fertilizers are evaluated separately for urea and other fertilizers.
The NH3 flux from soils is evaluated using a single-layer resistance scheme which includes the partitioning between gaseous, aqueous, and adsorbed phases of ammonia and ammonium and evaluates the solute and gas diffusion in the water- and air-filled soil pores. The emissions from animal housings and manure stores are evaluated using the parameterization of Gyldenkærne et al. (2005).
The global manure nitrogen excretion (120 Tg N yr−1) was derived from livestock datasets (Robinson et al., 2011, 2014) released by the United Nations Food and Agriculture Organization (FAO) using the nitrogen excretion rates given in IPCC (2006). The synthetic fertilizer use (79–87 Tg N yr−1 for 2010–2015) was based on the Land Use Harmonization 2 dataset (Lawrence et al., 2016; Hurtt et al., 2020) prepared for use within the Coupled Model Intercomparison Project Phase 6 (CMIP6).
2.2 The Community Land Model
The FANv2 process model was introduced into the CLM version 5 (Lawrence et al., 2018), which forms the terrestrial component of the CESM version 2. The CLM evaluates the soil conditions (temperature, moisture, rainwater infiltration) and the aerodynamic and quasi-laminar layer resistances required by FANv2. CLM also includes a representation of the terrestrial nitrogen (N) cycle and its effects on carbon cycling and vegetation. In this study, the simulated N losses in FANv2 are not propagated back to the N cycling in the CLM, and the amounts of fertilizer N available to crops are therefore not affected by FANv2.
The timing of synthetic fertilizer application is determined by the CLM crop model (Levis et al., 2012, 2018; Lombardozzi et al., 2020), which includes phenological parameterizations for eight major crops, which may coexist in the same grid cell within the CLM sub-grid structure. Synthetic fertilizer is applied in FANv2 over a single 20 d window following the simulated time of leaf emergence, which is determined mainly by thresholds dependent on growing degree days and air temperature. The timing of the synthetic fertilization, and consequently the fertilizer NH3 emissions, therefore depends on both crop types and meteorological conditions.
2.3 The Community Atmospheric Model with Chemistry
The emission flux of ammonia, as evaluated by the FANv2 model within the CLM, is passed to the Community Atmospheric Model with interactive chemistry (CAM-chem). The CAM-chem version 5.4 was run in the offline configuration (Lamarque et al., 2012), where the meteorological fields were prescribed from the MERRA reanalyses (Rienecker et al., 2011) from 2010–2015. The formation of ammonium sulfate and nitrate aerosols is simulated by the Bulk Aerosol Model (BAM) following the scheme of Metzger et al. (2002), which parameterizes the thermodynamic equilibrium between sulfuric and nitric acid, ammonia, and ammonium in gaseous and aerosol phases.
Ammonia and ammonium are removed from the atmosphere through wet and dry deposition. Dry deposition of ammonia is evaluated using the resistance approach of Wesely (1989) with updates described by Emmons et al. (2010); dry deposition of aerosols is described in Lamarque et al. (2012). The wet deposition of soluble gases including ammonia is simulated with the algorithm of Neu and Prather (2012), while aerosol wet deposition is parameterized according to Barth et al. (2000).
2.4 Simulations
Table 1Agricultural ammonia emissions by region in the FANv2 simulation and in the CEDS, EDGAR 4.3.2 and HTAP_v2.2 inventories. The FANv2 emissions are averaged for 2010–2015; the other emissions are for the year 2010. The totals are interpolated from gridded emissions; the European emissions include the part of Russia west of 60∘ E.
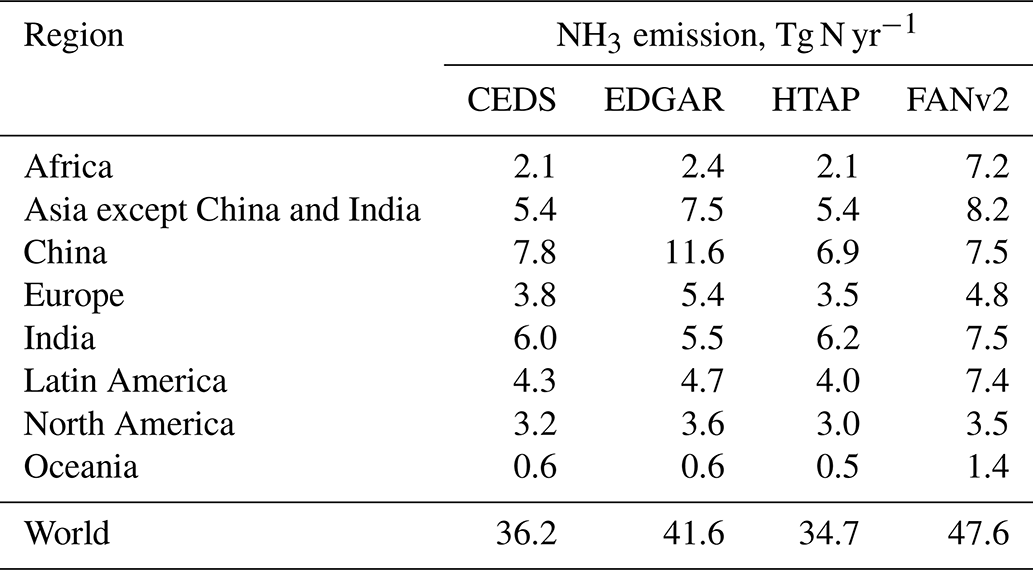
Four CESM simulations for 2010–2015 were run. In the first simulation the CESM is run with the FANv2 NH3 emissions coupled to CAM-chem. An additional three simulations are run with agricultural NH3 emissions taken from three global emission inventories for 2010: the Emissions Database for Global Atmospheric Research version 4.3.2 (EDGAR; Crippa et al., 2018a), the HTAP_v2.2 inventory (Janssens-Maenhout et al., 2015) and the Community Emissions Data System (CEDS; Hoesly et al., 2018). Both the CEDS and HTAP_v2.2 inventories are based on merging the global emissions from EDGAR with more detailed regional inventories where available. In CEDS, the regional inventories are introduced by scaling the EDGAR emissions to a country level, while in HTAP_v2.2 the regional inventories are merged into EDGAR in gridded form. The total NH3 emissions in the CEDS and HTAP_v2.2 inventories are rather similar; both CEDS and HTAP_v2.2 emit 35–36 Tg NH3-N yr−1 from agriculture, which is 6–7 Tg N less than EDGAR (42 Tg N) and 12–13 Tg N less than FANv2 (48 Tg N, Table 1). Regionally, the largest differences between FANv2 and the inventories occur over Africa, where FANv2 emissions are about 5 Tg N higher, and over Latin America, where the FANv2 emissions are 3–3.5 Tg N higher. The NH3 emissions in each inventory are given on a monthly time resolution, while the FANv2 emissions are evaluated on each model time step.
The simulations differ only in the NH3 emissions from the agricultural sector; all other anthropogenic emissions, including 5.4 Tg NH3-N from non-agricultural sources, are taken from the HTAP_v2.2 inventory. Biogenic and biomass burning emissions are taken from the CAM-chem default input dataset (Lamarque et al., 2012); this includes NH3 emitted from natural soils (2 Tg N yr−1), oceans (6.7 Tg N yr−1) and biomass burning (4.7 Tg N yr−1).
Four additional 1-year (2010) simulations were run to investigate the effect of the temporal resolution of the NH3 emissions on nitrate aerosols. The NH3 emissions from FANv2 were used in these simulations, but instead of running FANv2 interactively, the emission from the FANv2-based simulation for 2010 was averaged to hourly, daily, monthly and finally yearly time resolutions and then used as input to CAM-chem.
Both CAM and CLM were run in a global longitude–latitude grid with a 2.5 × 1.9∘ resolution and a 30 min coupling time step. The year 2009 was run for spin-up.
2.5 Observations
The simulations are evaluated against data from various atmospheric monitoring networks. While the NH3 is emitted in gaseous form, gas-phase NH3 has a short atmospheric lifetime, making the observations sensitive to local sources or sinks. To obtain a more robust picture of how the different emission inventories perform in the CAM-chem simulations, we also include observations of particulate and wet deposition. In addition, observations of particulate nitrate () are used to evaluate the effect of NH3 emissions on nitrate aerosols.
Table 2Summary of the atmospheric monitoring network datasets used in this study. The number of stations shown is evaluated after screening for completeness (see text for details).
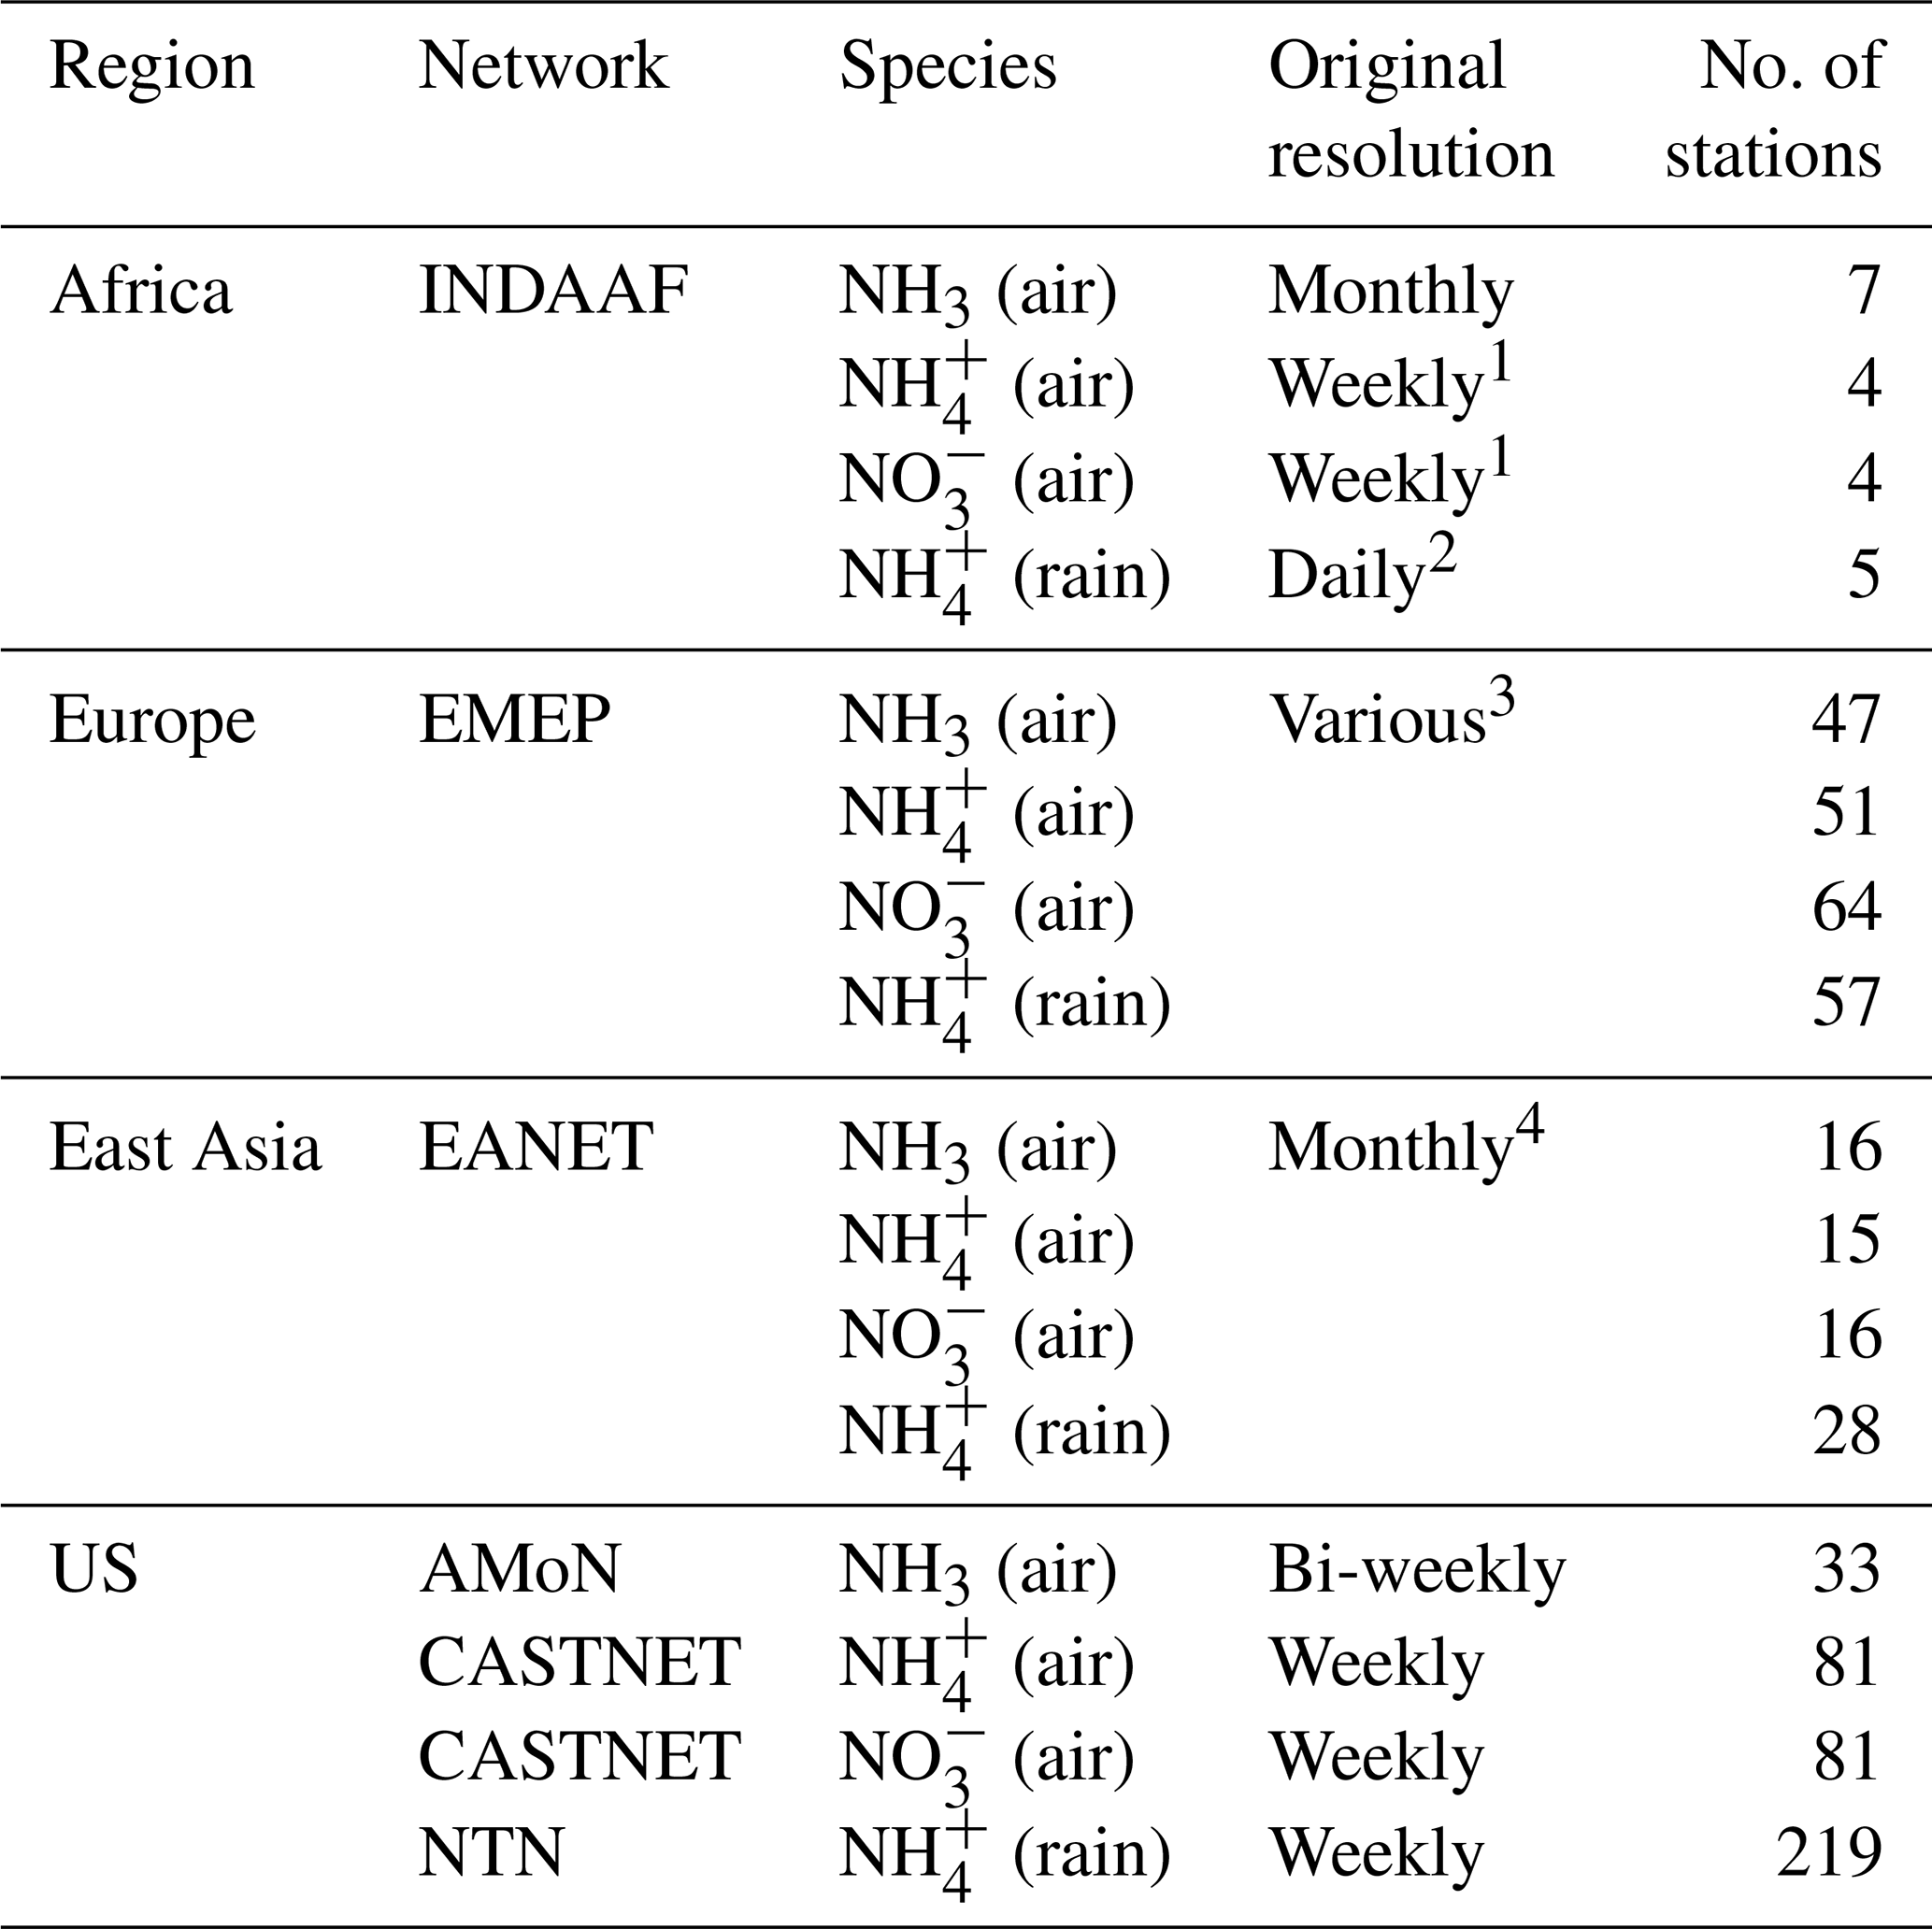
1 One 24 h exposure per week for 2000–2004; 7 d exposures since 2005. 2 Reported per precipitation event. 3 Hourly to weekly. 4 Data obtained from monthly summaries.
We use data from six networks (Table 2): the National Trends (NTN, http://nadp.slh.wisc.edu/ntn/, last access: 4 February 2022), Clean Air Status and Trends (CASTNET, https://www.epa.gov/castnet, last access: 4 February 2022), and Ammonia Monitoring (AMoN, http://nadp.slh.wisc.edu/amon/, last access: 4 February 2022) networks for North America; the European Monitoring and Evaluation Programme (EMEP, https://www.emep.int/, last access: 4 February 2022) network for Europe; the International Network to study Deposition and Atmospheric composition in Africa (INDAAF, https://indaaf.obs-mip.fr/, last access: 4 February 2022) for Africa; and the Acid Deposition Monitoring Network in East Asia (EANET, https://www.eanet.asia/, last access: 4 February 2022) for eastern Asia. All model–measurement comparisons are performed either on a monthly or multiannual basis. The nitrate and ammonium concentrations are measured within bulk aerosol (without restrictions in particle size), except in the EMEP dataset, which depending on the station includes measurements in both PM2.5 and bulk aerosol. The comparisons of wet deposition are based on measured ammonium concentrations in rainwater, which are converted to monthly wet deposition by multiplying by the observed precipitation reported with the data. The modeled wet deposition is evaluated as the sum of the scavenged and NH3.
All observations were first screened using the quality flags provided with the data, averaged to the monthly level and then checked for temporal coverage. Due to the seasonal variation of the NH3 emissions, the criteria for temporal coverage prioritize seasonal completeness, whereas the required number of years within the simulated period was adjusted for each network in order to retain sufficient spatial representativeness. This was implemented as follows:
-
months with less than 50 % of days covered were omitted;
-
years with less than 10 valid months were omitted;
-
for the INDAAF network, stations with less than 1 valid year (according to steps 1 and 2) after the year 2000 were omitted;
-
for the EMEP network, stations with less than 2 valid years within the 2010–2015 period were omitted;
-
for the remaining networks, stations with less than 3 valid years within 2010–2015 were omitted.
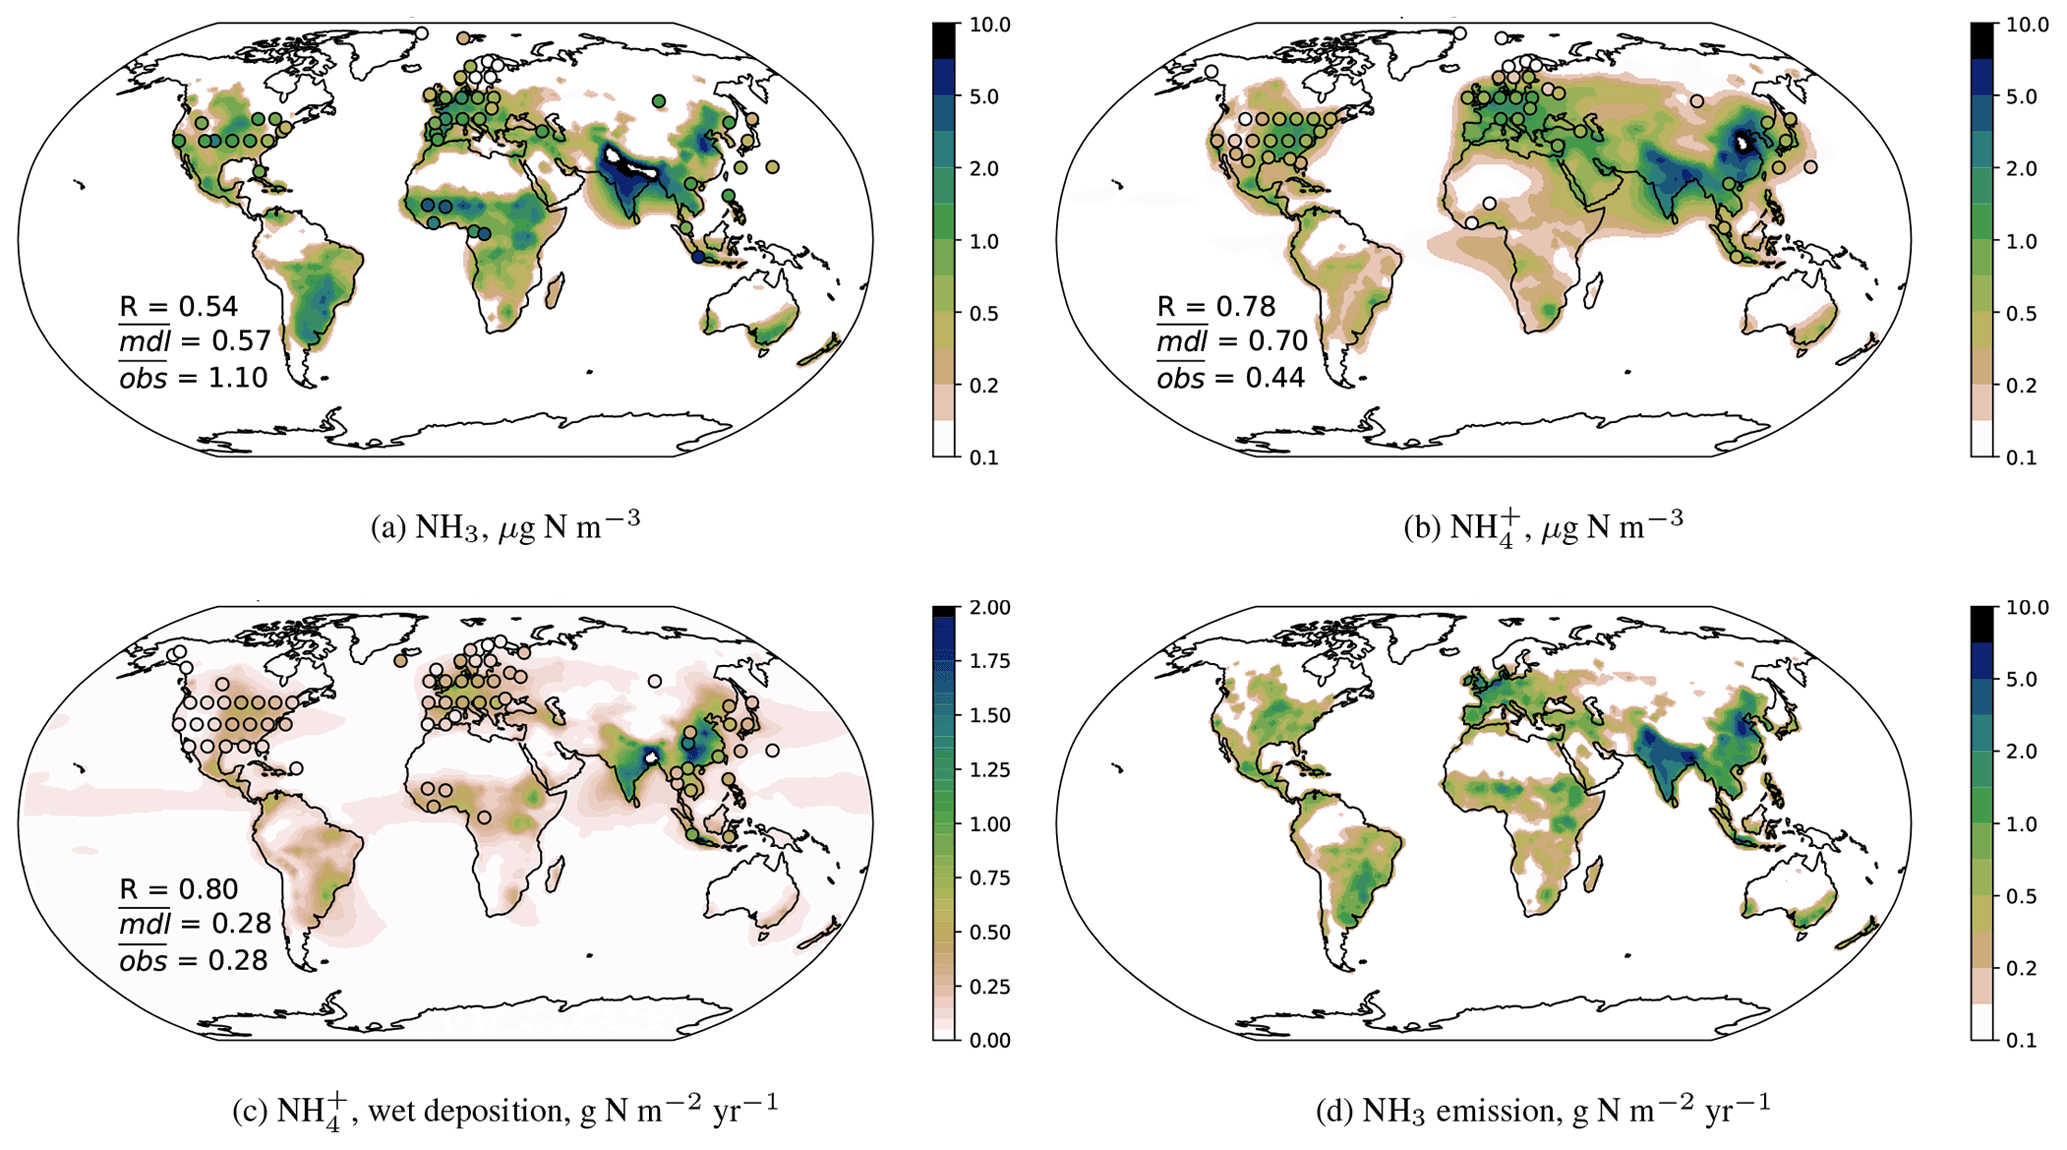
Figure 1Simulated global distribution for 2010–2015 of near-surface-level ammonia and ammonium (µg N m−3, a, b), and wet deposition of ammonium and emission of ammonia (g N m−2 yr−1, c, d) in FANv2. Markers indicate observed values. For the sake of clarity, the density of observations has been reduced by averaging into an 8∘ grid where necessary. The correlation coefficient (R), average of observations and model average at observed sites are shown for panels (a)–(c). The statistical parameters are evaluated after spatial averaging to the 8∘ grid. The wet deposition includes the wet deposition of gas-phase ammonia. The maps for the CEDS, EDGAR and HTAP simulations are shown in Figs. S1–S3 in the Supplement.
The monthly coverage test (item 1 above) was generally evaluated using the averaging period of each observation. However, this criterion could not be applied to the automatic precipitation samplers in the INDAAF network, which sample discrete precipitation events. In earlier studies (Yoboué et al., 2005; Galy-Lacaux et al., 2009) the average collection efficiency of these samplers was 85 %–90 % of the total precipitation. Furthermore, the INDAAF aerosol observations ( and ) collected before 2005 consists of 1 d filter exposures repeated every 7 d. These measurements were taken over each 7 d window so that two to three samples were required for each valid month. Finally, the INDAAF dataset includes little data after 2010, and therefore all data from 2000 and later years were included. The simulations were compared with the observations only as temporal averages over the simulated and measured periods.
For the other networks, the observations were extracted for 2010–2015 and compared both annually averaged and on a monthly basis. The EANET dataset includes urban stations, which were omitted due to questions concerning their representativeness at the 2∘ model resolution; the other networks include mainly rural or remote sites. The EMEP network includes wet deposition observations collected using bulk samplers, which in some conditions overestimate the wet deposition flux due to contamination from dry deposition (Vet et al., 2014). In this paper, the bulk sampler measurements are presented visually but not included in the computation of the measurement statistics.
Fewer data are available to constrain the ammonia and ammonium outside the regions covered by the networks listed above. In Sect. 3.3 we compare the simulated wet deposition with observed averages compiled from published literature (Table A1). These observations cover 1 or more years between 2000 and 2013, depending on the study; all comparisons are made with respect to the simulated 2010–2015 average.
Finally, we compare the simulated column-integrated NH3 concentrations with the dataset of Van Damme et al. (2018b), which consists of NH3 retrievals from the IASI (Infrared Atmospheric Sounding Interferometer) instrument aboard the MetOp satellites. The IASI data shown here are obtained from the oversampled level 3 dataset (Van Damme et al., 2018a), which consists of NH3 column densities retrieved for the morning overpasses averaged over the years 2008–2016; only the observations of NH3 total columns that have 10 % or less cloud cover are used. A detailed description of the algorithm can be found in Van Damme et al. (2017). A quantitative comparison between IASI and the model results would require a careful consideration of temporal sampling and vertical sensitivity of the retrievals, and our comparisons are therefore mainly qualitative and complement the in situ observations over data-sparse regions.
The global distribution of ammonia and ammonium (Fig. 1) reflects the global emission patterns and highlights India, northern China and western Europe as the regions most impacted by ammonia emissions. Comparison with observations shows that the spatial patterns of particulate ammonium and the wet deposition are generally well captured in FAN and the other simulations (R=0.7–0.8; Figs. S1–S3) on the global scale. The observed pattern of NH3 is reproduced less accurately (R=0.3–0.5). The smaller correlation for NH3 is in part explained by the shorter atmospheric lifetime of NH3, which results in spatial gradients that cannot be reproduced at the 2∘ resolution. However, the comparisons also indicate that the model tends to simultaneously underestimate NH3 and overestimate regardless of the NH3 emission inventory used.
Figure 2 compares the FAN and EDGAR simulations to the retrievals of column-integrated NH3 from the IASI instrument. Consistent with the comparison with surface observations of NH3, both the FAN and EDGAR simulations are biased low in parts of East Asia, eastern Europe and the central US. The largest differences occur over Africa, India and South America, which will be discussed in Sect. 3.2 and 3.3.
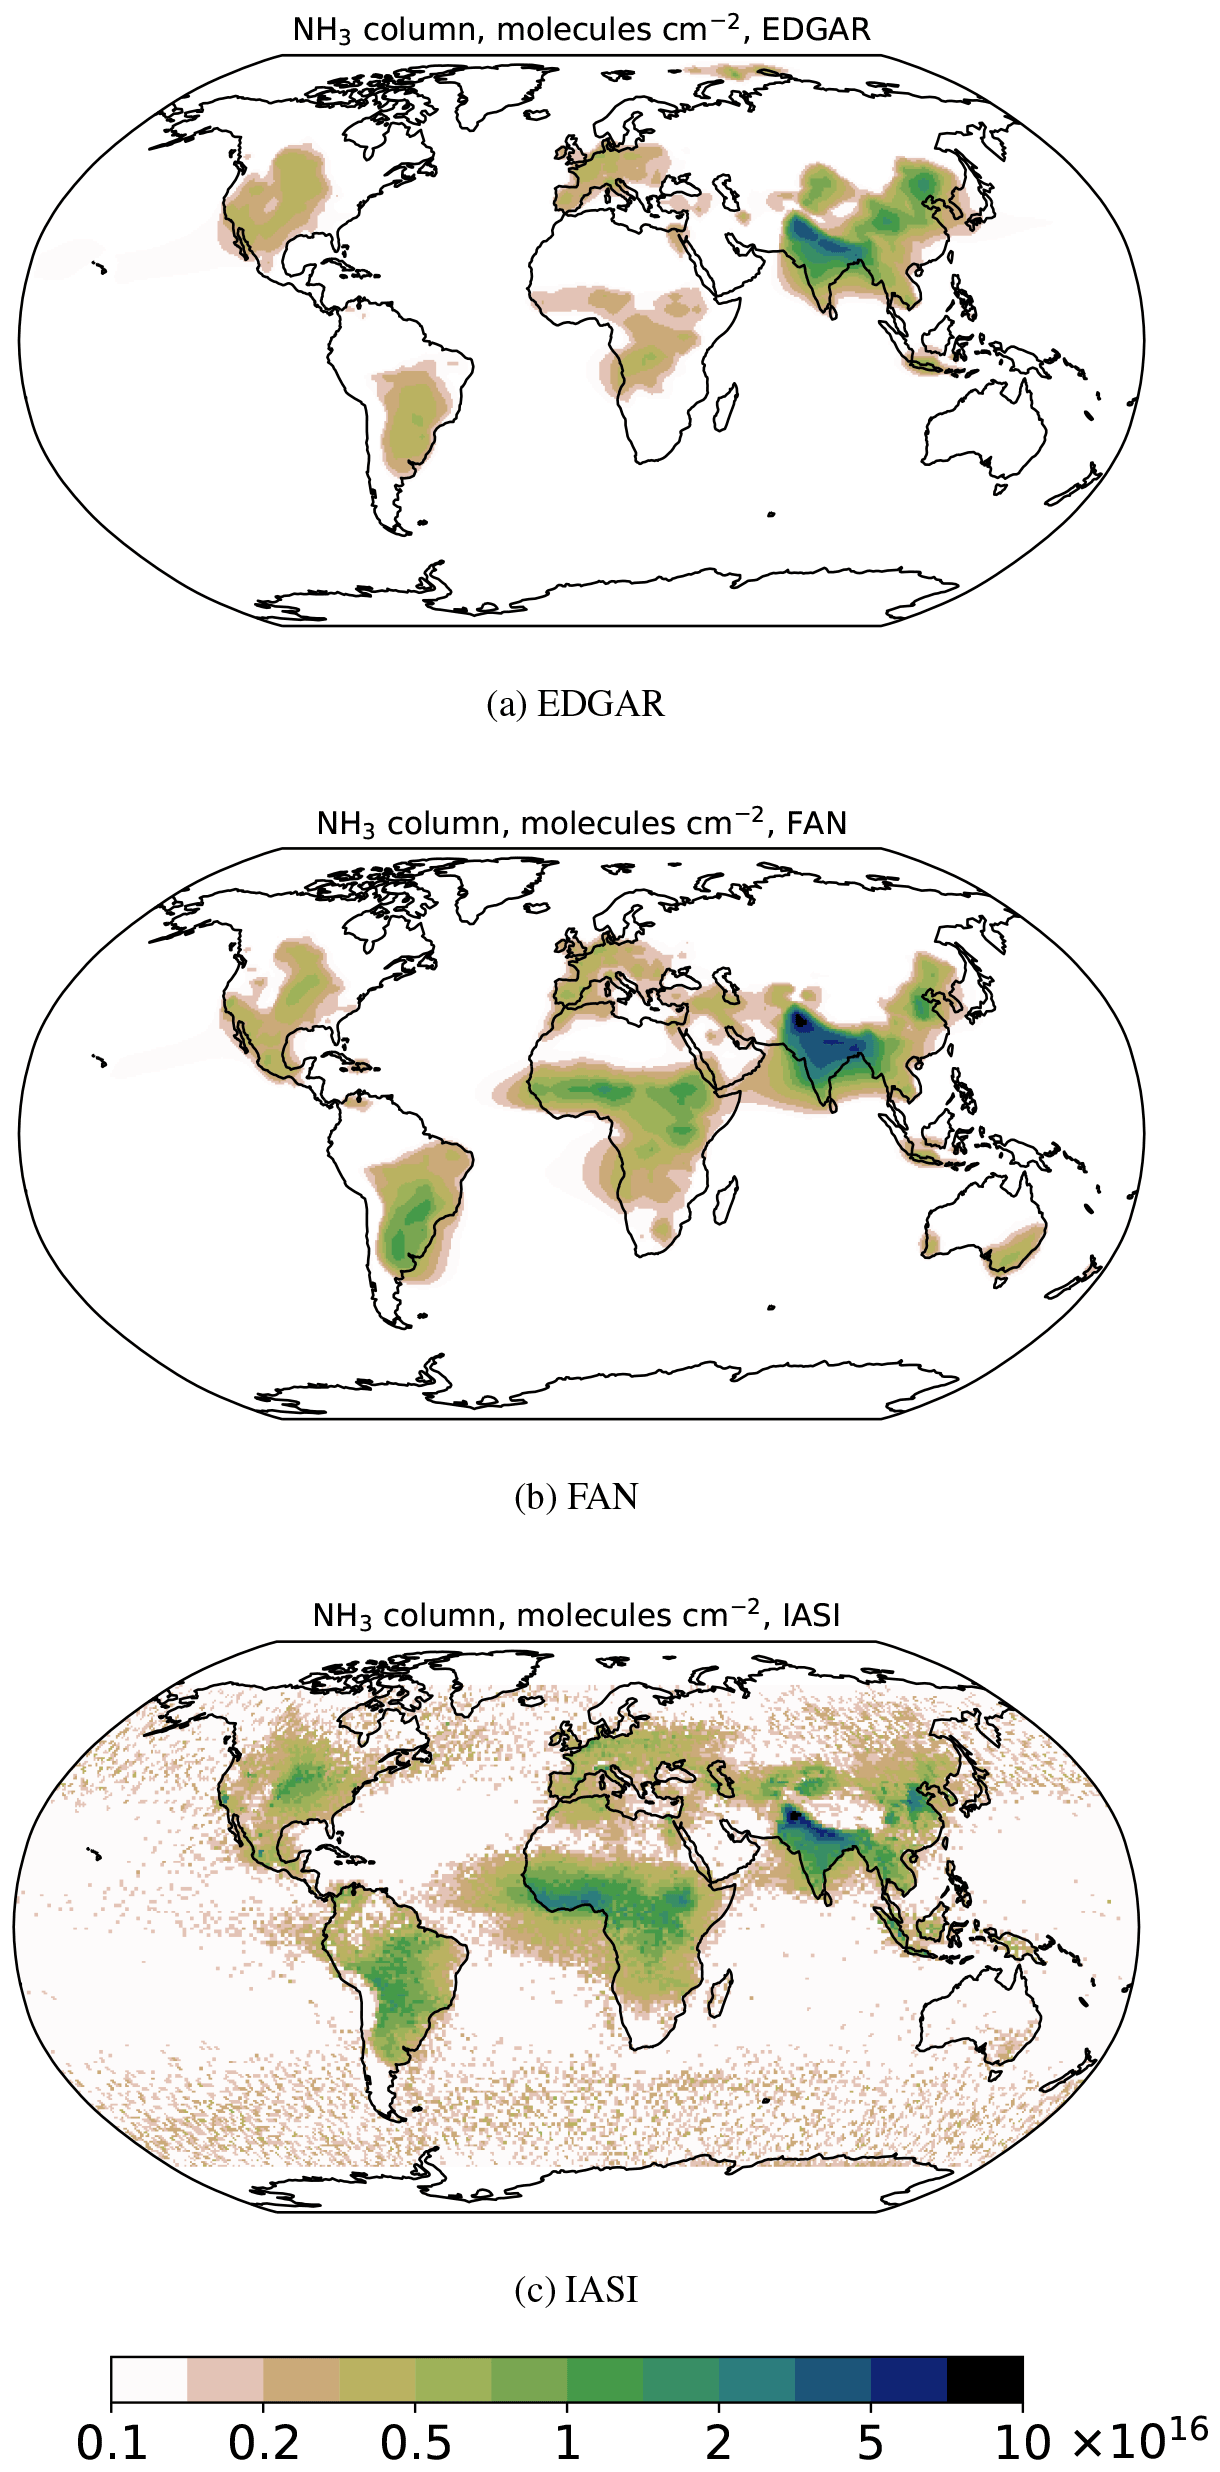
Figure 2Column density of NH3 (molecules cm−2) in the (a) EDGAR and (b) FAN simulations for 2010–2015 and (c) in the IASI dataset (Van Damme et al., 2018b) averaged over 2008–2016. The results for CEDS and HTAP are shown in Fig. S4.
In the following section, we analyze the simulated atmospheric NH3 and and their wet deposition regionally. The simulation of nitrate aerosols is discussed separately in Sect. 3.4. The model evaluations are summarized by Taylor plots, which were calculated separately in space (averaged in time, comparing spatially across stations) and time (averaged each month over all stations, comparing the time series).
3.1 North America, Europe and East Asia
Maps of the simulated atmospheric ammonia, ammonium and wet deposition of ammonium for North America, Europe and East Asia are shown in Figs. 3 and 4. The regions differ in both climatic conditions and their emissions of ammonia and other pollutants, which results in differences in the model performance across the different regions and species. The spatial patterns of the wet deposition are well reproduced for the North American and East Asian networks (R∼0.8–0.9; Figs. 5, 7 and S8–S11). The model captures the peak wet deposition occurring in the US Midwest (Fig. 3c) and in central and southwestern China (Fig. 4c) and reproduces the transition towards lower deposition in less agriculturally intensive areas. The measured wet deposition over the EMEP network is not captured as accurately (R=0.43 in the FAN simulation; Fig. 6). The lower correlation is largely caused by two to three outlying stations with very high observed wet depositions (Fig. S8). The FAN and EDGAR simulations are also generally biased high (∼ 25 %–40 % of the observed mean wet deposition) especially in western Europe. While the HTAP and CEDS simulations do not overestimate the average wet deposition in the EMEP dataset, which is consistent with their lower emitted totals, their spatial correlation coefficients remain low (0.47–0.51). The HTAP and CEDS simulations have the smallest average deposition bias also over Asia and North America, which might reflect the benefit of including regional emission data into the CEDS and HTAP inventories.

Figure 3Ammonia (a, d), ammonium (b, e) and wet deposition of ammonium (c, f) in the FAN simulation for North America and Europe (a–c and d–f, respectively). Observed values are shown by markers. Grey markers in panel (f) denote wet deposition observations from bulk samplers which are not used for calculating statistical parameters. The other simulations are shown in Figs. S5 and S6.
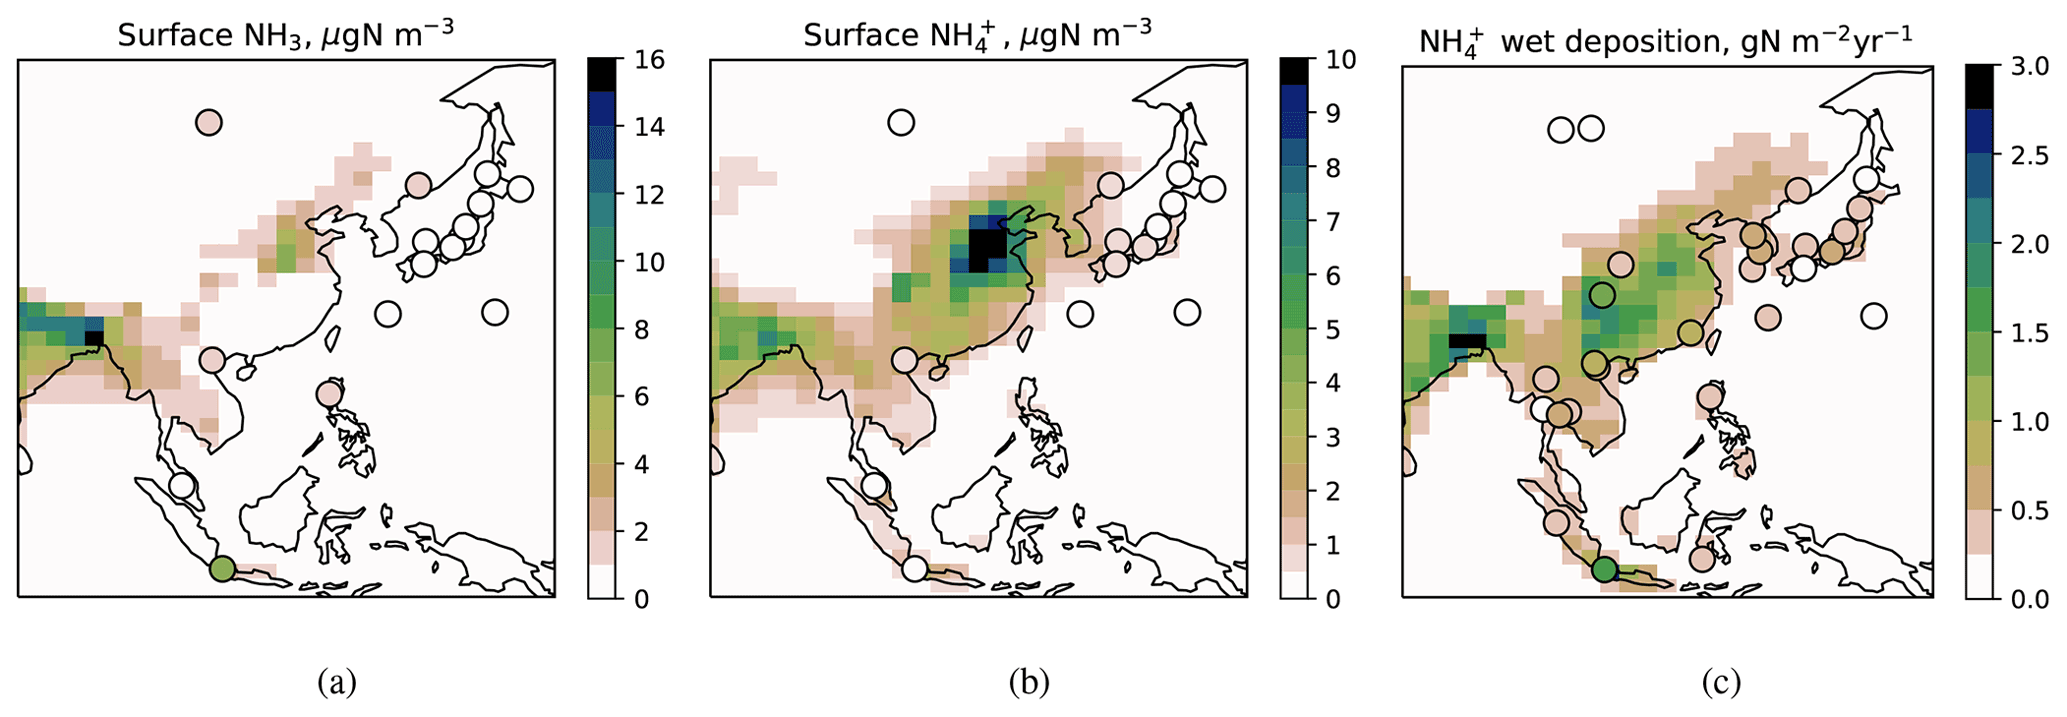
Figure 4Ammonia (a), ammonium (b) and wet deposition of ammonium (c) in the FAN simulation for East Asia (shading) and in the EANET observations (markers). The other simulations are shown in Fig. S7.
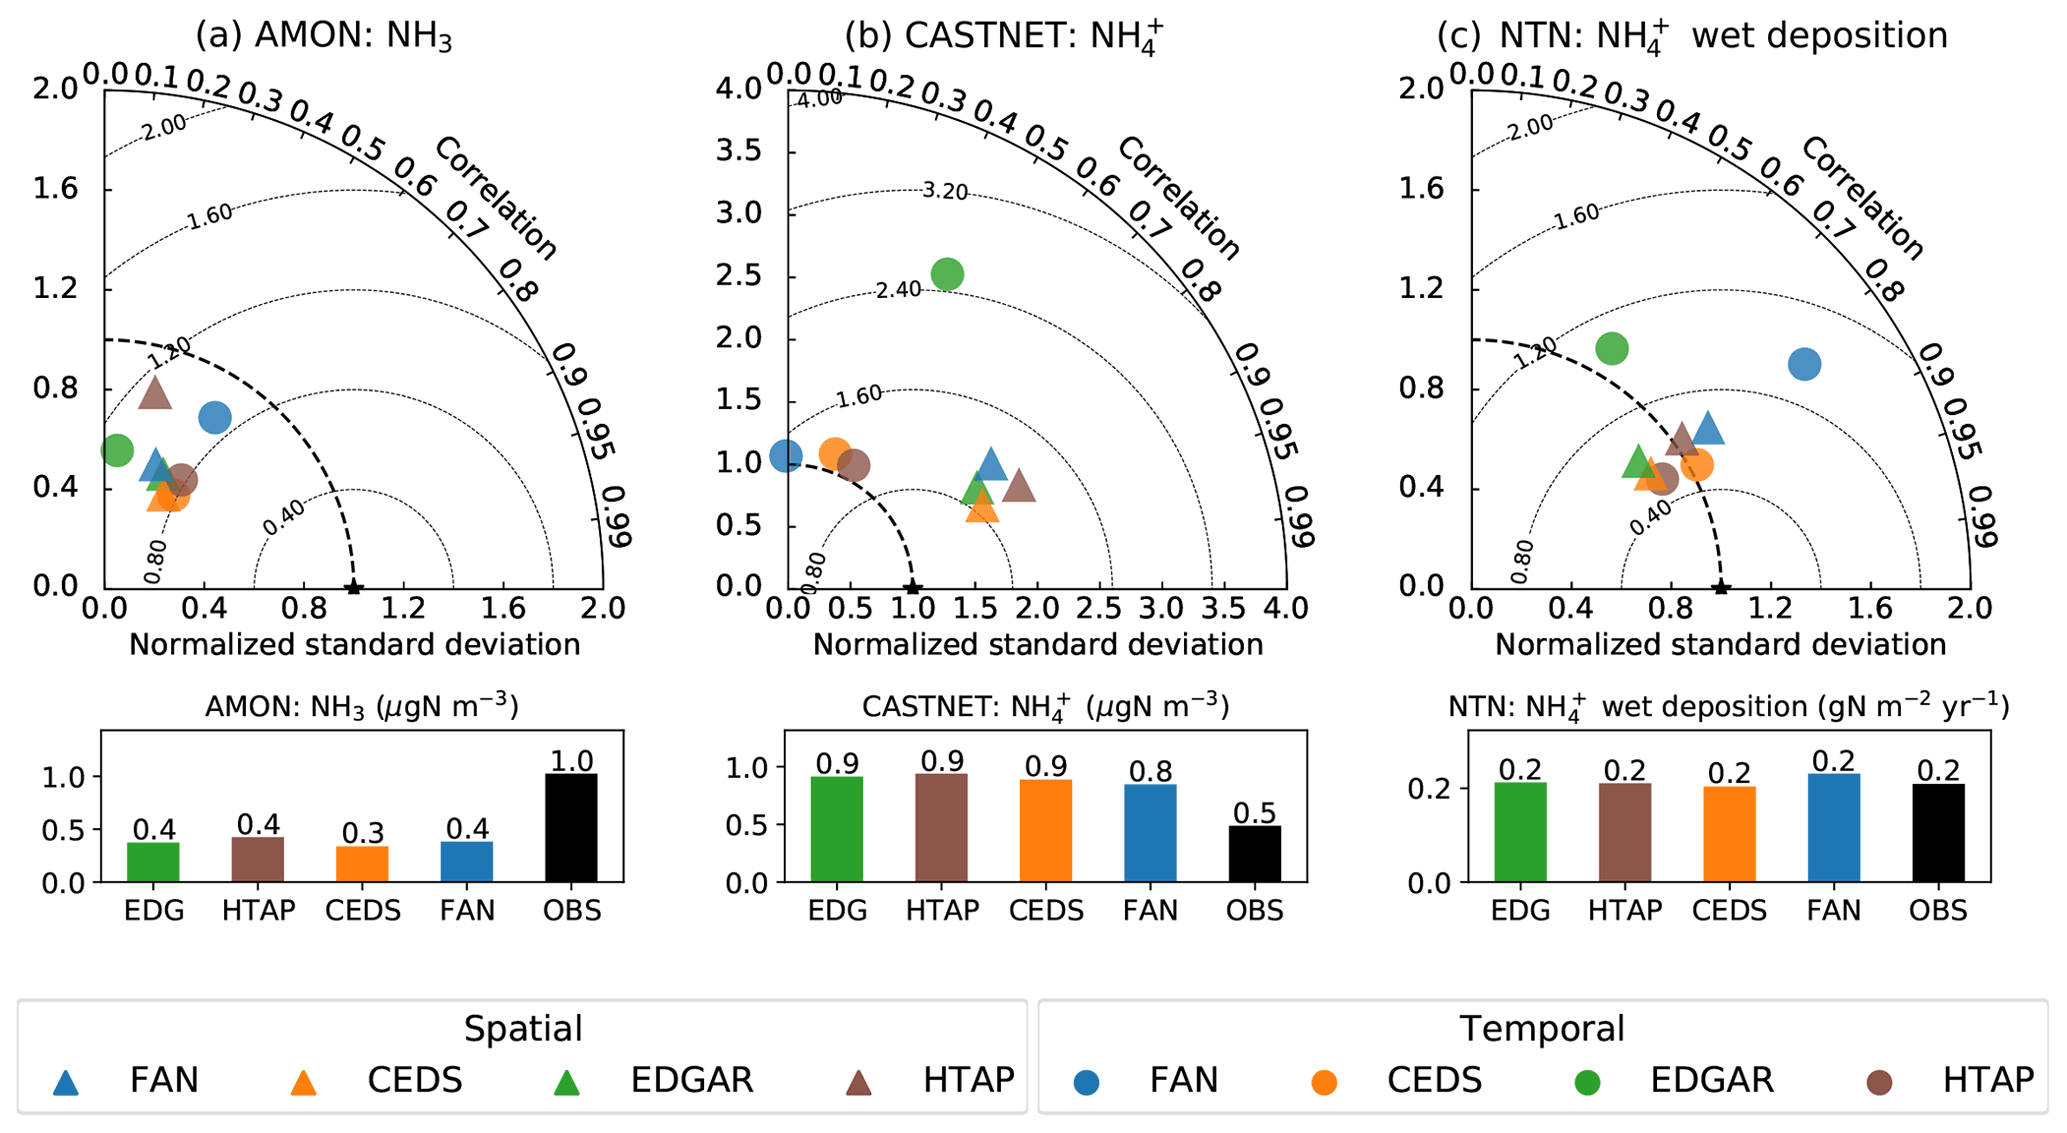
Figure 5Taylor plots for the simulated surface NH3 (a) and (b) concentrations and the wet deposition (c) evaluated for the US observation networks (AMoN, CASTNET and NTN). The simulated and observed network-wide averages are shown in bar charts. The Taylor plots include both a temporal (first averaged in space) and spatial (first averaged in time) evaluation denoted by triangular and circular markers, respectively.
Similar to the global means, within each region NH3 is biased low and NH4+ is biased high in almost all simulations. For Europe, the bias of NH3 ranges from a ∼ 40 % underestimation of the measurements (CEDS and HTAP) to a ∼ 10 % overestimation (EDGAR), whereas the is overestimated by between 40 % (CEDS, FAN, HTAP) and 70 % (EDGAR). The biases are even larger but more uniform for the US (60 %–70 % underestimation of NH3 and 60 %–80 % overestimation of ), and the performance is particularly poor for East Asia, where all inventories predict unrealistically low NH3 concentrations of below 0.5 µg N m−3 over large areas; at the observed sites the negative bias is 80 %–90 % of the mean.
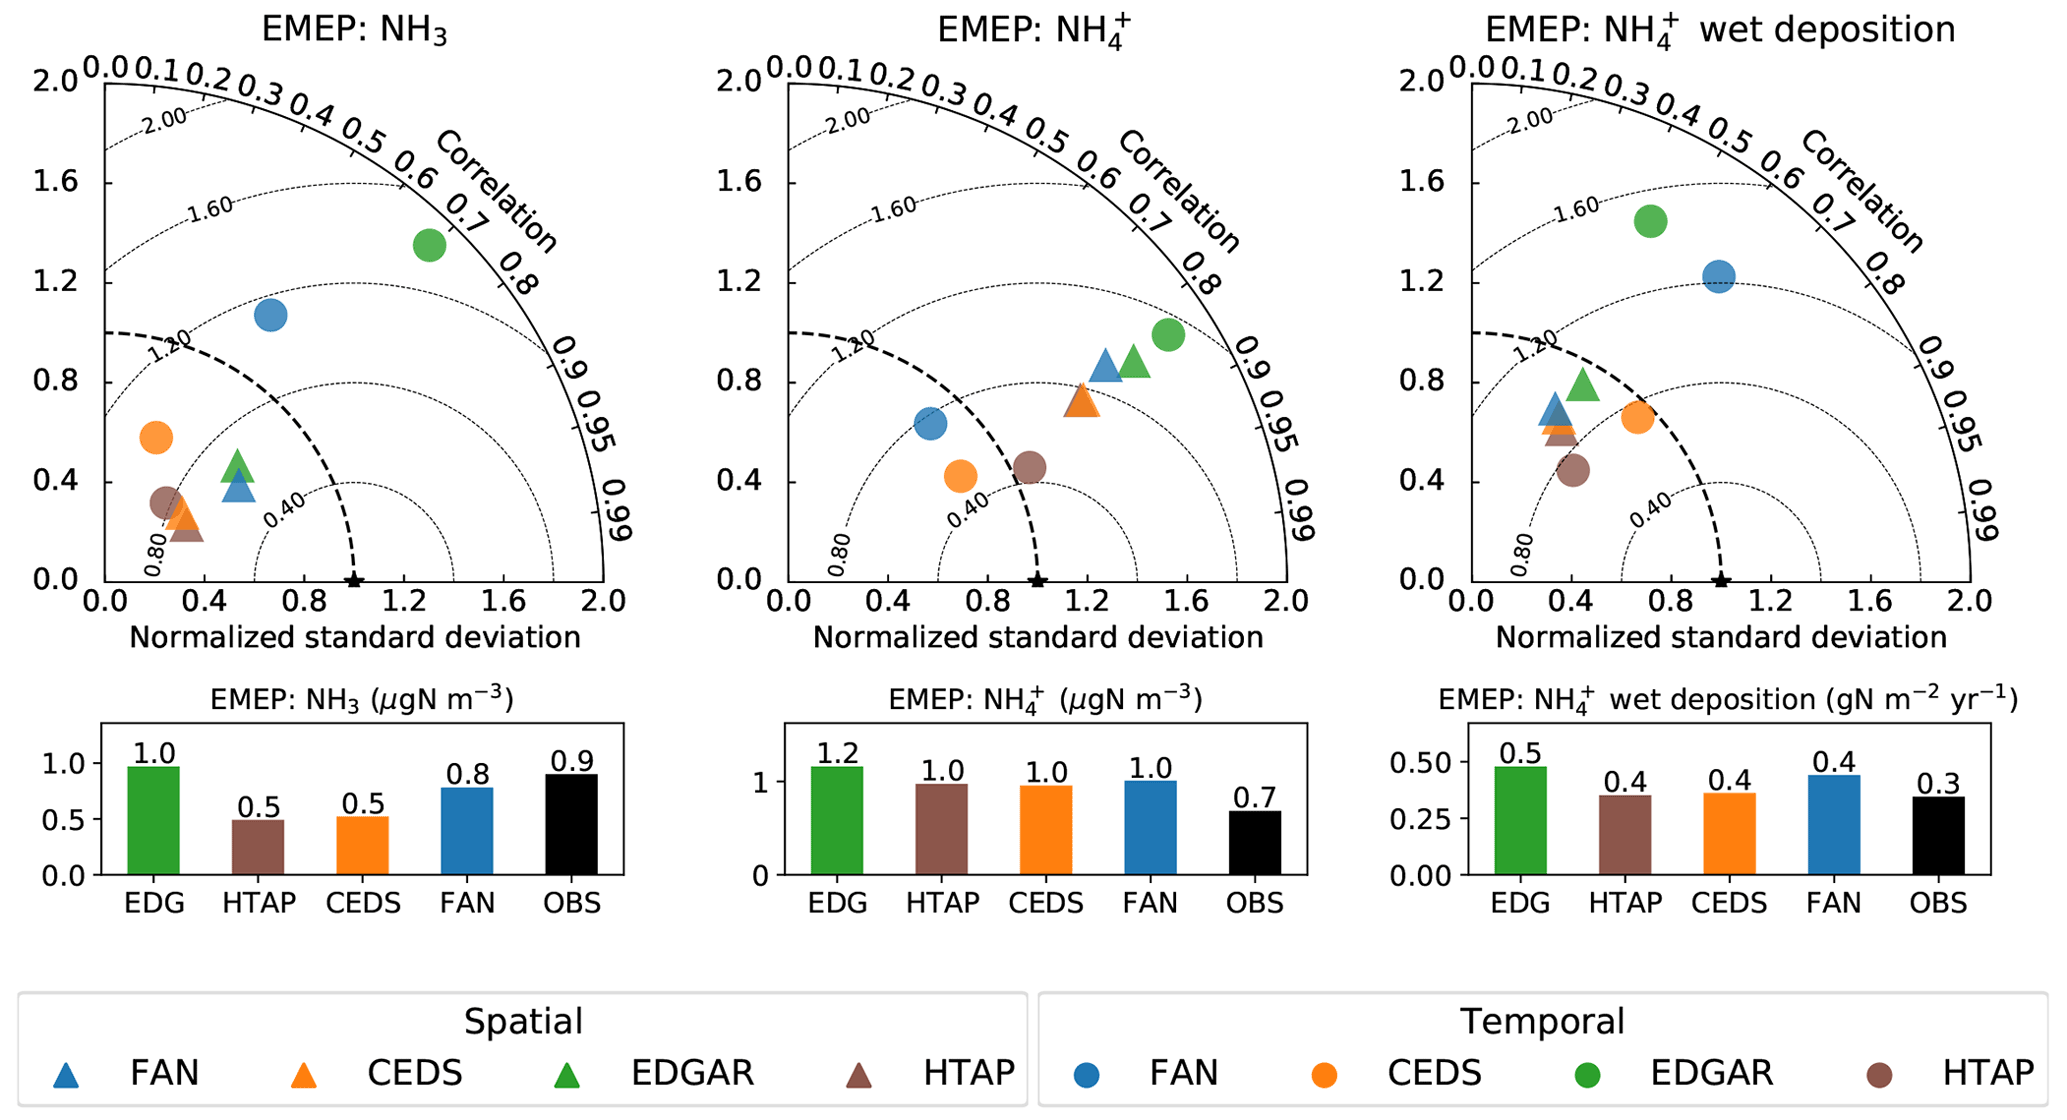
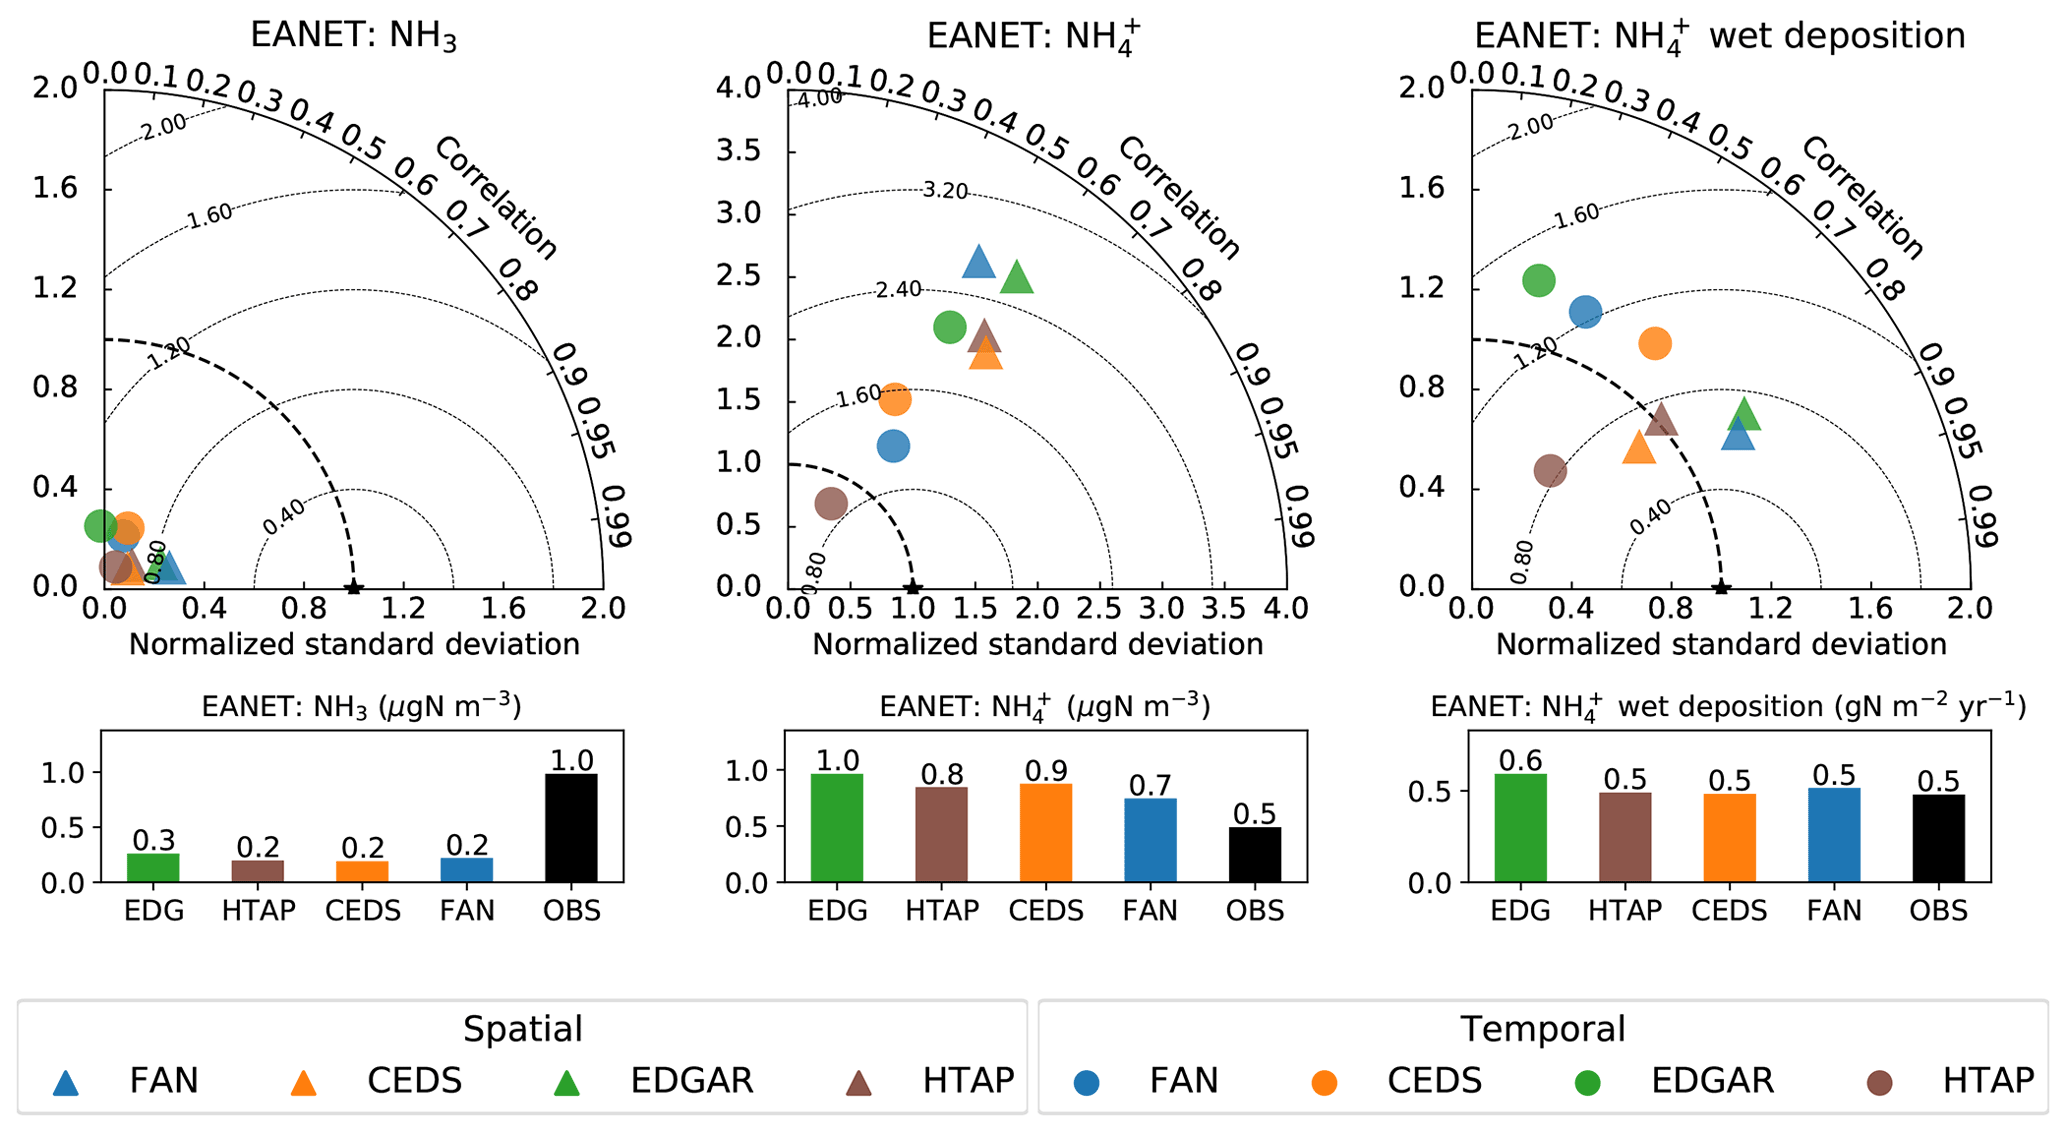

Figure 8Seasonal profiles of simulated wet deposition (a–c) and and NH3 emissions for the EANET, EMEP and NTN networks. All values are averaged over the years 2010–2015; the emission fluxes are evaluated for the observed sites.
The CAM-chem version used in this study has previously been found to overestimate sulfate aerosol concentrations (Lamarque et al., 2012; Tilmes et al., 2015), possibly due to assumptions regarding the vertical distribution of sulfur dioxide emissions. A qualitative comparison to the observed sulfate concentrations averaged over the monitoring networks (Fig. S17) confirms the overestimation especially for the summertime concentrations over the US. This is likely to lead to a positive bias in and a correspondingly negative bias in NH3, due to an overestimation of ammonium sulfates. The modeled wet deposition (calculated as the sum of scavenged NH3 and ) is likely to be more robust towards errors in the NH3/ partitioning than the individual atmospheric measurements of these constituents, since both the gas-phase NH3 and aerosol-phase are scavenged by precipitation. This is consistent with the smaller biases and generally better performance of the simulated wet depositions compared to atmospheric NH3 and concentrations.
The differences between the simulations become more pronounced when evaluated in the temporal domain, as indicated by the Taylor plots (Figs. 5–7). A comparison of the monthly wet deposition and NH3 emissions (Fig. 8) shows that in each simulation the temporal peaks in wet deposition coincide with the peaks in emissions in each of the networks, which suggests that the temporal differences in the different simulations can be traced to the temporal differences in NH3 emissions. In FANv2, the seasonal variation in NH3 emissions can be ascribed to both the NH3 volatilization rate, which is driven by the simulated meteorology, and the fertilization timing, which is parameterized within the CLM crop model. The emission inventories prescribe these temporal variations on a monthly timescale.
The simulations broadly agree in the overall seasonal variation of the emissions, which in temperate climates results, in part, from the temperature contrast between the summer and winter months (Fig. 8). However, the simulations generally differ with regard to the timing and magnitude of the springtime emission peak, a peak which can be attributed to springtime fertilization and possibly manure spreading. CEDS, EDGAR and FAN overestimate the springtime wet deposition peaks to varying degrees; in FAN and especially EDGAR, the peak also occurs too early. The overall seasonality of the wet deposition is best captured by the CEDS and HTAP simulations (Figs. 5–7), although, compared to CEDS, HTAP has a tendency to underestimate the variability.
In summary, the four simulations show only small differences in their time-averaged spatial patterns, and their performance differs only slightly between the regions when evaluated against time-averaged observations (Figs. 5–7). In contrast, the simulations show distinct differences when compared temporally. This highlights temporal differences in the emissions – differences likely to originate in contrasting assumptions regarding the seasonality of agricultural activities. The temporal features of the observations are generally best reproduced using the CEDS and HTAP inventories, which incorporate regional datasets. In the FAN simulation the temporal correlation with the measurements generally lies between the EDGAR and the CEDS and HTAP simulations.
The results further suggest that both FAN and the inventories could be improved by assuming the fertilizer application is distributed more evenly over the growing season. All inventories, as well as FAN, would also benefit from a more realistic representation of agricultural practices in the East Asian region covered by EANET, where the observed wet deposition would be better captured by a more symmetric monthly variation in emissions peaking between May and July. This seasonal pattern is consistent with recent NH3-focused global and regional studies (Xu et al., 2019; Zhang et al., 2018).
Regional fertilization practices could, in principle, be implemented in the CLM and thus within FANv2. This more detailed regional information would impact the agricultural nitrogen cycle simulated by the CLM, with consequences to the other simulated aspects of the crop model including crop growth, harvest and N losses such as denitrification. Nevertheless, a central focus of the CLM as a component of an Earth system model is to simulate how ecosystem processes respond to the climate forcing, and it is therefore important to allow all simulated agricultural practices to change in response to the simulated climate. The direct coupling between FANv2 and the CLM means that FANv2 can benefit from improvements such as more detailed fertilization algorithms, should they be implemented in future versions of the CLM.
3.2 Africa
For Africa, the FAN-simulated NH3 emissions (7.2 Tg N) differ markedly from the other inventories (2.1–2.4 Tg N; Table 1). While widespread observational data covering Africa are not available, the INDAAF dataset provides an opportunity to evaluate the predicted NH3 emissions at stations located in western and central Africa. As noted in Sect. 2.5, due to limited data availability, the simulated results for 2010–2015 are here compared with measurements covering 1 or more years since the year 2000 or later.
The comparison with the INDAAF data (Fig. 9) shows that both FAN and EDGAR emissions generally underestimate the average NH3 concentration of 3.2 µg N m−3 at the INDAAF sites. The EDGAR simulation predicts NH3 concentrations mostly below 1.5 µg N m−3 with a mean of 0.4 µg N m−3, while the FAN simulation also underpredicts the NH3 concentrations (simulated mean 1.0 µg N m−3) but shows less bias in comparison to the available observations. As the CEDS and HTAP emissions over Africa are based on the EDGAR inventory, the simulations using these inventories do not differ significantly from the EDGAR simulation.
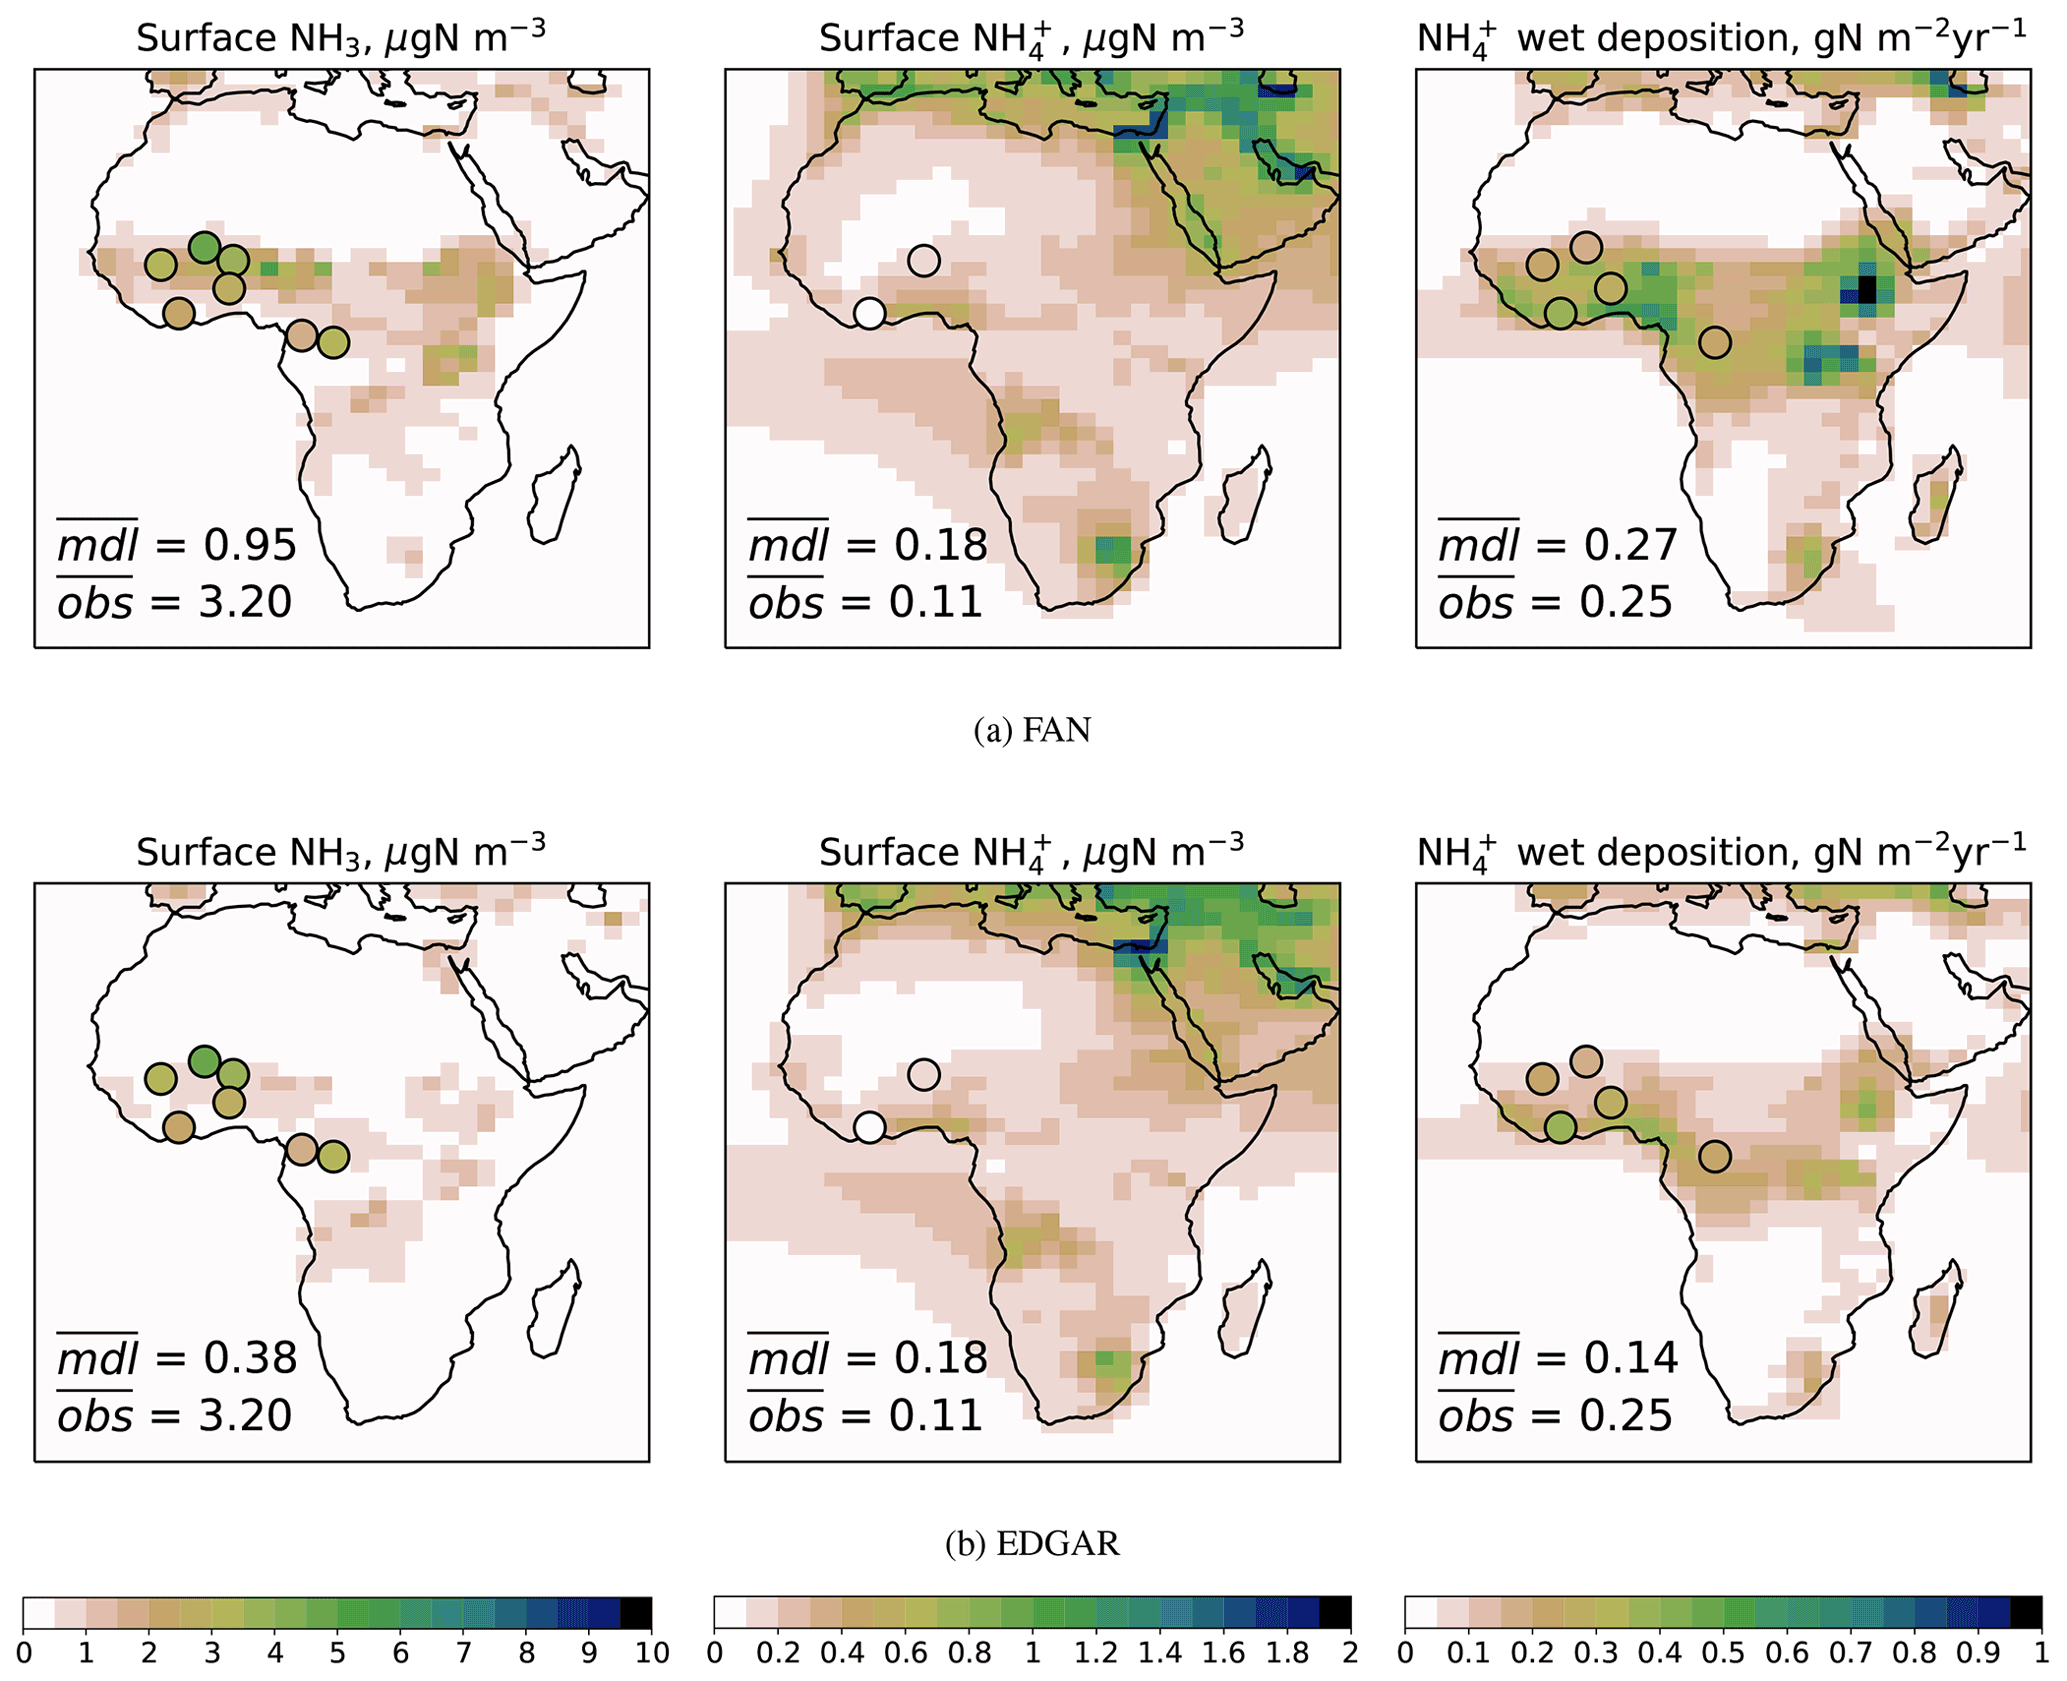
Figure 9Modeled (shading) and observed (markers) for ammonia (left) and ammonium (middle) concentrations and wet deposition fluxes (right) for Africa in the FAN (a) and EDGAR (b) simulations. Modeled and observed values averaged over the stations are shown in the lower-left corner of each plot.
The underestimation of NH3 over Africa could be caused by inaccurate partitioning between the airborne NH3 and as noted in the previous section. Especially over arid regions this could be due to non-volatile cations in crustal aerosols, which increase the aerosol pH and reduce the uptake of ammonia (Guo et al., 2018). While simulated concentration in aerosol is indeed overestimated at one of the two INDAAF sites with sufficient data coverage for , the difference is far too small to explain the negative bias of gaseous NH3. The concentration of in aerosol phase is generally low compared to NH3, and the higher ammonia emissions in FAN compared with EDGAR mainly increase the concentration in the gas phase. Some of the increased NH3 emissions in the FAN simulation are scavenged as in the precipitation. As a result the wet deposition is substantially higher in the FAN simulation than in EDGAR.
The EDGAR simulation underestimates the average wet deposition of by about 50 %. The FAN simulation overestimates the wet deposition flux calculated from the observation by ∼10 %, but since the collection efficiency of the precipitation samplers is not perfect (see Sect. 2.5), the actual deposition flux is unlikely to be overestimated. The precipitation-weighted concentrations in rainwater (Fig. S12) indeed show an average underestimation by about 30 %.
The modeled NH3 concentrations at the INDAAF sites are consistent with the comparison of the column densities (Fig. 2), which show a dramatic difference between the FAN and EDGAR simulations over Africa between the Equator and approximately 15∘ N. The column density predicted by FAN is much closer to the IASI, although contrary to both FAN and the INDAAF observations, IASI shows a positive north-to-south gradient over western Africa. The FAN simulation reproduces the observed pattern over eastern Africa (Ethiopia and Kenya), while the values over central and western Africa remain underestimated.
Biomass burning is generally an important source of NH3 emissions over Africa (Bouwman et al., 1997; Whitburn et al., 2015). However, the relative contributions of biomass burning and agricultural NH3 emissions differ between different ecosystems. The biomass burning emissions during the dry season are predominant in the forests and wet savannas, but volatilization of NH3 from livestock wastes is the largest source in the Sahelian dry savannas (Adon et al., 2010), and it is indeed over the INDAAF sites in the Sahel region where FAN and the other simulations differ most markedly.
Figure 10 compares the observed and simulated seasonal distributions of ammonia and its emission over the three dry savanna sites in the INDAAF dataset. Banizoumbou and Katibougou (Fig. 10b and c) show a two-peaked distribution with the highest NH3 concentrations occurring during the transitions between the wet and dry seasons (boreal spring and autumn). A similar pattern has been observed for the concentration of nitrogen dioxide at the same sites (Ossohou et al., 2019). FAN captures the two-peaked seasonal pattern, although the concentration during the wet season is underestimated. The peaks are offset by 1–2 months from that observed, because the simulated wet season starts earlier and ends later than observed. Different from the other two sites, the observed NH3 concentration at the Agoufou site (Fig. 10a) remains high during the dry season, which is not reproduced. The reasons for this difference are unclear. Agoufou records a lower yearly rainfall than Banizoumbou and Katibougou, but in addition, Delon et al. (2015) note that the surrounding area is heavily grazed during the dry season due to the proximity of a permanent pond. We therefore cannot exclude the possibility that the observed seasonal variation would reflect the variability of the local NH3 emissions.
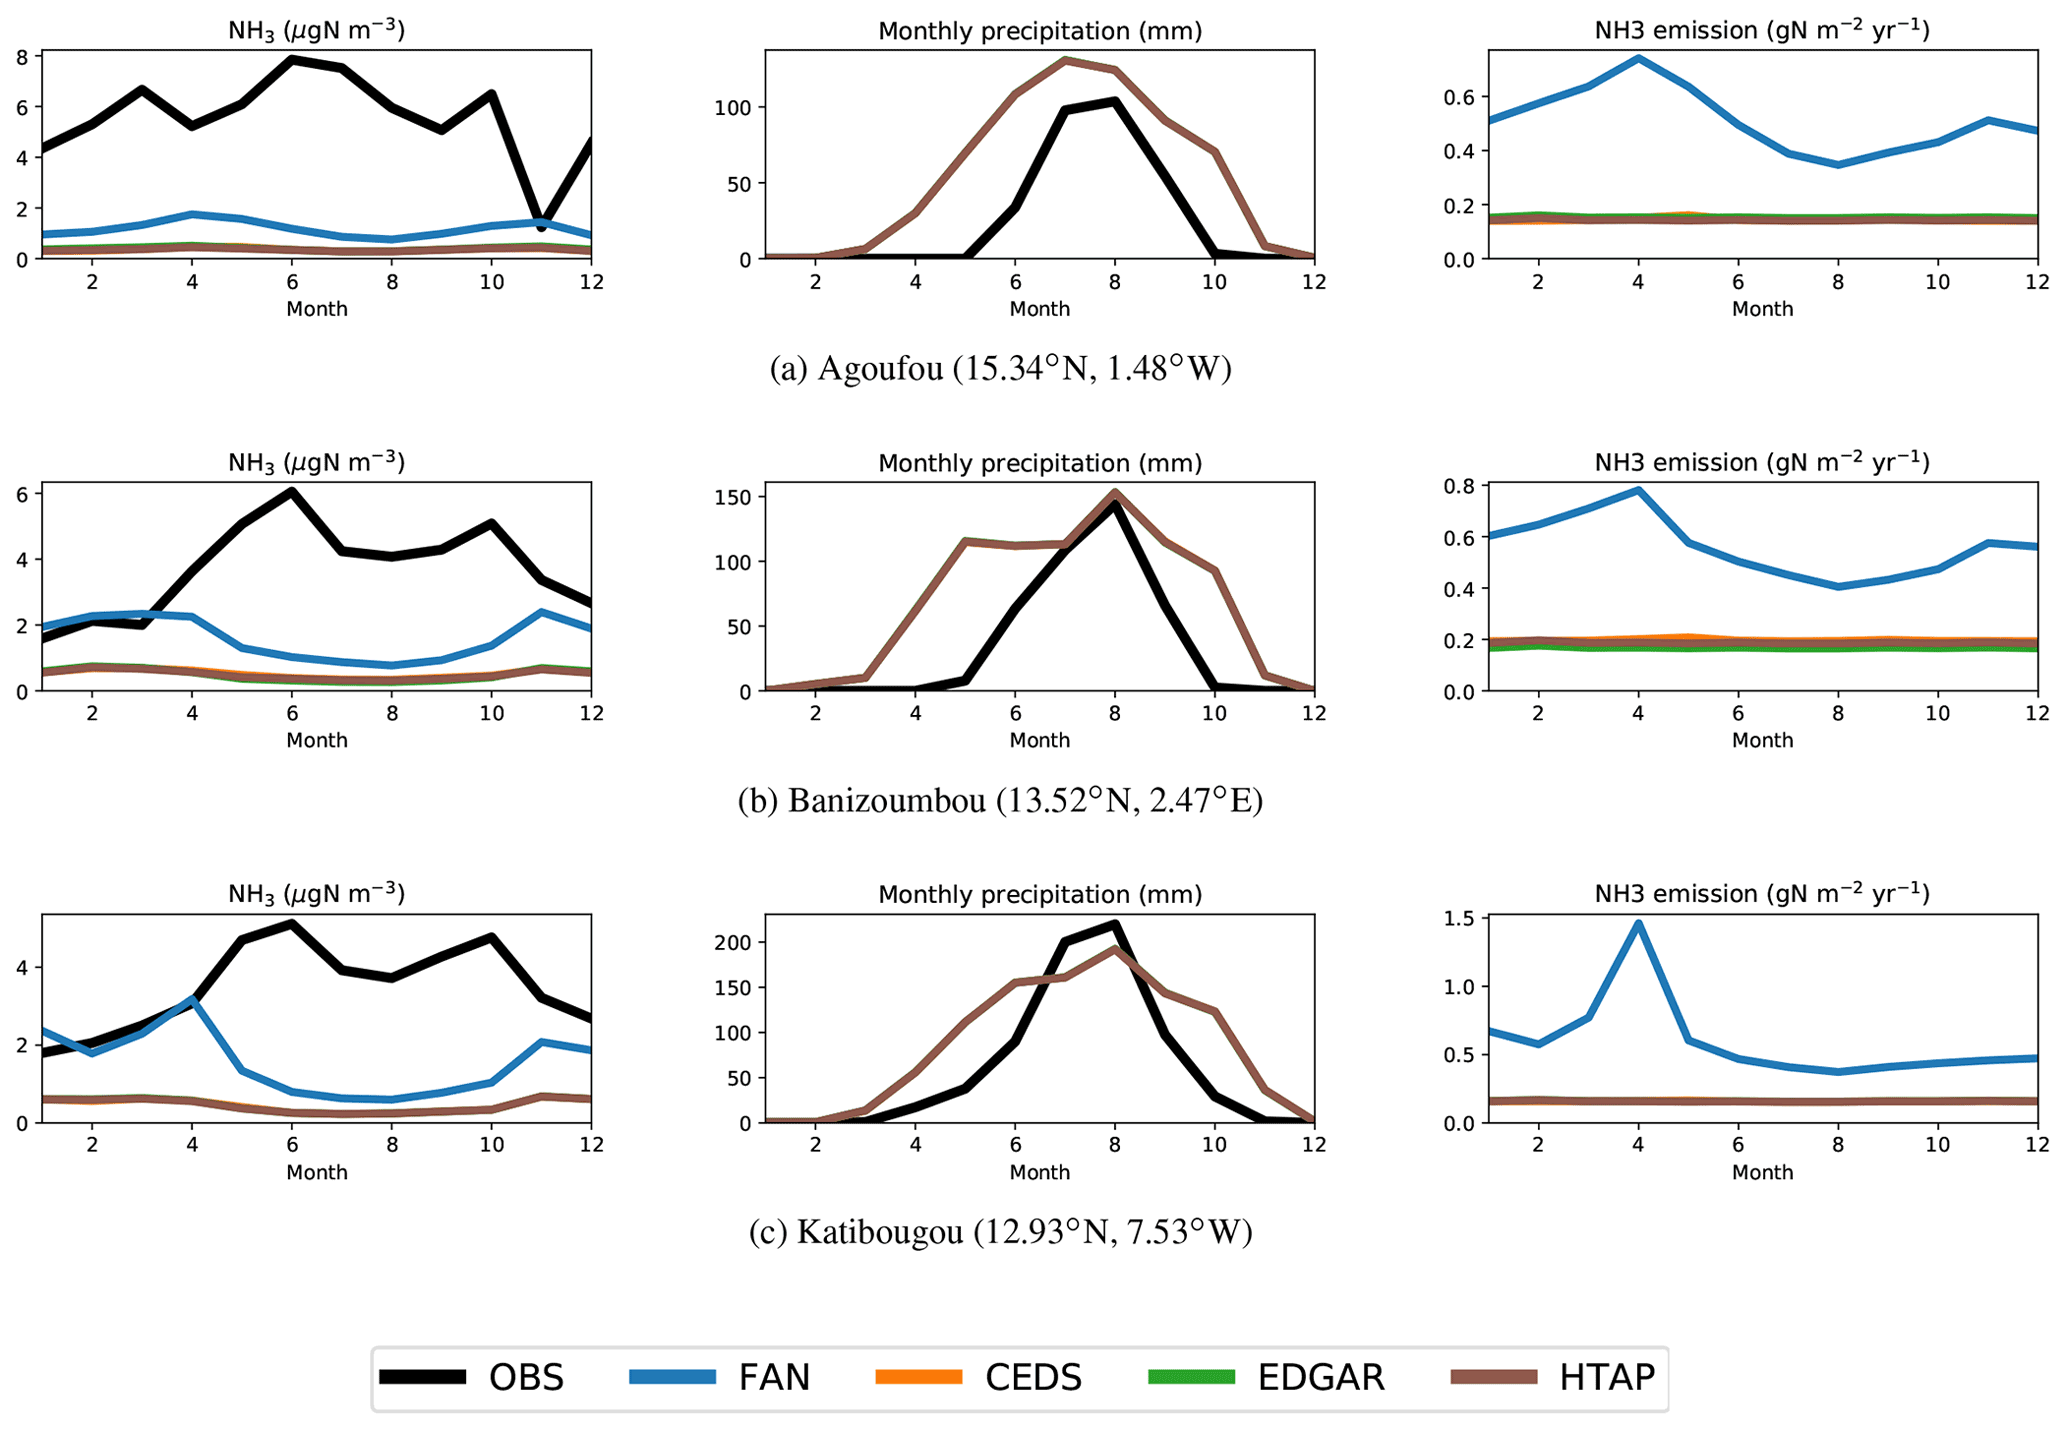
Figure 10Simulated and observed ammonia concentration (µg N m−3), monthly precipitation (mm; no difference between simulations) and the emission flux of ammonia (g N m−3 yr−1) on three dry savanna sites included in the INDAAF database.
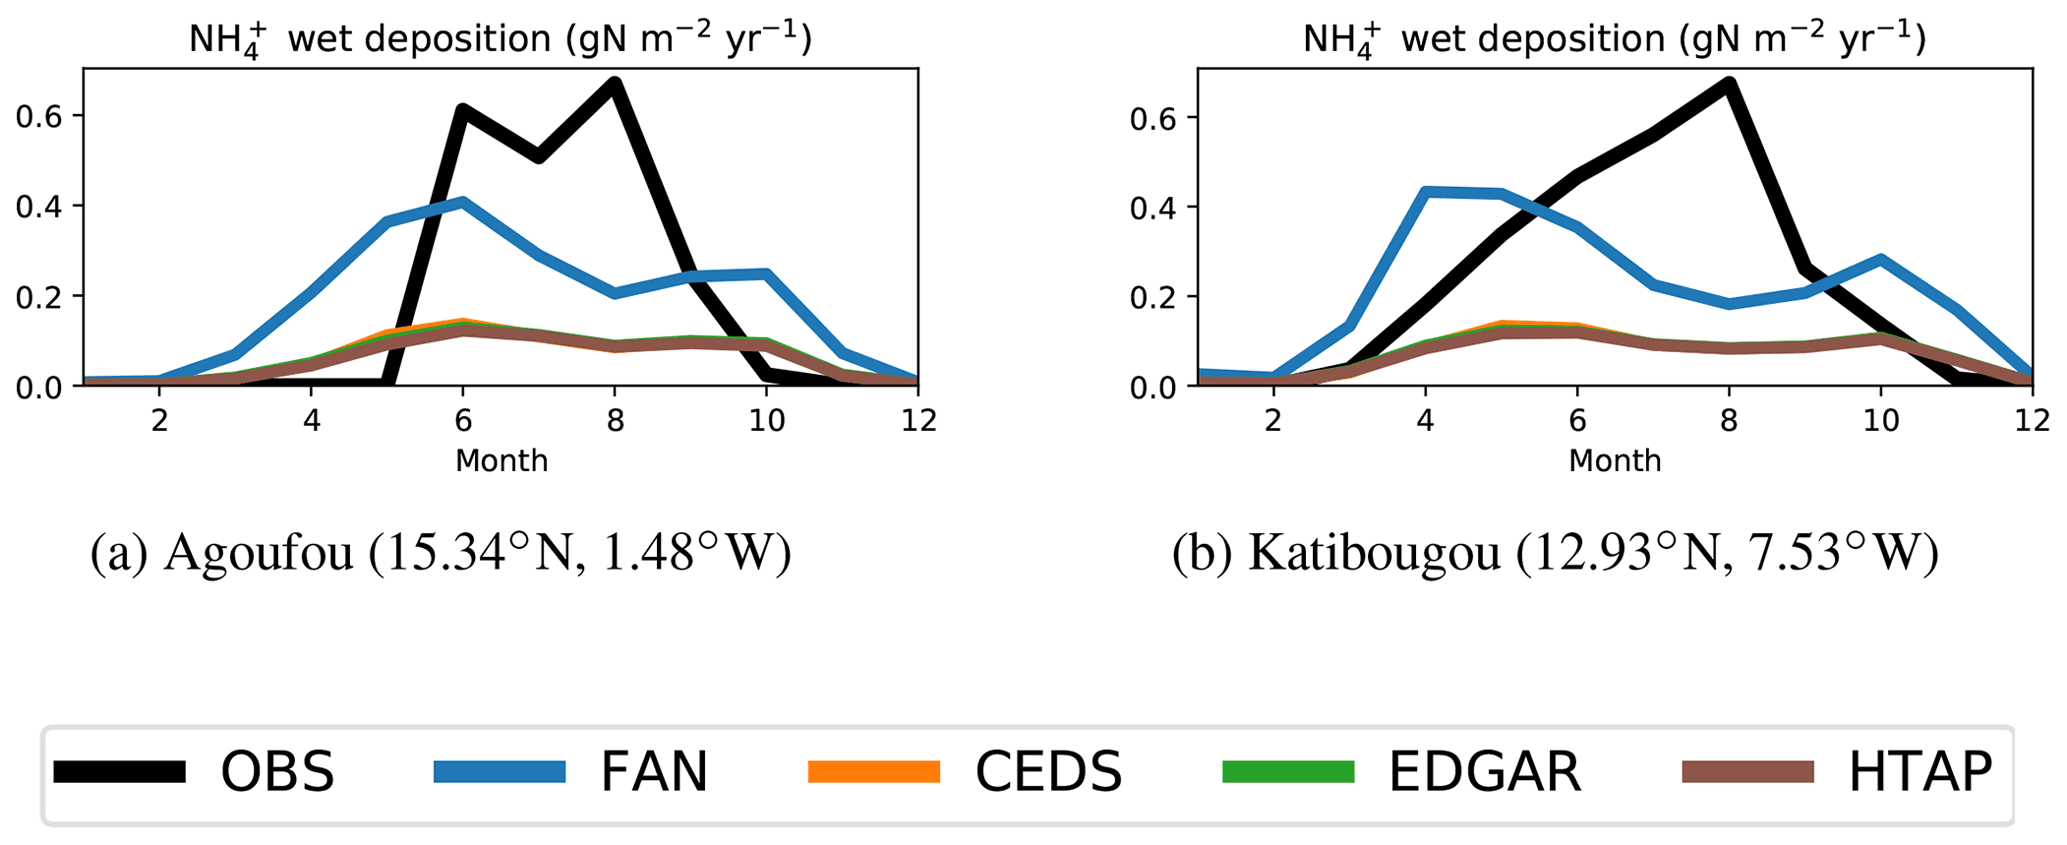
Figure 11Simulated and observed wet deposition of ammonium (µg N m−3 yr−1) in Agoufou and Katibougou. The simulated wet deposition includes both scavenged aerosol-phase ammonium and the dissolved gaseous ammonia.
The NH3 emissions simulated by FAN at the Agoufou and Banizoumbou sites are mainly from manure handling and grazing livestock (not shown). No seasonal variation in the livestock N excretion is simulated over the region, and the seasonality of the NH3 emissions in Fig. 10a and b is therefore driven by changes in environmental conditions, especially soil moisture as suggested by earlier studies based on biogeochemical models (Delon et al., 2019) and empirical data (Hickman et al., 2018). The sharper peak in the NH3 emission simulated for Katibougou in April (Fig. 10c) is due to fertilizer application on croplands, which coincides with the end of the dry season.
The seasonal patterns of wet deposition (Fig. 11) are strongly affected by the seasonality of precipitation. FAN predicts a strong reduction in the deposition flux over the wettest months, similar to the seasonal variation of the gaseous NH3. This, however, contrasts with the observed deposition fluxes which show only slight or no reduction for the month of peak precipitation.
The presence of significant livestock-originated NH3 emissions over the Sahel region has been identified in earlier studies (Adon et al., 2010; Delon et al., 2010), and the non-pyrogenic origin of these emissions is consistent with the conclusion of several studies based on satellite data (Whitburn et al., 2015; Van Damme et al., 2015; Someya et al., 2020). Similar to the assessment of Vet et al. (2014), we find that the current emission inventories underestimate the NH3 and concentrations and deposition over the Sahel region, and the comparison with IASI data furthermore suggests that a similar underestimation may exist also in other parts of Africa where livestock densities are high. The FAN simulation shows that some of the discrepancy can be reconciled using recent land use and livestock datasets in combination with a process model which evaluates the NH3 volatilization as a function of environmental drivers.
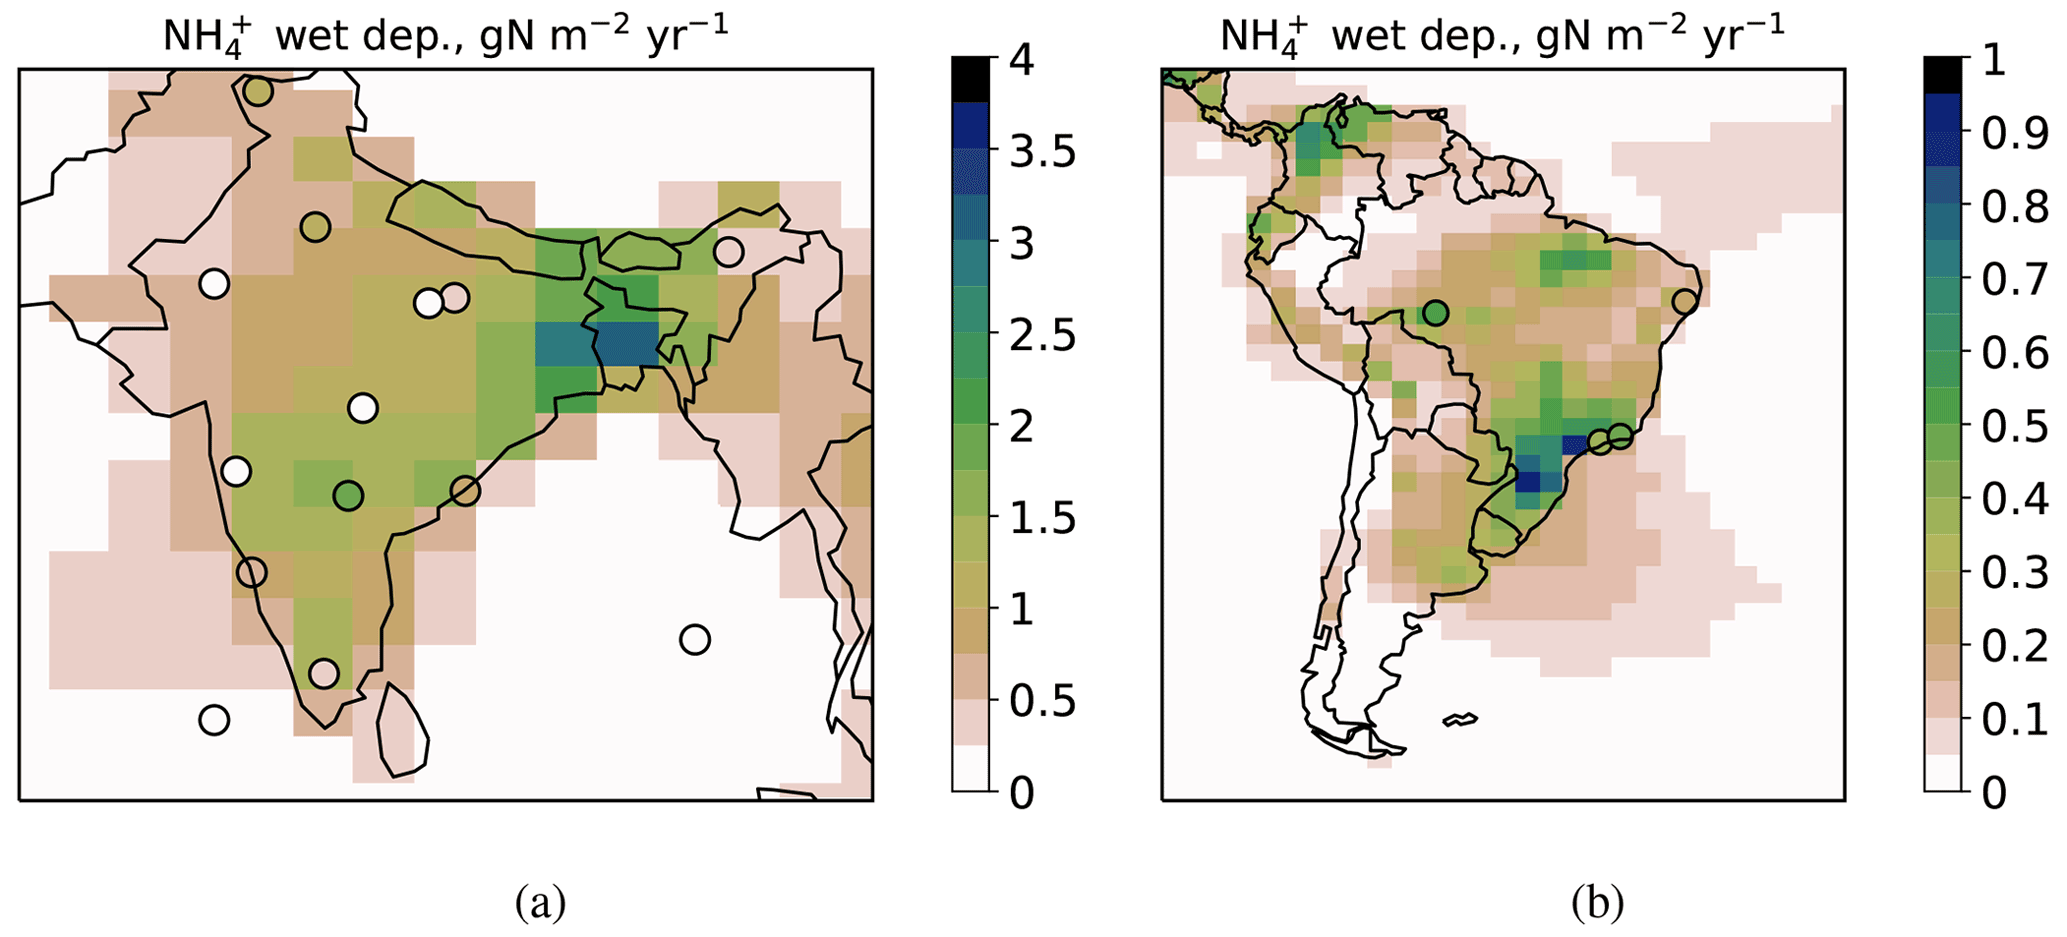
Figure 12The modeled wet deposition (gN m−2 yr−1) over (a) India and (b) South America in the FAN simulation (shading) and in the observations listed in Table A1 (markers). The other simulations are shown in Figs. S13 and S15.
3.3 Other regions
The FAN emissions are higher than in other inventories by ∼ 20 %–35 % over India and by ∼ 55 %–85 % over Latin America. These regions are not covered by the monitoring networks included in this study, and instead we compare the simulations with annual and multiannual wet deposition observations reported in the literature for sites in India and Brazil (Table A1).
For the majority of the sites in India (Figs. 12a and S13), all simulations overestimate wet deposition. The FAN simulation has the largest positive bias, as it has the highest NH3 emissions of all the simulations (Table 1). The FAN simulation also has the highest spatial correlation with the measurements, although the overall agreement is modest in all simulations (R=0.14–0.30).
The concentration in rainwater is overestimated in all simulations (Fig. S14), and thus an overestimate in simulated precipitation is unlikely to explain the positive biases over India. Earlier studies (Dentener et al., 2006; Vet et al., 2014) have also found the wet deposition to be overestimated in India, which could be caused by a systematic bias in emission inventories. The FAN simulation indeed overestimates the column-integrated NH3 concentration with respect to the IASI data (Fig. 2) over parts of India, while EDGAR and the other simulations (Fig. S4) appear less biased despite the overestimated wet depositions. As an alternative explanation, Singh and Kulshrestha (2012) suggest that the alkaline crustal aerosols typically present over the Indian subcontinent reduce the aerosol uptake and scavenging of NH3, causing dry deposition to become the dominant removal pathway. This effect is not simulated by CAM-chem but could explain the apparent discrepancy between the reports of very high measured gaseous NH3 concentrations, up to 70 µg m−3 on a rural site (Singh and Kulshrestha, 2014), and the relatively low (<0.5 gN m−2 yr−1) wet deposition fluxes at several of the Indian sites.
Figure 12b compares the simulated wet depositions to observations at four sites in Brazil. The deposition in the FAN simulation is on average slightly underestimated but about 50 % higher than the other simulations (Fig. S15) and thus closer to the observations. The NH3 column density in FAN also agrees better with the IASI data (Fig. 2), although the extent of the plume in northwestern Brazil is not captured. Similar to Africa, biomass burning is a significant source of NH3 in South America, but more specific observations would be needed to differentiate between the agricultural and other emission sources. Thus, while the observations are consistent with the higher NH3 emissions predicted by FAN, the sparse geographical coverage and the lack of co-located NH3 and observations make it difficult to draw definitive conclusions about the NH3 emissions on a continental level.
Together, the NH3 emissions in Africa, India and Latin America comprise nearly half of the global total as simulated by FAN. Due to the scarcity of in situ data, the emissions in these regions remain poorly constrained. Satellite retrievals of NH3 offer an alternative data source for emission assessment (e.g., Chen et al., 2021); however, since only the gaseous ammonia is observable from satellites, this approach is sensitive to assumptions or model errors in the lifetime and gas–aerosol partitioning of atmospheric NH3.
3.4 Nitrate aerosols
The atmospheric concentration of ammonium nitrate depends on availability of ammonia and nitric acid vapor produced by oxidation of nitrogen dioxide (Ansari and Pandis, 1998). The highest nitrate concentrations occur over populated areas in Asia, Europe and North America where the NH3 emissions from intensive agriculture coincide with nitrogen oxide emissions from industrial and traffic sources (Fig. 13).
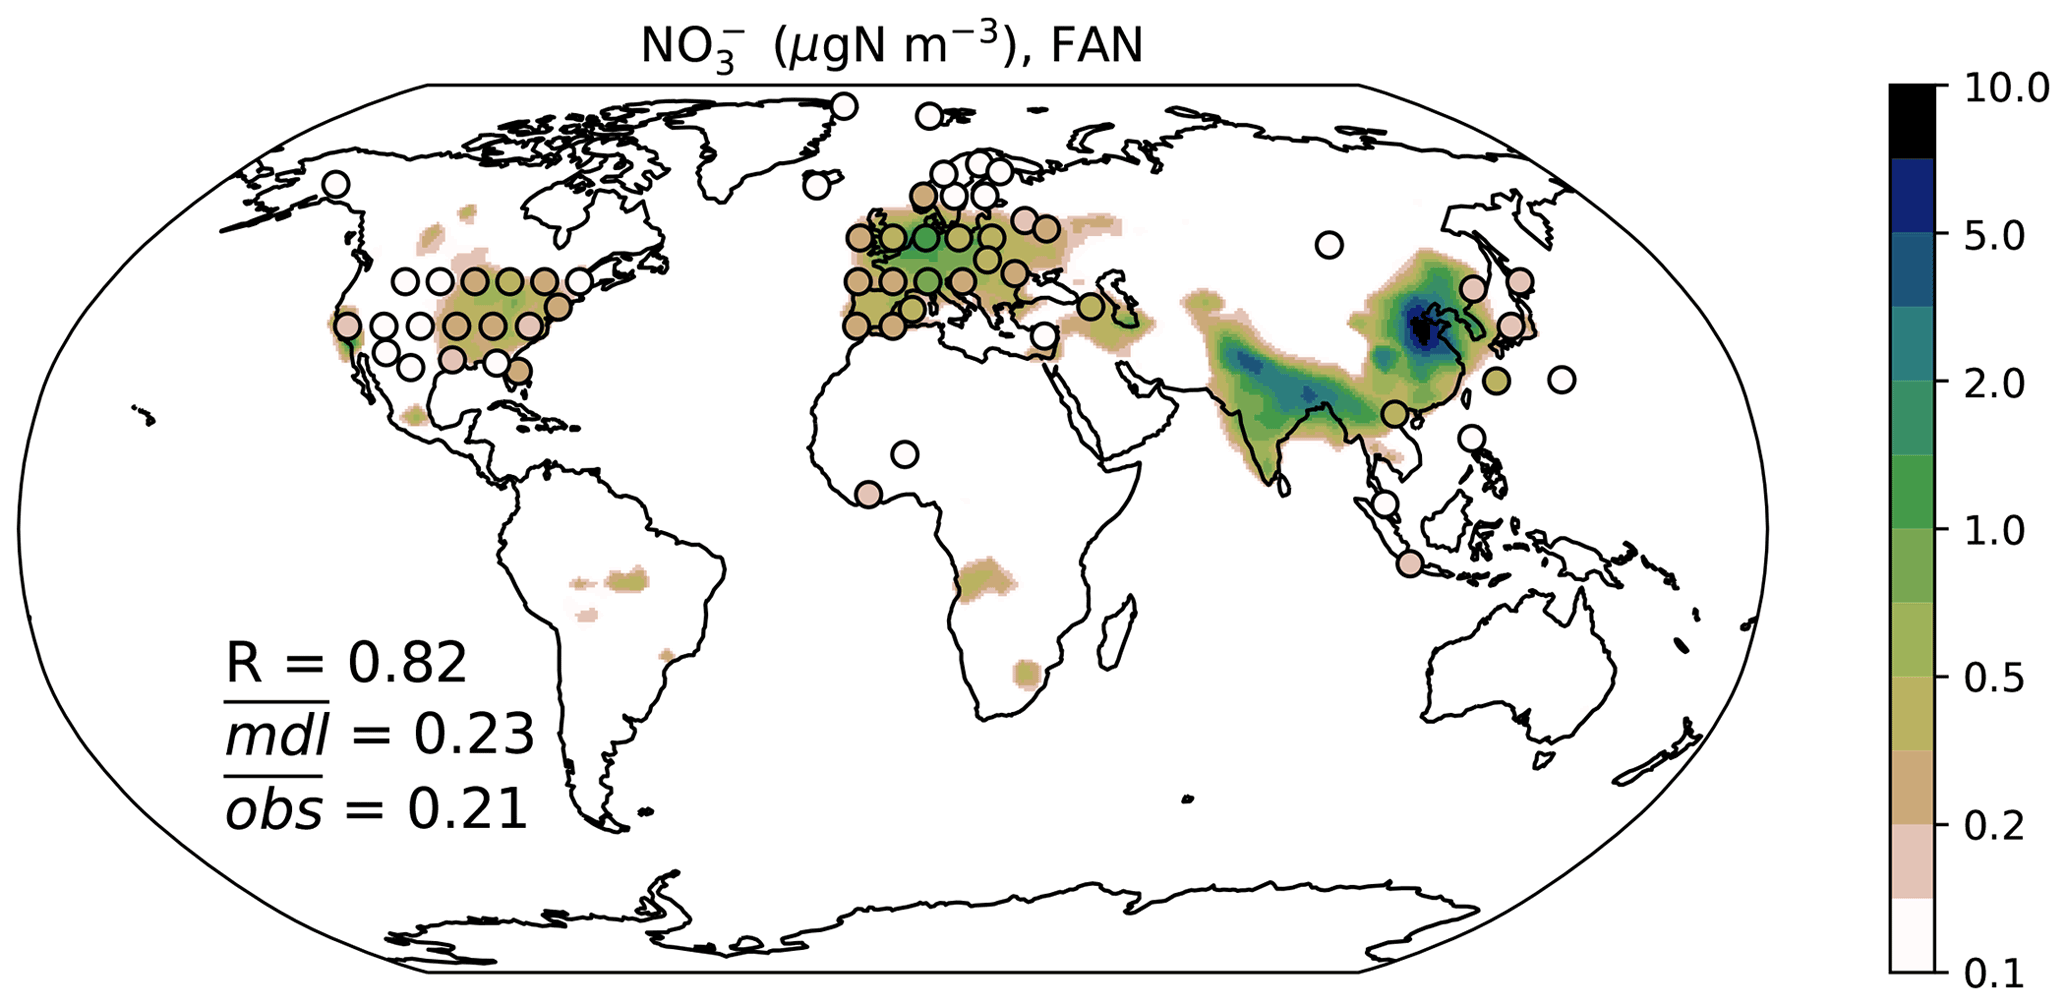
Figure 13Average near-surface concentration of (µgN m−3) in the FAN simulation for 2010–2015. Observed values are indicated by markers. The density of observations has been reduced as in Fig. 1. The corresponding plots for the other simulations are shown in Fig. S16.
The FAN simulation is in good agreement (R=0.82, < 10 % mean bias) with the observed global patterns of aerosol-phase nitrate. The other simulations (Fig. S16) also reproduce the observations well (R=0.74–0.76) although with slightly higher biases (15 %–35 % of mean). However, comparing the networks separately (Fig. 14) reveals regional biases: the FAN simulation overestimates the North American (CASTNET) observations on average by ∼70 % and the European observations on average by ∼35 %, and it underestimates the East Asian (EANET) observations on average by ∼50 %. The other simulations show smaller underestimations for EANET but larger overestimations for CASTNET.
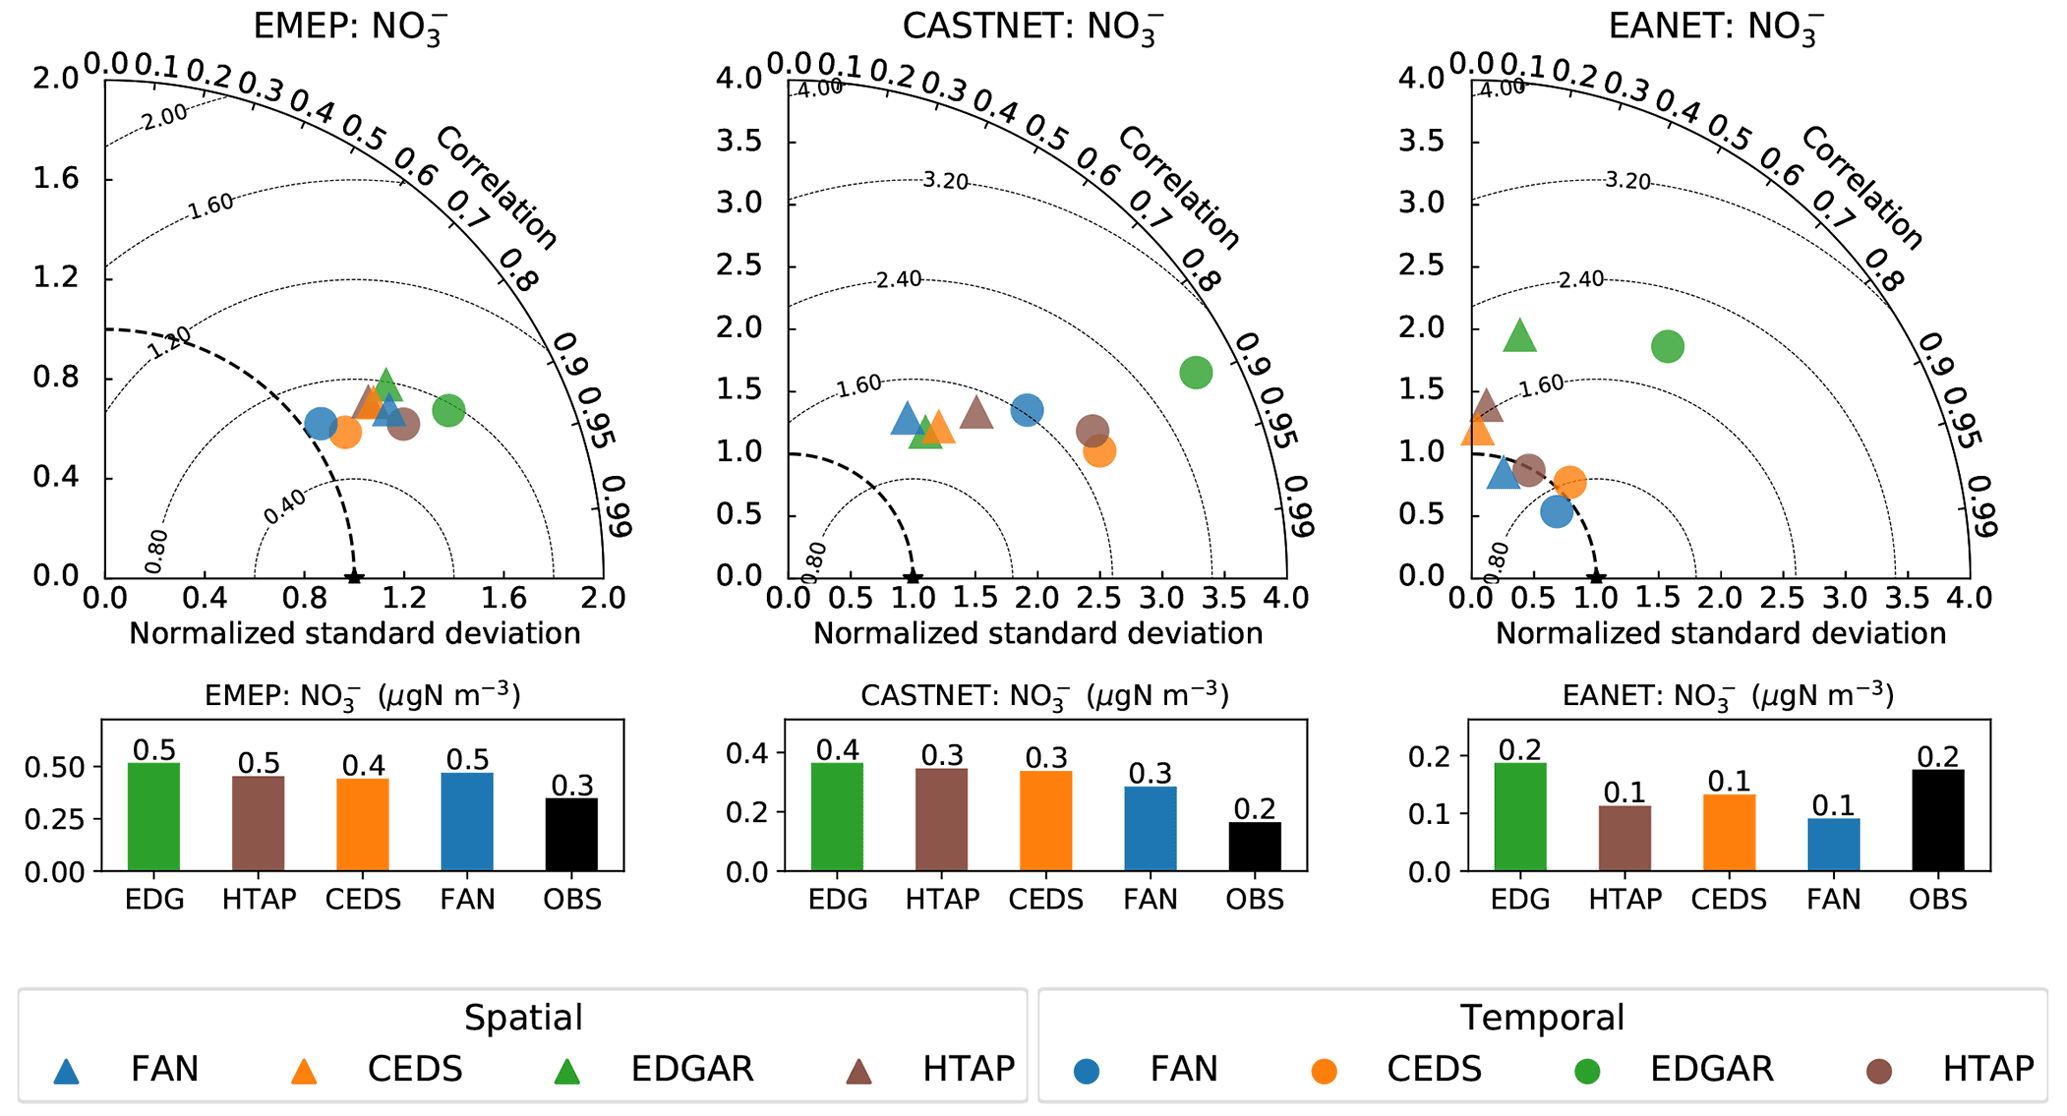
Figure 14Taylor plots for the simulated concentration in the EMEP, CASTNET and EANET networks. Average concentrations for 2010–2015 are shown in bar charts.
As seen in Fig. 14, the temporal variation of is in good qualitative agreement with the observations over North America and Europe in all simulations (R=0.8–0.9), but its simulated amplitude (as measured by the standard deviation) is too high, especially for over the US. Over East Asia, the temporal correlations show rather large variations between the simulations (R=0.45–0.8) with FAN and CEDS performing best. It should be noted that the highest nitrate levels in East Asia are simulated to occur in China, which is not covered by the nitrate observations in EANET.
Some of the biases might be caused by inaccurate simulation of the gas- or aqueous-phase chemistry of the sulfur and nitrogen oxides impacting the precursor concentrations for ammonium nitrates. The overestimation of sulfate aerosols (as noted in Sect. 3.1) could disturb the gas–aerosol partitioning of nitric acid, but this would be expected to rather result in a negative bias in the simulated nitrates (Feng and Penner, 2007; Nenes et al., 2021). The annually averaged effect in our simulations is likely to be small due to the opposite seasonal variations of the model biases for nitrate and sulfate (Fig. S17).
Besides ammonium nitrate, the measured nitrate aerosols may also form due to the interaction of nitric acid and sea salt or soil dust aerosols (Lee et al., 2008; Itahashi et al., 2016). The latter mechanisms are not simulated here. The omission of non-ammonium nitrate aerosols may explain the simulated negative bias seen in Fig. 13 at some coastal sites (e.g., several of the EANET stations) or continental sites (e.g., the INDAAF stations in the Sahel region). This, however, implies that the positive biases for the EMEP and CASTNET networks would be even higher if CAM-chem included the nitrate in sea salt or dust particles.
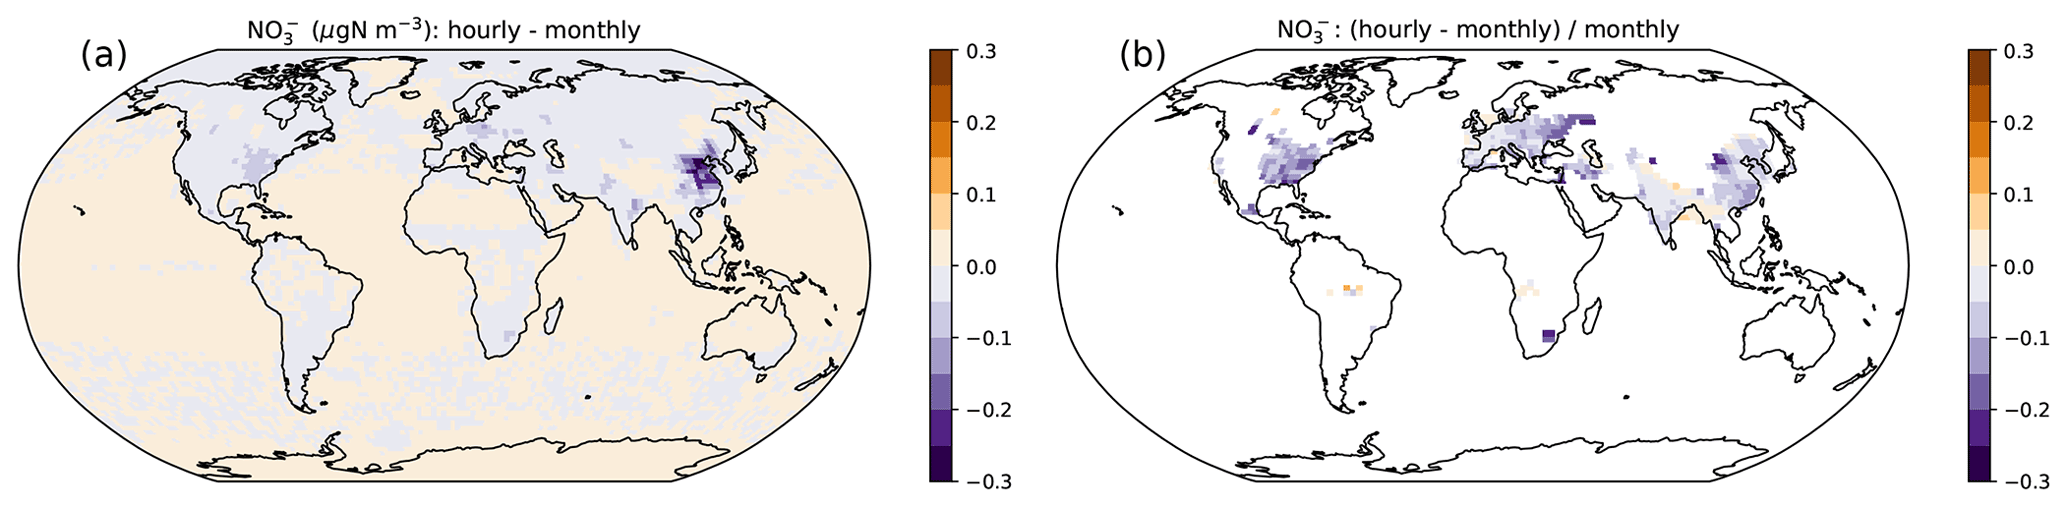
Figure 15Difference in the 2010 mean aerosol concentration between the simulations with monthly and hourly NH3 emissions. (a) Difference (hourly–monthly) in µgN m−3; (b) difference relative to the concentration in the monthly simulation. The relative difference is evaluated for cells with annual mean concentration greater than 0.2 µgN m−3.
3.4.1 Effect of temporal resolution of emissions
For CASTNET, the FAN simulation has the lowest average nitrate concentration despite having the highest wet deposition and second-highest total NH3 emissions among the four simulations (Fig. 14 and Table 1). The FAN simulation also exaggerates the seasonal variation of (Figs. 14 and S17) to a lesser extent than the other simulations. The seasonality of the NH3 emissions shown in Fig. 8 and the Taylor plot shown in Fig. 5 suggest this cannot be attributed to FAN NH3 emissions having a significantly smaller seasonal amplitude than the other inventories. However, the differences between these simulations could be caused by the co-variation between NH3 emissions and the chemical equilibrium which regulates the formation of ammonium nitrate aerosols: the cold, humid conditions which favor the aerosol-phase ammonium nitrate (Ansari and Pandis, 1998) are the least favorable for NH3 volatilization (Vira et al., 2020b). A set of 1-year simulations was run to test this hypothesis by averaging the FAN emissions to different time resolutions (hourly, daily, monthly, annually) but keeping the total emissions constant.
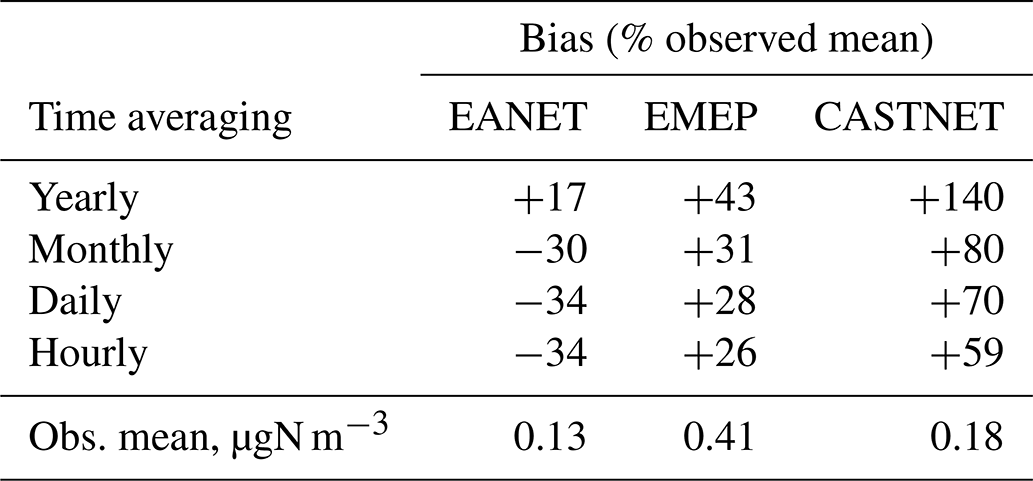
Table 3Bias (percent relative to observed) simulated concentration for 2010 as affected by temporal averaging of NH3 emissions. The biases are evaluated for the EANET, EMEP and CASTNET networks.
Consistent with the above hypothesis, increasing the temporal resolution of emissions reduced the average concentration throughout the world, although as seen in Fig. 15, the effect was geographically uneven. The largest absolute difference (up to ∼ 0.5 µgN m−3) between the simulations with hourly and monthly NH3 emissions occurs in northern China. However, if the difference is expressed as a fraction relative to the monthly run, the effect is largest in the eastern and central United States, where using hourly emissions decreases the mean concentration by up to 25 %–30 % compared to monthly emissions. Nitrate aerosols are also noticeably reduced in parts of China, eastern Europe and the Middle East. In western Europe and India the temporal averaging of the emissions has only a small effect despite the relatively high levels.
Comparison with observations (Table 3) confirms that increasing the time resolution of the emissions reduces the simulated nitrate concentrations. This reduces the positive simulation bias in the EMEP and CASTNET networks; over the EANET network the modeled bias changes from positive to negative. The largest reductions in nitrate occur from switching the emissions from the annual to the monthly resolution, and further but more modest reductions occur by increasing the temporal resolution to daily for all the measurement networks. Only over the CASTNET sites does a significant reduction occur when reducing the timescale of emissions from daily to hourly.
The effect of the emissions' temporal variation has previously not been tested systematically. Paulot et al. (2016) found that a prescribed, climatological diurnal variation of NH3 emissions had only a small effect on surface-level nitrate. In contrast, Zhu et al. (2015) allowed the livestock NH3 emissions in GEOS-Chem to vary proportionally to the temperature-dependent effective Henry constant for NH3 and obtained reductions in the nitrate concentrations comparable to those in this study. It is possible that using the actual meteorology to drive the NH3 emissions (as in Zhu et al., 2015, and this study) has a stronger effect on the concentration than an imposed diurnal cycle, since the co-variation of the NH3 emission and nitrate formation is likely to be better resolved.
The positive model bias for nitrate over the central and eastern US that occurs in CAM-chem (Lamarque et al., 2012) and other models has been connected to deficiencies in gas-phase chemistry (Heald et al., 2012) and aerosol scavenging (Luo et al., 2019). Our results do not conflict with these earlier findings, since the positive bias is not fully resolved even using hourly NH3 emissions. Nevertheless, the results indicate that some of the observed bias could be caused by unresolved temporal variations of the NH3 emissions due to a mechanism that stems from well-known thermodynamical properties of ammonia and ammonium nitrate. Further study is needed to determine the impact of this effect when non-volatile cations in sea salt or crustal material are taken into account.
We have presented the first evaluation of a global chemistry-climate model simulation where ammonia emissions from both synthetic fertilizer and livestock are simulated interactively by a process model (FANv2). We compare the FANv2-enabled simulation with three conventional setups of the chemistry climate model CAM-chem, where the agricultural NH3 emissions are prescribed based on the CEDS, EDGAR and HTAP emission inventories.
The simulations are evaluated against multi-component (atmospheric NH3 and , and wet deposition) in situ observations from European, East Asian and North American monitoring networks. When averaged over the 6-year period, the differences between these various simulations were relatively small, indicating that FANv2 offers a feasible alternative to the commonly used global emission inventories. The global patterns of wet deposition were especially well reproduced, whereas the gaseous ammonia and particulate showed biases likely related to problems in simulating the chemistry of secondary inorganic aerosols in the bulk aerosol scheme in CAM-chem. Comparing the simulations temporally with a monthly resolution revealed larger differences between the simulations using various emission inventories and suggested that a better characterization of fertilization practices would benefit both FANv2 and the emission inventories. The seasonal profiles used in CEDS and HTAP emissions captured the observed temporal patterns slightly better than FAN or the EDGAR inventory.
FAN and the emission inventories differ most over areas with scarce observational coverage. Over Africa, FAN predicts roughly 200 %–300 % higher NH3 emissions than the EDGAR inventory or the HTAP and CEDS inventories derived from EDGAR. Observations at the four to seven sites (depending on species) included in the INDAAF network were consistent with the higher emissions in FAN, and the FAN simulation also agreed better with the NH3 column densities retrieved from the IASI instrument over Africa. Regional ammonia emission inventories for Africa are currently not available, but our evaluation suggests that FANv2 may there capture the livestock-originated ammonia emissions better than the global inventories. Shared Socioeconomic Pathways (SSPs) used in the Land Use Harmonization 2 project (LUH2; Hurtt et al., 2020) all predict significant livestock and population increases in Africa by 2100, indicating the importance of obtaining better observational constraints of ammonia emissions over Africa.
The wet deposition patterns simulated using the FANv2 emissions were closer to those measured at three sites in Brazil than the other assessed inventories, but measurements suggest FAN overestimates the emissions in India. However, the lack of co-located observations of atmospheric NH3 or make the comparisons over India and Brazil less conclusive.
Finally, we evaluate the simulations against observations of aerosol-phase nitrate and show that the simulated ammonium nitrate concentrations are, even on a yearly level, sensitive to meteorology-driven daily and hourly variations in the NH3 emissions. While the effect is geographically variable, our results suggest that some of the overestimation of nitrate aerosols over the eastern United States in the CAM and other models may be explained by unresolved temporal variations in the emissions of NH3.
In conclusion, in simulating ammonia and ammonium concentrations over regions with detailed regional emission inventories, the inventories based on these details (HTAP, CEDS) capture the atmospheric concentrations and their seasonal variability the best. However, they cannot simulate the daily to interannual variations in emissions due to meteorological variability. This variability may be substantial (e.g., Sutton et al., 2013) and also important for simulating nitrate aerosols. As a process model, FANv2 is capable of simulating this variability, although we do not specifically examine it in this paper. In a larger context, agriculture plays an important role in the global cycles of carbon and nitrogen, and to capture its impact it is essential to simulate agriculture dynamically within an Earth system model.
In the future, we intend to integrate the FANv2 emission model more tightly to the nitrogen cycling simulated by the Community Land Model. This would allow FANv2 to simulate how the volatilization losses affect the biogeochemistry of agricultural ecosystems. Conversely, it would allow FANv2 to take advantage of possible advances in representation of agricultural practices such as tillage and irrigation, as well as to estimate their possible positive or negative impacts on the ammonia emissions.
Table A1 wet deposition measurements from Brazil and India.
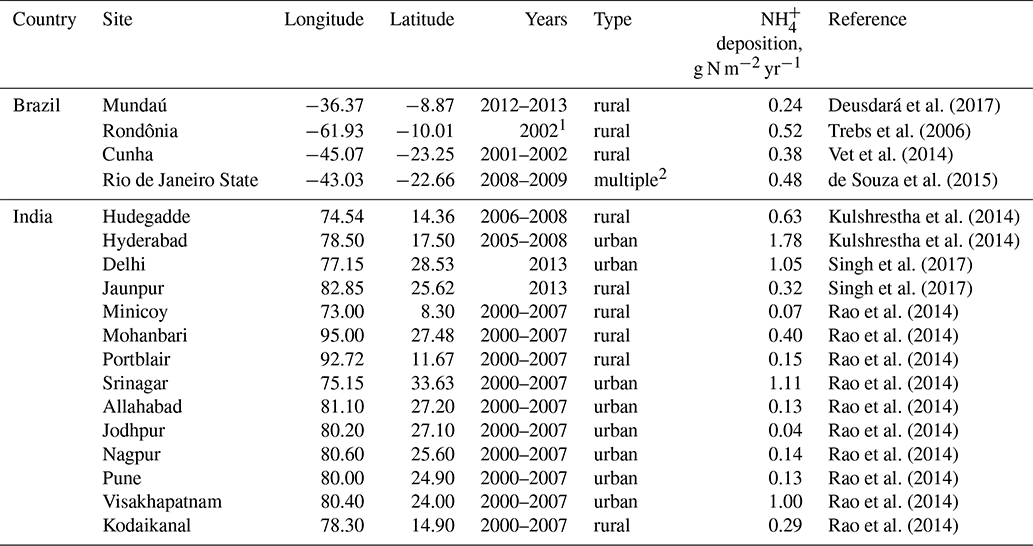
1 Extrapolated from a campaign using climatological precipitation data. 2 Average of two montane and one peri-urban site.
The Community Earth System Model, including the Community Land Model (CLM), is available at https://www.cesm.ucar.edu/ (University Corporation for Atmospheric Research, 2022). The modified version of CLM used in this paper is available at https://doi.org/10.5281/zenodo.3841776 (Vira et al., 2019). The full modified version of CESM, including changes to CAM and the coupler interface, requires access to the CAM development repository which can be granted by UCAR upon agreement with the terms of use. The NH3 emissions simulated by FAN and the FAN-specific input data are available at https://doi.org/10.5281/zenodo.3841723 (Vira et al., 2020a); other model outputs are available upon a reasonable request from the authors. The other model input and all observational data were obtained from public databases and datasets. The NH3 emission inventories used in this study are available at http://data.europa.eu/89h/jrc-edgar-v432-ap-gridmaps (EDGAR v4.3.2) (Crippa et al., 2018b), https://edgar.jrc.ec.europa.eu/dataset_htap_v2 (HTAP v2.2) (Joint Research Centre, 2022) and in Hoesly et al. (2017) (https://doi.org/10.22033/ESGF/input4MIPs.1241) for the CEDS. The CASTNET observations are available at https://www.epa.gov/castnet (United States Environmental Protection Agency, 2022). The AMoN and NTN observations are available at https://nadp.slh.wisc.edu/ (National Atmospheric Deposition Program, 2022). The EMEP observations are available at http://ebas.nilu.no/ (Norwegian Institute for Air Research, 2022), the EANET observations are available at https://www.eanet.asia/ (Secretariat for the EANET, 2022), and the INDAAF observations are available at https://indaaf.obs-mip.fr/ (INDAAF, 2022) upon registration. The IASI data are published in Van Damme et al. (2018b) (https://doi.org/10.1594/PANGAEA.894736). All websites were accessed on 4 February 2022.
The supplement related to this article is available online at: https://doi.org/10.5194/acp-22-1883-2022-supplement.
JV and PH designed the experiments; JV performed the simulations and analyzed the results with contributions from PH, MO and CGL. JV and PH wrote the manuscript with contributions from MO and CGL.
The contact author has declared that neither they nor their co-authors have any competing interests.
Publisher’s note: Copernicus Publications remains neutral with regard to jurisdictional claims in published maps and institutional affiliations.
This work was funded in part by the Department of Energy (grant no. DE-SC0016361) and in part supported by the National Center for Atmospheric Research, which is a major facility sponsored by the National Science Foundation under cooperative agreement no. 1852977. Julius Vira acknowledges additional support by the Strategic Research Council at the Academy of Finland (decision no. 327214 and 327350) and the Academy of Finland Flagship Program (decision no. 337552). Computing resources (https://doi.org/10.5065/D6RX99HX) were provided by the Climate Simulation Laboratory at NCAR's Computational and Information Systems Laboratory, sponsored by the National Science Foundation and other agencies. We thank the Joint Research Centre for the EDGAR emission dataset made available at https://data.europa.eu/doi/10.2904/JRC_DATASET_EDGAR (last access: 4 February 2022). We thank the National Atmospheric Deposition Program for the access to the NTN and AMoN datasets, as well as the U.S. Environmental Protection Agency Clean Air Markets Division for the CASTNET dataset. We also thank the Network Center for EANET for the EANET Data on the Acid Deposition in the East Asian Region, as well as the cooperative program for monitoring and evaluation of the long-range transmission of air pollutants in Europe (EMEP) for provision of the European air pollution monitoring data. The authors thank Will Wieder and Erik Kluzek for assistance with the CESM model and Marje Prank for comments on the manuscript. The Taylor diagrams in this paper were produced using the Python module taylorDiagram.py by Yannick Copin.
This research has been supported by the U.S. Department of Energy (grant no. DE-SC0016361), the National Science Foundation (grant no. 1852977), the Strategic Research Council at the Academy of Finland (decision nos. 327214 and 327350), and the Academy of Finland Flagship Programme (decision no. 337552).
This paper was edited by Maria Kanakidou and reviewed by two anonymous referees.
Adon, M., Galy-Lacaux, C., Yoboué, V., Delon, C., Lacaux, J. P., Castera, P., Gardrat, E., Pienaar, J., Al Ourabi, H., Laouali, D., Diop, B., Sigha-Nkamdjou, L., Akpo, A., Tathy, J. P., Lavenu, F., and Mougin, E.: Long term measurements of sulfur dioxide, nitrogen dioxide, ammonia, nitric acid and ozone in Africa using passive samplers, Atmos. Chem. Phys., 10, 7467–7487, https://doi.org/10.5194/acp-10-7467-2010, 2010. a, b
Ansari, A. S. and Pandis, S. N.: Response of inorganic PM to precursor concentrations, Environ. Sci. Technol., 32, 2706–2714, https://doi.org/10.1021/es971130j, 1998. a, b
Barth, M. C., Rasch, P. J., Kiehl, J. T., Benkovitz, C. M., and Schwartz, S. E.: Sulfur chemistry in the National Center for Atmospheric Research Community Climate Model: Description, evaluation, features, and sensitivity to aqueous chemistry, J. Geophys. Res.-Atmos., 105, 1387–1415, https://doi.org/10.1029/1999JD900773, 2000. a
Bash, J. O., Cooter, E. J., Dennis, R. L., Walker, J. T., and Pleim, J. E.: Evaluation of a regional air-quality model with bidirectional NH3 exchange coupled to an agroecosystem model, Biogeosciences, 10, 1635–1645, https://doi.org/10.5194/bg-10-1635-2013, 2013. a
Bauer, S. E., Koch, D., Unger, N., Metzger, S. M., Shindell, D. T., and Streets, D. G.: Nitrate aerosols today and in 2030: a global simulation including aerosols and tropospheric ozone, Atmos. Chem. Phys., 7, 5043–5059, https://doi.org/10.5194/acp-7-5043-2007, 2007. a
Beusen, A. H., Bouwman, A. F., Heuberger, P. S., Van Drecht, G., and Van Der Hoek, K. W.: Bottom-up uncertainty estimates of global ammonia emissions from global agricultural production systems, Atmos. Environ., 42, 6067–6077, https://doi.org/10.1016/j.atmosenv.2008.03.044, 2008. a
Bouwman, A. F., Lee, D. S., Asman, W. A., Dentener, F. J., Van Der Hoek, K. W., and Olivier, J. G.: A global high-resolution emission inventory for ammonia, Global Biogeochem. Cy., 11, 561–587, https://doi.org/10.1029/97GB02266, 1997. a
Chen, Y., Shen, H., Kaiser, J., Hu, Y., Capps, S. L., Zhao, S., Hakami, A., Shih, J.-S., Pavur, G. K., Turner, M. D., Henze, D. K., Resler, J., Nenes, A., Napelenok, S. L., Bash, J. O., Fahey, K. M., Carmichael, G. R., Chai, T., Clarisse, L., Coheur, P.-F., Van Damme, M., and Russell, A. G.: High-resolution hybrid inversion of IASI ammonia columns to constrain US ammonia emissions using the CMAQ adjoint model, Atmos. Chem. Phys., 21, 2067–2082, https://doi.org/10.5194/acp-21-2067-2021, 2021. a
Crippa, M., Guizzardi, D., Muntean, M., Schaaf, E., Dentener, F., van Aardenne, J. A., Monni, S., Doering, U., Olivier, J. G. J., Pagliari, V., and Janssens-Maenhout, G.: Gridded emissions of air pollutants for the period 1970–2012 within EDGAR v4.3.2, Earth Syst. Sci. Data, 10, 1987–2013, https://doi.org/10.5194/essd-10-1987-2018, 2018a. a
Crippa, M., Janssens-Maenhout, G., Guizzardi, D., Muntean, M., and Schaaf, E.: Emissions Database for Global Atmospheric Research, version v4.3.2 part II Air Pollutants (gridmaps), European Commission, Joint Research Centre (JRC) [data set] PID, http://data.europa.eu/89h/jrc-edgar-v432-ap-gridmaps (last access: 8 February 2022), 2018b. a
de Souza, P. A., Ponette-González, A. G., Mello, W. Z. D., Weathers, K. C., and Santos, I. A.: Atmospheric organic and inorganic nitrogen inputs to coastal urban and montane Atlantic Forest sites in southeastern Brazil, Atmos. Res., 160, 126–137, https://doi.org/10.1016/j.atmosres.2015.03.011, 2015. a
Delon, C., Galy-Lacaux, C., Boone, A., Liousse, C., Serça, D., Adon, M., Diop, B., Akpo, A., Lavenu, F., Mougin, E., and Timouk, F.: Atmospheric nitrogen budget in Sahelian dry savannas, Atmos. Chem. Phys., 10, 2691–2708, https://doi.org/10.5194/acp-10-2691-2010, 2010. a
Delon, C., Mougin, E., Serça, D., Grippa, M., Hiernaux, P., Diawara, M., Galy-Lacaux, C., and Kergoat, L.: Modelling the effect of soil moisture and organic matter degradation on biogenic NO emissions from soils in Sahel rangeland (Mali), Biogeosciences, 12, 3253–3272, https://doi.org/10.5194/bg-12-3253-2015, 2015. a
Delon, C., Galy-Lacaux, C., Serça, D., Personne, E., Mougin, E., Adon, M., Le Dantec, V., Loubet, B., Fensholt, R., and Tagesson, T.: Modelling land–atmosphere daily exchanges of NO, NH3, and CO2 in a semi-arid grazed ecosystem in Senegal, Biogeosciences, 16, 2049–2077, https://doi.org/10.5194/bg-16-2049-2019, 2019. a
Dentener, F., Drevet, J., Lamarque, J. F., Bey, I., Eickhout, B., Fiore, A. M., Hauglustaine, D., Horowitz, L. W., Krol, M., Kulshrestha, U. C., Lawrence, M., Galy-Lacaux, C., Rast, S., Shindell, D., Stevenson, D., Van Noije, T., Atherton, C., Bell, N., Bergman, D., Butler, T., Cofala, J., Collins, B., Doherty, R., Ellingsen, K., Galloway, J., Gauss, M., Montanaro, V., Müller, J. F., Pitari, G., Rodriguez, J., Sanderson, M., Solmon, F., Strahan, S., Schultz, M., Sudo, K., Szopa, S., and Wild, O.: Nitrogen and sulfur deposition on regional and global scales: A multimodel evaluation, Global Biogeochem. Cy., 20, GB4003, https://doi.org/10.1029/2005GB002672, 2006. a
Deusdará, K. R., Forti, M. C., Borma, L. S., Menezes, R. S., Lima, J. R., and Ometto, J. P.: Rainwater chemistry and bulk atmospheric deposition in a tropical semiarid ecosystem: the Brazilian Caatinga, J. Atmos. Chem., 74, 71–85, https://doi.org/10.1007/s10874-016-9341-9, 2017. a
Duprè, C., Stevens, C. J., Ranke, T., Bleekers, A., Peppler-Lisbach, C., Gowing, D. J. G., Dise, N. B., Dorland, E., Bobbink, R., and Diekmann, M.: Changes in species richness and composition in European acidic grasslands over the past 70 years: the contribution of cumulative atmospheric nitrogen deposition, Glob. Change Biol., 16, 344–357, https://doi.org/10.1111/j.1365-2486.2009.01982.x, 2010. a
Emmons, L. K., Walters, S., Hess, P. G., Lamarque, J.-F., Pfister, G. G., Fillmore, D., Granier, C., Guenther, A., Kinnison, D., Laepple, T., Orlando, J., Tie, X., Tyndall, G., Wiedinmyer, C., Baughcum, S. L., and Kloster, S.: Description and evaluation of the Model for Ozone and Related chemical Tracers, version 4 (MOZART-4), Geosci. Model Dev., 3, 43–67, https://doi.org/10.5194/gmd-3-43-2010, 2010. a
Feng, Y. and Penner, J. E.: Global modeling of nitrate and ammonium: Interaction of aerosols and tropospheric chemistry, J. Geophys. Res.-Atmos., 112, D01304, https://doi.org/10.1029/2005JD006404, 2007. a
Fenn, L. B. and Hossner, L. R.: Ammonia volatilization from ammonium or ammonium-forming nitrogen fertilizers, in: Advances in soil science, vol. 1, edited by: Stewart, B. A., 123–169, Springer, New York, NY, https://doi.org/10.1007/978-1-4612-5046-3_4, 1985. a
Galy-Lacaux, C., Laouali, D., Descroix, L., Gobron, N., and Liousse, C.: Long term precipitation chemistry and wet deposition in a remote dry savanna site in Africa (Niger), Atmos. Chem. Phys., 9, 1579–1595, https://doi.org/10.5194/acp-9-1579-2009, 2009. a
Guo, H., Nenes, A., and Weber, R. J.: The underappreciated role of nonvolatile cations in aerosol ammonium-sulfate molar ratios, Atmos. Chem. Phys., 18, 17307–17323, https://doi.org/10.5194/acp-18-17307-2018, 2018. a
Gyldenkærne, S., Skjøth, C. A., Hertel, O., and Ellermann, T.: A dynamical ammonia emission parameterization for use in air pollution models, J. Geophys. Res.-Atmos., 110, 1–14, https://doi.org/10.1029/2004JD005459, 2005. a
Hauglustaine, D. A., Balkanski, Y., and Schulz, M.: A global model simulation of present and future nitrate aerosols and their direct radiative forcing of climate, Atmos. Chem. Phys., 14, 11031–11063, https://doi.org/10.5194/acp-14-11031-2014, 2014. a
Heald, C. L., Collett Jr., J. L., Lee, T., Benedict, K. B., Schwandner, F. M., Li, Y., Clarisse, L., Hurtmans, D. R., Van Damme, M., Clerbaux, C., Coheur, P.-F., Philip, S., Martin, R. V., and Pye, H. O. T.: Atmospheric ammonia and particulate inorganic nitrogen over the United States, Atmos. Chem. Phys., 12, 10295–10312, https://doi.org/10.5194/acp-12-10295-2012, 2012. a, b
Hickman, J. E., Dammers, E., Galy-Lacaux, C., and van der Werf, G. R.: Satellite evidence of substantial rain-induced soil emissions of ammonia across the Sahel, Atmos. Chem. Phys., 18, 16713–16727, https://doi.org/10.5194/acp-18-16713-2018, 2018. a
Hoesly, R., Smith, S., Feng, L., Klimont, Z., Janssens-Maenhout, G., Pitkanen, T., Seibert, J. J., Vu, L., Andres, R. J., Bolt, R. M., Bond, T. C., Dawidowski, L., Kholod, N., Kurokawa, J.-i., Li, M., Liu, L., Lu, Z., Moura, M. C. P., O'Rourke, P. R., and Zhang, Q.: Historical Emissions (1750–2014) – CEDS – v2017-05-18, Earth System Grid Federation [data set], https://doi.org/10.22033/ESGF/input4MIPs.1241, 2017. a
Hoesly, R. M., Smith, S. J., Feng, L., Klimont, Z., Janssens-Maenhout, G., Pitkanen, T., Seibert, J. J., Vu, L., Andres, R. J., Bolt, R. M., Bond, T. C., Dawidowski, L., Kholod, N., Kurokawa, J.-I., Li, M., Liu, L., Lu, Z., Moura, M. C. P., O'Rourke, P. R., and Zhang, Q.: Historical (1750–2014) anthropogenic emissions of reactive gases and aerosols from the Community Emissions Data System (CEDS), Geosci. Model Dev., 11, 369–408, https://doi.org/10.5194/gmd-11-369-2018, 2018. a
Hurtt, G. C., Chini, L., Sahajpal, R., Frolking, S., Bodirsky, B. L., Calvin, K., Doelman, J. C., Fisk, J., Fujimori, S., Klein Goldewijk, K., Hasegawa, T., Havlik, P., Heinimann, A., Humpenöder, F., Jungclaus, J., Kaplan, J. O., Kennedy, J., Krisztin, T., Lawrence, D., Lawrence, P., Ma, L., Mertz, O., Pongratz, J., Popp, A., Poulter, B., Riahi, K., Shevliakova, E., Stehfest, E., Thornton, P., Tubiello, F. N., van Vuuren, D. P., and Zhang, X.: Harmonization of global land use change and management for the period 850–2100 (LUH2) for CMIP6, Geosci. Model Dev., 13, 5425–5464, https://doi.org/10.5194/gmd-13-5425-2020, 2020. a, b
INDAAF – International Network to study Deposition and Atmospheric chemistry in AFrica: https://indaaf.obs-mip.fr/, last access: 4 February 2022. a
IPCC: 2006 IPCC Guidelines for National Greenhouse Gas Inventories, Prepared by the National Greenhouse Gas Inventories Programme, edited by: Eggleston, H. S., Buendia, L., Miwa, K., Ngara, T., and Tanabe, K., IGES, Japan, 2006. a
Itahashi, S., Hayami, H., Uno, I., Pan, X., and Uematsu, M.: Importance of coarse-mode nitrate produced via sea salt as atmospheric input to East Asian oceans, Geophys. Res. Lett., 43, 5483–5491, https://doi.org/10.1002/2016GL068722, 2016. a
Janssens-Maenhout, G., Crippa, M., Guizzardi, D., Dentener, F., Muntean, M., Pouliot, G., Keating, T., Zhang, Q., Kurokawa, J., Wankmüller, R., Denier van der Gon, H., Kuenen, J. J. P., Klimont, Z., Frost, G., Darras, S., Koffi, B., and Li, M.: HTAP_v2.2: a mosaic of regional and global emission grid maps for 2008 and 2010 to study hemispheric transport of air pollution, Atmos. Chem. Phys., 15, 11411–11432, https://doi.org/10.5194/acp-15-11411-2015, 2015. a
Joint Research Centre: EDGAR FOR HTAP V2, https://edgar.jrc.ec.europa.eu/dataset_htap_v2, last access: 4 February 2022. a
Kulshrestha, U. C., Kulshrestha, M. J., Satyanarayana, J., and Reddy, L. A. K.: Atmospheric deposition of reactive nitrogen in India, in: Nitrogen Deposition, Critical Loads and Biodiversity, edited by: Sutton, M. A., Mason, K. E., Sheppard, L. J., Sverdrup, H., Haeuber, R., and Hicks, W. K., 75–82, Springer, Netherlands, https://doi.org/10.1007/978-94-007-7939-6_9, 2014. a, b
Lamarque, J.-F., Emmons, L. K., Hess, P. G., Kinnison, D. E., Tilmes, S., Vitt, F., Heald, C. L., Holland, E. A., Lauritzen, P. H., Neu, J., Orlando, J. J., Rasch, P. J., and Tyndall, G. K.: CAM-chem: description and evaluation of interactive atmospheric chemistry in the Community Earth System Model, Geosci. Model Dev., 5, 369–411, https://doi.org/10.5194/gmd-5-369-2012, 2012. a, b, c, d, e, f, g
Lawrence, D., Fisher, R., Koven, C., Oleson, K., Swenson, S., and Vertenstein, M.: Technical Description of version 5.0 of the Community Land Model (CLM), Tech. rep., National Center for Atmospheric Research, Boulder, CO, available at: https://escomp.github.io/ctsm-docs/versions/release-clm5.0/html/tech_note/index.html (last access: 4 February 2022), 2018. a
Lawrence, D. M., Hurtt, G. C., Arneth, A., Brovkin, V., Calvin, K. V., Jones, A. D., Jones, C. D., Lawrence, P. J., de Noblet-Ducoudré, N., Pongratz, J., Seneviratne, S. I., and Shevliakova, E.: The Land Use Model Intercomparison Project (LUMIP) contribution to CMIP6: rationale and experimental design, Geosci. Model Dev., 9, 2973–2998, https://doi.org/10.5194/gmd-9-2973-2016, 2016. a
Lee, T., Yu, X. Y., Ayres, B., Kreidenweis, S. M., Malm, W. C., and Collett, J. L.: Observations of fine and coarse particle nitrate at several rural locations in the United States, Atmos. Environ., 42, 2720–2732, https://doi.org/10.1016/j.atmosenv.2007.05.016, 2008. a
Levis, S., Bonan, G. B., Kluzek, E., Thornton, P. E., Jones, A., Sacks, W. J., and Kucharik, C. J.: Interactive crop management in the Community Earth System Model (CESM1): Seasonal influences on land–atmosphere fluxes, J. Climate, 25, 4839–4859, 2012. a
Levis, S., Badger, A., Drewniak, B., Nevison, C., and Ren, X.: CLMcrop yields and water requirements: avoided impacts by choosing RCP 4.5 over 8.5, Clim. Change, 146, 501–515, 2018. a
Lombardozzi, D. L., Lu, Y., Lawrence, P. J., Lawrence, D. M., Swenson, S., Oleson, K. W., Wieder, W. R., and Ainsworth, E. A.: Simulating Agriculture in the Community Land Model Version 5, J. Geophys. Res.-Biogeo., 125, 1–19, https://doi.org/10.1029/2019jg005529, 2020. a
Luo, G., Yu, F., and Schwab, J.: Revised treatment of wet scavenging processes dramatically improves GEOS-Chem 12.0.0 simulations of surface nitric acid, nitrate, and ammonium over the United States, Geosci. Model Dev., 12, 3439–3447, https://doi.org/10.5194/gmd-12-3439-2019, 2019. a
Metzger, S., Dentener, F., Pandis, S., and Lelieveld, J.: Gas/aerosol partitioning: 1. A computationally efficient model, J. Geophys. Res.-Atmos., 107, https://doi.org/10.1029/2001JD001102, 2002. a
National Atmospheric Deposition Program: https://nadp.slh.wisc.edu/networks/, last access: 4 February 2022. a
Nenes, A., Pandis, S. N., Kanakidou, M., Russell, A. G., Song, S., Vasilakos, P., and Weber, R. J.: Aerosol acidity and liquid water content regulate the dry deposition of inorganic reactive nitrogen, Atmos. Chem. Phys., 21, 6023–6033, https://doi.org/10.5194/acp-21-6023-2021, 2021. a
Neu, J. L. and Prather, M. J.: Toward a more physical representation of precipitation scavenging in global chemistry models: cloud overlap and ice physics and their impact on tropospheric ozone, Atmos. Chem. Phys., 12, 3289–3310, https://doi.org/10.5194/acp-12-3289-2012, 2012. a
Norwegian Institute for Air Research: EBAS, https://ebas.nilu.no/, last access: 4 February 2022. a
Ossohou, M., Galy-Lacaux, C., Yoboué, V., Hickman, J. E., Gardrat, E., Adon, M., Darras, S., Laouali, D., Akpo, A., Ouafo, M., Diop, B., and Opepa, C.: Trends and seasonal variability of atmospheric NO2 and HNO3 concentrations across three major African biomes inferred from long-term series of ground-based and satellite measurements, Atmos. Environ., 207, 148–166, https://doi.org/10.1016/j.atmosenv.2019.03.027, 2019. a
Paulot, F., Jacob, D. J., Pinder, R. W., Bash, J. O., Travis, K., and Henze, D. K.: Ammonia emissions in the United States, european union, and China derived by high-resolution inversion of ammonium wet deposition data: Interpretation with a new agricultural emissions inventory (MASAGE_NH3), J. Geophys. Res., 119, 4343–4364, https://doi.org/10.1002/2013JD021130, 2014. a
Paulot, F., Ginoux, P., Cooke, W. F., Donner, L. J., Fan, S., Lin, M.-Y., Mao, J., Naik, V., and Horowitz, L. W.: Sensitivity of nitrate aerosols to ammonia emissions and to nitrate chemistry: implications for present and future nitrate optical depth, Atmos. Chem. Phys., 16, 1459–1477, https://doi.org/10.5194/acp-16-1459-2016, 2016. a, b
Payne, R. J., Dise, N. B., Field, C. D., Dore, A. J., Caporn, S. J., and Stevens, C. J.: Nitrogen deposition and plant biodiversity: past, present, and future, Front. Ecol. Environ., 15, 431–436, https://doi.org/10.1002/fee.1528, 2017. a
Rao, P. S. P., Safai, P. D., Budhavant, K., and Soni, V. K.: Wet Deposition of Nitrogen at Different Locations in India, in: Nitrogen Deposition, Critical Loads and Biodiversity, edited by: Sutton, M., Mason, K., Sheppard, L., Sverdrup, H., Haeuber, R., and Hicks, W., 117–123, Springer, Dordrecht, https://doi.org/10.1007/978-94-007-7939-6_13, 2014. a, b, c, d, e, f, g, h, i, j
Rienecker, M. M., Suarez, M. J., Gelaro, R., Todling, R., Bacmeister, J., Liu, E., Bosilovich, M. G., Schubert, S. D., Takacs, L., Kim, G.-K., Zaveri, R. A., Easter, R. C., Singh, B., Wang, H., Lu, Z., Tilmes, S., Emmons, L. K., Vitt, F., Zhang, R., Liu, X., Ghan, S. J., and Rasch, P. J.: MERRA: NASA's modern-era retrospective analysis for research and applications, J. Climate, 24, 3624–3648, 2011. a
Robinson, T. P., Thornton, P. K., Franceschini, G., Kruska, R. L., Chiozza, F., Notenbaert, A. M. O., Cecchi, G., Herrero, M., Epprecht, M., Fritz, S., You, L., Conchedda, G., and See, L.: Global livestock production systems, Rome, Food and Agriculture Organization of the United Nations (FAO) and International Livestock Research Institute (ILRI), 152 pp., 2011. a
Robinson, T. P., Wint, G. R. W., Conchedda, G., Van Boeckel, T. P., Ercoli, V., Palamara, E., Cinardi, G., D'Aietti, L., Hay, S. I., and Gilbert, M.: Mapping the global distribution of livestock, PloS ONE, 9, e96084, https://doi.org/10.1371/journal.pone.0096084, 2014. a
Secretariat for the EANET: The Acid Deposition Monitoring Network in East Asia (EANET), https://www.eanet.asia/, last access: 4 February 2022. a
Shen, H., Chen, Y., Hu, Y., Ran, L., Lam, S. K., Pavur, G. K., Zhou, F., Pleim, J. E., and Russell, A. G.: Intense Warming Will Significantly Increase Cropland Ammonia Volatilization Threatening Food Security and Ecosystem Health, One Earth, 3, 126–134, https://doi.org/10.1016/j.oneear.2020.06.015, 2020. a
Singh, S. and Kulshrestha, U. C.: Abundance and distribution of gaseous ammonia and particulate ammonium at Delhi, India, Biogeosciences, 9, 5023–5029, https://doi.org/10.5194/bg-9-5023-2012, 2012. a
Singh, S. and Kulshrestha, U. C.: Rural versus urban gaseous inorganic reactive nitrogen in the Indo-Gangetic plains (IGP) of India, Environ. Res. Lett., 9, 125004, https://doi.org/10.1088/1748-9326/9/12/125004, 2014. a
Singh, S., Sharma, A., Kumar, B., and Kulshrestha, U. C.: Wet deposition fluxes of atmospheric inorganic reactive nitrogen at an urban and rural site in the Indo-Gangetic Plain, Atmos. Pollut. Res., 8, 669–677, https://doi.org/10.1016/j.apr.2016.12.021, 2017. a, b
Someya, Y., Imasu, R., Shiomi, K., and Saitoh, N.: Atmospheric ammonia retrieval from the TANSO-FTS/GOSAT thermal infrared sounder, Atmos. Meas. Tech., 13, 309–321, https://doi.org/10.5194/amt-13-309-2020, 2020. a
Sommer, S. G., Schjoerring, J. K., and Denmead, O. T.: Ammonia emission from mineral fertilizers and fertilized crops, Adv. Agron., 82, 82004–82008, 2004. a
Sutton, M. A., Reis, S., Riddick, S. N., Dragosits, U., Nemitz, E., Theobald, M. R., Tang, Y. S., Braban, C. F., Vieno, M., Dore, A. J., Mitchell, R. F., Wanless, S., Daunt, F., Fowler, D., Blackall, T. D., Milford, C., Flechard, C. R., Loubet, B., Massad, R., Cellier, P., Personne, E., Coheur, P. F., Clarisse, L., Van Damme, M., Ngadi, Y., Clerbaux, C., Skjøth, C. A., Geels, C., Hertel, O., Kruit, R. J., Pinder, R. W., Bash, J. O., Walker, J. T., Simpson, D., Horváth, L., Misselbrook, T. H., Bleeker, A., Dentener, F., and de Vries, W.: Towards a climate-dependent paradigm of ammonia emission and deposition, Philos. T. Roy. Soc. B, 368, B3682013016620130166, https://doi.org/10.1098/rstb.2013.0166, 2013. a
Tilmes, S., Lamarque, J.-F., Emmons, L. K., Kinnison, D. E., Ma, P.-L., Liu, X., Ghan, S., Bardeen, C., Arnold, S., Deeter, M., Vitt, F., Ryerson, T., Elkins, J. W., Moore, F., Spackman, J. R., and Val Martin, M.: Description and evaluation of tropospheric chemistry and aerosols in the Community Earth System Model (CESM1.2), Geosci. Model Dev., 8, 1395–1426, https://doi.org/10.5194/gmd-8-1395-2015, 2015. a, b
Trebs, I., Lara, L. L., Zeri, L. M. M., Gatti, L. V., Artaxo, P., Dlugi, R., Slanina, J., Andreae, M. O., and Meixner, F. X.: Dry and wet deposition of inorganic nitrogen compounds to a tropical pasture site (Rondônia, Brazil), Atmos. Chem. Phys., 6, 447–469, https://doi.org/10.5194/acp-6-447-2006, 2006. a
United States Environmental Protection Agency: Clean Air Status and Trends Network (CASTNET), https://www.epa.gov/castnet, last access: 4 February 2022. a
University Corporation for Atmospheric Research: Community Earth System Model, https://www.cesm.ucar.edu, last access: 4 February 2022. a
Van Damme, M., Erisman, J. W., Clarisse, L., Dammers, E., Whitburn, S., Clerbaux, C., Dolman, A. J., and Coheur, P.-F.: Worldwide spatiotemporal atmospheric ammonia (NH3) columns variability revealed by satellite, Geophys. Res. Lett., 42, 8660– 8668, https://doi.org/10.1002/2015GL065496, 2015. a
Van Damme, M., Whitburn, S., Clarisse, L., Clerbaux, C., Hurtmans, D., and Coheur, P.-F.: Version 2 of the IASI NH3 neural network retrieval algorithm: near-real-time and reanalysed datasets, Atmos. Meas. Tech., 10, 4905–4914, https://doi.org/10.5194/amt-10-4905-2017, 2017. a
Van Damme, M., Clarisse, L., Whitburn, S., Hadji-Lazaro, J., Hurtmans, D., Clerbaux, C., and Coheur, P.-F.: Industrial and agricultural ammonia point sources exposed, Nature, 564, 99–103, 2018a. a
Van Damme, M., Clarisse, L., Whitburn, S., Hadji-Lazaro, J., Hurtmans, D., Clerbaux, C., and Coheur, P.-F.: Level 2 dataset and Level 3 oversampled average map of the IASI/Metop-A ammonia (NH3) morning column measurements (ANNI-NH3-v2.1R-I) from 2008 to 2016, PANGAEA [data set], https://doi.org/10.1594/PANGAEA.894736, 2018b. a, b, c
Vet, R., Artz, R. S., Carou, S., Shaw, M., Ro, C. U., Aas, W., Baker, A., Bowersox, V. C., Dentener, F., Galy-Lacaux, C., Hou, A., Pienaar, J. J., Gillett, R., Forti, M. C., Gromov, S., Hara, H., Khodzher, T., Mahowald, N. M., Nickovic, S., Rao, P. S., and Reid, N. W.: A global assessment of precipitation chemistry and deposition of sulfur, nitrogen, sea salt, base cations, organic acids, acidity and pH, and phosphorus, Atmos. Environ., 93, 3–100, https://doi.org/10.1016/j.atmosenv.2013.10.060, 2014. a, b, c, d
Vira, J., Hess, P., Melkonian, J., and Wieder, W. R.: Flow of Agricultural Nitrogen, version 2 (FANv2) (May 2020), Zenodo [code], https://doi.org/10.5281/zenodo.3841776, 2019. a
Vira, J., Hess, P., Melkonian, J., and Wieder, W.: Flow of Agricultural Nitrogen, version 2 (FANv2): Model input and output data (Revised May 2020), Zenodo [data set], https://doi.org/10.5281/zenodo.3841723, 2020a. a
Vira, J., Hess, P., Melkonian, J., and Wieder, W. R.: An improved mechanistic model for ammonia volatilization in Earth system models: Flow of Agricultural Nitrogen version 2 (FANv2), Geosci. Model Dev., 13, 4459–4490, https://doi.org/10.5194/gmd-13-4459-2020, 2020b. a, b, c, d, e, f
Walker, J. M., Philip, S., Martin, R. V., and Seinfeld, J. H.: Simulation of nitrate, sulfate, and ammonium aerosols over the United States, Atmos. Chem. Phys., 12, 11213–11227, https://doi.org/10.5194/acp-12-11213-2012, 2012. a
Wesely, M. L.: Parameterization of surface resistances to gaseous dry deposition in regional-scale numerical models, Atmos. Environ., 23, 1293–1304, 1989. a
Whitburn, S., Van Damme, M., Kaiser, J. W., Van Der Werf, G. R., Turquety, S., Hurtmans, D., Clarisse, L., Clerbaux, C., and Coheur, P. F.: Ammonia emissions in tropical biomass burning regions: Comparison between satellite-derived emissions and bottom-up fire inventories, Atmos. Environ., 121, 42–54, https://doi.org/10.1016/j.atmosenv.2015.03.015, 2015. a, b
Xu, R., Tian, H., Pan, S., Prior, S. A., Feng, Y., Batchelor, W. D., Chen, J., and Yang, J.: Global ammonia emissions from synthetic nitrogen fertilizer applications in agricultural systems: Empirical and process-based estimates and uncertainty, Glob. Change Biol., 25, 314–326, https://doi.org/10.1111/gcb.14499, 2019. a
Yoboué, V., Galy-Lacaux, C., Lacaux, J. P., and Silué, S.: Rainwater chemistry and wet deposition over the Wet Savanna Ecosystem of Lamto (Cote d'Ivoire), J. Atmos. Chem., 52, 117–141, 2005. a
Zhang, L., Chen, Y., Zhao, Y., Henze, D. K., Zhu, L., Song, Y., Paulot, F., Liu, X., Pan, Y., Lin, Y., and Huang, B.: Agricultural ammonia emissions in China: reconciling bottom-up and top-down estimates, Atmos. Chem. Phys., 18, 339–355, https://doi.org/10.5194/acp-18-339-2018, 2018. a
Zhu, L., Henze, D., Bash, J., Jeong, G.-R., Cady-Pereira, K., Shephard, M., Luo, M., Paulot, F., and Capps, S.: Global evaluation of ammonia bidirectional exchange and livestock diurnal variation schemes, Atmos. Chem. Phys., 15, 12823–12843, https://doi.org/10.5194/acp-15-12823-2015, 2015. a, b, c