the Creative Commons Attribution 4.0 License.
the Creative Commons Attribution 4.0 License.
 | 30 Nov 2022
Ice crystal characterization in cirrus clouds III: retrieval of ice crystal shape and roughness from observations of halo displays
Linda Forster
Bernhard Mayer
In this study, which is the third part of the HaloCam series after Forster et al. (2017, 2020), we present a novel technique to retrieve quantitative information about ice crystal optical and microphysical properties using ground-based imaging observations of halo displays. Comparing HaloCam's calibrated RGB images of 22 and 46∘ halo observations against a lookup table of simulated radiances, this technique allows the retrieval of the sizes and shapes of randomly oriented crystals as well as the fraction of smooth and rough ice crystals for cirrus clouds. We analyzed 4400 HaloCam images between September 2015 and November 2016 showing a visible 22∘ halo. The optical properties of hexagonal 8-element aggregates of columns with a mean ice crystal effective radius of about 20 µm and a mixture of 37 % smooth and 63 % rough crystals on average best match the HaloCam observations. Implemented on different sites, HaloCam in combination with the machine-learning-based halo detection algorithm HaloForest can provide a consistent dataset for climatological studies of ice crystal properties representing typical cirrus clouds. Representative ice crystal optical properties are required for remote sensing of cirrus clouds as well as climate modeling. Since ground-based passive imaging observations provide information about the forward scattering part of the ice crystal optical properties, the results of this work ideally complement the results of satellite-based and airborne studies.
- Article
(7969 KB) - Full-text XML
- BibTeX
- EndNote


Cirrus clouds cover about one-third of the globe on average (Wylie and Menzel, 1999; Stubenrauch et al., 2006) and consist of small ice crystals. Crystal size, shape, and surface roughness predominantly govern the single scattering properties and thus the radiative forcing of cirrus clouds (e.g., Liou, 1986; Wielicki et al., 1995; Wendisch et al., 2007; Yi et al., 2013). Depending on these microphysical properties, ice clouds may have a net warming or cooling radiative effect for a given ice water content (Stephens et al., 1990). Furthermore, wrong assumptions regarding the ice crystal shape can result in significant errors in retrievals of optical thickness and cloud microphysical properties using satellite-based shortwave infrared measurements (Mishchenko et al., 1996; Baran et al., 1999; Yang et al., 2015; Holz et al., 2016). The uncertainty in the retrieved cirrus optical thickness and ice crystal effective radius was estimated to be more than 50 % and 20 %, respectively, by Key et al. (2002), Eichler et al. (2009), and Zinner et al. (2016). Ice crystal size and shape also have a significant impact on cloud evolution and the hydrological cycle (e.g., Jensen et al., 2018). A better understanding of ice crystal microphysical properties and finding representative optical properties is therefore essential for improving remote sensing retrievals of cirrus cloud properties, which in turn helps to improve estimates of the radiative forcing of cirrus clouds (e.g., Yang et al., 2015; Liou and Yang, 2016).
Over the past few decades the natural distribution of ice crystal shapes has been investigated by laboratory studies (Magono and Lee, 1966; Bailey and Hallett, 2004, 2009) and in situ measurements (Weickmann, 1947; Heymsfield and Platt, 1984; Field et al., 2005; Heymsfield et al., 2013; Magee et al., 2021). Although these methods have been providing more and more detailed information about ice crystal size and shape under various nucleation and growth conditions, they suffer from certain limitations. The nucleation technique used in laboratory studies, for example, can influence the shape of the growing ice crystals and lead to biased results (e.g., Bailey and Hallett, 2012). In situ observations by aircraft probes are spatially limited. Furthermore, due to the high speed of the aircraft, shattering of larger complex ice crystals at the inlets of the in situ probes is an issue which might cause an artificially increased fraction of small particles (Baran, 2012, and references therein).
Therefore, satellite-based methods have been investigated in recent years to retrieve information about ice crystal shape with large spatial and temporal coverage. Retrievals of ice crystal habit from multi-angle satellite observations were pioneered by Baran et al. (1998, 1999) using radiance measurements at two different viewing angles from the Along Track Scanning Radiometer (ATSR-2). McFarlane and Marchand (2008) present a retrieval using measurements from MISR (Multi-angle Imaging Spectroradiometer) and MODIS (Moderate-resolution Imaging System) reflectances based on optical properties of single ice crystal habits. Multi-angular polarized reflectances from the Polarization and Directionality of Earth Reflectance (POLDER) have been used to infer information about ice crystal shape (e.g., Descloitres et al., 1998; Chepfer et al., 2001; Baran and Labonnote, 2006; Sun et al., 2006; Yang et al., 2018). More recently, POLDER observations have been used to retrieve ice crystal aspect ratio and distortion levels: van Diedenhoven et al. (2012), van Diedenhoven et al. (2020), and van Diedenhoven (2021) found that crystal distortion and aspect ratio increase with cloud top height, leading to decreasing asymmetry parameters. These studies mainly focus on tops of optically thick ice clouds.
Investigation of ice crystal shapes in thin cirrus clouds using spaceborne or airborne passive remote sensing is more challenging due to the unknown surface reflectance, especially over land. Wang et al. (2014) and Holz et al. (2016) used a combination of active and passive remote sensing instruments with co-located MODIS and CALIOP (Cloud Aerosol Lidar with Orthogonal Polarization) observations. Saito et al. (2017) developed an optimal estimation-based algorithm to retrieve optical thickness, effective radius, fraction of (horizontally oriented) plates, and the degree of surface roughness for optically thin ice clouds using CALIOP and the IIR (Infrared Imaging Radiometer). The majority of studies imply that ice crystals with a roughened surface represent the observations better than crystals with smooth faces (Liu et al., 2014; Holz et al., 2016), which led to the definition of the new ice crystal properties in the MODIS Collection 6 product (Platnick et al., 2017). Recently, Wang et al. (2021) presented a retrieval using observations of the Airborne Multi-Angle Spectro-Polarimetric Imager (AirMSPI) for thin cirrus over ocean and found 8-element columnar crystals to best represent the observations, with severely roughened surfaces for polarized reflectance measurements and smooth surfaces for the total intensity.
Most in situ observations report ice crystals with more rough surfaces and complex rather than pristine shapes: Schnaiter et al. (2016) and Järvinen et al. (2018) found that most ice crystal shapes are highly complex rather than pristine. Järvinen et al. (2018) found from in situ observations using the PHIPS aircraft probe (Abdelmonem et al., 2016; Schnaiter et al., 2018) and Polar Nephelometer (PN) (Gayet et al., 1997; Crepel et al., 1997) that an overwhelming fraction (between 61 % and 81 %) of atmospheric ice crystals exhibits mesoscopic deformations and could be best represented by a flat and featureless angular scattering function. The probed scattering angle region was 18 to 170∘ in the case of PHIPS and 15 to 162∘ with a resolution of 3.5∘ for the PN.
These findings of predominantly rough and complex crystals with featureless scattering phase functions seem to be in disagreement with sightings of halo displays, which form by refraction and reflection of light by smooth hexagonal ice crystals. Forster et al. (2017) showed that at least 25 % of all cirrus clouds produce 22∘ halos, which are only one of the three most common halo types and are formed by randomly oriented hexagonal crystals (cf. Fig. 1). In this study we focus on observations in the scattering angle region of the 22 and 46∘ halos to shed light on the forward scattering part of the ice crystal phase function containing these halo features. Since this forward scattering angle range is not accessible from satellite-based observations, this study adds an important puzzle piece to finding representative ice crystal optical properties for cirrus clouds.
In this study, we investigate a new method to retrieve ice crystal shape and the degree of surface roughness from calibrated camera observations of halo displays using HaloCam (Forster et al., 2020). This retrieval method makes use of scattering features, commonly known as halo displays, which can be observed as bright and colorful circles and arcs in the sky radiance and are caused by details of ice crystal scattering characteristics.
Halo displays are produced by hexagonal ice crystals with smooth faces via refraction and reflection of light as described by Wegener (1925), Greenler (1980), Minnaert (1993), and Tape (1994).
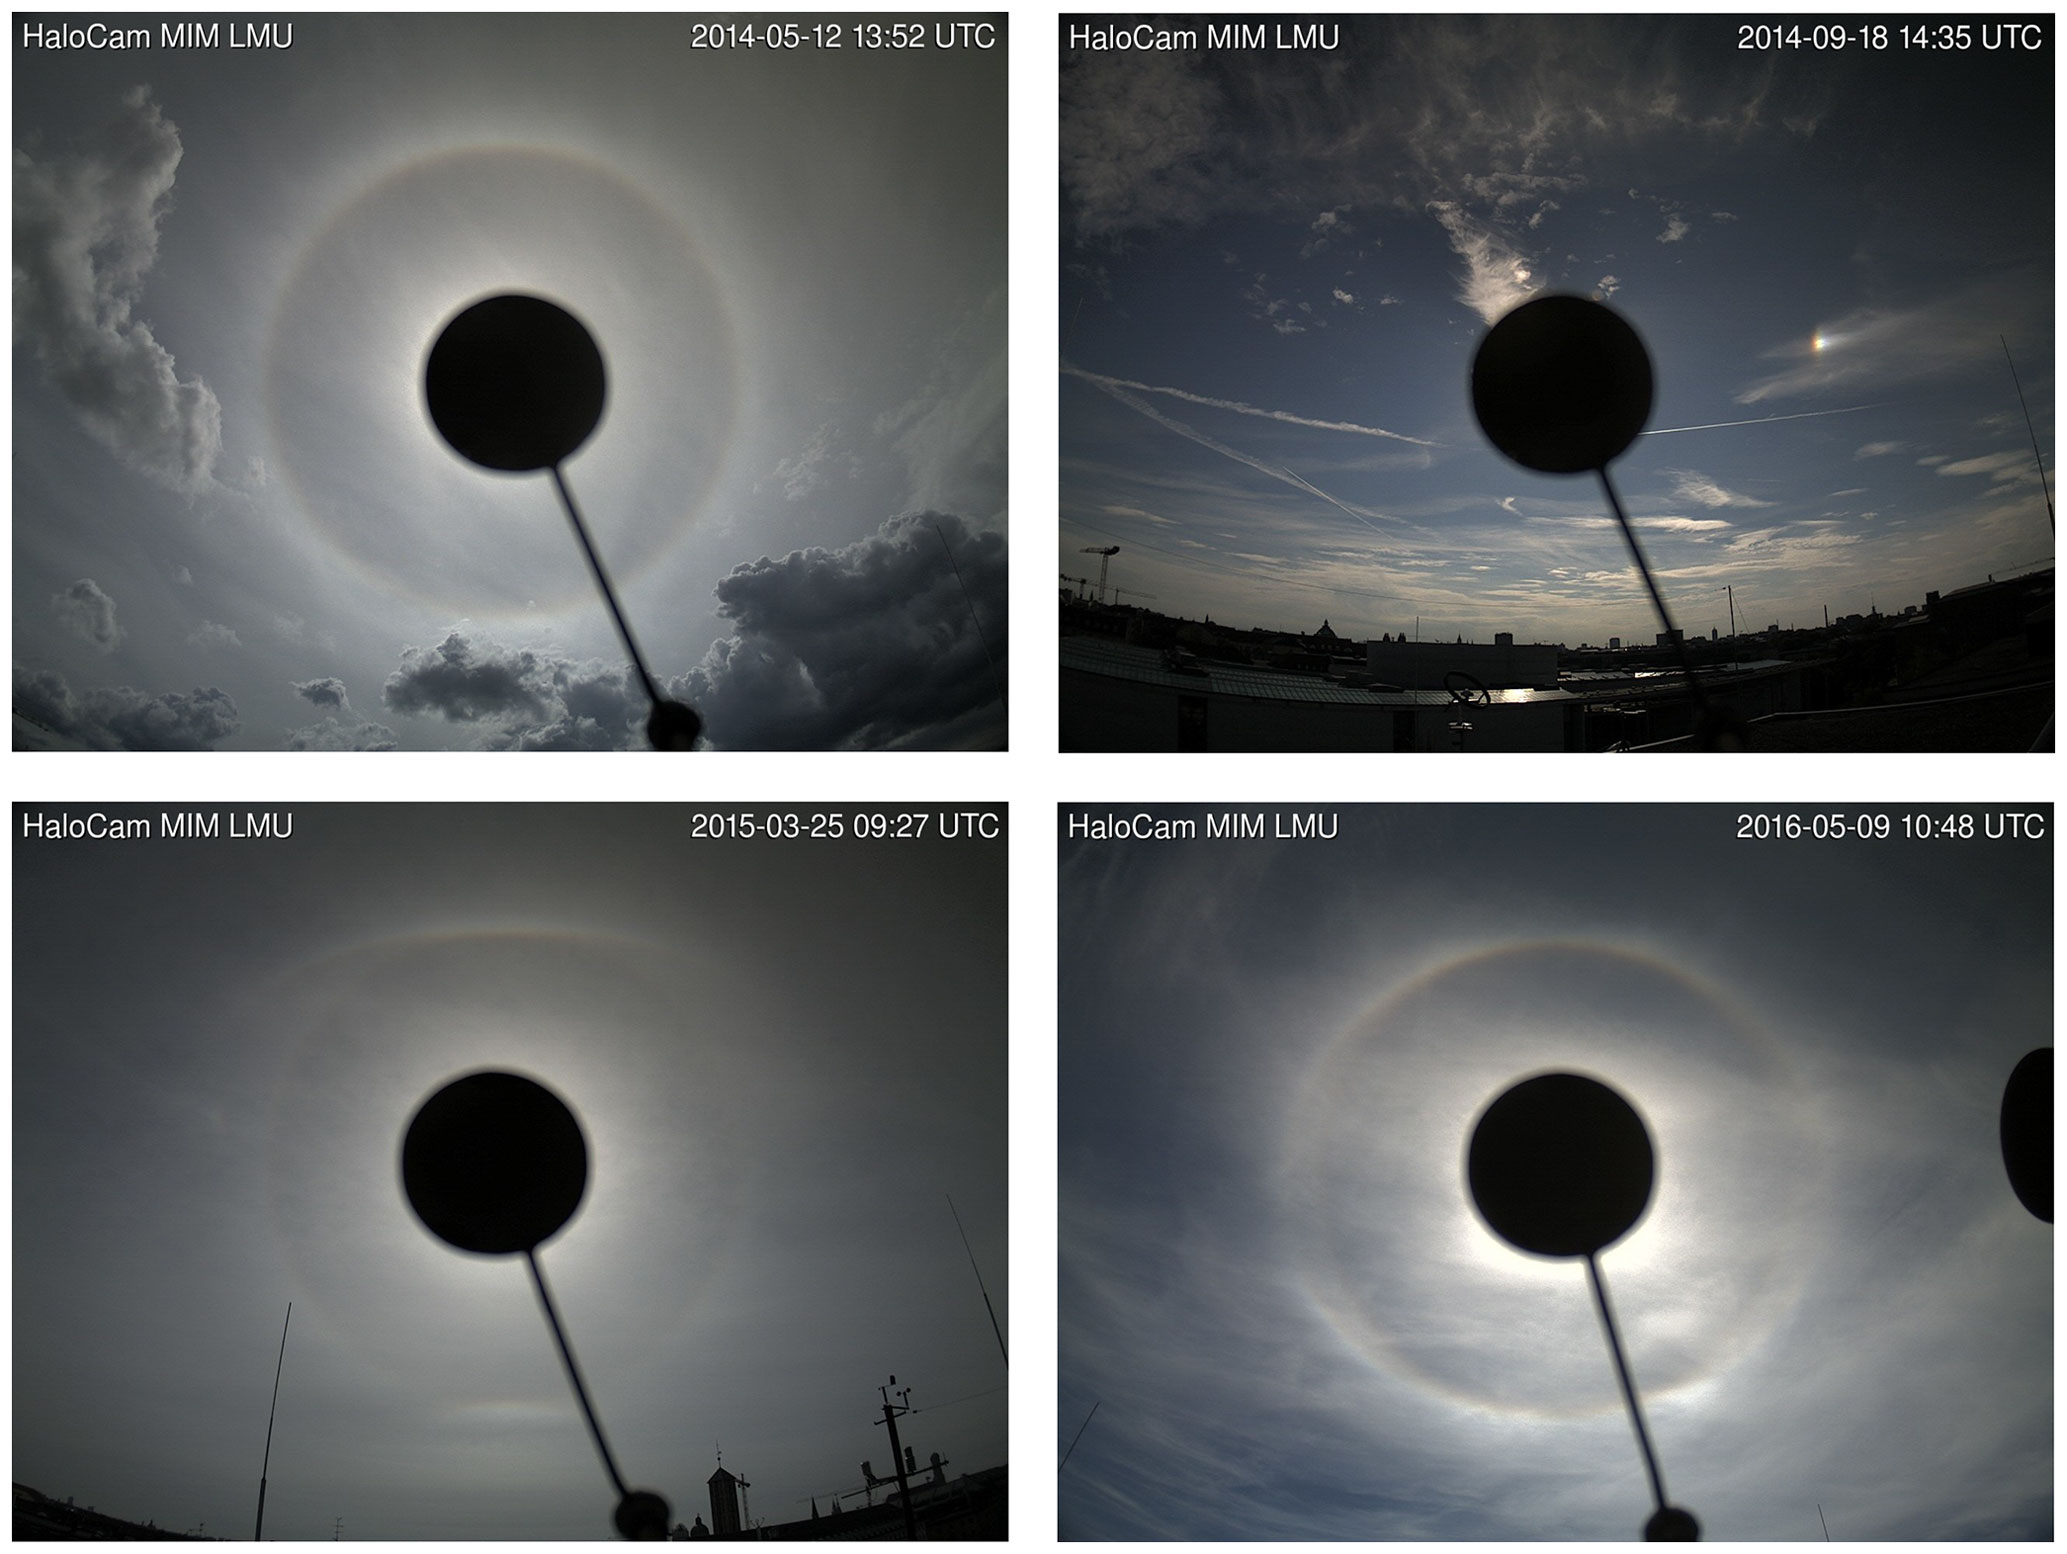
Figure 1Examples of halo displays observed at the Meteorological Institute of LMU in Munich. The Sun is blocked by a black circular shade to avoid stray light and saturation of the camera sensor. Top left: 22∘ halo. Top right: right-hand 22∘ parhelia or sundog. Bottom left: faint 22∘ halo with upper and lower tangent arcs. Bottom right: 22∘ halo with circumscribed halo.
Figure 1 illustrates the most frequent halo displays: the 22∘ halo (top left) is formed by randomly oriented hexagonal ice crystals and appears as a bright ring around the Sun at a scattering angle of about 22∘. The top right image in Fig. 1 shows a bright 22∘ parhelion, commonly called a sundog, on the right-hand side of the Sun. This type of halo is caused by oriented hexagonal plates. Upper and lower tangent arcs, which are produced by oriented ice crystal columns, are shown on the lower left in Fig. 1. While ice crystal orientation also has significant effects on the remote sensing of ice cloud properties, this study focuses on randomly oriented ice crystals for a start and leaves investigation of oriented crystals for a future study. Halo displays contain valuable information about ice particle size, shape, and orientation (Lynch and Schwartz, 1985; Sassen et al., 1994; van Diedenhoven, 2014; Flatau and Draine, 2014). van Diedenhoven (2014) showed that the brightness contrast of the 22∘ halo in ice crystal scattering phase functions is related to the aspect ratio and surface roughness of the crystals. Quantitative analysis of the frequency of occurrence as well as the brightness contrast of halo displays can therefore help determine ice crystal shape, surface roughness, and orientation in cirrus clouds.
In this study we present a novel method to retrieve ice crystal shape and surface roughness in cirrus clouds using ground-based imaging observations of the 22 and 46∘ halo scattering angle region. To the best of the authors' knowledge, this is the first quantitative and systematic analysis of a long-term dataset of halo observations. So far, investigations of halo displays regarding ice crystal properties have been limited to qualitative analysis of single case studies (Lynch and Schwartz, 1985). Long-term studies have focused primarily on the frequency of halo displays with high personnel effort (Sassen et al., 2003).
The paper is structured as follows. Section 2 explains the retrieval method, including a detailed description of the ice crystal optical properties, HaloCam observations, and ancillary data used for the retrieval. In Sect. 3 we describe the results of the retrieval applied to a dataset of 8 different days between September 2015 and November 2016. The sensitivity of the results to the choice of the aerosol properties and to uncertainties introduced by the camera calibration are investigated. Further sensitivity studies of the retrieval and details on ancillary data are provided in the Appendix. We close with a discussion of the retrieval results in Sect. 4 and summarize our key findings in Sect. 5.
Cirrus clouds featuring a halo display contain at least a certain fraction of smooth hexagonal ice crystals. The frequency of these cirrus clouds, which will be referred to as “halo-producing” cirrus in the following, provides therefore a first estimate of the minimum fraction of smooth hexagonal ice crystals in cirrus clouds. Forster et al. (2017) estimate from a 2.5-year dataset of HaloCam observations in Munich that about 25 % of the cirrus clouds produced a 22∘ halo. In both the 2017 study and the present study we refer to cirrus clouds as non-precipitating ice clouds. In the 2017 study, we even constrained the observations to cloud base temperatures of C or colder.
More detailed information about ice crystal properties can be obtained by analyzing the brightness contrast of the 22∘ halo and the radiance distribution around the halo. While the brightness contrast of the halo is mostly sensitive to ice crystal shape, surface roughness, and size, the radiance distribution depends mainly on the cirrus optical thickness (COT). To retrieve all ice crystal properties simultaneously, the radiance measurements of the 22∘ halo have to be compared with radiative transfer simulations. Lookup tables (LUTs) of radiance distributions across the 22∘ halo were compiled using the libRadtran radiative transfer package (Mayer and Kylling, 2005; Emde et al., 2016) with the Discrete Ordinate Radiative Transfer (DISORT) solver (Stamnes et al., 1988) and compared with several days of HaloCam observations to determine the optical and microphysical properties which best represent the observations. The LUT comprises different ice crystal habits, surface roughness values, effective radii, COTs, and AOTs. Furthermore, the LUT is calculated for different solar zenith angles (SZAs) and observation geometries (cf. Table 2). For the surface albedo, aerosol type, atmospheric profile, and cloud height, fixed parameters were chosen. Finally, the radiance measurements were compared with the LUT's precomputed radiance distributions to find the best match. The following sections provide more details on the compilation of the LUT and application of the retrieval to long-term HaloCam observations.
2.1 Ice crystal shape and roughness models
Optical properties based on Yang et al. (2013) (referred to as YG13 in the following) were used for eight different habits: solid columns, hollow columns, plates, 8-element aggregate of columns, 5-element aggregate of plates, 10-element aggregate of plates, solid bullet rosettes, and hollow bullet rosettes, all of which are based on hexagonal crystal symmetry. Droxtals were not considered for the retrieval since they do not produce a 22∘ halo (Yang et al., 2013). For the sake of brevity, we will refer to the aggregates of columns and plates as 8-element columns and 5- and 10-element plates. Since this parameterization provides only three different roughness levels (smooth, moderately roughened, and severely roughened), the optical properties of smooth and severely roughened ice crystals were mixed linearly to achieve a continuous distribution of roughness levels. It should be noted that in this parameterization ice crystal surface roughness is approximated by distortion of the particle geometry. For each habit separately, optical properties of smooth and rough ice crystals were mixed by scaling their extinction coefficients in the radiative transfer simulations. The resulting ice crystal properties assumed here represent a single ice crystal shape and two levels of surface roughness and follow a particle size distribution n according to
with maximum crystal dimension D and ν=1 fixed. For a given effective radius reff, the optical properties provided for a range of maximum dimensions D in YG13 were integrated over the size distribution. During integration, λ was determined iteratively to match the computed effective radius with the prescribed one. The smooth crystal fraction (SCF)
with , ranges between , resulting in a rough crystal fraction (RCF) of
Note that the retrieved ice crystal effective radius, shape, and SCF will depend on assumptions about the underlying particle distribution, since the bulk optical properties, e.g., the extinction coefficient βext, are obtained by integrating the single scattering properties over Eq. (1).
Ice crystals in cirrus clouds are known to follow multimodal rather than monomodal size, shape, and surface roughness distributions. Therefore, matching ice crystal properties could be retrieved for mixtures of arbitrary complexity. However, this study aims at finding the simplest ice crystal model with the minimum degrees of freedom that matches the observations within the measurement uncertainty. Inspired by Schmitt and Heymsfield (2014) and Liu et al. (2014), who separate the huge variety of ice crystal shapes into simple and complex crystals, we employ this two-habit approach for smooth and rough crystals to represent the “halo-producing” and “non-halo-producing” categories of ice particles. The radiative transfer simulations for compiling the LUT were performed using the US standard atmospheric profile (Anderson et al., 1986) and assuming a cirrus cloud between 10 and 11 km in height. Sensitivity studies in Appendix B show that the effect of cloud base height, geometric thickness, as well as atmospheric profile cause a bias in the 22∘ halo radiances of less than 1 %. Furthermore, to save computation time, the radiative transfer simulations were performed for a representative wavelength of each color channel of HaloCamRAW rather than integrating over the spectral response function: 618 nm for the red channel, 553 nm for the green channel, and 498 nm for the blue channel. Figure B3 in Appendix B shows that this causes a bias in the 22∘ halo radiances of 1.5 % for the blue channel, 2.0 % for the green channel, and 1.2 % for the red channel.
Figure 2 illustrates how the properties of the 22∘ (upper panel) and 46∘ (lower panel) halos, represented here by their respective halo ratio, vary with effective crystal radius reff and SCF. A halo ratio of 1 is considered the threshold for a visible halo display, indicated by the white contour. Below this value, the halo features are assumed to vanish compared to the background illumination. The key takeaway from this figure is that column-shaped crystals (solid columns, aggregates of 8-element columns, solid bullet rosettes) produce the most pronounced 22∘ halo, i.e., the largest halo ratio for a given smooth crystal fraction and effective radius. To produce a comparable 22∘ halo ratio, plate-like crystals (plates and 5- and 10-element aggregates of plates) need a much larger fraction of smooth crystals, which implies a significantly larger 46∘ halo ratio compared to columnar crystals. Ice crystals with a hollow base (hollow column, hollow bullet rosette) result in 22∘ halo ratios ranging between the values for columnar and plate-like crystals; however, they do not produce a 46∘ halo since the cavity prevents the necessary ray path.
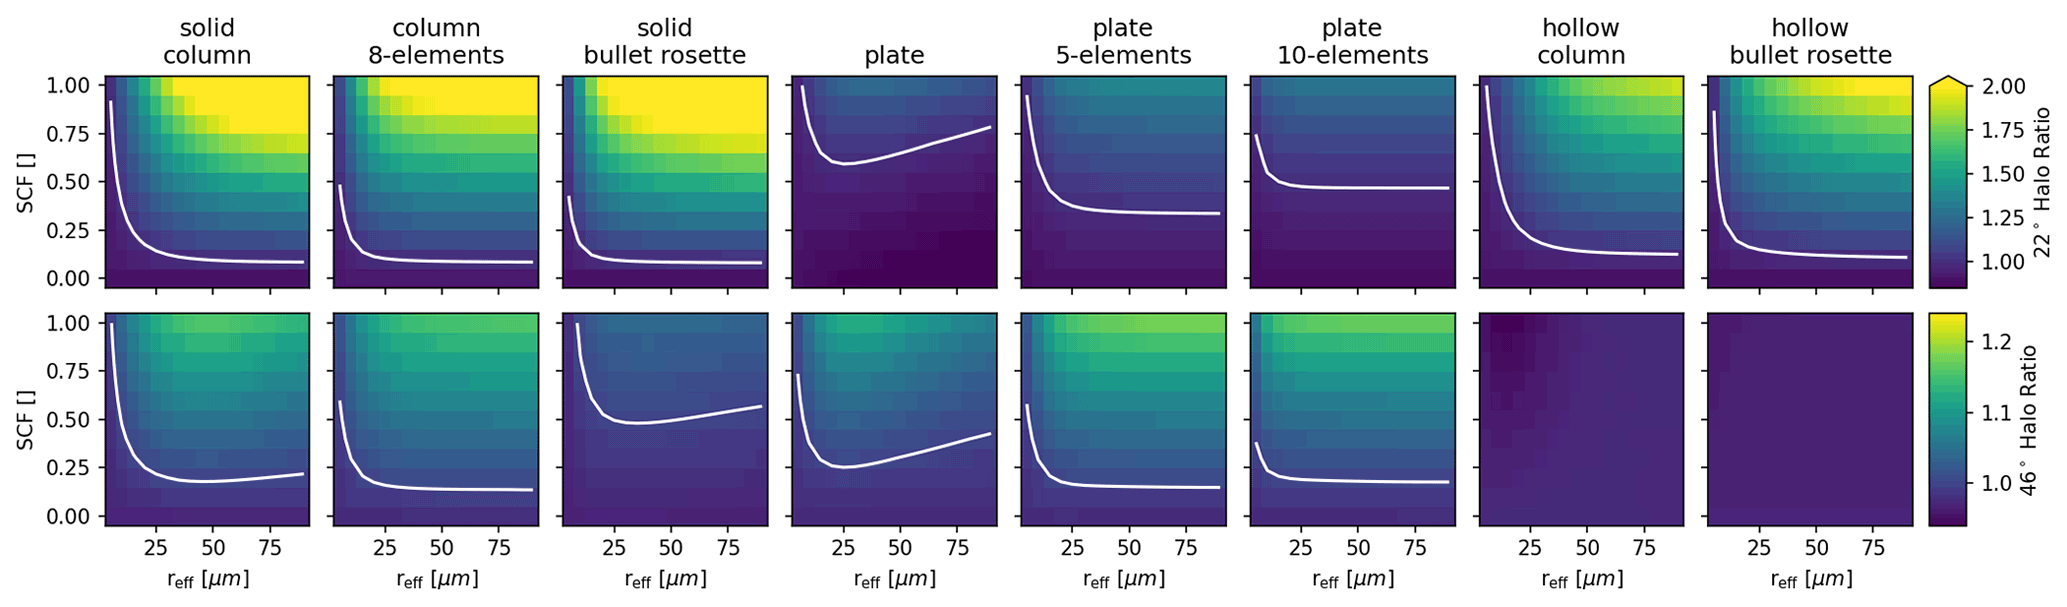
Figure 2Sensitivity of the halo features, represented here by the 22∘ (upper panel) and 46∘ (lower panel) halo ratios, to ice crystal shape, effective radius (x axis), and smooth crystal fraction (SCF) (y axis) based on the lookup tables (LUTs) used for the retrieval. These features are a selection of the full LUT for a wavelength of 618 nm, SZA = 40∘, AOT = 0.25, COT = 1.0, and image segment no. 1 (cf. Fig. 4). The white contour lines mark the threshold assumed here for a visible 22 or 46∘ halo at halo ratio HR=1.
2.2 HaloCam observations and ancillary data
To obtain representative results for ice crystal properties of halo-producing cirrus clouds, long-term observations are required. These are provided by the weather-proof Sun-tracking camera HaloCamRAW which was installed in September 2015 on the rooftop platform of MIM (Meteorological Institute Munich, LMU) (Forster et al., 2020). Between 22 September 2015 and 31 December 2016, HaloCamRAW recorded scenes with a 22∘ halo on 52 d with a temporal resolution of 10 s. The automated halo detection algorithm HaloForest, described in Forster et al. (2017), was used to filter the HaloCamRAW images for 22∘ halos. Additional Sun photometer measurements are used to constrain aerosol optical thickness (AOT) and COT. As demonstrated in Appendix B, additional knowledge about these two parameters is critical for retrieving information about the ice crystal microphysical properties. The aerosol optical thickness was derived from the AERONET AOT product (Holben et al., 1998) (version 2) for the observation site on the MIM rooftop platform. The AOT during the time of the halo observation is constrained to a 2σ confidence interval around the daily average AOT estimated during clear-sky periods.
The COT introduces an ambiguity in the brightness contrast of the 22∘ halo (Forster et al., 2017). Constraining the COT is therefore necessary for a stable retrieval. For this retrieval the COT is derived from Sun photometer measurements using the SSARA instrument (Toledano et al., 2009, 2011). SSARA provides direct Sun measurements with a temporal resolution of 2 s which are much more suitable for the observation of the highly variable cirrus clouds than AERONET with 15 min (Holben et al., 1998). The COT is derived by calculating the total optical thickness from the SSARA direct Sun measurements. The previously estimated AOT is then subtracted, and a correction factor is applied to account for the increased forward scattering of the ice crystals (Reinhardt et al., 2014) (cf. Appendix B1.2). The retrieval is applied to the red channel of HaloCamRAW with a central wavelength of 618 nm (cf. Fig. B3) to minimize the relative contribution of Rayleigh and aerosol scattering compared to the scattering by ice crystals.
Table 1HaloCamRAW 22∘ halo days between 22 September 2015 and 31 December 2016.
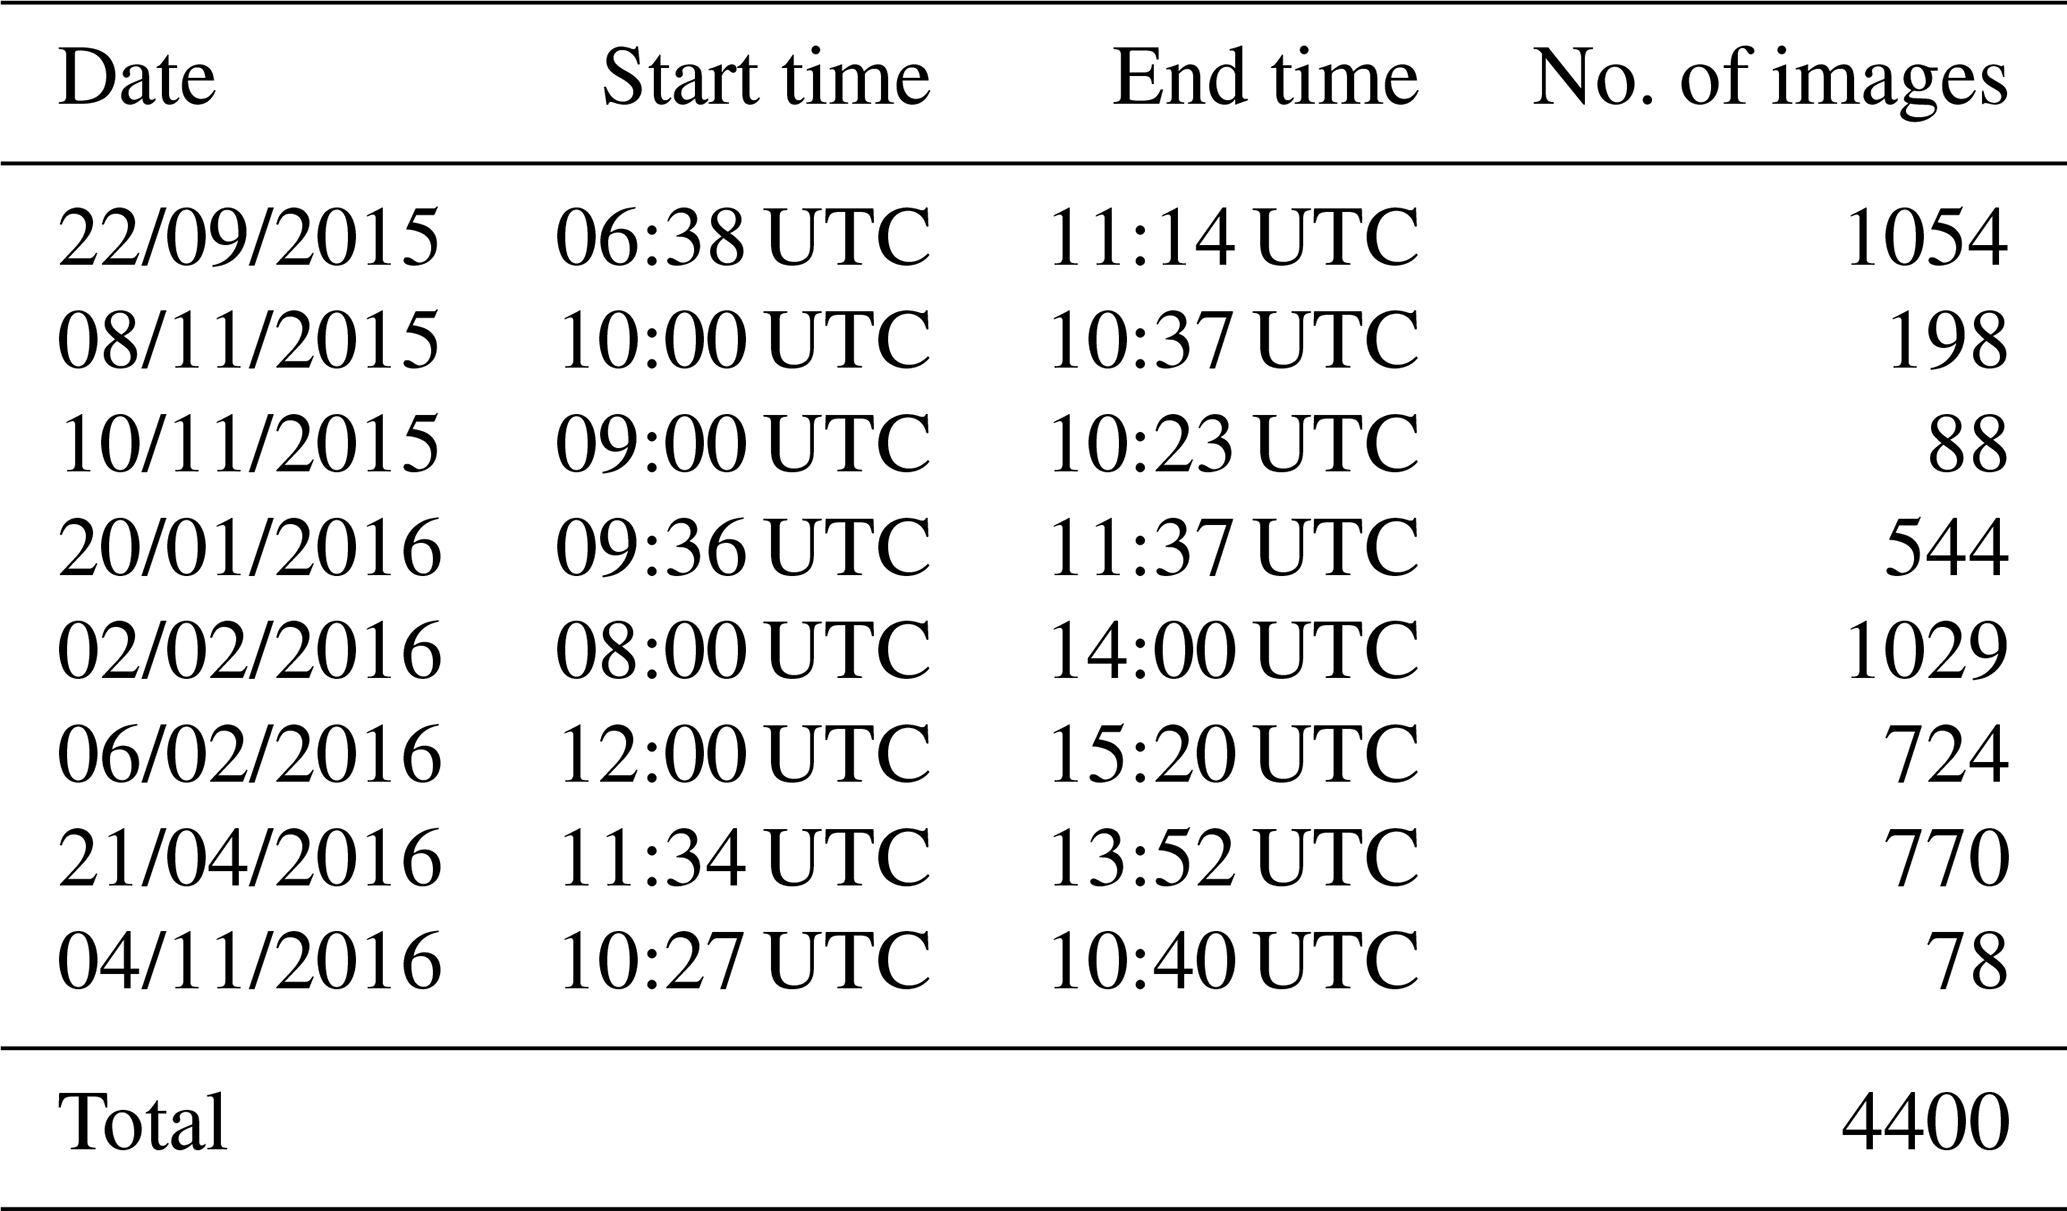
Using additional observations of AOT requires clear-sky periods before and/or after the 22∘ halo event. Simultaneous AOT and COT observations from SSARA and AERONET (including the necessary clear-sky scenes) together with 22∘ halo observations from HaloCamRAW are available for only 8 of the 52 d, which are listed in Table 1. Figure 3 shows an example of the AOT and apparent COT derived from Sun photometer measurements on 21 April 2016. The AOT is obtained from the AERONET dataset and is represented by turquoise stars. The daily average AOT amounts to about 0.08 ± 0.04 at 618 nm. The blue dots in Fig. 3 indicate the apparent COT derived from SSARA direct Sun measurements, which are available from about 11:30 UTC. Figure 3b shows slices of the HaloCam images along the principal plane above the Sun; 22∘ halos and upper tangent arcs appear as a bright line in the center of the panel with a reddish inner, i.e., lower, edge from about 11:30 until 14:00 UTC.
The HaloCamRAW observations were geometrically and radiometrically calibrated as described in Forster et al. (2020). To apply the retrieval to the HaloCamRAW data, the LUT was calculated for a wavelength of 618 nm with a surface albedo of 0.065. The remaining LUT parameters are provided in Table 2. To use as much information as possible from the HaloCamRAW images for the retrieval, the radiative transfer simulations for the LUT were performed for the viewing angles of all five image segments. The file size of the LUT and observations was then reduced by averaging both simulated and measured images over the five segments in the direction of the relative azimuth angle φ (Forster et al., 2020, Fig. 3b). Thus, a separate LUT was compiled for each of the five HaloCamRAW image segments, which are evaluated separately.
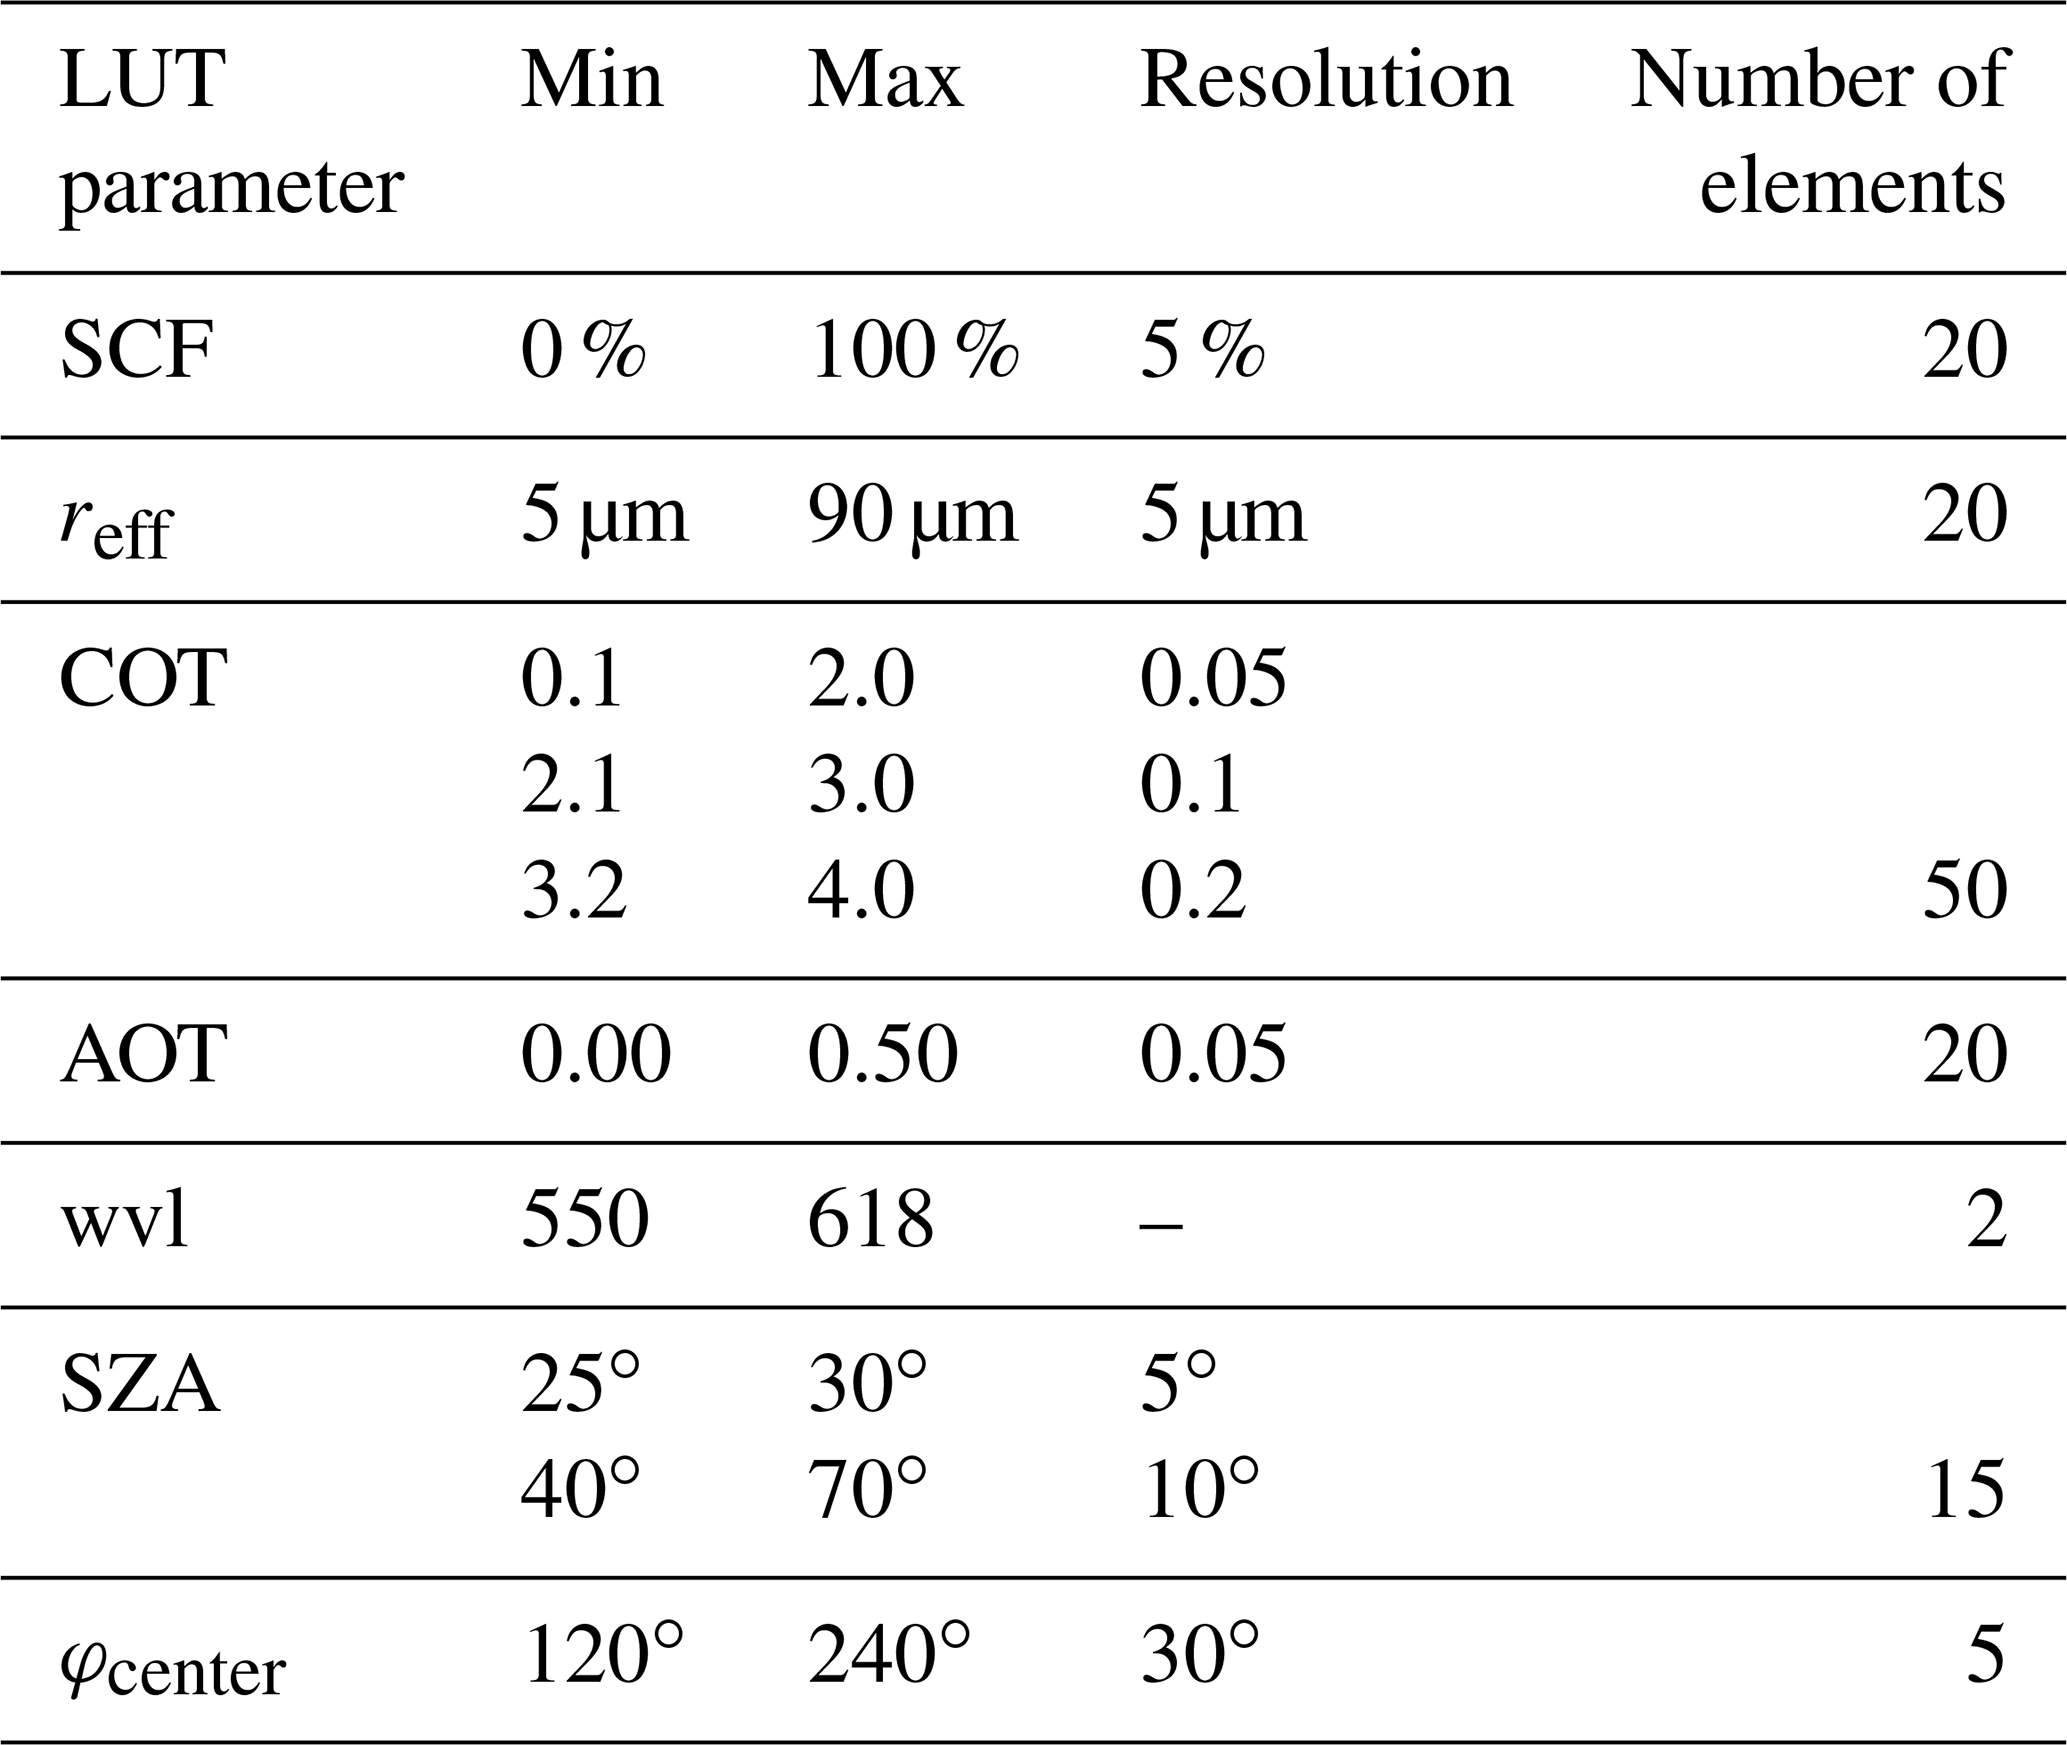
Table 2Lookup table parameters: minimum value, maximum value, and resolution for smooth crystal fraction (SCF), effective radius (reff), cirrus optical thickness (COT), aerosol optical thickness (AOT), wavelength (wvl), solar zenith angle (SZA), and central value of the Sun-centered azimuth angle φcenter for each of the five image segments. COT and AOT are defined at a wavelength of 550 nm.
The retrieval was performed as illustrated in Fig. 4. The left (yellow) branch of the flowchart describes the processing of the HaloCam images, starting with (a) selecting images from the database for a specific day and (b) filtering them for a visible 22∘ halo using HaloForest (Forster et al., 2017). Looping over this filtered database, an image is selected (c) and calibrated (d) as described in Forster et al. (2020), and the retrieval is performed for each of the five image segments separately. A sample HaloCamRAW image is shown here for illustration with the five image segments indicated and the corresponding radiance distributions as a function of scattering angle below. Each of the image segments is centered around the relative azimuth angles φcenter=120, 150, 180, 210, and 240∘ as listed in Table 2. Pre-processing of the synthetic observations from a LUT of radiative transfer simulations is represented by the right (blue) branch in Fig. 4 (steps 1 through 5), followed by the actual retrieval (steps 6 through 8).
-
For each ice crystal habit, the respective LUT was selected.
-
The LUT was further constrained to the wavelength representative of the image channel, here 618 nm.
-
In a next step, the AOT dimension of the LUT was constrained using AERONET Sun photometer observations, interpolated to 618 nm. Since AERONET's AOT can only be measured during clear skies, the values during the observation of the halo display were estimated to range around the daily mean AOT within a 2σ confidence interval. The AOT dimension of the LUT was then constrained to the interval (, ). As an example, for 21 April 2016, the AOT dimension was allowed to range within 0.08 ± 0.04 (cf. Fig. 3).
-
Then, for each HaloCamRAW image, the LUT was interpolated to the SZA corresponding to the image time stamp.
-
For each HaloCamRAW image time stamp, the COT dimension of the LUT was constrained in addition. Sun photometer measurements using SSARA's high temporal resolution of 1 s were used to find a representative COT interval for each time step of halo observations. The COT was derived from SSARA's total optical thickness observations by subtracting AERONET's AOT and correcting the resulting apparent COT for the enhanced forward scattering by ice crystals according to Eq. (B5 using the so-called k value. For a fixed instrument field of view and for a given ice crystal shape, the k value depends primarily on the ice crystal size (cf. Appendix B1.2) and was computed for the LUT's minimum and maximum effective radii of 5 and 90 µm as an initial guess. The representative COT interval was then determined by computing the average COT within a 2σ confidence interval over a 10 min time window (±5 min around the observation time stamp) to account for the slightly different pointing directions (Sun photometer) and (halo display) in combination with the unknown wind direction.
-
For the retrieval, each of the five averaged radiance distributions measured with HaloCamRAW was compared to the LUT elements with the respective viewing geometry. The residuum between measurements and LUT is quantified by the root mean squared error (RMSE), which is calculated by
using the measurements Lmeas,i and LUT elements LLUT,i within the considered scattering angle range and averaged over the number of elements n.
-
The LUT element with the minimum RMSE, averaged over the scattering angle range, represents the best match for the cirrus optical and microphysical properties.
In case the average RMSE between LUT and measurements exceeds the 2σ measurement uncertainty, the measurements are discarded from the retrieval. This occurs, for example, for highly inhomogeneous scenes or cirrus properties outside the LUT.
-
The resulting SCF, effective radius reff, asymmetry factor g, COT, and AOT are considered representative optical properties for the cirrus cloud region captured by the respective HaloCam image segment.
-
A second iteration of the retrieval is performed starting from step 5 to further constrain the COT dimension of the LUT. Using the retrieved effective radii for the five image segments, the minimum and maximum k values are determined by the effective radius averaged over all image segments within a 2σ confidence interval: . This constrained range of k values then translates to a further constrained COT dimension of the LUT.
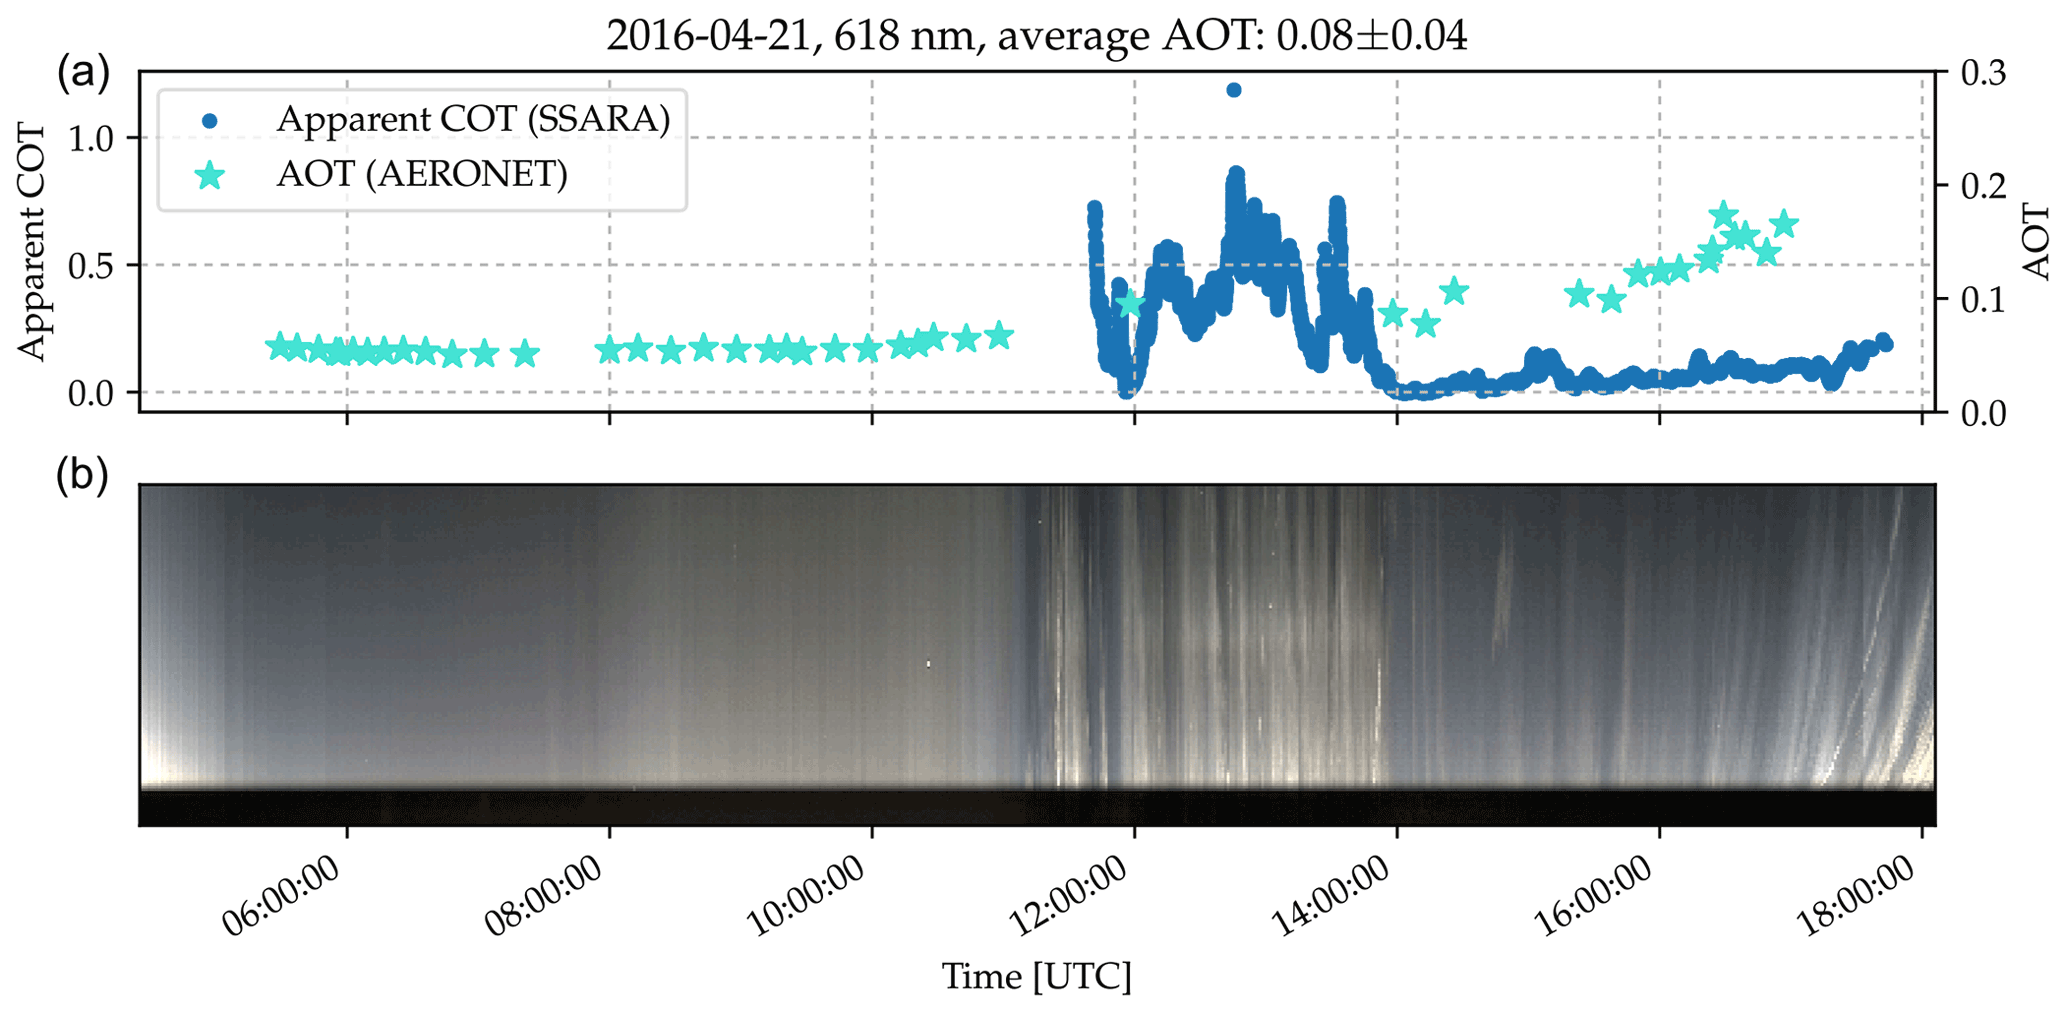
Figure 3(a) AERONET AOT (turquoise stars) and apparent COT derived from SSARA measurements (blue dots) for a wavelength of 618 nm. (b) Timeline of HaloCam image slices along the principal plane above the Sun.
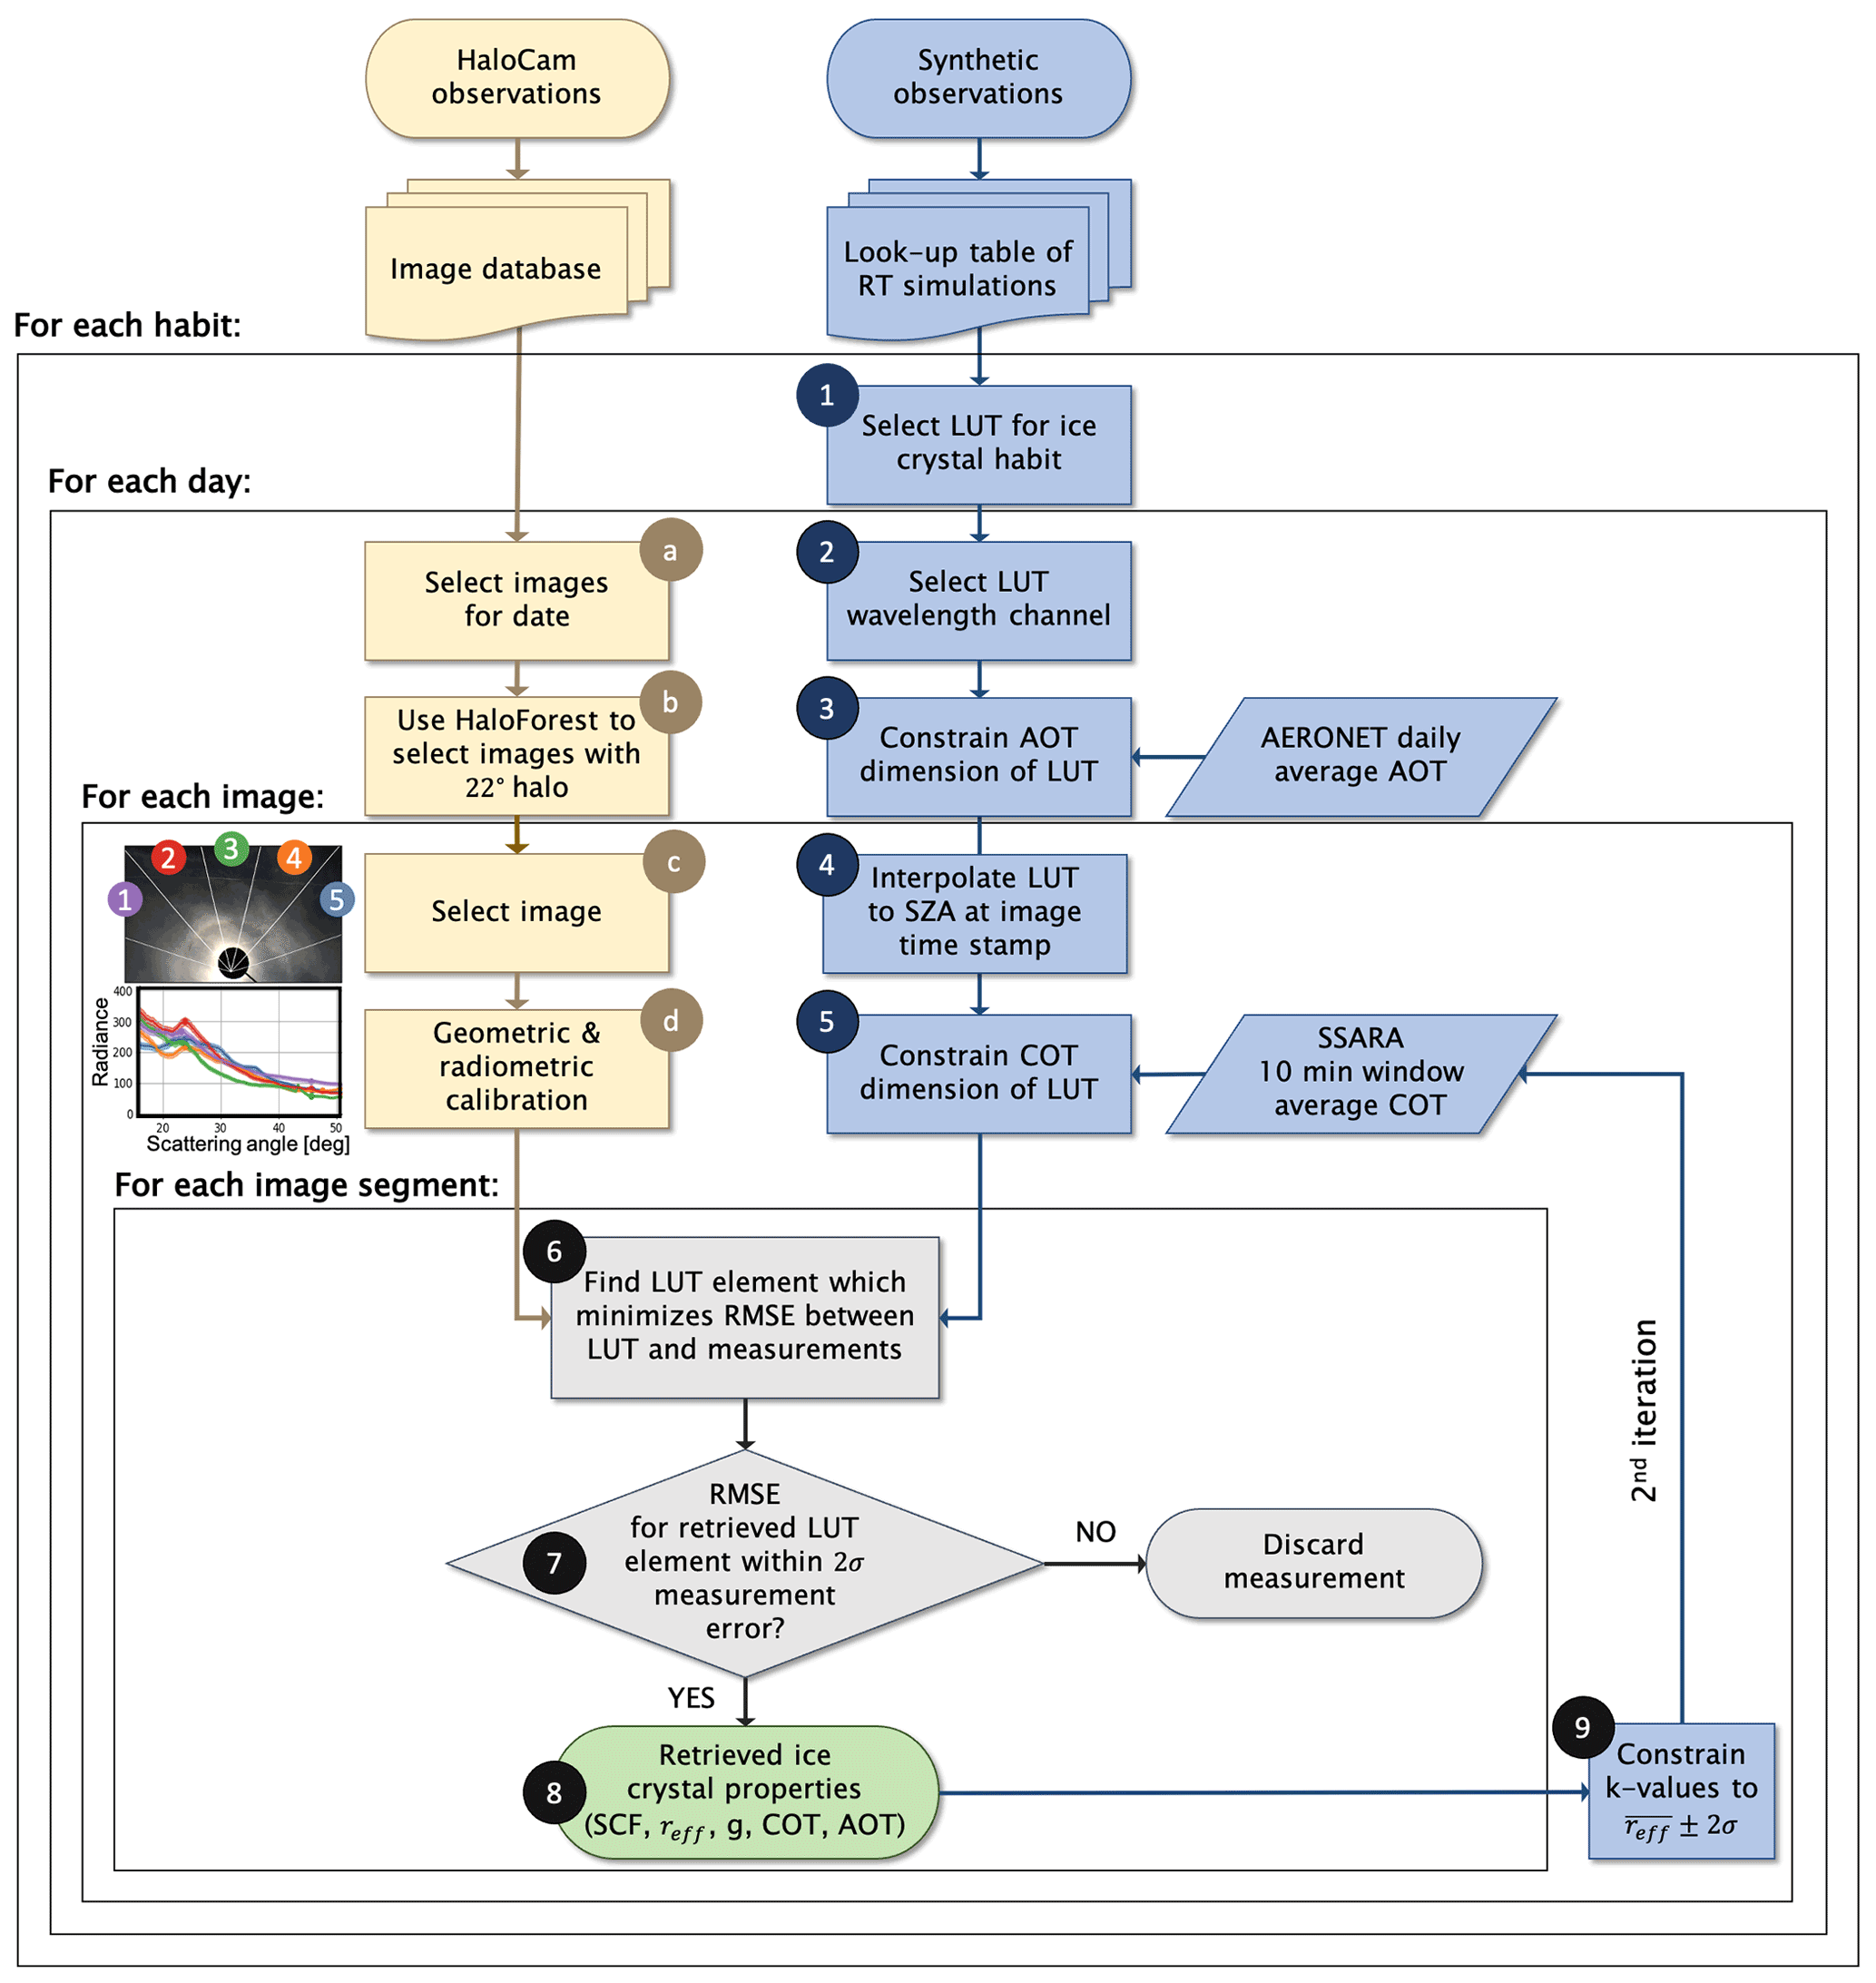
Figure 4Flowchart visualizing the individual steps of retrieving representative ice crystal properties by finding the best match between HaloCam observations (yellow) and a LUT of radiative transfer simulations (blue).
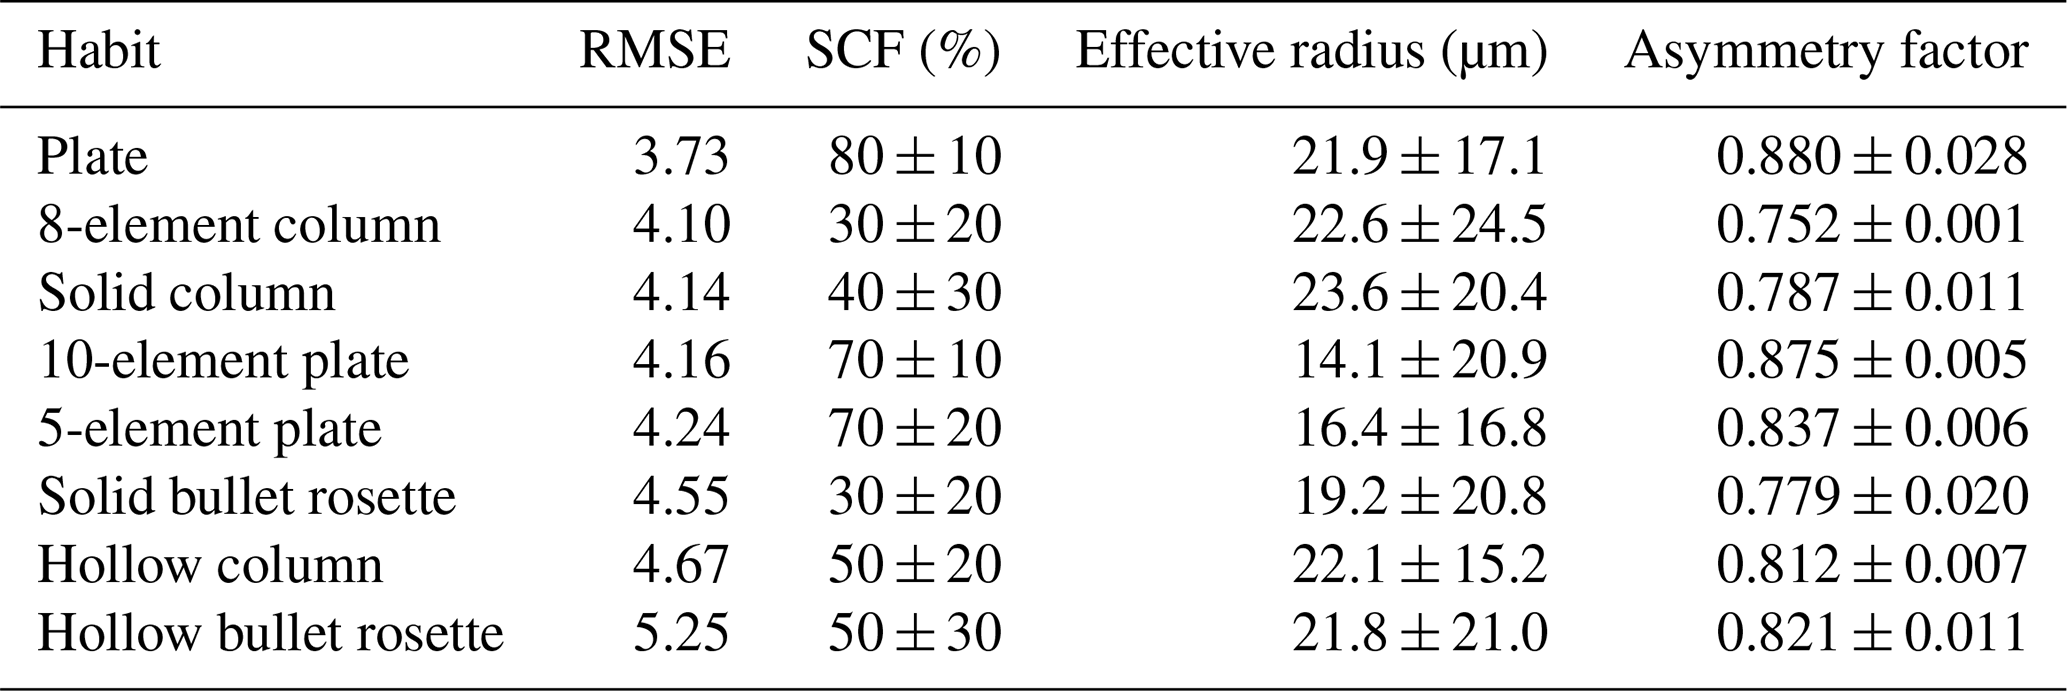
Table 3Retrieval results evaluated for all 8 d. Mean value and 1σ standard deviation are provided for the SCF, effective radius, and asymmetry factor, sorted by increasing mean RMSE.
3.1 Using information of the 22∘ halo
Observations and LUT are compared in the scattering angle range between with an angular resolution of 0.5∘. Maximizing the scattering angle range, which is used for this comparison, provides more information. On the other hand, for an increasing angular region, inhomogeneities in the cirrus optical and microphysical properties become relevant. The goal of the retrieval is to find the ice crystal properties which best match the observed radiance distributions across the scattering angle range of the 22∘ halo. Therefore, the scattering angle range was optimized to cover as much as possible of the vicinity of the 22∘ halo in addition to its peak while keeping it as small as possible to avoid inhomogeneities of the cirrus cloud.
To ensure that only samples with a clearly visible 22∘ halo are considered, the results were filtered for a halo ratio HR>1 (cf. Eq. 1 in Forster et al., 2017), and the uppermost image segment (no. 3 at ; cf. Table 2) was excluded. This segment might contain signatures of the upper tangent arc, which is produced by oriented ice crystal columns.
Sundogs appear in the left and right image segments (nos. 1 and 5) only for at scattering angles of , which does not interfere with the 22∘ halo, as discussed in Forster et al. (2017). While observations of upper tangent arcs and sundogs contain valuable information about the fraction of oriented columns and plates, they are excluded from the retrieval presented in this study, which focuses on randomly oriented crystals.
Figure 5 presents the retrieval results for the 3080 samples (four segments per image) of a 22∘ halo observed on 21 April 2016. The histograms display the retrieved LUT parameters based on the assumption that the representative ice crystal habit is either solid columns (a), hollow columns (b), or plates (c). The retrieved values for the SCF, effective radius, asymmetry factor g, COT, and AOT are provided as histograms with parameter boundaries and bins as defined in the LUT. The RMSE between LUT and measurement is provided in the rightmost panels of Fig. 5.

Figure 5Retrieval results for 21 April 2016 for three selected YG13 ice crystal shapes: (a) solid columns, (b) hollow columns, and (c) plates. The different panels show histograms of the best-matching LUT parameters for the SCF, effective radius (reff), asymmetry factor (g), cirrus optical thickness (COT), aerosol optical thickness (AOT), and RMSE between LUT and measurement (from left to right). The results were filtered for a halo ratio HR>1 to ensure that only image slices with a 22∘ halo were analyzed, and the uppermost image segment (no. 3; cf. Fig. 4) was excluded from the analysis to avoid applying the retrieval to upper tangent arcs.
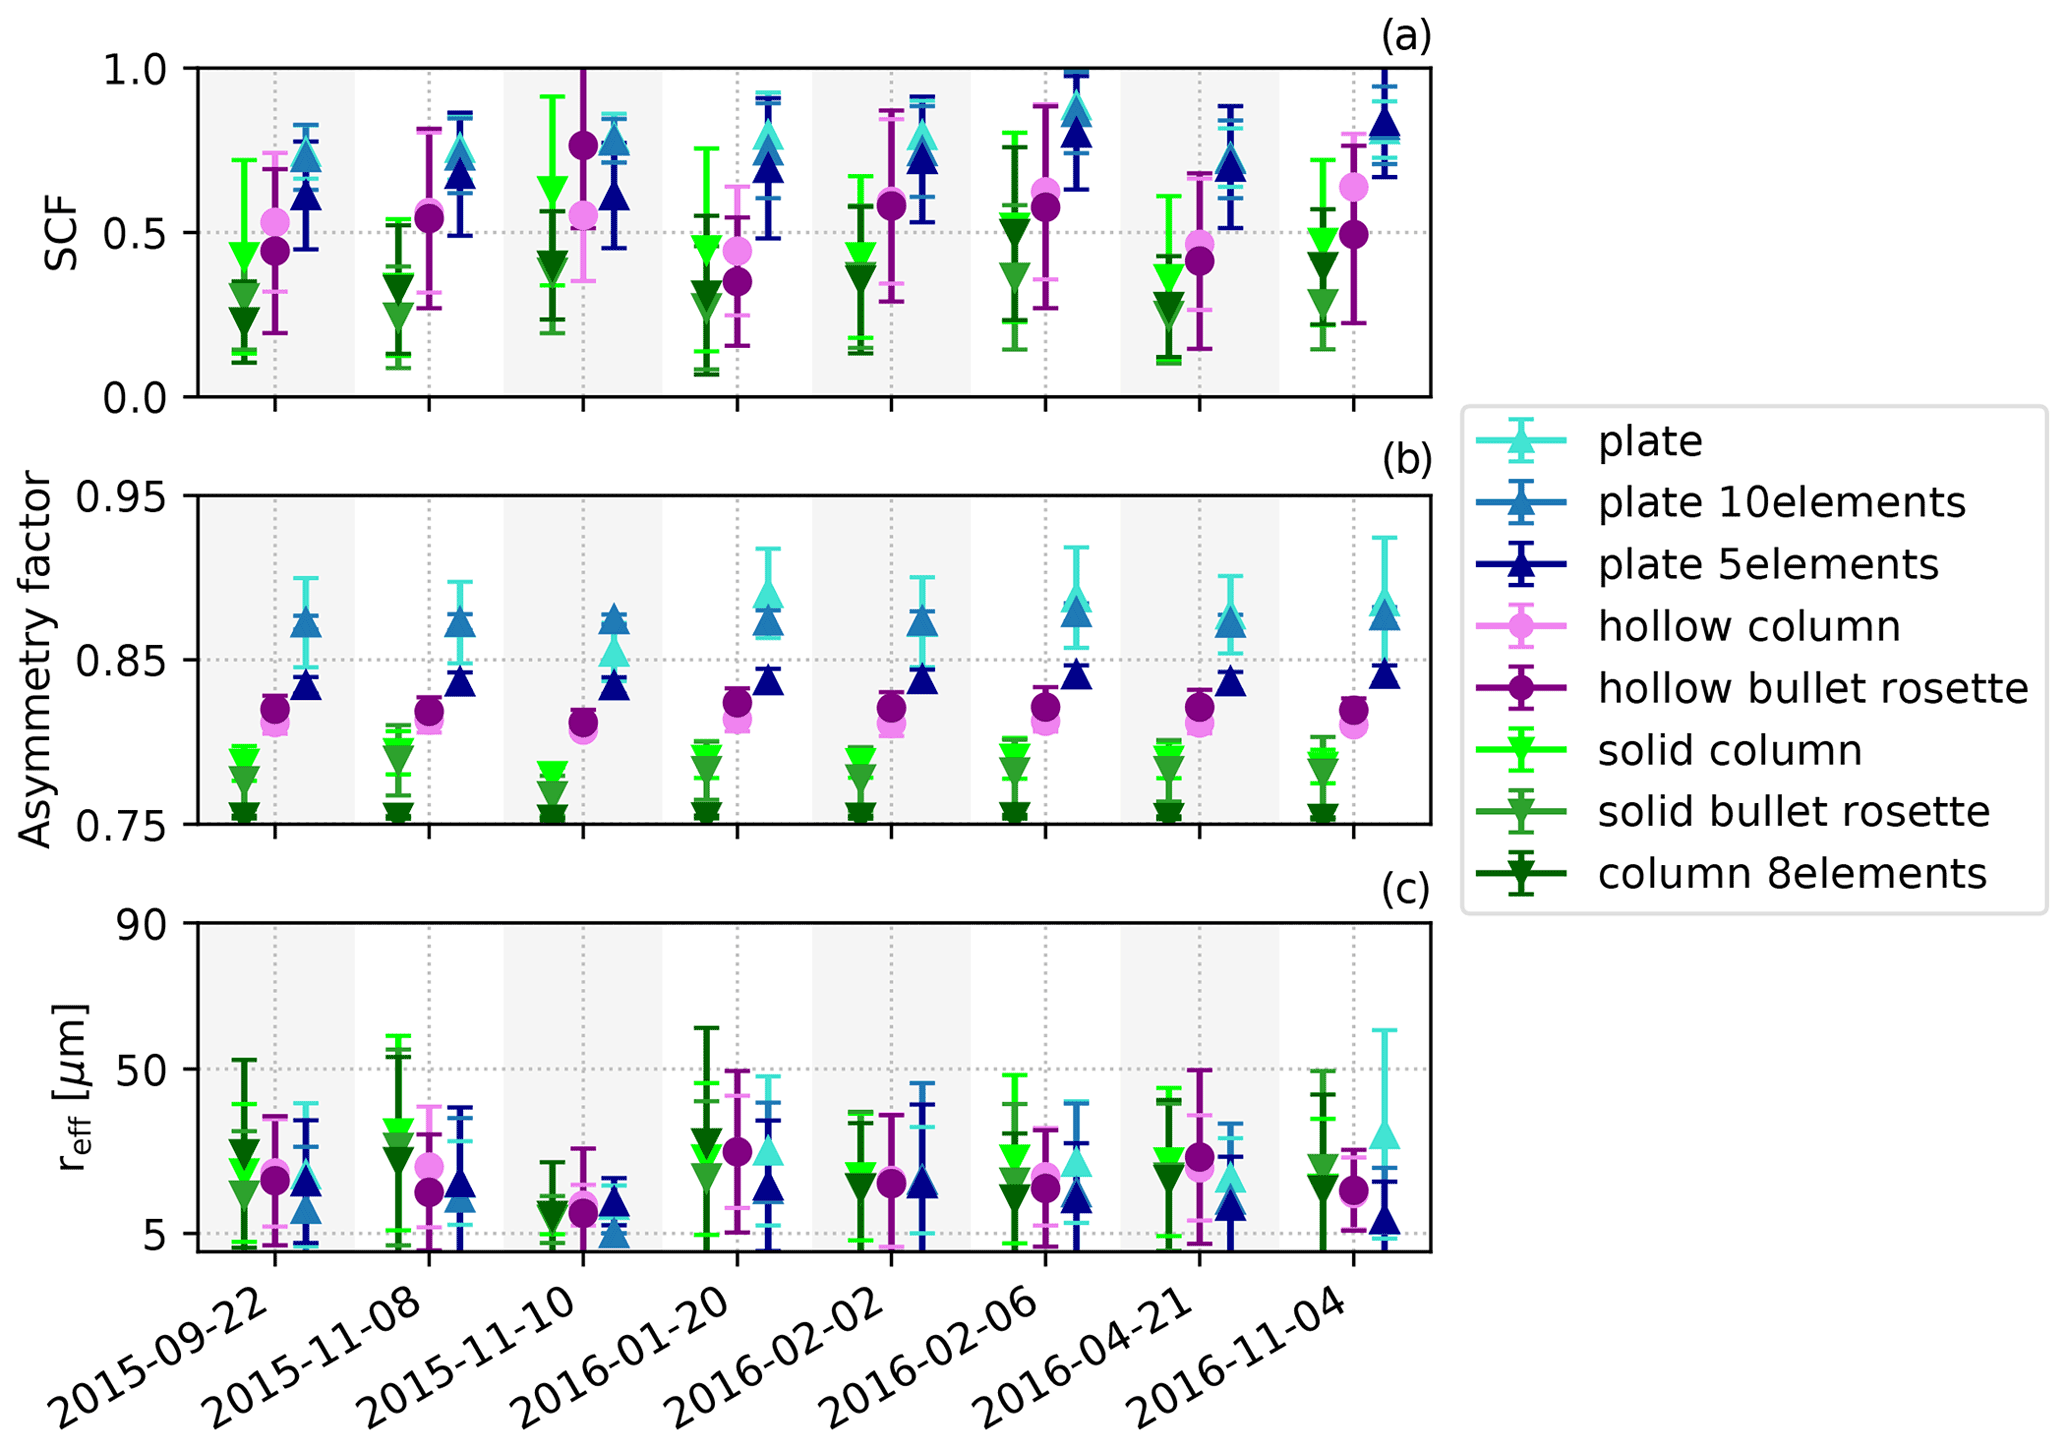
Figure 6Retrieval results for all 8 d listed in Table 1 and for all eight crystal shapes of the YG13 optical property database. Results are shown for the SCF (a), asymmetry factor (b), and effective radius (c) using the mean value within a 1σ confidence interval. Note that the underlying distributions might be skewed as depicted in Fig. 5. Blue (triangles up), pink (circles), and green color tones (triangles down) are used to group the ice crystal shapes into plate-like, hollow, and columnar shapes, respectively. Darker colors indicate more complex crystals.
For solid columns (Fig. 5a), the SCF peaks below 50 %, and HaloCamRAW's 22∘ halo observations are represented best by a mean SCF of 35.9 % and an RCF of 64.1 % (cf. Eq. 3). The ice crystal effective radii peak at 20 µm with a mean value of 24.5 µm and a mean asymmetry factor of 0.788. The majority of COT values are below 1 with a mean value of 0.53, whereas the AOT (constrained between 0.05 and 0.15 using AERONET data) yields a mean value of 0.11. In the case of hollow columns (Fig. 5b), the retrieved SCF ranges around 50 % with effective radii of 22.9 µm on average and a mean asymmetry factor of about 0.811. The average COT of 0.41 is slightly smaller compared to the solid column case. For ice crystal plates (Fig. 5c), a larger SCF of about 72.8 % (and an RCF of 27.2 %) on average is required to match the brightness contrast of the 22∘ halo measured with HaloCamRAW. The mean effective radius with 20.2 µm is slightly smaller compared to the solid column case. Assuming plates to be a dominating ice crystal habit causes a larger asymmetry factor on average of 0.879. The average COT amounts to 1.07 with a few values larger than 2. The retrieved COT in the case of plates is significantly larger compared to solid and hollow columns due to the increased forward scattering indicated by the large asymmetry factors. Increasing the asymmetry factor (i.e., the amount of forward scattering) of ice crystals in a cloud with a constant crystal concentration would result in higher radiance values measured by the same detector (cf. Appendix B1.2). Compared with solid and hollow columns, the plate habit shows the smallest RMSE values for this dataset.
Figure 6 displays the results of the retrieval applied to the 8 d of 22∘ halo observations with HaloCamRAW. Panel a presents the retrieved SCF for each day and for the eight habits. By grouping the ice crystal habits into columnar (green, triangles down), hollow (pink, circles), and plate-shaped (blue, triangles up) crystals, the average SCF clusters at ∼30 %, ∼60 %, and ∼80 %, respectively. A similar clustering results for the asymmetry factor, which is smallest for columnar crystals and largest for plate-like crystals. In contrast to the differences of the retrieved mean SCFs and asymmetry factors among the habits, the retrieved mean effective radii, shown in Fig. 6c, seem to be almost independent of ice crystal habit and roughness. This confirms that the width of the 22∘ halo is primarily determined by ice crystal size, while shape and surface roughness play a minor role. The mean effective radius amounts to about 20 µm. Due to the skewed distribution of the retrieved effective radii (cf. Fig. 5), more than 90 % of the results are smaller than 40 µm.
Figure 7a shows cloud top (circles) and base (dots) height represented by the mean value and standard deviation, which were derived from co-located measurements of a MIRA-35 cloud radar (Görsdorf et al., 2015) on the MIM rooftop platform. On 4 November 2016 cirrus clouds formed only in the south and southeast during the 22∘ halo event (cf. Table 1). Thus, the zenith-pointing cloud radar did not detect the cirrus cloud observed by HaloCamRAW, and therefore no cloud height could be provided. In the other cases, the cirrus clouds had a larger horizontal extent, and the 22∘ halo was visible over a longer time period. The cloud top height varied around 10 km, except for 20 January 2016, with 6 km. The cloud base height exhibits a larger variability between 5 and 10 km. The corresponding temperatures at cloud top (circles) and cloud base (dots), indicated by mean value and standard deviation, are displayed in Fig. 7b. The threshold temperature for homogeneous nucleation is represented by the blue dashed line at −38∘ C. For all seven cases, the cloud top temperature was equal to or colder than −38∘ C, while the cloud base temperature varied between −10 and −50∘ C on average. It is noteworthy that the coldest and thinnest cirrus on 10 November 2015 with a cloud base temperature of about −50∘ C coincides with the smallest retrieved effective radii in Fig. 6. This tendency is in agreement with, e.g., Bailey and Hallett (2009) and Baran (2012), who report the smallest ice crystals close to cloud top and at the coldest temperatures in the case of synoptic cirrus. While observing ice crystals directly at cloud top is impossible for ground-based imaging in the case of thick clouds, geometrically thin cirrus provides an opportunity to infer ice crystal properties close enough to the cloud top and ensure more homogeneous atmospheric conditions, which are conducive to a more homogeneous size and shape distribution. van Diedenhoven (2021) also found effective radii of ice crystals to decrease with increasing cloud top height and thus decreasing temperature using the airborne Research Scanning Polarimeter's (RSP's) observations together with reanalysis data from the Goddard Earth Observing System Model Forward Processing (GEOS-FP) data assimilation system.
Table 3 presents the retrieved SCF, effective radius, and asymmetry factor for all evaluated days, sorted by increasing mean RMSE. The retrieval revealed that ice crystal plates have the overall smallest mean RMSE and thus seem to match the HaloCamRAW observations better in the scattering angle range between 18 and 25∘ than the other seven habits of the YG13 database. The best-matching LUT elements of ice crystal plates have an SCF of (80 ± 10) %, an effective radius of (21.9 ± 17.1) µm, and an asymmetry factor of 0.880 ± 0.028. With increasing RMSE, the plates are followed by 8-element columns and solid columns. Hollow columns and bullet rosettes result in the largest mean RMSE, which is mainly due to an additional peak in the radiance distribution at scattering angles around 18∘ as shown in Forster et al. (2020), Fig. 13.

Figure 7(a) Cloud top (circles) and base (dots) height were derived from cloud radar observations. (b) The corresponding temperature was estimated from radiosonde profiles launched at Oberschleißheim. The dashed blue line indicates the threshold for homogeneous nucleation at a temperature of −38 ∘C. The results are provided by the mean values within a 1σ confidence interval over the time periods with a visible 22∘ halo.
In the following we assess how stable the retrieved ice crystal habit is considering the necessary assumptions regarding spectral response, aerosol type, and radiometric uncertainty. Using the representative wavelength of HaloCamRAW's red channel instead of accounting for its full spectral response introduces a small bias of less than 1.2 % (cf. Fig. B3). Since the LUT was calculated for the OPAC continental average aerosol type, the retrieval results might be biased if the actual aerosol type differs. To investigate the sensitivity of the retrieval to different aerosol types, we would ideally compute new LUTs. Since computing a new LUT would require several weeks' computation time on MIM's high-performance computing cluster for each new aerosol type and the radiance at each scattering angle would basically only differ by a multiplicative factor, we repeated the retrieval with a modified LUT to estimate the effect of these approximations. The LUT was modified by multiplication by a factor for each scattering angle, which is representative of the amount and the sign of the bias introduced by the approximations. The multiplicative factor for each scattering angle in the LUT, which we refer to as “slope” in the following, was computed by the ratio between two radiance distributions simulated with DISORT: one “reference” radiance distribution using the continental average aerosol type and one “modified” radiance distribution for each of the aerosol types: continental clean, continental polluted, and urban. In addition, a slope was generated by computing the ratio between a “reference” radiance distribution accounting for HaloCamRAW's full spectral response (cf. the solid red line in Fig. B3) and a “modified” radiance distribution based on HaloCamRAW's representative wavelength of 618 nm for the red channel (cf. the dashed red line in Fig. B3). These slopes were computed for each of the eight ice crystal habits assuming a representative atmospheric setup: COT = 0.8, AOT = 0.1, and SCFs of 30 % for columnar crystals, 60 % for hollow column crystals, and 70 % for plate-like crystals.
Table 4Best match habit for the retrieval applied to HaloCamRAW daily observations for the default retrieval (first column) and considering the spectral response (second column), followed by the continental clean, polluted, and urban aerosol types. The habits vary between plates (plate), 5-element plates (5-plate), 10-element plates (10-plate), 8-element columns (8-col), solid columns (sCol), hollow columns (hCol), and solid bullet rosettes (sbRos).
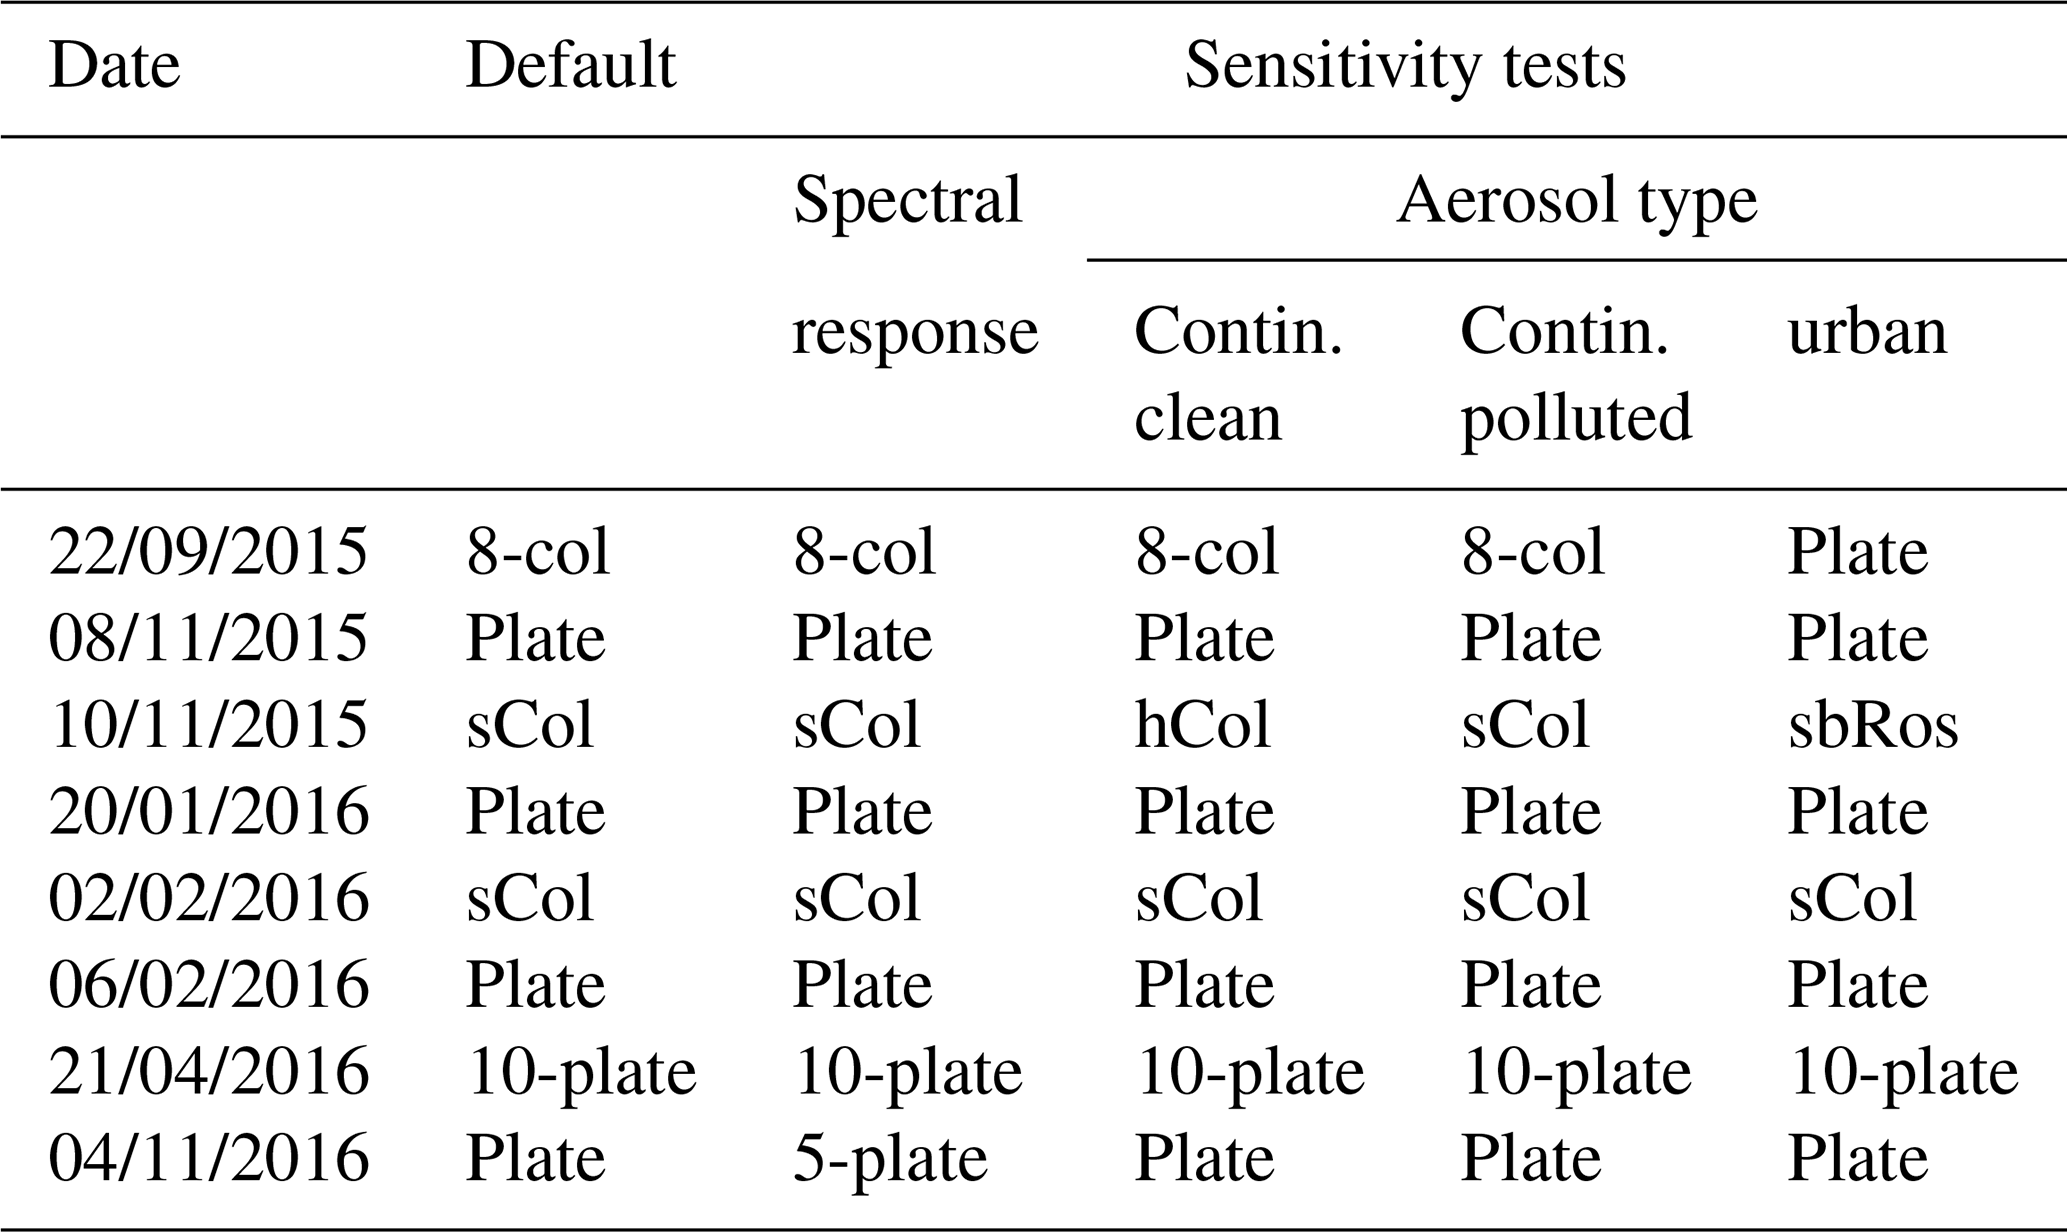
Table 4 shows the results of the best-matching habit for each day retrieved with the modified LUT. The best-matching habit changed slightly for the different modifications of the LUT, but only within the plate-like or column-like crystal groups. The ice crystal plates remain the overall best-matching habit in the considered scattering angle range. The retrieved SCF in Table 3 remained mostly unaffected by using the modified LUT for the retrieval. Only for the urban aerosol case did the retrieved SCF for plates change from (80±10) % to (70±10) %, for 10-element plates from (70±10) % to (80±10) %, and for 5-element plates from (70±20) % to (60±20) %. Another uncertainty for cloud base temperatures higher than −38∘ C might be the presence of supercooled water droplets, which act similarly to rough ice crystals in diminishing the 22∘ halo, as discussed in Appendix B. However, Fig. B2 showed that the presence of water droplets has only a small effect on the retrieved SCF.
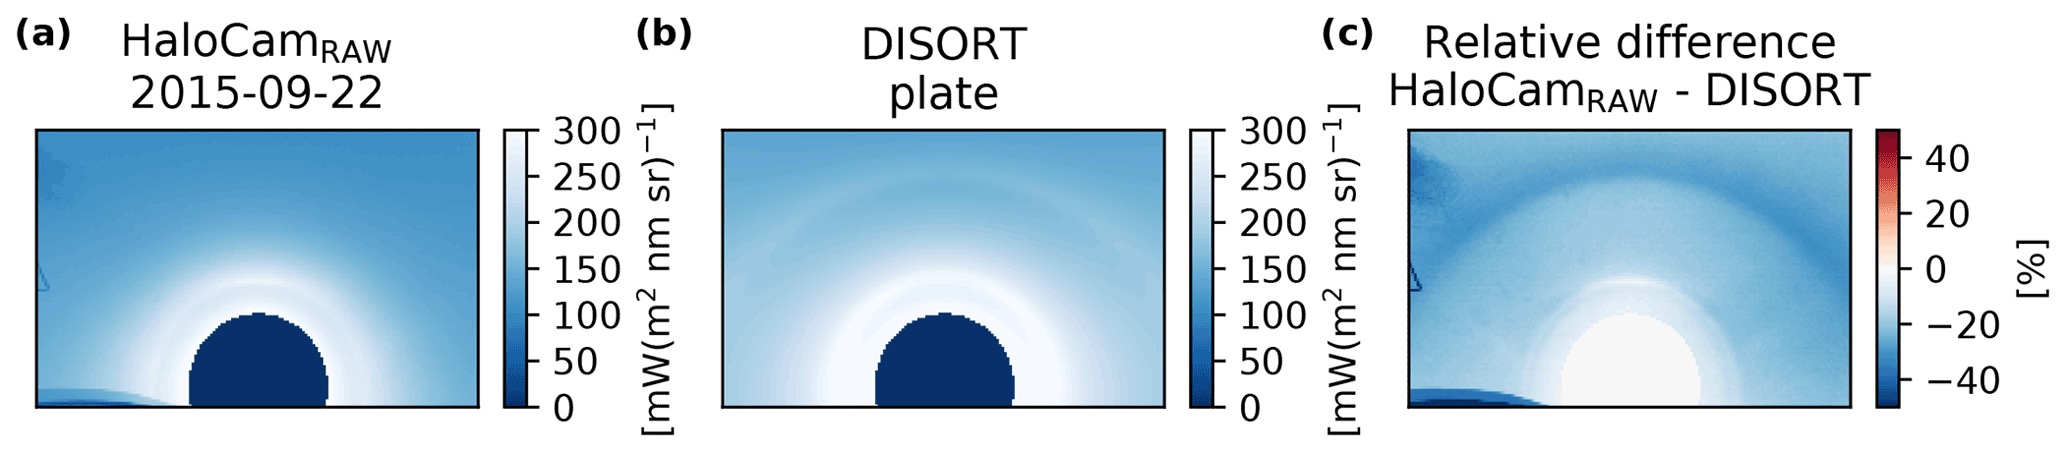
Figure 8(a) HaloCamRAW R-channel radiance averaged over all 22∘ halo images for 22 September 2015. (b) DISORT simulations for the best-matching ice crystal and cirrus properties in the 22∘ halo region, without taking into account information about the 46∘ halo region. (c) Relative difference between HaloCamRAW-averaged radiances and the simulated DISORT radiances.
3.2 Adding information about the 46∘ halo
The presence or absence of the 46∘ halo adds important information about the ice crystal shape and surface roughness. In a second step we use this information to find the ice crystal shape, which is representative for the whole scene, i.e., the scattering angle range for both the 22 and 46∘ halos. While the 22∘ halo provides the most pronounced signal and is therefore used for the quantitative retrieval of ice crystal properties, the signal of the 46∘ halo is much fainter and is subject to inhomogeneities in the cirrus. To analyze this scattering angle region, we therefore use HaloCamRAW observations averaged over each day and make use of the presence or absence of the 46∘ halo in a qualitative way to further constrain the retrieved ice crystal properties from Sect. 3.1. We focused this analysis on 6 of 8 d, for which the number of halo samples was high and the horizontal extent of the cirrus cloud was large enough to yield homogeneous conditions across both the 22 and 46∘ halo regions in the averaged image. If ice crystals in the cirrus cloud were able to form a 46∘ halo, we would expect to see it in the averaged image. Figure 8 displays the averaged HaloCamRAW measurements for 22 September 2015 (a) in comparison with DISORT simulations (b) using ice crystal plates, which were found to best match the observations in the region of the 22∘ halo (cf. Table 3). Figure 8c shows the relative difference between measured and synthetic images in percent. Apparently, the averaged HaloCamRAW image does not show any 46∘ halo, whereas the optical properties of plates produce a pronounced 46∘ halo in addition to the 22∘ halo in the simulated DISORT image. This can be observed for all evaluated days and is presented here for 22 September 2015 as an example. Comparing the retrieval results for all eight habits revealed that 8-element columns best match the whole scene of the HaloCamRAW images – both in the scattering angle range of the 22 and 46∘ halos. The results using the overall best-matching habit of 8-element columns for the DISORT simulations are displayed in Fig. 9, which shows the averaged HaloCamRAW images (left) in comparison with synthetic images simulated with DISORT (center) and their relative difference (right). This analysis demonstrates that the scattering angle range around the 46∘ halo provides further valuable information for the retrieval of ice crystal optical properties. Figure 2 illustrates why the absence of the 46∘ halo indicates columnar crystals rather than plates to best match the observed cirrus. For the selected LUT elements, a 22 or 46∘ halo would be visible for HR>1, i.e., SCF–reff combinations with HR values above the white contour. In the case of ice crystal plates, the majority of SCF–reff combinations, which produce a visible 22∘ halo (upper panel), will be accompanied by a visible 46∘ halo (lower panel). In fact, for the retrieved SCF–reff combinations, plates would produce a pronounced 46∘ halo and thus do not match the observations.
As mentioned above, applying the retrieval to HaloCamRAW observations, which were averaged over a whole day, yields only qualitative results that help us confirm which ice crystal shape best matches the region of both the 22 and 46∘ halos. Since it does not allow for the retrieved cirrus and aerosol optical thickness to follow their natural temporal fluctuation, the retrieved smooth crystal fraction and ice crystal radius might become biased1. We therefore repeated the quantitative retrieval as described in Sect. 3.1 for the individual HaloCamRAW images but this time excluding all LUT elements with a 46∘ halo, corresponding to a halo ratio >1 (cf. Fig. 2). The results of the SCF, effective radius, and asymmetry factor, averaged over all habits, did not change significantly. In this case, the best-matching habit (with the overall smallest RMSE) in the scattering angle region between is the 8-element column followed by a solid column. For the whole scene of the HaloCamRAW images, 8-element columns also proved to slightly better represent the observations than solid columns. In YG13's definition, 8-element columns are aggregates of eight individual solid columns, each with a slightly different aspect ratio (AR). Since optical properties of aggregates are very similar to those of their individual components, a slight variation of ARs (either as single particles or aggregates) apparently better matches realistic ice crystal populations in cirrus clouds.
Ice crystal plates proved to match the observations only for larger effective radii of about 50 µm on average. A possible explanation is the relationship between ice crystal AR and size for the YG13 optical properties: small ice crystal plates have ARs of ≈1, which are effective for the formation of 46∘ halos (van Diedenhoven, 2014), since the ray paths responsible for the 46 and 22∘ halos are both equally likely. Since the overall mean effective radius for all habits except for plates did not change significantly compared to the results in Fig. 6, the size–AR parameterization of the plate habit does not seem to represent the observations well. It is important to highlight that the sundogs visible on 8 November 2015 and 6 February 2016 are a clear indication of the presence of oriented ice crystal plates. Together with the missing 46∘ halo, which is produced by randomly oriented ice crystal plates, this could be explained by either (1) the cirrus cloud consisting of ice crystal plates too large to be randomly oriented and smaller columnar crystals which are randomly oriented and form the 22∘ halo or (2) the ice crystal plates having defects on their basal faces strong enough to inhibit the ray path responsible for the 46∘ halo.
In the following, the results of this study will be further discussed and compared with the literature. Previous studies using passive remote sensing have retrieved quantitative information about ice crystal microphysics, primarily from space. Spaceborne imaging of optically thin clouds over land is challenging since the measured reflectances are very sensitive to the surface albedo. While the BRDF is well known over ocean, it is highly variable over land surfaces. Thus, over land the majority of ice crystal shape and roughness retrievals based on passive remote sensing techniques focus on optically thicker ice clouds. Moreover, spaceborne observations of ice clouds might also include the ice phase of (deep) convection, e.g., anvils of thunderstorms. Ground-based remote sensing of halo displays focuses on rather thin ice clouds instead with a COT smaller than about 5 (Gedzelman and Vollmer, 2008). It should also be kept in mind that the results of this study were obtained from local measurements in Munich, in contrast to the spaceborne observations, which have a global coverage.
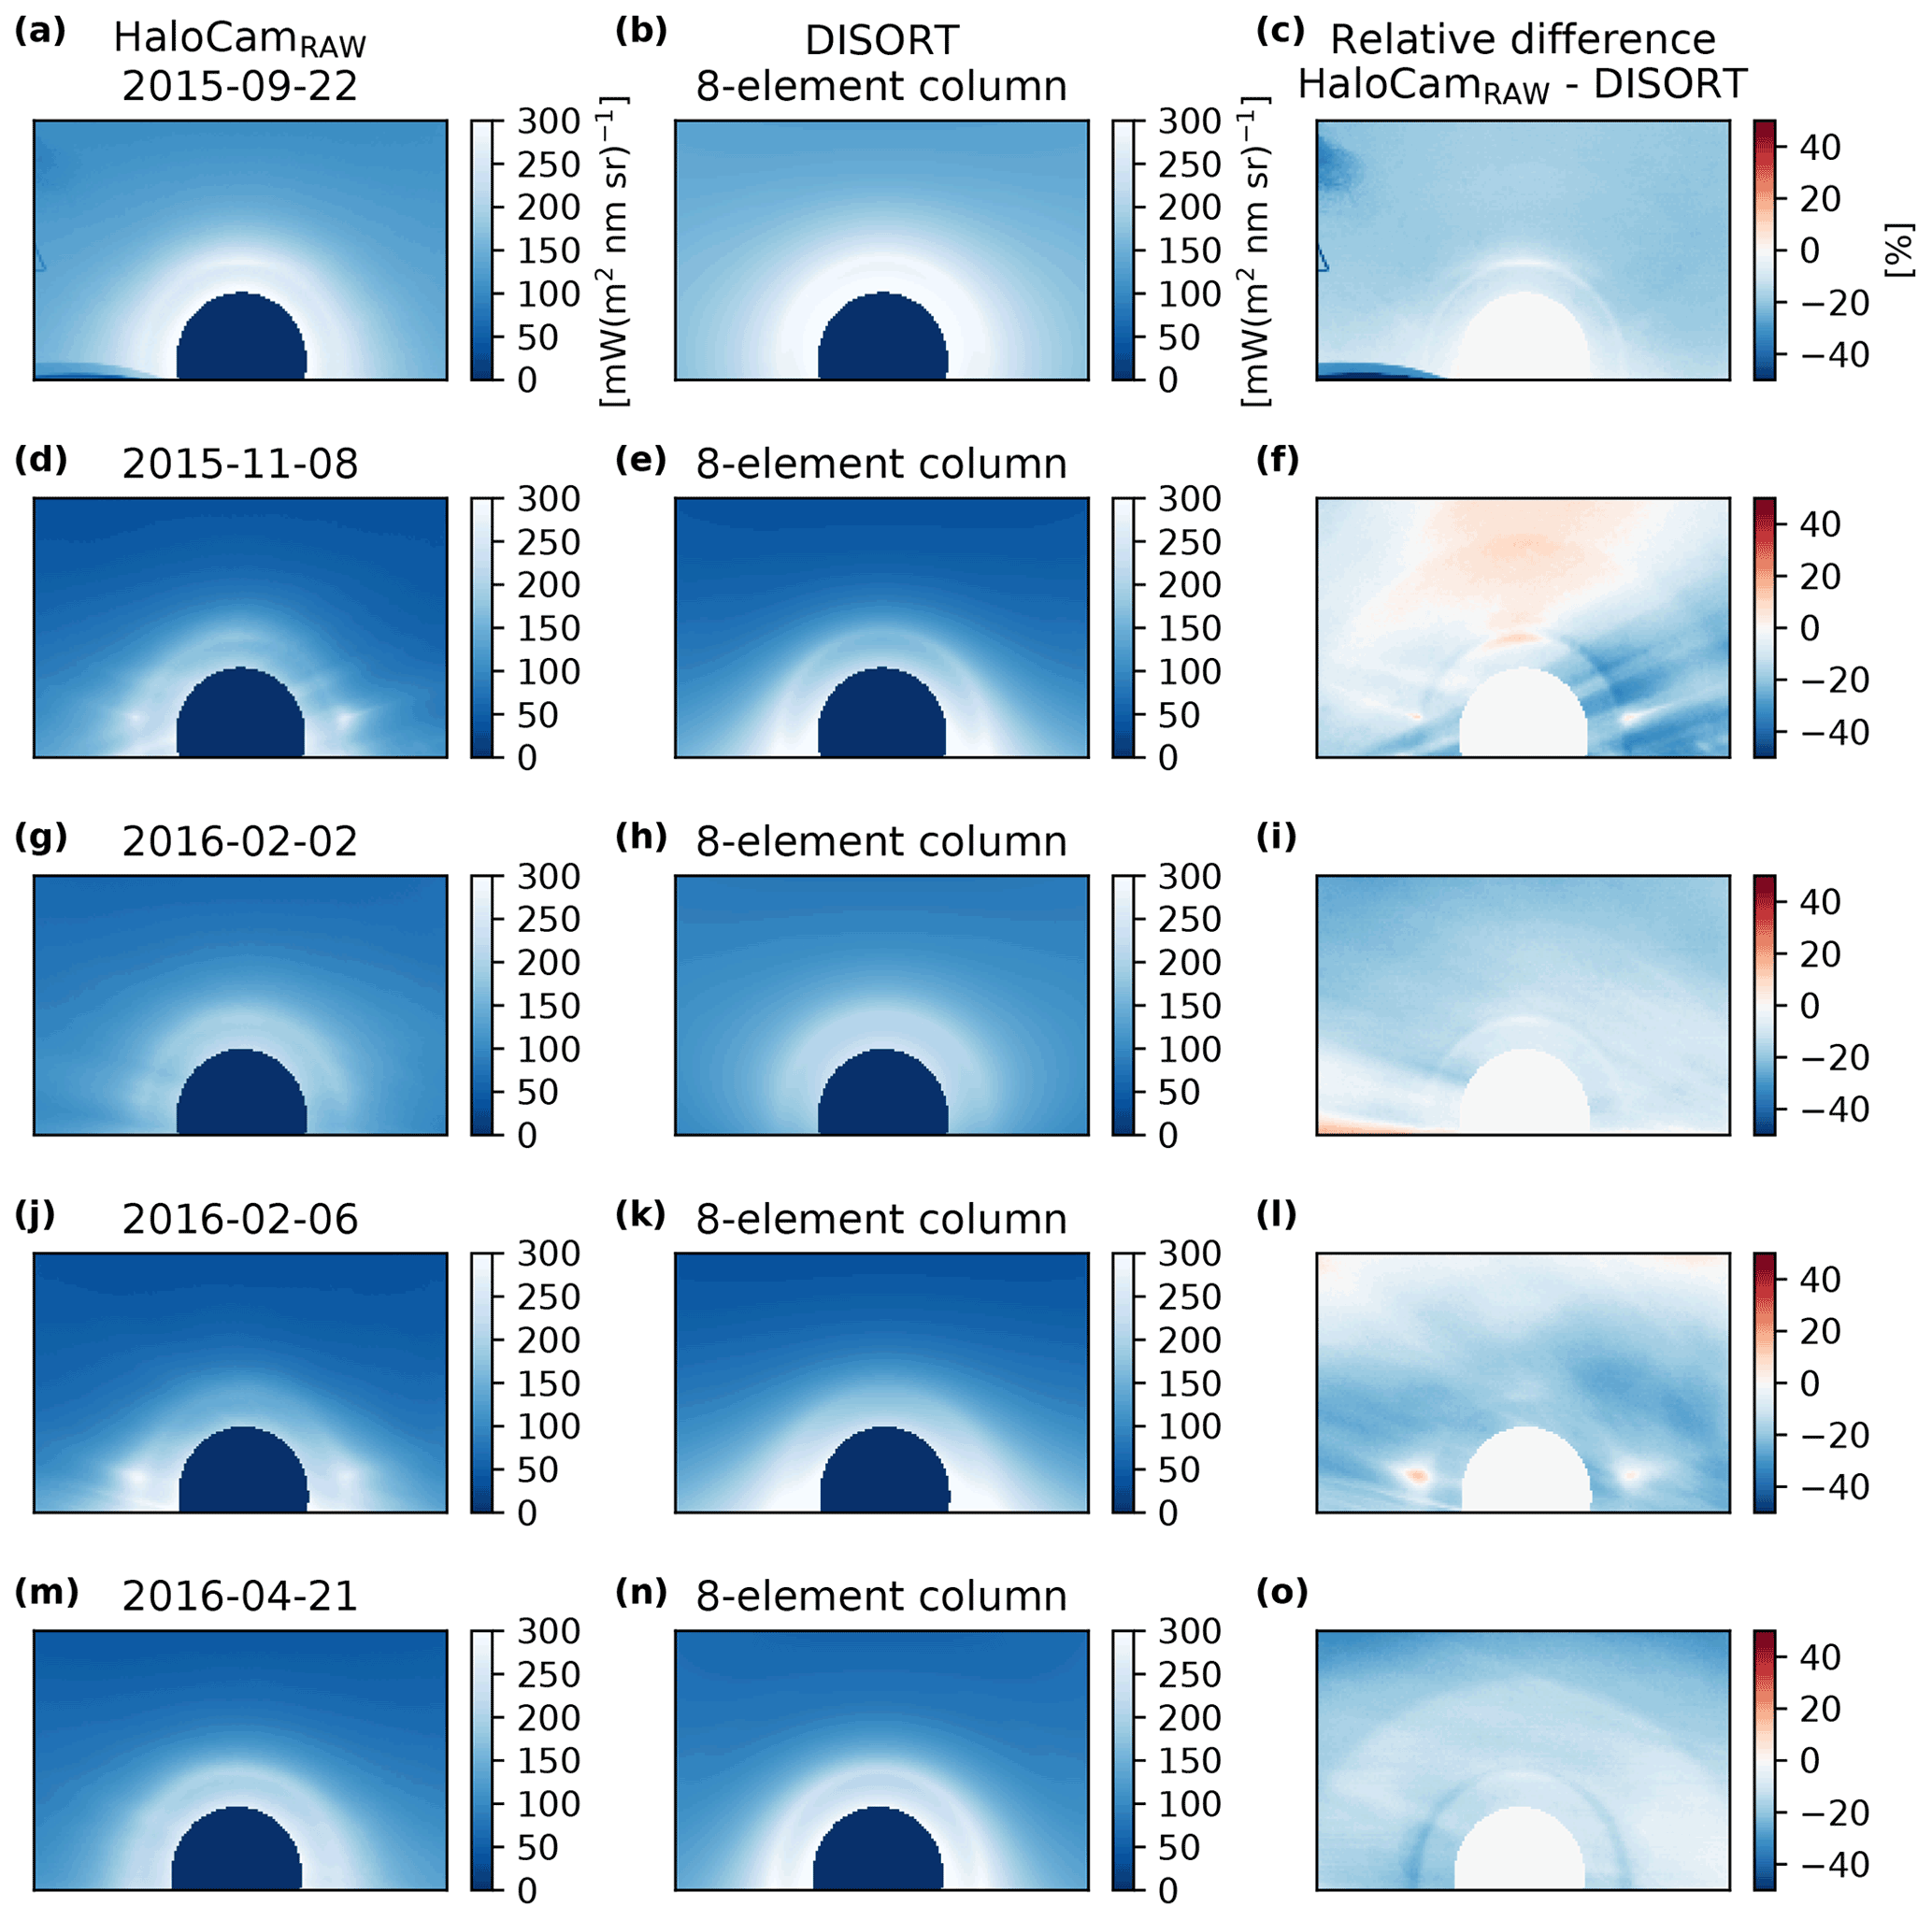
Figure 9Same as Fig. 8, for selected days and 8-element columns, the overall best-matching ice crystal habit for both the 22 and 46∘ halo region.
4.1 Ice crystal shape
This study revealed that the overall best-matching ice crystal habits are 8-element and solid columns with an SCF of (30±20) % and (40±30) % and asymmetry factors at 618 nm between 0.752 and 0.787, respectively. The optical properties of solid columns and aggregates of columns, as YG13's 8-element columns, are very similar. The main difference is that the 8-element column is an aggregate of individual solid columns with different aspect ratios and sizes. The fact that 8-element columns proved to be a slightly better match to the observations than solid columns indicates that a distribution of variable aspect ratios and sizes is more representative of the observed cirrus clouds than a “mono-disperse” ice crystal distribution of solid columns. It is noteworthy that 8-element columns, the overall best-matching ice crystal habit in this work, is the same habit as used in the MODIS Collection 6 (C6) data product for operational retrieval of ice cloud optical thickness and effective radius (Platnick et al., 2017). While the 8-element columns used for MODIS C6 have severely roughened surfaces to achieve consistency with spectral and polarimetric satellite observations (Baran, 2009; Wang et al., 2018), the results of this study suggest a fraction of about 30 % smooth crystals and 70 % severely roughened crystals to account for the presence of halo displays.
Ice crystal columns and aggregates of columns were also found by Holz et al. (2016), without any smooth crystals however, resulting in an asymmetry factor of about 0.75 in the mid-visible spectrum. Also, Wang et al. (2014) retrieved a mixture with a dominating fraction of columnar crystals to best match the MODIS and CALIPSO observations over ocean with an SCF of 10 % and an asymmetry factor of 0.778 at a wavelength of 0.65 µm. These retrievals were performed for COT<3, which is comparable to the optical thickness range observed in this work. Moreover, Wang et al. (2021) found columnar crystals to be the most representative ice particle shape using both total and polarized airborne reflectance measurements from AirMSPI for cirrus clouds of optical thicknesses up to 5.
Several other studies found plate-like or compact ice crystals to better represent the observations than columns, for example, McFarlane and Marchand (2008), van Diedenhoven et al. (2012), van Diedenhoven et al. (2013), and Cole et al. (2014). However, these studies focus on optically thick ice clouds, in particular anvil cirrus, with potentially very different formation mechanisms compared to thin halo-producing ice clouds. Um et al. (2015) studied aspect ratios of natural ice crystals, which were collected during field campaigns by a cloud particle imager for temperatures between 0 and −87∘ C, and found that synoptic cirrus is dominated by columnar crystals, while anvil cirrus contains a larger fraction of plate-like crystals. All evaluated HaloCamRAW observations showed synoptic cirrus or contrail cirrus and did not contain any anvil cirrus. Columnar ice crystals were found to best match these HaloCamRAW observations, which is in agreement with the findings of Um et al. (2015).
Ice crystal plates of the YG13 database produce a pronounced 46∘ halo for the retrieved effective radii which was not visible in the HaloCamRAW observations. YG13 assumes that the ice crystal aspect ratio is coupled with crystal size and that crystal top/base faces grow more quickly than their side faces starting from a cubic shape (aspect ratio 1). For this parameterization, smaller crystals with aspect ratios closer to 1 produce more pronounced 46∘ halos compared to larger crystals. A possible explanation for why YG13 plates match the HaloCamRAW observations in the 22∘ halo region but not the 46∘ halo region could be that this parameterization does not represent the observed ice crystal shape: the observed crystals could have larger top/base faces for smaller crystal sizes. Another reason for the missing 46∘ halo could be that crystal base and top faces have defects strong enough to inhibit the ray path responsible for the formation of this halo type. These defects have been commonly observed in laboratory as well as in situ observations (e.g., Ulanowski et al., 2014) and are not represented in the YG13 database. While YG13's hollow column crystal shape mimics these defects by a cavity at its top and base faces, they appear to be too pronounced to match the HaloCamRAW observations since they introduce a new intensity peak at around 18∘ scattering angle, which is not visible in the observations (Forster et al., 2020, Fig. 13). Optical properties ideally suited for this study would allow choosing of ice crystal size independent of the aspect ratio while still taking into account physical optics effects.
4.2 Ice crystal roughness
As shown in Forster et al. (2017), long-term HaloCam observations in Munich revealed that about 25 % of the cirrus clouds produced a 22∘ halo. This fraction would be slightly larger when considering other halo types, such as sundogs and upper tangent arcs as well: a visual evaluation of the 6-week HaloCam dataset during the ACCEPT campaign resulted in about 27 % halo-producing cirrus clouds, accounting for all three halo types. The remaining ∼73 % of cirrus clouds could either be too opaque (optical thickness >5) for the 22∘ halo to be visible or contain predominantly rough or complex ice crystals.
The results of the present study focus on cirrus clouds that produce a visible 22∘ halo. Averaged over all 4400 images, the SCF for columnar, hollow, and plate-shaped crystals amounts to about ∼37 %, ∼47 %, and ∼73 %. Based on the study by van Diedenhoven (2014), a minimum fraction of smooth crystals of 10 % in the case of columns or 40 % in the case of plates can be estimated for the halo-producing cirrus clouds if multiple scattering and scattering by aerosol are neglected. The retrieved fractions in this study taking into account aerosol and cirrus optical thickness result in an about 27 % (33 %) larger SCF for solid columns (plates).
Our finding that columnar ice crystal shapes best represent the HaloCam observations further implies that the majority of rough ice crystals mixed with a smaller fraction of smooth crystals is sufficient to produce a visible 22∘ halo. Finding predominantly rough and complex ice crystals to best match the observations is in agreement with the results of several studies based on satellite retrievals. Using multi-angle reflectance measurements, Baran et al. (1998, 1999) and McFarlane and Marchand (2008) found polycrystals and complex crystals to better represent the observations than pristine single crystals. Studies based on multi-angular polarized reflectances from POLDER also report that featureless phase functions, which correspond to roughened or complex crystals, better represent the measurements than phase functions of a single ice crystal habit (Descloitres et al., 1998; Chepfer et al., 2001; Baran et al., 2001; Baran and Labonnote, 2006; Sun et al., 2006; Yang et al., 2018). Holz et al. (2016) and Wang et al. (2014) confirmed that rough and complex crystals better match the observations than smooth single crystals for optically thin clouds (COT<3) using retrievals based on lidar observations and reflectances in the infrared spectrum.
4.3 Ice crystal size
The retrieved effective radii in this study are, to the best of the authors' knowledge, the first observational results for 22∘ halos and yield similar results for all eight ice crystal habits, with 90 % of the radii being smaller than 40 µm and having a mean value of 20 µm. Several studies (e.g., Mishchenko and Macke, 1999; Fraser, 1979; Garrett et al., 2007) investigated the size range in which ice crystals produce a 22∘ halo based on theoretical and analytical considerations for single crystals. A lower boundary for ice crystal maximum dimensions of about 10 µm was found based on an analysis of the 22 and 46∘ halos in the scattering phase functions of Yang and Liou (1996) and Yang et al. (2000). This lower boundary is in agreement with the results from laboratory studies of Sassen and Liou (1979). Another criterion for the formation of 22 and 46∘ halos is random orientation. This occurs for compact ice crystals with maximum dimensions smaller than about 100 µm. Ambiguities might occur since aggregated ice crystals such as bullet rosettes can be oriented, while their components are randomly oriented relative to each other (Fraser, 1979; Sassen et al., 1994; Tape, 1994). Another indication of this upper size limit is the finding of Macke et al. (1996), who report that air bubbles develop in larger ice crystals, which cause the 22∘ halo to fade. Furthermore, Bailey and Hallett (2002) state that pristine shapes are mostly found in the laboratory for maximum dimensions smaller than about 100 µm. Um and McFarquhar (2015) 2 determined minimum size parameters for the formation of 22∘ halos as a function of the AR, resulting in size parameters χ=45 for compact particles (AR=1), χ=103 for plates with AR=0.1, and χ=182 for columns with AR=4. The 46∘ halo forms starting from size parameters of χ=68 for plates (AR=0.5), χ=45 for compact crystals, and χ=223 for columns (AR=2). Unfortunately, these results are difficult to compare to our findings since the effective radius is defined for an ensemble of crystals accounting for different shapes, whereas ice crystal maximum dimension and size parameter are defined for single particles. However, global observations of ice cloud effective radii are available from MODIS Collection 6 (Yi et al., 2017), which range between 30 and 35 µm over land at the northern mid-latitudes. These values are slightly larger than the mean effective radius of about 20 µm we retrieved for ice crystals producing a 22∘ halo.
The retrieved ice crystal size, shape, and surface roughness depend on assumptions about the underlying particle distribution. Although ice crystals in cirrus clouds are more likely described by multimodal size and shape distributions with different degrees of surface roughness and matching ice crystal properties could be found for mixtures of arbitrary complexity, this study aims at finding the simplest ice crystal model with the minimum degrees of freedom that matches the observations within the measurement uncertainty.
We present a novel imaging remote sensing method to retrieve ice crystal optical and microphysical properties, with a special focus on ice crystal roughness and shape. Using calibrated RGB images of the automated Sun-tracking camera system HaloCam, we exploit the scattering features of the 22 and 46∘ halos which are formed by randomly oriented hexagonal ice crystals. It can be concluded that the brightness contrast and width of the 22 and 46∘ halos contain valuable information about ice crystal size, shape, and surface roughness. This retrieval compares measured radiance distributions with lookup tables of radiative transfer simulations, which were calculated for a range of ice crystal optical properties using the database of Yang et al. (2013) (YG13) and the DISORT radiative transfer solver. The YG13 database provides ice crystal optical properties for nine different habits, different sizes, and three levels of surface roughness (smooth, moderately roughened, severely roughened). To achieve continuous roughness levels, the optical properties of smooth and severely roughened ice crystals of a specific habit were mixed linearly with smooth crystal fractions (SCFs) ranging from 0 % to 100 %. Sensitivity tests showed that if the retrieval is applied to uncalibrated measurements with unknown radiometric response, the retrieved SCF can deviate by up to 70 % from the true value. If the uncertainty of the radiometric response is smaller than 15 %, the error in the retrieved SCF is smaller than about 15 %. A reasonable absolute radiometric calibration is therefore required to retrieve quantitative results of the ice crystal properties.
Long-term observations of ice crystal optical and microphysical properties were performed using HaloCamRAW. This camera provides the “raw” signal directly from the sensor and was geometrically and radiometrically calibrated as described in Forster et al. (2020). For the retrieval, the red channel was used with an absolute radiometric uncertainty of less than 5 %. The machine-learning-based image classification algorithm HaloForest (Forster et al., 2017) was used to select HaloCam images with a visible 22∘ halo. For 8 d in total, 22∘ halo observations with simultaneous Sun photometer measurements were available which are used to constrain both cirrus and aerosol optical thickness. The retrieval was applied to a total of 4400 HaloCamRAW images, and the best-matching ice crystal properties were analyzed.
It was found that several ice crystal habits and SCFs match the observations within the averaged measurement error in the scattering angle region around the 22∘ halo. Plate-like crystals with a large SCF and columnar crystals with a small SCF could reproduce the same 22∘ halo within the measurement uncertainty. Averaged over all 4400 images, the SCF for columnar, hollow, and plate-shaped crystals amounts to about ∼37 %, ∼47 %, and ∼73 %. Although ice crystal plates best match the observations in the angular region of the 22∘ halo, the YG13 optical properties exhibit a pronounced 46∘ halo for effective radii smaller than about 50 µm, which is not visible in the evaluated HaloCam images. Filtering the LUT for elements without a 46∘ halo yields 8-element aggregates of columns as the best-matching ice crystal habit, with an average SCF of (30±20) %, an average effective radius of (22.6±24.5) µm, and an asymmetry factor of 0.752±0.001. This result is in agreement with satellite-based retrievals for optically thin cirrus which also find aggregates of columns to be the best-matching ice crystal habit (Wang et al., 2014; Holz et al., 2016).
The variation of the retrieved effective radii between the ice crystal habits is much smaller compared to the variation of the SCF and yields an overall mean of about 20 µm. The underlying distribution of the retrieved effective radii is skewed towards smaller values, with more than 90 % of the radii being smaller than 40 µm. Relating the retrieved ice crystal effective radii to the temperature of cloud base and top revealed that the smallest crystals were retrieved for the coldest and thinnest cirrus. This tendency to find the smallest crystals at the coldest cloud temperatures close to cloud top is in agreement with in situ observations (Baran, 2012).
This study highlights the potential and feasibility of a completely automated method to collect and evaluate halo observations. Long-term calibrated radiance observations of the 22 and 46∘ halo scattering angle range together with Sun photometer measurements allow the retrieval of ice crystal shape, size, and surface roughness, representative of cirrus clouds. Long-term observations in Munich indicate that about 25 % of the cirrus clouds contained about (50±30) % smooth ice crystals with effective radii of about (20±10) µm regardless of their shape. Accounting for the missing 46∘ halo in the HaloCam observations, 8-element aggregates of columns reproduced best the measured radiance distributions across the 22∘ halo. As a next step, the retrieval should be applied to all available HaloCamRAW observations to date. Filtered for cirrus clouds by using the institute's CLOUDNET product (Illingworth et al., 2007), the retrieval results allow us to determine ice crystal habit, SCF, and effective radius representative of cirrus clouds in general – including both halo- and non-halo-producing cirrus.
These observations contribute to an improved understanding of ice crystal optical and microphysical properties. Implemented on different sites, HaloCam in combination with HaloForest can provide a consistent dataset for climatological studies of ice crystal properties representing optically thin ice clouds, for example, anvil cirrus of deep convection in the tropics or cirrus clouds and diamond dust in high-latitude regions. Representative ice crystal optical properties are required for remote sensing of cirrus clouds as well as climate modeling. To the best of the authors' knowledge, this study presents the first quantitative retrieval for ice crystal shape and surface roughness using ground-based imaging observations of halo displays. Since ground-based observations provide information about the forward portion of the light scattered by ice crystals, the results of this work ideally complement the results of satellite-based studies.
An important choice for creating the lookup tables used in this study is the radiative transfer model. Since cirrus clouds producing visible 22∘ halos have to be homogeneous across a large scattering angle region (more than 44∘), we assume they are horizontally homogeneous and infinitely extended cloud layers. This assumption allows us to use the one-dimensional radiative transfer solver DISORT (Stamnes et al., 1988), which is considerably faster for computing radiances compared to MYSTIC, the three-dimensional MYSTIC (Mayer, 2009; Emde et al., 2010). Using MYSTIC as the “physically correct” reference, we tested the performance and accuracy of the DISORT solver to simulate synthetic HaloCam observations of the 22∘ halo. An important tuning parameter for the discrete-ordinate approximation is the number of quadrature angles, also called streams, which must be large enough to correctly sample the 22∘ halo. Figure A1 shows the direct comparison of radiances across the 22∘ halo peak simulated with DISORT (solid curves) and MYSTIC (curves with error bars). Using 16 streams, DISORT agrees well with MYSTIC within the Monte Carlo noise for 105 photons considering a 2σ confidence interval. A second test was performed by taking into account the solar radius instead of assuming a point source (dashed curves with error bars), which also showed negligible differences compared to DISORT within the 2σ error bars. Based on this comparison, we decided to use DISORT with 16 streams to compute the radiances for the lookup tables.
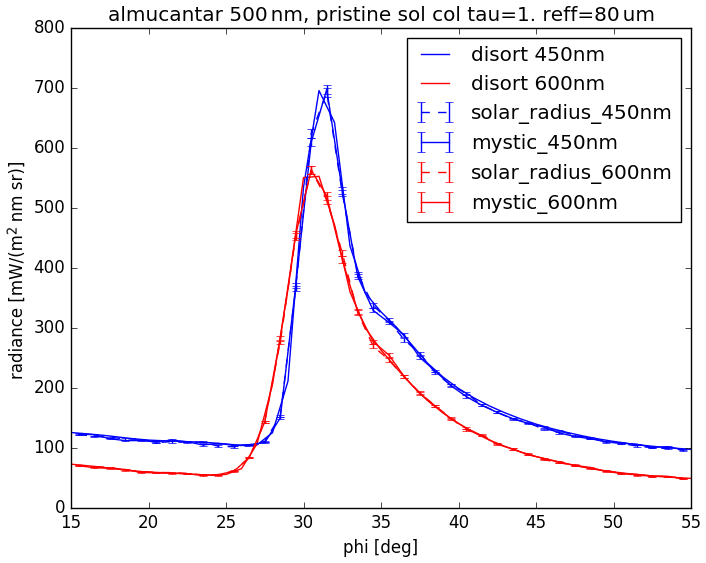
Figure A1Comparison between MYSTIC (lines with error bars) and DISORT (solid lines) for the region of the 22∘ halo for red (600 nm) and blue (450 nm) light. For the MYSTIC simulations, the effect of taking the solar radius into account (dashed lines with error bars) vs. assuming a point source (solid lines with error bars) is shown as well: 105 photons are used for the MYSTIC simulations and 16 streams for DISORT. For all simulations a solar zenith angle of 50∘ is assumed, and the halo slice is computed in the almucantar plane, i.e., with a varying azimuth and a constant solar zenith angle. The ice cloud was defined with an optical thickness of 1 and consists of smooth solid columns with an effective radius of 80 µm.
In the following the sensitivity of the retrieval to the retrieved smooth crystal fraction (SCF) is tested for different scenarios using the YG13 model for the ice crystal optical properties. LUTs assuming slightly different atmospheric or ice cloud parameters are matched against synthetic measurements simulated with DISORT. The tests are performed for the ice crystal habit, AOT, aerosol type, surface albedo, and atmospheric profile. The synthetic measurements were simulated for a wavelength of 500 nm and a solar zenith angle of 45∘ in the almucantar plane. The SCF is varied between 0 and 1 in steps of 0.05, whereas the cirrus optical thickness ranges between 0.1 and 3. The effective radius, which is related to the width of the 22∘ halo, was demonstrated to be independent of multiple scattering effects. Thus, the sensitivity studies presented in this section focus on the SCF with the effective radius treated as a free parameter, ranging from 10 to 90 µm in steps of 10 µm. Unless otherwise stated, ice clouds with different mixtures of smooth and severely roughened solid columns with an aerosol-free atmosphere assuming the US standard atmospheric profile (Anderson et al., 1986) were used for the radiative transfer simulations.
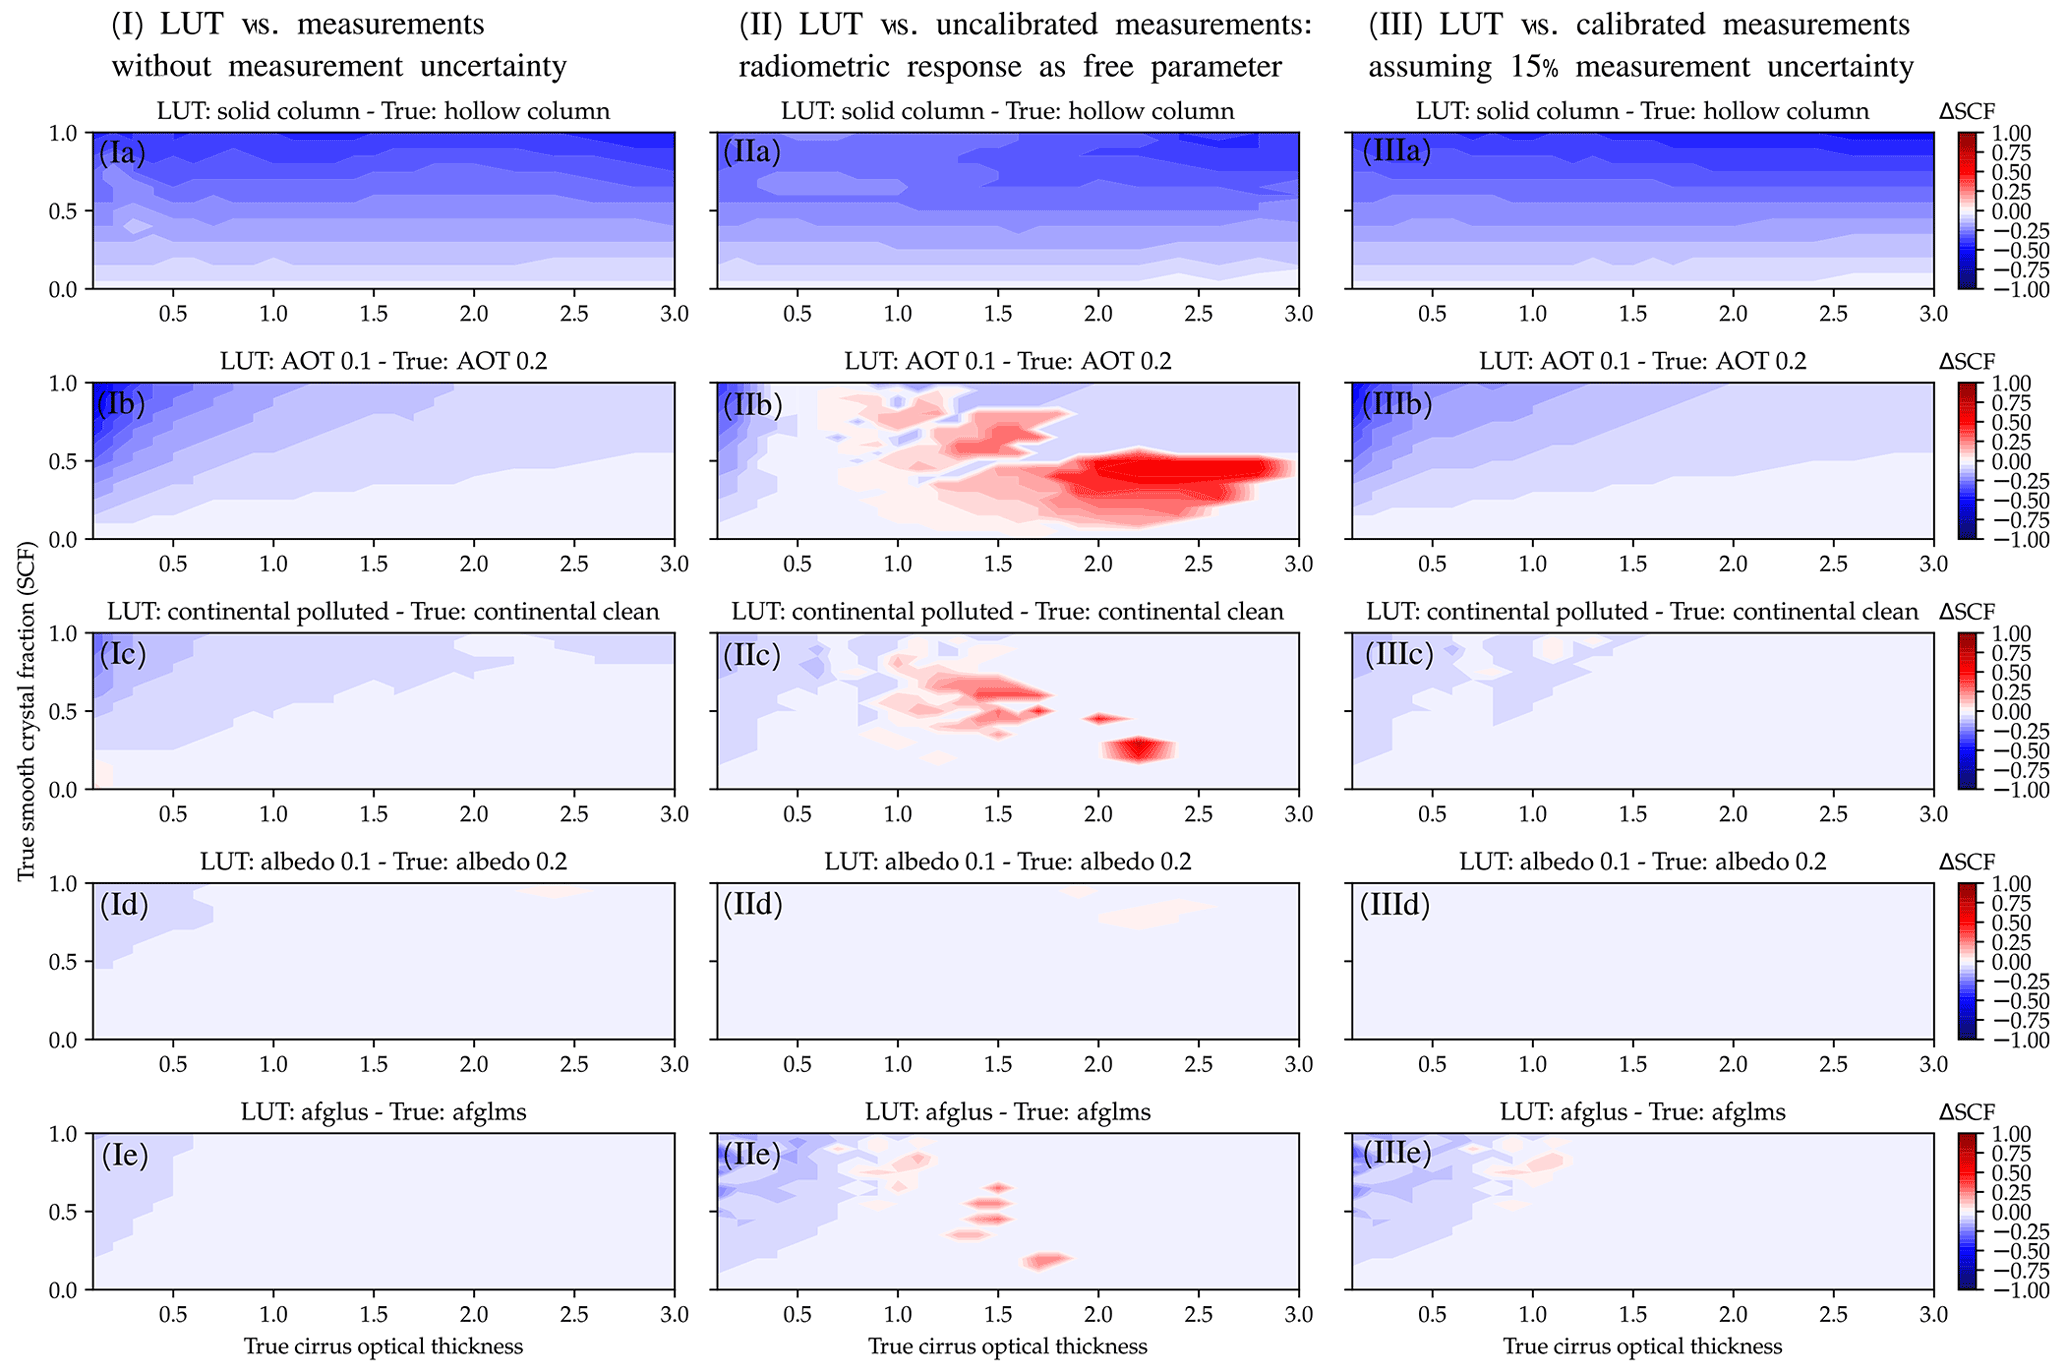
Figure B1Sensitivity of the retrieval regarding five different LUT parameters: (a) ice crystal habit, (b) AOT, (c) aerosol type, (d) surface albedo, and (e) atmospheric profile. Three different scenarios were investigated: (I) assuming “perfect” measurements without calibration uncertainty; (II) assuming uncalibrated measurements by treating the radiometric response as a free scaling parameter during the retrieval; (III) calibrated measurements with an uncertainty of 15 %. To test the sensitivity, a LUT was matched against synthetic measurements simulated with DISORT at a wavelength of 500 nm and an SZA of 45∘ in the almucantar plane. Synthetic measurements for different COTs and SCFs were calculated and are considered “truth”. The LUTs were calculated for slightly different parameter values or parameterizations for the different tests (a–e), while all other LUT parameters were correct. Panels (a)–(e) show contour plots of the difference between the true and retrieved smooth crystal fraction . Blue indicates an underestimation (SCFRetrieved<SCFTrue) and red an overestimation (SCFRetrieved>SCFTrue) of the true SCF.
First, the retrieval error is estimated by applying the retrieval to simulated test cases using LUTs with slight deviations in the assumed atmospheric condition, e.g., surface albedo, AOT, or aerosol type. In order to investigate the stability of the retrieval for different ice clouds, simulations were performed for a range of COTs and SCFs for one ice crystal habit population. The retrieval error is evaluated for the difference between the true and retrieved SCFs defined by
Figure B1Ia demonstrates the effect of assuming a wrong ice crystal shape. All other LUT parameters are correct. The surface albedo is zero, and an aerosol-free atmosphere is assumed. The difference of the retrieved smooth crystal fraction is denoted by ΔSCF. Blue colors indicate an underestimation of the true SCF (SCFRetrieved<SCFTrue), and red colors represent an overestimation of the true SCF (SCFRetrieved>SCFTrue). Calculating the LUT for solid columns and applying it to a cirrus cloud consisting of hollow columns causes a tendency to underestimate the retrieved fraction of smooth ice crystals. This is due to the fact that solid columns produce a brighter halo than hollow columns. Therefore, a smaller fraction of smooth ice crystals is needed in the case of the solid columns to produce an equally bright halo. The error of the retrieved fraction of smooth ice crystals is almost independent of the COT but increases with SCF. A maximum error of occurs for COT=2.8 and SCF=0.8.
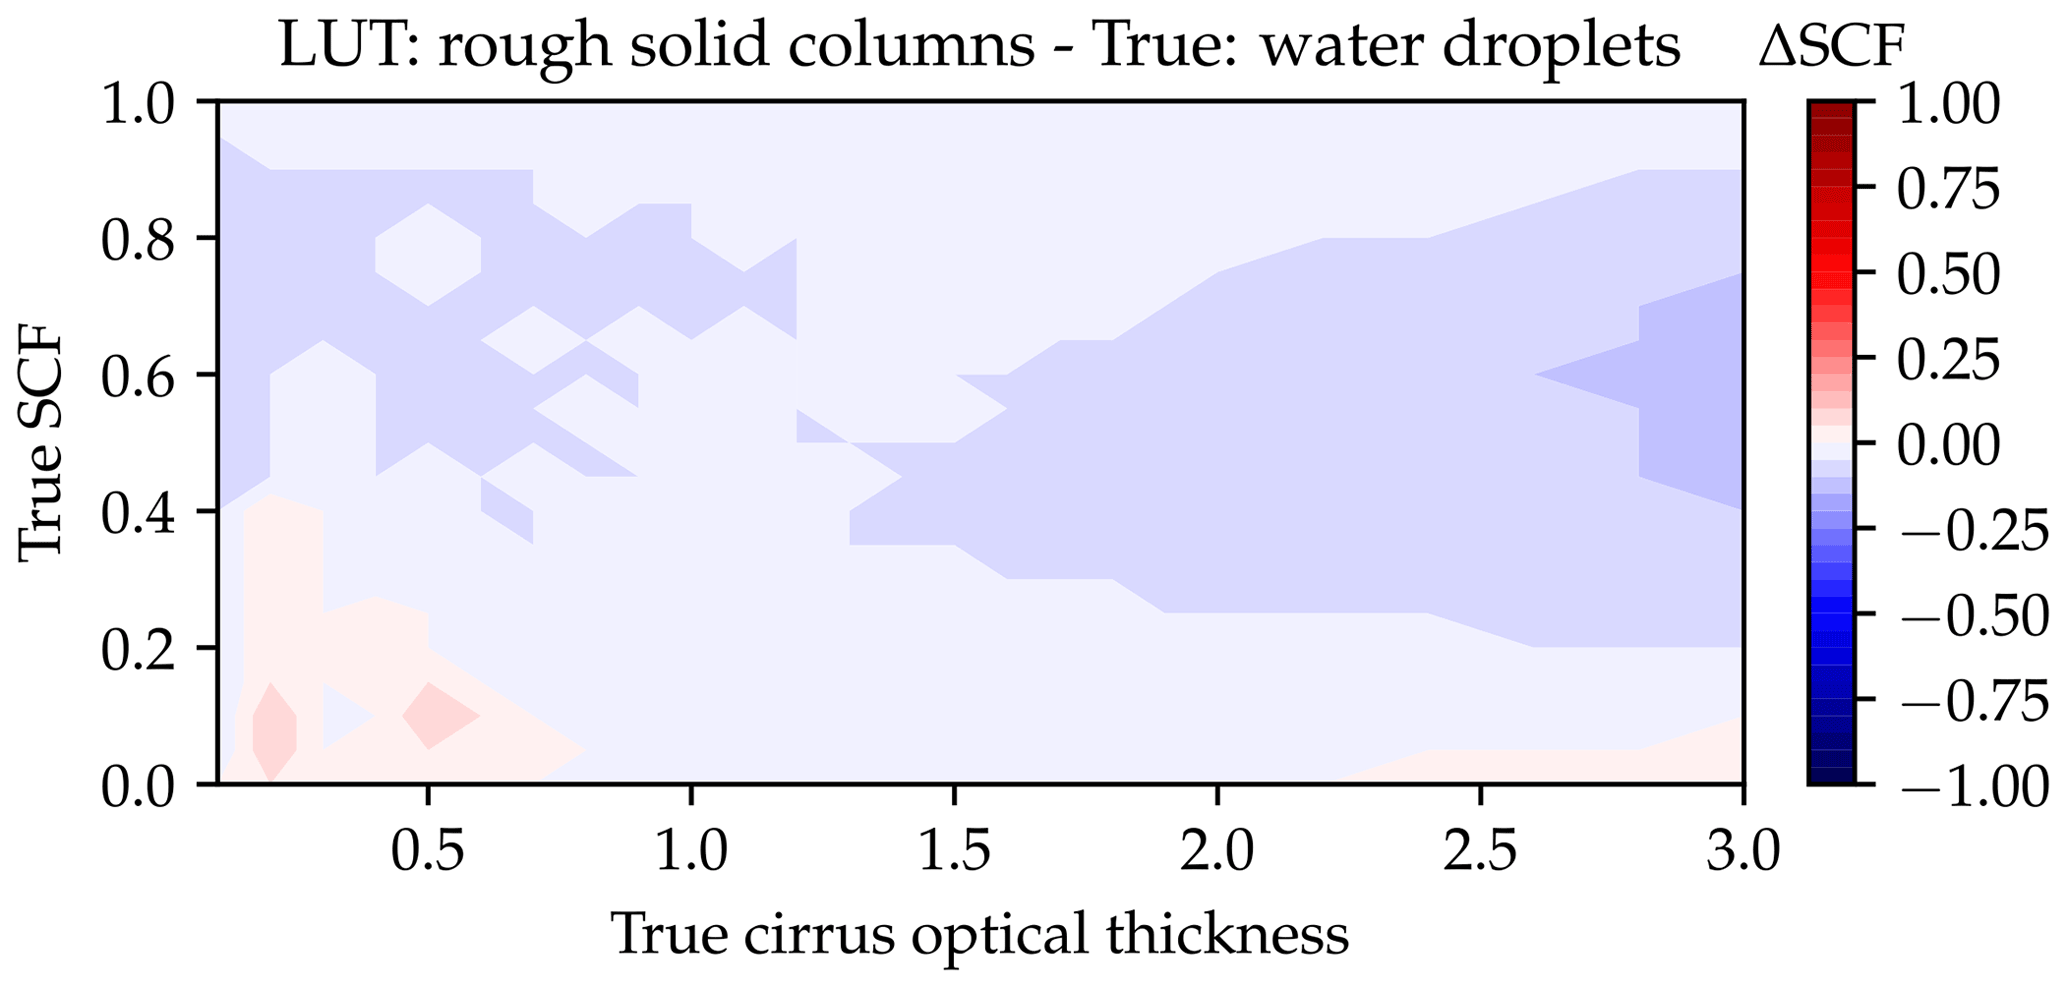
Figure B2Sensitivity studies as in Fig. B1 for measurements assuming mixtures of smooth ice crystal columns with supercooled water droplets.
In Fig. B1Ib, the sensitivity of the retrieved smooth crystal fraction is tested for an error in the assumed AOT. For this test the surface albedo is set to zero and the “continental clean” aerosol mixture from the OPAC library was chosen. Underestimating the AOT leads to an underestimation of the SCF, especially for very small COTs. The 22∘ halo in the LUT is brighter than in the true data due to the lower AOT, especially for low COTs, for which the aerosol scattering features dominate over the halo features. Therefore, a smaller SCF is sufficient to obtain a 22∘ halo of the same brightness contrast as the true halo. When the COT becomes larger than the AOT, the retrieval error tends to decrease. For this test the largest error of the retrieved SCF amounts to for COT=0.1 and SCF=0.9.
A similar but much less pronounced effect occurs for errors in the assumed aerosol type, demonstrated in Fig. B1Ic. For the LUT the “continental polluted” OPAC aerosol optical properties were used whereas the truth is “continental clean” with a constant AOT of 0.2 and surface albedo zero. In this case the SCF is overestimated for very small COTs. The maximum difference between retrieved and true smooth crystal fraction amounts to for COT=0.1 and SCF=0.7. The results of these two sensitivity studies demonstrate that especially for ground-based remote sensing it is crucial to have an accurate representation of aerosol type and optical thickness in the model setup in order to retrieve information about ice cloud optical properties. An error in the assumed surface albedo of 0.1 (Fig. B1Id) has a significantly weaker effect on the retrieved smooth crystal fraction with a maximum error of for COT=0.1 and SCF=0.1. For these simulations an aerosol free atmosphere was assumed.
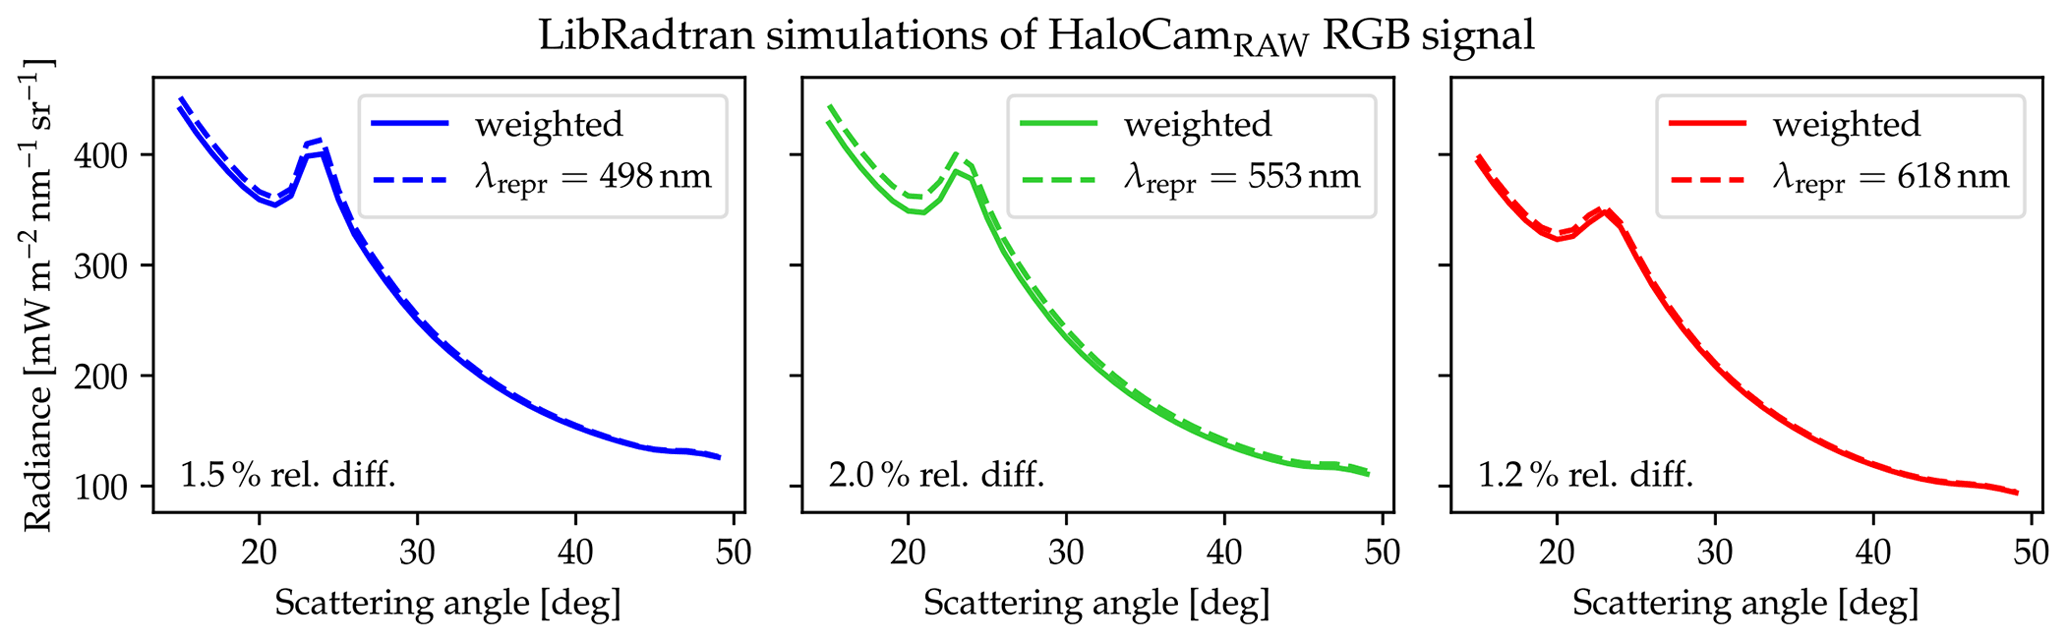
Figure B3Radiative transfer simulations performed with libRadtran for the HaloCamRAW red, green, and blue channels in the principal plane above the Sun with . A cirrus cloud with COT=1 (at a wavelength 550 nm), reff=20 µm, and a mixture of 25 % smooth and 75 % severely roughened solid columns was assumed. The continental average aerosol mixture from OPAC was chosen with AOT=0.1 at 550 nm.
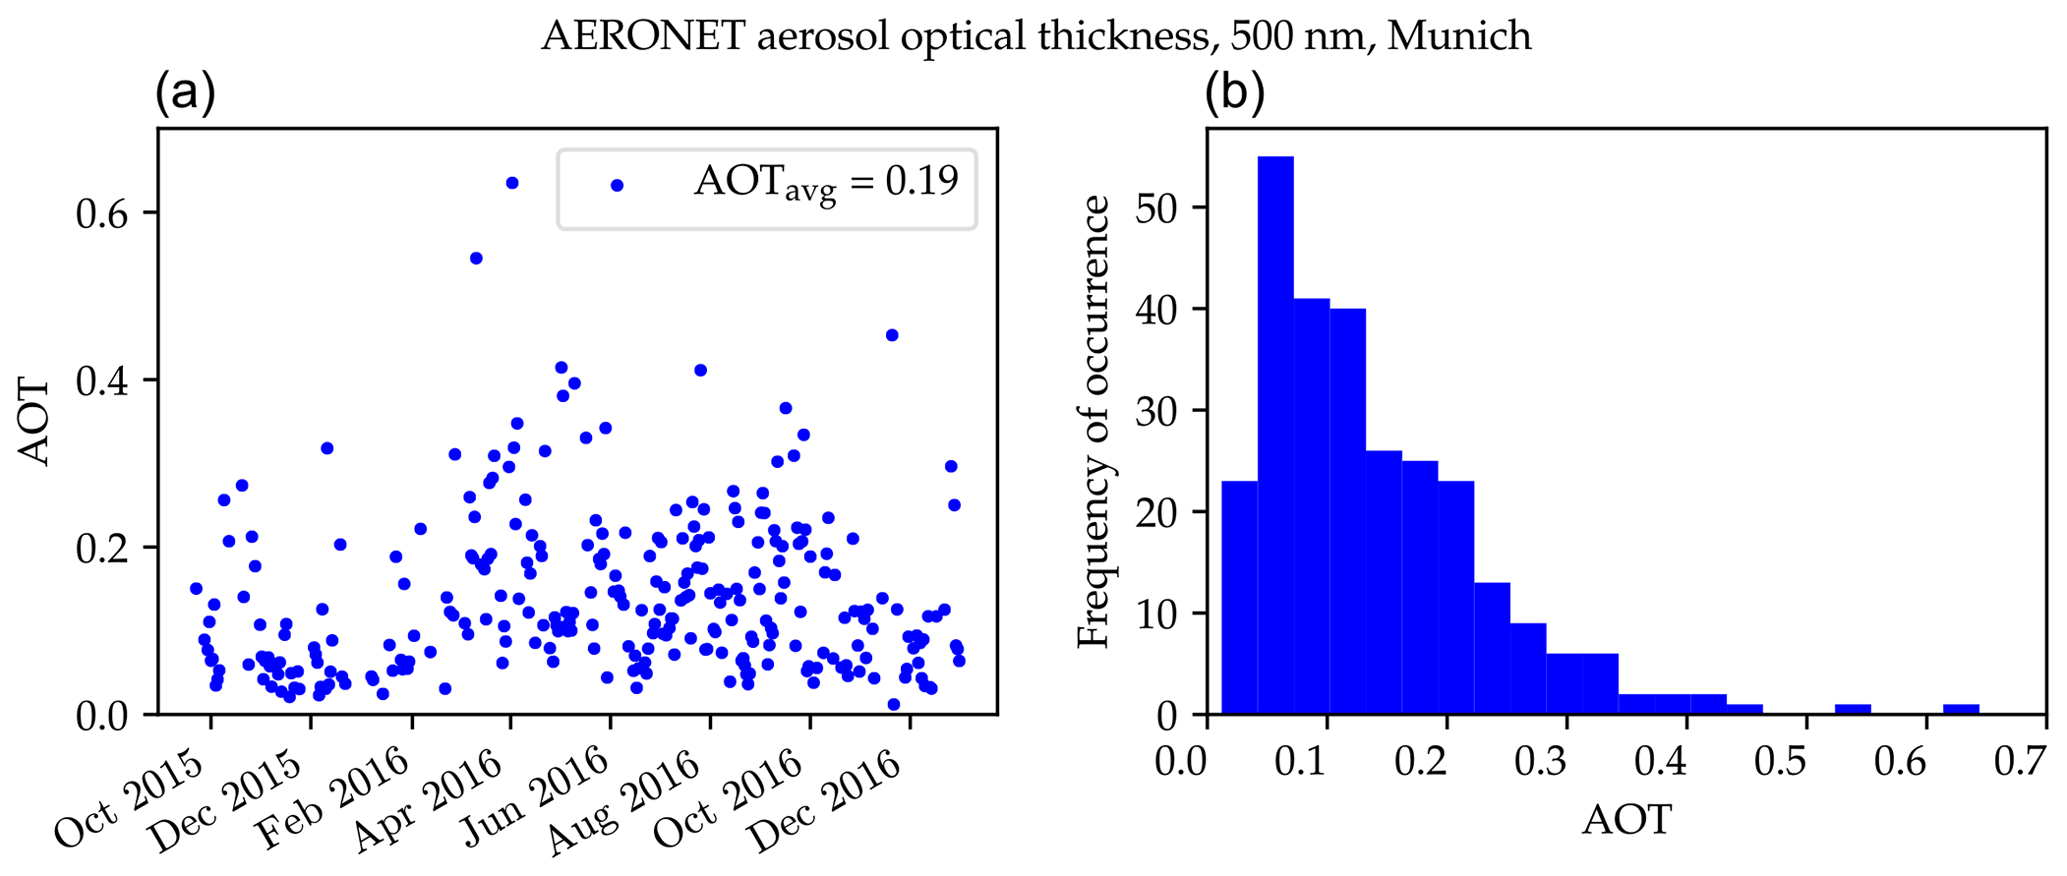
Figure B4AERONET (version 2, level 1.5) AOT at 500 nm wavelength for the period between September 2015 and December 2016 with an average AOT of 0.19 (a). The histogram (b) shows that the most frequent AOTs range between 0 and 0.5 with only 3 % of the values between .
The last sensitivity study shown in Fig. B1Ie investigates the effect of a different atmospheric profile. This results in a slightly different humidity profile, which in turn affects the aerosol optical properties. For this experiment the LUT assumes the US standard atmospheric profile, whereas the true profile is the mid-latitude summer atmosphere with higher relative humidity values in the lower layers (Anderson et al., 1986). The results show that for very thin cirrus there is a small difference between the true and retrieved smooth crystal fractions of for COT=0.1 and SCF=0.8. In general, the introduced error is negligible compared to the errors caused by a wrong representation of the aerosol optical properties.
Figure B1II shows the same sensitivity studies as Fig. B1I but assuming measurements with unknown radiometric response. To retrieve the best match in the LUT, the radiometric response of the measured radiance is a free parameter. The sensitivity test of assuming a wrong ice crystal shape, shown in Fig. B1IIa, yields almost the same results as the study with the calibrated measurements. The underestimation of the SCF is larger for a brighter halo if solid columns are assumed instead of hollow columns, with a maximum error of the retrieved SCF of for COT=2.2 and SCF=0.85. Figure B1IIb shows that uncalibrated measurements can lead to large errors of the SCF ranging from an underestimation of for small COTs to an overestimation of up to ΔSCF=0.55 for COT>1 for an error in the assumed AOT of 0.1. A similar behavior can be observed for the sensitivity test of the aerosol type in Fig. B1IIc, which results in a maximum underestimation of the SCF of for small COTs and an overestimation of the SCF of up to ΔSCF=0.7 for COT=1.5 and SCF=0.5. The tendency to underestimate the retrieved SCF for small COTs and a high SCF remains almost the same as for calibrated measurements. The sensitivity studies of the retrieval of wrong assumptions of the surface albedo (Fig. B1IId is almost negligible, with a maximum error of ΔSCF=0.05 in the retrieved SCF. An error in the assumed atmospheric profile (Fig. B1IIe results in a maximum error of the retrieved SCF between and ΔSCF=0.3 at a COT of 0.1 and 0.9, respectively. This study demonstrates that for uncalibrated measurements the retrieval uncertainties can deviate by up to 70 % in the retrieved SCF from the errors of the calibrated measurements.
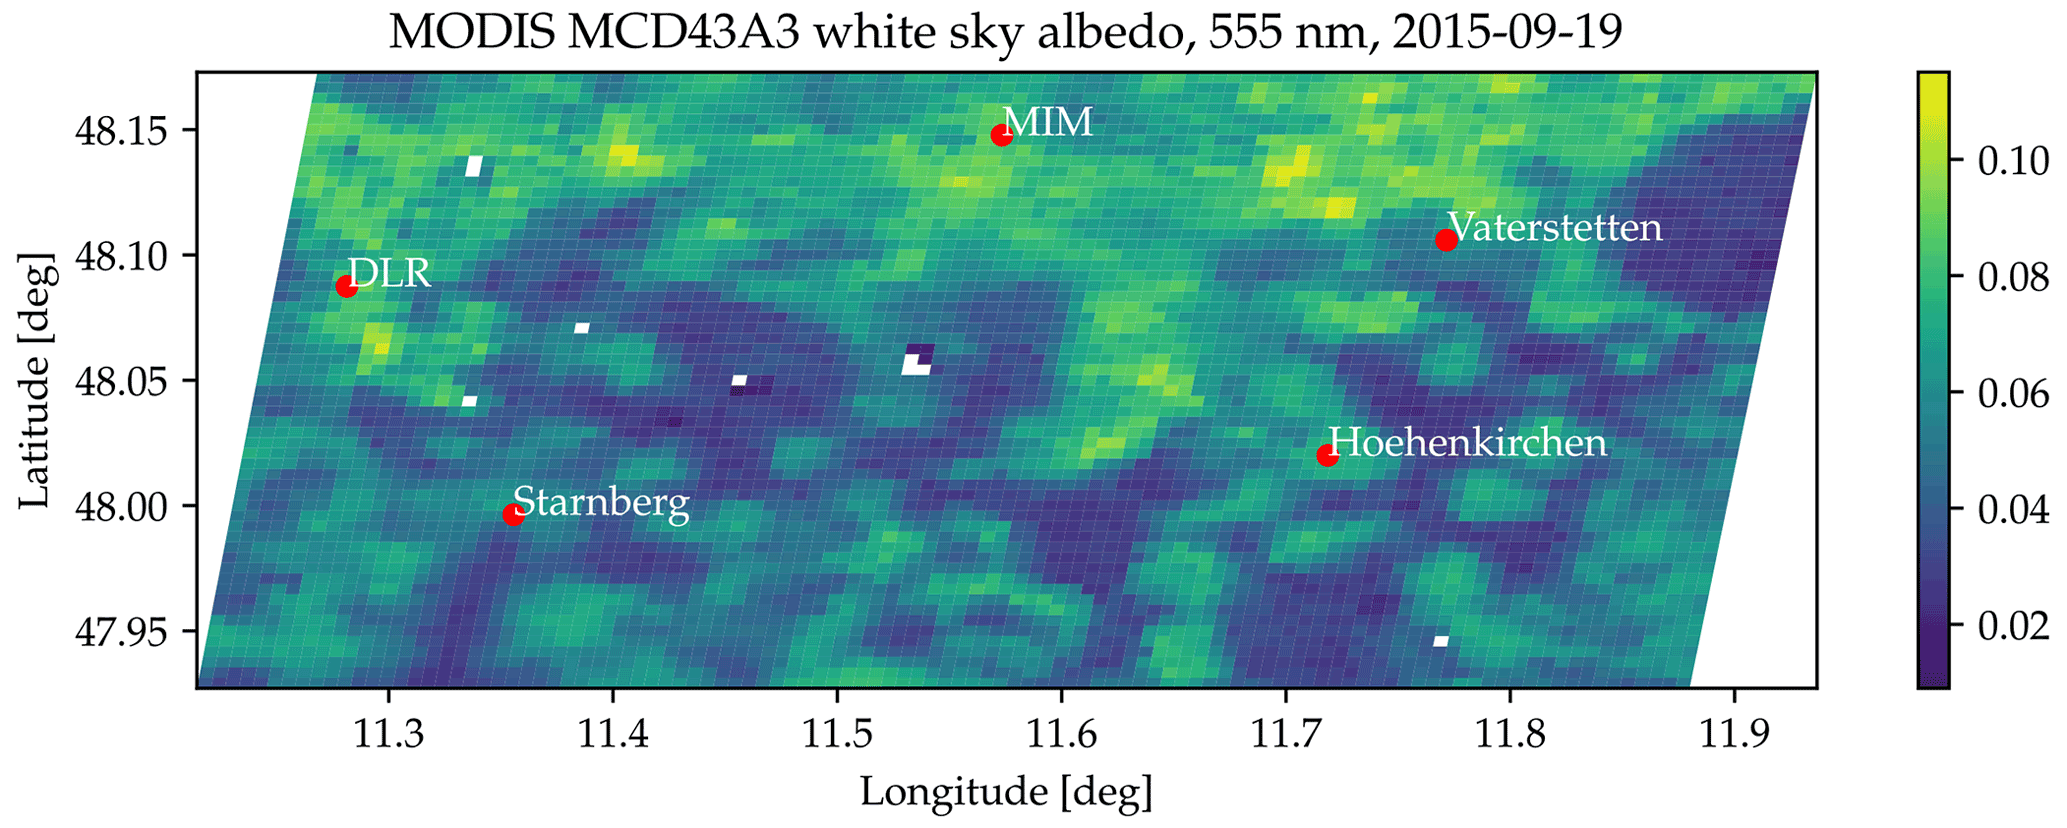
Figure B5MODIS MCD43A3 white-sky albedo from 19 September 2015 at a wavelength of 555 nm displayed for the geographic region which is covered by the projected 22∘ halo between sunrise and sunset throughout the year. The Meteorological Institute of LMU in Munich is marked by a red dot and labeled with “MIM”. Some more locations, e.g., the DLR in Oberpfaffenhofen, are marked for orientation.
Another test was performed for calibrated measurements with an error of the radiometric response of 15 %, which corresponds to the error of HaloCamRAW's R channel (Forster et al., 2020). Figure B1III shows the results for the same sensitivity studies as in the previous cases (Fig. B1I, II). The results of the ice crystal habit and AOT test in Figs. B1IIIa and B1IIIb are very similar to the calibrated measurements assuming no error for the radiometric response (cf. Figs. B1Ia and B1Ib). A slight overestimation of the retrieved SCF occurs for the aerosol type and atmospheric profile test (Figs. B1IIIc and B1IIIe) compared to the sensitivity of the calibrated measurements assuming no error for the radiometric response. For the aerosol type test (Fig. B1IIIc), the error of the retrieved SCF ranges between and ΔSCF=0.15, whereas for the atmospheric profile test (Fig. B1IIIe) ΔSCF has a range of (−0.35, 0.15). The error of the retrieved SCF for the albedo test (Fig. B1IIId) is negligible, which occurs most likely since errors in the assumed LUT parameters are transferred to the radiometric calibration factor to some extent.
These sensitivity studies demonstrate that the largest retrieval errors occur for wrong assumptions about the ice crystal habit and the AOT. Thus, for the compiled LUTs, all available ice crystal habits for the YG13 optical properties are considered. Under the assumption that the optical properties represent the variability of ice crystals in natural cirrus clouds, the retrieval error for the ice crystal habit is negligible. The AOT is varied in the LUT assuming typical values for Munich. For the remaining LUT parameters, i.e., aerosol type, surface albedo, cloud height, and atmospheric profile, “best-guess” fixed values or parameters are chosen. The procedure for how the LUT parameters are selected will be presented in the following sections.

Figure B6Spectral albedo data from the ASTER library provided with a resolution of 2 nm for grass (blue), shingle (red), conifer (dark green), and deciduous trees (green) as well as concrete (purple). A linear combination for the different ASTER albedo types is determined which represents best the averaged MODIS data from Fig. B5 by applying the least-squares method. The weighting factors for 19 September 2015 are provided in the legend of the figure. The resulting mixture of ASTER albedo data is then used to obtain an approximation of the MODIS albedo product for high spectral resolution, which is represented by the black solid line.
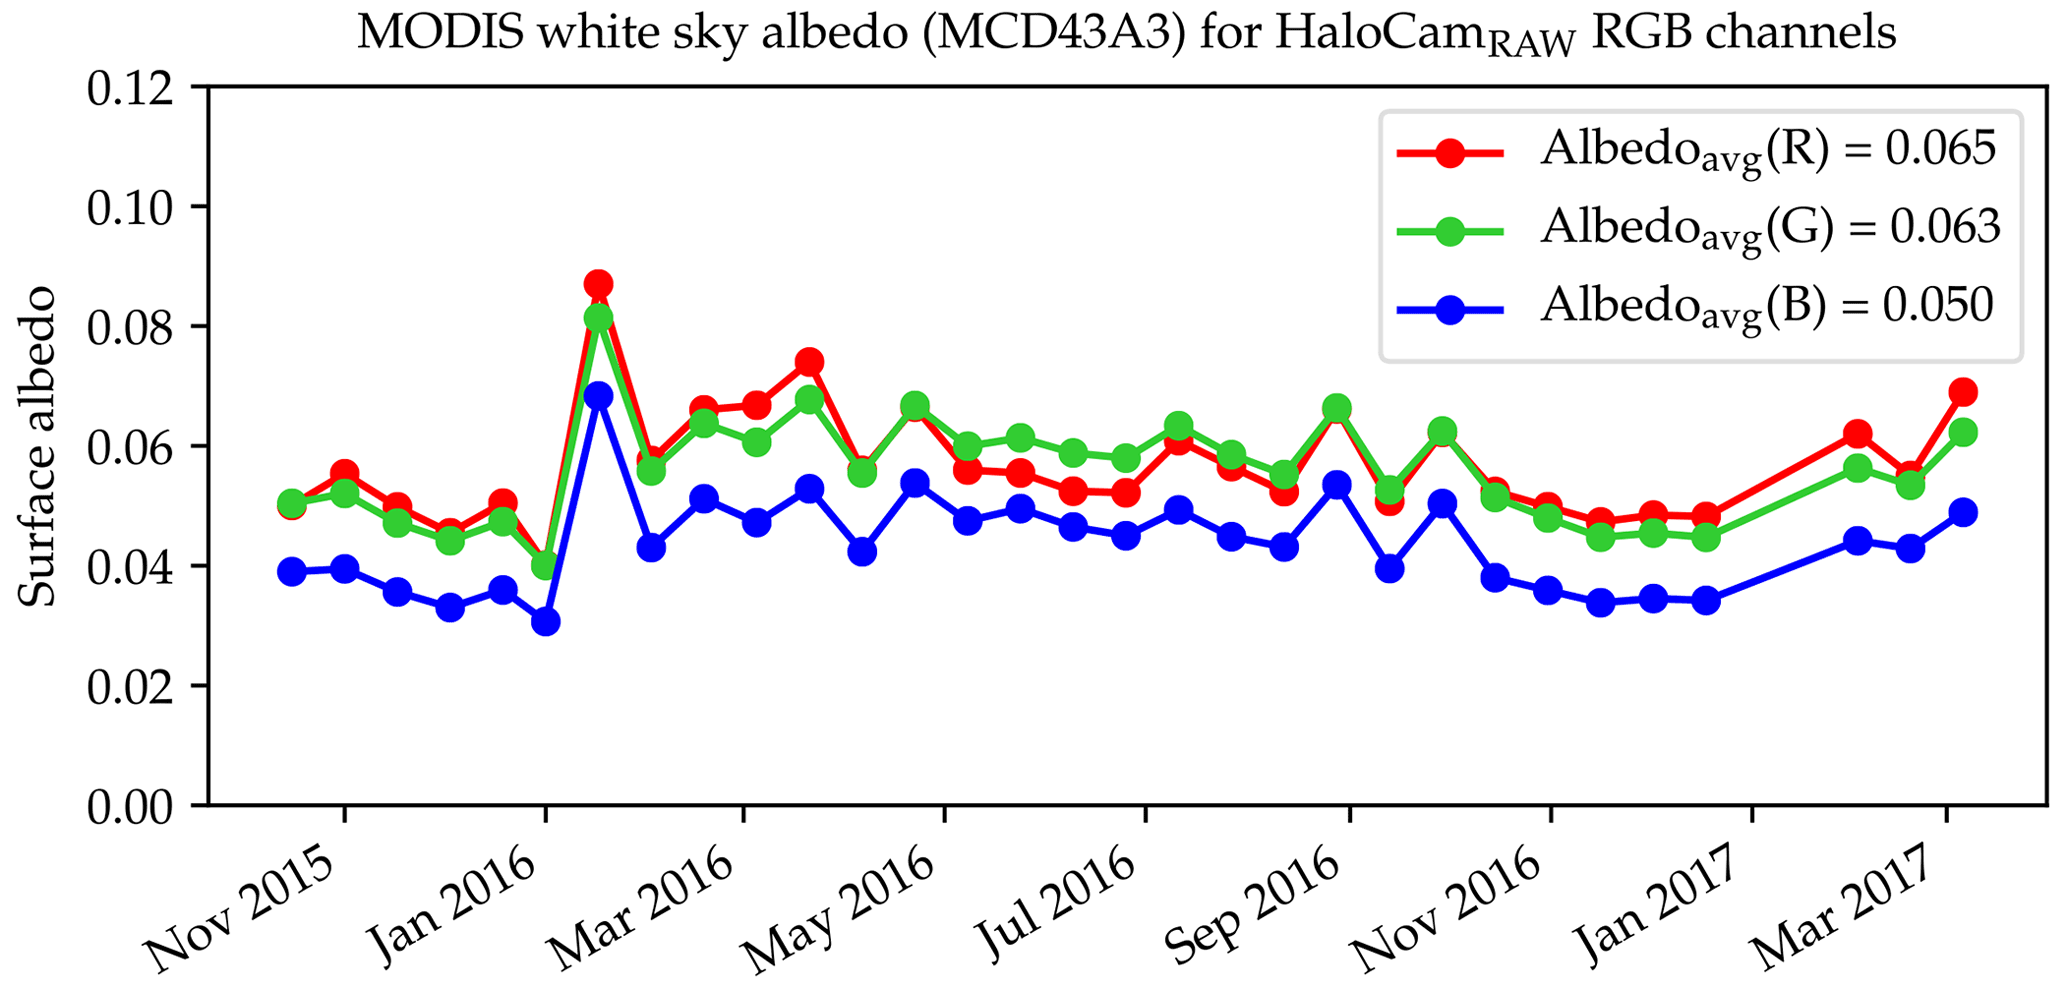
Figure B7Surface albedo between October 2015 and March 2017 for the HaloCamRAW RGB channels. The data are obtained by weighting the spectral high-resolution parameterization of the MODIS albedo data (cf. Fig. B6, black curve) with the spectral response of the RGB channels (Forster et al., 2020). The surface albedo for the HaloCamRAW channels averaged over this period amounts to 0.065 (R), 0.063 (G), and 0.050 (B).
Depending on the temperature regime of the cirrus and its evolutionary stage, the cloud can contain supercooled water droplets alongside the ice crystals. Hu et al. (2010) investigated the occurrence frequency, liquid water content, liquid water path, and temperature dependence of supercooled water droplets using global depolarization and backscatter intensity measurements from CALIOP. These observations were combined with temperature information from co-located Infrared Imaging Radiometer (IIR) and MODIS measurements to derive cloud water paths. This study considers clouds with optical thicknesses greater than 0.4. Hu et al. (2010) confirmed the findings of Hogan et al. (2004), who state that supercooled water clouds are rarely found below −35∘ C. According to Hu et al. (2010), the probability of the water phase occurring in a cloud is almost 0 % for ∘ C and increases rapidly to almost 100 % at about −10∘ C.
Since water droplets cannot form halo displays due to their spherical shape, they have in principle a similar smoothing effect on halo displays to rough ice crystals. Water droplets may therefore not be distinguishable from rough ice crystals by passive ground-based observations in the visible spectral range. To investigate the effect of supercooled water droplets on the retrieved smooth crystal fraction, synthetic measurements were simulated with DISORT for different mixtures of smooth ice crystal columns and water droplets. Similarly to the two-habit LUTs, the fraction of water droplets was increased from 0 for a cloud consisting entirely of smooth solid ice crystal columns to 1 for a pure water cloud. The water cloud optical properties were calculated with the Mie tool described in Wiscombe (1980). A gamma size distribution N(r) was assumed:
with the droplet radius r, the normalization constant N0, and α=7, which corresponds to an effective variance of , as described in Emde et al. (2016). It is assumed that all cloud particles (water droplets and ice crystals) have the same effective radius, which was varied between 10 and 90 µm in steps of 10 µm. A LUT assuming different mixtures of smooth and rough ice crystal columns was matched against these synthetic measurements. The retrieved SCF is displayed in Fig. B2. The error of the retrieved SCF ranges in the interval . This means that water droplets indeed have a very similar effect on the 22∘ halo to rough ice crystals and introduce an error of the retrieved smooth crystal fraction of .
The sensitivity of the cloud height and thickness as well as the atmospheric profile to the 22∘ halo radiance distribution was tested. The tests were performed for the HaloCamRAW R, G, and B channels. Varying the cloud base height between 6 and 10 km, both with a geometrical thickness of 1 km, resulted in differences of ≪1 %. Similar results were obtained for the depth of the cloud, which was varied between 1 and 4 km. Also, the choice of the atmospheric profile is negligible in this spectral range: the difference between simulations using the US standard atmosphere and the mid-latitude summer atmosphere was ≪1 %. Both atmospheric profiles are defined in Anderson et al. (1986).
Furthermore, we tested whether it is sufficient to perform radiative transfer simulations for a representative wavelength rather than integrating over the full spectral sensitivity curves of HaloCamRAW.
Figure B3 shows the results of radiative transfer simulations using libRadtran for realistic conditions including a cirrus cloud with 25 % smooth crystals and a typical AOT of 0.1. The geometry was chosen in the principal plane above the Sun () for scattering angles between 10 and 50∘. The solid lines represent spectral simulations integrated over the spectral sensitivity functions for the red, green, and blue channels of HaloCamRAW. The dashed lines display the same simulations but for only one wavelength which is equal to the weighted average of the respective camera channels. The averaged relative differences are overall smaller than 2 %. Considering the large uncertainties of the unknown aerosol type, let alone the variability of the ice crystal shape, this uncertainty is considered small enough to allow for monochromatic radiative transfer simulations using the representative wavelengths of each camera channel. The representative wavelengths for HaloCamRAW were determined by the weighted average over the spectral response of each channel (Forster et al., 2020), resulting in 618 nm for the red channel, 553 nm for the green channel, and 498 nm for the blue channel.
B1 Ancillary data
The sensitivity studies in Appendix B reveal that the retrieval is influenced by additional parameters. Besides the ice crystal shape itself, the cirrus optical thickness has the strongest impact on the retrieval, followed by the aerosol optical thickness and the surface albedo. The subsequent sections present ancillary data which are used to constrain these additional parameters in the retrieval and explain the methods which are used to determine these parameters.
B1.1 Aerosol optical thickness
According to the study of Schnell (2014), typical aerosol optical thickness (AOT) values for Munich during the period from 2007 to 2010 amount to 0.269 ± 0.014 based on AERONET data for a wavelength of 500 nm and ranged between 0.12 and 0.17 at 532 nm for measurements with the Multichannel Lidar System (MULIS) (Freudenthaler et al., 2009). For the period between September 2015 and December 2016, the AERONET AOT at 500 nm amounts to 0.19 on average as displayed in Fig. B4.
Three percent of the values range in , possibly due to contamination of very homogeneous cloud layers which are not filtered out by the AERONET cloud-screening algorithm. To cover the most frequently observed values for Munich, which are displayed in Fig. B4b, the LUT was calculated for AOTs ranging between 0.0 and 0.5 in steps of 0.05. Schnell (2014) also studied the typical aerosol type over Munich using CALIPSO data. Evaluated in geometrical layer depth, the dominant aerosol type was smoke, followed by polluted dust. In fall, the continental clean aerosol type was the second-largest fraction. Other observed aerosol types were dust and continental polluted aerosol. Unless otherwise stated, the LUT simulations were performed using the “continental average” mixture which is part of the OPAC database (Hess et al., 1998). To constrain the AOT in the retrieval, the daily mean value from AERONET was used within a 2σ confidence interval.
B1.2 Cirrus optical thickness
To constrain the cirrus optical thickness (COT) in the retrieval, we make use of the SSARA Sun photometer, which is located on the institute's rooftop and provides a high temporal resolution of 2 s. After deriving the total optical thickness from SSARA's direct Sun measurements at a wavelength of 500 nm, we subtract the AERONET AOT from the previous clear-sky scene, interpolated to the cirrus time stamp, to obtain the apparent COT. Due to the enhanced forward scattering in the case of ice crystals, the Sun photometer detects a higher signal within its field of view (FOV) for the same concentration of scattering ice compared to aerosol particles, hence the term “apparent” COT. This additional forward scattering contribution can be corrected for by using radiative transfer simulations to compute and tabulate the correction factor k.
Similarly to the procedure presented in Reinhardt et al. (2014), the concept of the apparent optical thickness is used as in Shiobara and Asano (1994), Guerrero-Rascado et al. (2013), and Segal-Rosenheimer et al. (2013). According to the Bouguer–Lambert–Beer law, the solar radiance L transmitted by the atmosphere with a slant-path optical thickness τs (equivalent to COT in our case) can be denoted as
where L0 is the solar radiance at the top of the atmosphere. Any detector with a finite FOV which is pointing towards the Sun will measure both the direct solar radiance and the diffuse radiance produced by scattering particles and molecules in the atmosphere. The total radiance entering the instrument FOV can be considered an apparent radiance L′ representing the direct and diffuse parts together. The apparent radiance is defined as
with the apparent optical thickness τapp (equivalent to apparent COT in our case). The apparent optical thickness can be related to the slant-path optical thickness τs by introducing the correction factor k:
which accounts for the difference between direct and apparent radiance due to the additional diffuse part and takes values . Using Eq. (B5), the slant-path optical thickness τs can be calculated by
As discussed in Reinhardt et al. (2014), for τs<3, the correction factor k is most sensitive to the detector FOV, the effective particle radius, and shape but is almost independent of τs itself. For the retrieval, the k factors were calculated according to this procedure for the SSARA FOV of 1.2∘ (Toledano et al., 2009) assuming a COT of 1.5 as proposed by Reinhardt et al. (2014). The k factors were calculated for all ice crystal habits, surface roughness values, and effective radii used in the LUT. The COT is then computed by dividing the apparent COT by k (cf. Eq. B5).
B1.3 Surface albedo
The surface albedo is another parameter which affects the transmission measured at the ground, but its impact on the retrieval is significantly smaller compared to the aerosol type and optical thickness (cf. Fig. B1). With increasing surface albedo, more radiation is reflected by the ground, which is scattered back to the camera by the clouds. To estimate the surface albedo during the time of the measurements, the MODIS white-sky albedo product MCD43B3 (Strahler et al., 1999) was used. The MODIS white-sky albedo product is available for seven wavelength bands centered at 469, 555, 645, 858, 1240, 1640, and 2130 nm. Figure B5 shows the MODIS white-sky albedo for the 555 nm wavelength band. The displayed geographic region was selected to cover the coordinates of the projected 22∘ halo between sunrise and sunset throughout the year. At a wavelength of 555 nm the albedo values range between about 0.015 and 0.12, with the lowest values for lakes (e.g., south of Starnberg) and forests (e.g., east of DLR). To obtain spectrally continuous data, the ASTER spectral library (Baldridge et al., 2009) is applied to interpolate the MODIS albedo data similarly to the procedure described in Hausmann (2012): a linear combination of the spectral albedo of deciduous and conifer trees, grass, shingle, and concrete is used to represent the MODIS white-sky albedo.
Figure B6 shows the MODIS white-sky albedo measured at the seven wavelengths with black dots. The black line represents the linear combination of the single ASTER spectral albedos which provides the best match of the MODIS measurements. The single spectral albedos with the corresponding weighting coefficients are depicted in different colors. To obtain the albedo measured, e.g., by HaloCamRAW, the fitted spectral albedo from the ASTER library (cf. the black line in Fig. B6) is integrated over the spectral sensitivity of the respective camera channel. In the case of HaloCamRAW, integrating the spectral albedo over the red, green, and blue channels yields the albedo values displayed in Fig. B7 with the respective line color. For this figure, the MODIS white-sky albedo values were evaluated between October 2015 and March 2017. Values larger than 0.1 were excluded since they are most likely due to snow cover.
Averaging over the whole period yields mean albedo values for the red, green, and blue channels of 0.065, 0.063, and 0.050, respectively. The red and green channels show higher values than the blue channel since the surface south of Munich is dominated by green grass and trees. Comparing the red and green channels, a slight difference between winter and summer is noticeable, which is very likely due to the vegetation period. During summer the deciduous trees increase the albedo in the part of the spectrum covered mostly by the green channel, whereas in winter the albedo measured by the green channel is slightly lower than the red channel.
AERONET data for the station “Munich University” are available via https://aeronet.gsfc.nasa.gov/ (AERONET, 2022). Radiosonde observations for München-Oberschleißheim (station no. 10868) can be downloaded using http://weather.uwyo.edu/upperair/sounding.html (Radiosonde, 2022). The MODIS white-sky albedo product MCD43A3 was retrieved from https://opendap.cr.usgs.gov/opendap/hyrax//MODV6_Cmp_B/MOTA/MCD43A3.006/ (MODIS, 2022). The lookup tables, image data, retrieval algorithm, institute's SSARA Sun photometer, and MIRA-35 cloud radar data used in this study will be provided upon request by the authors.
LF prepared the manuscript, developed the retrieval method and measurement strategy, pre-processed and calibrated the HaloCam dataset, compiled the DISORT lookup tables, and analyzed the retrieval results as part of her doctoral thesis. BM secured the funding for the HaloCam project and supervised the doctoral thesis. He provided valuable feedback on the retrieval method and data analysis as well as on the manuscript.
The contact author has declared that neither of the authors has any competing interests.
Publisher’s note: Copernicus Publications remains neutral with regard to jurisdictional claims in published maps and institutional affiliations.
We thank Markus Rapp (DLR Oberpfaffenhofen) for co-funding the PhD thesis. We also thank Matthias Wiegner for providing the AERONET Sun photometer measurements and Meinhard Seefeldner, Markus Garhammer, and Anton Lex for their help with maintaining the Sun photometers and HaloCam's Sun-tracking mount. Florian Ewald and Tobias Zinner kindly provided the MIRA-35 cloud radar measurements. We thank Claudia Emde for implementing Yang et al. (2013)'s ice crystal optical properties in libRadtran and providing valuable feedback on the project. Finally, we thank Ping Yang and an anonymous referee for reviewing the manuscript and providing valuable suggestions to improve its quality and clarity.
This paper was edited by Odran Sourdeval and reviewed by Ping Yang and one anonymous referee.
Abdelmonem, A., Järvinen, E., Duft, D., Hirst, E., Vogt, S., Leisner, T., and Schnaiter, M.: PHIPS–HALO: the airborne Particle Habit Imaging and Polar Scattering probe – Part 1: Design and operation, Atmos. Meas. Tech., 9, 3131–3144, https://doi.org/10.5194/amt-9-3131-2016, 2016. a
AERONET: AERONET observations [data set], https://aeronet.gsfc.nasa.gov/, last access: 3 November 2022. a
Anderson, G., Clough, S., Kneizys, F., Chetwynd, J., and Shettle, E.: AFGL Atmospheric Constituent Profiles (0–120 km), Tech. Rep. AFGL-TR-86-0110, AFGL (OPI), Hanscom AFB, MA 01736, 1986. a, b, c, d
Bailey, M. and Hallett, J.: Nucleation effects on the habit of vapour grown ice crystals from −18 to −42∘ C, Q. J. Roy. Meteor. Soc., 128, 1461–1483, https://doi.org/10.1002/qj.200212858304, 2002. a
Bailey, M. and Hallett, J.: Growth rates and habits of ice crystals between −20 and −70∘ C, J. Atmos. Sci., 61, 514–544, https://doi.org/10.1175/1520-0469(2004)061<0514:GRAHOI>2.0.CO;2, 2004. a
Bailey, M. and Hallett, J.: Ice Crystal Linear Growth Rates from −20 to −70∘ C: Confirmation from Wave Cloud Studies, J. Atmos. Sci., 69, 390–402, https://doi.org/10.1175/JAS-D-11-035.1, 2012. a
Bailey, M. P. and Hallett, J.: A Comprehensive Habit Diagram for Atmospheric Ice Crystals: Confirmation from the Laboratory, AIRS II, and Other Field Studies, J. Atmos. Sci., 66, 2888–2899, https://doi.org/10.1175/2009JAS2883.1, 2009. a, b
Baldridge, A., Hook, S., Grove, C., and Rivera, G.: The ASTER spectral library version 2.0, Remote Sens. Environ., 113, 711–715, https://doi.org/10.1016/j.rse.2008.11.007, 2009. a
Baran, A., Watts, P., and Francis, P.: Testing the coherence of cirrus microphysical and bulk properties retrieved from dual-viewing multispectral satellite radiance measurements, J. Geophys. Res., 104, 31673–31683, https://doi.org/10.1029/1999JD900842, 1999. a, b, c
Baran, A., Francis, P., Havemann, S., and Yang, P.: A study of the absorption and extinction properties of hexagonal ice columns and plates in random and preferred orientation, using T-Matrix theory and aircraft observations of cirrus, J. Quant. Spectrosc. Ra., 70, 505–518, https://doi.org/10.1016/S0022-4073(01)00025-5, 2001. a
Baran, A. J.: A review of the light scattering properties of cirrus, J. Quant. Spectrosc. Ra., 110, 1239–1260, https://doi.org/10.1016/j.jqsrt.2009.02.026, 2009. a
Baran, A. J.: From the single-scattering properties of ice crystals to climate prediction: A way forward, Atmos. Res., 112, 45–69, https://doi.org/10.1016/j.atmosres.2012.04.010, 2012. a, b, c
Baran, A. J. and Labonnote, L. C.: On the reflection and polarisation properties of ice cloud, J. Quant. Spectrosc. Ra., 100, 41–54, https://doi.org/10.1016/j.jqsrt.2005.11.062, 2006. a, b
Baran, A. J., Watts, P. D., and Foot, J. S.: Potential retrieval of dominating crystal habit and size using radiance data from a dual-view and multiwavelength instrument: A tropical cirrus anvil case, J. Geophys. Res., 103, 6075–6082, https://doi.org/10.1029/97JD03122, 1998. a, b
Chepfer, H., Goloub, P., Riedi, J., De Haan, J. F., Hovenier, J., and Flamant, P.: Ice crystal shapes in cirrus clouds derived from POLDER/ADEOS-1, J. Geophys. Res., 106, 7955–7966, https://doi.org/10.1029/2000JD900285, 2001. a, b
Cole, B. H., Yang, P., Baum, B. A., Riedi, J., and C.-Labonnote, L.: Ice particle habit and surface roughness derived from PARASOL polarization measurements, Atmos. Chem. Phys., 14, 3739–3750, https://doi.org/10.5194/acp-14-3739-2014, 2014. a
Crépel, O., Gayet, J.-F., Fournol, J.-F., and Oshchepkov, S.: A new airborne Polar Nephelometer for the measurement of optical and microphysical cloud properties. Part II: Preliminary tests, Ann. Geophys., 15, 460–470, https://doi.org/10.1007/s00585-997-0460-0, 1997. a
Descloitres, J., Buriez, J.-C., Parol, F., and Fouquart, Y.: POLDER observations of cloud bidirectional reflectances compared to a plane-parallel model using the International Satellite Cloud Climatology Project cloud phase functions, J. Geophys. Res., 103, 11411–11418, https://doi.org/10.1029/98JD00592, 1998. a, b
Eichler, H., Ehrlich, A., Wendisch, M., Mioche, G., Gayet, J.-F., Wirth, M., Emde, C., and Minikin, A.: Influence of ice crystal shape on retrieval of cirrus optical thickness and effective radius: A case study, J. Geophys. Res., 114, D19203, https://doi.org/10.1029/2009JD012215, 2009. a
Emde, C., Buras, R., Mayer, B., and Blumthaler, M.: The impact of aerosols on polarized sky radiance: model development, validation, and applications, Atmos. Chem. Phys., 10, 383–396, https://doi.org/10.5194/acp-10-383-2010, 2010. a
Emde, C., Buras-Schnell, R., Kylling, A., Mayer, B., Gasteiger, J., Hamann, U., Kylling, J., Richter, B., Pause, C., Dowling, T., and Bugliaro, L.: The libRadtran software package for radiative transfer calculations (version 2.0.1), Geosci. Model Dev., 9, 1647–1672, https://doi.org/10.5194/gmd-9-1647-2016, 2016. a, b
Field, P. R., Hogan, R. J., Brown, P. R. A., Illingworth, A. J., Choularton, T. W., and Cotton, R. J.: Parametrization of ice-particle size distributions for mid-latitude stratiform cloud, Q. J. Roy. Meteor. Soc., 131, 1997–2017, https://doi.org/10.1256/qj.04.134, 2005. a
Flatau, P. J. and Draine, B. T.: Light scattering by hexagonal columns in the discrete dipole approximation, Opt. Express, 22, 21834–21846, https://doi.org/10.1364/OE.22.021834, 2014. a
Forster, L., Seefeldner, M., Wiegner, M., and Mayer, B.: Ice crystal characterization in cirrus clouds: a sun-tracking camera system and automated detection algorithm for halo displays, Atmos. Meas. Tech., 10, 2499–2516, https://doi.org/10.5194/amt-10-2499-2017, 2017. a, b, c, d, e, f, g, h, i, j, k, l
Forster, L., Seefeldner, M., Baumgartner, A., Kölling, T., and Mayer, B.: Ice crystal characterization in cirrus clouds II: radiometric characterization of HaloCam for the quantitative analysis of halo displays, Atmos. Meas. Tech., 13, 3977–3991, https://doi.org/10.5194/amt-13-3977-2020, 2020. a, b, c, d, e, f, g, h, i, j, k, l
Fraser, A. B.: What size of ice crystals causes the halos?, J. Opt. Soc. Am., 69, 1112–1118, https://doi.org/10.1364/JOSA.69.001112, 1979. a, b
Freudenthaler, V., Esselborn, M., Wiegner, M., Heese, B., Tesche, M., Ansmann, A., Müller, D., Althausen, D., Wirth, M., Fix, A., Ehret, G., Knippertz, P., Toledano, C., Gasteiger, J., Garhammer, M., and Seefeldner, M.: Depolarization ratio profiling at several wavelengths in pure Saharan dust during SAMUM 2006, Tellus B, 61, 165–179, https://doi.org/10.1111/j.1600-0889.2008.00396.x, 2009. a
Garrett, T. J., Kimball, M. B., Mace, G. G., and Baumgardner, D. G.: Observing cirrus halos to constrain in-situ measurements of ice crystal size, Atmos. Chem. Phys. Discuss., 7, 1295–1325, https://doi.org/10.5194/acpd-7-1295-2007, 2007. a
Gayet, J. F., Crépel, O., Fournol, J. F., and Oshchepkov, S.: A new airborne polar Nephelometer for the measurements of optical and microphysical cloud properties. Part I: Theoretical design, Ann. Geophys., 15, 451–459, https://doi.org/10.1007/s00585-997-0451-1, 1997. a
Gedzelman, S. D. and Vollmer, M.: Atmospheric Optical Phenomena and Radiative Transfer, B. Am. Meteorol. Soc., 89, 471–485, https://doi.org/10.1175/BAMS-89-4-471, 2008. a
Görsdorf, U., Lehmann, V., Bauer-Pfundstein, M., Peters, G., Vavriv, D., Vinogradov, V., and Volkov, V.: A 35-GHz Polarimetric Doppler Radar for Long-Term Observations of Cloud Parameters – Description of System and Data Processing, J. Atmos. Ocean. Tech., 32, 675–690, https://doi.org/10.1175/JTECH-D-14-00066.1, 2015. a
Greenler, R.: Rainbows, Halos and Glories, Cambridge University Press, Cambridge, ISBN 978-0521236058, 1980. a
Guerrero-Rascado, J. L., Costa, M. J., Silva, A. M., and Olmo, F. J.: Retrieval and variability analysis of optically thin cloud optical depths from a Cimel sun-photometer, Atmos. Res., 127, 210–220, 2013. a
Hausmann, P.: Ground-based remote sensing of optically thin ice clouds, Master's thesis, Ludwig-Maximilians-Universität München, M.S. thesis, 2012. a
Hess, M., Koepke, P., and Schult, I.: Optical properties of aerosols and clouds: the software package OPAC, B. Am. Meteorol. Soc., 79, 831–844, 1998. a
Heymsfield, A. and Platt, C.: A parameterization of the particle size spectrum of ice clouds in terms of the ambient temperature and the ice water content, J. Atmos. Sci., 41, 846–855, https://doi.org/10.1175/1520-0469(1984)041<0846:APOTPS>2.0.CO;2, 1984. a
Heymsfield, A. J., Schmitt, C., and Bansemer, A.: Ice Cloud Particle Size Distributions and Pressure-Dependent Terminal Velocities from In Situ Observations at Temperatures from 0∘to −86∘ C, J. Atmos. Sci., 70, 4123–4154, https://doi.org/10.1175/JAS-D-12-0124.1, 2013. a
Hogan, R., Behera, M., O'Connor, E., and Illingworth, A.: Estimate of the global distribution of stratiform supercooled liquid water clouds using the LITE radar, Geophys. Res. Lett., 31, L05106, https://doi.org/10.1029/2003GL018977, 2004. a
Holben, B., Eck, T., Slutsker, I., Tanré, D., Buis, J., Setzer, A., Vermote, E., Reagan, J., Kaufman, Y., Nakajima, T., Lavenu, F., Jankowiak, I., and Smirnov, A.: AERONET - A Federated Instrument Network and Data Archive for Aerosol Characterization, Remote Sens. Environ., 66, 1–16, https://doi.org/10.1016/S0034-4257(98)00031-5, 1998. a, b
Holz, R. E., Platnick, S., Meyer, K., Vaughan, M., Heidinger, A., Yang, P., Wind, G., Dutcher, S., Ackerman, S., Amarasinghe, N., Nagle, F., and Wang, C.: Resolving ice cloud optical thickness biases between CALIOP and MODIS using infrared retrievals, Atmos. Chem. Phys., 16, 5075–5090, https://doi.org/10.5194/acp-16-5075-2016, 2016. a, b, c, d, e, f
Hu, Y., Rodier, S., Xu, K., Sun, W., Huang, J., Lin, B., Zhai, P., and Josset, D.: Occurrence, liquid water content, and fraction of supercooled water clouds from combined CALIOP/IIR/MODIS measurements, J. Geophys. Res., 115, D00H34, https://doi.org/10.1029/2009JD012384, 2010. a, b, c
Illingworth, A. J., Hogan, R. J., O'Connor, E., Bouniol, D., Brooks, M. E., Delanoe, J., Donovan, D. P., Eastment, J. D., Gaussiat, N., Goddard, J. W. F., Haeffelin, M., Baltink, H. K., Krasnov, O. A., Pelon, J., Piriou, J.-M., Protat, A., Russchenberg, H. W. J., Seifert, A., Tompkins, A. M., van Zadelhoff, G.-J., Vinit, F., Willen, U., Wilson, D. R., and Wrench, C. L.: Cloudnet, B. Am. Meteorol. Soc., 88, 883–898, https://doi.org/10.1175/BAMS-88-6-883, 2007. a
Järvinen, E., Jourdan, O., Neubauer, D., Yao, B., Liu, C., Andreae, M. O., Lohmann, U., Wendisch, M., McFarquhar, G. M., Leisner, T., and Schnaiter, M.: Additional global climate cooling by clouds due to ice crystal complexity, Atmos. Chem. Phys., 18, 15767–15781, https://doi.org/10.5194/acp-18-15767-2018, 2018. a, b
Jensen, A. A., Harrington, J. Y., and Morrison, H.: Impacts of Ice Particle Shape and Density Evolution on the Distribution of Orographic Precipitation, J. Atmos. Sci., 75, 3095–3114, https://doi.org/10.1175/JAS-D-17-0400.1, 2018. a
Key, J., Yang, P., Baum, B., and Nasiri, S.: Parameterization of shortwave ice cloud optical properties for various particle habits, J. Geophys. Res., 107, https://doi.org/10.1029/2001JD000742, 2002. a
Liou, K.-N.: Influence of cirrus clouds on weather and climate processes: A global perspective, Month. Weather Rev., 114, 1167–1199, https://doi.org/10.1175/1520-0493(1986)114<1167:IOCCOW>2.0.CO;2, 1986. a
Liou, K.-N. and Yang, P.: Light Scattering by Ice Crystals: Fundamentals and Applications, Cambridge University Press, Cambridge, ISBN 978-0521889162, 2016. a
Liu, C., Yang, P., Minnis, P., Loeb, N., Kato, S., Heymsfield, A., and Schmitt, C.: A two-habit model for the microphysical and optical properties of ice clouds, Atmos. Chem. Phys., 14, 13719–13737, https://doi.org/10.5194/acp-14-13719-2014, 2014. a, b
Lynch, D. K. and Schwartz, P.: Intensity profile of the 22∘ halo, J. Opt. Soc. Am. A, 2, 584–589, https://doi.org/10.1364/JOSAA.2.000584, 1985. a, b
Macke, A., Mishchenko, M., and Cairns, B.: The influence of inclusions on light scattering by large ice particles, J. Geophys. Res., 101, 23311–23316, 1996. a
Magee, N., Boaggio, K., Staskiewicz, S., Lynn, A., Zhao, X., Tusay, N., Schuh, T., Bandamede, M., Bancroft, L., Connelly, D., Hurler, K., Miner, B., and Khoudary, E.: Captured cirrus ice particles in high definition, Atmos. Chem. Phys., 21, 7171–7185, https://doi.org/10.5194/acp-21-7171-2021, 2021. a
Magono, C. and Lee, C. W.: Meteorological classification of natural snow crystals, J. Fac. Sci., 2, 321–335, 1966. a
Mayer, B.: Radiative transfer in the cloudy atmosphere, Europ. Phys. J. Conf., 1, 75–99, https://doi.org/10.1140/epjconf/e2009-00912-1, 2009. a
Mayer, B. and Kylling, A.: Technical note: The libRadtran software package for radiative transfer calculations - description and examples of use, Atmos. Chem. Phys., 5, 1855–1877, https://doi.org/10.5194/acp-5-1855-2005, 2005. a
McFarlane, S. A. and Marchand, R. T.: Analysis of ice crystal habits derived from MISR and MODIS observations over the ARM Southern Great Plains site, J. Geophys. Res.-Atmos., 113, D07209, https://doi.org/10.1029/2007JD009191, 2008. a, b, c
Minnaert, M.: Rainbows, Halos, and Coronas, Springer New York, New York, NY, 185–258, https://doi.org/10.1007/978-1-4612-2722-9_10, 1993. a
Mishchenko, M. and Macke, A.: How big should hexagonal ice crystals be to produce halos?, Appl. Opt., 38, 1626–1629, https://doi.org/10.1364/AO.38.001626, 1999. a
Mishchenko, M., Rossow, W., Macke, A., and Lacis, A.: Sensitivity of cirrus cloud albedo, bidirectional reflectance and optical thickness retrieval accuracy to ice particle shape, J. Geophys. Res., 101, 16973–16985, https://doi.org/10.1029/96JD01155, 1996. a
MODIS: MODIS albedo data [data set], https://opendap.cr.usgs.gov/opendap/hyrax//MODV6_Cmp_B/MOTA/MCD43A3.006/, last access: 3 November 2022. a
Platnick, S., Meyer, K. G., King, M. D., Wind, G., Amarasinghe, N., Marchant, B., Arnold, G. T., Zhang, Z., Hubanks, P. A., Holz, R. E., Yang, P., Ridgway, W. L., and Riedi, J.: The MODIS Cloud Optical and Microphysical Products: Collection 6 Updates and Examples From Terra and Aqua, IEEE T. Geosci. Remote, 55, 502–525, https://doi.org/10.1109/TGRS.2016.2610522, 2017. a, b
Radiosonde: Radiosonde observations [data set], http://weather.uwyo.edu/upperair/sounding.html, last access: 3 November 2022. a
Reinhardt, B., Buras, R., Bugliaro, L., Wilbert, S., and Mayer, B.: Determination of circumsolar radiation from Meteosat Second Generation, Atmos. Meas. Tech., 7, 823–838, https://doi.org/10.5194/amt-7-823-2014, 2014. a, b, c, d
Saito, M., Iwabuchi, H., Yang, P., Tang, G., King, M. D., and Sekiguchi, M.: Ice particle morphology and microphysical properties of cirrus clouds inferred from combined CALIOP-IIR measurements, J. Geophys. Res.-Atmos., 122, 4440–4462, https://doi.org/10.1002/2016JD026080, 2017. a
Sassen, K. and Liou, K.-N.: Scattering of polarized laser light by water droplet, mixed-phase and ice crystal clouds. Part I: Angular scattering patterns, J. Atmos. Sci., 36, 838–851, https://doi.org/10.1175/1520-0469(1979)036<0838:SOPLLB>2.0.CO;2, 1979. a
Sassen, K., Knight, N. C., Takano, Y., and Heymsfield, A. J.: Effects of ice-crystal structure on halo formation: cirrus cloud experimental and ray-tracing modeling studies, Appl. Opt., 33, 4590–4601, https://doi.org/10.1364/AO.33.004590, 1994. a, b
Sassen, K., Zhu, J., and Benson, S.: Midlatitude cirrus cloud climatology from the Facility for Atmospheric Remote Sensing, IV. Optical displays, Appl. Opt., 42, 332–341, https://doi.org/10.1364/AO.42.000332, 2003. a
Schmitt, C. G. and Heymsfield, A. J.: Observational quantification of the separation of simple and complex atmospheric ice particles, Geophys. Res. Lett., 41, 1301–1307, https://doi.org/10.1002/2013GL058781, 2013GL058781, 2014. a
Schnaiter, M., Järvinen, E., Vochezer, P., Abdelmonem, A., Wagner, R., Jourdan, O., Mioche, G., Shcherbakov, V. N., Schmitt, C. G., Tricoli, U., Ulanowski, Z., and Heymsfield, A. J.: Cloud chamber experiments on the origin of ice crystal complexity in cirrus clouds, Atmos. Chem. Phys., 16, 5091–5110, https://doi.org/10.5194/acp-16-5091-2016, 2016. a
Schnaiter, M., Järvinen, E., Abdelmonem, A., and Leisner, T.: PHIPS-HALO: the airborne particle habit imaging and polar scattering probe – Part 2: Characterization and first results, Atmos. Meas. Tech., 11, 341–357, https://doi.org/10.5194/amt-11-341-2018, 2018. a
Schnell, F. I. J.: Aerosol distribution above Munich using remote sensing techniques, PhD thesis, Ludwig-Maximilians-Universität München, Ph.D. thesis, 2014. a, b
Segal-Rosenheimer, M., Russell, P. B., Livingston, J. M., Ramachandran, S., Redemann, J., and Baum, B. A.: Retrieval of cirrus properties by Sun photometry: A new perspective on an old issue, J. Geophys. Res.-Atmos., 118, 4503–4520, https://doi.org/10.1002/jgrd.50185, 2013. a
Shiobara, M. and Asano, S.: Estimation of cirrus optical thickness from sun photometer measurements, J. Appl. Meteorol., 33, 672–681, https://doi.org/10.1175/1520-0450(1994)033<0672:EOCOTF>2.0.CO;2, 1994. a
Stamnes, K., Tsay, S., Wiscombe, W., and Jayaweera, K.: A numerically stable algorithm for discrete-ordinate-method radiative transfer in multiple scattering and emitting layered media, Appl. Opt., 27, 2502–2509, https://doi.org/10.1364/AO.27.002502, 1988. a, b
Stephens, G. L., Tsay, S., Stackhouse Jr., P. W., and Flatau, P. J.: The Relevance of the Microphysical and Radiative Properties of Cirrus Clouds to Climate and Climatic Feedback, J. Atmos. Sci., 47, 1742–1754, https://doi.org/10.1175/1520-0469(1990)047<1742:TROTMA>2.0.CO;2, 1990. a
Strahler, A., Muller, J., Lucht, W., Schaaf, C., Tsang, T., Gao, F., Li, X., Lewis, P., and Barnsley, M.: MODIS BRDF/albedo product: algorithm theoretical basis document version 5.0, MODIS documentation, 1999. a
Stubenrauch, C. J., Chédin, A., Rädel, G., Scott, N. A., and Serrar, S.: Cloud Properties and Their Seasonal and Diurnal Variability from TOVS Path-B, J. Climate, 19, 5531–5553, https://doi.org/10.1175/JCLI3929.1, 2006. a
Sun, W., Loeb, N. G., and Yang, P.: On the retrieval of ice cloud particle shapes from POLDER measurements, J. Quant. Spectrosc. Ra., 101, 435–447, https://doi.org/10.1016/j.jqsrt.2006.02.071, 2006. a, b
Tape, W.: Atmospheric halos, Antarctic Research Series, American Geophysical Union, Washington, DC, ISBN 978-0875908342, 1994. a, b
Toledano, C., Wiegner, M., Garhammer, M., Seefeldner, M., Gasteiger, J., Müller, D., and Koepke, P.: Spectral aerosol optical depth characterization of desert dust during SAMUM 2006, Tellus B, 61, 216–228, https://doi.org/10.1111/j.1600-0889.2008.00382.x, 2009. a, b
Toledano, C., Wiegner, M., Groß, S., Freudenthaler, V., Gasteiger, J., Müller, D., Müller, T., Schladitz, A., Weinzierl, B., Torres, B., and O'Neill, N. T.: Optical properties of aerosol mixtures derived from sun-sky radiometry during SAMUM-2, Tellus B, 63, 635–648, https://doi.org/10.1111/j.1600-0889.2011.00573.x, 2011. a
Ulanowski, Z., Kaye, P. H., Hirst, E., Greenaway, R. S., Cotton, R. J., Hesse, E., and Collier, C. T.: Incidence of rough and irregular atmospheric ice particles from Small Ice Detector 3 measurements, Atmos. Chem. Phys., 14, 1649–1662, https://doi.org/10.5194/acp-14-1649-2014, 2014. a
Um, J. and McFarquhar, G. M.: Formation of atmospheric halos and applicability of geometric optics for calculating single-scattering properties of hexagonal ice crystals: Impacts of aspect ratio and ice crystal size, J. Quant. Spectrosc. Ra., 165, 134–152, https://doi.org/10.1016/j.jqsrt.2015.07.001, 2015. a, b
Um, J., McFarquhar, G. M., Hong, Y. P., Lee, S.-S., Jung, C. H., Lawson, R. P., and Mo, Q.: Dimensions and aspect ratios of natural ice crystals, Atmos. Chem. Phys., 15, 3933–3956, https://doi.org/10.5194/acp-15-3933-2015, 2015. a, b
van Diedenhoven, B.: The prevalence of the 22∘ halo in cirrus clouds, J. Quant. Spectrosc. Ra., 146, 475–479, https://doi.org/10.1016/j.jqsrt.2014.01.012, 2014. a, b, c, d
van Diedenhoven, B.: Variation of Ice Microphysical Properties With Temperature and Humidity at Tops of Convective Clouds, Geophys. Res. Lett., 48, e2021GL093673, https://doi.org/10.1029/2021GL093673, 2021. a, b
van Diedenhoven, B., Fridlind, A. M., Ackerman, A. S., and Cairns, B.: Evaluation of Hydrometeor Phase and Ice Properties in Cloud-Resolving Model Simulations of Tropical Deep Convection Using Radiance and Polarization Measurements, J. Atmos. Sci., 69, 3290–3314, https://doi.org/10.1175/JAS-D-11-0314.1, 2012. a, b
van Diedenhoven, B., Cairns, B., Fridlind, A. M., Ackerman, A. S., and Garrett, T. J.: Remote sensing of ice crystal asymmetry parameter using multi-directional polarization measurements – Part 2: Application to the Research Scanning Polarimeter, Atmos. Chem. Phys., 13, 3185–3203, https://doi.org/10.5194/acp-13-3185-2013, 2013. a
van Diedenhoven, B., Ackerman, A. S., Fridlind, A. M., Cairns, B., and Riedi, J.: Global Statistics of Ice Microphysical and Optical Properties at Tops of Optically Thick Ice Clouds, J. Geophys. Res.-Atmos., 125, e2019JD031811, https://doi.org/10.1029/2019JD031811, 2020. a
Wang, C., Yang, P., Dessler, A., Baum, B. A., and Hu, Y.: Estimation of the cirrus cloud scattering phase function from satellite observations, J. Quant. Spectrosc. Ra., 138, 36–49, https://doi.org/10.1016/j.jqsrt.2014.02.001, 2014. a, b, c, d
Wang, Y., Hioki, S., Yang, P., King, M. D., Di Girolamo, L., Fu, D., and Baum, B. A.: Inference of an Optimal Ice Particle Model through Latitudinal Analysis of MISR and MODIS Data, Remote Sens., 10, https://doi.org/10.3390/rs10121981, 2018. a
Wang, Y., Yang, P., King, M. D., and Baum, B. A.: Optical Property Model for Cirrus Clouds Based on Airborne Multi-Angle Polarization Observations, Remote Sens., 13, 2754, https://doi.org/10.3390/rs13142754, 2021. a, b
Wegener, A.: Theorie der Haupthalos, vol. 43, Aus dem Archiv der Deutschen Seewarte und des Marineobservatoriums, Hamburg, 1925. a
Weickmann, H.: Die Eisphase in der Atmosphäre, Royal Aircraft Establishment, ASIN: B0007K3DCU, 1947. a
Wendisch, M., Yang, P., and Pilewskie, P.: Effects of ice crystal habit on thermal infrared radiative properties and forcing of cirrus, J. Geophys. Res., 112, D08201, https://doi.org/10.1029/2006JD007899, 2007. a
Wielicki, B., Cess, R., King, M., Randall, D., and Harrison, E.: Mission to planet Earth: Role of clouds and radiation in climate, B. Am. Meteorol. Soc., 76, 2125–2153, https://doi.org/10.1175/1520-0477(1995)076<2125:MTPERO>2.0.CO;2, 1995. a
Wiscombe, W.: Improved Mie scattering algorithms, Appl. Opt., 19, 1505–1509, https://doi.org/10.1364/AO.19.001505, 1980. a
Wylie, D. P. and Menzel, W. P.: Eight Years of High Cloud Statistics Using HIRS, J. Climate, 12, 170–184, https://doi.org/10.1175/1520-0442(1999)012<0170:EYOHCS>2.0.CO;2, 1999. a
Yang, P. and Liou, K.-N.: Geometric-optics-integral-equation method for light scattering by nonspherical ice crystals, Appl. Opt., 35, 6568–6584, https://doi.org/10.1364/AO.35.006568, 1996. a
Yang, P., Bi, L., Baum, B. A., Liou, K.-N., Kattawar, G. W., Mishchenko, M. I., and Cole, B.: Spectrally Consistent Scattering, Absorption, and Polarization Properties of Atmospheric Ice Crystals at Wavelengths from 0.2 to 100 μm, J. Atmos. Sci., 70, 330–347, https://doi.org/10.1175/JAS-D-12-039.1, 2013. a, b, c, d
Yang, P., Liou, K.-N., Bi, L., Liu, C., Yi, B., and Baum, B. A.: On the radiative properties of ice clouds: Light scattering, remote sensing, and radiation parameterization, Adv. Atmos. Sci., 32, 32–63, https://doi.org/10.1007/s00376-014-0011-z, 2015. a, b
Yang, P., Hioki, S., Saito, M., Kuo, C.-P., Baum, B. A., and Liou, K.-N.: A Review of Ice Cloud Optical Property Models for Passive Satellite Remote Sensing, Atmosphere, 9, 499, https://doi.org/10.3390/atmos9120499, 2018. a, b
Yang, S., Ricchiazzi, P., and Gautier, C.: Modified correlated k-distribution methods for remote sensing applications, J. Quant. Spectrosc. Ra., 64, 585–608, https://doi.org/10.1016/S0022-4073(99)00140-5, 2000. a
Yi, B., Yang, P., Baum, B. A., L'Ecuyer, T., Oreopoulos, L., Mlawer, E. J., Heymsfield, A. J., and Liou, K.-N.: Influence of Ice Particle Surface Roughening on the Global Cloud Radiative Effect, J. Atmos. Sci., 70, 2794–2807, https://doi.org/10.1175/JAS-D-13-020.1, 2013. a
Yi, B., Rapp, A. D., Yang, P., Baum, B. A., and King, M. D.: A comparison of Aqua MODIS ice and liquid water cloud physical and optical properties between collection 6 and collection 5.1: Cloud radiative effects, J. Geophys. Res., 122, 4550–4564, https://doi.org/10.1002/2016JD025654, 2017. a
Zinner, T., Hausmann, P., Ewald, F., Bugliaro, L., Emde, C., and Mayer, B.: Ground-based imaging remote sensing of ice clouds: uncertainties caused by sensor, method and atmosphere, Atmos. Meas. Tech., 9, 4615–4632, https://doi.org/10.5194/amt-9-4615-2016, 2016. a
For the sake of completeness, we provide here the ice crystal properties used for the DISORT simulations: Fig. 8b (SCF = 80 %, reff=10 µm), Fig. 9b (SCF = 20 %, reff=10 µm), Fig. 9e (SCF = 20 %, reff=10 µm), Fig. 9h (SCF = 20 %, reff=10 µm), Fig. 9k (SCF = 80 %, reff=5 µm), and Fig. 9n (SCF = 20 %, reff=10 µm).
Note that the term “circumscribed halo” in Um and McFarquhar (2015) was incorrectly used as a collective term for the 22 and 46∘ halos. In fact, the circumscribed halo occurs at high solar elevations when upper and lower tangent arcs merge and is formed by oriented columns instead of randomly oriented hexagonal crystals.
- Abstract
- Introduction
- Retrieval of ice crystal properties
- Application and retrieval results
- Discussion
- Summary and conclusions
- Appendix A: Radiative transfer simulations of halo displays – DISORT (Discrete Ordinate Radiative Transfer) vs. MYSTIC (Monte Carlo code for phYsically correct tracing of photons In Cloudy atmospheres)
- Appendix B: Sensitivity studies
- Code and data availability
- Author contributions
- Competing interests
- Disclaimer
- Acknowledgements
- Review statement
- References