the Creative Commons Attribution 4.0 License.
the Creative Commons Attribution 4.0 License.
Global methane budget and trend, 2010–2017: complementarity of inverse analyses using in situ (GLOBALVIEWplus CH4 ObsPack) and satellite (GOSAT) observations
Daniel J. Jacob
Yuzhong Zhang
Joannes D. Maasakkers
Melissa P. Sulprizio
Lu Shen
Tia R. Scarpelli
Hannah Nesser
Robert M. Yantosca
Jianxiong Sheng
Arlyn Andrews
Robert J. Parker
Hartmut Boesch
A. Anthony Bloom
Shuang Ma
We use satellite (GOSAT) and in situ (GLOBALVIEWplus CH4 ObsPack) observations of atmospheric methane in a joint global inversion of methane sources, sinks, and trends for the 2010–2017 period. The inversion is done by analytical solution to the Bayesian optimization problem, yielding closed-form estimates of information content to assess the consistency and complementarity (or redundancy) of the satellite and in situ data sets. We find that GOSAT and in situ observations are to a large extent complementary, with GOSAT providing a stronger overall constraint on the global methane distributions, but in situ observations being more important for northern midlatitudes and for relaxing global error correlations between methane emissions and the main methane sink (oxidation by OH radicals). The in-situ-only and the GOSAT-only inversions alone achieve 113 and 212 respective independent pieces of information (DOFS) for quantifying mean 2010–2017 anthropogenic emissions on 1009 global model grid elements, and respective DOFS of 67 and 122 for 2010–2017 emission trends. The joint GOSAT+ in situ inversion achieves DOFS of 262 and 161 for mean emissions and trends, respectively. Thus, the in situ data increase the global information content from the GOSAT-only inversion by 20 %–30 %. The in-situ-only and GOSAT-only inversions show consistent corrections to regional methane emissions but are less consistent in optimizing the global methane budget. The joint inversion finds that oil and gas emissions in the US and Canada are underestimated relative to the values reported by these countries to the United Nations Framework Convention on Climate Change (UNFCCC) and used here as prior estimates, whereas coal emissions in China are overestimated. Wetland emissions in North America are much lower than in the mean WetCHARTs inventory used as a prior estimate. Oil and gas emissions in the US increase over the 2010–2017 period but decrease in Canada and Europe. The joint inversion yields a global methane emission of 551 Tg a−1 averaged over 2010–2017 and a methane lifetime of 11.2 years against oxidation by tropospheric OH (86 % of the methane sink).
- Article
(9980 KB) - Full-text XML
-
Supplement
(763 KB) - BibTeX
- EndNote
Methane (CH4) is the second most important anthropogenic greenhouse gas and plays a central role in atmospheric chemistry as a precursor of tropospheric ozone and a sink of hydroxyl radicals (OH). It is emitted from many natural and anthropogenic sources that are difficult to quantify (Saunois et al., 2020). Atmospheric methane observations from satellites and in situ (surface, tower, shipboard, and aircraft) platforms have been used extensively to infer methane emissions and their trends through inverse analyses (Houweling et al., 2017). However, the information from satellite and in situ observations does not always agree (Monteil et al., 2013; Bruhwiler et al., 2017) and is hard to compare because of large differences in observational density, precision, and the actual quantity being measured (Cressot et al., 2014). Here we use an analytical solution to the Bayesian inverse problem to quantitatively compare and combine the information from satellite (GOSAT) and in situ (GLOBALVIEWplus CH4 ObsPack) observations for estimating global methane sources and their trends over the 2010–2017 period, including contributions from different source sectors and from the methane sink (oxidation by tropospheric OH).
Inverse analyses of atmospheric methane observations using chemical transport models (CTMs) provide a formal method for inferring methane emissions and their trends (Brasseur and Jacob, 2017). Global satellite observations of atmospheric methane columns from the shortwave infrared SCIAMACHY and GOSAT instruments have been widely used for this purpose (Bergamaschi et al., 2013; Wecht et al., 2014; Turner et al., 2015; Maasakkers et al., 2019; Miller et al., 2019; Lunt et al., 2019). Other inverse analyses have relied on in situ methane observations that have much higher precision, are more sensitive to surface emissions, and may include isotopic information, but are much sparser (Pison et al., 2009; Bousquet et al., 2011; Miller et al., 2013; Patra et al., 2016; McNorton et al., 2018).
A number of inverse analyses have combined in situ and satellite observations (Bergamaschi et al., 2007, 2009, 2013; Fraser et al., 2013; Monteil et al., 2013; Cressot et al., 2014; Houweling et al., 2014; Alexe et al., 2015; Ganesan et al., 2017; Janardanan et al., 2020), but few of them have compared the information from the two data streams and then mostly qualitatively. Bergamaschi et al. (2009, 2013), Fraser et al. (2014), and Alexe et al. (2015) found that surface and satellite methane observations provided consistent constraints on global methane emissions but that satellite observations achieved stronger regional constraints in the tropics. No study, to our knowledge, has compared the ability of satellite and in situ observations to attribute long-term methane trends.
An analytical solution to the inverse problem, as used here, provides closed-form error characterization as part of the solution and, from there, allows derivation of the information content from different components of the observing system (Rodgers, 2000). Application to satellite observations has been used to determine where the observations can actually constrain the inverse solution (Turner et al., 2015). The major obstacle to this analytical solution in the past has been the need to construct the Jacobian matrix for the CTM forward model, but this is now readily done using massively parallel computing clusters (Maasakkers et al., 2019). Such a method provides a means to quantify the differences in information content between different data streams (e.g., satellite vs. in situ) and, from there, to contribute to the design of a better observing system.
Here, we apply satellite observations of atmospheric methane columns from the GOSAT instrument together with an extensive global compilation of in situ observations (including surface, tower, shipboard, and aircraft methane measurements) from the GLOBALVIEWplus CH4 ObsPack v1.0 data product (Cooperative Global Atmospheric Data Integration Project, 2019), to quantify the global distribution of methane emissions, loss from reaction with OH, and related trends for the 2010–2017 period. For this purpose, we use an analytical inversion method that formally characterizes the information content from the two data streams, whether that information is consistent, and whether it is complementary or redundant (Rodgers, 2000; Jacob et al., 2016). Our work provides a comprehensive global perspective on the sources contributing to 2010–2017 methane emissions and trends, as well as a general framework for synthesizing the information from satellite and in situ observations.
Figure 1 summarizes the components of our analytical inversion system, which builds on previous inversions of GOSAT satellite data by Maasakkers et al. (2019) and Zhang et al. (2021) but adds the in situ observations. We apply observations y from GLOBALVIEWplus observations and/or GOSAT (Sect. 2.1), with the GEOS-Chem CTM as the forward model (Sect. 2.3), to optimize the state vector x of our inverse problem. The state vector has dimension n=3378 including mean 2010–2017 non-wetland methane emissions on the GEOS-Chem 4∘ × 5∘ global grid (n1=1009), 2010–2017 linear trends for these emissions on that grid (n2=1009), monthly mean wetland methane emissions for individual years in 14 subcontinental regions (), and tropospheric OH concentrations in each hemisphere for individual years (). Section 2.2 describes the prior state vector estimates (xA) and the prior error covariance matrix (SA). We derive posterior estimates of the state vector and the associated error covariance matrix by analytical solution to the Bayesian optimization problem (Sect. 2.4). We present results from three inversions using in situ observations only (in-situ-only inversion), GOSAT observations only (GOSAT-only inversion), and both GOSAT and in situ observations (GOSAT+ in situ inversion).
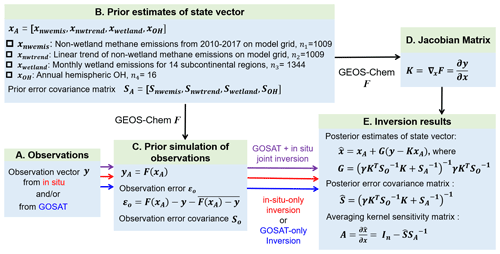
Figure 1Analytical inversion framework. The inversion is applied to GOSAT and GLOBALVIEWplus in situ observations for 2010–2017. GEOS-Chem is the chemical transport model (CTM) used as the forward model for the inversion. γ is a regularization factor in the Bayesian cost function (see text).
2.1 Methane observations
The GLOBALVIEWplus CH4 ObsPack v1.0 data product compiled by the National Oceanic and Atmospheric Administration (NOAA) Global Monitoring Laboratory includes worldwide high-accuracy measurements of atmospheric methane concentrations from different observational platforms (surface, tower, shipboard, and aircraft) (Cooperative Global Atmospheric Data Integration Project, 2019). Here, we use the ensemble of GLOBALVIEWplus observations for 2010–2017. For surface and tower measurements, we use only daytime (10:00–16:00 LT, local time) observations and average them to the corresponding daytime mean values. We exclude outliers at individual sites that depart by more than 3 standard deviations from the mean. In this manner, we obtain 157 054 observation data points for the inversion, including 81 119 from 103 surface sites, 27 433 from 13 towers, 827 from 3 ship cruises, and 47 675 from 29 aircraft campaigns. Figure 2a shows the mean methane concentrations in 2010–2017 from the in situ data. The data are relatively dense in North America and western Europe, with also a few sites in China, but otherwise mainly measure background concentrations. The number of available surface and tower observations increases from 10 493 in 2010 to 19 657 in 2017 with the largest changes in Europe and Canada.
GOSAT is a nadir-viewing satellite instrument launched in 2009 that measures the backscattered solar radiation from a sun-synchronous orbit at around 13:00 LT (Butz et al., 2011; Kuze et al., 2016). Observing pixels are 10 km in diameter and separated by about 250 km along-track and cross-track in normal observation mode, with higher-density data collected in targeted observation modes. Methane is retrieved in the 1.65 µm absorption band. We use dry column methane mixing ratios from the University of Leicester version 9.0 Proxy XCH4 retrieval (Parker et al., 2020). The retrieval has a single-observation precision of 13 ppb and a regional bias of 2 ppb (Buchwitz et al., 2015). We use GOSAT data for 2010–2017 including 1.6 million retrievals over land, as shown in Fig. 2b. We do not use glint data over the oceans and data poleward of 60∘ because of seasonal bias and the potential for large errors (Maasakkers et al., 2019).
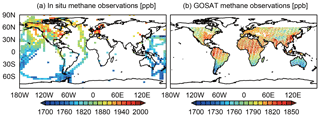
Figure 2Mean 2010–2017 methane observations from the GLOBALVIEWplus ObsPack data product and from GOSAT. The GLOBALVIEWplus in situ data are local dry mixing ratios and are averaged over the 4∘ × 5∘ model grid for visibility. The GOSAT data are dry column mixing ratios on a 1∘ × 1∘ grid from the University of Leicester version 9 Proxy XCH4 retrieval (Parker et al., 2020), excluding observations over oceans and poleward of 60∘ N. Note the difference in color scale between panels.
2.2 Prior estimates
Table 1 summarizes the prior estimates of the mean 2010–2017 methane emissions used for the state vector, and Fig. 3 shows the spatial patterns. Natural sources include the ensemble mean of the WetCHARTs inventory version 1.2.1 (Bloom et al., 2017) for wetlands, open fires from the Global Fire Emissions Database version 4s with seasonal and interannual variability (van der Werf et al., 2017), termites from Fung et al. (1991), and seeps from Etiope et al. (2019) with global scaling to 2 Tg a−1 from Hmiel et al. (2020). The default anthropogenic emissions are from EDGAR v4.3.2 (Janssens-Maenhout et al., 2019) and are superseded for fugitive fuel emissions (oil, gas, coal) by the Scarpelli et al. (2020) inventory which spatially allocates national emissions reported by countries to the United Nations Framework Convention of Climate Change (UNFCCC). US anthropogenic emissions are further superseded by the gridded version of Inventory of U.S. Greenhouse Gas Emissions and Sinks from the Environmental Protection Agency (EPA GHGI) (Maasakkers et al., 2016). The WetCHARTs wetlands inventory includes seasonal and interannual variability that is optimized in the inversion through correction to the monthly emissions. Seasonality from Zhang et al. (2016) is imposed for rice emissions, and temperature-dependent seasonality is applied to manure emissions (Maasakkers et al., 2016). Other emissions are aseasonal.
We assume a 50 % error standard deviation for all anthropogenic and non-wetland natural emissions on the 4∘ latitude × 5∘ longitude grid, with no spatial error covariance so that their prior error covariance matrix is diagonal, which is a reasonable assumption for anthropogenic emissions (Maasakkers et al., 2016). We assume 0 ± 10 % a−1 as a prior estimate for the linear 2010–2017 emission trends on the 4∘ × 5∘ grid; a sensitivity test using 0 ± 5 % a−1 is also performed. The inclusion of linear trends in state vectors allows us to identify the direction of emission change for each 4∘ × 5∘ grid in the 8-year period, but it would not capture high-frequency interannual variability. Prior estimates of monthly mean wetland methane emissions for individual years in 14 subcontinental regions, along with their error covariance matrix, are from the WetCHARTs v1.2.1 inventory ensemble (Bloom et al., 2017). The prior methane emissions total 533 Tg a−1, at the low end of the current top-down estimates (550–594 Tg a−1) for 2008–2017 (Saunois et al., 2020), and this largely reflects the downward revision of global seep emissions by Hmiel et al. (2020).
Prior monthly 3-D fields of global tropospheric OH concentrations are taken from a GEOS-Chem simulation with full chemistry (Wecht et al., 2014) that yields a methane lifetime due to oxidation by tropospheric OH of 10.6 years and an interhemispheric OH ratio (North to South) of 1.16. The methane lifetime is consistent with the value of 11.2 ± 1.3 years inferred from methyl chloroform observations (Prather et al., 2012), while the interhemispheric OH ratio lies between the observed range of 0.97 ± 0.12 (Patra et al., 2014) and the recent multi-model estimates of 1.3 ± 0.1 (Zhao et al., 2019). We assume no interannual variability in this prior OH field. We assume 10 % as the prior error standard deviation for the hemispheric OH concentrations in individual years, based on Holmes et al. (2013), and also conduct a sensitivity test assuming 5 %. Corrections to OH in the inversion are applied as a hemispheric scaling factor for individual years, without changing the spatial or temporal pattern of the original fields. Zhang et al. (2018) conducted methane inversions with 12 different OH fields from the Atmospheric Chemistry and Climate Model Intercomparison Project (ACCMIP) model ensemble (Naik et al., 2013) and found no significant difference in results with the GEOS-Chem OH fields used here except for two outlier models.
2.3 Forward model
We use the GEOS-Chem 12.5.0 (http://geos-chem.org, last access: 20 June 2020) global CTM (Bey et al., 2001; Wecht et al., 2014; Maasakkers et al., 2019) as the forward model to simulate atmospheric methane concentrations and their sensitivity to the state vector elements. The model is driven by the Modern-Era Retrospective Analysis for Research and Applications, Version 2 (MERRA-2) reanalysis meteorological fields from the NASA Global Modeling and Assimilation Office (GMAO) (Gelaro et al., 2017). The methane sink is computed within the model from 3-D tropospheric oxidant fields including OH (optimized in the inversion), Cl atoms (Wang et al., 2019), 2-D stratospheric oxidant fields (Murray et al., 2012), and soil uptake (Murguia-Flores et al., 2018). We conduct GEOS-Chem model simulations for 2010–2017 at a global 4∘ × 5∘ resolution with 47 vertical layers extending to the mesosphere.
GEOS-Chem has excessive methane in the high-latitude stratosphere, a flaw common to many models (Patra et al., 2011), especially at coarse model resolution. Following Zhang et al. (2021), we compute correction factors to GEOS-Chem stratospheric methane subcolumns as a function of season and equivalent latitude to match the measurements from the solar occultation Atmospheric Chemistry Experiment Fourier transform spectrometer (ACE-FTS) v3.6 instrument (Waymark et al., 2014; Koo et al., 2017). As shown in Zhang et al. (2021), the correction can be up to 10 % at high latitudes during winter and spring. We apply the correction factors before the inversion to avoid wrongly attributing this model transport bias to methane emissions and loss. Figure S1 shows that the systematic differences in the posterior scaling factors of non-wetland emissions with and without bias correction are more prominent at the northern high latitudes, as also shown in Stanevich et al. (2020), but the global total emissions only differ by 1 %.
Initial GEOS-Chem methane concentrations on 1 January 2010 are adjusted to have an unbiased zonal mean relative to GOSAT observations for January 2010, and we find that the resulting model values are also unbiased relative to the GLOBALVIEWplus in situ observations in January 2010. In this manner, model discrepancies with observations over the 2010–2017 period can be attributed to model errors in emissions or OH over that period, instead of error in initial conditions. We archive model methane dry mixing ratios at each location and time of the in situ and GOSAT data sets for 2010–2017.
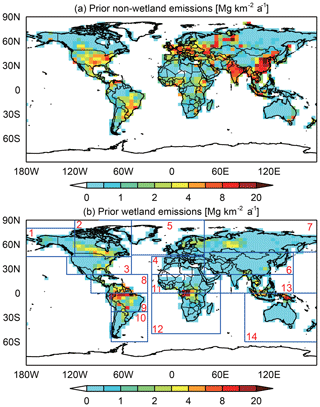
Figure 3Prior estimates of mean 2010–2017 methane emissions. Panel (a) shows the non-wetland emissions on the 4∘ × 5∘ grid used for the inversion. Panel (b) shows the wetland emissions and the 14 subcontinental wetland regions used for the inversion following Bloom et al. (2017).
Table 1Global sources and sinks of atmospheric methane, 2010–2017a.
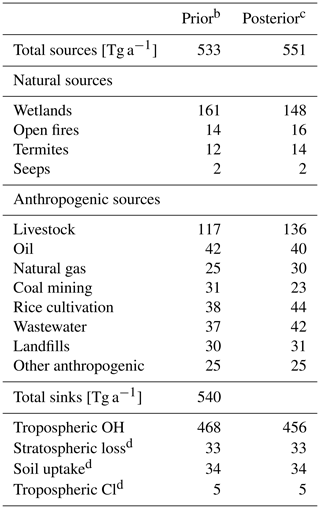
a The 8-year mean values for 2010–2017. b Prior natural source estimates (2000–2017 means) are from Bloom et al. (2017) for wetlands, Etiope et al. (2019) and Hmiel et al. (2020) for seeps, Fung et al. (1991) for termite emissions, and van der Werf et al. (2017) for open fire emissions. Prior anthropogenic source estimates for 2012 are from EDGAR v4.3.2 (Janssens-Maenhout et al., 2017) except for fuel exploitation (oil, gas, coal), which is from Scarpelli et al. (2020), and are overwritten for the US with the gridded EPA inventory of Maasakkers et al. (2016). The prior tropospheric OH concentration field is from Wecht et al. (2014) and yields a methane lifetime against oxidation by tropospheric OH of 10.6 years. c Posterior estimates are from the joint inversion of GOSAT and in situ data. d These minor sinks are not optimized by the inversion.
As the forward model F for the inversion, GEOS-Chem relates the state vector x to the atmospheric concentrations y as y=F(x) (Fig. 1). The simulation of observations with the prior estimates of state vectors (xA) in 2010–2017 diagnoses systematic errors in comparison to observations that enable an improved estimate of the state vector through the inversion. In addition, the random component of the discrepancy can be used to estimate the observation error (sum of instrument error, representation error, and forward model error) in the Bayesian optimization problem using the residual error method (Heald et al., 2004). The method assumes that the systematic component of the model bias () for individual years, where the overbar denotes the temporal average in a 4∘ × 5∘ grid cell (for GOSAT) or for an observation platform (for in situ observations), is to be corrected in the inversion, while the residual term () represents the random observation error. Here, we applied this method to construct the observation error covariance matrix SO from the statistics of εO For in-situ observations, we derive εO separately for the ensemble of background surface sites (Dlugokencky et al., 1994), non-background sites, tower sites, shipboard measurements, and aircraft measurements, while for GOSAT observations εO is calculated for each 4∘ × 5∘ grid cell.
We find that the mean standard deviation of the random observation error (εO) for the GLOBALVIEWplus in situ data averages 36 ppbv (20 and 45 ppbv for background and non-background surface observations, 68 ppbv for tower observations, 10 ppbv for shipboard observations, and 24 ppbv for aircraft observations), compared with 13 ppbv for GOSAT. The observation error for in situ observations is dominated by the forward model error, whereas it is dominated by the instrument error for GOSAT. The forward model error is higher for surface concentrations near source regions than for columns or other in situ observations measuring background, because the amplitude of methane variability is much higher (Cusworth et al., 2018) and more challenging for a model at 4∘ × 5∘ resolution to capture. We assume that SO is diagonal in the absence of better objective information, but in fact some error correlation between different observations could be expected to arise from transport and source aggregation errors in the forward model. This is considered by introducing a regularization factor γ in the minimization of the cost function for the inversion (Sect. 2.4).
2.4 Analytical inversion
The Bayesian solution to the state vector optimization problem assuming Gaussian prior and observation errors involves minimizing the cost function J(x):
where x is the state vector, xA denotes the prior estimate of x, SA is the prior error covariance matrix, y is the observation vector, F(x) represents the GEOS-Chem simulation of y, SO is the observation error covariance matrix, and γ is a regularization factor. The need for γ in J(x) is to avoid giving excessive weighting to observations, due to the likely underestimation of SO when unknown error correlations are not included in its construction (Zhang et al., 2018; Maasakkers et al., 2019). γ here plays the same role as the regularization parameter in Tikhonov methods (Brasseur and Jacob, 2017) and reflects our inability to properly quantify the magnitude of errors.
Minimization of the cost function in Eq. (1) has an analytical solution if the forward model is linear (Rodgers, 2000). The optimization of methane emission and its trends is strictly linear by design because we use prescribed monthly 3-D OH fields as described in Sect. 2.2. There is some nonlinearity regarding the optimization of OH, because the sensitivity of the methane concentration to changes in OH concentrations depends on the methane concentration through first-order loss, but we assume that the variability of methane concentration is sufficiently small that this nonlinearity is negligible (we verify this assumption below). Thus, we express the GEOS-Chem forward model as , where represents the Jacobian matrix, and c is an initialization constant. We construct the Jacobian matrix K explicitly by conducting GEOS-Chem simulations with each element of the state vector perturbed separately. For the linear emission trend elements, this is done by perturbing the 2010–2017 emission trend in each grid cell from 0 % (the best prior estimate) to 10 % a−1; for OH, this is done by perturbing yearly hemispheric OH fields by 20 % without modifying the spatial or seasonal distribution. Comparison of the resulting Jacobian matrix to GEOS-Chem as shows a negligible residual difference of 2 ± 3 ppb, verifying the assumption of linearity.
Minimizing the Bayesian cost function by solving yields closed-form expressions for the posterior estimate of the state vector with error covariance matrix S:
where G is the gain matrix,
From the posterior error covariance matrix one can derive the averaging kernel matrix describing the sensitivity of the posterior estimate to the true state:
The trace of A quantifies the degrees of freedom for signal (DOFS), which represents the number of pieces of independent information gained from the observing system for constraining the state vector (Rodgers, 2000).
We choose the value of the regularization parameter γ in order to avoid overfitting to the observations when the number m of observations is much larger than the number n of state vector elements, and the error covariance of the observations cannot be properly quantified. Overfitting would be implied by a highly unlikely departure of the posterior solution from the prior estimate, which can be indicated by the posterior cost function. For a given state vector element i,the expected value of (xi−xAi)2 is the prior error variance . For an n-dimensional state vector with a diagonal prior error covariance matrix, the state component JA of the cost function is the sum of n random normal elements
and its PDF (probability density function) is given by the chi-square distribution with n degrees of freedom (n=3378 in this case), with an expected value of n and a standard deviation of . One can apply the same reasoning to the observation component JO of the posterior cost function,
whose PDF follows a chi-square distribution with m degrees of freedom. However, this component is less sensitive to the choice of γ because of the large random error component for individual observations.
Figure 4 shows the dependences of and on the choice of the regularization parameter γ, for the in situ and GOSAT observations. The in situ observations are sufficiently sparse that γ=1 (no regularization) is expected. In the case of GOSAT, however, γ=1 would yield which indicates overfitting, whereas γ=0.1 yields which is the expected value and is used here. This can be explained by the high observation density of GOSAT, such that error correlation between individual observations through the forward model may be expected and would have a large effect on the solution. Maasakkers et al. (2019) found that γ=0.05 and γ=0.1 gave similar solutions in their global inversions of GOSAT data. We also conduct sensitivity tests using γ=0.5 for in situ observations and γ=0.05 for GOSAT observations.
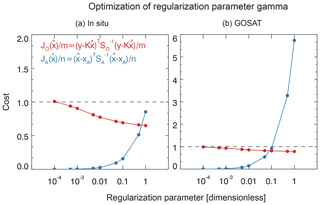
Figure 4Optimization of the regularization parameter γ in the Bayesian cost function (Eq. 1). The figure shows the posterior observation component and the posterior state component for the in-situ-only and GOSAT-only inversions.
The analytical solution to the Bayesian optimization problem, as done here, has several advantages relative to the more commonly used variational (numerical) solution: (1) it finds the true minimum in the cost function, rather than an approximation that may be sensitive to the choice of initial estimate; (2) it identifies the information content of the inversion and the ability to constrain each state vector element; and (3) it enables a range of sensitivity analyses, modifying the prior estimates, modifying the error covariance matrices, adding/subtracting observations, and so on, at minimal computational cost. We will make use of these advantages in comparing the ability of the in-situ-only, GOSAT-only, and GOSAT+ in situ inversions, and to test how choices in cost-function construction affect our conclusions, including changing the regularization parameter γ, changing the prior error estimates, and using different types of in-situ observations. Our analysis will focus on results from the base inversions with the default settings, but we will use results from the sensitivity inversions to address specific issues.
A requirement of the analytical approach is that the Jacobian matrix be explicitly constructed, requiring n+1 forward model runs. Building the Jacobian matrix for the 3378 state vectors in this 8-year period study requires about 1 million core hours (8 cores × 36 h per simulation × 3378 simulations). However, this construction is readily done in parallel on high-performance computing clusters.
Our inversion returns posterior emission estimates and their temporal trends on a 4∘ × 5∘ grid for non-wetland emissions, and monthly mean wetland emissions for individual years in 14 subcontinental regions. We cannot separate individual sectors within a 4∘ × 5∘ grid cell because they will all have the same response function (Jacobian column). However, we can aggregate results spatially and by sector in a way that retains the error covariance of the solution (Maasakkers et al., 2019). Consider a reduced state vector xred representing a linear combination of the original state vector elements that may be a sum over a particular region or the globe and may be weighted by the contributions from individual sectors following the prior distribution. The linear transformation from the posterior full-dimension state vector x to the reduced state vector xred is defined by a summation matrix W:
The posterior error covariance and averaging kernel matrices for the reduced state vector can then be calculated as follows:
where (Calisesi et al., 2005). provides a means to determine error correlations between aggregates of quantities optimized by the inversion (e.g., between global methane emissions and global OH concentrations). Ared provides a means to determine the ability of the inversion to constrain an aggregated term (e.g., emissions from a particular sector).
3.1 Ability to fit the in situ and GOSAT data
We will present results from three different inversions for 2010–2017: (1) using only in situ observations (in-situ-only inversion), (2) using only GOSAT observations (GOSAT-only inversion), and (3) using both GOSAT and in situ observations (GOSAT+ in situ inversion). Here we first evaluate the ability of these different inversions to fit the in situ and GOSAT observations, including when the data are not used in the inversion (consistency check). This is done by conducting GEOS-Chem simulations with posterior values for the state vectors and comparing them to observations.
Figures 5 and 6 show the resulting comparisons for the in situ observations, arranged by type of platform (Fig. 5), and by latitude bands and months (Fig. 6a–d). The model simulation with prior estimates shows a 30–60 ppb low bias for all in situ platforms growing with time. The in-situ-only inversion effectively corrects this bias and its trend, and it also significantly improves the correlations across all platforms. The GOSAT-only inversion performs comparably in correcting the 2010–2017 trend for the independent in-situ data (Fig. 6c) and bias for background observations (e.g., aircraft observations in the Southern Hemisphere; Fig. S2), but there is a low bias at northern midlatitudes reflecting surface and tower data in North America and Europe. As we will see, the in situ observations are important for optimizing emissions in these regions.
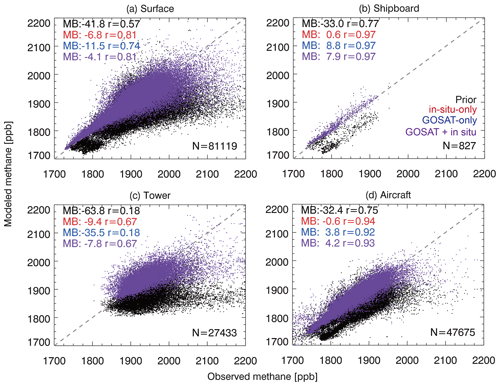
Figure 5Ability of the inversions to fit the in situ methane observations. Panels (a)–(d) compare the surface, tower, shipboard, and aircraft observations in 2010–2017 to the GEOS-Chem simulation using the prior (black) and posterior estimates of methane emissions and OH concentrations from the in-situ-only inversion (red, dots not shown), GOSAT-only inversion (blue, dots not shown), and GOSAT+ in situ joint inversion (purple). The numbers (N) of observations from each platform, the mean bias (MB), and the correlation coefficients (r) between the observed and simulated values are shown inset.
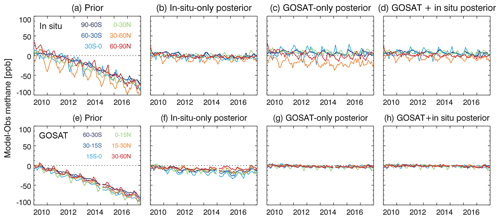
Figure 6Ability of the inversions to fit the in situ methane observations and GOSAT satellite observations. Panels (a)–(d) show the monthly time series of the differences between observed and simulated in situ methane concentrations averaged over different latitude bands from 2010–2017. Panels (e)–(h) are the same as panels (a)–(d) but for GOSAT methane concentrations.
Figure 6e–h also compare the fits to the GOSAT observations. The GOSAT-only inversion corrects the bias and trend in the prior simulation at all latitudes. The in-situ-only inversion corrects the trends, but it biases low to the GOSAT observations by about 10 ppbv with larger bias in the Southern Hemisphere due to the sparsity of in situ observation there. The comparison suggests that in situ and GOSAT observations are largely consistent for informing the global methane change but also have some complementarity for the inversion. The GOSAT+ in situ joint inversion shows good agreement with both the in situ and GOSAT observations.
Figure 7a further evaluates the global methane growth rate as determined by the methane budget imbalance for individual years in 2010–2017 from the three inversions. The observed methane growth rate inferred from the NOAA sites (https://www.esrl.noaa.gov/gmd/ccgg/trends_ch4/, last access: 20 June 2020) averages 7.2 ± 2.8 ppb a−1 over the period, peaking in 2014, and accelerating overall with higher growth in 2015–2017 than in 2010–2013. We find that all posterior simulations show a comparable mean methane growth rate (7.7 ± 3.7 ppb a−1 for the in-situ-only inversion, 8.8 ± 2.2 ppb a−1 for the GOSAT-only inversion, and 8.3 ± 1.8 ppb a−1 for the GOSAT+ in situ inversion). However, the in-situ-only inversion overestimates the increasing trend in the methane growth rate, largely driven by the year 2017, and fails to fit its interannual variability. This may reflect the heavy weighting of the in situ observations toward northern midlatitudes. GOSAT observations in the inversion do much better in capturing the observed methane interannual variability and trend. Adding in situ observations to GOSAT observations provides a better fit in 2015 than GOSAT-only inversion but has an insignificant effect in other years. Zhang et al. (2021) interpreted the trend and interannual variability in the GOSAT-only inversion as due to a combination of anthropogenic emissions, wetlands, and OH concentrations.
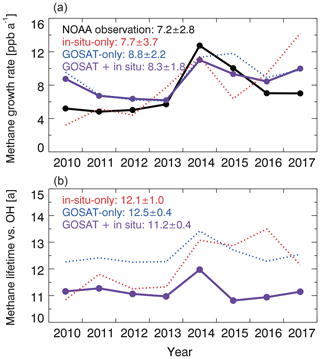
Figure 7(a) Annual global growth rate of atmospheric methane, 2010–2017. Results from our three different inversions (in-situ-only, GOSAT-only, and GOSAT+ in situ) are compared to the observed growth rates inferred from the NOAA surface observational network (https://www.esrl.noaa.gov/gmd/ccgg/trends_ch4/, last access: 20 June 2020). Mean annual growth rates and standard deviations from the different inversions are shown inset. (b) Methane lifetime against oxidation by tropospheric OH, 2010–2017, from the three different inversions. Mean lifetime and standard deviations are shown inset. The methane lifetime in the prior estimate is 10.6 years.
3.2 Anthropogenic methane emissions
Figure 8 shows the averaging kernel sensitivities (diagonal elements of the averaging kernel matrix) and posterior scaling factors for the non-wetland emissions (dominated by anthropogenic emissions) in the in-situ-only, GOSAT-only, and GOSAT+ in situ joint inversions. The DOFS (trace of the averaging kernel matrix) quantify the number of independent pieces of information from the inversion, starting from 1009 unknowns for anthropogenic emissions (Fig. 1). The DOFS are 113 for the in-situ-only inversion, 212 for the GOSAT-only inversion, and 262 for the GOSAT+ in situ joint inversion. The higher DOFS from the joint inversion indicate that the satellite and in situ observations have complementarity but also some redundancy. Strict complementarity would imply a DOFS of . We find that 75 % of the in situ information is at northern midlatitudes (30–60∘ N, DOFS = 82, calculated as the sum of averaging kernel sensitivities in that latitude band) where the observations are densest, with another 9 % (DOFS = 10) at 60–90∘ N. GOSAT provides more information than in situ observations do at northern midlatitudes (DOFS = 96) and dominates in the tropics (DOFS = 105). This dominance of satellites for informing methane sources in the tropics has been pointed out in previous studies (Bergamaschi et al., 2013; Monteil et al., 2013; Fraser et al., 2013; Alexe et al., 2015). We find that the DOFS from the in-situ-only inversion observations are mostly (85 %) from the surface and tower measurements (Fig. S3).
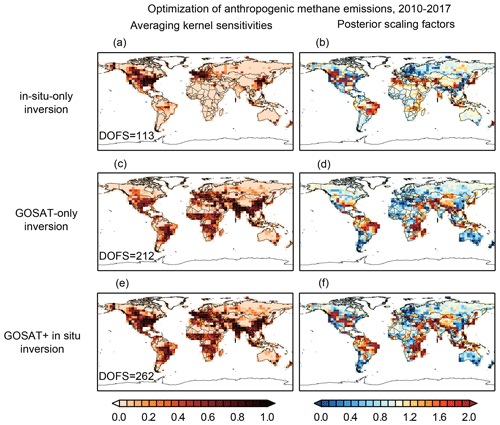
Figure 8Optimization of mean 2010–2017 non-wetland (mainly anthropogenic) emissions. The in-situ-only inversion uses in situ observations, the GOSAT-only inversion uses GOSAT satellite observations, and the GOSAT+ in situ inversion uses both. Panels (a), (c), and (e) show the averaging kernel sensitivities (diagonal elements of the averaging kernel matrix) for each inversion, with the degrees of freedom for signal (DOFS, defined as the trace of the averaging kernel matrix) given inset. Panels (b), (d), and (f) show the correction factors to the prior emissions (Fig. 3a). Wetland emissions are corrected separately (see text).
We further investigate the inversion results for northern midlatitudes where most of the information of in situ observations is contained, including for the US, Canada, Europe, and China. Table 2 gives the optimization of anthropogenic methane emissions (calculated as the difference between total non-wetland emissions and the non-wetland natural emissions) in these regions. Figure 9 shows the optimization by source sectors, assuming that (1) the partitioning between sectors of non-wetland emissions in individual grid cells is correct in the prior inventory (this does not assume that the prior distribution of sectoral emissions is correct) and that (2) the scaling factors are to be applied equally to all sectors in a grid cell. These assumptions are adequate when the sectors are spatially separated but are more prone to error when they spatially overlap. Figure 9 also shows the averaging kernel sensitivities of emission sectors (diagonal terms of Ared derived from Eqs. 8 and 10), measuring the ability of the inversion to optimize different emissions sectors, and the DOFS for each inversion summed over the region. Wetland methane emissions are optimized separately as will be discussed in Sect. 3.3.
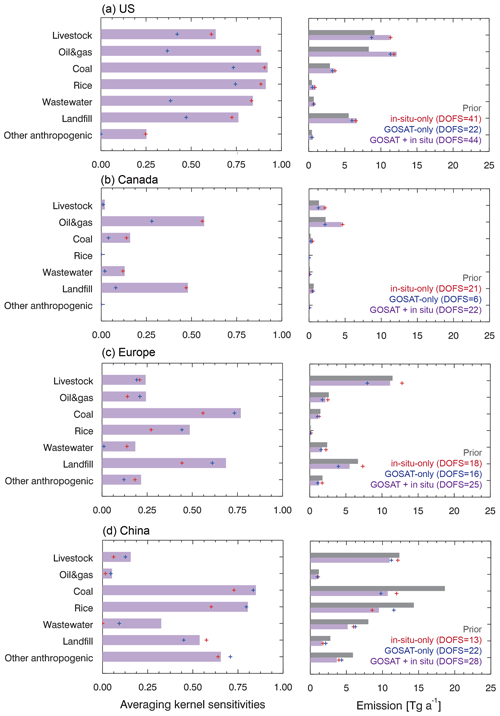
Figure 9Optimization of anthropogenic methane emissions by source sectors in the in-situ-only, GOSAT-only, and GOSAT+ in situ inversions. The left panel shows the averaging kernel sensitivities for each emission sector (see text for description), and the right panel shows the emissions. Europe is defined as west of 30∘ E, which excludes Russia.
Table 2Anthropogenic methane emissions and trends, 2010–2017a.
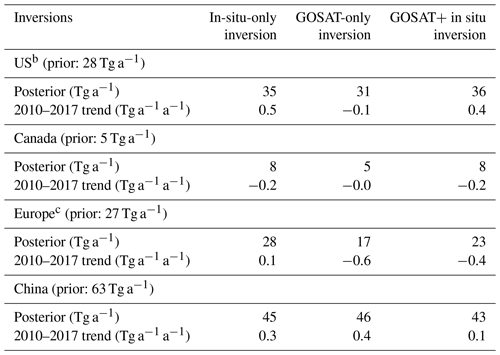
a Posterior estimates of mean 2010–2017 emissions and trends for the in-situ-only, GOSAT-only, and GOSAT+ in situ joint inversions. b Including contiguous US and Alaska. c Europe is defined as west of 30∘ E, excluding Russia.
Inspection of the DOFS shows that the in situ observations are more effective than GOSAT for optimizing US anthropogenic methane emissions (DOFS = 41 vs. DOFS = 22) and this applies to all sectors (Fig. 9). The averaging kernel sensitivities panel in Fig. 9 shows that US results from the joint GOSAT+ in situ inversion are mostly determined by the in situ observations. The joint GOSAT+ in situ inversion increases anthropogenic US emissions from 28 Tg a−1 in the prior EPA GHGI to 36 Tg a−1, with most of the increase driven by oil and gas sources in the central US. Averaging kernel sensitivity for major sectors is large (0.63–0.93), indicating that the posterior estimates are mostly determined by the observations rather than by the prior estimates. The underestimate of oil and gas emissions in the EPA GHGI has been reported before in local observations and higher-resolution inversions (Miller et al., 2013; Turner et al., 2015; Alvarez et al., 2018; Cui et al., 2019; Maasakkers et al., 2021).
The in situ observations are also more effective than GOSAT in optimizing anthropogenic methane emissions in Canada (DOFS = 21 vs. DOFS = 6), particularly in Alberta where oil and gas emissions are high (Fig. 8). This reflects in part our exclusion of GOSAT data poleward of 60∘ N. Oil and gas emissions in Canada increase by a factor of 2 in the GOSAT+ in situ inversion to 4.5 Tg a−1 compared with the UNFCCC prior estimate, with an averaging kernel sensitivity of 0.57 (Fig. 9). Total anthropogenic emissions increase from 5 to 8 Tg a−1.
In situ and GOSAT observations show comparable ability in optimizing the total anthropogenic emissions in Europe (DOFS = 16–18). They agree that prior anthropogenic methane emissions are too high in northern Europe but disagree in southern Europe. Averaging kernel sensitivities from the in-situ-only inversion are slightly weaker than for the US and Canada because of the lower density of in situ sites. The Integrated Carbon Observation system (ICOS) network (https://www.icos-cp.eu/, last access: 17 July 2020) has substantially increased the number of available methane observations in Europe since 2017 so that future inversions should expect a stronger constraint from in situ observations. Total European anthropogenic emissions decrease from 27 to 23 Tg a−1 in the GOSAT+ in situ joint inversion with decreases for all sectors, but this may reflect the inability of our 4∘ × 5∘ resolution to effectively separate emission sectors.
The only other region where in situ observations provide significant information is China, although the corresponding DOFS of 13 is less than for GOSAT (DOFS = 22). Both inversions agree that emissions must be greatly decreased from the prior estimate, and the joint inversion (DOFS = 28) has stronger power in doing so. The posterior 2010–2017 Chinese anthropogenic emission is 43 Tg a−1 in the joint inversion, compared with 63 Tg a−1 in the prior estimate. Our results agree with a recent study by Janardanan et al. (2020), which also used GOSAT and surface observations to estimate a mean 2011–2017 anthropogenic methane emission in China of 46 ± 9 Tg a−1. The downward correction is mainly driven by a 40 % decrease in coal emissions from 19 to 11 Tg a−1 (Fig. 9). Previous inversions using the EDGAR inventory (> 20 Tg a−1) as a prior estimate found a similar correction (Alexe et al., 2015; Thompson et al., 2015; Turner et al., 2015; Maasakkers et al., 2019; Miller et al., 2019). In our case, the prior estimate of coal emissions (19 Tg a−1) is the value reported by China to the UNFCCC, and we find that it is still too high. A recent inventory by Sheng et al. (2019) gives a coal emission estimate of 15 Tg a−1 for China in 2010–2016.
3.3 Wetland methane emissions
The inversion optimizes wetland emissions for the 14 regions of Fig. 3 and for 96 individual months covering 2010–2017, amounting to 1344 state vector elements. Results from the in-situ-only, GOSAT-only, and GOSAT+ in situ inversions yield DOFS of 221, 183, and 301, respectively. In situ observations provide more information for boreal wetlands, whereas GOSAT dominates for tropical wetlands.
Zhang et al. (2021) give a detailed analysis of GOSAT-only inversion results for tropical wetlands. Here we further analyzed the boreal and temperate North America wetlands, where in situ observations provide significant added information (Fig. 10). Both in situ and GOSAT observations agree that the prior WetCHARTs emissions are too high. The posterior estimates from the GOSAT+ in situ inversion are 4.5 and 2.0 Tg a−1 for boreal and temperate North America, respectively, compared with 12.8 and 6.9 Tg a−1 in WetCHARTs. Posterior boreal wetland CH4 emissions for North America are on the lower end but within the WetCHARTs estimates (WetCHARTs models range 3–33 Tg a−1); however, posterior temperate CH4 emissions for North America are outside the WetCHARTs range (3–12 Tg a−1). The correction for boreal North America is particularly large in May–June, which can potentially be attributed to the suppression of wetland emissions by either snow cover (Pickett-Heaps et al., 2011) or frozen soils (Zona et al., 2016). The WetCHARTs emission overestimate for temperate North America (mainly coastal wetlands in the eastern US) has been reported before from inversions using aircraft data (Sheng et al., 2018) and GOSAT data (Maasakkers et al., 2021).
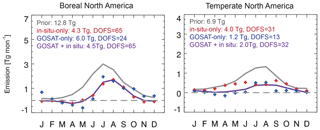
Figure 10Wetland emissions in boreal and temperate North America (regions 2 and 3 of Fig. 3). Prior and posterior estimates of the monthly mean wetland emissions averaged over 2010–2017 from different inversions are shown. Annual mean emissions and the degree of freedom for signal (DOFS) for monthly emissions in individual years are shown inset. Note the differences in scale between panels. Negative emissions are allowed statistically by the inversion but are likely not physical.
3.4 Anthropogenic methane emission trends
Figure 11 presents the 2010–2017 trends (% a−1) of anthropogenic methane emissions from the three inversions and the corresponding averaging kernel sensitivities. The GOSAT+ in situ inversion has a DOFS of 161 for quantifying the spatial distribution of the trends. Most of that information is from GOSAT (DOFS = 122) but in situ observations add significant information. Information from in situ observations is concentrated in the US, Canada, Europe, and China. Table 2 summarizes the trends for the four regions. Figure 12 shows the trends disaggregated by sectors, using the same procedure as for Fig. 9.
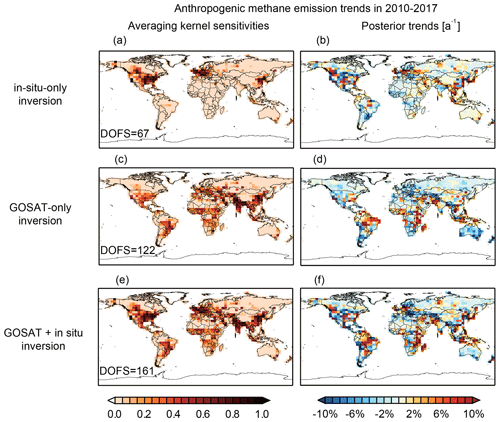
Figure 11Same as Fig. 8 but for optimization of non-wetland (mainly anthropogenic) emission trends (% a−1) in 2010–2017.
In situ observations provide stronger constraints than GOSAT on anthropogenic emission trends in the US (DOFS = 29 vs. DOFS = 12). They agree on the upward trend in the eastern US as also found in Maasakkers et al. (2021) which used GOSAT in a high-resolution inversion to interpret methane trends in the US in 2010–2015. However, they show opposite trends (positive trend from in-situ-only inversion but negative from GOSAT-only inversion) in total emissions and in the central south US (Table 2, Fig. 11). The GOSAT+ in situ joint inversion (DOFS = 31) estimates that US anthropogenic methane emissions increased by 0.4 Tg a−1 a−1 (1.1 % a−1) from 2010–2017, with the largest contribution from oil and gas emissions (0.3 Tg a−1 a−1, 2.5 % a−1). This posterior trend is much smaller than previous studies showing large increases in US oil and gas emissions (2.1–4.4 Tg a−1 a−1) inferred from ethane and propane levels (Franco et al., 2016; Hausmann et al., 2016; Helmig et al., 2016), but it is more consistent with a recent study by Lan et al. (2019) that reported 0.3 ± 0.1 Tg a−1 a−1 in 2006–2015 based on long-term in situ measurements. The inversion also reveals rising emissions from oil and gas in the central south US, including the Permian Basin which is currently the largest oil-producing basin in the US (Zhang et al., 2020).
We find that anthropogenic emissions in Canada decrease over the 2010–2017 period by 0.2 Tg a−1 a−1 (2.5 % a−1) in the GOSAT+ in situ joint inversion, mostly driven by oil and gas emissions in Alberta and livestock emissions (Figs. 11, 12). Anthropogenic emissions in Europe decrease by 0.4 Tg a−1 a−1 (1.7 % a−1).
All three inversions show increases of 0.1–0.4 Tg a−1 a−1 (0.3 % a−1–0.9 % a−1) in Chinese anthropogenic methane emissions over 2010–2017, but the spatial patterns and source attributions are different. The largest difference is for coal mining emissions in the North China Plain, where in situ observations indicate a decrease of −0.8 Tg a−1 a−1 whereas GOSAT shows an increase of 0.1 Tg a−1 a−1. A previous GOSAT inversion study found a large increase in coal mining emissions in China over 2010–2015 (Miller et al., 2019). However, a recent bottom-up inventory estimates that Chinese coal emission peaked in 2012 and decreased afterward, leading to no significant overall trend for 2010–2016 (Sheng et al., 2019). Our inversion assumes linear trends in emissions over 2010–2017 but that may not be appropriate for China.
3.5 Global methane budget for 2010–2017
Table 1 shows the optimized global anthropogenic emissions from different sectors as determined by the joint GOSAT+ in situ inversion. Corrections to the global prior estimates are mostly determined by GOSAT (Fig. 8). They include upward corrections to livestock and rice methane emissions as well as downward correction to the coal mining emissions driven by overestimation in China. The joint inversion also estimates a global increase in anthropogenic emissions of 1.7 ± 0.6 Tg a−1 a−1 (0.5 % a−1) in 2010–2017, dominantly driven by trends in the tropics (Fig. 11).
A number of previous studies have analyzed surface observations to interpret global methane budgets and trends (Dlugokencky et al., 2009; Bruhwiler et al., 2014; Houweling et al., 2017). As shown in Fig. 6, our in-situ-only inversion can fit the GOSAT observations of global methane distribution and trend, indicating that the in situ data provide useful information on the global budget. Here, we examine whether this information adds to that from GOSAT. For this purpose and following Maasakkers et al. (2019), we collapse the full state vector to a reduced state vector () that contains global mean methane emissions and OH as elements, and we derive the associated error covariance matrix () as introduced in Sect. 2.4.
Figure 13 shows the joint probability density functions (PDFs) of the mean anthropogenic methane emissions and methane lifetime against oxidation by tropospheric OH from the three inversions. There is strong negative correlation () between the optimization of methane emissions and OH in the GOSAT-only inversion, and somewhat less in the in-situ-only inversion (), although the posterior error variance is larger due to the lower data density as indicated by the axes of the ellipses. A sensitivity inversion using only the surface and tower measurements in the in-situ-only inversion yields (Fig. 13b). It indicates that in situ observations, in particular surface and tower measurements, are more effective than the satellite observations in constraining methane emissions independently from the sink by OH. A likely reason is that surface measurements in source regions are more sensitive to methane emissions than column measurements are. We also find that the in-situ-only inversion yields a larger interannual variability of posterior OH concentrations and, thus, methane lifetime than the GOSAT-only inversion (Figs. 7b, S4). This is because the number and location of the observations varies from year to year, particularly for aircraft campaigns and ship cruises.
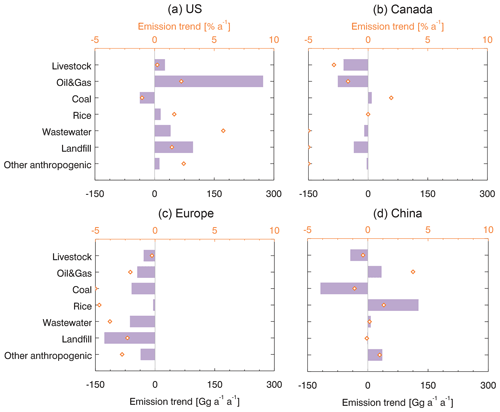
Figure 12Optimization by sector of regional anthropogenic methane emission trends in 2010–2017. Bars and diamonds represent trends in gigagrams per annum per annum (Gg a−1 a−1, bottom axis) and percent per annum (% a−1, top axis) over the 2010–2017 period from the GOSAT+ in situ joint inversion.
Comparison of the posterior PDFs between the GOSAT-only and in-situ-only inversions implies that the two are inconsistent in optimizing global methane budgets, as the 99 % probability contours do not overlap (Fig. 13a). A possible cause is that the posterior error covariance matrix underestimates the actual error variance due to its assumption of independent identically distributed (IID) observational errors (Brasseur and Jacob, 2017), and this would particularly affect the global budget which sums emission results for individual grid cells. Remarkably, the solution from the GOSAT+ in situ joint inversion is more in agreement with in situ observations than GOSAT and does not lie between these two solutions. Inspection of Fig. 6c shows that the GOSAT-only inversion is biased low relative to in situ observations at northern midlatitudes and biased high in the Southern Hemisphere, implying that both emissions and OH concentrations are too low. On the other hand, Fig. 6f indicates either underestimation of emissions or overestimation of OH concentrations in the in-situ-only inversion; the former is more likely, as GOSAT measurements used here are over land which should be more sensitive to emissions than OH loss. Thus, ingestion of both observations in the GOSAT+ in situ inversion enhances both the methane emissions and OH concentrations compared with the in-situ-only and GOSAT-only inversion to correct these biases. It also narrows the posterior error of mean anthropogenic emissions and methane lifetime against tropospheric OH by 20 % and 50 % compared with the GOSAT-only and in-situ-only inversions, respectively (Fig. 13a). Therefore, we find that the GOSAT and in situ observations are complementary in quantifying the global budget.
Table 3 summarizes the global mean methane budget in 2010–2017. The GOSAT+ in situ joint inversion estimates a total methane emission of 551 Tg a−1, 371 Tg a−1 of which is anthropogenic, and a total sink of 529 Tg a−1. The total emission is within the 550–594 Tg a−1 range of top-down estimates but lower than the 594–881 Tg a−1 range of bottom-up estimates reported for the 2008–2017 decade by the Global Carbon Project (Saunois et al., 2020). Our joint inversion yields a methane lifetime against OH oxidation of 11.2 years, consistent with the observationally based estimate of 11.2 ± 1.3 years (Prather et al., 2012), and pushes the Northern to Southern hemispheric OH ratio (1.06 in GOSAT+ in situ inversion vs. 1.16 in prior estimate) closer to the values of 0.97 ± 0.12 inferred from methyl chloroform observations (Patra et al., 2014).
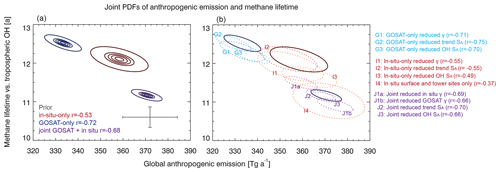
Figure 13Joint probability density functions (PDFs) of global mean anthropogenic methane emission and methane lifetime against oxidation by tropospheric OH optimized by different inversions. Panel (a) shows the results from the prior and the three base inversions. The prior estimates are shown in gray with bars representing the prior error standard deviation. The thick contours show probabilities of 0.99 (outermost), 0.7, 0.5, 0.3, and 0.1 (innermost). The error correlation coefficients are given inset. Panel (b) shows the 0.99 probability contours from the three base inversions along with the same contours for 10 additional sensitivity inversions using reduced values of the regularization parameter γ (0.05 instead of 0.1 for GOSAT and 0.5 instead of 1 for in situ); reduced errors for the methane emission trends on the 4∘ × 5∘ grid (5 % a−1 instead of 10 % a−1); reduced errors on annual hemispheric mean OH concentrations (5 % instead of 10 %); or surface and tower data only in the in-situ-only inversion.
Table 3Optimized global methane budget, 2010–2017.
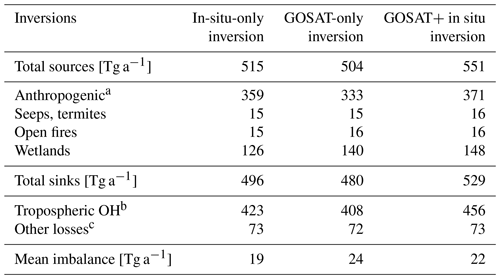
a See Table 1 for sectoral breakdown from the joint inversion. b Methane lifetime against oxidation by tropospheric OH is 11.2 ± 0.1 years in the GOSAT+ in situ inversion. c Soils, stratosphere, and oxidation by tropospheric Cl.
In Fig. 13b, we examine the sensitivity of the global methane budget optimization to the choice of different regularization parameter γ (and, therefore, observation error SO) and prior error of methane emission trends and OH concentrations. We find that reducing γ or prior errors of trend and OH by 50 % yields consistent estimates of anthropogenic emissions and OH concentrations as compared to the default inversion, with differences within 3 %. Decreasing the weighting of observations in the inversion (i.e., assuming larger observation error) enlarges the posterior error and pushes the posterior estimates closer to the prior estimates. Assuming a lower prior error for the OH concentration from 10 % to 5 % results in a lower methane lifetime (closer to the prior) and higher emissions; it also reduces the error correlation between the optimization of methane emissions and OH, whereas assuming a lower prior error for non-wetland emission trends leads to an opposite effect. Our results are consistent with Maasakkers et al. (2019), who showed that different assumptions with respect to error distribution and magnitude in their analyses had relatively small results. We also find that having the shipboard and aircraft measurements in the in-situ-only inversion pushes the estimate to be more consistent with the GOSAT-only inversion (Fig. 13b), implying that the shipboard and aircraft measurements – by emphasizing the methane in the remote atmosphere – play a similar role to satellite measurements in global methane budget optimization.
We quantified and attributed global sources, sinks, and trends of atmospheric methane for 2010–2017 by inversions of GOSAT satellite data and the GLOBALVIEWplus in situ methane observations from surface sites, towers, ships, and aircraft. The inversions use an analytical solution to the Bayesian optimization problem including closed-form error covariance matrices from which the detailed information content of the inversion can be derived. We conduct inversions using GOSAT and in situ data separately and combined. In this manner, we are able to quantify the consistency and complementarity (or redundancy) of the satellite and in situ observations.
We find that the GOSAT-only inversion can generally fit the in situ data and the in-situ-only inversion can generally fit the GOSAT data, indicating consistency between the two data sets. However, the GOSAT-only inversion has difficulty fitting the in situ observations in source regions (US and Europe), whereas the in-situ-only inversion cannot reproduce the interannual variability of the methane growth rate due to the heavy weighting of in situ data to northern midlatitudes. The GOSAT+ in situ inversion shows the best fit to the ensemble of observations.
GOSAT and in situ observations have complementarity in constraining global emissions. GOSAT provides stronger constraints than in situ observations for the tropics, whereas in situ observations are more important in the US, Canada, Europe, and northern China where observations are most dense. The GOSAT-only and in-situ-only inversions also show consistent corrections to regional methane emissions in the US, Europe, and China. The joint GOSAT+ in situ inversion indicates large underestimates of oil and gas emissions in the US and Canada as well as large overestimates of coal emissions in China, relative to the national inventories reported to the United Nations Framework Convention on Climate Change (UNFCCC) and used here as prior estimates for our inversions. Emissions from boreal wetlands are overestimated in the mean WetCHARTs inventory used as a prior estimate, particularly in May–June when snow cover and frozen soils inhibit methane emission.
Our inversions indicate increasing trends in US anthropogenic emissions driven by oil and gas production but decreasing trends in Canada (oil and gas) and Europe. Joint inversion of GOSAT+ in situ data shows a weak decreasing trend in Chinese coal emissions for 2010–2017, consistent with a recent bottom-up inventory (Sheng et al., 2019).
We find that GOSAT and in situ observations are also complementary in constraining the global methane budget. While the global budget information relies more on GOSAT observations, information from the in situ observations at northern midlatitudes avoids the large error correlations between methane emissions and sink from OH and also corrects the underestimation of both emission and OH in the GOSAT-only inversion. Our joint GOSAT+ in situ inversion yields global methane emissions and loss of 551 and 529 Tg a−1 a−1 averaged over 2010–2017 as well as a methane lifetime of 11.2 years.
Our study presents a framework to integrate satellite and in situ data in analytical inversions. We conclude that on the basis of the present observation system, in situ and satellite observations are complementary for constraining global methane budgets and regional emissions. Satellite observations of atmospheric methane are presently expanding with the new availability of global daily data from the Tropospheric Monitoring Instrument (TROPOMI) launched in October 2017 (Hu et al., 2018). This will call for a re-evaluation of the role of in situ observations for constraining regional and global methane budgets, as can be done with the methods presented here. In situ observations will in any case continue to play a critical role for documenting long-term trends of methane with consistent calibration, for observation of oceanic and polar regions where satellites have limited capability, for high-frequency measurements in source regions giving insight into the magnitude and intermittency of local emissions, and for independent validation of satellite-based inversions.
The GLOBALVIEWplus CH4 ObsPack v1.0 data product is available at https://www.esrl.noaa.gov/gmd/ccgg/obspack/data.php?id=_obspack_ch4_1_GLOBALVIEWplus_v1.0_2019-01-08 (Cooperative Global Atmospheric Data Integration Project, 2019). The GOSAT Proxy satellite methane observations are available at https://doi.org/10.5285/18ef8247f52a4cb6a14013f8235cc1eb (Parker and Boesch, 2020). (last access: 17 July 2020). Modeling data can be accessed by contacting the corresponding authors: Xiao Lu (xiaolu@g.harvard.edu) and Yuzhong Zhang (zhangyuzhong@westlake.edu.cn).
The supplement related to this article is available online at: https://doi.org/10.5194/acp-21-4637-2021-supplement.
XL and DJJ designed the study. XL and YZZ conducted the modeling and data analyses with contributions from JDM, MPS, LS, ZQ, TRS, HON, RMY, and JXS. AA contributed to the GLOBALVIEWplus CH4 ObsPack v1.0 data product. RJP and HB contributed to the GOSAT satellite methane retrievals. AAB and SM contributed to the WetCHARTs wetland emission inventory and its interpretation. XL and DJJ wrote the paper with input from all authors.
The authors declare that they have no conflict of interest.
This work was supported by the NOAA AC4 program and the NASA Carbon Monitoring System. Robert J. Parker and Hartmut Boesch are funded via the UK National Centre for Earth Observation (NCEO; grant nos. NE/R016518/1 and NE/N018079/1). Robert J. Parker and Hartmut Boesch acknowledge funding from the ESA GHG-CCI and Copernicus C3S projects. We thank the Japanese Aerospace Exploration Agency, the National Institute for Environmental Studies, and the Ministry of Environment for the GOSAT data and their continuous support as part of the Joint Research Agreement. This research used the ALICE High Performance Computing Facility at the University of Leicester for the GOSAT retrievals. Part of this research was carried out at the Jet Propulsion Laboratory, California Institute of Technology, under a contract with the National Aeronautics and Space Administration.
We acknowledge all of the data providers and laboratories (https://search.datacite.org/works/10.25925/20190108, last access: 20 March 2021) that contributed to the GLOBALVIEWplus CH4 ObsPack v1.0 data product compiled by NOAA Global Monitoring Laboratory. We acknowledge methane observations collected from the CONTRAIL (Comprehensive Observation Network for TRace gases by AIrLiner) project (Machida et al., 2019). Data collected at WLEF Park Falls towers were supported by the NSF DEB-0845166 and DOE AmeriFlux Management Project. Data collected at the Southern Great Plains were supported by the Office of Biological and Environmental Research of the US Department of Energy (under contract no. DE-AC02-05CH11231) as part of the Atmospheric Radiation Measurement (ARM) program, ARM Aerial Facility (AAF), and the Terrestrial Ecosystem Science (TES) program.
This research has been supported by the NOAA AC4 program (grant no. NA19OAR4310173), NASA (grant no. 80NSSC18K0178), and the UK National Centre for Earth Observation (grant nos. NE/R016518/1 and NE/N018079/1).
This paper was edited by Patrick Jöckel and reviewed by Julia Marshall and two anonymous referees.
Alexe, M., Bergamaschi, P., Segers, A., Detmers, R., Butz, A., Hasekamp, O., Guerlet, S., Parker, R., Boesch, H., Frankenberg, C., Scheepmaker, R. A., Dlugokencky, E., Sweeney, C., Wofsy, S. C., and Kort, E. A.: Inverse modelling of CH4 emissions for 2010–2011 using different satellite retrieval products from GOSAT and SCIAMACHY, Atmos. Chem. Phys., 15, 113–133, https://doi.org/10.5194/acp-15-113-2015, 2015.
Alvarez, R. A., Zavala-Araiza, D., Lyon, D. R., Allen, D. T., Barkley, Z. R., Brandt, A. R., Davis, K. J., Herndon, S. C., Jacob, D. J., Karion, A., Kort, E. A., Lamb, B. K., Lauvaux, T., Maasakkers, J. D., Marchese, A. J., Omara, M., Pacala, S. W., Peischl, J., Robinson, A. L., Shepson, P. B., Sweeney, C., Townsend-Small, A., Wofsy, S. C., and Hamburg, S. P.: Assessment of methane emissions from the US oil and gas supply chain, Science, 361, 186–188, https://doi.org/10.1126/science.aar7204, 2018.
Bergamaschi, P., Frankenberg, C., Meirink, J. F., Krol, M., Dentener, F., Wagner, T., Platt, U., Kaplan, J. O., Körner, S., Heimann, M., Dlugokencky, E. J., and Goede, A.: Satellite chartography of atmospheric methane from SCIAMACHY on board ENVISAT: 2. Evaluation based on inverse model simulations, J. Geophys. Res., 112, is D02304, https://doi.org/10.1029/2006jd007268, 2007.
Bergamaschi, P., Frankenberg, C., Meirink, J. F., Krol, M., Villani, M. G., Houweling, S., Dentener, F., Dlugokencky, E. J., Miller, J. B., Gatti, L. V., Engel, A., and Levin, I.: Inverse modeling of global and regional CH4 emissions using SCIAMACHY satellite retrievals, J. Geophys. Res., 114, D22301, https://doi.org/10.1029/2009jd012287, 2009.
Bergamaschi, P., Houweling, S., Segers, A., Krol, M., Frankenberg, C., Scheepmaker, R. A., Dlugokencky, E., Wofsy, S. C., Kort, E. A., Sweeney, C., Schuck, T., Brenninkmeijer, C., Chen, H., Beck, V., and Gerbig, C.: Atmospheric CH4 in the first decade of the 21st century: Inverse modeling analysis using SCIAMACHY satellite retrievals and NOAA surface measurements, J. Geophys. Res., 118, 7350–7369, https://doi.org/10.1002/jgrd.50480, 2013.
Bey, I., Jacob, D. J., Yantosca, R. M., Logan, J. A., Field, B. D., Fiore, A. M., Li, Q., Liu, H. Y., Mickley, L. J., and Schultz, M. G.: Global modeling of tropospheric chemistry with assimilated meteorology: Model description and evaluation, J. Geophys. Res., 106, 23073–23095, https://doi.org/10.1029/2001jd000807, 2001.
Bloom, A. A., Bowman, K. W., Lee, M., Turner, A. J., Schroeder, R., Worden, J. R., Weidner, R., McDonald, K. C., and Jacob, D. J.: A global wetland methane emissions and uncertainty dataset for atmospheric chemical transport models (WetCHARTs version 1.0), Geosci. Model Dev., 10, 2141–2156, https://doi.org/10.5194/gmd-10-2141-2017, 2017.
Bousquet, P., Ringeval, B., Pison, I., Dlugokencky, E. J., Brunke, E.-G., Carouge, C., Chevallier, F., Fortems-Cheiney, A., Frankenberg, C., Hauglustaine, D. A., Krummel, P. B., Langenfelds, R. L., Ramonet, M., Schmidt, M., Steele, L. P., Szopa, S., Yver, C., Viovy, N., and Ciais, P.: Source attribution of the changes in atmospheric methane for 2006–2008, Atmos. Chem. Phys., 11, 3689–3700, https://doi.org/10.5194/acp-11-3689-2011, 2011.
Brasseur, G. P. and Jacob, D. J.: Modeling of Atmospheric Chemistry, Cambridge University Press, Cambridge, UK, https://doi.org/10.1017/9781316544754, 2017.
Bruhwiler, L., Dlugokencky, E., Masarie, K., Ishizawa, M., Andrews, A., Miller, J., Sweeney, C., Tans, P., and Worthy, D.: CarbonTracker-CH4: an assimilation system for estimating emissions of atmospheric methane, Atmos. Chem. Phys., 14, 8269–8293, https://doi.org/10.5194/acp-14-8269-2014, 2014.
Bruhwiler, L. M., Basu, S., Bergamaschi, P., Bousquet, P., Dlugokencky, E., Houweling, S., Ishizawa, M., Kim, H. S., Locatelli, R., Maksyutov, S., Montzka, S., Pandey, S., Patra, P. K., Petron, G., Saunois, M., Sweeney, C., Schwietzke, S., Tans, P., and Weatherhead, E. C.: US CH4 emissions from oil and gas production: Have recent large increases been detected?, J. Geophys. Res., 122, 4070–4083, https://doi.org/10.1002/2016jd026157, 2017.
Buchwitz, M., Reuter, M., Schneising, O., Boesch, H., Guerlet, S., Dils, B., Aben, I., Armante, R., Bergamaschi, P., Blumenstock, T., Bovensmann, H., Brunner, D., Buchmann, B., Burrows, J. P., Butz, A., Chédin, A., Chevallier, F., Crevoisier, C. D., Deutscher, N. M., Frankenberg, C., Hase, F., Hasekamp, O. P., Heymann, J., Kaminski, T., Laeng, A., Lichtenberg, G., De Mazière, M., Noël, S., Notholt, J., Orphal, J., Popp, C., Parker, R., Scholze, M., Sussmann, R., Stiller, G. P., Warneke, T., Zehner, C., Bril, A., Crisp, D., Griffith, D. W. T., Kuze, A., O'Dell, C., Oshchepkov, S., Sherlock, V., Suto, H., Wennberg, P., Wunch, D., Yokota, T., and Yoshida, Y.: The Greenhouse Gas Climate Change Initiative (GHG-CCI): Comparison and quality assessment of near-surface-sensitive satellite-derived CO2 and CH4 global data sets, Remote Sens. Environ., 162, 344–362, https://doi.org/10.1016/j.rse.2013.04.024, 2015.
Butz, A., Guerlet, S., Hasekamp, O., Schepers, D., Galli, A., Aben, I., Frankenberg, C., Hartmann, J. M., Tran, H., Kuze, A., Keppel-Aleks, G., Toon, G., Wunch, D., Wennberg, P., Deutscher, N., Griffith, D., Macatangay, R., Messerschmidt, J., Notholt, J., and Warneke, T.: Toward accurate CO2 and CH4 observations from GOSAT, Geophys. Res. Lett., 38, L14812, https://doi.org/10.1029/2011gl047888, 2011.
Calisesi, Y., Soebijanta, V. T., and van Oss, R.: Regridding of remote soundings: Formulation and application to ozone profile comparison, J. Geophys. Res., 110, D23306, https://doi.org/10.1029/2005jd006122, 2005.
Cooperative Global Atmospheric Data Integration Project: Multi-laboratory compilation of atmospheric methane data for the period 1957–2017, obspack_ch4_1_GLOBALVIEWplus_v1.0_2019_01_08, NOAA Earth System Research Laboratory, Global Monitoring Laboratory, https://doi.org/10.25925/20190108 (last access: 17 July 2020), 2019.
Cressot, C., Chevallier, F., Bousquet, P., Crevoisier, C., Dlugokencky, E. J., Fortems-Cheiney, A., Frankenberg, C., Parker, R., Pison, I., Scheepmaker, R. A., Montzka, S. A., Krummel, P. B., Steele, L. P., and Langenfelds, R. L.: On the consistency between global and regional methane emissions inferred from SCIAMACHY, TANSO-FTS, IASI and surface measurements, Atmos. Chem. Phys., 14, 577–592, https://doi.org/10.5194/acp-14-577-2014, 2014.
Cui, Y. Y., Henze, D. K., Brioude, J., Angevine, W. M., Liu, Z., Bousserez, N., Guerrette, J., McKeen, S. A., Peischl, J., Yuan, B., Ryerson, T., Frost, G., and Trainer, M.: Inversion Estimates of Lognormally Distributed Methane Emission Rates From the Haynesville-Bossier Oil and Gas Production Region Using Airborne Measurements, J. Geophys. Res., 124, 3520–3531, https://doi.org/10.1029/2018jd029489, 2019.
Cusworth, D. H., Jacob, D. J., Sheng, J.-X., Benmergui, J., Turner, A. J., Brandman, J., White, L., and Randles, C. A.: Detecting high-emitting methane sources in oil/gas fields using satellite observations, Atmos. Chem. Phys., 18, 16885–16896, https://doi.org/10.5194/acp-18-16885-2018, 2018.
Dlugokencky, E. J., Steele, L. P., Lang, P. M., and Masarie, K. A.: The growth rate and distribution of atmospheric methane, J. Geophys. Res., 99, 17021, https://doi.org/10.1029/94jd01245, 1994.
Dlugokencky, E. J., Bruhwiler, L., White, J. W. C., Emmons, L. K., Novelli, P. C., Montzka, S. A., Masarie, K. A., Lang, P. M., Crotwell, A. M., Miller, J. B., and Gatti, L. V.: Observational constraints on recent increases in the atmospheric CH4 burden, Geophys. Res. Lett., 36, L18803, https://doi.org/10.1029/2009gl039780, 2009.
Etiope, G., Ciotoli, G., Schwietzke, S., and Schoell, M.: Gridded maps of geological methane emissions and their isotopic signature, Earth Syst. Sci. Data, 11, 1–22, https://doi.org/10.5194/essd-11-1-2019, 2019.
Franco, B., Mahieu, E., Emmons, L. K., Tzompa-Sosa, Z. A., Fischer, E. V., Sudo, K., Bovy, B., Conway, S., Griffin, D., Hannigan, J. W., Strong, K., and Walker, K. A.: Evaluating ethane and methane emissions associated with the development of oil and natural gas extraction in North America, Environ. Res. Lett., 11, 044010, https://doi.org/10.1088/1748-9326/11/4/044010, 2016.
Fraser, A., Palmer, P. I., Feng, L., Boesch, H., Cogan, A., Parker, R., Dlugokencky, E. J., Fraser, P. J., Krummel, P. B., Langenfelds, R. L., O'Doherty, S., Prinn, R. G., Steele, L. P., van der Schoot, M., and Weiss, R. F.: Estimating regional methane surface fluxes: the relative importance of surface and GOSAT mole fraction measurements, Atmos. Chem. Phys., 13, 5697–5713, https://doi.org/10.5194/acp-13-5697-2013, 2013.
Fung, I., John, J., Lerner, J., Matthews, E., Prather, M., Steele, L. P., and Fraser, P. J.: Three-dimensional model synthesis of the global methane cycle, J. Geophys. Res., 96, 13033, https://doi.org/10.1029/91jd01247, 1991.
Ganesan, A. L., Rigby, M., Lunt, M. F., Parker, R. J., Boesch, H., Goulding, N., Umezawa, T., Zahn, A., Chatterjee, A., Prinn, R. G., Tiwari, Y. K., van der Schoot, M., and Krummel, P. B.: Atmospheric observations show accurate reporting and little growth in India's methane emissions, Nat. Commun., 8, 836, https://doi.org/10.1038/s41467-017-00994-7, 2017.
Gelaro, R., McCarty, W., Suárez, M. J., Todling, R., Molod, A., Takacs, L., Randles, C. A., Darmenov, A., Bosilovich, M. G., Reichle, R., Wargan, K., Coy, L., Cullather, R., Draper, C., Akella, S., Buchard, V., Conaty, A., da Silva, A. M., Gu, W., Kim, G.-K., Koster, R., Lucchesi, R., Merkova, D., Nielsen, J. E., Partyka, G., Pawson, S., Putman, W., Rienecker, M., Schubert, S. D., Sienkiewicz, M., and Zhao, B.: The Modern-Era Retrospective Analysis for Research and Applications, Version 2 (MERRA-2), J. Clim., 30, 5419–5454, https://doi.org/10.1175/jcli-d-16-0758.1, 2017.
Hausmann, P., Sussmann, R., and Smale, D.: Contribution of oil and natural gas production to renewed increase in atmospheric methane (2007–2014): top–down estimate from ethane and methane column observations, Atmos. Chem. Phys., 16, 3227–3244, https://doi.org/10.5194/acp-16-3227-2016, 2016.
Heald, C. L., Jacob, D. J., Jones, D. B. A., Palmer, P. I., Logan, J. A., Streets, D. G., Sachse, G. W., Gille, J. C., Hoffman, R. N., and Nehrkorn, T.: Comparative inverse analysis of satellite (MOPITT) and aircraft (TRACE-P) observations to estimate Asian sources of carbon monoxide, J. Geophys. Res., 109, D23306, https://doi.org/10.1029/2004jd005185, 2004.
Helmig, D., Rossabi, S., Hueber, J., Tans, P., Montzka, S. A., Masarie, K., Thoning, K., Plass-Duelmer, C., Claude, A., Carpenter, L. J., Lewis, A. C., Punjabi, S., Reimann, S., Vollmer, M. K., Steinbrecher, R., Hannigan, J. W., Emmons, L. K., Mahieu, E., Franco, B., Smale, D., and Pozzer, A.: Reversal of global atmospheric ethane and propane trends largely due to US oil and natural gas production, Nat. Geosci., 9, 490–495, https://doi.org/10.1038/ngeo2721, 2016.
Hmiel, B., Petrenko, V. V., Dyonisius, M. N., Buizert, C., Smith, A. M., Place, P. F., Harth, C., Beaudette, R., Hua, Q., Yang, B., Vimont, I., Michel, S. E., Severinghaus, J. P., Etheridge, D., Bromley, T., Schmitt, J., Faïn, X., Weiss, R. F., and Dlugokencky, E.: Preindustrial 14CH4 indicates greater anthropogenic fossil CH4 emissions, Nature, 578, 409–412, https://doi.org/10.1038/s41586-020-1991-8, 2020.
Holmes, C. D., Prather, M. J., Søvde, O. A., and Myhre, G.: Future methane, hydroxyl, and their uncertainties: key climate and emission parameters for future predictions, Atmos. Chem. Phys., 13, 285–302, https://doi.org/10.5194/acp-13-285-2013, 2013.
Houweling, S., Krol, M., Bergamaschi, P., Frankenberg, C., Dlugokencky, E. J., Morino, I., Notholt, J., Sherlock, V., Wunch, D., Beck, V., Gerbig, C., Chen, H., Kort, E. A., Röckmann, T., and Aben, I.: A multi-year methane inversion using SCIAMACHY, accounting for systematic errors using TCCON measurements, Atmos. Chem. Phys., 14, 3991–4012, https://doi.org/10.5194/acp-14-3991-2014, 2014.
Houweling, S., Bergamaschi, P., Chevallier, F., Heimann, M., Kaminski, T., Krol, M., Michalak, A. M., and Patra, P.: Global inverse modeling of CH4 sources and sinks: an overview of methods, Atmos. Chem. Phys., 17, 235–256, https://doi.org/10.5194/acp-17-235-2017, 2017.
Hu, H., Landgraf, J., Detmers, R., Borsdorff, T., Aan de Brugh, J., Aben, I., Butz, A., and Hasekamp, O.: Toward Global Mapping of Methane With TROPOMI: First Results and Intersatellite Comparison to GOSAT, Geophys. Res. Lett., 45, 3682–3689, https://doi.org/10.1002/2018gl077259, 2018.
Jacob, D. J., Turner, A. J., Maasakkers, J. D., Sheng, J., Sun, K., Liu, X., Chance, K., Aben, I., McKeever, J., and Frankenberg, C.: Satellite observations of atmospheric methane and their value for quantifying methane emissions, Atmos. Chem. Phys., 16, 14371–14396, https://doi.org/10.5194/acp-16-14371-2016, 2016.
Janardanan, R., Maksyutov, S., Tsuruta, A., Wang, F., Tiwari, Y. K., Valsala, V., Ito, A., Yoshida, Y., Kaiser, J. W., Janssens-Maenhout, G., Arshinov, M., Sasakawa, M., Tohjima, Y., Worthy, D. E. J., Dlugokencky, E. J., Ramonet, M., Arduini, J., Lavric, J. V., Piacentino, S., Krummel, P. B., Langenfelds, R. L., Mammarella, I., and Matsunaga, T.: Country-Scale Analysis of Methane Emissions with a High-Resolution Inverse Model Using GOSAT and Surface Observations, Remote Sens.-Basel, 12, 375, https://doi.org/10.3390/rs12030375, 2020.
Janssens-Maenhout, G., Crippa, M., Guizzardi, D., Muntean, M., Schaaf, E., Dentener, F., Bergamaschi, P., Pagliari, V., Olivier, J. G. J., Peters, J. A. H. W., van Aardenne, J. A., Monni, S., Doering, U., Petrescu, A. M. R., Solazzo, E., and Oreggioni, G. D.: EDGAR v4.3.2 Global Atlas of the three major greenhouse gas emissions for the period 1970–2012, Earth Syst. Sci. Data, 11, 959–1002, https://doi.org/10.5194/essd-11-959-2019, 2019.
Koo, J.-H., Walker, K. A., Jones, A., Sheese, P. E., Boone, C. D., Bernath, P. F., and Manney, G. L.: Global climatology based on the ACE-FTS version 3.5 dataset: Addition of mesospheric levels and carbon-containing species in the UTLS, J. Quant. Spectrosc. Ra., 186, 52–62, https://doi.org/10.1016/j.jqsrt.2016.07.003, 2017.
Kuze, A., Suto, H., Shiomi, K., Kawakami, S., Tanaka, M., Ueda, Y., Deguchi, A., Yoshida, J., Yamamoto, Y., Kataoka, F., Taylor, T. E., and Buijs, H. L.: Update on GOSAT TANSO-FTS performance, operations, and data products after more than 6 years in space, Atmos. Meas. Tech., 9, 2445–2461, https://doi.org/10.5194/amt-9-2445-2016, 2016.
Lan, X., Tans, P., Sweeney, C., Andrews, A., Dlugokencky, E., Schwietzke, S., Kofler, J., McKain, K., Thoning, K., Crotwell, M., Montzka, S., Miller, B. R., and Biraud, S. C.: Long-Term Measurements Show Little Evidence for Large Increases in Total U.S. Methane Emissions Over the Past Decade, Geophys. Res. Lett., 46, 4991–4999, https://doi.org/10.1029/2018gl081731, 2019.
Lunt, M. F., Palmer, P. I., Feng, L., Taylor, C. M., Boesch, H., and Parker, R. J.: An increase in methane emissions from tropical Africa between 2010 and 2016 inferred from satellite data, Atmos. Chem. Phys., 19, 14721–14740, https://doi.org/10.5194/acp-19-14721-2019, 2019.
Maasakkers, J. D., Jacob, D. J., Sulprizio, M. P., Turner, A. J., Weitz, M., Wirth, T., Hight, C., DeFigueiredo, M., Desai, M., Schmeltz, R., Hockstad, L., Bloom, A. A., Bowman, K. W., Jeong, S., and Fischer, M. L.: Gridded National Inventory of U.S. Methane Emissions, Environ. Sci. Technol., 50, 13123–13133, https://doi.org/10.1021/acs.est.6b02878, 2016.
Maasakkers, J. D., Jacob, D. J., Sulprizio, M. P., Scarpelli, T. R., Nesser, H., Sheng, J.-X., Zhang, Y., Hersher, M., Bloom, A. A., Bowman, K. W., Worden, J. R., Janssens-Maenhout, G., and Parker, R. J.: Global distribution of methane emissions, emission trends, and OH concentrations and trends inferred from an inversion of GOSAT satellite data for 2010–2015, Atmos. Chem. Phys., 19, 7859–7881, https://doi.org/10.5194/acp-19-7859-2019, 2019.
Maasakkers, J. D., Jacob, D. J., Sulprizio, M. P., Scarpelli, T. R., Nesser, H., Sheng, J., Zhang, Y., Lu, X., Bloom, A. A., Bowman, K. W., Worden, J. R., and Parker, R. J.: 2010–2015 North American methane emissions, sectoral contributions, and trends: a high-resolution inversion of GOSAT observations of atmospheric methane, Atmos. Chem. Phys., 21, 4339–4356, https://doi.org/10.5194/acp-21-4339-2021, 2021.
Machida, T., Matsueda, H., Sawa, Y., and Niwa, Y.: Atmospheric trace gas data from the CONTRAIL flask air sampling over the Pacific Ocean, Center for Global Environmental Research, National Institute for Environmental Studies (NIES), Japan, https://doi.org/10.17595/20190828.001, 2019.
McNorton, J., Wilson, C., Gloor, M., Parker, R. J., Boesch, H., Feng, W., Hossaini, R., and Chipperfield, M. P.: Attribution of recent increases in atmospheric methane through 3D inverse modelling, Atmos. Chem. Phys., 18, 18149–18168, https://doi.org/10.5194/acp-18-18149-2018, 2018.
Miller, S. M., Wofsy, S. C., Michalak, A. M., Kort, E. A., Andrews, A. E., Biraud, S. C., Dlugokencky, E. J., Eluszkiewicz, J., Fischer, M. L., Janssens-Maenhout, G., Miller, B. R., Miller, J. B., Montzka, S. A., Nehrkorn, T., and Sweeney, C.: Anthropogenic emissions of methane in the United States, P. Natl. Acad. Sci. USA, 110, 20018–20022, https://doi.org/10.1073/pnas.1314392110, 2013.
Miller, S. M., Michalak, A. M., Detmers, R. G., Hasekamp, O. P., Bruhwiler, L. M. P., and Schwietzke, S.: China's coal mine methane regulations have not curbed growing emissions, Nat. Commun., 10, 303, https://doi.org/10.1038/s41467-018-07891-7, 2019.
Monteil, G., Houweling, S., Butz, A., Guerlet, S., Schepers, D., Hasekamp, O., Frankenberg, C., Scheepmaker, R., Aben, I., and Röckmann, T.: Comparison of CH4 inversions based on 15 months of GOSAT and SCIAMACHY observations, J. Geophys. Res., 118, 11807–11823, https://doi.org/10.1002/2013jd019760, 2013.
Murguia-Flores, F., Arndt, S., Ganesan, A. L., Murray-Tortarolo, G., and Hornibrook, E. R. C.: Soil Methanotrophy Model (MeMo v1.0): a process-based model to quantify global uptake of atmospheric methane by soil, Geosci. Model Dev., 11, 2009–2032, https://doi.org/10.5194/gmd-11-2009-2018, 2018.
Murray, L. T., Jacob, D. J., Logan, J. A., Hudman, R. C., and Koshak, W. J.: Optimized regional and interannual variability of lightning in a global chemical transport model constrained by LIS/OTD satellite data, J. Geophys. Res., 117, D20307, https://doi.org/10.1029/2012jd017934, 2012.
Naik, V., Voulgarakis, A., Fiore, A. M., Horowitz, L. W., Lamarque, J.-F., Lin, M., Prather, M. J., Young, P. J., Bergmann, D., Cameron-Smith, P. J., Cionni, I., Collins, W. J., Dalsøren, S. B., Doherty, R., Eyring, V., Faluvegi, G., Folberth, G. A., Josse, B., Lee, Y. H., MacKenzie, I. A., Nagashima, T., van Noije, T. P. C., Plummer, D. A., Righi, M., Rumbold, S. T., Skeie, R., Shindell, D. T., Stevenson, D. S., Strode, S., Sudo, K., Szopa, S., and Zeng, G.: Preindustrial to present-day changes in tropospheric hydroxyl radical and methane lifetime from the Atmospheric Chemistry and Climate Model Intercomparison Project (ACCMIP), Atmos. Chem. Phys., 13, 5277–5298, https://doi.org/10.5194/acp-13-5277-2013, 2013.
Parker, R. and Boesch, H.: University of Leicester GOSAT Proxy XCH4 v9.0, Centre for Environmental Data Analysis, https://doi.org/10.5285/18ef8247f52a4cb6a14013f8235cc1eb, 2020.
Parker, R. J., Webb, A., Boesch, H., Somkuti, P., Barrio Guillo, R., Di Noia, A., Kalaitzi, N., Anand, J. S., Bergamaschi, P., Chevallier, F., Palmer, P. I., Feng, L., Deutscher, N. M., Feist, D. G., Griffith, D. W. T., Hase, F., Kivi, R., Morino, I., Notholt, J., Oh, Y.-S., Ohyama, H., Petri, C., Pollard, D. F., Roehl, C., Sha, M. K., Shiomi, K., Strong, K., Sussmann, R., Té, Y., Velazco, V. A., Warneke, T., Wennberg, P. O., and Wunch, D.: A decade of GOSAT Proxy satellite CH4 observations, Earth Syst. Sci. Data, 12, 3383–3412, https://doi.org/10.5194/essd-12-3383-2020, 2020.
Patra, P. K., Houweling, S., Krol, M., Bousquet, P., Belikov, D., Bergmann, D., Bian, H., Cameron-Smith, P., Chipperfield, M. P., Corbin, K., Fortems-Cheiney, A., Fraser, A., Gloor, E., Hess, P., Ito, A., Kawa, S. R., Law, R. M., Loh, Z., Maksyutov, S., Meng, L., Palmer, P. I., Prinn, R. G., Rigby, M., Saito, R., and Wilson, C.: TransCom model simulations of CH4 and related species: linking transport, surface flux and chemical loss with CH4 variability in the troposphere and lower stratosphere, Atmos. Chem. Phys., 11, 12813–12837, https://doi.org/10.5194/acp-11-12813-2011, 2011.
Patra, P. K., Krol, M. C., Montzka, S. A., Arnold, T., Atlas, E. L., Lintner, B. R., Stephens, B. B., Xiang, B., Elkins, J. W., Fraser, P. J., Ghosh, A., Hintsa, E. J., Hurst, D. F., Ishijima, K., Krummel, P. B., Miller, B. R., Miyazaki, K., Moore, F. L., Muhle, J., O'Doherty, S., Prinn, R. G., Steele, L. P., Takigawa, M., Wang, H. J., Weiss, R. F., Wofsy, S. C., and Young, D.: Observational evidence for interhemispheric hydroxyl-radical parity, Nature, 513, 219–223, https://doi.org/10.1038/nature13721, 2014.
Patra, P. K., Saeki, T., Dlugokencky, E. J., Ishijima, K., Umezawa, T., Ito, A., Aoki, S., Morimoto, S., Kort, E. A., Crotwell, A., Ravi Kumar, K., and Nakazawa, T.: Regional Methane Emission Estimation Based on Observed Atmospheric Concentrations (2002–2012), J. Meteorol. Soc. Jpn., 94, 91–113, https://doi.org/10.2151/jmsj.2016-006, 2016.
Pickett-Heaps, C. A., Jacob, D. J., Wecht, K. J., Kort, E. A., Wofsy, S. C., Diskin, G. S., Worthy, D. E. J., Kaplan, J. O., Bey, I., and Drevet, J.: Magnitude and seasonality of wetland methane emissions from the Hudson Bay Lowlands (Canada), Atmos. Chem. Phys., 11, 3773–3779, https://doi.org/10.5194/acp-11-3773-2011, 2011.
Pison, I., Bousquet, P., Chevallier, F., Szopa, S., and Hauglustaine, D.: Multi-species inversion of CH4, CO and H2 emissions from surface measurements, Atmos. Chem. Phys., 9, 5281–5297, https://doi.org/10.5194/acp-9-5281-2009, 2009.
Prather, M. J., Holmes, C. D., and Hsu, J.: Reactive greenhouse gas scenarios: Systematic exploration of uncertainties and the role of atmospheric chemistry, Geophys. Res. Lett., 39, L09803, https://doi.org/10.1029/2012gl051440, 2012.
Rodgers, C. D.: Inverse Methods for Atmospheric Sounding: Theory and Practice, World Scientific, River Edge, USA, 2000.
Saunois, M., Stavert, A. R., Poulter, B., Bousquet, P., Canadell, J. G., Jackson, R. B., Raymond, P. A., Dlugokencky, E. J., Houweling, S., Patra, P. K., Ciais, P., Arora, V. K., Bastviken, D., Bergamaschi, P., Blake, D. R., Brailsford, G., Bruhwiler, L., Carlson, K. M., Carrol, M., Castaldi, S., Chandra, N., Crevoisier, C., Crill, P. M., Covey, K., Curry, C. L., Etiope, G., Frankenberg, C., Gedney, N., Hegglin, M. I., Höglund-Isaksson, L., Hugelius, G., Ishizawa, M., Ito, A., Janssens-Maenhout, G., Jensen, K. M., Joos, F., Kleinen, T., Krummel, P. B., Langenfelds, R. L., Laruelle, G. G., Liu, L., Machida, T., Maksyutov, S., McDonald, K. C., McNorton, J., Miller, P. A., Melton, J. R., Morino, I., Müller, J., Murguia-Flores, F., Naik, V., Niwa, Y., Noce, S., O'Doherty, S., Parker, R. J., Peng, C., Peng, S., Peters, G. P., Prigent, C., Prinn, R., Ramonet, M., Regnier, P., Riley, W. J., Rosentreter, J. A., Segers, A., Simpson, I. J., Shi, H., Smith, S. J., Steele, L. P., Thornton, B. F., Tian, H., Tohjima, Y., Tubiello, F. N., Tsuruta, A., Viovy, N., Voulgarakis, A., Weber, T. S., van Weele, M., van der Werf, G. R., Weiss, R. F., Worthy, D., Wunch, D., Yin, Y., Yoshida, Y., Zhang, W., Zhang, Z., Zhao, Y., Zheng, B., Zhu, Q., Zhu, Q., and Zhuang, Q.: The Global Methane Budget 2000–2017, Earth Syst. Sci. Data, 12, 1561–1623, https://doi.org/10.5194/essd-12-1561-2020, 2020.
Scarpelli, T. R., Jacob, D. J., Maasakkers, J. D., Sulprizio, M. P., Sheng, J.-X., Rose, K., Romeo, L., Worden, J. R., and Janssens-Maenhout, G.: A global gridded (0.1∘ × 0.1∘) inventory of methane emissions from oil, gas, and coal exploitation based on national reports to the United Nations Framework Convention on Climate Change, Earth Syst. Sci. Data, 12, 563–575, https://doi.org/10.5194/essd-12-563-2020, 2020.
Sheng, J.-X., Jacob, D. J., Turner, A. J., Maasakkers, J. D., Sulprizio, M. P., Bloom, A. A., Andrews, A. E., and Wunch, D.: High-resolution inversion of methane emissions in the Southeast US using SEAC4RS aircraft observations of atmospheric methane: anthropogenic and wetland sources, Atmos. Chem. Phys., 18, 6483–6491, https://doi.org/10.5194/acp-18-6483-2018, 2018.
Sheng, J.-X., Song, S., Zhang, Y., Prinn, R. G., and Janssens-Maenhout, G.: Bottom-Up Estimates of Coal Mine Methane Emissions in China: A Gridded Inventory, Emission Factors, and Trends, Environ. Sci. Tech. Let., 6, 473–478, https://doi.org/10.1021/acs.estlett.9b00294, 2019.
Stanevich, I., Jones, D. B. A., Strong, K., Parker, R. J., Boesch, H., Wunch, D., Notholt, J., Petri, C., Warneke, T., Sussmann, R., Schneider, M., Hase, F., Kivi, R., Deutscher, N. M., Velazco, V. A., Walker, K. A., and Deng, F.: Characterizing model errors in chemical transport modeling of methane: impact of model resolution in versions v9-02 of GEOS-Chem and v35j of its adjoint model, Geosci. Model Dev., 13, 3839–3862, https://doi.org/10.5194/gmd-13-3839-2020, 2020.
Thompson, R. L., Stohl, A., Zhou, L. X., Dlugokencky, E., Fukuyama, Y., Tohjima, Y., Kim, S. Y., Lee, H., Nisbet, E. G., Fisher, R. E., Lowry, D., Weiss, R. F., Prinn, R. G., O'Doherty, S., Young, D., and White, J. W. C.: Methane emissions in East Asia for 2000–2011 estimated using an atmospheric Bayesian inversion, J. Geophys. Res., 120, 4352–4369, https://doi.org/10.1002/2014jd022394, 2015.
Turner, A. J., Jacob, D. J., Wecht, K. J., Maasakkers, J. D., Lundgren, E., Andrews, A. E., Biraud, S. C., Boesch, H., Bowman, K. W., Deutscher, N. M., Dubey, M. K., Griffith, D. W. T., Hase, F., Kuze, A., Notholt, J., Ohyama, H., Parker, R., Payne, V. H., Sussmann, R., Sweeney, C., Velazco, V. A., Warneke, T., Wennberg, P. O., and Wunch, D.: Estimating global and North American methane emissions with high spatial resolution using GOSAT satellite data, Atmos. Chem. Phys., 15, 7049–7069, https://doi.org/10.5194/acp-15-7049-2015, 2015.
van der Werf, G. R., Randerson, J. T., Giglio, L., van Leeuwen, T. T., Chen, Y., Rogers, B. M., Mu, M., van Marle, M. J. E., Morton, D. C., Collatz, G. J., Yokelson, R. J., and Kasibhatla, P. S.: Global fire emissions estimates during 1997–2016, Earth Syst. Sci. Data, 9, 697–720, https://doi.org/10.5194/essd-9-697-2017, 2017.
Wang, X., Jacob, D. J., Eastham, S. D., Sulprizio, M. P., Zhu, L., Chen, Q., Alexander, B., Sherwen, T., Evans, M. J., Lee, B. H., Haskins, J. D., Lopez-Hilfiker, F. D., Thornton, J. A., Huey, G. L., and Liao, H.: The role of chlorine in global tropospheric chemistry, Atmos. Chem. Phys., 19, 3981–4003, https://doi.org/10.5194/acp-19-3981-2019, 2019.
Waymark, C., Walker, K., Boone, C. D., and Bernath, P. F.: ACE-FTS version 3.0, validation and data processing update, data set, https://doi.org/10.4401/ag-6339, 2014.
Wecht, K. J., Jacob, D. J., Frankenberg, C., Jiang, Z., and Blake, D. R.: Mapping of North American methane emissions with high spatial resolution by inversion of SCIAMACHY satellite data, J. Geophys. Res., 119, 7741–7756, https://doi.org/10.1002/2014jd021551, 2014.
Zhang, B., Tian, H., Ren, W., Tao, B., Lu, C., Yang, J., Banger, K., and Pan, S.: Methane emissions from global rice fields: Magnitude, spatiotemporal patterns, and environmental controls, Global Biogeochem. Cy., 30, 1246–1263, https://doi.org/10.1002/2016gb005381, 2016.
Zhang, Y., Jacob, D. J., Maasakkers, J. D., Sulprizio, M. P., Sheng, J.-X., Gautam, R., and Worden, J.: Monitoring global tropospheric OH concentrations using satellite observations of atmospheric methane, Atmos. Chem. Phys., 18, 15959–15973, https://doi.org/10.5194/acp-18-15959-2018, 2018.
Zhang, Y., Gautam, R., Pandey, S., Omara, M., Maasakkers, J. D., Sadavarte, P., Lyon, D., Nesser, H., Sulprizio, M. P., Varon, D. J., Zhang, R., Houweling, S., Zavala-Araiza, D., Alvarez, R. A., Lorente, A., Hamburg, S. P., Aben, I., and Jacob, D. J.: Quantifying methane emissions from the largest oil-producing basin in the United States from space, Science Advances, 6, eaaz5120, https://doi.org/10.1126/sciadv.aaz5120, 2020.
Zhang, Y., Jacob, D. J., Lu, X., Maasakkers, J. D., Scarpelli, T. R., Sheng, J.-X., Shen, L., Qu, Z., Sulprizio, M. P., Chang, J., Bloom, A. A., Ma, S., Worden, J., Parker, R. J., and Boesch, H.: Attribution of the accelerating increase in atmospheric methane during 2010–2018 by inverse analysis of GOSAT observations, Atmos. Chem. Phys., 21, 3643–3666, https://doi.org/10.5194/acp-21-3643-2021, 2021.
Zhao, Y., Saunois, M., Bousquet, P., Lin, X., Berchet, A., Hegglin, M. I., Canadell, J. G., Jackson, R. B., Hauglustaine, D. A., Szopa, S., Stavert, A. R., Abraham, N. L., Archibald, A. T., Bekki, S., Deushi, M., Jöckel, P., Josse, B., Kinnison, D., Kirner, O., Marécal, V., O'Connor, F. M., Plummer, D. A., Revell, L. E., Rozanov, E., Stenke, A., Strode, S., Tilmes, S., Dlugokencky, E. J., and Zheng, B.: Inter-model comparison of global hydroxyl radical (OH) distributions and their impact on atmospheric methane over the 2000–2016 period, Atmos. Chem. Phys., 19, 13701–13723, https://doi.org/10.5194/acp-19-13701-2019, 2019.
Zona, D., Gioli, B., Commane, R., Lindaas, J., Wofsy, S. C., Miller, C. E., Dinardo, S. J., Dengel, S., Sweeney, C., Karion, A., Chang, R. Y., Henderson, J. M., Murphy, P. C., Goodrich, J. P., Moreaux, V., Liljedahl, A., Watts, J. D., Kimball, J. S., Lipson, D. A., and Oechel, W. C.: Cold season emissions dominate the Arctic tundra methane budget, P. Natl. Acad. Sci. USA, 113, 40–45, https://doi.org/10.1073/pnas.1516017113, 2016.


