the Creative Commons Attribution 4.0 License.
the Creative Commons Attribution 4.0 License.
 | 23 Feb 2021
Influence of aromatics on tropospheric gas-phase composition
Domenico Taraborrelli
David Cabrera-Perez
Sara Bacer
Sergey Gromov
Jos Lelieveld
Rolf Sander
Andrea Pozzer
Aromatics contribute a significant fraction to organic compounds in the troposphere and are mainly emitted by anthropogenic activities and biomass burning. Their oxidation in lab experiments is known to lead to the formation of ozone and aerosol precursors. However, their overall impact on tropospheric composition is uncertain as it depends on transport, multiphase chemistry, and removal processes of the oxidation intermediates. Representation of aromatics in global atmospheric models has been either neglected or highly simplified. Here, we present an assessment of their impact on gas-phase chemistry, using the general circulation model EMAC (ECHAM5/MESSy Atmospheric Chemistry). We employ a comprehensive kinetic model to represent the oxidation of the following monocyclic aromatics: benzene, toluene, xylenes, phenol, styrene, ethylbenzene, trimethylbenzenes, benzaldehyde, and lumped higher aromatics that contain more than nine C atoms.
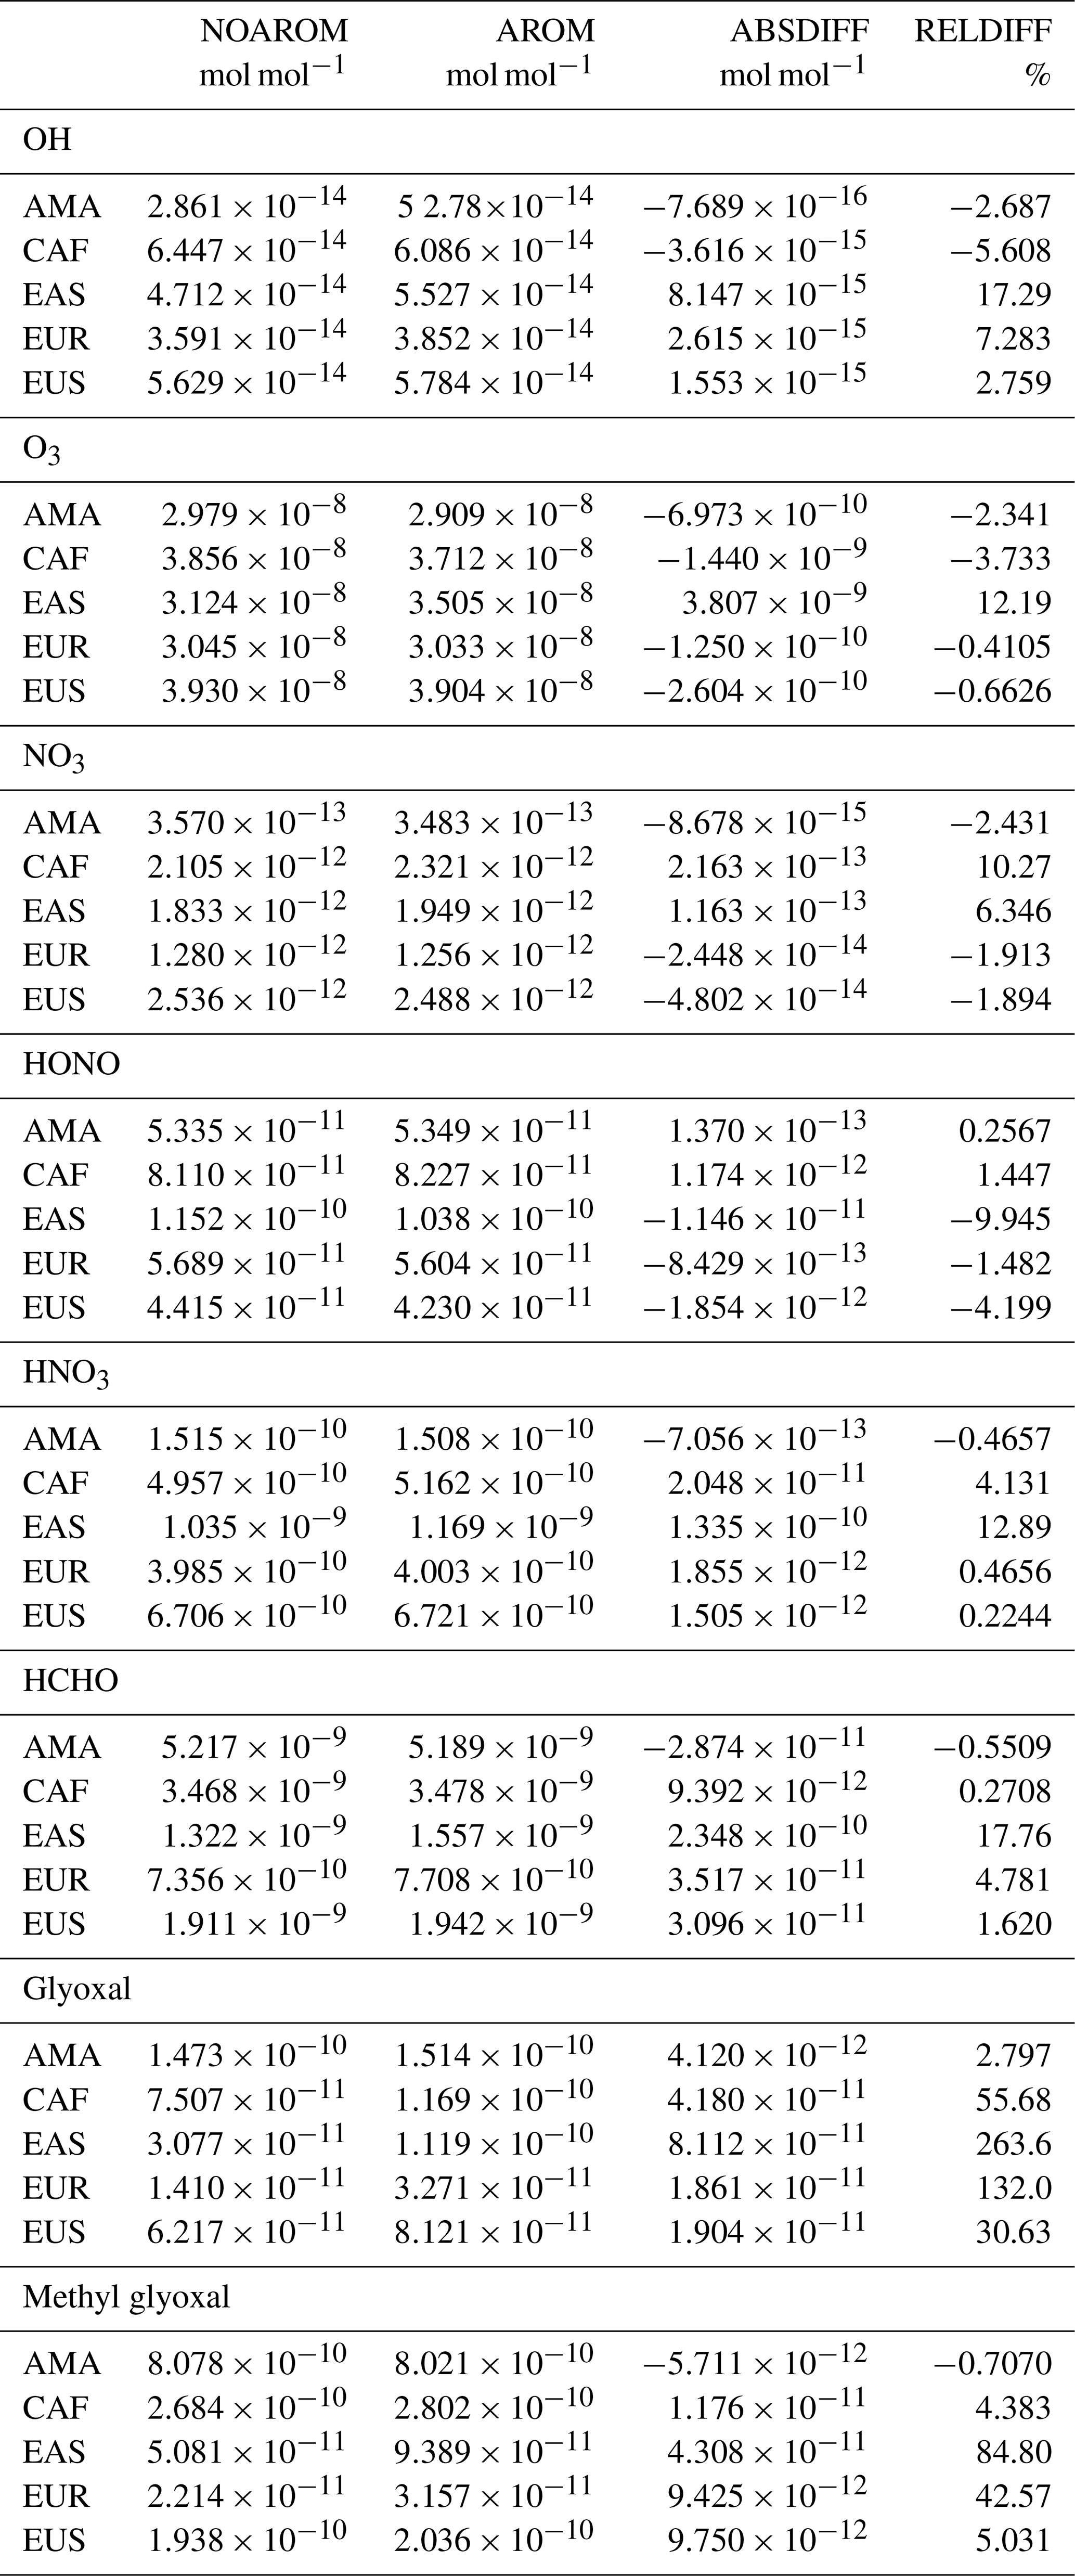
Significant regional changes are identified for several species. For instance, glyoxal increases by 130 % in Europe and 260 % in East Asia, respectively. Large increases in HCHO are also predicted in these regions. In general, the influence of aromatics is particularly evident in areas with high concentrations of NOx, with increases up to 12 % in O3 and 17 % in OH.
On a global scale, the estimated net changes of trace gas levels are minor when aromatic compounds are included in our model. For instance, the tropospheric burden of CO increases by about 6 %, while the burdens of OH, O3, and NOx (NO+NO2) decrease between 3 % and 9 %. The global mean changes are small, partially because of compensating effects between high- and low-NOx regions. The largest change is predicted for the important aerosol precursor glyoxal, which increases globally by 36 %. In contrast to other studies, the net change in tropospheric ozone is predicted to be negative, −3 % globally. This change is larger in the Northern Hemisphere where global models usually show positive biases. We find that the reaction with phenoxy radicals is a significant loss for ozone, on the order of 200–300 Tg yr−1, which is similar to the estimated ozone loss due to bromine chemistry.
Although the net global impact of aromatics is limited, our results indicate that aromatics can strongly influence tropospheric chemistry on a regional scale, most significantly in East Asia. An analysis of the main model uncertainties related to oxidation and emissions suggests that the impact of aromatics may even be significantly larger.
- Article
(11044 KB) - Full-text XML
- BibTeX
- EndNote


Volatile organic compounds (VOCs) comprise a large variety of species that influence the tropospheric chemistry at local, regional, and global scales. VOCs react mainly with the hydroxyl radical (OH), ozone (O3), and the nitrate radical (NO3), or they are photolyzed. Their oxidation affects many key atmospheric species, including OH, O3, and nitrogen oxides (). Production and destruction of ozone is controlled by the ratio of VOCs to NOx. In the low-NOx regime, the net effect of VOC oxidation is ozone destruction. Under high-NOx conditions, e.g., in urban areas, O3 is generated by the oxidation of VOCs (Sillman et al., 1990).
Aromatics are unsaturated planar cyclic organic compounds with enhanced stability due to a strong electron delocalization. Several of them are present in the atmosphere, e.g., benzene, toluene, ethylbenzene, xylenes, styrene, and trimethylbenzenes. In general, aromatic compounds are found in continental areas, especially in industrialized urban and semiurban regions (Barletta et al., 2005) where their emissions are highest. They are responsible for a considerable fraction of ozone and secondary organic aerosol (SOA) formation (Ng et al., 2007; Lee et al., 2002; Ran et al., 2009). In addition, many aromatics are toxic (WMO, 2000).
Emissions of aromatics are primarily anthropogenic, related to fuel combustion and leakage from fuels and solvents (Koppmann, 2007; Sack et al., 1992). Emissions from biomass burning play a secondary role but can be important on a regional scale (Cabrera-Perez et al., 2016). Biogenic emissions are only relevant for toluene (Heiden et al., 1999), although recent studies suggest that other aromatics from biogenic sources may rival those from fossil fuel use (Misztal et al., 2015).
As shown by Cabrera-Perez et al. (2016), aromatic compounds are removed from the atmosphere mainly via chemical oxidation. Dry deposition is a minor sink and wet deposition is almost negligible. The gas-phase chemistry of aromatics has been the subject of many studies (e.g., Atkinson et al., 1989; Warneck, 1999; Koppmann, 2007). Aromatics have relatively short atmospheric lifetimes ranging from a few hours, e.g., for trimethylbenzene, to about 10 days, e.g., for benzene (Atkinson and Arey, 2003). Their oxidation is mainly controlled by the OH radical but they also react with NO3 and O3. The reaction with OH can proceed along two principal pathways. The first starts with H abstraction from an aliphatic substituent. The following reactions are similar to those of aliphatic compounds and involve the addition of O2, yielding a peroxy radical as an intermediate. Toluene, for example, can be oxidized in this way to benzaldehyde (Atkinson and Arey, 2003, and references therein). The second, which is the dominant path, is OH addition to the aromatic ring. Secondary reactions can lead to ring opening and complex further reactions, eventually generating HCHO, glyoxal, and other smaller organic molecules (Vereecken, 2019, and references therein). The products from the oxidation of aromatic compounds have a reduced volatility and allow for the formation of SOA (Henze et al., 2008; Lin et al., 2012), which in turn can significantly reduce the gas-phase concentrations of the aromatic oxidation products.
Numerical models are essential to understand the highly complex chemical degradation of aromatics and to quantify the impact of these compounds in atmospheric chemistry. A very detailed modeling of aromatics is possible with the reactions contained in the Master Chemical Mechanism (MCM, Jenkin et al., 2003). However, due to its complexity, the full mechanism is mainly suitable for box model calculations. For global studies, simplified reaction schemes are usually used (e.g., Emmons et al., 2010; Hu et al., 2015).
The main objective of this study is to investigate how tropospheric OH, O3, NOx, and several VOC concentrations are affected by the oxidation of several monocyclic aromatics. The paper is organized as follows. In Sect. 2, the numerical model and the set-up of the simulations are described. Section 3 analyzes the calculated impact on selected chemical species both on the global and regional scales.
We used the ECHAM5/MESSy Atmospheric Chemistry (EMAC) model, which is a numerical chemistry and climate simulation system that includes submodels describing tropospheric and middle atmosphere processes (Jöckel et al., 2010). EMAC uses the second version of the Modular Earth Submodel System (MESSy2) to link multi-institutional computer codes. The core atmospheric model is the fifth-generation European Centre Hamburg general circulation model (ECHAM5, Roeckner et al., 2006).
For the present study we performed simulations with EMAC (ECHAM5 version 5.3.02, MESSy version 2.53) in the T63L31ECMWF resolution, which corresponds to a grid with a horizontal cell size of approximately and 31 vertical hybrid pressure levels, extending from the surface up to about 10 hPa.
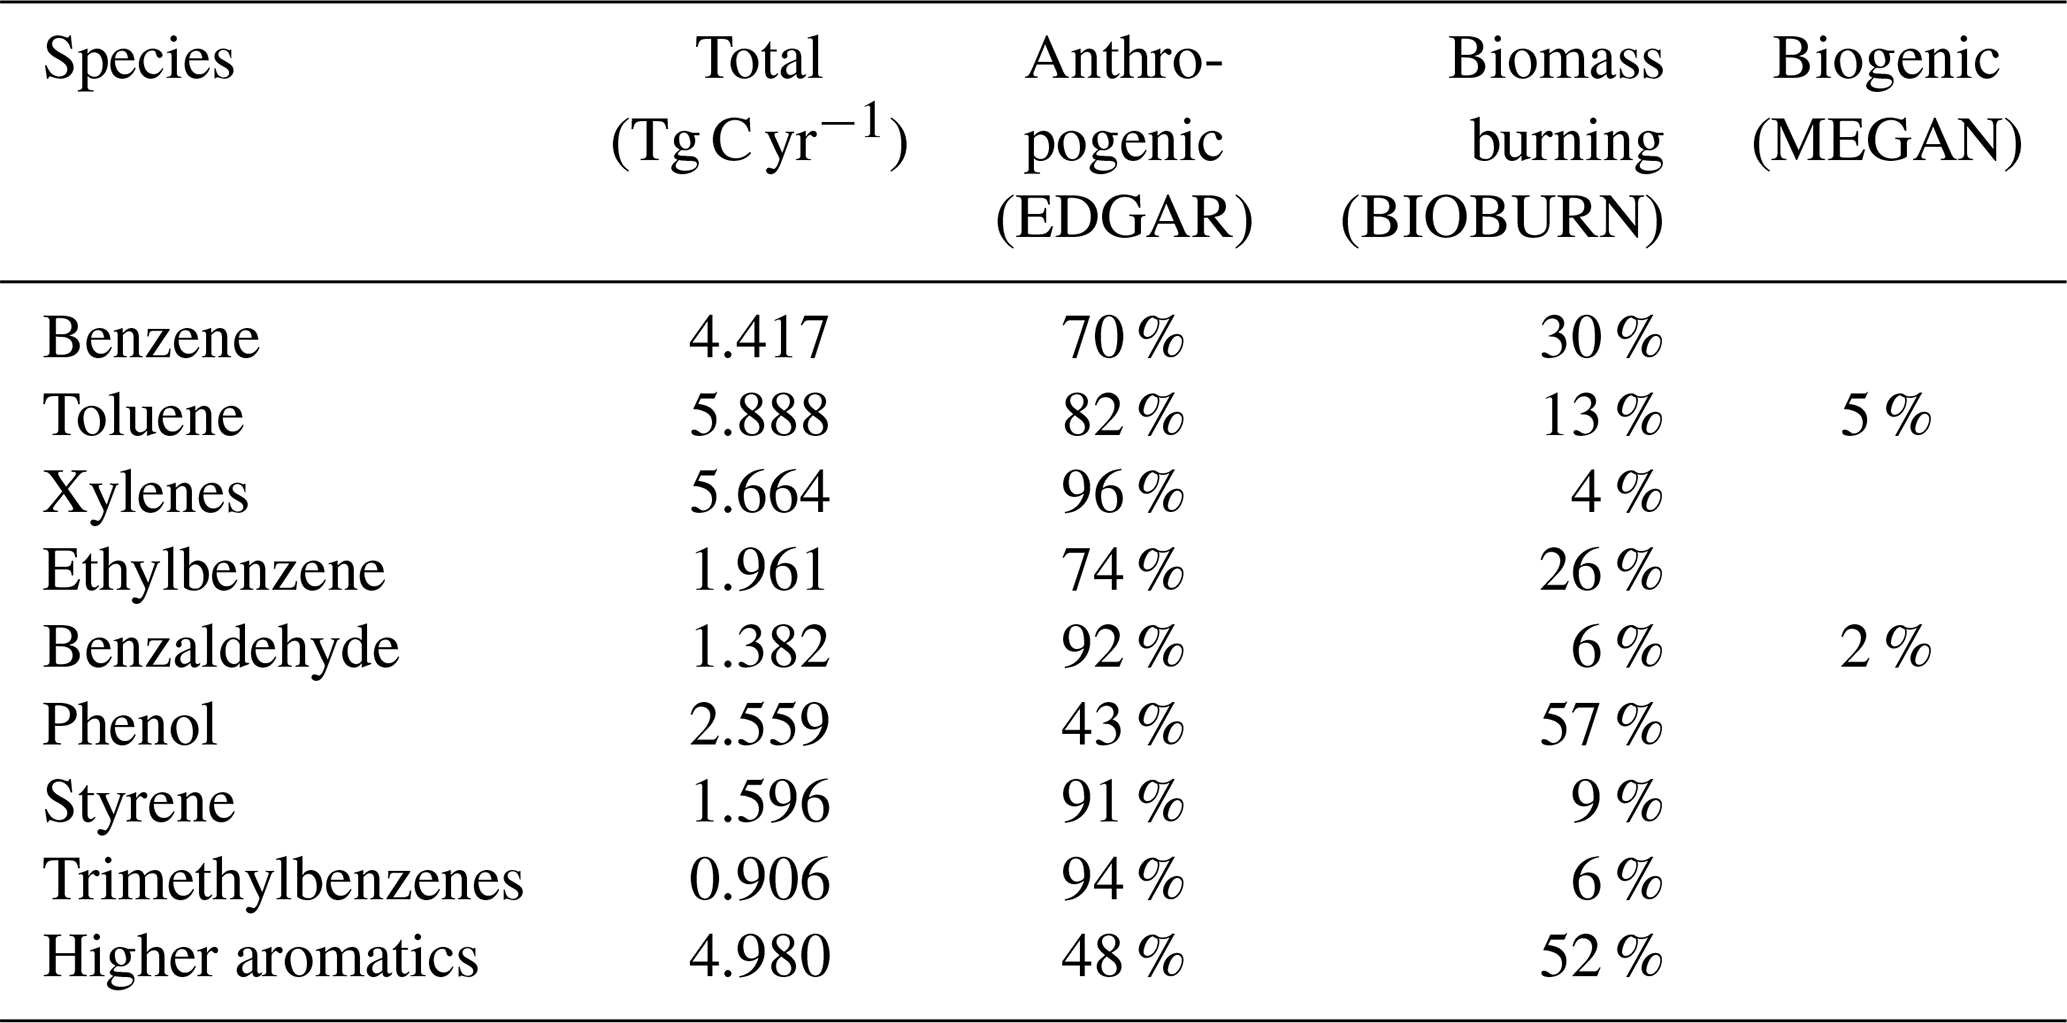
Emission rates of the individual aromatics are shown in Table 1. The sum of all sources is 29.4 Tg C yr−1. For anthropogenic emissions, we used EDGAR 4.3.2 (Huang et al., 2017) distributed vertically as in Pozzer et al. (2009). The MESSy submodel MEGAN calculates biogenic emissions (Guenther et al., 2012). For biomass burning, the submodel BIOBURN was used, which integrates the Global Fire Assimilation System (GFAS) inventory (Kaiser et al., 2012).
Table 1Global annual emission rates of aromatic compounds included in the model simulations and their relative contributions.
Atmospheric chemistry was calculated with the MECCA submodel, which has been evaluated by Pozzer et al. (2007) and Pozzer et al. (2010). The most recent model version has been described by Sander et al. (2019). The mechanism for aromatic species is a reduced version of the MCM (Bloss et al., 2005b), as described in detail by Cabrera-Perez et al. (2016). In short, the MCM schemes for benzene and toluene were taken. Following the approach of Taraborrelli et al. (2009), short-lived intermediates were replaced with their stable products and isomeric peroxy radicals were lumped, preserving the yield of stable products. The initial oxidation steps of aromatics other than benzene and toluene are considered and products replaced by the analogous toluene oxidation products. This approximation inherently introduces an error with respect to the formation of larger and low volatile products. The carbon mass that is not accounted for with this approximation is however tracked by introducing the counter LCARBON for the difference of carbon atoms between the oxidation products of larger aromatics and toluene. In this study, we consider several additions to the MCM reactions:
-
For several nitrophenols (MCM names: HOC6H4NO2, DNPHEN, TOL1OHNO2, MNCATECH, DNCRES), their photolytic production of HONO were added (Bejan et al., 2006), e.g.,
In JVAL (Sander et al., 2014) the cross sections for 2-nitrophenol and 3-methyl-2-nitrophenol and the quantum yield for 2-nitrophenol by Chen et al. (2011) are used to calculate the j values.
-
For the photolysis of benzaldehyde, the MCM uses the rate constant (j value) of methacrolein as a proxy. Our model calculates with JVAL (Sander et al., 2014) the j value based on the UV/VIS spectrum of benzaldehyde recommended by Wallington et al. (2018). In our code, the photolysis of benzaldehyde produces C6H5O2, HO2, and CO.
-
For several phenyl peroxy compounds (MCM names: C6H5O2, CATEC1O2, OXYL1O2, MCATEC1O2, NCRES1O2), their reactions with NO2 were added (Jagiella and Zabel, 2007), e.g.,
-
For the reaction of HO2 with the peroxy radical C6H5CO3 (resulting from the oxidation of benzaldehyde), we use the yields provided by Roth et al. (2010).
-
Alkyl nitrate yields are calculated as a function of temperature and pressure, as described by Sander et al. (2019).
-
Bicyclic peroxy radicals in the oxidation mechanism of toluene yield 60 % glyoxal and 40 % methyl glyoxal from the nonradical terminating reactions with NO and HO2 as suggested by Birdsall et al. (2010). Benzene is treated analogously but yields 100 % glyoxal from the above-mentioned reactions.
The aerosol calculations follow the approach of Pringle et al. (2010), with the notable difference of the inclusion of the explicit organic aerosol submodel ORACLEv1.0 by Tsimpidi et al. (2014). Although, similar to Tsimpidi et al. (2014), low and intermediate volatiles are parameterized as lumped species; the equilibrium with their equivalent aerosol phase is explicitly calculated for ≃600 volatile organic carbon tracers via ORACLE. The volatility and the enthalpy of vaporization of each tracer is estimated with the approaches of Li et al. (2016) and Epstein et al. (2010), respectively.
The simulated period covers the years 2009–2010, with the first year as spin-up and year 2010 being used for the analysis. The feedback between radiation and chemistry was decoupled to avoid any influence of chemistry on the dynamics (QCTM mode by Deckert et al., 2011). As a consequence, every simulation discussed here has the same meteorology, i.e., binary identical transport.
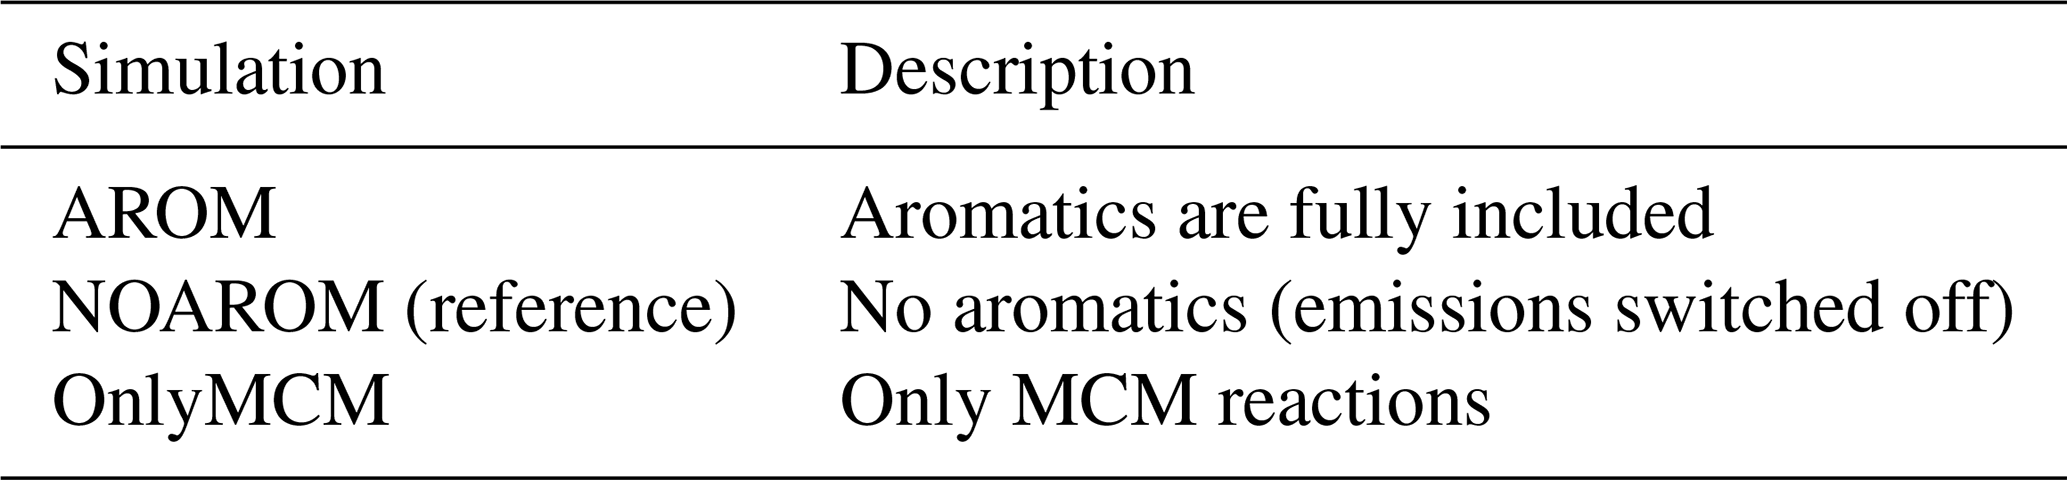
To analyze the influence of the aromatic compounds on atmospheric chemistry and composition, we performed three model simulations, as listed in Table 2. The AROM simulation includes all chemical reactions and emissions of the following monocyclic aromatic compounds: benzene, toluene, xylenes (lumped), phenol, styrene, ethylbenzene, trimethylbenzenes (lumped), benzaldehydes, and higher aromatics (as representative of aromatics with more than nine carbon atoms). The reference simulation (NOAROM) is identical to AROM except that it excludes aromatic compounds. In the OnlyMCM run, we reverted the additions and changes to the MCM that have been described above. Our focus is to compare AROM with NOAROM. The results of OnlyMCM are mainly interesting for benzaldehyde and HONO. As EMAC uses terrain-following vertical hybrid pressure coordinates, we will refer to “surface” as the lowest model level, with an average thickness of roughly 60 m.
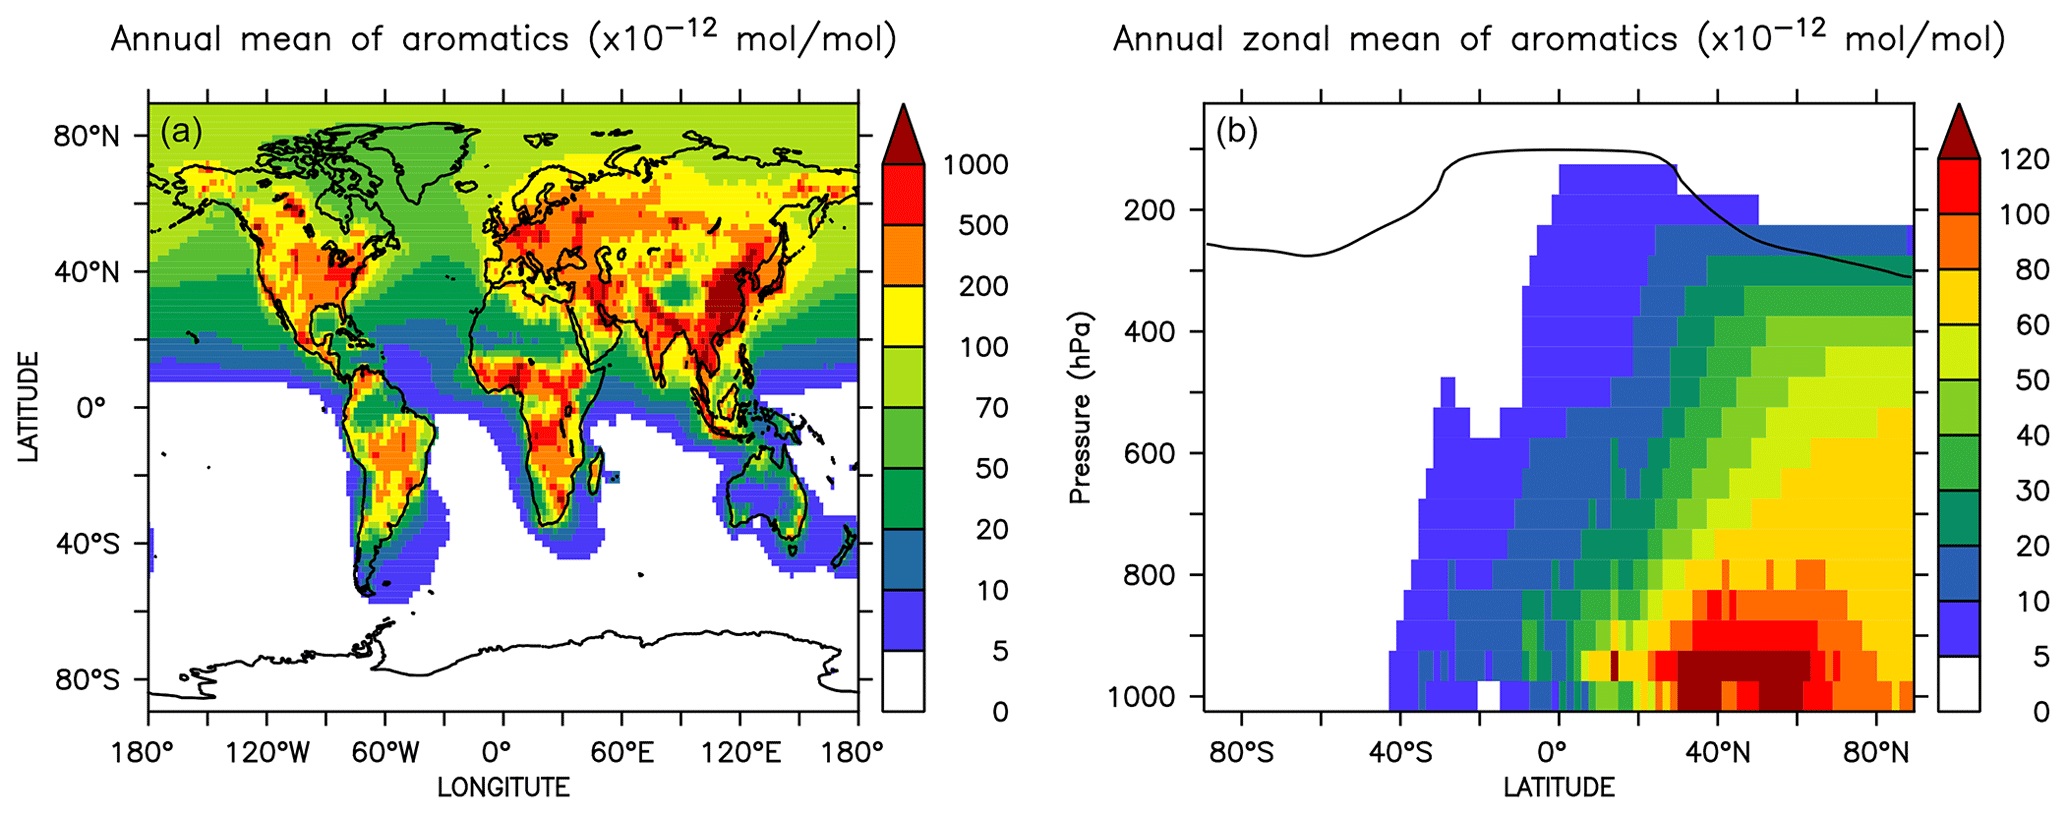
Figure 1Annual mean mixing ratios of the sum of aromatics at the surface (a) and the zonal mean (b) in the AROM simulation. The solid line between 100 and 300 hPa depicts the mean tropopause level.
Globally averaged surface mixing ratios obtained from all model simulations (AROM, NOAROM, and OnlyMCM) are listed in Table 3. Figure 1 shows the annual average mixing ratios of the sum of all aromatic compounds included in the simulation AROM. They are higher in continental areas and close to the surface. The highest values are predicted in the Northern Hemisphere (NH), in particular, in East and South Asia, as well as in parts of Europe, Africa, and the US, reaching up to about 1 nmol mol−1. The background mean mixing ratios in oceanic areas of the Southern Hemisphere (SH) are on the order of a few pmol mol−1. For a more detailed analysis, we have selected the following five regions, as defined in Fig. 2: Amazon area (AMA), central Africa (CAF), eastern Asia (EAS), Europe (EUR), and eastern US (EUS). The budgets of selected chemical species were calculated within these regions (Table 5).
Table 3Globally averaged area-weighted mixing ratios at the surface (annual averages for 2010). “ABSDIFF” denotes the absolute difference, (e.g., AROM-NOAROM), and “RELDIFF” the relative difference, (e.g., AROM/NOAROM-1).
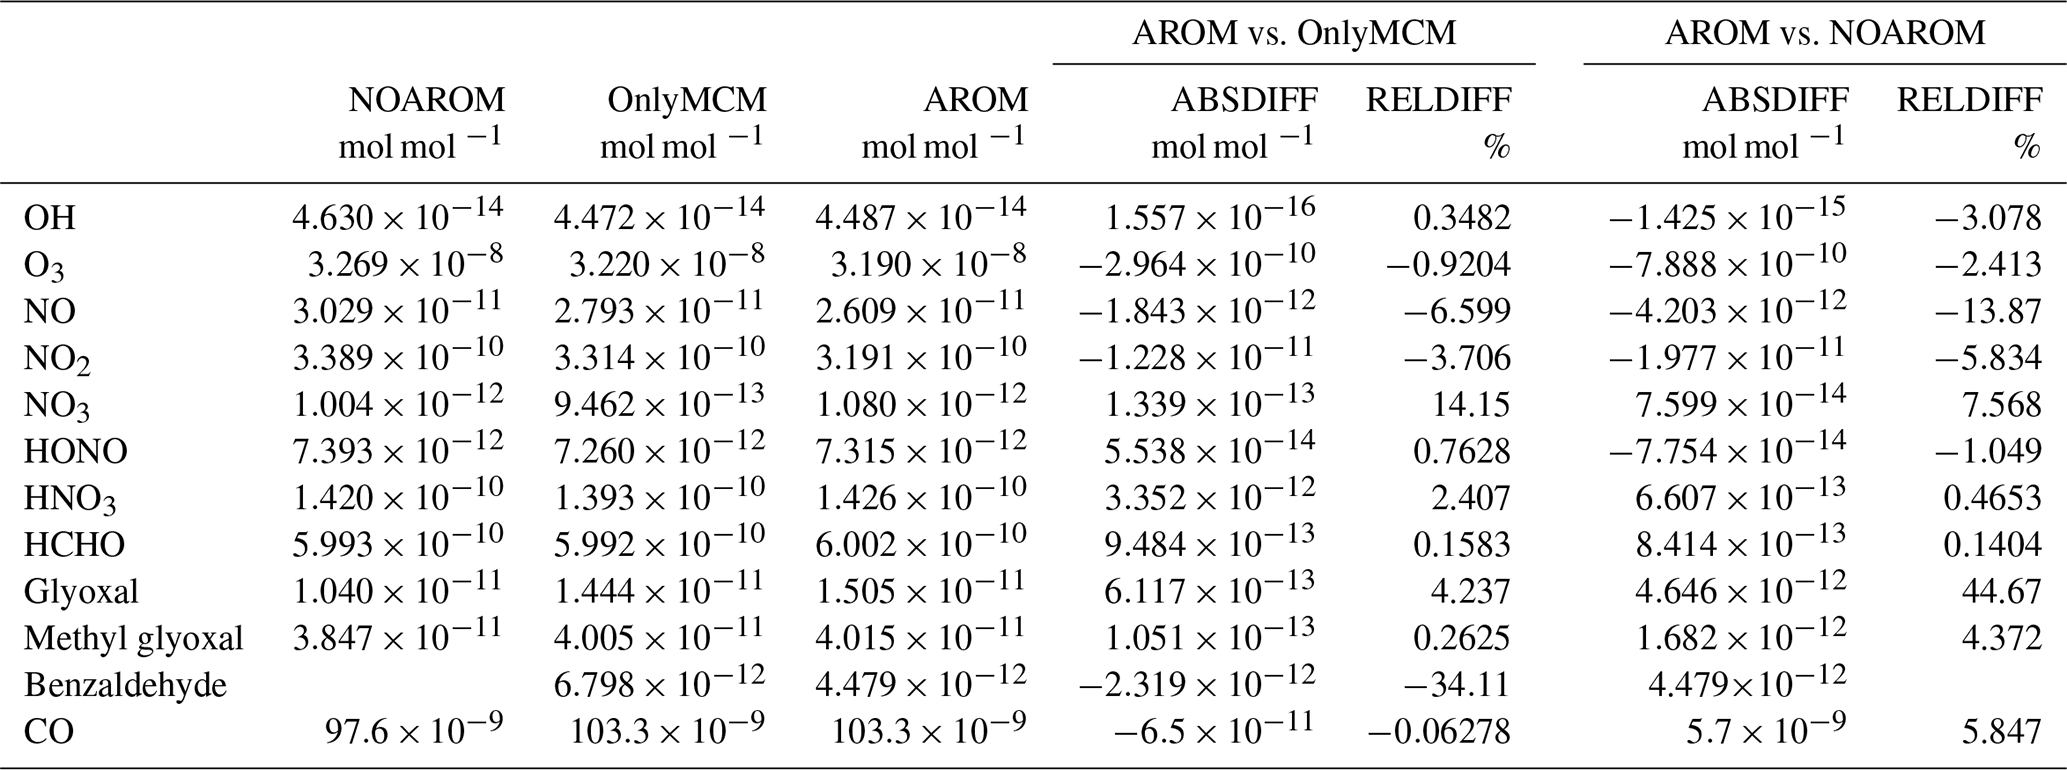

Figure 2Selected regions: AMA – Amazon area, CAF – central Africa, EAS – eastern Asia, EUR – Europe, and EUS – eastern US.
3.1 Hydroxyl radical (OH)
Figure 3 shows the model-calculated surface OH in the AROM and NOAROM simulations. When aromatics are introduced to the model, the global average concentration of OH decreases for two reasons: first, the direct reaction with aromatics consumes OH, and second, additional CO resulting from the degradation of aromatics represents an increased sink for OH. However, in eastern Asia, Europe, and the east coast of the US, where NOx concentrations are high, an increase of OH can be seen. Although the aromatics decrease NOx in these areas (see below), the chemical system remains in the high-NOx regime.

Figure 3Annual average OH mixing ratios at the surface. Middle rows: seasonal means. Left column: mixing ratios in the NOAROM simulation. Middle column: absolute difference AROM–NOAROM. Right column: relative difference AROM/NOAROM-1 in % (shown only where OH is above 0.01 pmol mol−1).
We find that inclusion of aromatics emissions leads to an increase of OH in these regions but to a decrease in the low-NOx CAF region. The increased OH in the high-NOx regions is mainly caused by the reaction of NO with HO2. The production of OH from this important reaction is enhanced by the significant HO2 formation in aromatics oxidation. Compared to OnlyMCM, the AROM simulation has additional HO2 production from the photolysis of ortho-nitrophenols (Reaction R1) and benzaldehyde (Sect. 2). The enhanced HO2 levels (not shown) overcompensates the negative changes in NO (see Sect. 3.3).
Table 4Simulated tropospheric integrals of OH, O3 and NOx, and the lifetime τ of CH4. Tropospheric burdens were reckoned using six different tropopause definitions (provided by the TROPOP submodel, see Jöckel et al. (2010) for details): (1, 2) surfaces of O3 mixing ratio of 125 and 150 nmol mol−1, respectively, (3) WMO definition (WMO, 1957), (4) dynamic PV-based (3.5 PVU potential vorticity surface, sought within 50–800 hPa), (5) climatological (invariable zonal profile, i.e., 300–215 ⋅ (cos(latitude))2 hPa) and (6) the combined definition (WMO tropopause within 30∘ N–30∘ S, otherwise dynamic PV-based tropopause). The latter definition is used by default in EMAC and in this work. Estimated changes to tropospheric O3 burden are identical within 0.05 % between the available definitions.
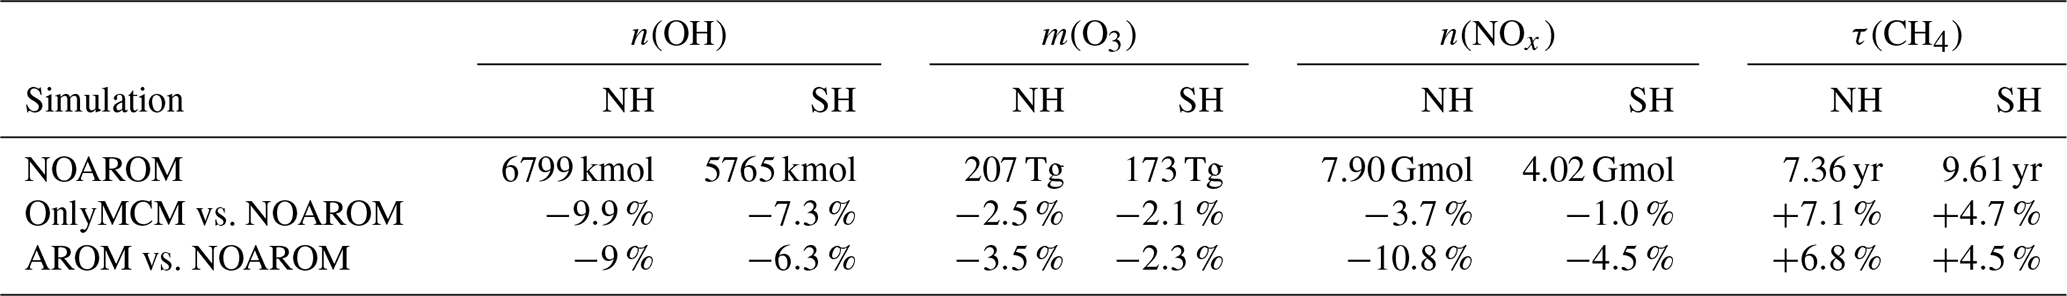
Figure 4 shows the seasonal cycle of the OH mixing ratio in the planetary boundary layer for the NH and SH. Inclusion of the aromatics leads to a relative decrease between 2.5 % and 5.5 %. Higher OH concentrations are identified over continental areas during the NH autumn, winter, and spring than in summer (Fig. 3). In summer, OH concentrations increase only at a few locations when aromatics are included. In general, enhancements are predicted for regions where radical production is not NOx-limited. In the NH there are obviously more such regions compared to the SH. However, the largest decrease in the planetary boundary OH is computed for the NH where most of the emissions of aromatics are located.
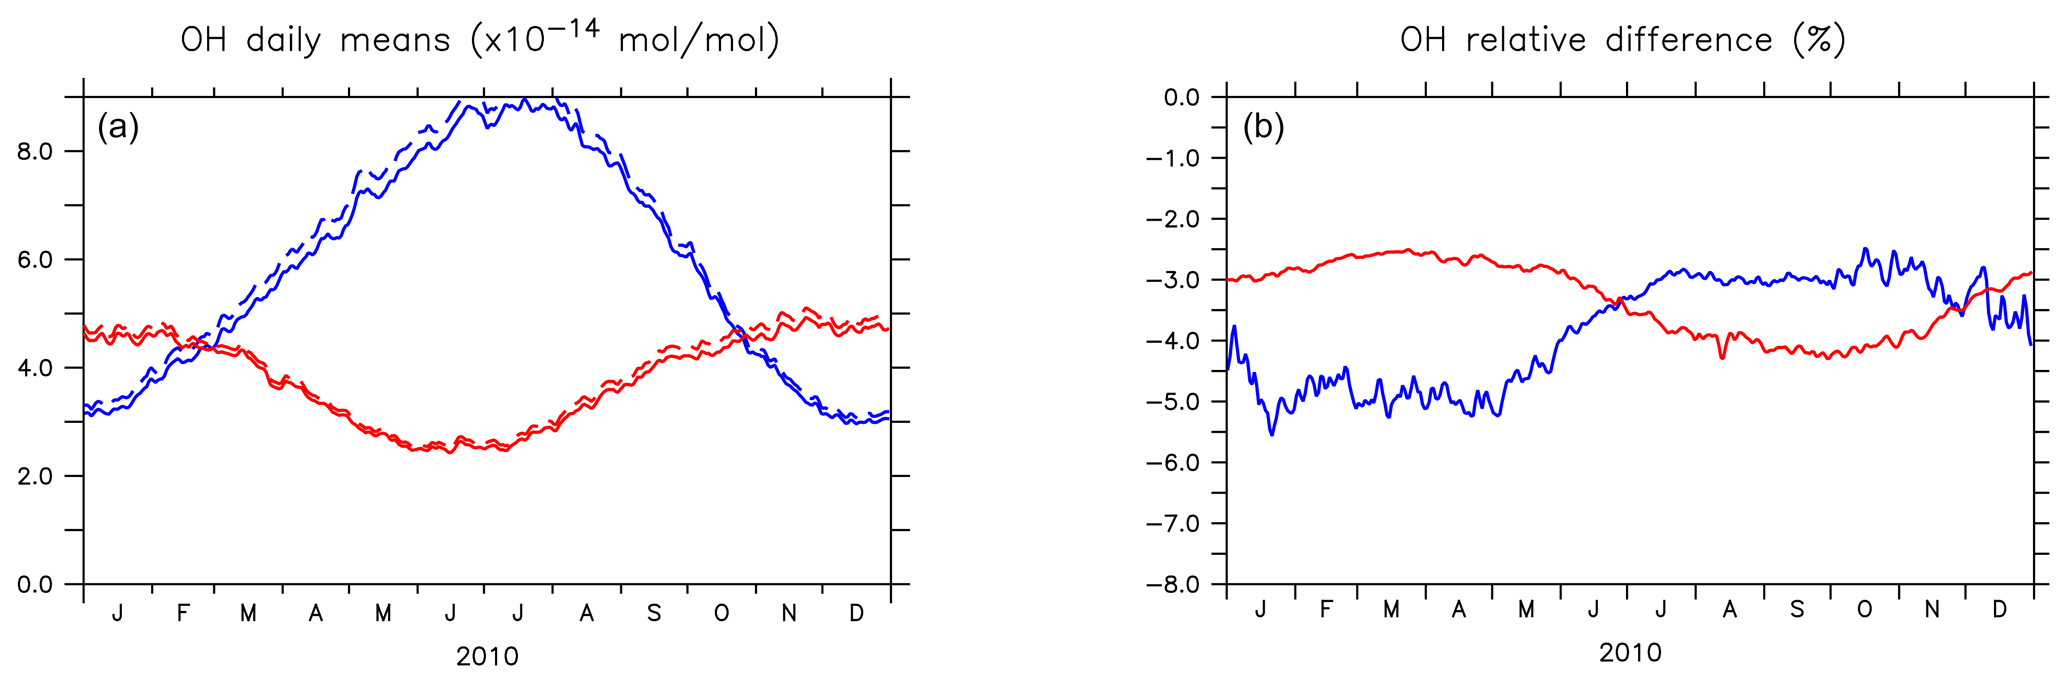
Figure 4(a) Seasonal cycles of OH daily (24 h) mixing ratio means (in 10−14 mol mol−1) in the planetary boundary layer (PBL) for AROM (solid line) and NOAROM (dashed line). (b) Relative difference (expressed in %) between AROM and NOAROM. In blue, values for the NH; in red, values for the SH. The PBL diagnosis is described in Pozzer et al. (2009). The PBL is calculated in the model based on the work of Holtslag et al. (1990). An interactive calculation is performed following the approach of Troen and Mahrt (1986), using the Richardson number, the horizontal velocity components, the buoyancy parameters, and the virtual temperature (Holtslag and Boville, 1993).
Figure 5 shows the annual zonal mean changes of the OH mixing ratio. The changes are most pronounced in the NH upper troposphere where reductions range from 7 % to 20 %. These predicted changes are associated with similar reductions in NOx. In fact, the upper troposphere is in general NOx-limited and the oxidation of aromatics enhances the formation N2O5 and HNO3, which are lost heterogeneously. This leads to an effective removal of NOx from the gas phase and lowers the radical production. The change in hemispheric burdens of OH are consistent with this picture (Table 4). This moderately helps bring the model-simulated interhemispheric OH asymmetry closer to that derived from observations (Lelieveld et al., 2016). Globally, aromatics oxidation reduces OH by 7.7 % and consequently increases methane lifetime by about 5.5 %. The changes are more pronounced in the Northern Hemisphere where aromatics are mostly emitted (Table 4). However, in the EMAC model, methane lifetime remains significantly lower than the ACCMIP multimodel mean and the observational-based estimates (Naik et al., 2013). Coarse model spatial resolutions (about 200 km) are known to result in an overestimation (underestimation) of global mean OH (methane lifetime) of at least 5 % (Yan et al., 2016). This is due to a less efficient conversion of NOx to NOy when strong pollutant emissions are artificially diluted in the model grid boxes. This aspect certainly has a larger impact on the interhemispheric OH asymmetry in atmospheric models that is in contrast to observational estimates (Patra et al., 2014).
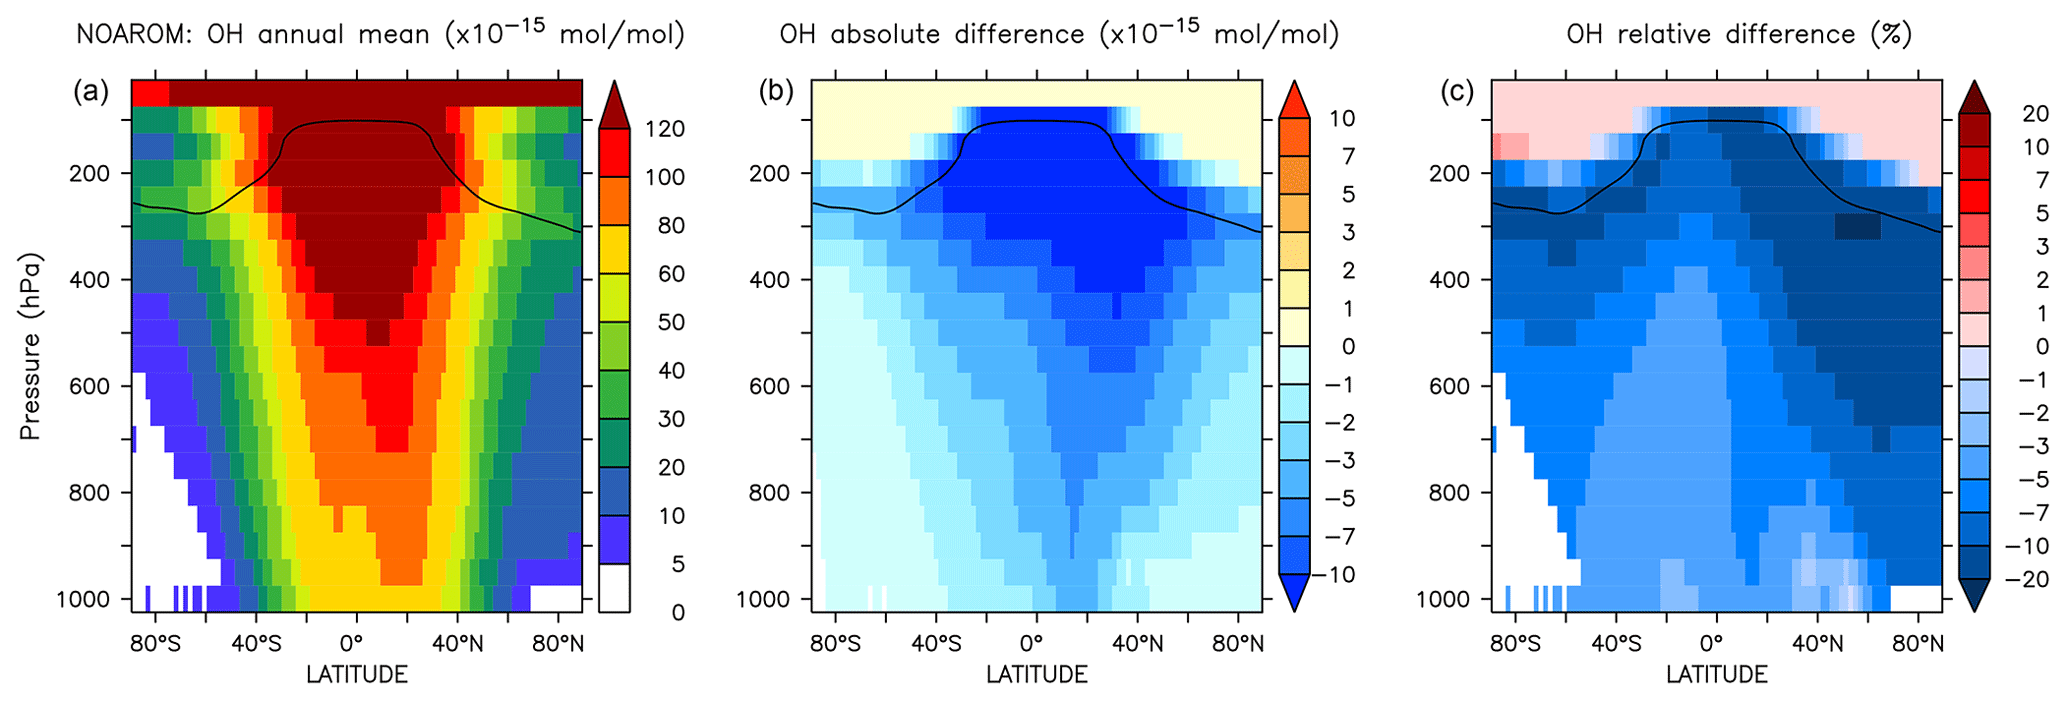
Figure 5Annual average zonal mean OH mixing ratios. (a) Mixing ratios in the NOAROM simulation. (b) Absolute difference AROM–NOAROM. (c) Relative difference AROM/NOAROM-1 in %. The solid line between 100 and 300 hPa depicts the mean tropopause level.
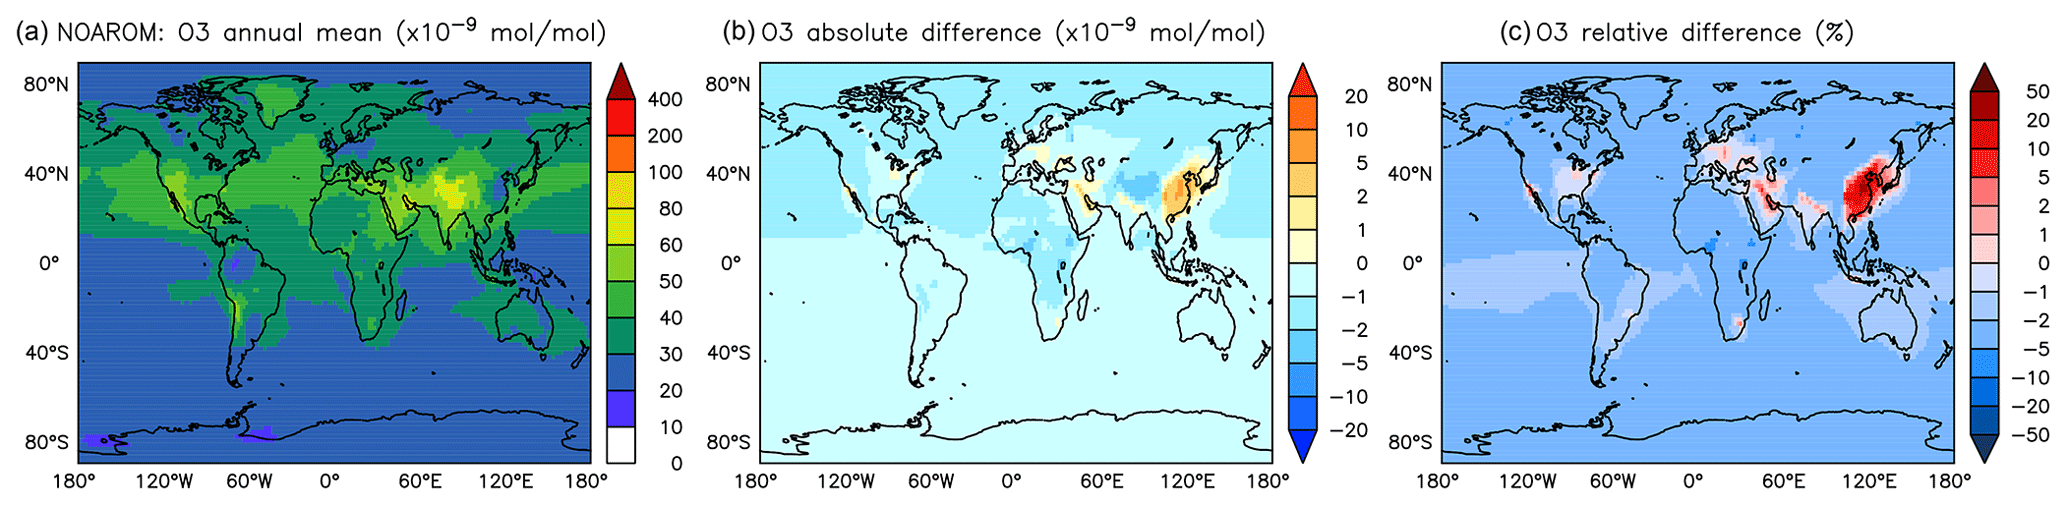
Figure 6Annual average O3 mixing ratios at the surface. (a) Mixing ratios in the NOAROM simulation. (b) Absolute difference AROM–NOAROM. (c) Relative difference AROM/NOAROM-1 in %.
Table 5Regionally averaged mixing ratios of selected species (annual averages for 2010).
Differences for OH between the AROM and OnlyMCM simulations are shown in Figs. A1 and A2 of the Appendix A.
3.2 Ozone (O3)
In most areas of the globe, surface ozone is slightly lower in AROM than in NOAROM (Fig. 6). The O3 reduction is due to (i) the decrease in NOx concentrations (limiting ozone formation) and (ii) increasing radical production (HOx and RO2) in ozone-depleting regimes, which enhances reaction of O3 with HO2. Only a few high-NOx regions, where hydrocarbons are the limiting factor for ozone formation, show increased ozone concentrations: mainly eastern Asia (EAS), but also the eastern US (EUS) and Europe (EUR). The increases in these areas is associated with anthropogenic emissions of aromatics, which have significant ozone formation potentials. We find that anthropogenic emissions of aromatics leads to an increase of O3 in the EAS and EUR regions but to a decrease in the low-NOx CAF region.
The seasonal cycles of the relative differences show lower amplitude than for OH, but similar patterns (Fig. 7). The impact of aromatics is smallest in summer. Like for the OH levels, the interhemispheric asymmetry in the emission of aromatics determines the higher O3 decrease in the NH compared to the SH.

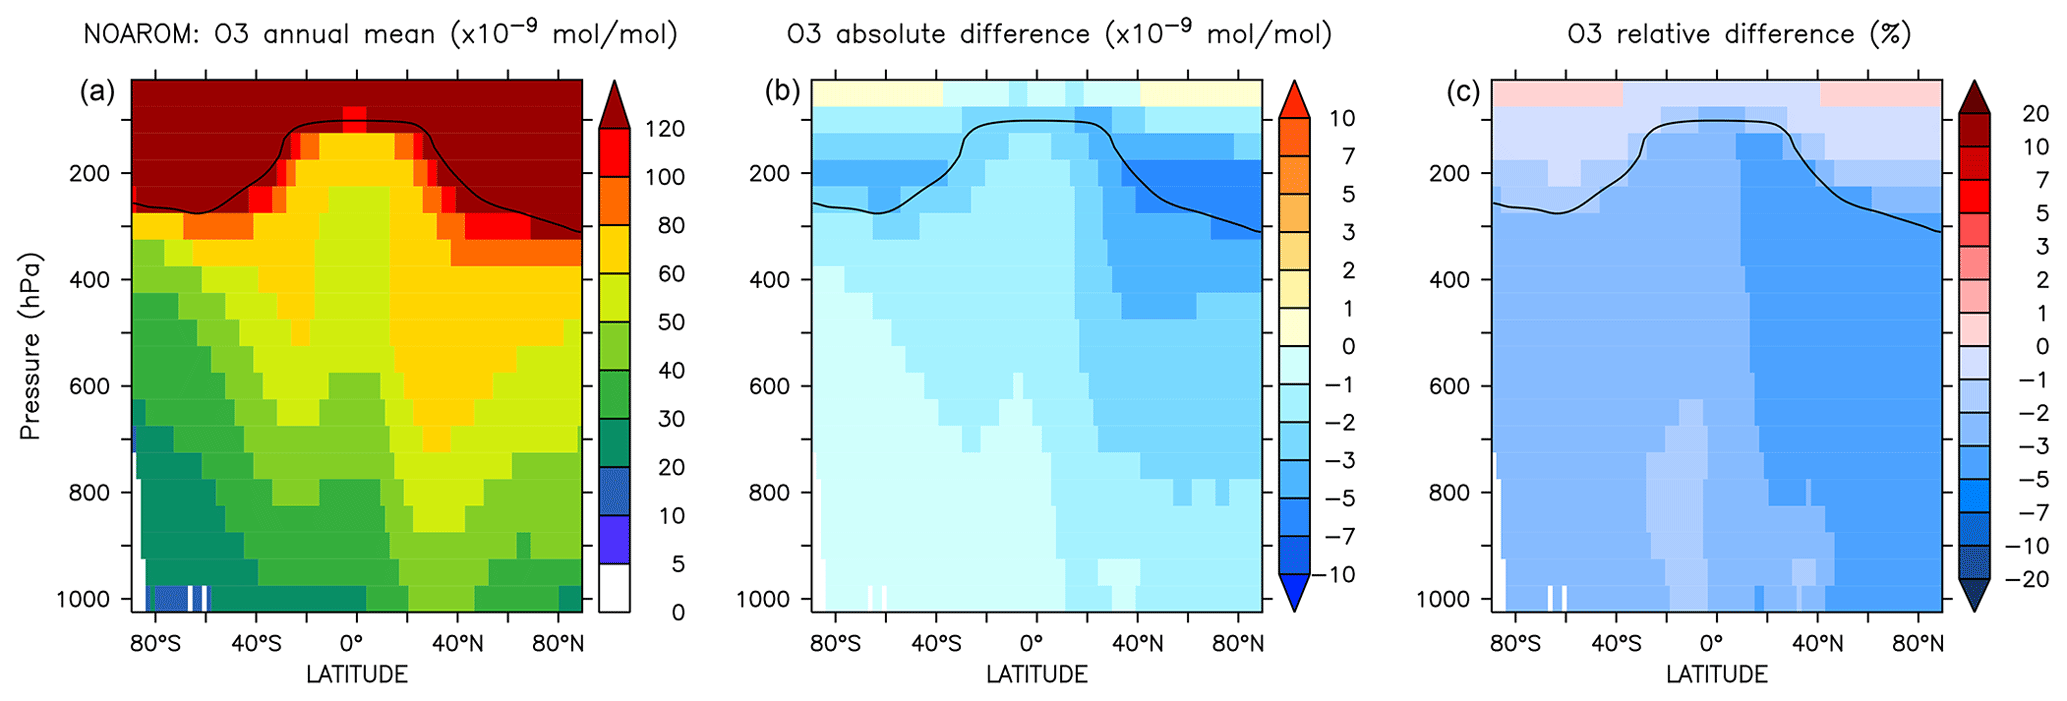
Figure 8Annual average zonal mean O3 mixing ratios. (a) Mixing ratios in the NOAROM simulation. (b) Absolute difference AROM–NOAROM. (c) Relative difference AROM/NOAROM-1 in %. The solid line between 100 and 300 hPa depicts the mean tropopause level.
The zonal mean changes of O3 mixing ratio in the troposphere are uniformly negative (Fig. 8). Similar to surface ozone, the annual mean changes for OnlyMCM and AROM are −2.3 % and −3.0 %, respectively. The hemispheric changes are shown in Table 4. It is well known that MCM for aromatics overestimates ozone production in chamber experiments (Bloss et al., 2005b). This issue has been analyzed in the companion paper (Bloss et al., 2005a), where the best mechanism improvement was found to be an early OH source during oxidation. Cabrera-Perez et al. (2016) introduced enhanced HOx sources by photolysis of benzaldehyde and nitrophenols. These modifications consistently result in less ozone produced with respect to MCM. These results deviate from the results by Yan et al. (2019) who suggested a global increase of 0.4 % due to aromatics. However, they only considered benzene, toluene, and xylenes. Our results, obtained with a more comprehensive setup, suggest that aromatics could slightly ameliorate the model overestimate in the NH (Jöckel et al., 2016; Young et al., 2018). The overall tropospheric ozone burden decreases from 381 to 369 Tg for the AROM simulation. These estimated changes are robust against the tropopause definition and are about −3.5 % and −2.3 % for the Northern Hemisphere and Southern Hemisphere, respectively (Table 4).
The changes in ozone are caused by perturbations of the radical production in different NOx regimes but also by the direct ozone loss in reactions with organic compounds. It is widely acknowledged that this direct loss is only due to the ozonolysis of unsaturated VOCs and is estimated to be about 100 Tg yr−1, less than 2 % of the tropospheric ozone budget (e.g., in Tilmes et al., 2016). However, with aromatics a new direct ozone loss process involving organic radicals comes into play. In Fig. 9 the change in tropospheric ozone burden is shown against the change in ozone loss with organic compounds. This change is estimated to be globally in the 200–300 Tg yr−1 range depending on the mechanism used and is comparable to the loss by bromine chemistry in the troposphere (Sherwen et al., 2016). Ozone is known to react with organic radicals like methyl peroxy radical although this loss is an insignificant sink (Tyndall et al., 1998). We find that (substituted) phenoxy radicals from aromatics are a significant sink term of ozone (>200 Tg yr−1). These radicals are unique to aromatics oxidation and they also react with NO and NO2. When the concentrations of NOx are relatively low, C6H5O has a sufficiently long lifetime to react with O3. This ozone loss is modeled based on the results by Tao and Li (1999) for phenoxy radical:
Although the known rate constant for Reaction (R3) is about one order of magnitude lower than the others, the high abundance in the atmosphere makes ozone the major sink of (substituted) phenoxy radicals. This direct ozone loss in Reaction (R3) is enhanced by phenoxy radical production in Reaction (R2) and the concurrent loss of odd oxygen by NO3 photolysis and N2O5 heterogeneous loss:
In our chemical kinetics mechanism (also in MCM) the reaction system just described constitutes an effective catalytic destruction cycle of odd oxygen. The strength of this cycle has not been diagnosed in this study. Nevertheless, we observe that it depends on the (substituted) phenoxy radical levels and is significantly reduced in AROM compared to OnlyMCM (Fig. 9). We ascribe this difference to MCM not accounting for the photolysis of nitrophenols (Reaction R1) as determined by Bejan et al. (2006). In fact, in MCM, the first nitrophenols from benzene (HOC6H4NO2) and toluene (TOL1OHNO2) solely form nitrophenoxy radicals with the same reactivity of the unsubstituted phenoxy radical (C6H5O). Thus, the photolysis of nitrophenols decreases the amount of ozone lost by reaction with nitrophenoxy radicals. The impact of all the additions and modifications to the MCM on the predicted O3 levels is shown in Figs. A3 and A4 of Appendix A. Uncertainties on the reactions mentioned in this paragraph are discussed in Sect. 4.
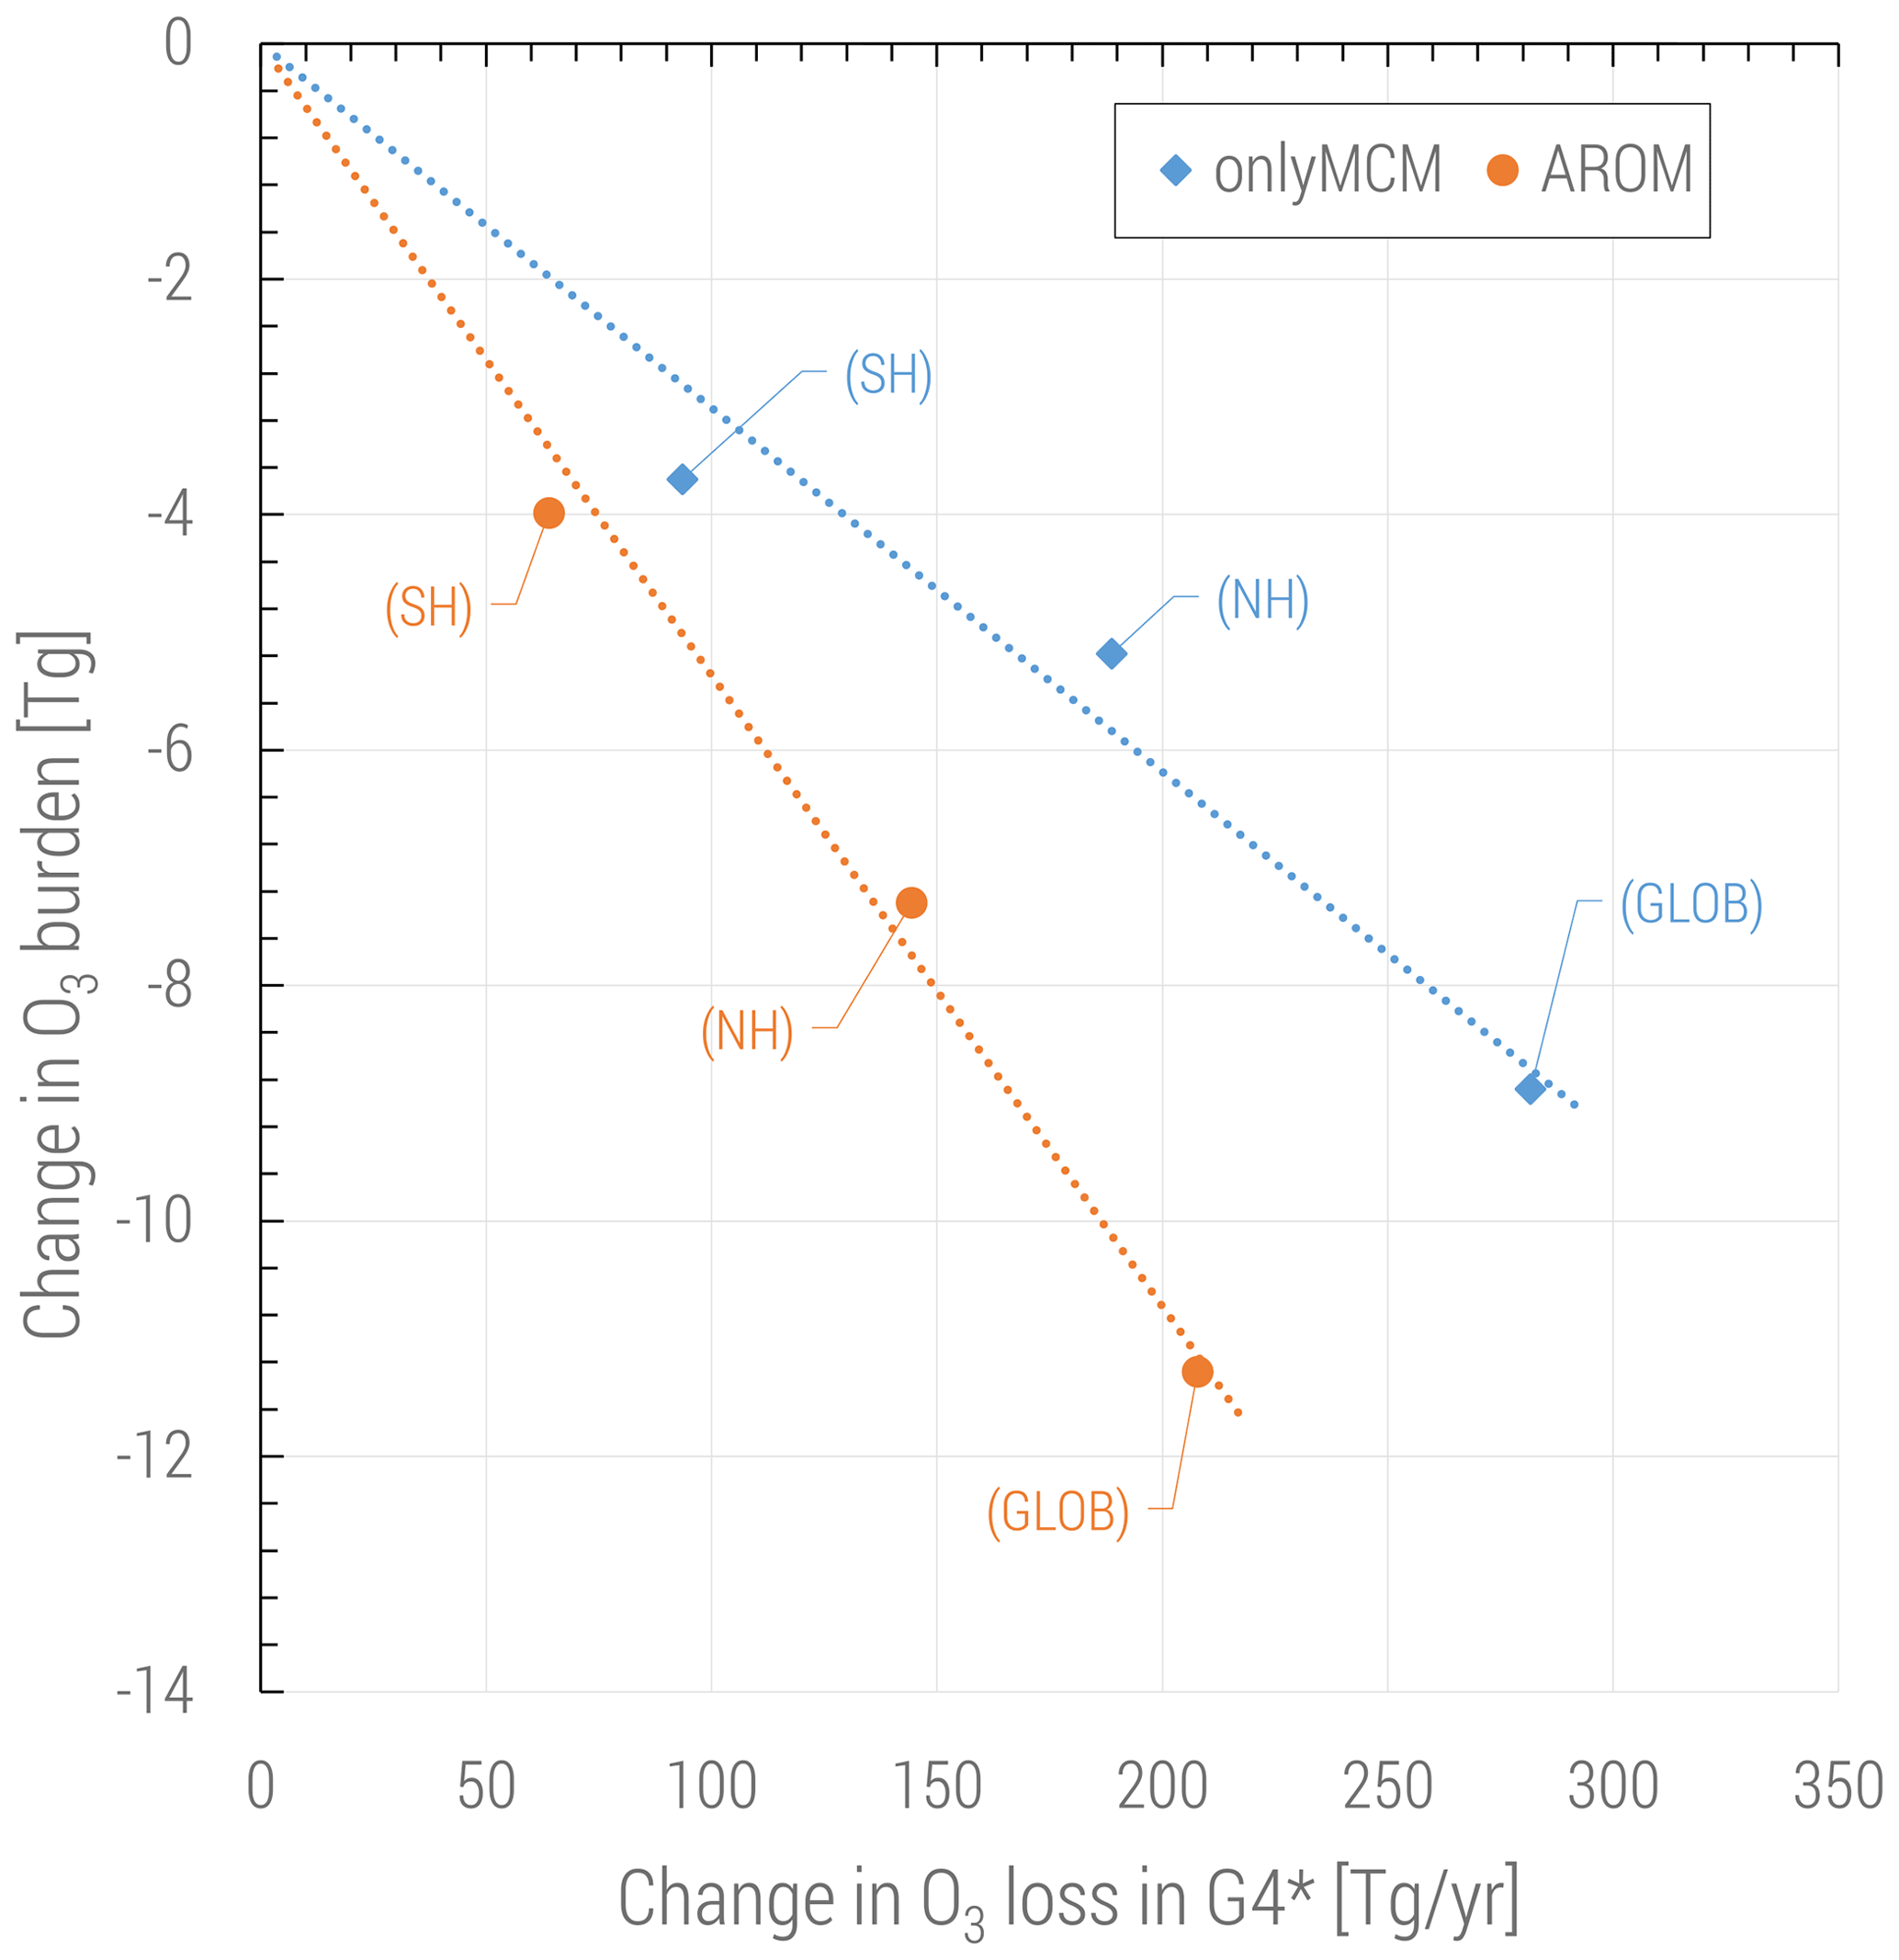
Figure 9Change in tropospheric ozone burden versus change in ozone loss for all reactions in the VOC chemistry (G4 category of the MECCA mechanism, see the Supplement of Sander et al., 2019). The change in ozone loss is due to the reactions with (substituted) phenoxy radicals. Global and hemispheric results for OnlyMCM (blue) and AROM (orange) simulations are shown.
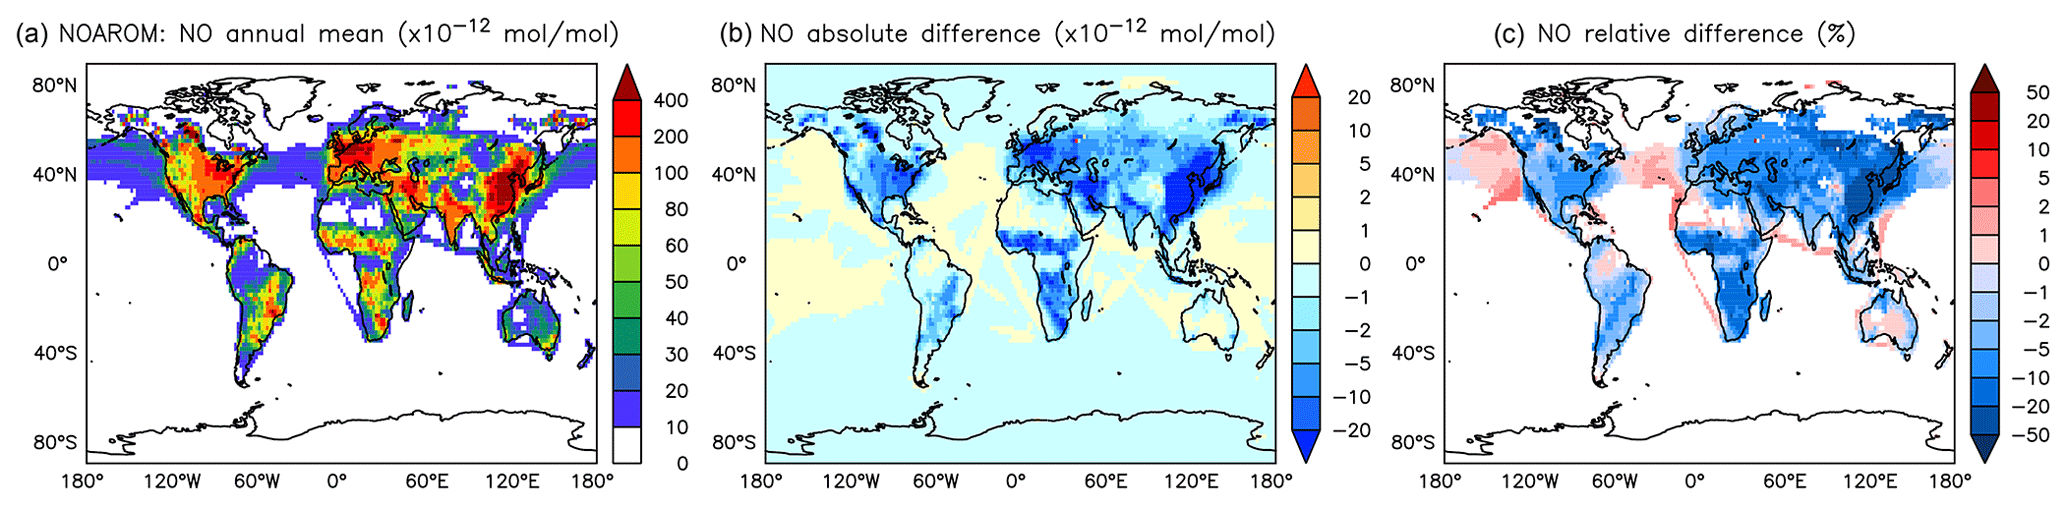
Figure 10Annual average NO mixing ratios at the surface. (a) Mixing ratios in the NOAROM simulation. (b) Absolute difference AROM–NOAROM. (c) Relative difference AROM/NOAROM-1 in % (shown only where NO is above 10 pmol mol−1).
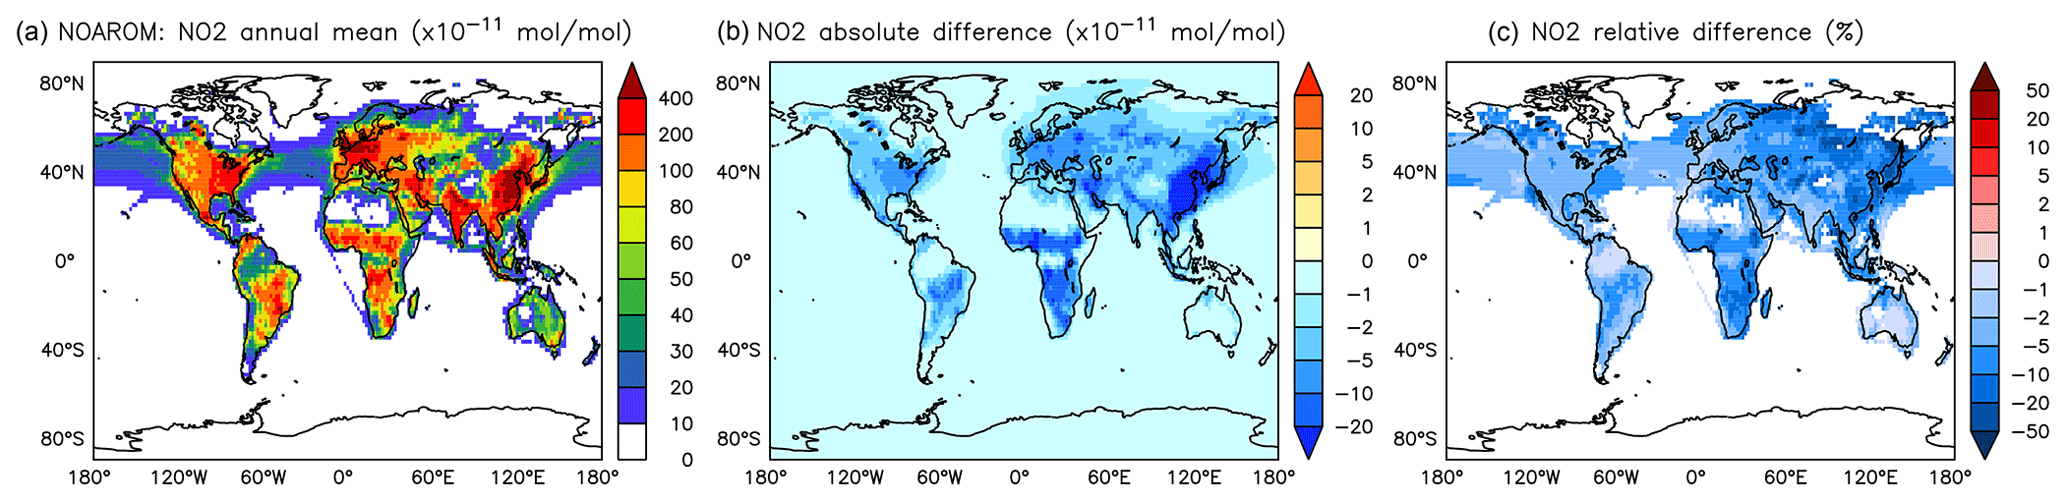
Figure 11Annual average NO2 mixing ratios at the surface. (a) Mixing ratios in the NOAROM simulation. (b) Absolute difference AROM–NOAROM. (c) Relative difference AROM/NOAROM-1 in % (shown only where NO2 is above 100 pmol mol−1).
Our results for ozone differ both in magnitude and sign compared to the global study by Yan et al. (2019). However, the latter used the SAPRC-11 oxidation mechanism (Carter and Heo, 2013), which does not account for the reaction of phenoxy radicals with ozone (Reaction R3) and phenylperoxy radicals with NO2 (Reaction R2).
3.3 Inorganic nitrogen
The simulated annual mean NOx concentrations at the surface are significantly lower in AROM than in NOAROM (Figs. 10 and 11). One reason is the formation of aromatic species containing nitrogen (e.g., nitrophenols) in AROM, thereby transferring part of the NOx burden to the nitrogenated species. The largest decreases (both absolute and relative) are found in regions with high NOx concentrations. Since the ozone chemistry is not NOx-limited in these regions, the impact on ozone is small. This holds for the free troposphere for which zonal average decreases in NOx can be larger than 20 % (not shown), which in turn significantly influences OH (Fig. 5).
On the one hand, the reaction with aromatics is a sink for NO3. On the other hand, NO3 is produced in the phenylperoxy reaction with NO2 (Reaction R2). However the latter seems to dominate and cause a significant and widespread increase in the predicted NO3 levels. Relative to NOAROM, in AROM the global average of the nighttime species NO3 increases by more than 7 % (Table 3). In contrast to the global mean tendency, NO3 has modest decreases in several regions in Africa, South America, and India (Fig. 12). These decreases correlate well with emissions from biomass burning. Differences for NO3 between the AROM and OnlyMCM simulations are shown in Fig. A5 of Appendix A.

Figure 12Annual average NO3 mixing ratios at the surface. (a) Mixing ratios in the NOAROM simulation. (b) Absolute difference AROM–NOAROM. (c) Relative difference AROM/NOAROM-1 in % (shown only where NO3 is above 1 pmol mol−1).
Although the net change of global HONO is small (about 3 % less in AROM than in NOAROM, see Fig. 13 and Table 3), the regional differences can be large (Table 5). A decrease of HONO is seen mainly in polluted areas (EAS, EUR, EUS) in the winter. In contrast, HONO increases in the regions with emissions from biomass burning (AMA, CAF). Here, HONO is formed by the photolysis of nitrophenols (Reaction R1). Since these reactions are not included in the MCM, we do not see any HONO increase in the OnlyMCM simulation (Fig. 14).
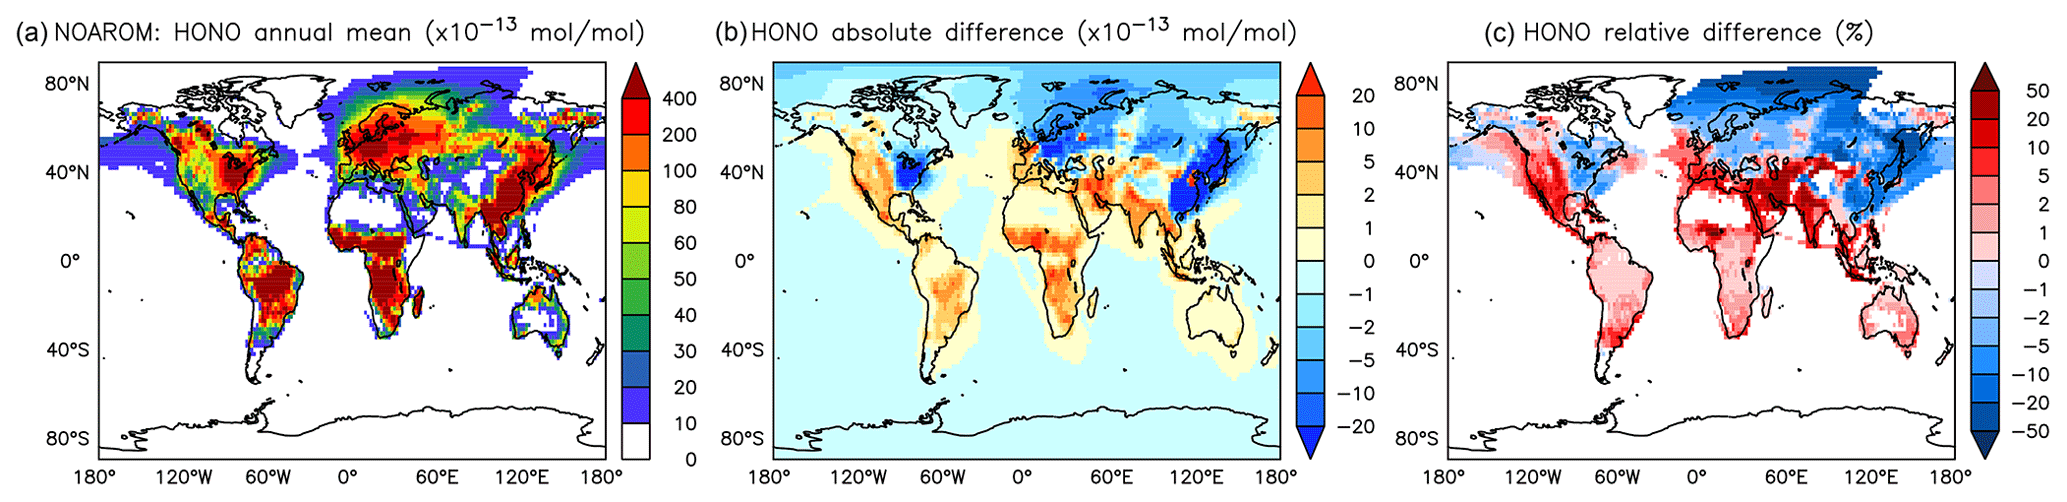
Figure 13Annual average HONO mixing ratios at the surface. (a) Mixing ratios in the NOAROM simulation. (b) Absolute difference AROM–NOAROM. (c) Relative difference AROM/NOAROM-1 in % (shown only where HONO is above 1 pmol mol−1).

Figure 14Annual average HONO mixing ratios at the surface. (a) Mixing ratios in the NOAROM simulation. (b) Absolute difference OnlyMCM–NOAROM. (c) Relative difference OnlyMCM/NOAROM-1 in % (shown only where HONO is above 1 pmol mol−1).
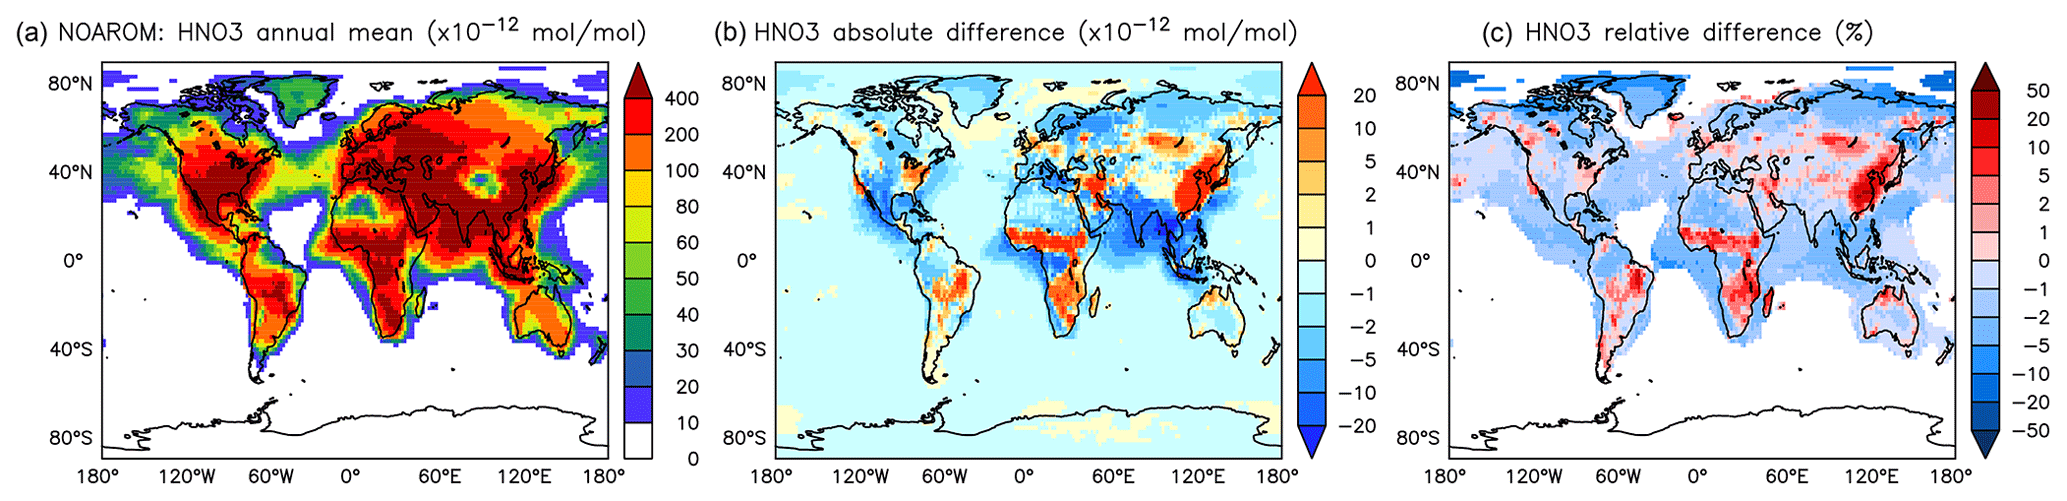
Figure 15Annual average HNO3 mixing ratios at the surface. (a) Mixing ratios in the NOAROM simulation. (b) Absolute difference AROM–NOAROM. (c) Relative difference AROM/NOAROM-1 in % (shown only where HNO3 is above 10 pmol mol−1).
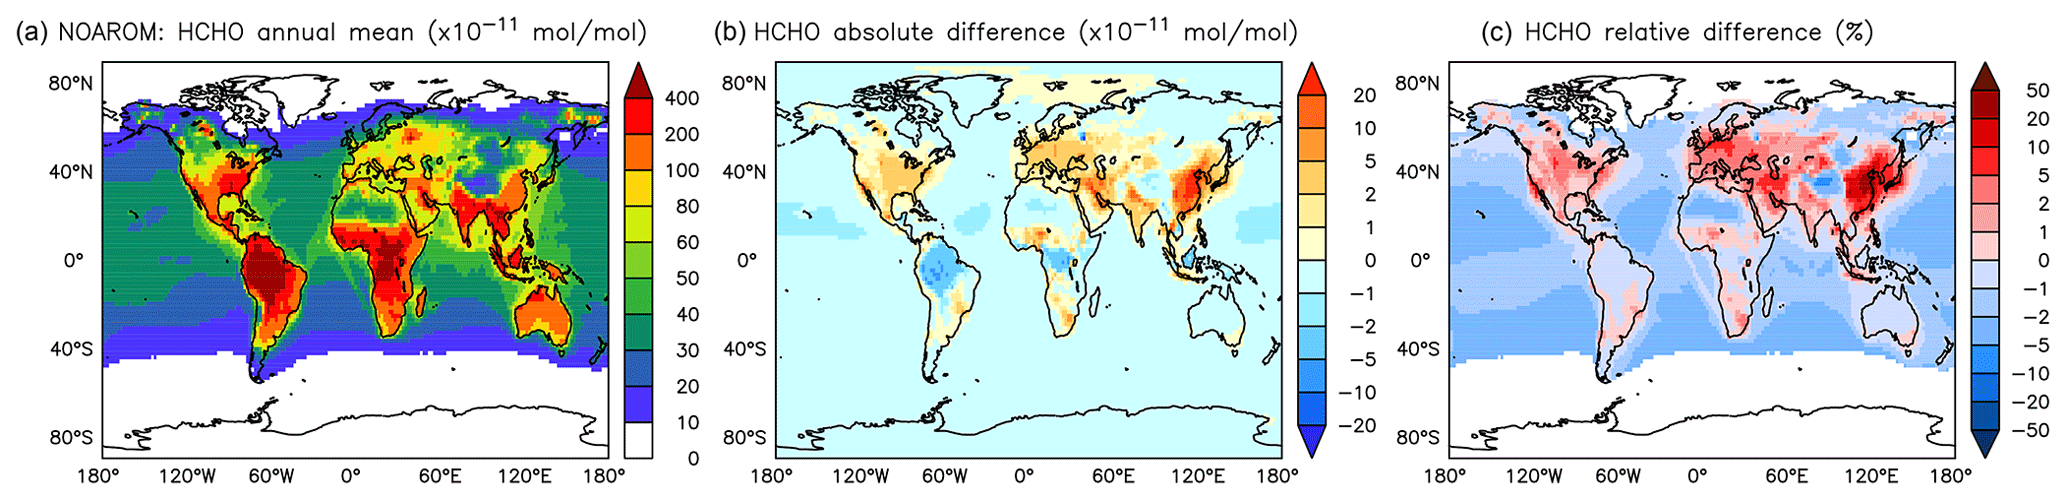
Figure 16Annual average HCHO mixing ratios at the surface. (a) Mixing ratios in the NOAROM simulation. (b) Absolute difference AROM–NOAROM. (c) Relative difference AROM/NOAROM-1 in % (shown only where HCHO is above 100 pmol mol−1).
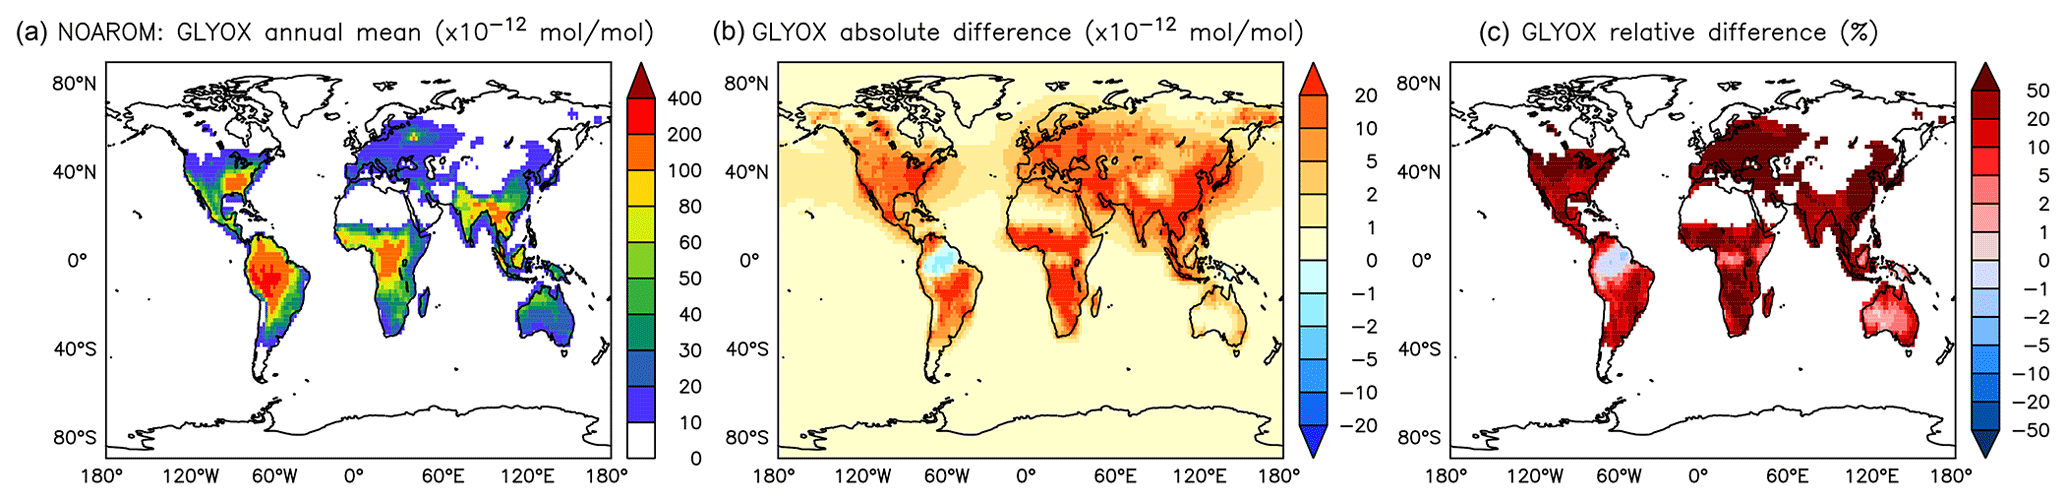
Figure 17Annual average glyoxal mixing ratios at the surface. (a) Mixing ratios in the NOAROM simulation. (b) Absolute difference AROM–NOAROM. (c) Relative difference AROM/NOAROM-1 in % (shown only where glyoxal is above 10 pmol mol−1).
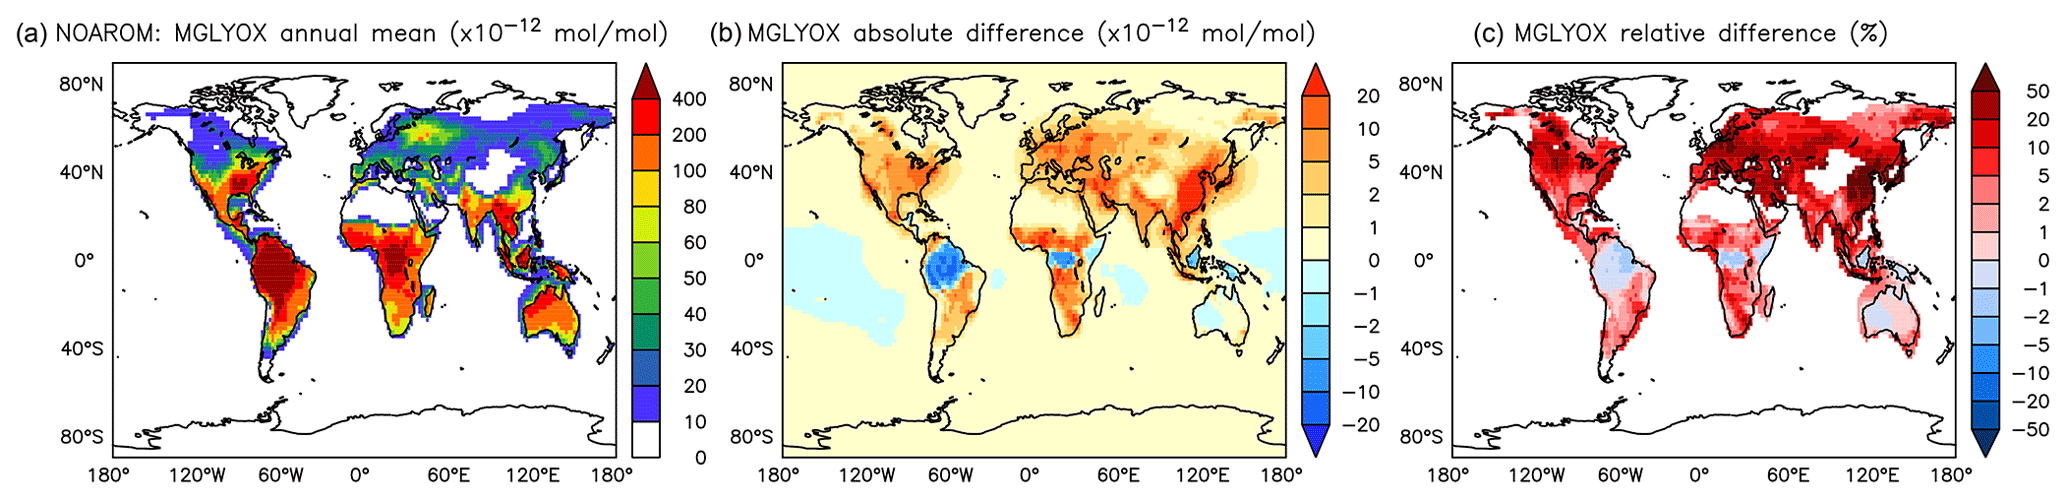
Figure 18Annual average methyl glyoxal mixing ratios at the surface. (a) Mixing ratios in the NOAROM simulation. (b) Absolute difference AROM–NOAROM. (c) Relative difference AROM/NOAROM-1 in % (shown only where methyl glyoxal is above 10 pmol mol−1).
On a global average level, HNO3 is not affected much by aromatics. However, an increase can be seen in the regions where ozone increases (EAS) or where biomass burning decreases NO3 and N2O5 (CAF) (see Fig. 15 and Table 5). An average zonal mean change of up to 5 % throughout the upper troposphere–lower stratosphere (UTLS) is linked to the enhanced NO3 production by Reaction (R2).
3.4 Selected oxygenated compounds
Globally, HCHO is not affected much by aromatics. There are, however, regional differences that are moderate because of the concurrent enhancement of the HCHO sink by reaction with OH. We find maximum absolute depletions in the AMA region, where concentrations are typically high (Fig. 16). Increased values of HCHO are mainly seen in EAS and EUR (Table 5).
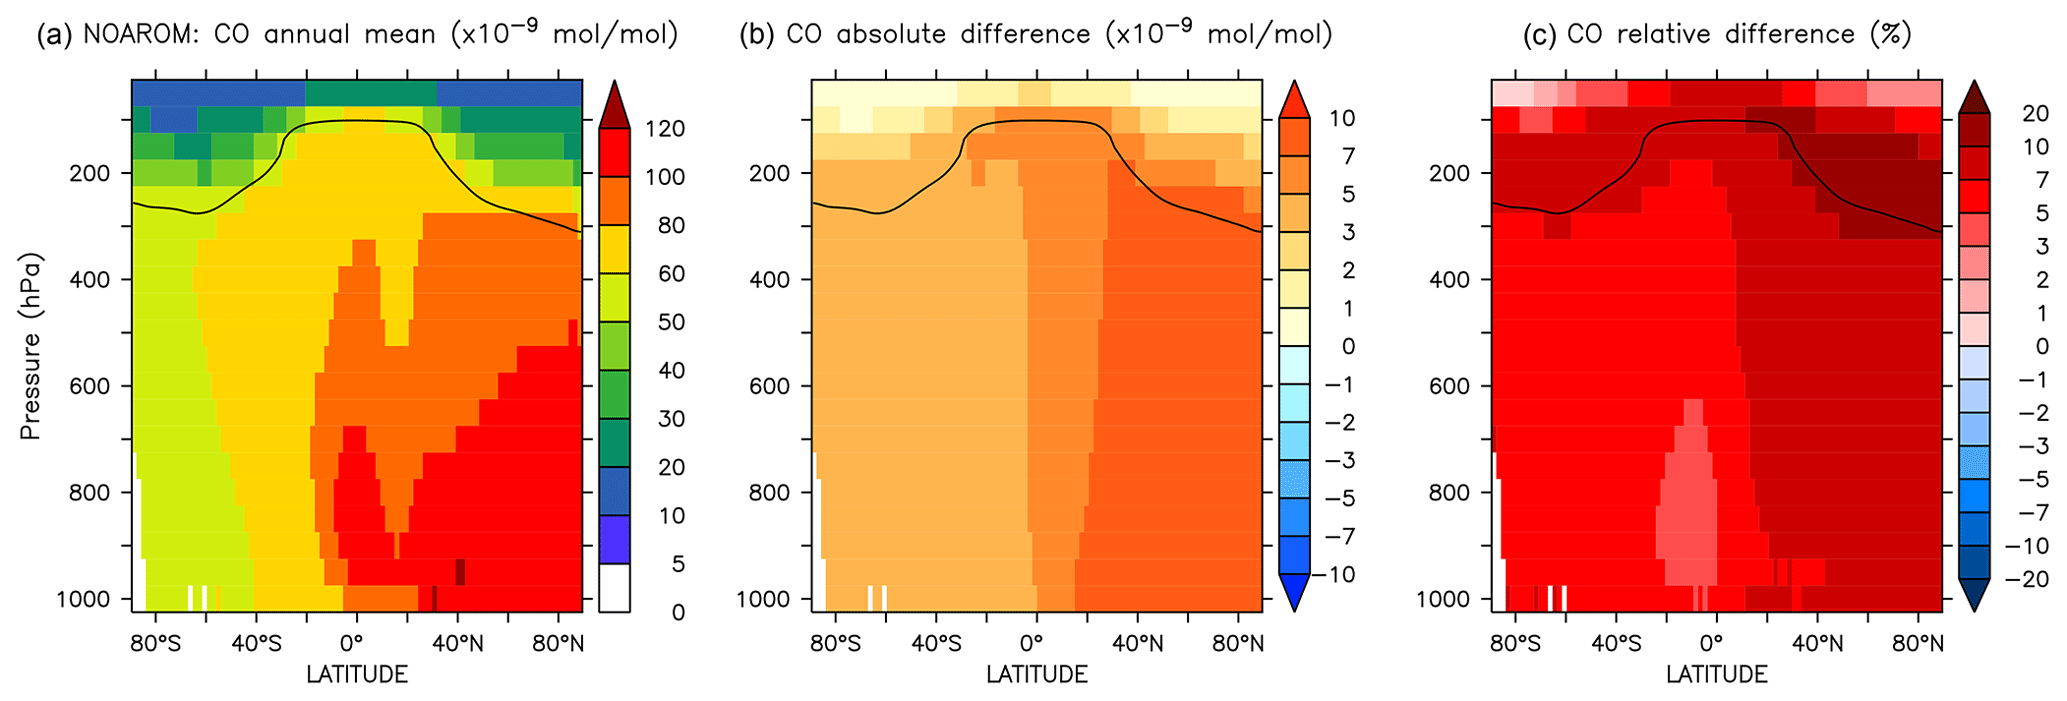
Figure 19Annual average zonal mean CO mixing ratios. (a) Mixing ratios in the NOAROM simulation. (b) Absolute difference AROM–NOAROM. (c) Relative difference AROM/NOAROM-1 in %. The solid line between 100 and 300 hPa depicts the mean tropopause level.
α-dicarbonyls like glyoxal and methyl glyoxal are primarily produced from the bicycloalkyl-radical pathway leading in the case of benzene to BZBIPERO2 (MCM) (Volkamer et al., 2001). A minor secondary formation pathway from conjugated unsaturated dicarbonyls, e.g., MALDIAL (MCM), is also known and taken into account (Bloss et al., 2005b). As expected, the model predicts a very large increase of glyoxal in almost all continental areas (Figs. 17 and 18). The global burden is 36 % higher than in the NOAROM model simulation. The largest regional increases are in the EAS and EUR regions (Table 5). An exception to the global trend is the AMA region, where OH is too low to produce either glyoxal or methyl glyoxal. Annual mean increases exceed 50 % over the continents close to the surface. In the lower troposphere, zonal mean increases are in the 10 %–20 % range. These changes are of significance for the model SOA budget since these two dicarbonyls are estimated to produce a large fraction of SOA by cloud processing yielding low-volatile oligomers (Lin et al., 2012). However, a model assessment of SOA formation from α-dicarbonyls is beyond the scope of this study. The reason is that although the simulations were performed with a VBS-based approach to model condensation of organic vapors, the EMAC model version used in this study has no representation of oligomer formation from (methyl)glyoxal. This has been recently implemented explicitly for cloud droplets (Rosanka et al., 2020) and its effect is planned to be assessed in a subsequent study together with the contribution of reactive uptake of epoxides from isoprene and aromatics.
Comparing AROM to OnlyMCM, benzaldehyde decreases by more than 50 % when the photolysis rate constant (j value) from the MCM (based on methacrolein) is replaced by our value (based on the UV/VIS spectrum of benzaldehyde). The more realistic photolysis rate enhances the production of radicals like HO2.
Since additional reactive carbon compounds have been introduced in the model, the oxidation of aromatics produces more CO, which has a lifetime of about 1–3 months (Lelieveld et al., 2016). CO can travel long distances from its source, although its lifetime is not long enough to allow it to cross hemispheres (Daniel and Solomon, 1998). CO concentrations generally increase on the global scale, indicating a small addition to the carbon budget. When comparing AROM to NOAROM, we find an increase of about 6 % in the atmospheric burden of CO. Interestingly, maximum zonal average increases of 10 %–20 % are found for the NH UTLS region (Fig. 19).
The model calculations presented in this work are associated with some uncertainties related to the oxidation kinetic model, emissions, and model resolution.
Gas-phase oxidation of aromatics is complex and the kinetic mechanism used in this study reflects the state of knowledge, advancements, and limitations in the mechanism that have recently been discussed (Vereecken, 2019). Recent progress has focused in particular on the source strength of aerosol precursors and not on the overall radical production, which also affects ozone. Nevertheless, our kinetic model makes use of only one rate constant for the Reaction (R3) of phenoxy radicals with ozone (Tao and Li, 1999). It also assigns this rate constant to the substituted phenoxy radicals other than C6H5O. Unfortunately, there is only one study of the rate constant of Reaction (R3) at 298 K. Although the 2σ reported uncertainty is slightly larger than 10 %, the rate constant of 2.86 cm3 molecules−1 s−1 has to be regarded as a lower limit. On the other hand, experimental evidence for the product of Reaction (R3), being phenyl peroxy radical (C6H5O2), has not been found although it was expected. If the products are different, then the catalytic O3-destruction cycle illustrated in Sect. 3.2 would not be in place. However, a significant amount of ozone loss via Reaction (R3) and analogous reactions is to be expected. Moreover, the ozone loss is likely underestimated because of the model not accounting for the photolysis of nitrophenols forming nitrosophenoxy radicals. Different from the HONO-formation channel, which destroys the aromatic ring, channels yielding substituted phenoxy radicals may dominate (Cheng et al., 2009; Vereecken et al., 2016) and thus enhance ozone loss. Another source of uncertainty is the direct formation of epoxide upon addition of OH and subsequently by O2 as implemented in the MCM ranging from 11.8 %, for benzene, to 24 %, for trimethylbenzene (Bloss et al., 2005b, a). There is in fact consistent theoretical evidence that the epoxide formation pathway passes through a second O2 addition. This implies that the epoxide yield likely depends on the abundance of NO, HO2, and RO2 (Vereecken, 2019, and references therein). This uncertainty limits the reliability of the predicted SOA formation from reactive uptake of epoxides by aerosols (Paulot et al., 2009).
Cloud chemistry of organic compounds is known to suppress gas-phase HOx production and directly consume ozone (Lelieveld and Crutzen, 1990). The overall effect on ozone depends on the local chemical regime. In our study water-soluble products are set to only undergo wet deposition (dissolution and removal by precipitation). Their aqueous-phase chemistry might however have a nonnegligible effect on ozone and other oxidants. For instance, phenol is known to react very quickly with OH in the aqueous phase (Field et al., 1982). Moreover, phenoxide anions from phenols react quickly with ozone (Hoigné and Bader, 1983). In particular, nitrophenols might be efficient ozone scavengers as they are stronger acids than unsubstituted phenols. A global assessment of cloud chemistry involving aromatics oxidation products is possible with the modeling system used here (Tost et al., 2006, 2010). However, considering the complexity of aqueous-phase oxidation of organic compounds, such an assessment is outside the scope of this study and deserves a dedicated model study.
In our study, biomass burning emissions of aromatics are potentially underestimated. In fact, based on the recent update by Andreae (2019), we estimate that emissions might be up to 5 Tg yr−1 (65 %) higher than what is implemented in our model. Moreover, emissions from peat fires in 2010 (the simulated year) were up to a factor 15 lower than in the subsequent years (van der Werf et al., 2017). In general, the interannual variability of biomass burning is large and difficult to capture in a study such as the present one. However, it appears that the two major contributions to this variability are the peat fires in Indonesia and boreal forest fires, which are strongly favored by El Niño and heat waves, respectively. An early estimate of anthropogenic emissions of aromatics gave 16 Tg C yr−1 (Fu et al., 2008). Two relatively recent datasets yield about 50 % higher emissions of 23 Tg C yr−1 for RCP (Cabrera-Perez et al., 2016) and 22 Tg C yr−1 for EDGAR 4.3.2 (Huang et al., 2017). The latter is used in this study and lacks the biofuel burning emissions of phenol, benzaldehyde, and styrene. Interannual variability of anthropogenic emissions of aromatics is not well known but the decadal trends are known to be negative since the 1980s (Lamarque et al., 2010). Aromatics emissions from terrestrial vegetation have been long neglected or considered very low. However, Misztal et al. (2015) suggested that aromatics emissions from biogenic sources may rival those from anthropogenic ones. In this study we used the same emission algorithm used in Misztal et al. (2015) but get much lower emissions for toluene (about 0.3 Tg C yr−1 vs. 1.5 Tg C yr−1). However, Misztal et al. (2015) suggest that emissions of aromatics and benzenoid compounds may be in the 1.4–15 Tg C yr−1 range. The major contributors are toluene and some benzenoids (oxygenated aromatics). The latter are mainly emitted during blossoming and stress-induced reactions by plants. The variability of their emissions is not very well quantified. For instance, the MEGAN model calculates their emission strengths based on the ones for carbon monoxide (Tarr et al., 1995).
The spatial resolution of atmospheric models has a significant influence on the predicted levels of oxidants and nitrogen oxides. Generally, in polluted regions, the coarser the resolution the larger the ozone production per molecule of NOx will be (Sillman et al., 1990). This is due to the artificial dilution of strong NOx emissions which, in reality, is efficiently converted to NOy by reacting with HOx. For instance, reducing the spatial resolution over polluted North America, Europe, and East Asia with a two-way nested regional model led to a 9.5 % reduction in the global tropospheric ozone burden (Yan et al., 2016). We have shown that at our model resolution of aromatics are estimated to induce important increases in HOx (Fig. 3) and decreases in NOx (Figs. 10 and 11) over continental polluted regions. Therefore, at much higher spatial resolutions the predicted enhancement of surface ozone by aromatics in those regions (Fig. 6) might be reduced. Based on the results by Yan et al. (2016) we expect this effect to translate into a significant enhancement of the tropospheric ozone reduction reported in this study (Sect. 3.2). A quantification of the model resolution effect on chemical regimes is at the moment computationally prohibitive with our very large chemical scheme running in the global EMAC model.
Finally, atmospheric levels of benzene and toluene simulated by our model were shown to underestimate many observations by at least 20 % (Cabrera-Perez et al., 2016). It is worth noting that in Cabrera-Perez et al. (2016) the total emissions of aromatics were even slightly higher (2.6 Tg C yr−1) than in the AROM simulation. This underestimate could be explained by an overestimate of the chemical sink in the troposphere by reaction with hydroxyl radical. However, the annual global mean concentration of hydroxyl radicals is potentially 10 % too high (Lelieveld et al., 2016), which cannot account for model concentration biases that are larger than 20 %. Therefore, we surmise that the impact of aromatics on the trace gas composition may be larger than estimated in this study.
This study investigated the effects of several monocyclic aromatics on the tropospheric gas-phase composition by means of the chemistry–climate model EMAC. When aromatics are introduced into our model calculations, large changes are seen for glyoxal and methyl glyoxal. For other species, our results show a relatively small importance of aromatics on the global scale. This is consistent with recent results by Yan et al. (2019) who used a simpler chemistry mechanism in the GEOS-Chem model. However, different from that study, we found a negative impact on global ozone. Our results also indicate that by including aromatics chemistry, free tropospheric OH is reduced, especially in the Northern Hemisphere. On a regional scale, the concentrations of several species change significantly, with the relatively largest impacts in East Asia where emissions are higher. Regions with high NOx concentrations show increases of OH and O3. However, since these increases are counteracted by decreases downwind, i.e., in remote areas where NOx concentrations are much lower, the net effects on large scales are small. Of the nitrogen compounds, mainly NO3 and HONO are affected by the aromatics chemistry.
We conclude that although the impact of aromatics is relatively minor on the global scale, it is important on regional scales, notably in the anthropogenic source regions and especially in those where NOx emissions are strongest. Given the uncertainties in the oxidation mechanisms and emissions, the results of our model calculations may underestimate the impact of aromatics on the tropospheric gas-phase composition.
In this appendix the impact of the modifications to the MCM chemistry (listed in Sect. 2) on the model results are shown for the main atmospheric oxidants.
A1 Hydroxyl radical (OH)
The differences at the surface are shown in Fig. A1. Much of the increase in Fig. 3 can be ascribed to the enhanced HOx production by photolysis of benzaldehyde (Roth et al., 2010) and HONO from Reaction (R1). That latter, which results from benzene chemistry, explain the significant enhancement across the UTLS (see Fig. A2).
A2 Ozone (O3)
The differences at the surface are shown in Fig. A3. It can be seen that a large part of the enhancement in surface ozone mixing ratio in Fig. 6 is due to enhanced HOx production in regions that are not NOx-limited. The zonal mean change in ozone is minimal and slightly positive at the tropical UTLS (Fig. A4).
A3 Nitrate radical (NO3)
The differences at the surface are shown in Fig. A5. It can be seen that the widespread enhancement of NO3 in Fig. 12 is largely to be ascribed to the effect of phenylperoxy reaction with NO2 (Reaction R2).
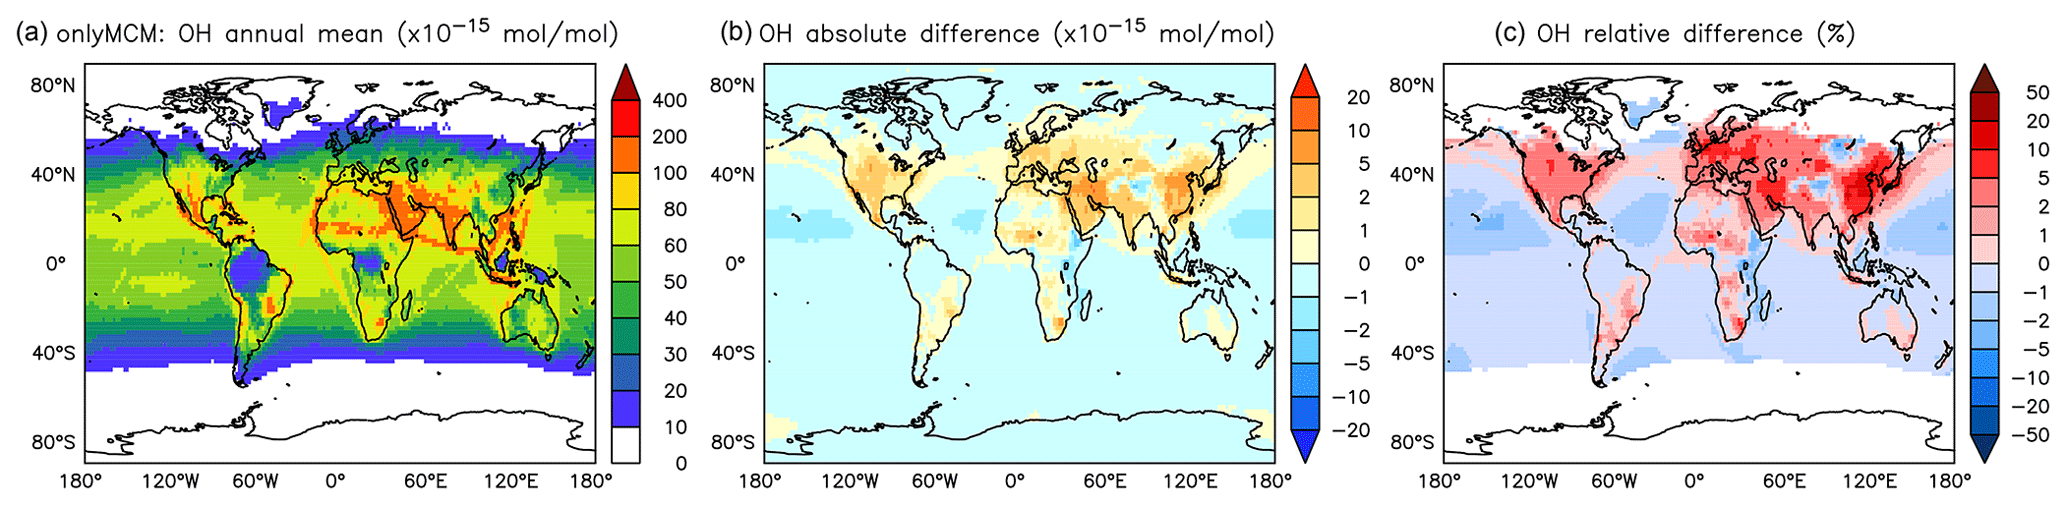
Figure A1Annual average OH mixing ratios at the surface. (a) Mixing ratios in the OnlyMCM simulation. (b) Absolute difference AROM–OnlyMCM. (c) Relative difference AROM/OnlyMCM-1 in % (shown only where OH is above 0.01 pmol mol−1).
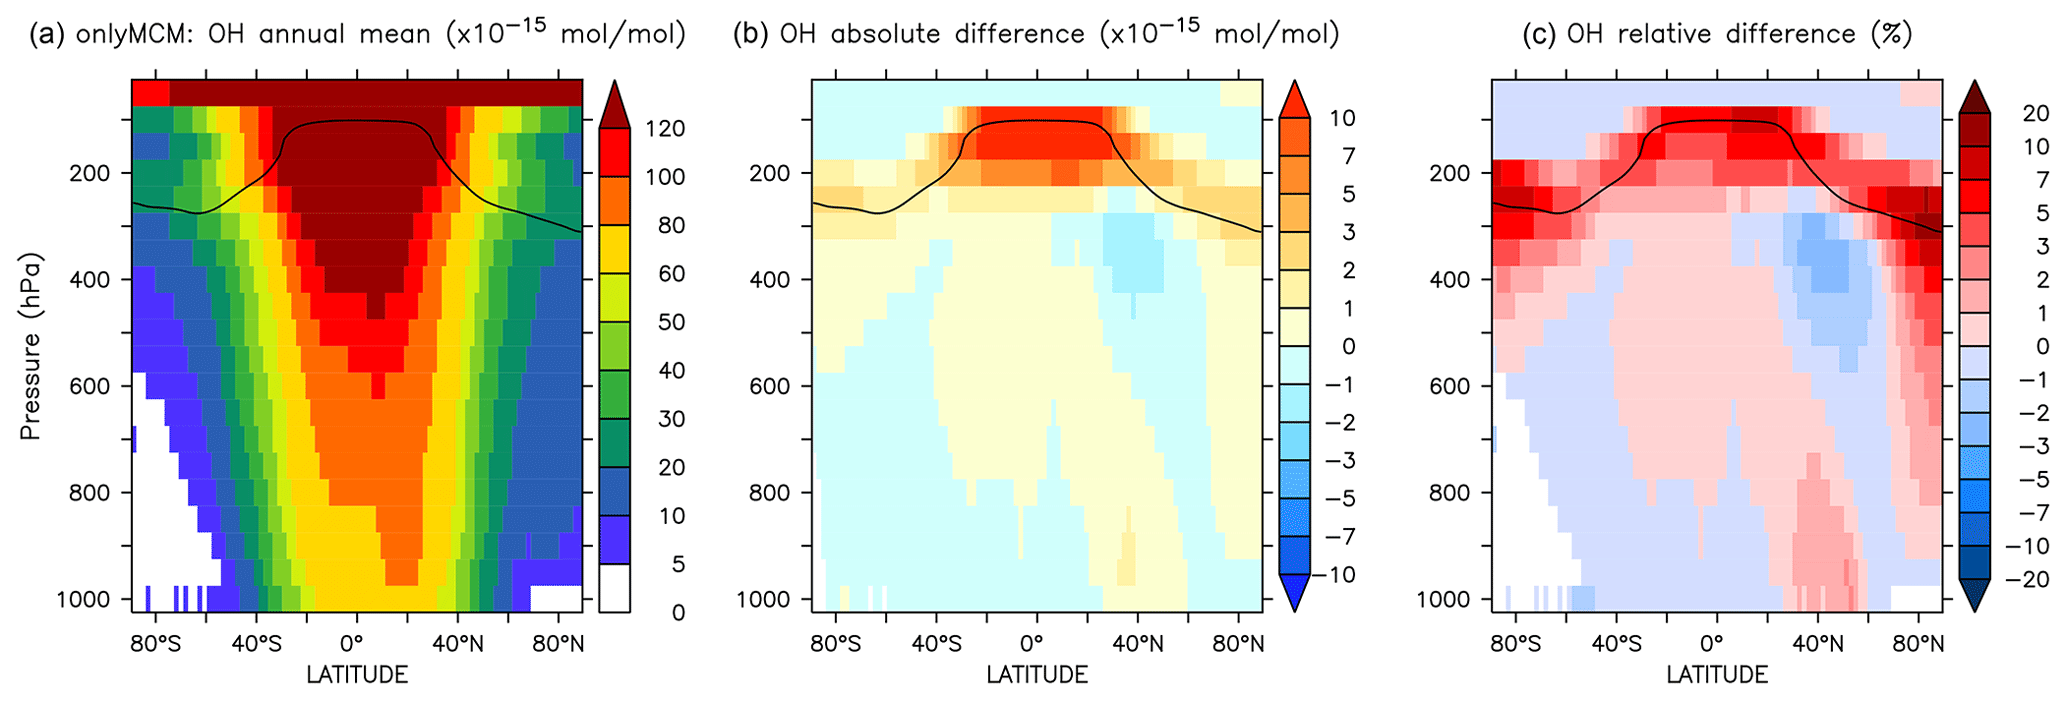
Figure A2Annual average zonal mean OH mixing ratios. (a) Mixing ratios in the OnlyMCM simulation. (b) Absolute difference AROM–OnlyMCM. (c) Relative difference AROM/OnlyMCM-1 in %. The solid line between 100 and 300 hPa depicts the mean tropopause level.
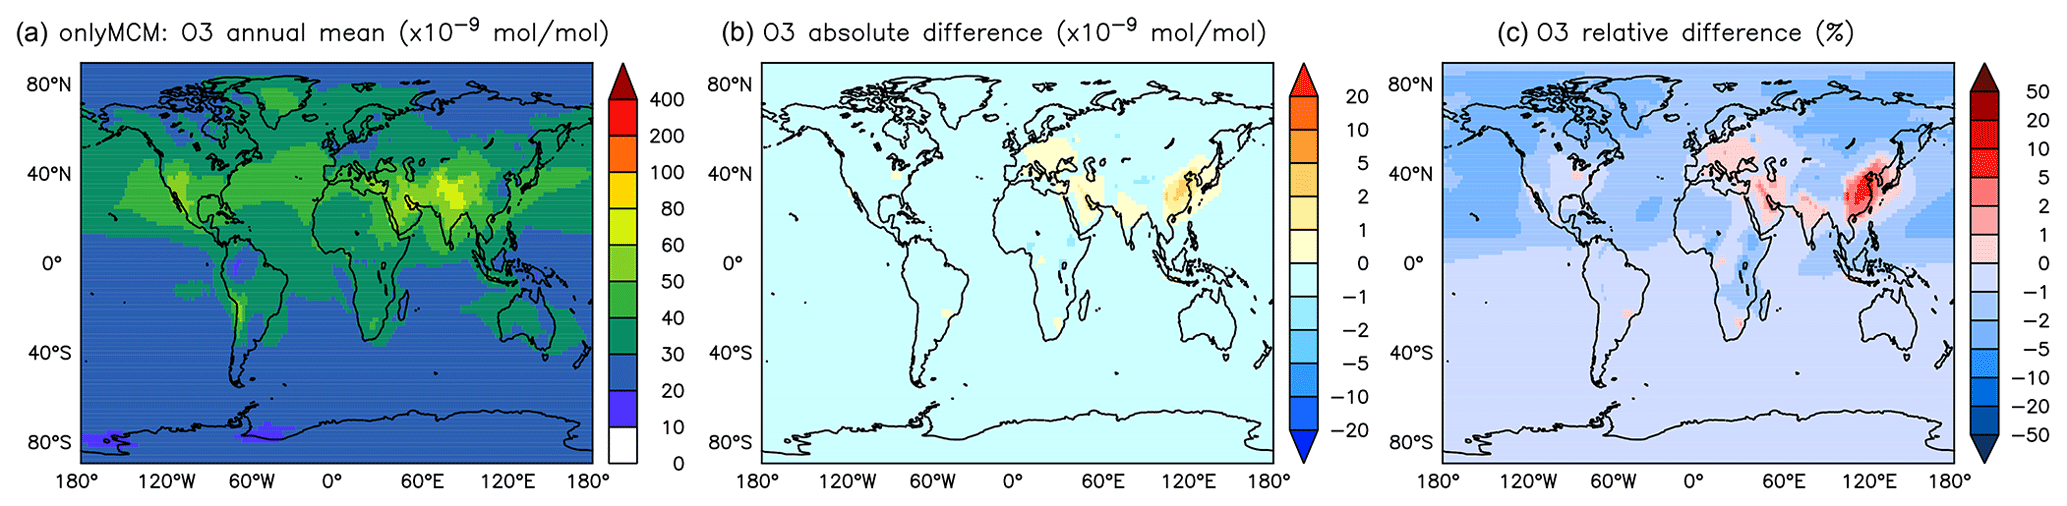
Figure A3Annual average O3 mixing ratios at the surface. (a) Mixing ratios in the OnlyMCM simulation. (b) Absolute difference AROM–OnlyMCM. (c) Relative difference AROM/OnlyMCM-1 in %.
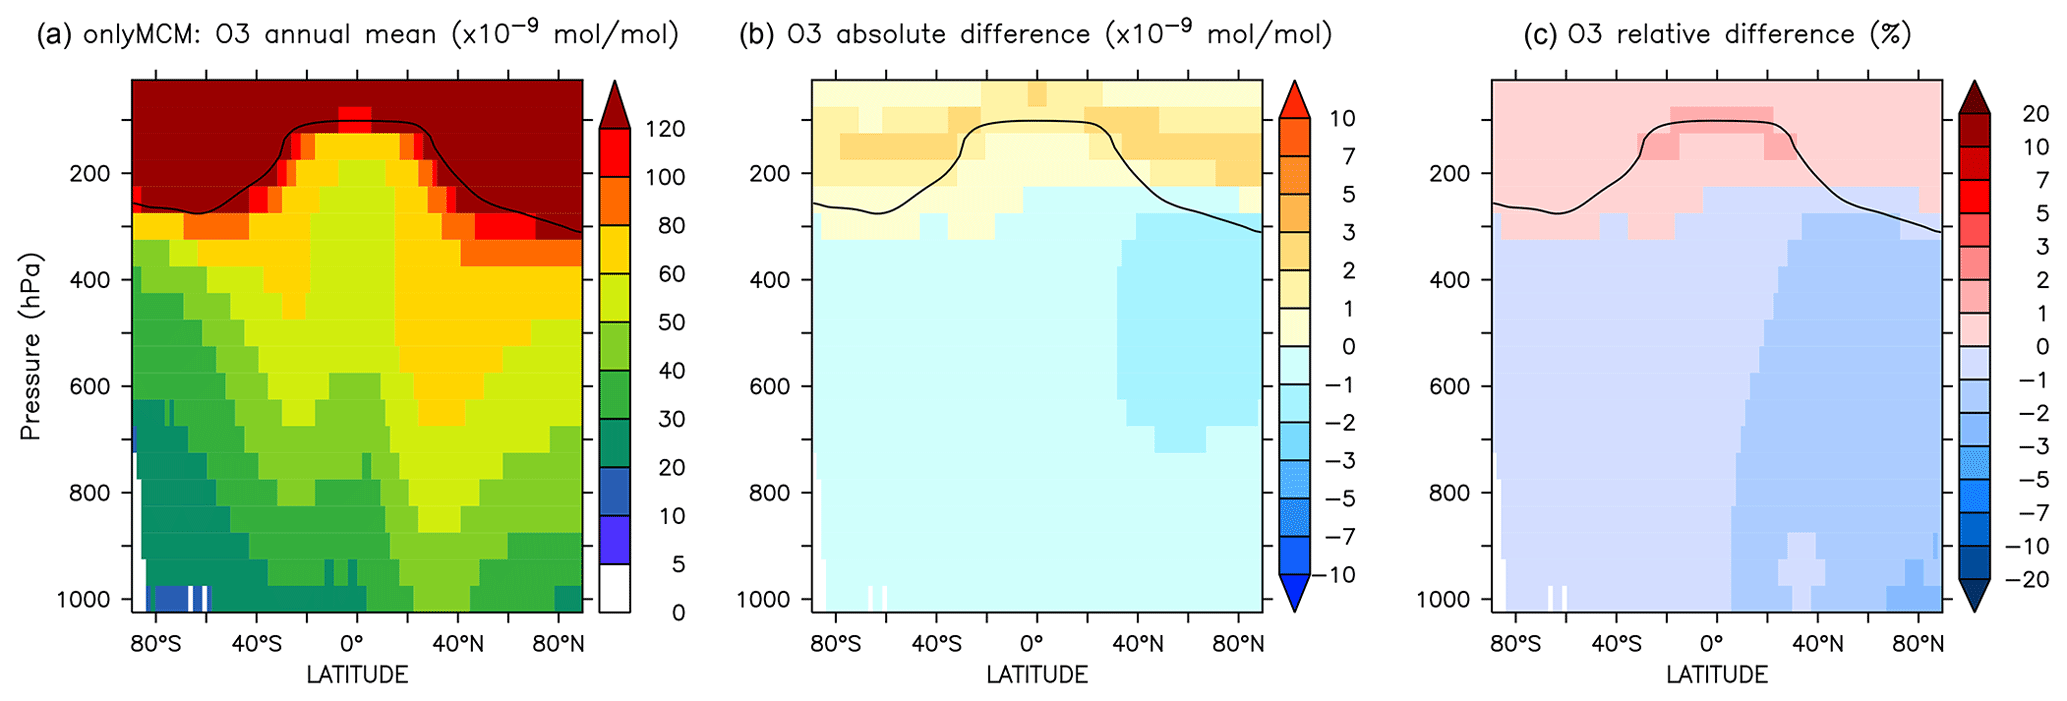
Figure A4Annual average zonal mean O3 mixing ratios. (a) Mixing ratios in the OnlyMCM simulation. (b) Absolute difference AROM–OnlyMCM. (c) Relative difference AROM/OnlyMCM-1 in %. The solid line between 100 and 300 hPa depicts the mean tropopause level.
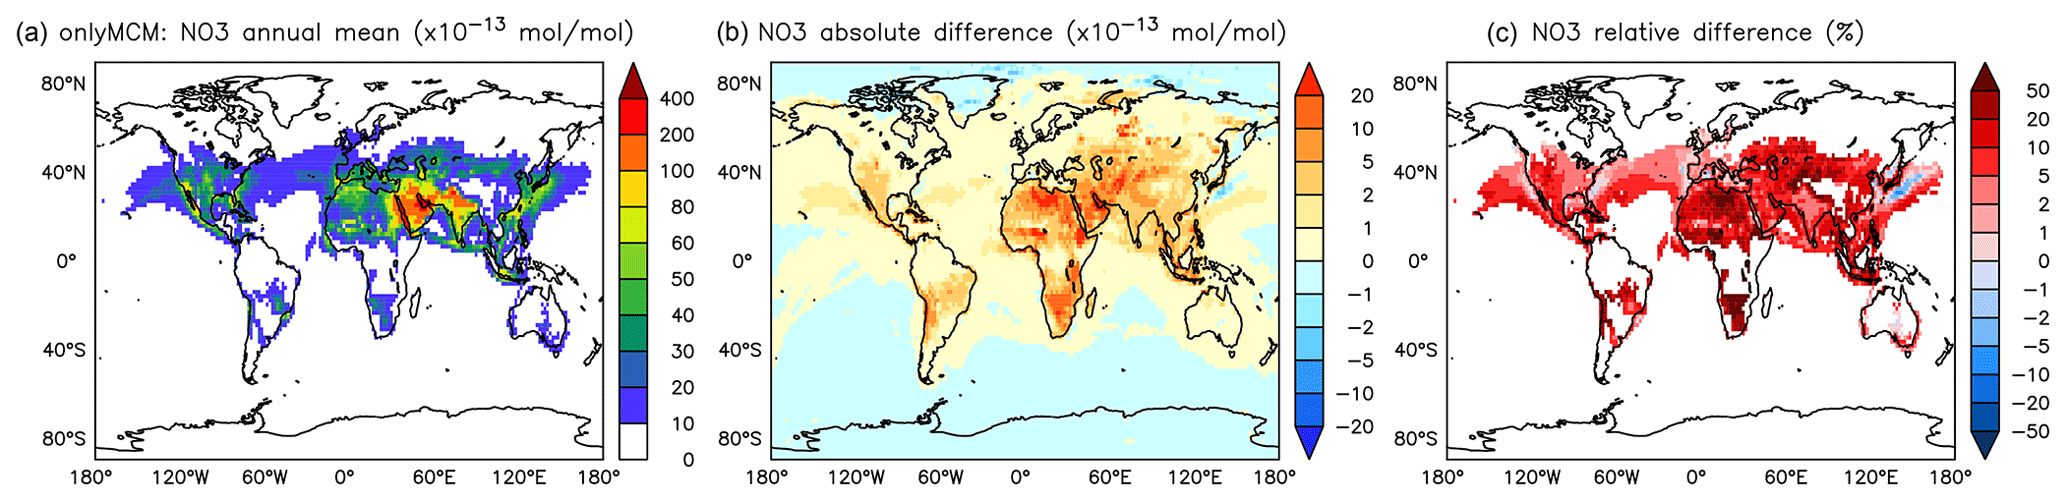
Figure A5Annual average NO3 mixing ratios at the surface. (a) Mixing ratios in the OnlyMCM simulation. (b) Absolute difference AROM–OnlyMCM. (c) Relative difference AROM/OnlyMCM-1 in % (shown only where NO3 is above 1 pmol mol−1).
The Modular Earth Submodel System (MESSy) is continuously further developed and applied by a consortium of institutions. The usage of MESSy and access to the source code is licensed to all affiliates of institutions that are members of the MESSy Consortium. Institutions can be a member of the MESSy Consortium by signing the MESSy Memorandum of Understanding. More information can be found on the MESSy Consortium web page (http://www.messy-interface.org, last access: 21 February 2021) (Jöckel and the MESSy Consortium, 2021).
DT, RS, AP, and DC wrote the manuscript. AP and DC performed the model simulations. DT and RS developed and analyzed the chemical mechanism. SB visualized the model results. SG performed extended budgeting of the species' chemical turnover. All coauthors contributed to the analysis of results and the writing of the paper.
The authors declare that they have no conflict of interest.
This article is part of the special issue “The Modular Earth Submodel System (MESSy) (ACP/GMD inter-journal SI)”. It is not associated with a conference.
The authors want to acknowledge the use of the Ferret program for analysis and graphics in this paper. Ferret is a product of NOAA's Pacific Marine Environmental Laboratory (information is available at https://ferret.pmel.noaa.gov/Ferret/, last access: 21 February 2021). The work described in this paper has received funding from the Initiative and Networking Fund of the Helmholtz Association through the project “Advanced Earth System Modelling Capacity (ESM)” (information is available at https://www.esm-project.net/, last access: 21 February 2021).
The article processing charges for this
open-access publication were covered by a Research
Centre of the Helmholtz Association.
This paper was edited by Anne Perring and reviewed by Alexander Archibald and one anonymous referee.
Andreae, M. O.: Emission of trace gases and aerosols from biomass burning – an updated assessment, Atmos. Chem. Phys., 19, 8523–8546, https://doi.org/10.5194/acp-19-8523-2019, 2019. a
Atkinson, R. and Arey, J.: Atmospheric degradation of volatile organic compounds, Chem. Rev., 103, 4605–4638, https://doi.org/10.1021/cr0206420, 2003. a, b
Atkinson, R., Aschmann, S. M., Arey, J., and Carter, W. P.: Formation of ring-retaining products from the OH radical-initiated reactions of benzene and toluene, Int. J. Chem. Kinet., 21, 801–827, 1989. a
Barletta, B., Meinardi, S., Sherwood Rowland, F., Chan, C.-Y., Wang, X., Zou, S., Yin Chan, L., and Blake, D. R.: Volatile organic compounds in 43 Chinese cities, Atmos. Environ., 39, 5979–5990, 2005. a
Bejan, I., El Aal, Y. A., Barnes, I., Benter, T., Bohn, B., Wiesen, P., and Kleffmann, J.: The photolysis of ortho-nitrophenols: a new gas phase source of HONO, Phys. Chem. Chem. Phys., 8, 2028–2035, 2006. a, b
Birdsall, A. W., Andreoni, J. F., and Elrod, M. J.: Investigation of the role of bicyclic peroxy radicals in the oxidation mechanism of toluene, J. Phys. Chem. A, 114, 10655–10663, https://doi.org/10.1021/jp105467e, 2010. a
Bloss, C., Wagner, V., Bonzanini, A., Jenkin, M. E., Wirtz, K., Martin-Reviejo, M., and Pilling, M. J.: Evaluation of detailed aromatic mechanisms (MCMv3 and MCMv3.1) against environmental chamber data, Atmos. Chem. Phys., 5, 623–639, https://doi.org/10.5194/acp-5-623-2005, 2005a. a, b
Bloss, C., Wagner, V., Jenkin, M. E., Volkamer, R., Bloss, W. J., Lee, J. D., Heard, D. E., Wirtz, K., Martin-Reviejo, M., Rea, G., Wenger, J. C., and Pilling, M. J.: Development of a detailed chemical mechanism (MCMv3.1) for the atmospheric oxidation of aromatic hydrocarbons, Atmos. Chem. Phys., 5, 641–664, https://doi.org/10.5194/acp-5-641-2005, 2005b. a, b, c, d
Cabrera-Perez, D., Taraborrelli, D., Sander, R., and Pozzer, A.: Global atmospheric budget of simple monocyclic aromatic compounds, Atmos. Chem. Phys., 16, 6931–6947, https://doi.org/10.5194/acp-16-6931-2016, 2016. a, b, c, d, e, f, g
Carter, W. P. and Heo, G.: Development of revised SAPRC aromatics mechanisms, Atmos. Environ., 77, 404–414, https://doi.org/10.1016/j.atmosenv.2013.05.021, 2013. a
Chen, J., Wenger, J. C., and Venables, D. S.: Near-ultraviolet absorption cross sections of nitrophenols and their potential influence on tropospheric oxidation capacity, J. Phys. Chem. A, 115, 12235–12242, https://doi.org/10.1021/jp206929r, 2011. a
Cheng, S.-B., Zhou, C.-H., Yin, H.-M., Sun, J.-L., and Han, K.-L.: OH produced from o-nitrophenol photolysis: a combined experimental and theoretical investigation, J. Chem. Phys., 130, 234311–234311, https://doi.org/10.1063/1.3152635, 2009. a
Daniel, J. S. and Solomon, S.: On the climate forcing of carbon monoxide, J. Geophys. Res., 103, 13249–13260, 1998. a
Deckert, R., Jöckel, P., Grewe, V., Gottschaldt, K.-D., and Hoor, P.: A quasi chemistry-transport model mode for EMAC, Geosci. Model Dev., 4, 195–206, https://doi.org/10.5194/gmd-4-195-2011, 2011. a
Emmons, L. K., Walters, S., Hess, P. G., Lamarque, J.-F., Pfister, G. G., Fillmore, D., Granier, C., Guenther, A., Kinnison, D., Laepple, T., Orlando, J., Tie, X., Tyndall, G., Wiedinmyer, C., Baughcum, S. L., and Kloster, S.: Description and evaluation of the Model for Ozone and Related chemical Tracers, version 4 (MOZART-4), Geosci. Model Dev., 3, 43–67, https://doi.org/10.5194/gmd-3-43-2010, 2010. a
Epstein, S. A., Riipinen, I., and Donahue, N. M.: A semiempirical correlation between enthalpy of vaporization and saturation concentration for organic aerosol, Environ. Sci. Technol., 44, 743–748, https://doi.org/10.1021/es902497z, 2010. a
Field, R. J., Raghavan, N. V., and Brummer, J. G.: A pulse radiolysis investigation of the reactions of bromine dioxide radical (BrO2.cntdot.) with hexacyanoferrate(II), manganese(II), phenoxide ion, and phenol, J. Phys. Chem., 86, 2443–2449, https://doi.org/10.1021/j100210a040, 1982. a
Fu, T.-M., Jacob, D. J., Wittrock, F., Burrows, J. P., Vrekoussis, M., and Henze, D. K.: Global budgets of atmospheric glyoxal and methylglyoxal, and implications for formation of secondary organic aerosols, J. Geophys. Res., 113, D15303, https://doi.org/10.1029/2007JD009505, 2008. a
Guenther, A. B., Jiang, X., Heald, C. L., Sakulyanontvittaya, T., Duhl, T., Emmons, L. K., and Wang, X.: The Model of Emissions of Gases and Aerosols from Nature version 2.1 (MEGAN2.1): an extended and updated framework for modeling biogenic emissions, Geosci. Model Dev., 5, 1471–1492, https://doi.org/10.5194/gmd-5-1471-2012, 2012. a
Heiden, A. C., Kobel, K., Komenda, M., Koppmann, R., Shao, M., and Wildt, J.: Toluene emissions from plants, Geophys. Res. Lett., 26, 1283–1286, https://doi.org/10.1029/1999GL900220, 1999. a
Henze, D. K., Seinfeld, J. H., Ng, N. L., Kroll, J. H., Fu, T.-M., Jacob, D. J., and Heald, C. L.: Global modeling of secondary organic aerosol formation from aromatic hydrocarbons: high- vs. low-yield pathways, Atmos. Chem. Phys., 8, 2405–2420, https://doi.org/10.5194/acp-8-2405-2008, 2008. a
Hoigné, J. and Bader, H.: Rate constants of reactions of ozone with organic and inorganic compounds in water – II: Dissociating organic compounds, Water Res., 17, 185–194, https://doi.org/10.1016/0043-1354(83)90099-4, 1983. a
Holtslag, A. and Boville, B.: Local versus nonlocal boundary-layer diffusion in a global climate model, J. Climate, 6, 1825–1842, 1993. a
Holtslag, A., De Bruijn, E., and Pan, H.: A high resolution air mass transformation model for short-range weather forecasting, Mon. Weather Rev., 118, 1561–1575, 1990. a
Hu, L., Millet, D. B., Baasandorj, M., Griffis, T. J., Travis, K. R., Tessum, C. W., Marshall, J. D., Reinhart, W. F., Mikoviny, T., Müller, M., Wisthaler, A., Graus, M., Warneke, C., and de Gouw, J.: Emissions of C6–C8 aromatic compounds in the United States: Constraints from tall tower and aircraft measurements, J. Geophys. Res., 120, 826–842, https://doi.org/10.1002/2014JD022627, 2015. a
Huang, G., Brook, R., Crippa, M., Janssens-Maenhout, G., Schieberle, C., Dore, C., Guizzardi, D., Muntean, M., Schaaf, E., and Friedrich, R.: Speciation of anthropogenic emissions of non-methane volatile organic compounds: a global gridded data set for 1970–2012, Atmos. Chem. Phys., 17, 7683–7701, https://doi.org/10.5194/acp-17-7683-2017, 2017. a, b
Jagiella, S. and Zabel, F.: Reaction of phenylperoxy radicals with NO2 at 298 K, Phys. Chem. Chem. Phys., 9, 5036–5051, https://doi.org/10.1039/B705193J, 2007. a
Jenkin, M. E., Saunders, S. M., Wagner, V., and Pilling, M. J.: Protocol for the development of the Master Chemical Mechanism, MCM v3 (part B): tropospheric degradation of aromatic volatile organic compounds, Atmos. Chem. Phys., 3, 181–193, https://doi.org/10.5194/acp-3-181-2003, 2003. a
Jöckel, P. and the MESSy Consortium: The highly structured Modular Earth Submodel System (MESSy), availabe at: http://www.messy-interface.org, last access: 21 February 2021. a
Jöckel, P., Kerkweg, A., Pozzer, A., Sander, R., Tost, H., Riede, H., Baumgaertner, A., Gromov, S., and Kern, B.: Development cycle 2 of the Modular Earth Submodel System (MESSy2), Geosci. Model Dev., 3, 717–752, https://doi.org/10.5194/GMD-3-717-2010, 2010. a, b
Jöckel, P., Tost, H., Pozzer, A., Kunze, M., Kirner, O., Brenninkmeijer, C. A. M., Brinkop, S., Cai, D. S., Dyroff, C., Eckstein, J., Frank, F., Garny, H., Gottschaldt, K.-D., Graf, P., Grewe, V., Kerkweg, A., Kern, B., Matthes, S., Mertens, M., Meul, S., Neumaier, M., Nützel, M., Oberländer-Hayn, S., Ruhnke, R., Runde, T., Sander, R., Scharffe, D., and Zahn, A.: Earth System Chemistry integrated Modelling (ESCiMo) with the Modular Earth Submodel System (MESSy), version 2.51, Geosci. Model Dev., 9, 1153–1200, https://doi.org/10.5194/gmd-9-1153-2016, 2016. a
Kaiser, J. W., Heil, A., Andreae, M. O., Benedetti, A., Chubarova, N., Jones, L., Morcrette, J.-J., Razinger, M., Schultz, M. G., Suttie, M., and van der Werf, G. R.: Biomass burning emissions estimated with a global fire assimilation system based on observed fire radiative power, Biogeoscience, 9, 527–554, https://doi.org/10.5194/bg-9-527-2012, 2012. a
Koppmann, R.: Volatile organic compounds in the atmosphere, Blackwell Publishing Ltd, https://doi.org/10.1002/9780470988657, 2007. a, b
Lamarque, J.-F., Bond, T. C., Eyring, V., Granier, C., Heil, A., Klimont, Z., Lee, D., Liousse, C., Mieville, A., Owen, B., Schultz, M. G., Shindell, D., Smith, S. J., Stehfest, E., Van Aardenne, J., Cooper, O. R., Kainuma, M., Mahowald, N., McConnell, J. R., Naik, V., Riahi, K., and van Vuuren, D. P.: Historical (1850–2000) gridded anthropogenic and biomass burning emissions of reactive gases and aerosols: methodology and application, Atmos. Chem. Phys., 10, 7017–7039, https://doi.org/10.5194/acp-10-7017-2010, 2010. a
Lee, S., Chiu, M., Ho, K., Zou, S., and Wang, X.: Volatile organic compounds (VOCs) in urban atmosphere of Hong Kong, Chemosphere, 48, 375–382, 2002. a
Lelieveld, J. and Crutzen, P. J.: Influences of cloud photochemical processes on tropospheric ozone, Nature, 343, 227–233, https://doi.org/10.1038/343227A0, 1990. a
Lelieveld, J., Gromov, S., Pozzer, A., and Taraborrelli, D.: Global tropospheric hydroxyl distribution, budget and reactivity, Atmos. Chem. Phys., 16, 12477–12493, https://doi.org/10.5194/acp-16-12477-2016, 2016. a, b, c
Li, Y., Pöschl, U., and Shiraiwa, M.: Molecular corridors and parameterizations of volatility in the chemical evolution of organic aerosols, Atmos. Chem. Phys., 16, 3327–3344, https://doi.org/10.5194/acp-16-3327-2016, 2016. a
Lin, G., Penner, J. E., Sillman, S., Taraborrelli, D., and Lelieveld, J.: Global modeling of SOA formation from dicarbonyls, epoxides, organic nitrates and peroxides, Atmos. Chem. Phys., 12, 4743–4774, https://doi.org/10.5194/acp-12-4743-2012, 2012. a, b
Misztal, P., Hewitt, C., Wildt, J., Blande, J., Eller, A., Fares, S., Gentner, D., Gilman, J., Graus, M., Greenberg, J., Guenther, A., Hansel, A., Harley, P., Huang, M., Jardine, K., Karl, T., Kaser, L., Keutsch, F., Kiendler-Scharr, A., Kleist, E., Lerner, B., Li, T., Mak, J., Nölscher, A., Schnitzhofer, R., Sinha, V., Thornton, B., Warneke, C., Wegener, F., Werner, C., Williams, J., Worton, D., Yassaa, N., and Goldstein, A.: Atmospheric benzenoid emissions from plants rival those from fossil fuels, Scient. Rep., 5, 12064, https://doi.org/10.1038/srep12064, 2015. a, b, c, d
Naik, V., Voulgarakis, A., Fiore, A. M., Horowitz, L. W., Lamarque, J.-F., Lin, M., Prather, M. J., Young, P. J., Bergmann, D., Cameron-Smith, P. J., Cionni, I., Collins, W. J., Dalsøren, S. B., Doherty, R., Eyring, V., Faluvegi, G., Folberth, G. A., Josse, B., Lee, Y. H., MacKenzie, I. A., Nagashima, T., van Noije, T. P. C., Plummer, D. A., Righi, M., Rumbold, S. T., Skeie, R., Shindell, D. T., Stevenson, D. S., Strode, S., Sudo, K., Szopa, S., and Zeng, G.: Preindustrial to present-day changes in tropospheric hydroxyl radical and methane lifetime from the Atmospheric Chemistry and Climate Model Intercomparison Project (ACCMIP), Atmos. Chem. Phys., 13, 5277–5298, https://doi.org/10.5194/acp-13-5277-2013, 2013. a
Ng, N. L., Kroll, J. H., Chan, A. W. H., Chhabra, P. S., Flagan, R. C., and Seinfeld, J. H.: Secondary organic aerosol formation from m-xylene, toluene, and benzene, Atmos. Chem. Phys., 7, 3909–3922, https://doi.org/10.5194/acp-7-3909-2007, 2007. a
Patra, P. K., Krol, M. C., Montzka, S. A., Arnold, T., Atlas, E. L., Lintner, B. R., Stephens, B. B., Xiang, B., Elkins, J. W., Fraser, P. J., Ghosh, A., Hintsa, E. J., Hurst, D. F., Ishijima, K., Krummel, P. B., Miller, B. R., Miyazaki, K., Moore, F. L., Mühle, J., O'Doherty, S., Prinn, R. G., Steele, L. P., Takigawa, M., Wang, H. J., Weiss, R. F., Wofsy, S. C., and Young, D.: Observational evidence for interhemispheric hydroxyl-radical parity, Nature, 513, 219–223, https://doi.org/10.1038/nature13721, 2014. a
Paulot, F., Crounse, J. D., Kjaergaard, H. G., Kürten, A., St. Clair, J. M., Seinfeld, J. H., and Wennberg, P. O.: Unexpected epoxide formation in the gas-phase photooxidation of isoprene, Science, 325, 730–733, https://doi.org/10.1126/science.1172910, 2009. a
Pozzer, A., Jöckel, P., Tost, H., Sander, R., Ganzeveld, L., Kerkweg, A., and Lelieveld, J.: Simulating organic species with the global atmospheric chemistry general circulation model ECHAM5/MESSy1: a comparison of model results with observations, Atmos. Chem. Phys., 7, 2527–2550, https://doi.org/10.5194/ACP-7-2527-2007, 2007. a
Pozzer, A., Jöckel, P., and van Aardenne, J.: The influence of the vertical distribution of emissions on tropospheric chemistry, Atmos. Chem. Phys., 9, 9417–9432, https://doi.org/10.5194/ACP-9-9417-2009, 2009. a, b
Pozzer, A., Pollmann, J., Taraborrelli, D., Jöckel, P., Helmig, D., Tans, P., Hueber, J., and Lelieveld, J.: Observed and simulated global distribution and budget of atmospheric C2–C5 alkanes, Atmos. Chem. Phys., 10, 4403–4422, https://doi.org/10.5194/ACP-10-4403-2010, 2010. a
Pringle, K. J., Tost, H., Message, S., Steil, B., Giannadaki, D., Nenes, A., Fountoukis, C., Stier, P., Vignati, E., and Lelieveld, J.: Description and evaluation of GMXe: a new aerosol submodel for global simulations (v1), Geosci. Model Dev., 3, 391–412, https://doi.org/10.5194/gmd-3-391-2010, 2010. a
Ran, L., Zhao, C., Geng, F., Tie, X., Tang, X., Peng, L., Zhou, G., Yu, Q., Xu, J., and Guenther, A.: Ozone photochemical production in urban Shanghai, China: Analysis based on ground level observations, J. Geophys. Res., 114, D15301, https://doi.org/10.1029/2008JD010752, 2009. a
Roeckner, E., Brokopf, R., Esch, M., Giorgetta, M., Hagemann, S., Kornblueh, L., Manzini, E., Schlese, U., and Schulzweida, U.: Sensitivity of simulated climate to horizontal and vertical resolution in the ECHAM5 atmosphere model, J. Climate, 19, 3771–3791, https://doi.org/10.1175/JCLI3824.1, 2006. a
Rosanka, S., Sander, R., Wahner, A., and Taraborrelli, D.: Oxidation of low-molecular weight organic compounds in cloud droplets: development of the JAMOC chemical mechanism in CAABA/MECCA (version 4.5.0gmdd), Geosci. Model Dev. Discuss. [preprint], https://doi.org/10.5194/gmd-2020-337, in review, 2020. a
Roth, E., Chakir, A., and Ferhati, A.: Study of a benzoylperoxy radical in the gas phase: ultraviolet spectrum and C6H5C(O)O2 + HO2 reaction between 295 and 357 K, J. Phys. Chem. A, 114, 10367–10379, https://doi.org/10.1021/jp1021467, 2010. a, b
Sack, T. M., Steele, D. H., Hammerstrom, K., and Remmers, J.: A survey of household products for volatile organic compounds, Atmos. Environ., 26A, 1063–1070, 1992. a
Sander, R., Jöckel, P., Kirner, O., Kunert, A. T., Landgraf, J., and Pozzer, A.: The photolysis module JVAL-14, compatible with the MESSy standard, and the JVal PreProcessor (JVPP), Geosci. Model Dev., 7, 2653–2662, https://doi.org/10.5194/GMD-7-2653-2014, 2014. a, b
Sander, R., Baumgaertner, A., Cabrera-Perez, D., Frank, F., Gromov, S., Grooß, J.-U., Harder, H., Huijnen, V., Jöckel, P., Karydis, V. A., Niemeyer, K. E., Pozzer, A., Riede, H., Schultz, M. G., Taraborrelli, D., and Tauer, S.: The community atmospheric chemistry box model CAABA/MECCA-4.0, Geosci. Model Dev., 12, 1365—1385, https://doi.org/10.5194/gmd-12-1365-2019, 2019. a, b, c
Sherwen, T., Schmidt, J. A., Evans, M. J., Carpenter, L. J., Großmann, K., Eastham, S. D., Jacob, D. J., Dix, B., Koenig, T. K., Sinreich, R., Ortega, I., Volkamer, R., Saiz-Lopez, A., Prados-Roman, C., Mahajan, A. S., and Ordóñez, C.: Global impacts of tropospheric halogens (Cl, Br, I) on oxidants and composition in GEOS-Chem, Atmos. Chem. Phys., 16, 12239–12271, https://doi.org/10.5194/acp-16-12239-2016, 2016. a
Sillman, S., Logan, J. A., and Wofsy, S. C.: The sensitivity of ozone to nitrogen oxides and hydrocarbons in regional ozone episodes, J. Geophys. Res., 95, 1837–1851, https://doi.org/10.1029/JD095iD02p01837, 1990. a, b
Tao, Z. and Li, Z.: A kinetics study on reactions of C6H5O with C6H5 and O3 at 298 K, Int. J. Chem. Kinet., 31, 65–72, https://doi.org/10.1002/(SICI)1097-4601(1999)31:1<65::AID-KIN8>3.0.CO;2-J, 1999. a, b
Taraborrelli, D., Lawrence, M. G., Butler, T. M., Sander, R., and Lelieveld, J.: Mainz Isoprene Mechanism 2 (MIM2): an isoprene oxidation mechanism for regional and global atmospheric modelling, Atmos. Chem. Phys., 9, 2751–2777, https://doi.org/10.5194/ACP-9-2751-2009, 2009. a
Tarr, M. A., Miller, W. L., and Zepp, R. G.: Direct carbon monoxide photoproduction from plant matter, J. Geophys. Res.-Atmos., 100, 11403–11413, https://doi.org/10.1029/94JD03324, 1995. a
Tilmes, S., Lamarque, J.-F., Emmons, L. K., Kinnison, D. E., Marsh, D., Garcia, R. R., Smith, A. K., Neely, R. R., Conley, A., Vitt, F., Val Martin, M., Tanimoto, H., Simpson, I., Blake, D. R., and Blake, N.: Representation of the Community Earth System Model (CESM1) CAM4-chem within the Chemistry-Climate Model Initiative (CCMI), Geosci. Model Dev., 9, 1853–1890, https://doi.org/10.5194/gmd-9-1853-2016, 2016. a
Tost, H., Jöckel, P., Kerkweg, A., Sander, R., and Lelieveld, J.: Technical note: A new comprehensive SCAVenging submodel for global atmospheric chemistry modelling, Atmos. Chem. Phys., 6, 565–574, https://doi.org/10.5194/ACP-6-565-2006, 2006. a
Tost, H., Lawrence, M. G., Brühl, C., Jöckel, P., The GABRIEL Team, and The SCOUT-O3-DARWIN/ACTIVE Team: Uncertainties in atmospheric chemistry modelling due to convection parameterisations and subsequent scavenging, Atmos. Chem. Phys., 10, 1931–1951, https://doi.org/10.5194/ACP-10-1931-2010, 2010. a
Troen, I. and Mahrt, L.: A simple model of the atmospheric boundary layer; sensitivity to surface evaporation, Bound.-Lay. Meteorol., 37, 129–148, 1986. a
Tsimpidi, A. P., Karydis, V. A., Pozzer, A., Pandis, S. N., and Lelieveld, J.: ORACLE (v1.0): module to simulate the organic aerosol composition and evolution in the atmosphere, Geosci. Model Dev., 7, 3153–3172, https://doi.org/10.5194/gmd-7-3153-2014, 2014. a, b
Tyndall, G. S., Wallington, T. J., and Ball, J. C.: FTIR Product Study of the Reactions CH3O2 + CH3O2 and CH3O2 + O3, J. Phys. Chem. A, 102, 2547–2554, https://doi.org/10.1021/jp972784h, 1998. a
van der Werf, G. R., Randerson, J. T., Giglio, L., van Leeuwen, T. T., Chen, Y., Rogers, B. M., Mu, M., van Marle, M. J. E., Morton, D. C., Collatz, G. J., Yokelson, R. J., and Kasibhatla, P. S.: Global fire emissions estimates during 1997–2016, Earth Syst. Sci. Data, 9, 697–720, https://doi.org/10.5194/essd-9-697-2017, 2017. a
Vereecken, L.: Reaction Mechanisms for the Atmospheric Oxidation of Monocyclic Aromatic Compounds, in: chap. 6, World Scientific Publishing, 377–527, https://doi.org/10.1142/9789813271838_0006, 2019. a, b, c
Vereecken, L., Chakravarty, H. K., Bohn, B., and Lelieveld, J.: Theoretical Study on the Formation of H- and O-Atoms, HONO, OH, NO, and NO2 from the Lowest Lying Singlet and Triplet States in Ortho-Nitrophenol Photolysis, Int. J. Chem. Kinet., 48, 785–795, https://doi.org/10.1002/kin.21033, 2016. a
Volkamer, R., Platt, U., and Wirtz, K.: Primary and secondary glyoxal formation from aromatics: Experimental evidence for the bicycloalkyl-radical pathway from benzene, toluene, and p-xylene, J. Phys. Chem. A, 105, 7865–7874, https://doi.org/10.1021/jp010152w, 2001. a
Wallington, T. J., Ammann, M., Cox, R. A., Crowley, J. N., Herrmann, H., Jenkin, M. E., McNeill, V., Mellouki, A., Rossi, M. J., and Troe, J.: IUPAC Task group on atmospheric chemical kinetic data evaluation: Evaluated kinetic data, available at: http://iupac.pole-ether.fr (last access: 31 July 2015), 2018. a
Warneck, P.: Chemistry of the Natural Atmosphere, 2nd Edn., Academic Press, available at: https://www.sciencedirect.com/bookseries/international-geophysics/vol/71/suppl/C (last access: 22 February 2021), 1999. a
WMO: Definition of the tropopause and of significant levels, available at: https://library.wmo.int/doc_num.php?explnum_id=6960 (last access: 15 November 2020), 1957. a
WMO: Air quality guidelines for Europe, WHO Regional Office for Europe, Copenhagen, 2000. a
Yan, Y., Lin, J., Chen, J., and Hu, L.: Improved simulation of tropospheric ozone by a global-multi-regional two-way coupling model system, Atmos. Chem. Phys., 16, 2381–2400, https://doi.org/10.5194/acp-16-2381-2016, 2016. a, b, c
Yan, Y., Cabrera-Perez, D., Lin, J., Pozzer, A., Hu, L., Millet, D. B., Porter, W. C., and Lelieveld, J.: Global tropospheric effects of aromatic chemistry with the SAPRC-11 mechanism implemented in GEOS-Chem version 9-02, Geosci. Model Dev., 12, 111–130, https://doi.org/10.5194/gmd-12-111-2019, 2019. a, b, c
Young, P. J., Naik, V., Fiore, A. M., Gaudel, A., Guo, J., Lin, M. Y., Neu, J. L., Parrish, D. D., Rieder, H. E., Schnell, J. L., Tilmes, S., Wild, O., Zhang, L., Ziemke, J., Brandt, J., Delcloo, A., Doherty, R. M., Geels, C., Hegglin, M. I., Hu, L., Im, U., Kumar, R., Luhar, A., Murray, L., Plummer, D., Rodriguez, J., Saiz-Lopez, A., Schultz, M. G., Woodhouse, M. T., and Zeng, G.: Tropospheric Ozone Assessment Report: Assessment of global-scale model performance for global and regional ozone distributions, variability, and trends, Elementa: Sci. Anthrop., 6, 10, https://doi.org/10.1525/elementa.265, 2018. a