the Creative Commons Attribution 4.0 License.
the Creative Commons Attribution 4.0 License.
 | 15 Feb 2021
Ice injected into the tropopause by deep convection – Part 2: Over the Maritime Continent
Iris-Amata Dion
Cyrille Dallet
Philippe Ricaud
Fabien Carminati
Thibaut Dauhut
Peter Haynes
The amount of ice injected into the tropical tropopause layer has a strong radiative impact on climate. A companion paper (Part 1) used the amplitude of the diurnal cycle of ice water content (IWC) as an estimate of ice injection by deep convection, showed that the Maritime Continent (MariCont) region provides the largest injection to the upper troposphere (UT; 146 hPa) and to the tropopause level (TL; 100 hPa). This study focuses on the MariCont region and extends that approach to assess the processes, the areas and the diurnal amount and duration of ice injected over islands and over seas during the austral convective season. The model presented in the companion paper is again used to estimate the amount of ice injected (ΔIWC) by combining ice water content (IWC) measured twice a day by the Microwave Limb Sounder (MLS; Version 4.2) from 2004 to 2017 and precipitation (Prec) measurements from the Tropical Rainfall Measurement Mission (TRMM; Version 007) binned at high temporal resolution (1 h). The horizontal distribution of ΔIWC estimated from Prec (ΔIWCPrec) is presented at 2 horizontal resolution over the MariCont. ΔIWC is also evaluated by using the number of lightning events (Flash) from the TRMM-LIS instrument (Lightning Imaging Sensor, from 2004 to 2015 at 1 h and 0.25∘ × 0.25∘ resolution). ΔIWCPrec and ΔIWC estimated from Flash (ΔIWCFlash) are compared to ΔIWC estimated from the ERA5 reanalyses (ΔIWCERA5) with the vertical resolution degraded to that of MLS observations (ΔIWCERA5). Our study shows that the diurnal cycles of Prec and Flash are consistent with each other in phase over land but different over offshore and coastal areas of the MariCont. The observational ΔIWC range between ΔIWCPrec and ΔIWCFlash, interpreted as the uncertainty of our model in estimating the amount of ice injected, is smaller over land (where ΔIWCPrec and ΔIWCFlash agree to within 22 %) than over ocean (where differences are up to 71 %) in the UT and TL. The impact of the MLS vertical resolution on the estimation of ΔIWC is greater in the TL (difference between ΔIWCERA5 and 〈ΔIWCERA5〉 of 32 % to 139 %, depending on the study zone) than in the UT (difference of 9 % to 33 %). Considering all the methods, in the UT, estimates of ΔIWC span 4.2 to 10.0 mg m−3 over land and 0.4 to 4.4 mg m−3 over sea, and in the TL estimates of ΔIWC span 0.5 to 3.9 mg m−3 over land and 0.1 to 0.7 mg m−3 over sea. Finally, based on IWC from MLS and ERA5, Prec and Flash, this study highlights that (1) at both levels, ΔIWC estimated over land can be more than twice that estimated over sea and (2) small islands with high topography present the largest ΔIWC (e.g., island of Java).
- Article
(5784 KB) - Full-text XML
- Companion paper
- BibTeX
- EndNote


The tropical tropopause layer (TTL) is widely recognized as a region of great importance for the climate system. The water vapour (WV) and ice cirrus clouds in this region have a strong radiative effect (e.g. Stephens et al., 1991). Furthermore, the partitioning between WV and ice in the TTL is a consequence of dehydration processes taking place there and controlling the global distribution of stratospheric WV, with implications for climate (e.g. Forster and Shine, 1997) and for stratospheric ozone chemistry (Stenke and Grewe, 2005). WV and ice crystals are transported through the tropopause layer by two main processes: a three-dimensional large-scale slow process (300 m month−1) and a small-scale fast convective process (diurnal timescale) (e.g. Fueglistaler et al., 2009; Randel and Jensen, 2013). Many studies have already shown the impact of convective processes on the hydration of the atmospheric layers from the upper troposphere (UT) to the lower stratosphere (LS) (e.g. Liu and Zipser, 2005; Jensen et al., 2007; Dauhut et al., 2018; Dion et al., 2019). However, although within the tropical UT and LS the vertical distribution of water vapour is constrained by temperature, the transport of total water (WV and ice) by convection is still poorly quantified. The vertical distribution of water vapour in those layers is constrained by thermal conditions of the CPT (cold point tropopause) (Randel et al., 2006). Dion et al. (2019) have shown that air masses transported up to 146 hPa in the UT and up to 100 hPa in the tropopause layer (TL) have ice to total water ratios of more than 50 % and 70 %, respectively, and that ice in the UT is strongly spatially correlated with the diurnal increases of deep convection, while WV is not. Dion et al. (2019) hence focused on the ice phase of total water to estimate the diurnal amount of ice injected into the UT and the TL over convective tropical areas, showing that it is larger over land than over ocean, with maxima over land of the Maritime Continent (MariCont), the region including Indonesian islands. The present study focuses on the MariCont region in order to gain further understanding of small-scale processes impacting the diurnal injection of ice up to the TL.
The method used by Dion et al. (2019) to estimate convective injection of ice to the UT and TL was via estimation of the amplitude of the diurnal cycle of ice using twice daily (at 01:30 and 13:30 local time) ice water content (IWC) observations from the Microwave Limb Sounder (MLS) instrument and the full diurnal cycle of precipitation (Prec) measured by the Tropical Rainfall Measurement Mission (TRMM) instrument (at 1 h resolution). The method first focuses on the increasing phase of the diurnal cycle of Prec (peak to peak from the diurnal Prec minimum to the diurnal Prec maximum) and shows that the increasing phase of Prec is consistent in time and in amplitude with the increasing phase of the diurnal cycle of deep convection, over tropical convective zones and during the convective season. The amount of ice (ΔIWC) injected into the UT and the TL is estimated by relating IWC measured by MLS during the growing phase of the deep convection to the increasing phase of the diurnal cycle of Prec. Dion et al. (2019) conclude that deep convection over the MariCont region is the main process impacting the increasing phase of the diurnal cycle of ice in those layers.
The MariCont region is one of the main convective centres in the tropics, with the wettest troposphere and the coldest and driest tropopause (Ramage, 1968; Sherwood, 2000; Hatsushika and Yamazaki, 2001). Yang and Slingo (2001) have shown that, over the Indonesian area, the phase of the convective activity diurnal cycle drifts from land to coastlines and to offshore areas. Even though Yang and Slingo (2001) have done a comprehensive study of the diurnal cycle of precipitation and convection over the MariCont, the diurnal cycle of ice injected by deep convection up to the TL over this region is still not well understood. Millán et al. (2013) have tentatively evaluated the upper tropospheric diurnal cycle of ice from Superconducting Submillimeter-Wave Limb-Emission Sounder (SMILES) measurements over the period 2009 to 2010 but without differentiating land and sea over the MariCont, which caused their analysis to show little diurnal variation over that region. Dion et al. (2019) have (1) highlighted that the MariCont must be considered as two separate areas: the MariCont land (MariCont_L) and the MariCont ocean (MariCont_O), with two distinct diurnal cycles of the Prec, and (2) estimated the amount of ice injected into the UT and the TL. Over these two domains, it has also been shown that convective processes are stronger over MariCont_L than over MariCont_O. Consequently, the amount of ice injected into the UT and the TL is greater over MariCont_L than over MariCont_O.
Building upon the results of Dion et al. (2019), the present study aims to improve their methodology by (i) studying smaller study zones and by distinguishing between islands and sea within the MariCont, (ii) comparing the sensitivity of our model to different proxies for deep convection and (iii) comparing the amount of ice injected into the UT and the TL inferred by our model to that of ERA5 reanalyses. Based on space-borne observations and meteorological reanalyses, ΔIWC is assessed at a horizontal resolution of 2∘ × 2∘ over five islands (Sumatra, Borneo, Java, Sulawesi and New Guinea) and five seas (West Sumatra Sea, Java Sea, China Sea, North Australia Sea and Bismarck Sea) of the MariCont during the convective season (December, January and February, hereafter DJF) from 2004 to 2017. Consistent with Dion et al. (2019), ΔIWC will be first estimated from Prec derived from TRMM-3B42. An alternative estimate of ΔIWC based on the number of flashes (Flash) detected by the TRMM Lightning Imaging Sensor (TRMM-LIS), another proxy for deep convection as shown by Liu and Zipser (2008), is also provided. Finally, we will use IWC calculated by the ERA5 reanalyses from 2005 to 2016 to estimate ΔIWC in the UT and the TL over each study zone and compare it to ΔIWC estimated from Prec and Flash.
The observational datasets used in our study are presented in Sect. 2. Methodology is reviewed in Sect. 3. The amount of ice (ΔIWC) injected up to the TL estimated from Prec is evaluated in Sect. 4. Diurnal cycles of Prec and Flash are compared to each other over different areas of the MariCont in Sect. 5. Results of the estimated ΔIWC injected up to the UT and the TL over five islands and five seas of the MariCont are presented and compared with the ERA5 reanalyses in Sect. 6. Results are discussed in Sect. 7, and conclusions are drawn in Sect. 8. This paper contains many abbreviations and acronyms. To facilitate reading, a complete specification is given in the list of acronyms in Appendix A.
This section presents the observational and reanalyses datasets used for this study.
2.1 MLS ice water content
The Microwave Limb Sounder (MLS) was launched on NASA’s Earth Observing System Aura platform in 2004 (Waters et al., 2006). MLS follows a sun-synchronous near-polar orbit, obtaining daily near-global coverage. Ascending (northbound) portions of the orbit cross the Equator at 13:30 local time (LT); descending portions of the orbit cross the Equator at 01:30 LT. Among other products, MLS provides measurements of ice water content (IWCMLS, mg m−3). Although optimal estimation is used to retrieve almost all other MLS products, a cloud-induced radiance technique is used to derive IWCMLS (Wu et al., 2008, 2009). Here we use version 4.2 IWC data, filtered following the recommendations of the MLS team described by Livesey et al. (2018). We select IWCMLS during all austral convective seasons (DJF) between 2004 and 2017. MLS data processing provides IWCMLS at six levels in the upper troposphere and lower stratosphere (UTLS; 82, 100, 121, 146, 177 and 215 hPa). We have chosen to study only two of the available levels: 146 hPa as representative of the lower part of the TTL (named UT for upper troposphere) and 100 hPa as representative of tropopause, which lies in the middle of the TTL (named TL for tropopause level). Note that the level at 82 hPa, representing the lower stratosphere, would have also been very interesting to study but does not provide enough significant measurements of IWC to achieve an acceptable signal-to-noise ratio. The resolution of IWCMLS (horizontal along the path, horizontal perpendicular to the path, vertical) measured at 146 and 100 hPa is km and 200×7×5 km, respectively. In our study, we consider 13 years of MLS data, which allows the IWCMLS measurements to be averaged in bins of 2∘ (∼ 220 km) zonal and meridional extent, over all study zones. The valid IWC range is 0.02–50.0 mg m−3 at 100 hPa and 0.1–50.0 mg m−3 at 146 hPa (Livesey et al., 2018). Typical single-profile precisions (i.e. random noise) are 0.10 mg m−3 at 100 hPa and 0.20–0.35 mg m−3 at 146 hPa, and the accuracy (i.e. systematic error) is 100 % for values less than 10 mg m−3 at both levels. The fact that our study is based on 13-year averages of all observations within each 2∘ × 2∘ bin implies that the uncertainty on the averages due to measurement precision is drastically reduced. On the other hand, the systematic error on the averages will be unchanged. Our analysis, based on the methodology developed in Dion et al. (2019), uses the difference between the maximum and the minimum of IWC obtained within 24 h as an estimate of the amplitude of the diurnal cycle of IWC and hence of the amount of ice injected into the TL and/or the UT. By considering the difference between the maximum and the minimum of IWC obtained within 24 h, the associated systematic error decreases. This supposes that the systematic errors are similar within each temporal bin within 24 h.
2.2 TRMM-3B42 Precipitation
The Tropical Rainfall Measurement Mission (TRMM) was launched in 1997 and provided measurements of precipitation until 2015. The TRMM satellite carried five instruments, three of which (PR, TMI, VIRS) formed a complementary sensor suite for rainfall. TRMM had an almost circular orbit at 350 km altitude, performing a complete revolution in 1.5 h.
The TRMM-3B42 product (version V7) is a multi-satellite precipitation analysis that extends the precipitation product through 2019 by merging microwave and infrared space-borne observations, including TRMM measurements from 1997 to 2015 (Huffman et al., 2007, 2010; Huffman and Bolvin, 2018). Precipitation from TRMM-3B42 (Prec) is provided at a 0.25∘ (∼ 29.2 km) horizontal resolution, extending from 50∘ S to 50∘ N (https://pmm.nasa.gov/data-access/downloads/trmm, last access: 1 April 2019). Details of the binning methodology of TRMM-3B42 are provided by Huffman and Bolvin (2018). The precipitation estimates do not distinguish between stratiform and convective precipitation, and the implications of this will be discussed later. Work is currently underway to develop more appropriate estimators for random error and to introduce estimates of bias error (Huffman and Bolvin, 2018). In our study, Prec from TRMM-3B42 was selected over the austral convective seasons (DJF) from 2004 to 2017 and at each location was binned into 1 h intervals according to local time (LT). This was possible because of the combination between the precessing orbit of the TRMM satellite and the precipitation analysis from the other satellites included in the TRMM-3B42 long-duration dataset (13 years). Finally, for each 1 h interval of LT, the data were averaged to a horizontal grid of 2∘ × 2∘ to be compared to IWCMLS.
2.3 TRMM-LIS number of lightning flashes
The Lightning Imaging Sensor (LIS) aboard the TRMM satellite measures several parameters related to lightning, including the number of flashes within a given time period. Details are given in Christian et al. (2000) and, more recently, on the NASA website (https://ghrc.nsstc.nasa.gov/lightning/overview_lis_instrument.html, last access: 15 November 2020), including how the raw measurements are processed to estimate the number of flashes (Flash), subject to a detection efficiency of the instrument of 69 % at noon to 88 % at night (lower during the day because of background illumination). The instrument detects lightning with a storm-scale resolution of 5–10 km (5 km at nadir), and the observation range of the sensor is between 38∘ N and 38∘ S. The LIS on TRMM views a total area exceeding 580 km × 580 km at the cloud top. The LIS instruments obtained measurements between 1 January 1998 and 8 April 2015. To be consistent with the other parts of our study, we used the measurements only for DJF from 2004–2015. As LIS is on the TRMM platform, the measurements can be binned in 1 h intervals of LT to obtain a full 24 h diurnal cycle. The measurements could be further binned at either 0.25∘ × 0.25∘ or at 2∘ × 2∘ horizontal resolution to allow for comparison with Prec from TRMM-3B42.
2.4 ERA5 ice water content
The European Centre for Medium-range Weather Forecasts (ECMWF) Reanalysis 5, known as ERA5, replaces the ERA-Interim reanalyses as the fifth generation of the ECMWF reanalysis, providing global climate and weather for the past decades (from 1979) (Hersbach et al., 2018). ERA5 provides hourly estimates for a large number of atmospheric, ocean and land surface quantities and covers the Earth on a 30 km grid with 137 levels from the surface up to a height of 80 km. Reanalyses such as ERA5 combine a large number of observations (space-borne, airborne and ground-based) with short-range forecasts. Our study uses the specific cloud ice water content (mass of condensate/mass of moist air) (IWCERA5) as being representative of non-precipitating ice. Precipitating ice, classified as snow water, is also provided by ERA5 but not used in this study because it is of little relevance to convectively injected ice in the TTL. No direct observations of atmospheric ice content are provided to the ERA5 data assimilation system, and IWCERA5 is primarily determined within the forecast model by changes in the analysed temperature (and at low levels, humidity), which is mostly driven by the assimilation of temperature-sensitive radiances from satellite instruments. These determine IWCERA5 through the model microphysics, which allows ice supersaturation with respect to ice (100 %–150 % in relative humidity) but not with respect to liquid water. Although microwave radiances at 183 GHz which are sensitive to atmospheric scattering induced by ice particles are assimilated, clouds and precipitation are not used as control variables in the 4D-Var assimilation system and cannot be adjusted independently in the analysis (Geer et al., 2017). Furthermore, whilst the modelled microwave radiances are mainly sensitive to the larger ice particles such as those in the cores of deep convection (Geer et al., 2017), the sensitivity to cirrus clouds in ERA5 is strongly dependent on microphysical assumptions of the shape and size of the cirrus particles. Observations that affect the tropospheric stability or humidity, or the synoptic situation, can affect the upper level ice cloud indirectly; e.g. changing the intensity of the convection will change the amount of outflow cirrus generated (Geer et al., 2017). A recent study of cloud ice observed by satellites and generated by reanalysis datasets (Duncan and Eriksson, 2018) has found that ERA5 is able to capture both seasonal and diurnal variability in cloud ice water but exhibits noisier and higher amplitude diurnal variability than borne out of multi-satellite estimates.
The present study uses the IWCERA5 at 100 and 150 hPa averaged over DJF from 2005 to 2016 with 1 h temporal resolution. IWCERA5 is compared to the amount of ice injected into the UT and the TL as estimated by the model developed in Dion et al. (2019). IWCERA5 data have been degraded along the vertical at 100 and 150 hPa (ΔIWCERA5), consistent with the vertical resolution of IWCMLS (5 and 4 km at 100 and 146 hPa, respectively) using a box function (see Sect. 7.2). IWCERA5 and 〈ΔIWCERA5〉 will both be considered in this study. IWCERA5, initially provided in kilograms per kilogram (kg kg−1), has been converted into milligrams per cubic metre (mg m−3) using the temperature provided by ERA5 in order to be compared with IWCMLS.
This section summarizes the method developed by Dion et al. (2019) to estimate ΔIWC, the amount of ice injected into the UT and the TL. Dion et al. (2019) have presented a model relating Prec (as a proxy for deep convection) from TRMM to IWCMLS over tropical convective areas during the austral convective season (DJF). The IWCMLS value measured by MLS during the growing phase of the convection (at x=01:30 LT or 13:30 LT) is compared to the Prec value at the same time (x) in order to define the correlation coefficient (C) between Prec and IWCMLS, as follows:
The diurnal cycle of estimated IWC (IWCest(t)) can be calculated by using C applied to the diurnal cycle of Prec (Prec(t)), where t is the time, as follows:
The amount of IWC injected into the UT or the TL (ΔIWCPrec) is defined by the difference between the maximum of IWCest (IWC) and its minimum (IWC).
where Precmax and Precmin are the diurnal maximum and minimum of Prec, respectively. Figure 1 illustrates the relationship between the diurnal cycle of Prec and the two MLS measurements at 01:30 and 13:30 LT. The growing phase of the convection is defined as the period of increase in precipitation from Precmin to Precmax. The amplitude of the diurnal cycle is defined by the difference between Precmax and Precmin. In Fig. 1, because the growing phase of the illustrated convection is happening during the afternoon, only the MLS measurement at 13:30 LT is used in the calculation of ΔIWC. IWC at 01:30 LT is not used in that case.
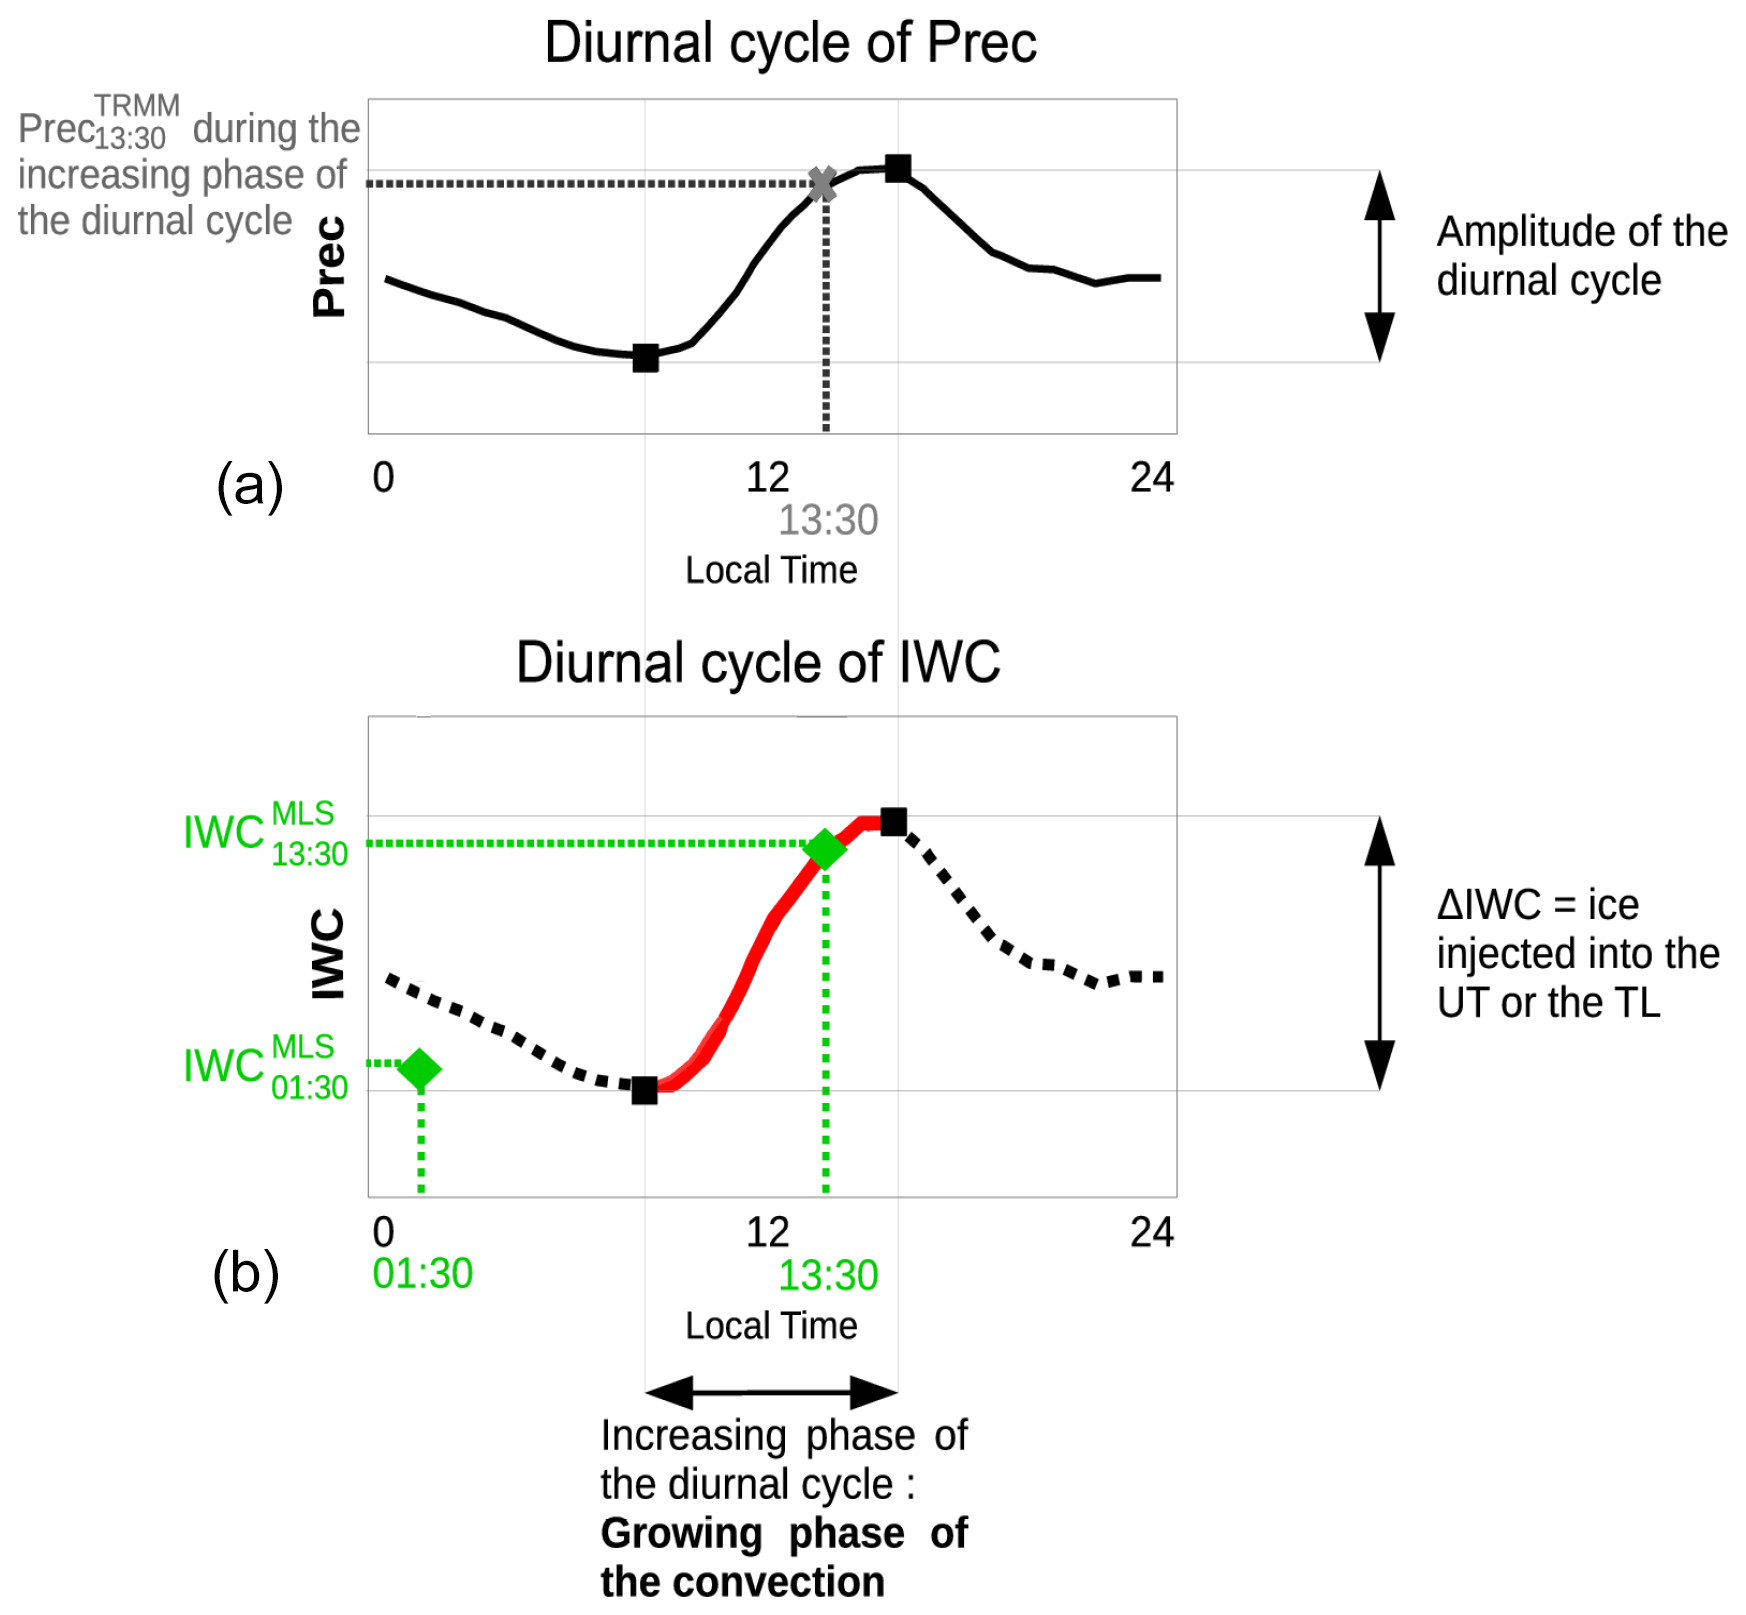
Figure 1Illustration of the model developed in Dion et al. (2019) to estimate the amount of ice (ΔIWC) injected into the UT or the TL. Diurnal cycle of a proxy for deep convection (Prec) (a) and diurnal cycle of ice water content (IWC) estimated from diurnal cycle of the proxy for deep convection (b). The red line is the increasing phase of the diurnal cycle and the dashed black line the decreasing phase of the diurnal cycle. The green diamonds are the two IWCMLS measurements from MLS. The grey thick cross represents the measurement of Prec during the growing phase of the convection (Precx), used in the model. The maximum and minimum of the diurnal cycles are represented by black squares. The amplitude of the diurnal cycle is defined by the differences between the maximum and the minimum of the cycle.
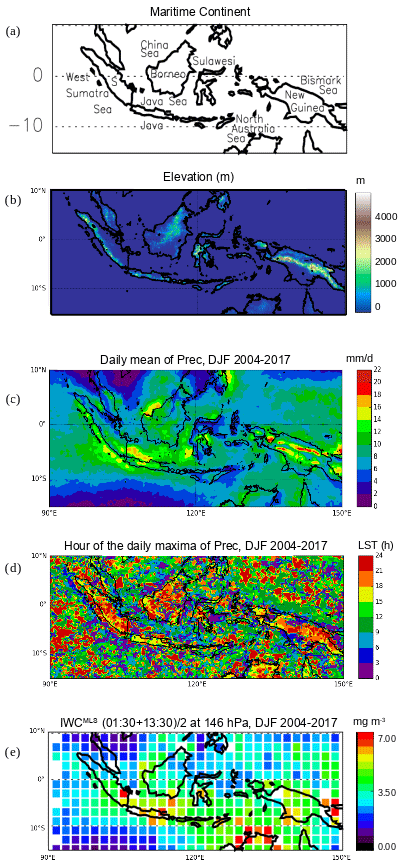
Figure 2Main islands and seas of the MariCont (S is for Sumatra) (a). Elevation from Solar Radiation Data (SoDa) (b). Daily mean of Prec obtained from TRMM analysis over the Maritime Continent, averaged over the period of DJF 2004–2017 (c). Hour (local solar time (LST)) of the diurnal maxima of Prec over the MariCont (d). Daily mean (01:30 LT + 13:30 LT) of IWCMLS at 146 hPa from MLS over the MariCont averaged over the period of DJF 2004–2017 (e). Observations are presented with a horizontal resolution of 0.25∘ × 0.25∘ (b, c, d) and 2∘ × 2∘ (e).
4.1 Prec from TRMM-3B42 related to IWC from MLS
In order to identify the main regions of injection of ice in the TL over the MariCont, Fig. 2 presents different parameters associated with this region: (a) the name of the main islands and seas over the MariCont, (b) the elevation from the Solar Radiation Data (SoDa; http://www.soda-pro.com/web-services/altitude/srtm-in-a-tile, last access: 12 June 2019), (c) the daily mean of Prec at 0.25∘ × 0.25∘ horizontal resolution, (d) the hour of the diurnal maxima of Prec at 0.25∘ × 0.25∘ horizontal resolution and (e) the daily mean of IWCMLS at 146 hPa at 2∘ × 2∘ horizontal resolution. Several points need to be highlighted. Daily means of Prec over land and coastal regions are higher than over oceans (Fig. 2c). Regions where the daily mean of Prec is maximum usually surround the highest elevation over land (e.g. over New Guinea) and near coastal regions (north-west of Borneo in the China Sea and southern Sumatra in the Java Sea) (Fig. 2b and c). Prec maxima are observed during the evening (18:00–00:00 LT) over land, during the night until morning (00:00–06:00 LT) over the coasts, and during the morning until noon and to a lesser extent during the evening (09:00–12:00 and 15:00–00:00 LT) over sea/ocean. These differences may be related to the diurnal variation of the land/sea breeze over the course of 24 h. The sea breeze during the day favours land convection at the end of the day when land surface temperature is higher than oceanic surface temperature. During the night, the land surface temperature drops below the coastline sea surface temperature, and the land breeze systematically favours the development of convection over coasts. These observations are consistent with results presented by Qian (2008), who explained that high precipitation is mainly concentrated over land in the MariCont because of the strong sea-breeze convergence but also because of the combination with the mountain–valley winds and cumulus merging processes. Amplitudes of the diurnal cycles of Prec over the MariCont will be detailed as a function of islands and sea in Sect. 5. The location of the largest concentration of IWCMLS (3.5–5.0 mg m−3; Fig. 2e) is consistent with that of Prec (∼ 12–16 mm d−1) over the West Sumatra Sea and over the south of the island of Sumatra. However, over North Australia Sea (including the Timor Sea and the Arafura Sea), we observed large differences between low values of Prec (4–8 mm d−1) and large values of IWCMLS (4–7 mg m−3).
4.2 Convective processes compared to IWC measurements
Although the TRMM horizontal resolution is 0.25∘ × 0.25∘, we require information at the same resolution as IWCMLS. The diurnal cycle of Prec obtained from TRMM analysis can be used for each 2∘ × 2∘ pixel to deduce the duration of the increasing phase of Prec and hence the duration of the growing phase of the convection. Figure 3a and b present the anomaly (deviation from the mean) of Prec in TRMM-3B42 over the MariCont for the pixels where convection is in the growing phase at 01:30 and 13:30 LT, respectively. Anomalies are calculated relative to the average computed over the entire MariCont region. Both blue and red shadings highlight regions experiencing the growing phase of convection, but while reds are associated with Prec values greater than the overall MariCont mean, blues, in contrast, are associated with precipitation less than the regional mean. Pixels are represented in the panels for both local times when (1) the onset of the convection is before 01:30 LT and the end is after 13:30 LT, or (2) the onset of the convection is before 13:30 LT, and the end is after 01:30 LT. The grey colour denotes pixels for which convection is not ongoing at 01:30 LT, nor at 13:30 LT. Similar anomalies of IWCMLS over the MariCont are shown in Fig. 3c and d, over pixels when the convection is in the growing phase at 01:30 and 13:30 LT, respectively. Note that, within each 2∘ × 2∘ pixel, at least 60 measurements of Prec or IWCMLS at 13:30 LT or 01:30 LT over the period 2004–2017 have been selected for the average.
The Prec anomaly at 01:30 and 13:30 LT varies between −0.15 and +0.15 mm h−1. The IWCMLS anomaly at 13:30 and 01:30 LT varies between −3 and +3 mg m−3. At 13:30 LT, the growing phase of the convection is found mainly over land. At 13:30 LT, over land, the strongest Prec and IWCMLS anomalies (+0.15 mm h−1 and +2.50 mg m−3, respectively) are found over Java and for IWCMLS over northern Australia. At 01:30 LT, the growing phase of the convection is found mainly over sea (while the pixels of the land are mostly grey), with maxima of Prec and IWCMLS anomalies over coastlines and seas close to coasts such as the Java Sea and the Bismarck Sea. Three types of regions can be distinguished from Fig. 3: (i) regions where Prec and IWCMLS anomalies have the same sign (e.g. over Java, Borneo, Sumatra, the Java Sea and the coast of Borneo or the China Sea); (ii) regions where the Prec anomaly is positive and the IWCMLS anomaly is negative (e.g. over the West Sumatra Sea); and (iii) regions where the Prec anomaly is negative and the IWCMLS anomaly is positive (e.g. over the North Australia Sea at 01:30 LT). Convective processes associated with these three types of regions over islands and seas of the MariCont are discussed in Sect. 6.
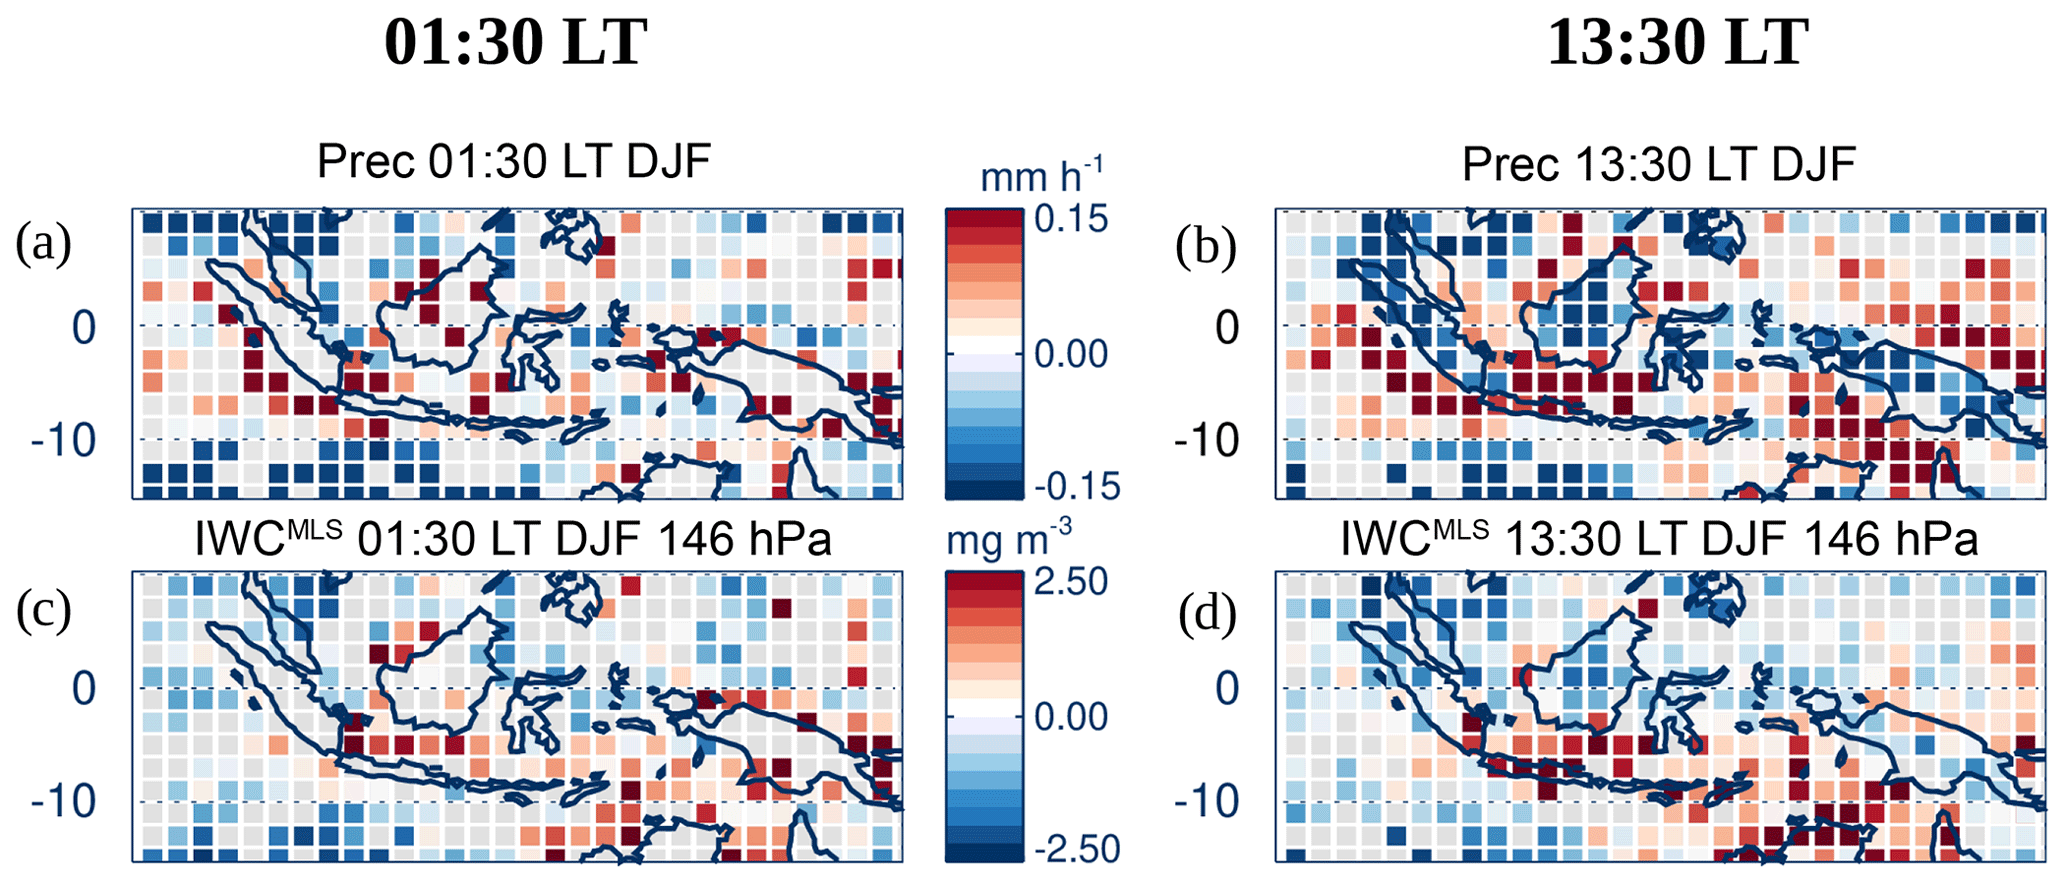
Figure 3Anomaly (deviation from the mean) of Prec (a–b) and ice water content (IWCMLS) at 146 hPa (c–d), at 01:30 (a) and at 13:30 LT (b) over pixels where 01:30 and 13:30 LT are during the growing phase of the convection, respectively, averaged over the period of DJF 2004–2017. The grey colour denotes pixels for which convection is not ongoing.
4.3 Horizontal distribution of ice injected into the UT and TL estimated from Prec
From the model developed in Dion et al. (2019) based on Prec from TRMM–3B42 and IWC from MLS and synthesized in Sect. 3, we can calculate the amount of IWC injected (ΔIWC) at 146 hPa (UT, Fig. 4a) and at 100 hPa (TL, Fig. 4b) by deep convection over the MariCont. In the UT, the amount of IWC injected over land (>10–20 mg m−3) is on average larger than over seas (<15 mg m−3). Southern Sumatra, Sulawesi, northern New Guinea and northern Australia present the largest amounts of ΔIWC over land (15–20 mg m−3). The Java Sea, China Sea and Bismarck Sea present the largest amounts of ΔIWC over seas (7–15 mg m−3). The West Sumatra Sea and North Australia Sea present low values of ΔIWC (<2 mg m−3). We note that the anomalies of Prec and IWC during the growing phase over the North Australia Sea at 13:30 LT are positive (>0.15 mm h−1, Fig. 3b and >2.5 mg m−3, Fig. 3d, respectively). In the TL, the maxima (up to 3.0 mg m−3) and minima (down to 0.2–0.3 mg m−3) of ΔIWC are located within the same pixels as in the UT, although they are 3 to 6 times lower than in the UT. The decrease of ΔIWC with altitude is larger over land (by a factor of 6) than over sea (by a factor of 3). We note that the similar pattern between the two layers comes from the diurnal cycle of Prec in the calculation of ΔIWC at 146 and 100 hPa. The differences in the magnitudes of the ΔIWC values at 100 and 146 hPa arise from the different amounts of IWC measured by MLS at those two levels. That is, similar ΔIWC patterns are expected between the two levels because, according to the model developed in Dion et al. (2019), deep convection is the main process transporting ice into the UT and the TL during the growing phase of the convection. Convective processes associated with land and sea are further discussed in Sect. 6.
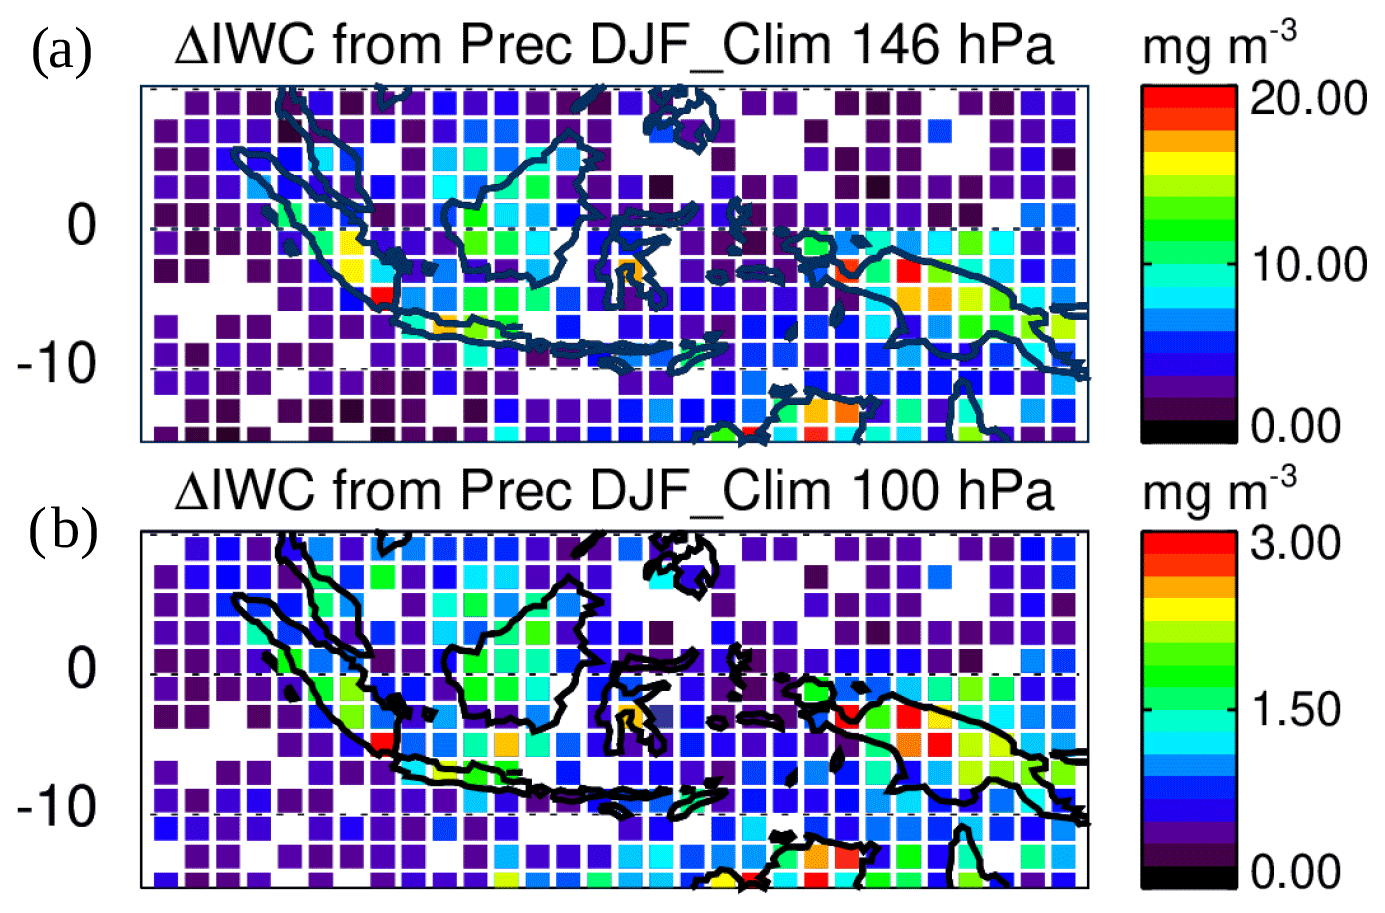
Figure 4Daily amount of ice injected (ΔIWC) up to the UT (a) and up to the TL (b) estimated from Prec, averaged during DJF 2004–2017.
In order to understand better the role of deep convection in determining the largest values of ΔIWC per pixel, isolated pixels selected in Fig. 4a are presented separately in Fig. 5a and f. This figure shows the diurnal cycles of Prec in four pixels selected for their large ΔIWC in the UT (≥15 mg m−3, Fig. 5b, c, d, e) and the diurnal cycle of Prec in four pixels selected for their low ΔIWC in the UT (but large enough to observe the diurnal cycles of IWC between 2.0 and 5.0 mg m−3, Fig. 5g, h, i, j). Pixels with low values of ΔIWC over land (Fig. 5g, h and i) present a small amplitude of diurnal cycles of Prec (∼ +0.5 mm h−1), with maxima between 15:00 and 20:00 LT and minima around 11:00 LT. The pixel with a low value of ΔIWC over sea (Fig. 5j) shows an almost zero amplitude of the diurnal cycle of Prec, with low values of Prec all day long (∼ 0.25 mm h−1).

Figure 5Location of 2∘ × 2∘ pixels in Fig. 4, where (a) ΔIWC >15 mg m−3 and (f) 5>ΔIWC >2 mg m−3. Diurnal cycle of Prec (solid line) over four pixels (in Fig. 4), where ΔIWC >15 mg m−3 (b, c, d, e) and 5>ΔIWC >2 mg m−3 (g, h, i, j), during DJF 2004–2017. The diamond represents IWCMLS during the increasing phase of the convection. The dashed line is the diurnal cycle of IWC estimated from the diurnal cycle of Prec and from IWCMLS.
Over land, the increasing phase of the Prec diurnal cycle is longer (from ∼ 09:00 to 20:00–00:00 LT) when ΔIWC is large (Fig. 5b, c, d, e) than when ΔIWC is small (from 10:00 to 15:00–19:00 LT; Fig. 5g, h, i). Pixels labelled 1 and 2 over New Guinea (Fig. 5d and e) and the pixel over southern Sumatra (Fig. 5c) show the amplitude of the diurnal cycle of Prec reaching 1.0 mm h−1, while the pixel over North Australia (Fig. 5b) shows the lower amplitude of the diurnal cycle of Prec (0.5 mm h−1).
IWCMLS during the growing phase of deep convection is also shown in Fig. 5. For pixels with large values of ΔIWC, IWCMLS is between 4.5 and 5.7 mg m−3 over North Australia, South Sumatra and New Guinea 1. For pixels with low values of ΔIWC, IWCMLS is found between 1.9 and 4.7 mg m−3. To summarize, large values of ΔIWC are observed over land in combination with (i) a longer growing phase of deep convection (>9 h) and/or (ii) the large diurnal amplitude of Prec (>0.5 mm h−1). However, as IWCMLS ranges overlap for the high and low ΔIWC, no definitive conclusion about the relationship between IWCMLS and ΔIWC can be drawn.
In the next section, we estimate ΔIWC using another proxy for deep convection, namely Flash measurements from LIS.
Lightning is created in cumulonimbus clouds when the electric potential energy difference is large between the base and the top of the cloud. Lightning can appear at the advanced stage of the growing phase of the convection and during the mature phase of the convection. For these reasons, in this section, we use Flash measured from LIS during DJF 2004–2015 as another proxy for deep convection in order to estimate ΔIWC (ΔIWCFlash) and check the consistency with ΔIWC obtained with Prec (ΔIWCPrec).
5.1 Flash distribution over the MariCont
Figure 6a shows the daily mean of Flash in DJF 2004–2015 at 0.25∘ × 0.25∘ horizontal resolution. Over land, Flash can reach a maximum of 10−1 flashes d−1 per pixel, while, over seas, Flash is characterized by smaller values (∼ 10−3 flashes d−1 per pixel). When compared to the distribution of Prec (Fig. 2c), maxima of Flash are found over similar regions to maxima of Prec (Java, east of the Sulawesi coast, Sumatra and northern Australia). Over Borneo and New Guinea, coastlines show larger values of Flash (∼10−2 flashes d−1) than inland (∼10−3 flashes d−1). Differences between Flash and Prec distributions are found over the North Australia Sea, with a relatively large number of Flash ( flashes d−1) compared to low Prec (4–10 mm d−1) (Fig. 2c), and over several inland regions of New Guinea, where the number of Flash is relatively low (∼ 10−2–10−3 flashes d−1) while Prec is high (∼ 14–20 mm d−1). Figure 6b shows the hour of the Flash maxima. Over land, maxima of Flash are mainly observed in the range 15:00–18:00 LT, while maxima of Prec (Fig. 2d) are mainly observed over a longer range of maxima from 18:00–24:00 LT. Coastal regions show similar hours of maximum of Prec and Flash, i.e between 00:00 and 04:00 LT, although, over the West Sumatra coast, diurnal maxima of both Prec and Flash happen 1–4 h earlier (from 23:00–24:00 LT) than those of other coasts.
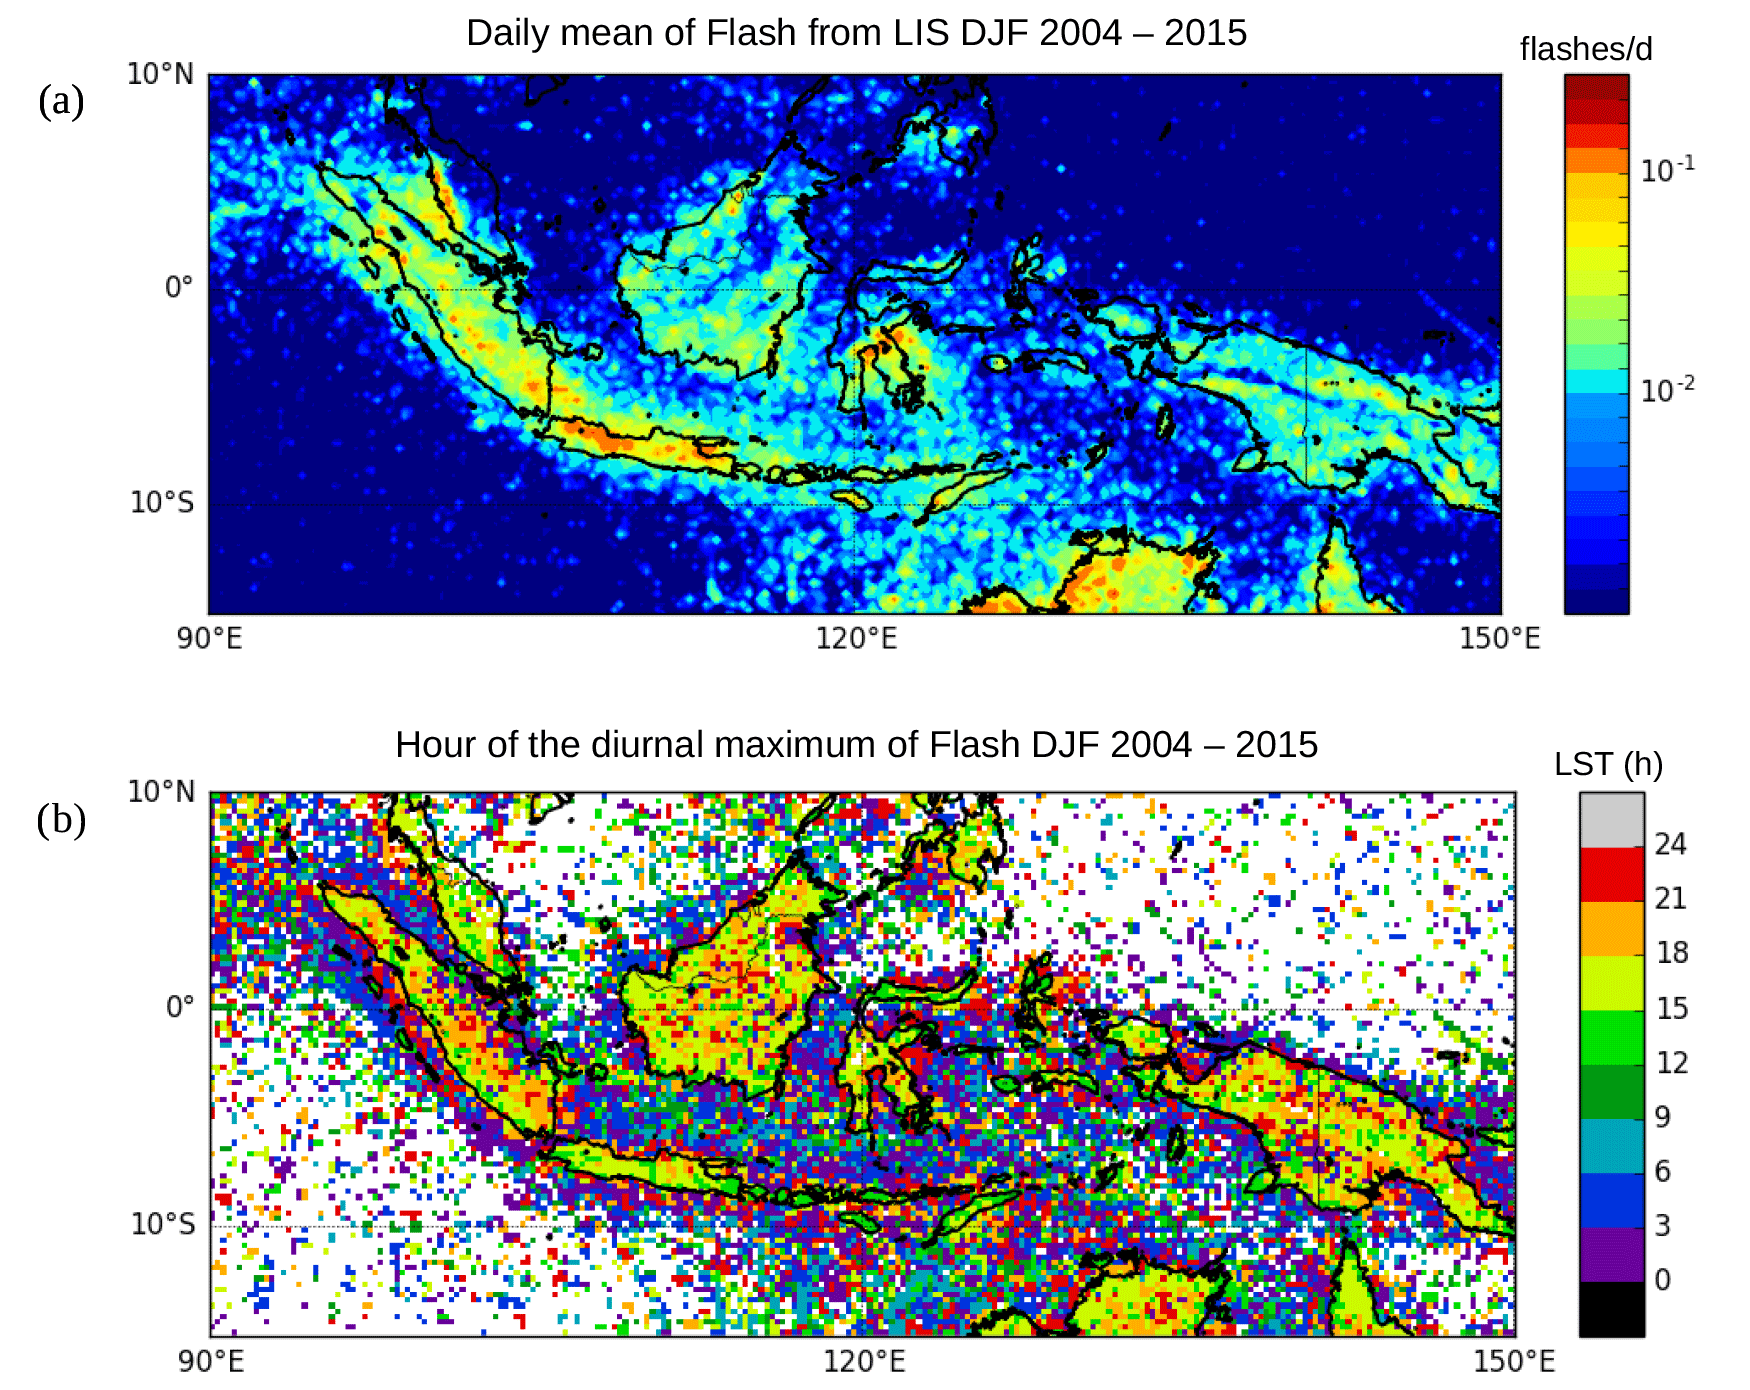
Figure 6Daily mean of Flash measured by LIS averaged over the period DJF 2004–2015 (a). Hour (local solar time (LST)) of the diurnal maximum of Flash (b).
5.2 Prec and Flash diurnal cycles over the MariCont
This section compares the diurnal cycle of Flash with the diurnal cycle of Prec in order to assess the potential for Flash to be used as a proxy for deep convection over land and sea of the MariCont. Diurnal cycles of Prec and Flash over the MariCont land, coastline and offshore (MariCont_L, MariCont_C and MariCont_O, respectively) are shown in Figs. 7a–c, respectively. Within each 0.25∘ × 0.25∘ pixel, ocean, land and coast filters were applied from the SoDa elevation filter. Each pixel is designated as either land or sea. Then MariCont_C is the region defined by sea pixels that are within five pixels of a land pixel. This choice of five pixels was made after consideration of some sensitivity tests in order to have the best compromise between a high signal-to-noise ratio and a good representation of the coastal region. The MariCont_O is the average of all offshore pixels defined as sea pixels excluding 10 pixels (∼ 2000 km) over the sea from the land; thus coastline pixels are excluded as well as all the coastal influences. MariCont_L is the average over all land pixels.
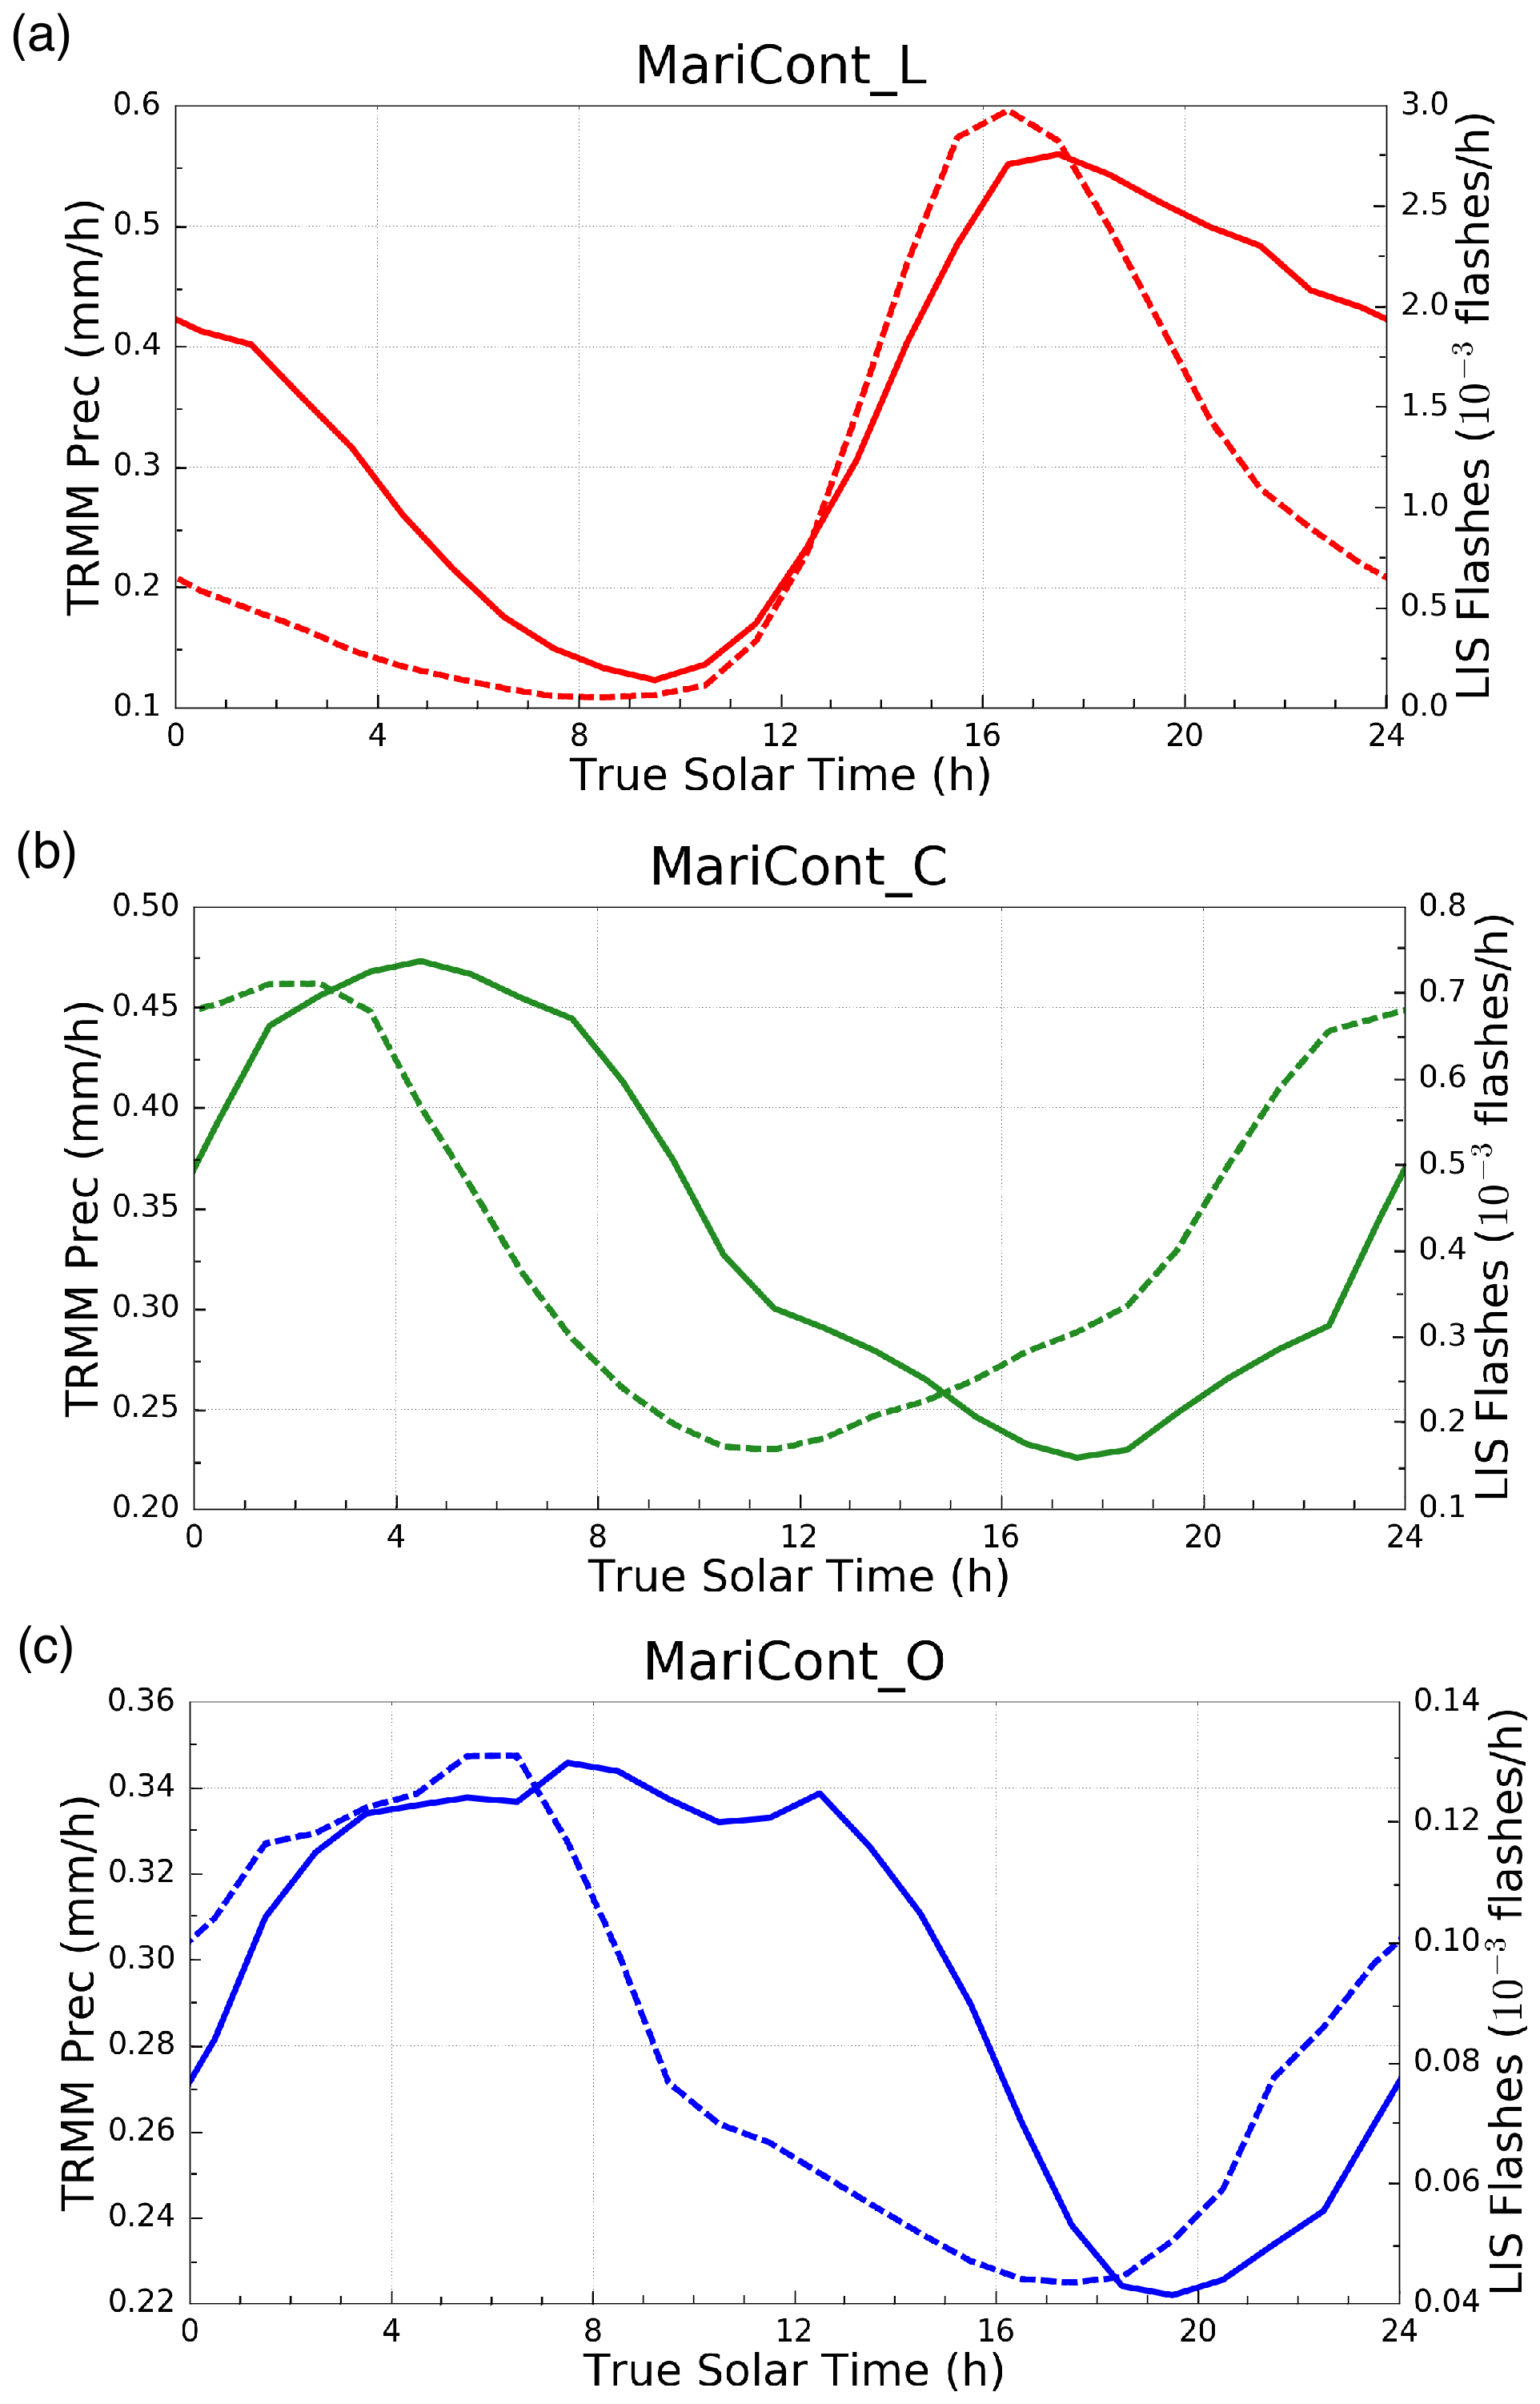
Figure 7Diurnal cycle of Prec (solid line) and diurnal cycle of Flash (dashed line) over MariCont_L (a), MariCont_C (b) and MariCont_O (c).
Over land, during the growing phase of the convection, Prec and Flash start to increase at the same time (10:00–12:00 LT), but Flash reaches a maximum earlier (from 15:00 LT) than Prec (from 18:00 LT), consistent with the range of maximum hours observed in Figs. 2d and 6b. This is consistent with the finding of Liu and Zipser (2008) over the whole tropics. The different timing of the maxima could come from the fact that in the dissipating stage of the convection, the number of flashes decreases, whilst the precipitation remains relatively high. Combining our results with the ones presented in Dion et al. (2019), Flash and Prec can be considered to be good proxies for deep convection during the growing phase of the convection over the MariCont_L.
Over coastlines (Fig. 7b), the Prec diurnal cycle is delayed by about +2 to 7 h with respect to the Flash diurnal cycle. The Prec minimum is around 18:00 LT, while the Flash minimum is around 11:30 LT. Maxima of Prec and Flash are found around 04:00 and 02:00 LT, respectively. This means that the increasing phase of Flash is 2–3 h longer than that of Prec. These results are consistent with the work of Mori et al. (2004) showing a diurnal maximum of precipitation in the early morning between 02:00 and 03:00 LT and a diurnal minimum of precipitation between 11:00 and 21:00 LT over coastal zones of Sumatra. According to Petersen and Rutlegde (2001) and Mori et al. (2004), coastal zones are areas where precipitation results more from convective activity than from stratiform activity and the amplitude of diurnal maximum of Prec decreases with the distance from the coastline.
Over offshore areas (Fig. 7c), minima of the diurnal cycle of Prec and the diurnal cycle of Flash are reached in the late afternoon, between 16:00 and 17:00 LT (Flash) and 17:00 and 18:00 LT (Prec), whilst maxima of the diurnal cycle of Prec and Flash are reached in the early morning, between 06:00 and 07:00 LT (Flash) and around 08:00–09:00 LT (Prec). Results over offshore areas are consistent with the diurnal cycle of Flash and Prec calculated by Liu and Zipser (2008) over the whole tropical ocean, showing the increasing phase of the diurnal cycle of Flash starting 1–2 h before the increasing phase of the diurnal cycle of Prec.
The time interval between the maximum and minimum of Prec is always longer than that for Flash. The period after the maximum of Prec is likely more representative of stratiform rainfall than deep convective rainfall. Consistent with that picture, model results from Love et al. (2011) have shown the suppression of deep convection over the offshore area west of Sumatra from the early afternoon due to a downwelling wavefront characterized by deep warm anomalies around noon. According to the authors, later in the afternoon, gravity waves are forced by the stratiform heating profile and propagate slowly offshore. They also highlighted that the diurnal cycle of the offshore convection responds strongly to the gravity wave forcing at the horizontal scale of 4 km. To summarize, diurnal cycles of Prec and Flash show the following:
- i.
Over land, Flash increases proportionally with Prec during the growing phase of the convection.
- ii.
Over coastlines, the Flash increasing phase is more than 6–7 h ahead of the Prec increasing phase.
- iii.
Over offshore areas, the Flash increasing phase is about 1–2 h ahead of the Prec increasing phase.
In Sect. 7, we investigate whether this time difference impacts the estimation of ΔIWC over land, coasts and offshore areas.
5.3 Prec and Flash diurnal cycles and small-scale processes
In this subsection, we study the diurnal cycle of Prec and Flash at 0.25∘ × 0.25∘ resolution over areas of deep convective activity over the MariCont. In line with the distribution of large values of Prec (Fig. 2), IWCMLS (Fig. 3) and ΔIWC (Fig. 4), we have selected five islands and five seas over the MariCont. Diurnal cycles of Prec and Flash are presented over land for (a) Java, (b) Borneo, (c) New Guinea, (d) Sulawesi and (e) Sumatra as shown in Fig. 8 and over sea for the (a) Java Sea, (b) North Australia Sea (NAusSea), (c) Bismarck Sea, (d) West Sumatra Sea (WSumSea) and (e) China Sea as shown in Fig. 9. Diurnal cycles of IWC from ERA5 (IWCERA5) are also presented in Figs. 8 and 9 and will be discussed in Sect. 6.

Figure 8Diurnal cycles of Prec (solid line), Flash (dashed line) and IWCERA5 from ERA5 at 150 hPa (dotted line) over MariCont islands: Java (a), Borneo (b), New Guinea (c), Sulawesi (d) and Sumatra (e) and map of the study zones over land (f).
Over land, the amplitude of the diurnal cycle of Prec is the largest over Java (Fig. 8a), consistent with Qian (2008), with a maximum reaching 1 mm h−1, while, over the other areas, maxima are between 0.4 and 0.6 mm h−1. Furthermore, over Java, the duration of the increasing phase in the diurnal cycle of Prec is 6 h, consistent with that of Flash, whereas elsewhere the duration of the increasing phase is longer in Prec than in Flash by 1–2 h. The particularity of Java is related to the increasing phase of the diurnal cycle of Prec (6 h), which is faster than over all the other land areas considered in our study (7–8 h). The strong and rapid convective growing phase measured over Java might be explained by the fact that the island is narrow, with high mountains (up to ∼ 2000 m altitude, as shown in Fig. 2b) reaching the coast. The topography promotes the growth of intense and rapid convective activity. The convection starts around 09:00 LT, rapidly elevating warm air up to the top of the mountains. Around 15:00 LT, air masses cooled at higher altitudes are transported to the sea, favouring the dissipating stage of the convection. Like Java, Sulawesi is a small island with high topography. However, the amplitude of the diurnal cycle of Prec and Flash is not as strong as over Java. Other islands, such as Borneo, New Guinea and Sumatra, have high mountains but also large lowland areas. Mountains promote deep convection at the beginning of the afternoon, while lowlands help maintain the convective activity through shallow convection and stratiform rainfall (Nesbitt and Zipser, 2003; Qian, 2008). Deep and shallow convection are then mixed during the slow dissipating phase of the convection (from ∼ 16:00–08:00 LT). However, because Flash is observed only in deep convective clouds, the decreasing phase of the Flash diurnal cycle is shorter than the decreasing phase of Prec. The diurnal maxima of Prec found separately over the five islands of the MariCont (at 0.25∘ × 0.25∘ resolution) are much higher than the diurnal maxima of Prec found over broad tropical land regions (South America, South Africa and MariCont_L, at 2∘ × 2∘ resolution) from Dion et al. (2019): ∼ 0.6–1.0 and ∼ 0.4 mm h−1, respectively. However, the duration of the increasing phase of the diurnal cycle of Prec is consistent with the one calculated over tropical land by Dion et al. (2019).

Figure 9Diurnal cycles of Prec (solid line), Flash (dashed line) and IWCERA5 from ERA5 at 150 hPa (dotted line) over MariCont seas: Java Sea (a), North Australia Sea (NAusSea) (b), Bismarck Sea (c), West Sumatra Sea (WSumSea) (d) and China Sea (e) and map of the study zones over sea (f).
Over sea, the five selected areas (Fig. 9a–e) show a diurnal cycle of Prec and Flash similar to that of either coastline or offshore areas, depending on the region considered. The diurnal cycle of Prec and Flash over Java Sea is similar to the one over coastlines (Fig. 7b). Java Sea (Fig. 9a), an area mainly surrounded by coasts, shows the largest diurnal maximum of Prec (∼ 0.7 mm h−1) and Flash (∼ flashes h−1) with the longest growing phase. In this area, land and sea breezes observed in coastal areas impact the diurnal cycle of the convection (Qian, 2008). Over the Java Sea, Prec is strongly impacted by land breezes from the islands of Borneo and Java (Qian, 2008), explaining why Prec and Flash reach largest values during the early morning. By contrast, NAusSea, Bismarck Sea and WSumSea (Fig. 9b, c and d, respectively), which are large regions on which coastal influences are likely to be weak, show a small amplitude of the diurnal cycle. In our analysis, these three study zones are the areas including the most offshore pixels. The China Sea shows a diurnal maximum of Flash shifted by about 4 h before the diurnal maximum of Prec, but the time of the diurnal minimum of Prec and Flash is similar. Over the China Sea and Bismarck Sea, the diurnal cycle of Flash shows a weak amplitude, with maxima reaching only 0.1– flashes h−1. Furthermore, over the Bismarck Sea, while the diurnal minimum in Prec is around 18:00 LT, there are several local minima in Flash (08:00, 14:00 and 18:00 LT). Over NAusSea, the diurnal minimum of Prec is delayed by more than 9 h compared to the diurnal minimum of Flash.
To summarize, over islands, the increasing phases of convection for Flash and Prec start at the same time and increase similarly, but the diurnal maximum of Flash is reached 1–2 h before the diurnal maximum of Prec. Over seas, the duration of the increasing phase of convection and the amplitude of the diurnal cycles are not always similar, depending on the area considered. The diurnal cycles of Flash and Prec show some time lag as for over the North Australia Sea where the diurnal cycle of Flash is more than 9 h ahead of the diurnal cycle of Prec. In Sect. 7, we estimate ΔIWC over the five selected island and sea areas from Prec and Flash as a proxy for deep convection.
The ERA5 reanalysis provides hourly IWC at 150 and 100 hPa (IWCERA5). The diurnal cycle of IWCERA5 over the MariCont will be used to calculate ΔIWCERA5 in order to support the horizontal distributions and the amount of ice injected into the UT and the TL deduced from our model combining IWCMLS and TRMM-3B42 Prec or IWCMLS and LIS flash. In assessing the consistency or lack thereof in the comparisons between ΔIWCERA5 and both ΔIWCPrec and ΔIWCFlash, it should be kept in mind that IWCERA5 data quality has not yet been fully evaluated. Figure. 10a, b, c and d present the daily mean and the hour of the diurnal maxima of IWCERA5 at 150 and 100 hPa. In the UT, the daily mean of IWCERA5 shows a horizontal distribution over the MariCont consistent with that of IWCMLS (Fig. 2e), except over New Guinea, where IWCERA5 (exceeding 6.4 mg m−3) is much larger than IWCMLS (∼ 4.0 mg m−3). The highest amount of IWCERA5 is located over the New Guinea mountain chain and over the west coast of northern Australia (exceeding 6.4 mg m−3 in the UT and 1.0 mg m−3 in the TL). Over islands in the UT and the TL, the time of the IWCERA5 diurnal maximum is found between 12:00 and 15:00 LT over Sulawesi and New Guinea and between 15:00 and 21:00 LT over Sumatra, Borneo and Java, which is close to the time of the diurnal maximum of Flash over islands (Fig. 6). Over sea, in the UT and the TL, the time of the IWCERA5 diurnal maximum is found between 06:00 and 09:00 LT over the West Sumatra Sea, Java Sea and North Australia Sea, between 06:00 and 12:00 LT over the China Sea and between 00:00 and 03:00 LT over the Bismarck Sea. There are no significant differences between the time of the maximum of IWCERA5 in the UT and in the TL.
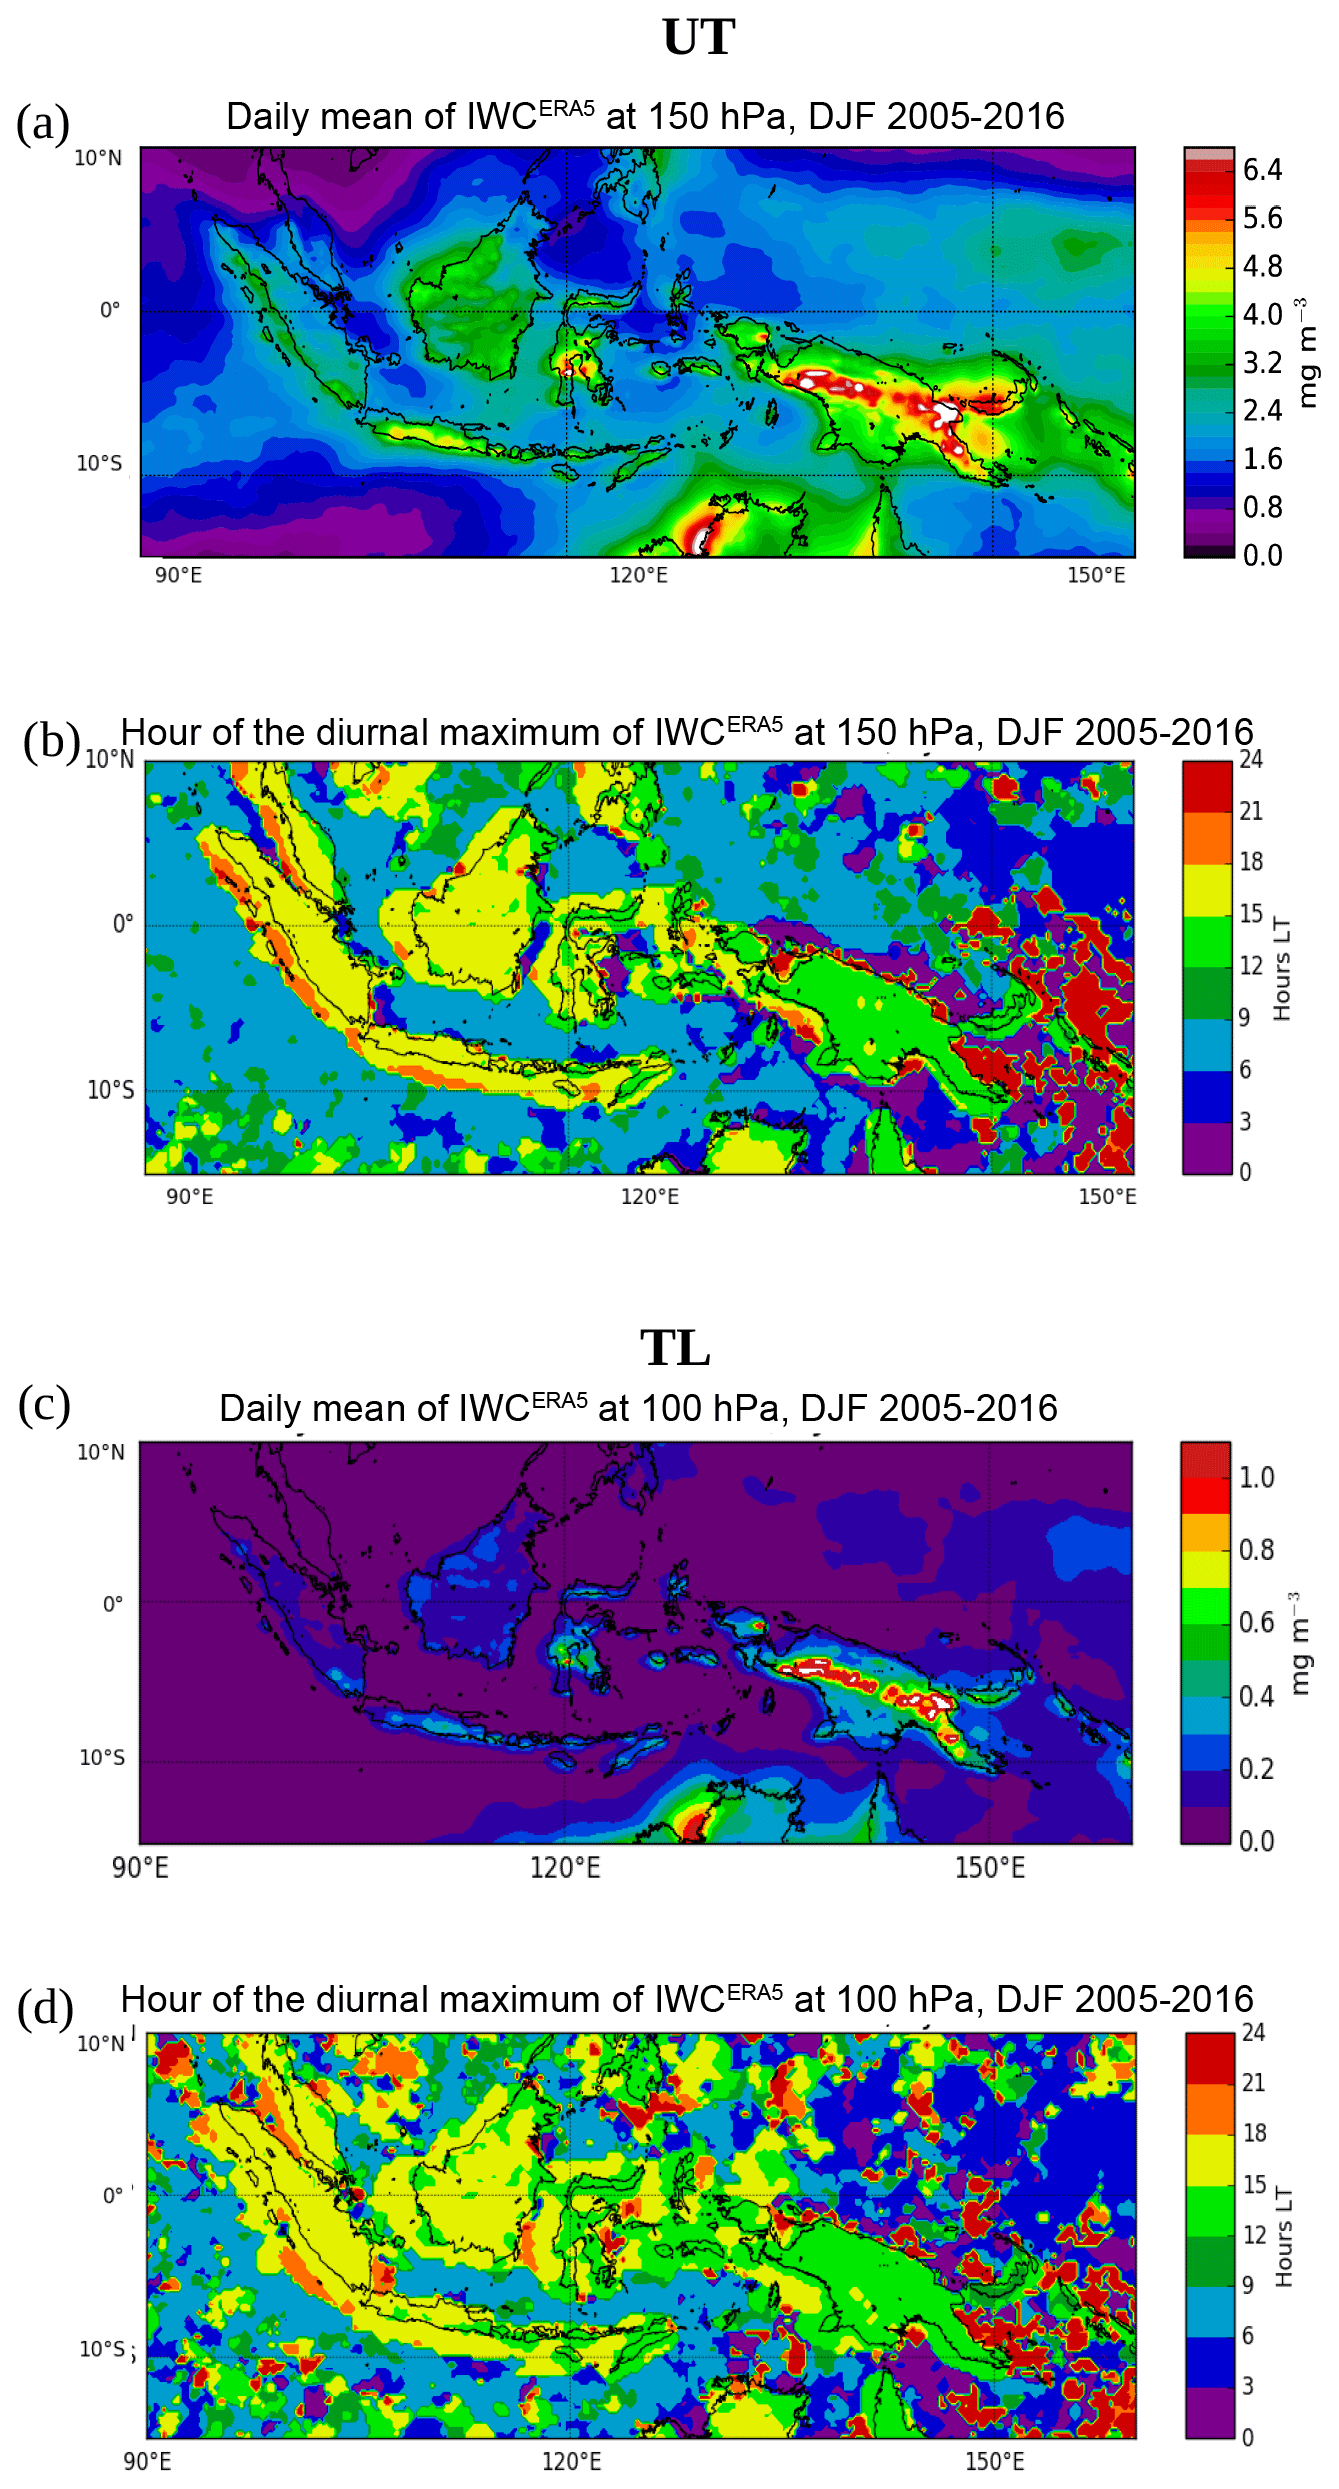
Figure 10Daily mean of IWCERA5 averaged over the period DJF 2005–2016 at 150 hPa (a) and at 100 hPa (c). Time (hour, local time (LT)) of the diurnal maximum of IWCERA5 at 150 hPa (b) and at 100 hPa (d).
The diurnal cycles of IWCERA5 at 150 hPa are presented in Figs. 8 and 9 over the selection of islands and seas of the MariCont together with the diurnal cycles of Prec and Flash. Over islands (Fig. 8), the maximum of the diurnal cycle of IWCERA5 is found between 16:00 and 17:00 LT, consistent with the diurnal cycle of Prec and Flash. The durations of the increasing phase of the diurnal cycles of Prec, Flash and IWCERA5 are all consistent with each other (6–8 h). Over sea (Fig. 9), the maximum of the diurnal cycle of IWCERA5 is mainly found between 07:00 and 10:00 LT over the Java Sea and North Australia Sea, consistent with the diurnal cycle of Prec, and a second peak is found around 16:00 LT. Thus, the duration of the increasing phase of the diurnal cycles of IWCERA5 is consistent with that of Prec over these two sea study zones (10 h) but not with that of Flash. Over the Bismarck Sea, the diurnal maxima of IWCERA5 are found at 04:00 LT with a second peak later at noon. Over the West Sumatra Sea, two diurnal maxima are found at 08:00 and 17:00 LT. Over the China Sea, the diurnal maximum of IWCERA5 is found at 16:00 LT with a second peak at 08:00 LT. These differences in the timing of the maximum of the diurnal cycle of Prec, Flash and IWCERA5 observed at small scale over the seas of the MariCont are not well understood. However, these differences do not affect the calculation of the ΔIWCPrec, ΔIWCFlash or ΔIWCERA5 because only the magnitude of the diurnal cycle (max–min) matters for the calculation of ΔIWC.
Figure 11 synthesizes ΔIWC deduced from observations and reanalysis in the UT and the TL over the five islands and five seas of the MariCont studied in the previous section.
7.1 ΔIWC deduced from observations
Equations (1)–(3) are used to calculate ΔIWC from Prec (ΔIWCPrec) and from Flash (ΔIWCFlash). As presented in the previous section, Prec and Flash can be used as two proxies for deep convection, although differences in their diurnal cycles may depend on the region considered. The observational ΔIWC range calculated between ΔIWCPrec and ΔIWCFlash provides a quantitative characterization of the uncertainty in our model. In the following we will consider the relative difference, expressed as a percentage, between ΔIWCPrec and ΔIWCFlash as
In the UT (Fig. 11a), over islands, ΔIWC calculated over Sumatra, Borneo, Sulawesi and New Guinea varies from 4.9–7.1 mg m−3, whereas, over Java, ΔIWC reaches 8.1–8.7 mg m−3. ΔIWCFlash is generally greater than ΔIWCPrec by less than 1.4 mg m−3 (with rPrec−Flash ranging from −6 % to −22 % over the study zones) for all the islands, except for Java where ΔIWCPrec is larger than ΔIWCFlash by 0.6 mg m−3 ( %). Over sea, ΔIWC varies from 1.1 to 4.4 mg m−3. ΔIWCFlash is greater than ΔIWCPrec by 0.6 to 2.3 mg m−3 ( % to −71 %), except for the Java Sea, where ΔIWCPrec is greater than ΔIWCFlash by 0.2 mg m−3 ( %). Over the North Australia Sea and West Sumatra Sea, ΔIWCFlash is more than twice as large as ΔIWCPrec ( % and −71 %, respectively).
In the TL (Fig. 11b), the observational ΔIWC range is found to be between 0.7 and 1.3 mg m−3 over islands and between 0.2 and 0.7 mg m−3 over seas. The same conclusions apply to the observational ΔIWC range calculated between ΔIWCPrec and ΔIWCFlash in the TL as in the UT, with differences of less than 0.4 mg m−3.
To summarize, independent of the proxies used for the calculation of ΔIWC, and for both UT and TL, the island of Java shows the largest injection of ice over the MariCont. The minimum value of the observational ΔIWC range over Java is larger than the maximum value of the observational ΔIWC range of other land study zones by more than 1.0 mg m−3 in the UT and more than 0.3 mg m−3 in the TL. Furthermore, it has been shown that both proxies can be used in our model, with more confidence over land: ΔIWCPrec and ΔIWCFlash are more consistent with each other, both in the UT and in the TL, over islands (relative difference % to −22 %) than over seas ( % to −71 %). The larger difference over seas is probably due to the larger contribution from stratiform precipitation to Prec over sea and to the very low values of Flash over seas ( flashes d−1 per pixel).
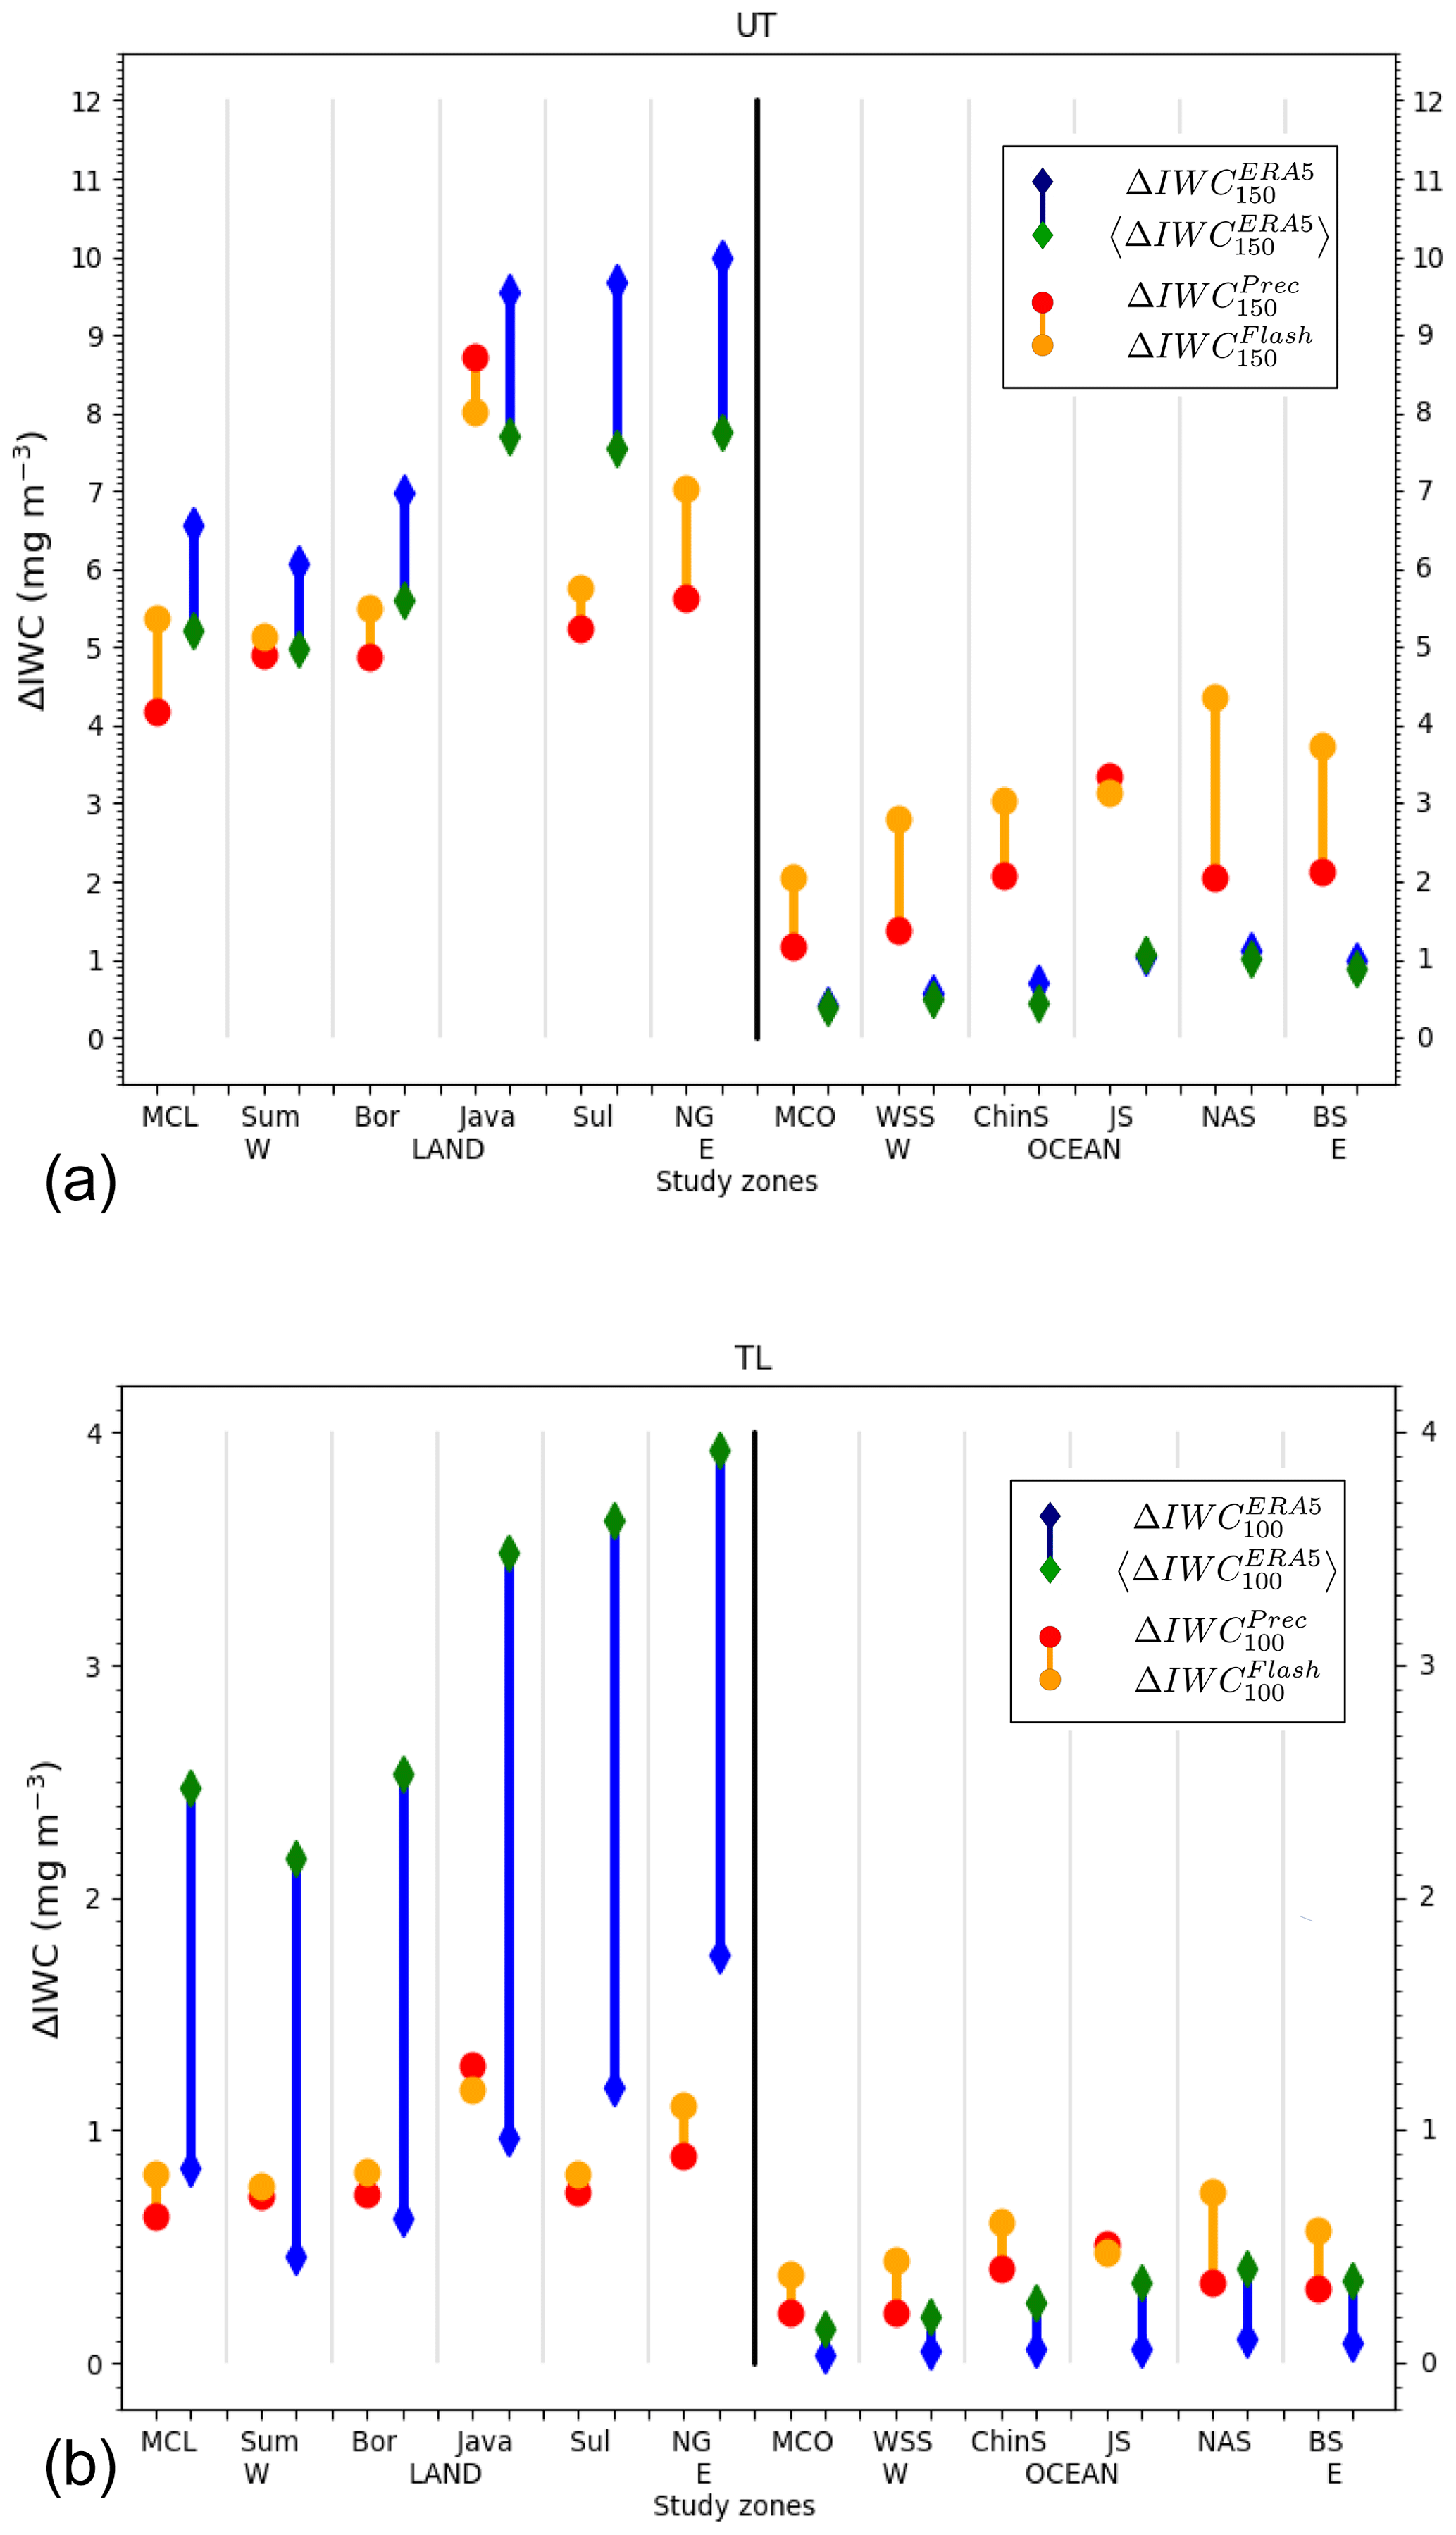
Figure 11(a) ΔIWC (mg m−3) estimated from Prec (red) and Flash (orange) at 146 hPa and ΔIWC estimated from ERA5 at the level 150 hPa and at the level 150 hPa degraded in the vertical, over islands and seas of the MariCont: MariCont_L (MCL) and MariCont_O (MCO); from west (W) to east (E) over land, Sumatra (Sum), Borneo (Bor), Java, Sulawesi (Sul) and New Guinea (NG); and over seas, West Sumatra Sea (WSS), China Sea (ChinS), Java Sea (JS), North Australia Sea (NAS) and Bismarck Sea (BS). (b) Same as in (a) but for 100 hPa.
7.2 ΔIWC deduced from reanalysis
ΔIWC from ERA5 (ΔIWC) is calculated in the UT and the TL (z0=150 and 100 hPa, respectively) as the max–min difference in the amplitude of the diurnal cycle. We can use the IWCERA5 to assess the impact of the vertical resolution of the MLS measurements on the observationally derived ΔIWC estimates. According to Wu et al. (2008), estimates of IWC derived from MLS represent spatially averaged quantities within a volume that can be approximated by a box of ∼ km3 near the pointing tangent height. In order to compare IWCMLS and IWCERA5, two steps were taken: (1) the horizontal resolution of ERA5 was degraded from 0.25 to 2 (∼ 200 km × 200 km), and (2) the vertical resolution of ERA5 was degraded by convolving the vertical profiles of IWCERA5 with a box function whose width is 5 and 4 km at 100 and 146 hPa, respectively. IWCERA5 with degraded vertical resolution is named 〈IWCERA5〉. The ERA5 amount of ice injected at z0=150 and 100 hPa with degraded vertical resolution is thus calculated from . In the following we consider the difference rERA5−〈ERA5〉 between ΔIWCERA5 and 〈ΔIWCERA5〉 as follows:
Figure 11 shows and at z0=150 and 100 hPa, over the island and the sea study zones. In the UT (Fig. 11a), over islands, and calculated over Sumatra and Borneo vary from 4.9 to 7.0 mg m−3 (rERA5−〈ERA5〉 ranges from 20 % to 22 %), whilst and over Java, Sulawesi and New Guinea reach 7.5–10.0 mg m−3 ( % to 24 %). Over sea, and vary from 0.35 to 1.1 mg m−3 ( % to 33 %). Over islands and sea, is greater than . The small differences between and over islands and sea in the UT support the fact that the vertical resolution at 150 hPa has a low impact on the estimated ΔIWC.
In the TL, over land, and vary from 0.5 to 3.9 mg m−3 ( % to −138 %), with being larger than by as much as 2.5 mg m−3 over some islands. Over sea, and vary from 0.05 to 0.4 mg m−3 ( % to −139 %), with lower than by as much as 0.3 mg m−3. The large differences between and over islands and sea in the TL support the fact that the vertical resolution at 100 hPa has a high impact on the estimation of ΔIWC.
7.3 Synthesis
The comparison between the observational ΔIWC range and the reanalysis ΔIWC range is presented in Fig. 11. In the UT, over land, observation and reanalysis ΔIWC ranges agree to within 0.1 to 1.0 mg m−3, which highlights the robustness of our model over land, except over Sulawesi and New Guinea, where the observational and the reanalysis ΔIWC ranges differ by at least 1.7 and 0.7 mg m−3, respectively. Over sea, the observational ΔIWC range is systematically greater than that of the reanalysis by ∼ 1.0–2.2 mg m−3, with systematically larger estimates derived from observations than from the reanalysis. The consistency between observational and reanalysis ΔIWC ranges is calculated as the minimum value of the higher range minus the maximum value of the lower range divided by the mean of these two values. In the UT, observational and reanalysis ΔIWC estimates are found to be consistent over land, where the relative differences between their ranges are less than 25 %, but inconsistent over sea, where differences are 62 % to 96 %. In the TL, the relative differences between the observational and reanalysis ΔIWC ranges are 0 % to 49 % over land and 0 % to 28 % over sea.
In the following, we define the total range covering the observational and reanalysis ΔIWC estimates, rTotal, as the maximum value of the higher range minus the minimum value of the lower range divided by the mean of these two values. In the UT, the observational and reanalysis ΔIWC estimates span 4.2 to 10.0 mg m−3 (with rTotal values from 20 % to 57 %) over land and 0.4 to 4.4 mg m−3 (with rTotal values from 107 % to 156 %) over sea. In the TL, the observational and reanalysis ΔIWC estimates span 0.5 to 3.9 mg m−3 (with rTotal values from 88 % to 134 %) over land and 0.1 to 0.7 mg m−3 (with rTotal values of 142 % to 160 %) over sea.
Amounts of injected ice deduced from observations and reanalysis are fairly consistent over land in the UT and over land and sea in the TL but are inconsistent over sea in the UT. However, the impact of the vertical resolution on the estimation of ΔIWC is much larger in the TL than in the UT (rTotal is larger in the TL than in the UT). At both levels, observational and reanalyses ΔIWC estimated over land is more than twice as large as ΔIWC estimated over sea. Although Java has shown the largest values of ΔIWC from observations compared to other study zones, the reanalysis ΔIWC range shows that Sulawesi and New Guinea may also reach high values of ΔIWC, similar to those seen over Java. However, as the ERA5 IWC data have yet to be extensively validated, it is also possible that the reanalysis overestimates IWC in these regions.
Our results have shown that, in all the datasets used, the island of Java and the Java Sea are the two areas with the largest amount of ice injected up to the UT and the TL over the MariCont land and sea, respectively. In this section, processes impacting ΔIWC in the different study zones are discussed.
8.1 Java, Sulawesi and New Guinea
The islands of Sulawesi, New Guinea and particularly Java have been shown as the areas of the largest ΔIWC in the UT and TL. Qian (2008) have used high-resolution observations and regional climate model simulations to show the three main processes impacting the diurnal cycle of rainfall over the island of Java. The main process explaining the rapid and strong peak of Prec during the afternoon over Java (Fig. 8a) is the sea-breeze convergence around midnight. This convergence caused by the sea-breeze phenomenon increases the deep convective activity and impacts the diurnal cycle of Prec and the IWC injected up to the TL by amplifying their quantities. The second process is the mountain–valley wind converging toward the mountain peaks, reinforcing the convergence and the precipitation. The land breeze becomes minor compared to the mountain–valley breeze, and this process is amplified with the mountain altitude. As shown in Fig. 2b, New Guinea has the highest mountain chain of the MariCont. The third process shown by Qian (2008) is precipitation that is amplified by the cumulus merging processes, which are more important over small islands such as Java (or Sulawesi) than over large islands such as Borneo or Sumatra. Another process is the interaction between sea-breeze-driven and precipitation-driven cold pools that generates lines of strong horizontal moisture convergence (Dauhut et al., 2016). Thus, IWC increases proportionally with Prec, consistent with the results from Dion et al. (2019), and rapid convergence combined with deep convection transports elevated amounts of IWC at 13:30 LT (Fig. 3), producing high ΔIWC during the growing phase of the convection (Figs. 4 and 11) over Java.
8.2 West Sumatra Sea
In Sect. 4.2, it has been shown that the West Sumatra Sea is an area with a positive anomaly of Prec during the growing phase of the convection but a negative anomaly of IWC, which differs from other places. These results suggest that Prec is representative not only of convective precipitation, but also of stratiform precipitation. The diurnal cycle of stratiform and convective precipitation over West Sumatra Sea has been studied by Mori et al. (2004) using 3 years of TRMM Precipitation Radar (PR) datasets, following the 2A23 Algorithm (Awaka, 1998). Mori et al. (2004) have shown that rainfall over Sumatra is characterized by convective activity, with a diurnal maximum between 15:00 and 22:00 LT, while, over the West Sumatra Sea, the rainfall type is convective and stratiform, with a diurnal maximum during the early morning (as observed in Fig. 9). Furthermore, their analyses have shown a strong diurnal cycle of 200 hPa wind, humidity and stability, consistent with the PR over West Sumatra Sea and the island of Sumatra. Stratiform and convective clouds are both at the origin of heavy rainfall in the tropics (Houze and Betts, 1981; Nesbitt and Zipser, 2003) and in the West Sumatra Sea, but stratiform clouds are mid-altitude clouds in the troposphere and do not transport ice up to the tropopause. Thus, over the West Sumatra Sea, ΔIWC calculated from Prec is possibly overestimated because Prec includes a non-negligible amount of stratiform precipitation over this area.
8.3 North Australia Sea and seas with nearby islands
The comparisons between Figs. 2c and 6a have shown a strong daily mean of Flash (10−2–10−1 flashes d−1) but a low daily mean of Prec (2.0–8.0 mm d−1) over the North Australia Sea. Additionally, Fig. 11 shows that the strongest differences between ΔIWCPrec and ΔIWCFlash are found over the North Australia Sea, with ΔIWCFlash greater than ΔIWCPrec by 2.3 mg m−3 in the UT ( %) and by 0.4 mg m−3 in the TL ( %). These results imply that the variability range in our model is too large, highlighting the difficulty of estimating ΔIWC over this study zone. Furthermore, as for the Java Sea or Bismarck Sea, North Australia Sea is surrounded by several islands. According to a study by Pope et al. (2008), the cloud size is the largest during the afternoon over northern Australia land, during the night over the northern Australia coastline and during the early morning over the North Australia Sea. These results suggest that deep convective activity moves from the land to the sea during the night. Over the North Australia Sea, it seems that the deep convective clouds are mainly composed of storms with lightning, but precipitation is weak or does not reach the surface before evaporating.
The present study has combined observations of ice water content (IWC) measured by the Microwave Limb Sounder (MLS), precipitation (Prec) from the algorithm 3B42 of the Tropical Rainfall Measurement Mission (TRMM), and the number of flashes (Flash) from the Lightning Imaging Sensor (LIS) on board of TRMM, with IWC provided by the ERA5 reanalyses in order to estimate the amount of ice injected (ΔIWC) into the upper troposphere (UT) and the tropopause level (TL) over the MariCont, using the method proposed in a companion paper (Dion et al., 2019). The study is focused on the austral convective season of DJF from 2004 to 2017. In the model used (Dion et al., 2019), Prec is considered as a proxy for deep convection injecting ice (ΔIWCPrec) in the UT and the TL. ΔIWCPrec is firstly calculated by the correlation between the growing phase of the diurnal cycle of Prec from TRMM-3B42 (binned at 1 h resolution over the diurnal cycle) and the value of IWC measured by the MLS (IWCMLS, provided at the temporal resolution of two observations in local time per day) during the growing phase of the diurnal cycle of Prec. While Dion et al. (2019) have calculated ΔIWCPrec over large convective study zones in the tropics, we show the spatial distribution of ΔIWCPrec in the UT and the TL at 2∘ × 2∘ horizontal resolution over the MariCont, highlighting local areas of strong injection of ice up to 20 mg m−3 in the UT and up to 3 mg m−3 in the TL. ΔIWC injected into the UT and the TL has also been evaluated by using another proxy for deep convection: Flash measured by TRMM-LIS. The diurnal cycle of Flash has been compared to the diurnal cycle of Prec, showing consistencies in (1) the spatial distribution of Flash and Prec over the MariCont (maxima of Prec and Flash located over land and coastline) and (2) their diurnal cycles over land (similar onset and duration of the diurnal cycle increasing phase). Differences have been mainly observed over sea and coastline areas, with the onset of the diurnal cycle increasing phase of Prec delayed by several hours depending on the considered area (from 2 to 7 h) compared to Flash. ΔIWC calculated by using Flash as a proxy for deep convection (ΔIWCFlash) is compared to ΔIWCPrec over five islands and five seas of the MariCont. Over each study zone, the range of values between ΔIWCPrec and ΔIWCFlash, the observational ΔIWC range, allows us to characterize the uncertainty of our model. ΔIWC is also estimated from IWC provided by the ERA5 reanalyses (ΔIWCERA5 and IWCERA5, respectively) at 150 and 100 hPa over the study zones. We have also degraded the vertical resolution of IWCERA5 to be consistent with that of IWCMLS observations: 4 km at 146 hPa and 5 km at 100 hPa. The ΔIWC ranges calculated from observations and reanalyses were evaluated over the selected study zones (islands and sea).
With the study of ΔIWCPrec, results show that the largest amounts of ice injected into the UT and TL per 2∘ × 2∘ pixels are found over land and are shown to be related to (i) an amplitude of the Prec diurnal cycle larger than 0.5 mm h−1 and (ii) a duration of the growing phase of the convection longer than 9 h. ΔIWCPrec is typically smaller than ΔIWCFlash, with the two estimates differing by up to −22 % over land and up to −71 % over sea, excepted for the island of Java and Java Sea, where the two estimates differ by +7 and +6 % respectively. The larger differences between ΔIWCPrec and ΔIWCFlash over sea might be due to the combination of the presence of stratiform precipitation included in Prec and the very low values of Flash over seas ( flashes d−1 per pixel). The diurnal cycle of IWCERA5 at 150 hPa is more consistent with that of Prec and Flash over land than over ocean. Finally, the relative difference between ΔIWC estimated from observations and that estimated from reanalysis is, over land, 25 % in the UT and 49 % in the TL and, over sea, 96 % in the UT and 28 % in the TL. In light of these relative differences, ΔIWC estimates from observations and reanalysis are found to be fairly consistent over land in the UT and over land and sea in the TL but inconsistent over sea in the UT. Thus, considering the combination of the observational and reanalysis ΔIWC ranges, the total ΔIWC range has been found in the UT to be between 4.2 and 10.0 mg m−3 over land and between 0.4 and 4.4 mg m−3 over sea and, in the TL, between 0.5 and 3.9 mg m−3 over land and between 0.1 and 0.7 mg m−3 over sea. The impact of the vertical resolution on the estimation of ΔIWC has been found to be greater in the TL than in the UT.
The study at small scale over islands and seas of the MariCont has shown that ΔIWC from ERA5, Prec and Flash in the UT agree to within 0.1–1.0 mg m−3 over MariCont_L, Sumatra, Borneo and Java, with the largest values obtained over Java. Based on observations, Java presents the largest amount of ice in the UT and the TL (with the minimum values of the observational ΔIWC ranges over Java being larger than the maximum values of the observational ΔIWC ranges of other land study zones by more than 1.0 mg m−3 in the UT and more than 0.3 mg m−3 in the TL). Based on the reanalysis, New Guinea and Sulawesi reach similar ranges of ice injection in the UT and even larger ranges of values in the TL than Java, although it must be kept in mind that ERA5 IWC data have not yet been fully evaluated. Processes related to the largest amount of ΔIWC injected into the UT and the TL have been identified as the combination of sea breeze, mountain–valley breeze and merged cumulus, accentuated over small islands with high topography such as Java or Sulawesi.
| ΔIWC | Amount of ice injected by deep convection up to the study pressure level |
| ΔIWCPrec | ΔIWC estimated from Prec and from IWCMLS |
| ΔIWCFlash | ΔIWC estimated from Flash and from IWCMLS |
| ΔIWCERA5 | ΔIWC estimated from ERA5 reanalysis |
| 〈ΔIWCERA5〉 | ΔIWCERA5 degraded along the vertical at the study pressure level, consistent |
| with the MLS vertical resolution of IWCMLS | |
| DJF | December, January, February |
| Flash | Number of flashes |
| IWC | Ice water content |
| IWCERA5 | IWC from ERA5 reanalysis |
| IWCMLS | IWC measured by MLS |
| LS | Lower stratosphere |
| MariCont | Maritime Continent |
| MariCont_C | Coastlines of the Maritime Continent |
| MariCont_O | Maritime Continent ocean |
| MariCont_L | Maritime Continent land |
| MLS | Microwave Limb Sounder |
| NAusSea | North Australia Sea |
| Prec | Precipitation |
| TTL | Tropical tropopause layer |
| UT | Upper troposphere |
| UTLS | Upper troposphere and lower stratosphere |
| WSumSea | West Sumatra Sea |
| WV | Water vapour |
The observational datasets are available from the following websites: https://disc.gsfc.nasa.gov/datasets?age=1&keywords=ML2IWC_004 (Lambert et al., 2015, last access: 1 November 2020, IWC from MLS), https://trmm.gsfc.nasa.gov/publications_dir/ publications.html (Tropical Rainfall Measuring Mission (TRMM), 2011, last access: 20 November 2020, Prec from TRMM-3B42), https://ghrc.nsstc.nasa.gov/lightning/data/data_lis_trmm.html (Blakeslee, 1998, last access: 12 November 2020, Flash from TRMM-LIS), and https://cds.climate.copernicus.eu/cdsapp#!/dataset/reanalysis-era5-pressure-levels-monthly-means?tab=form (Hersbach et al., 2019, last access: 20 November 2020, IWC from ERA5).
IAD analysed the data, formulated the model and the method combining MLS, TRMM and LIS data and took primary responsibility for writing the paper. CD has treated the LIS data, provided the figures with Flash datasets, gave advice on data processing and contributed to the Prec and Flash comparative analysis. PR strongly contributed to the design of the study, the interpretation of the results and the writing of the paper. PR, FC, PH and TD provided comments on the paper and contributed to the writing.
The authors declare that they have no conflict of interest.
We thank the Centre National de la Recherche Scientifique-Institut National des Sciences de l'Univers (CNRS-INSU) and the Excellence Initiative (Idex) of Toulouse, France, for funding this study and the Turbulence Effects on Active Species in Atmosphere project (TEASAO; http://www.legos.obs-mip.fr/projets/axes-transverses-processus/teasao, last access: 21 May 2020, Peter Haynes Chaire d'attractivité). We would like to thank the teams that have provided the MLS data (https://disc.gsfc.nasa.gov/datasets?page=1&keywords=ML2IWC_004, last access: 1 November 2020), the TRMM data (https://pmm.nasa.gov/data-access/downloads/trmm, last access: 20 November 2019), the LIS data (https://ghrc.nsstc.nasa.gov/lightning/data/data_lis_trmm.html, last access: 12 November 2020) and the ERA5 Reanalysis data (https://cds.climate.copernicus.eu/cdsapp#!/dataset/reanalysis-era5-pressure-levels-monthly-means?tab=form, last access: 20 November 2020). We would like to thank both reviewers for their helpful comments and especially Michelle Santee for the many very detailed comments she provided that were invaluable in improving the study.
This research has been supported by the Centre National de la Recherche Scientifique-Institut National des Sciences de l'Univers (CNRS-INSU), Météo-France, and the Excellence Initiative (Idex) of Toulouse, France (grant no. 139225).
This paper was edited by Geraint Vaughan and reviewed by Michelle Santee and Emmanuel Rivière.
Awaka, J.: Algorithm 2A23 – Rain type classification, in: Proceedings of the symposium on the Precipitation Observation from Non-Sun Synchronous Orbit, Nagoya, Japan, 215–220, 1998.
Blakeslee, R. J.: Lightning Imaging Sensor (LIS) on TRMM Science Data 2004–2015, Dataset available online from the NASA Global Hydrology Resource Center DAAC, Huntsville, Alabama, USA, https://doi.org/10.5067/LIS/LIS/DATA201, 1998.
Christian, H. J.: Algorithm theoretical basis document (ATBD) for the Lightning Imaging Sensor (LIS), available at: https://eospso.gsfc.nasa.gov/sites/default/files/atbd/atbd-lis-01.pdf (last access: 20 November 2020), 2000.
Dauhut, T. ,Chaboureau, J.-P. , Escobar, J., and Mascart, P.: Giga-LES of Hector the Convector and its two tallest updrafts up to the stratosphere, J. Atmos. Sci., 73, 5041–5060, 2016. a
Dauhut, T., Chaboureau, J.-P., Mascart, P., and Lane, T.: The overshoots that hydrate the stratosphere in the tropics, EGU General Assembly, 4–13 April, 2018 in Vienna, Austria, EGU2018-9149, 2018. a
Dion, I.-A., Ricaud, P., Haynes, P., Carminati, F., and Dauhut, T.: Ice injected into the tropopause by deep convection – Part 1: In the austral convective tropics, Atmos. Chem. Phys., 19, 6459–6479, https://doi.org/10.5194/acp-19-6459-2019, 2019. a, b, c, d, e, f, g, h, i, j, k, l, m, n, o, p, q, r
Duncan, D. and Eriksson, P.: An update on global atmospheric ice estimates from observations and reanalyses, EGU General Assembly, 4–13 April 2018, Vienna, Austria, EGU2018-13448, 2018.
Forster, F. and Shine, P.: Radiative forcing and temperature trends from stratospheric ozone changes, J. Geophys. Res.-Atmos., 102, 10841–10855, 1997.
Fueglistaler, S., Dessler, A. E., Dunkerton, T. J., Folkins, I., Fu, Q., and Mote, P. W.: Tropical tropopause layer, Rev. Geophys., 47, 1, https://doi.org/10.1029/2008RG000267, 2009a. a
Geer, A. J., Baordo, F., Bormann, N., Chambon, P., English, S. J., Kazumori, M., Lawrence, H., Lean, P., Lonitz, K., and Lupu, C.: The growing impact of satellite observations sensitive to humidity, cloud and precipitation, Q. J. Roy. Meteor. Soc., 143, 3189–3206, 2017.
Hatsushika, H. and Yamazaki, K.: Inter-annual variations of temperature and vertical motion at the tropical tropopause associated with ENSO, Geophys. Res. Lett., 28, 2891–2894, 2001. a
Hersbach, H., de Rosnay, P., and Bell, B.: Operational global reanalysis: progress, future directions and synergies with NWP, European Centre for Medium Range Weather Forecasts ERA report series, N27, 2018. a
Hersbach, H., Bell, B., Berrisford, P., Biavati, G., Horányi, A., Muñoz Sabater, J., Nicolas, J., Peubey, C., Radu, R., Rozum, I., Schepers, D., Simmons, A., Soci, C., Dee, D., and Thépaut, J.-N.: ERA5 monthly averaged data on pressure levels from 1979 to present. Copernicus Climate Change Service (C3S) Climate Data Store (CDS), https://doi.org/10.24381/cds.6860a573, 2019.
Houze, R. A. and Betts, A. K.: Convection in GATE, Rev. Geophys., 19, 541–576, 1981. a
Huffman, G. J. and Bolvin, D. T.: Real-time TRMM Multi-satellite Precipitation Analysis data set documentation, available at: https://gpm.nasa.gov/sites/default/files/document_files/3B4XRT_doc_V7_180426.pdfhttps://gpm.nasa.gov/sites/ (last access: 10 April 2020), 2020. a
Huffman, G. J., Bolvin, D. T., Nelkin, E. J., Wolff, D. B., Adler, R. F., Gu, G., Hong, Y., Bowman, K. P., and Stocker, E. F.: The TRMM multi-satellite precipitation analysis (TMPA): quasi-global, multiyear, combined-sensor precipitation estimates at fine scales, J. Hydrometeorol., 8, 38–55, 2007. a
Huffman, G. J., Adler, R. F., Bolvin, D. T., and Nelkin, E. J.: The TRMM Multi-satellite Precipitation Analysis (TMPA) in Satellite rainfall applications for surface hydrology, in: Satellite Rainfall Applications for Surface Hydrology, edited by: Gebremichael, M. and Hossain, F., Springer, Dordrecht, The Netherlands, 3-22, 2010. a
Jensen, E. J., Ackerman, A. S., and Smith, J. A.: Can overshooting convection dehydrate the tropical tropopause layer?, J. Geophys. Res.-Atmos., 112, D11, https://doi.org/10.1029/2006JD007943, 2007. a
Lambert, A., Livesey, N., and Read, W.: MLS/Aura Level 2 Cloud Ice Product V004, Greenbelt, MD, USA, Goddard Earth Sciences Data and Information Services Center (GES DISC), https://doi.org/10.5067/Aura/MLS/DATA201, 2015.
Liu, C. and Zipser, E. J.: Global distribution of convection penetrating the tropical tropopause, J. Geophys. Res.-Atmos., 110, D23, https://doi.org/10.1029/2005JD006063, 2005. a
Liu, C. and Zipser, E. J.: Diurnal cycles of precipitation, clouds, and lightning in the tropics from 9 years of TRMM observations, Geophys. Res. Lett., 35, L04819, https://doi.org/10.1029/2007GL032437, 2008. a
Livesey, N. J., Read, W. G., Wagner, P. A., Froidevaux, L., Lambert, A., Manney, G. L., Millan, L. F., Pumphrey, H. C., Santee, M. L., Schwartz, M. J., Wang, S., Fuller, R. A., Jarnot, R. F., Knosp, B. W., Martinez, E., and Lay, R. R.: Version 4.2x Level 2 data quality and description document, Technical Report JPL D-33509 Rev. D, Jet Propulsion Laboratory, available at: http://mls.jpl.nasa.gov (last access: 1 September 2019), 2018. a
Love, B. S., Matthews, A. J., and Lister, G. M. S.: The diurnal cycle of precipitation over the Maritime Continent in a high-resolution atmospheric model, Q. J. Roy. Meteor. Soc., 137, 934–947, 2011. a
Millán, L., Read, W., Kasai, Y., Lambert, A., Livesey, N., Mendrok, J., Sagawa, H., Sano, T., Shiotani, M., and Wu, D. L.: SMILES ice cloud products, J. Geophys. Res.-Atmos., 118, 6468–6477, 2013. a
Mori, S., Jun-Ichi, H., Tauhid, Y. I., Yamanaka, M. D., Okamoto, N., Murata, F., Sakurai, N., Hashiguchi, H., and Sribimawati, T.: Diurnal land-sea rainfall peak migration over Sumatra island, Indonesian Maritime Continent, observed by TRMM satellite and intensive radio sonde soundings, Mon. Weather Rev., 132, 2021–2039, 2004. a, b, c, d
Nesbitt, S. W. and Zipser, E. J.: The diurnal cycle of rainfall and convective intensity according to three years of TRMM measurements, J. Climate, 16, 1456–1475, 2003. a, b
Petersen, W. A. and Rutledge, S. A.: Regional variability in tropical convection: observations from TRMM, J. Climate, 14, 3566–3586, 2001. a
Pope, M., Jakob, C., and Reeder, M. J.: Convective systems of the North Australian monsoon, J. Climate, 21, 5091–5112, 2008. a
Qian, J.-H.: Why precipitation is mostly concentrated over islands in the Maritime Continent, J. Atmos. Sci., 65, 1428–1441, 2008. a, b, c, d, e, f, g
Ramage, C. S.: Role of a tropical “Maritime Continent” in the atmospheric circulation, Mon. Weather Rev., 96, 365–370, 1968. a
Randel, W. J. and Jensen, E. J.: Physical processes in the tropical tropopause layer and their roles in a changing climate, Nat. Geosci., 6, 169–176, https://doi.org/10.1038/ngeo1733, 2013. a
Randel, W. J., Wu, F., Voemel, H., Nedoluha, G. E., and Forster, P.: Decreases in stratospheric water vapor after 2001: links to changes in the tropical tropopause and the Brewer-Dobson circulation, J. Geophys. Res.-Atmos., 111, D12, https://doi.org/10.1029/2005JD006744, 2006a. a
Sherwood, S. C.: A stratospheric “drain” over the Maritime Continent, Geophys. Res. Lett., 27, 677–680, 2000. a
Stenke, A. and Grewe, V.: Simulation of stratospheric water vapor trends: impact on stratospheric ozone chemistry, Atmos. Chem. Phys., 5, 1257–1272, https://doi.org/10.5194/acp-5-1257-2005, 2005.
Stephens, G. L. and Greenwald, T. J.: The earth’s radiation budget and its relation to atmospheric hydrology: 2. observations of cloud effects, J. Geophys. Res.-Atmos., 96, 15325–15340, 1991. a
Tropical Rainfall Measuring Mission (TRMM): TRMM (TMPA) Rainfall Estimate L3 3 hour V7, Greenbelt, MD, Goddard Earth Sciences Data and Information Services Center (GES DISC), https://doi.org/10.5067/TRMM/TMPA/3H/7, 2011.
Waters, J. W., Froidevaux, L., Harwood, R. S., et al.: The Earth Observing System Microwave Limb Sounder (EOS MLS) on the Aura satellite, IEEE T. Geosci. Remote, 44, 1075–1092, https://doi.org/10.1109/TGRS.2006.873771, 2006. a
Wu, D. L., Jiang, J. H., Read, W. G., Austin, R. T., Davis, C. P., Lambert, A., Stephens, G. L., Vane, D. G., and Waters, J. W.: Validation of the Aura MLS cloud ice water content measurements, J. Geophys. Res.-Atmos., 113, D15, https://doi.org/10.1029/2007JD008931, 2008. a
Wu, D. L., Austin, R. T., Deng, M., Durden, S. L., Heymsfield, A. J., Jiang, J. H., Lambert, A., Li, J.-L., Livesey, N. J., McFarquhar, G. M., Pittman, J. V., Stephens, G. L., Tanelli, S., Vane, D. G., and Waliser, D. E.: Comparisons of global cloud ice from MLS, CloudSat, and correlative data sets, J. Geophys. Res.-Atmos., 114, D8, https://doi.org/10.1029/2008JD009946, 2009. a
Yang, G.-Y. and Slingo, J.: The diurnal cycle in the tropics, Mon. Weather Rev., 129, 784–801, 2001. a, b
- Abstract
- Introduction
- Datasets
- Methodology
- Horizontal distribution of ΔIWC estimated from Prec over the MariCont
- Relationship between the diurnal cycle of Prec and Flash over MariCont land and sea
- Horizontal distribution of IWC from ERA5 reanalyses
- Ice injected over a selection of island and sea areas
- Discussion on small-scale convective processes impacting ΔIWC over a selection of areas
- Conclusions
- Appendix A: Main acronyms list
- Data availability
- Author contributions
- Competing interests
- Acknowledgements
- Financial support
- Review statement
- References