the Creative Commons Attribution 4.0 License.
the Creative Commons Attribution 4.0 License.
Ice injected into the tropopause by deep convection – Part 1: In the austral convective tropics
Iris-Amata Dion
Philippe Ricaud
Peter Haynes
Fabien Carminati
Thibaut Dauhut
The contribution of deep convection to the amount of water vapour and ice in the tropical tropopause layer (TTL) from the tropical upper troposphere (UT; around 146 hPa) to the tropopause level (TL; around 100 hPa) is investigated. Ice water content (IWC) and water vapour (WV) measured in the UT and the TL by the Microwave Limb Sounder (MLS; Version 4.2) are compared to the precipitation (Prec) measured by the Tropical Rainfall Measurement Mission (TRMM; Version 007). The two datasets, gridded within 2∘ × 2∘ horizontal bins, have been analysed during the austral convective season, December, January, and February (DJF), from 2004 to 2017. MLS observations are performed at 01:30 and 13:30 local solar time, whilst the Prec dataset is constructed with a time resolution of 1 h. The new contribution of this study is to provide a much more detailed picture of the diurnal variation of ice than is provided by the very limited (two per day) MLS observations. Firstly, we show that IWC represents 70 % and 50 % of the total water in the tropical UT and TL, respectively, and that Prec is spatially highly correlated with IWC in the UT (Pearson's linear coefficient R=0.7). We propose a method that uses Prec as a proxy for deep convection bringing ice up to the UT and TL during the growing stage of convection, in order to estimate the amount of ice injected into the UT and the TL, respectively. We validate the method using ice measurements from the Superconducting Submillimeter-Wave Limb-Emission Sounder (SMILES) during the period DJF 2009–2010. Next, the diurnal cycle of injection of IWC into the UT and the TL by deep convection is calculated by the difference between the maximum and the minimum in the estimated diurnal cycle of IWC in these layers and over selected convective zones. Six tropical highly convective zones have been chosen: South America, South Africa, Pacific Ocean, Indian Ocean, and the Maritime Continent region, split into land (MariCont-L) and ocean (MariCont-O). IWC injection is found to be 2.73 and 0.41 mg m−3 over tropical land in the UT and TL, respectively, and 0.60 and 0.13 mg m−3 over tropical ocean in the UT and TL, respectively. The MariCont-L region has the greatest ice injection in both the UT and TL (3.34 and 0.42–0.56 mg m−3, respectively). The MariCont-O region has less ice injection than MariCont-L (0.91 mg m−3 in the UT and 0.16–0.34 mg m−3 in TL) but has the highest diurnal minimum value of IWC in the TL (0.34–0.37 mg m−3) among all oceanic zones.
- Article
(6015 KB) - Full-text XML
- Companion paper
- BibTeX
- EndNote
Water vapour (WV) is one of the main greenhouse gases and has an important impact on the climate, particularly in the tropics. WV concentrations are limited by temperature, which regulates the saturation mixing ratio in air masses (Hartmann et al., 2001; Fueglistaler et al., 2009; Khaykin et al., 2013). In consequence, WV is much smaller in the upper troposphere (UT) and stratosphere than in the lower troposphere. However, despite the small concentrations, the WV distribution in the tropical upper troposphere (e.g. Soden et al., 2008) and stratosphere (e.g. Solomon et al., 2010) plays an important role in climate, including the determination of the overall radiative balance of the troposphere. The WV distribution in this region of the atmosphere is strongly coupled to the distribution of cirrus clouds which, despite being thin, can have a significant effect on the overall thermal balance of the troposphere (e.g. Zhou et al., 2014). The tropical upper stratosphere and lower stratosphere recognised as a distinct region of the atmosphere – the tropical tropopause layer (TTL) – is defined by the layer between the level of maximum convective outflow (10–12 km, ∼200 hPa) that closely corresponds to a minimum in ozone and the cold point tropopause (CPT) (16–17 km, ∼100 hPa) (Gettelman and Forster, 2002; Mehta et al., 2008; Birner and Charlesworth, 2017). Within the TTL, a complex set of physical processes interact to determine the distribution of temperature, WV and clouds, and other radiatively active chemical species (e.g. Fueglistaler et al., 2009; Randel and Jensen, 2013). The TTL is important in determining several aspects of troposphere–stratosphere exchange and therefore determining the chemical composition of the stratosphere. Much attention has therefore been focused on the role of TTL processes in setting the value of WV concentrations that enter the stratosphere. In particular, there has been an ongoing debate of the relative importance of large-scale processes in which air masses move slowly from the troposphere to the stratosphere within the large-scale three-dimensional circulation and dehydrate as they encounter very cold temperatures and small-scale processes, in which convection injects WV (and ice) directly into the TTL, and the stratosphere, with potentially hydrating impact. The relative importance of the three-dimensional circulation processes and convective processes continues to be debated (e.g. Alcala and Dessler, 2002; Liu and Zipser, 2005; Carminati et al., 2014).
For instance, Ueyama et al. (2015) have shown that tropical waves dehydrate the TTL by 0.5 ppmv, while the cloud microphysical processes and convection moisten the TTL by 0.7 and 0.3 ppmv, respectively. Some authors have shown that fast overshoots from deep convection transport water upward very rapidly (from a few minutes to 1 h) into the stratosphere (Pommereau, 2010; Dauhut et al., 2015). Liu and Zipser (2005) have found that 1.3 % of tropical convection systems reach 14 km, and 0.1 % of them may even penetrate the 380 K potential temperature level, which corresponds to the CPT. Avery et al. (2017) have also suggested that tropical convective ice cloud and associated cirrus sublimating at unusually high altitudes might also have a role in stratospheric hydration. The other path for water entering the lower stratosphere (LS) is the slow vertical advection (300 m per month) governed by radiative heating (Holton and Gettelman, 2001; Gettelman and Forster, 2002; Corti et al., 2006; Fueglistaler et al., 2009). Once in the UT or the TTL, the amount of the relative humidity of the layer impacts the ice nucleation, growth, and sedimentation (Peter et al., 2006).
Whilst there is observational evidence for convective hydration events (Liu and Zipser, 2005; Pommereau, 2010; Avery et al., 2017), and convective hydration of the stratosphere has been clearly corroborated by state-of-the-art numerical simulations (e.g. Dauhut et al., 2015), the quantitative role of convective hydration in determining water vapour concentrations in the main body of the stratosphere remains uncertain. One approach has been to combine observational estimates of overshooting convection frequency with information from short-localised-duration numerical simulations. Using this approach, Dauhut et al. (2015) have estimated that 18 % of the water mass flux across the 380 K potential temperature level is due to overshooting deep convection. Another has been to include estimates of convective penetration, e.g. from satellite observations, in large-scale trajectory calculations. The conclusions are sensitive to the assumptions made, but, for example, Wright et al. (2011) and Schoeberl et al. (2018) both conclude that the effect of convective penetration on WV concentrations in the stratosphere is very weak, essentially because most air masses that are moistened by convective injection are subsequently dehydrated when they encounter cold temperatures on a large scale before they reach the main body of the stratosphere.
Whether or not convective processes play a direct role in determining stratospheric WV concentrations, it is clear that, moving from the lower TTL to the upper TTL, convective-scale processes play an increasingly important role in determining the distributions of WV and of cirrus. Representing convective-scale processes in global models used for weather climate prediction is challenging, and it is important where possible to evaluate model representations by finding observed characteristics of WV and cirrus in the TTL that can be usefully compared to model simulations. One opportunity is provided by diurnal variations. The timescale is of course very different to the decadal and longer timescales of interest in climate prediction, but the short timescale has the advantage of providing time series with many cycles which is therefore well characterised statistically. The diurnal cycle is one of the most fundamental modes of variability of the global climate system and is associated with large and well-defined variations in the solar forcing (Yang and Slingo, 2001). The amplitude of the surface thermal diurnal cycles in the tropics is 10 times stronger than the amplitude of the surface thermal annual cycle (Beucher, 2010), and the diurnal cycle of deep convection is mainly governed by the surface thermal diurnal cycle. Understanding the diurnal cycle of the total water in the tropical UT, TTL, and LS contributes to the characterisation of the total water exchange between the UT and the LS in the tropics. Many studies (e.g. Jiang et al., 2015) have shown that the diurnal cycle of ice in the UT is linked to the diurnal cycle of the convection. The maximum of deep convection in the UT has been shown to peak in the local afternoon over land and in the local early morning over ocean (Liu and Zipser, 2005). Based on these studies and data from the space-borne Microwave Limb Sounder (MLS) instrument, Carminati et al. (2014) studied the diurnal cycle of WV and ice in the TTL over Africa and South America and have shown the presence of a strong diurnal signal over the two continents. Suneeth et al. (2017) have shown the differences in the diurnal cycles of CPT altitudes and CPT temperatures over tropical land and ocean. The diurnal cycle of temperature has also been studied in the TTL (Khaykin et al., 2013), showing that the amplitude of temperature anomalies increases with the intensity of the convection.
In summary, the processes driving the total water diurnal cycle are different in the UT and at the tropopause layer; e.g. only the deepest convection directly impacts water content in the tropopause layer, and saturation is more frequent in the tropopause layer than in the UT. Since the total water diurnal cycle in the tropopause layer is still not well described in global models (Jiang et al., 2015), space-borne observations may improve our understanding of the processes occurring in this layer. This provides motivation for the study presented in this paper, in which we consider the diurnal cycle of ice in the TTL, for which limited, but nonetheless valuable, data are provided by the MLS instrument.
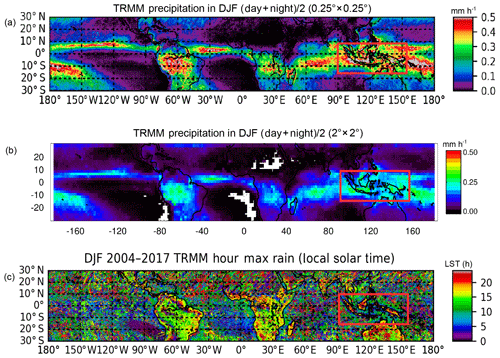
Figure 1(a) Daily averaged () precipitation measured by the TRMM at 0.25∘ × 0.25∘ resolution (mm h−1), (b) daily averaged () precipitation at 2∘ × 2∘ resolution (mm h−1), and (c) hour of diurnal maximum precipitation at 0.25∘ × 0.25∘ resolution (h in local solar time, LST) in DJF over the period 2004–2017. The red box surrounds the MariCont region.
The aim of the present study is to quantify the role of deep convection in the hydration and dehydration of the TTL. For this, we focus on the diurnal injection of ice into the tropical UT and the tropopause layer from the deep convective activity and address the question relative to the diurnal cycle of total water over tropical deep convective areas.
Africa and South America are two land regions of intense deep convective activity in the tropics, together with the Maritime Continent region (MariCont, the region made up of lands and oceans, between the Indian Ocean and the western Pacific, presented by the red box in Fig. 1). However, the deep convective systems occur more frequently and strongly over the MariCont region (Liu and Zipser, 2015) than over the other continental zones. It is known that excess of energy received by tropical surfaces is mainly balanced and transferred over land by convection toward mid-latitudes and over ocean by both convection and oceanic circulation. However, over the MariCont region, sea and ocean currents transferring energy toward mid-latitudes are slowed down and blocked by thousands of islands. Consequently, the excess of energy in the oceanic surface over the MariCont region is mainly balanced by transfer from convection. The diurnal cycle of WV and ice has already been studied over Africa and South America and over the whole tropical band (see, for example, Liu et al., 2007; Millán et al., 2013; Carminati et al., 2014). The MariCont region is the driest and coldest area at the CPT, and the water budget in the TTL over the MariCont region separating MariCont land and MariCont ocean is still unknown. Furthermore what the physical mechanism is governing the diurnal cycle of convection and surface precipitation over ocean is still an open question.
In order to understand the total water diurnal cycle up to the TTL, we first use 13 years of the ice water content (IWC) and WV measurements from the MLS (Version 4.2x) and surface precipitations (Prec) from the TRMM instrument. Then, we use WV, IWC, total water (), relative humidity with respect to ice (RHI), and temperature (TEMP) from the MLS and Prec from the TRMM over the period 2004 to 2017 in order to better understand the water fraction () in the UT (∼146 hPa) and the tropopause level (TL; ∼100 hPa, around the CPT). The relationships between surface precipitation and the processes in the UT and the TL are investigated. Our study intends to evaluate the mechanisms affecting the diurnal cycle of total water in the TL above land and ocean with a particular emphasis over the MariCont region due to its topographical complexity. Thus, the diurnal cycle of ice (provided by the MLS but with very poor time resolution) is improved and better understood thanks to the relation with the diurnal cycle of precipitation (provided by the TRMM with a much better time resolution).
The main instruments used are presented in Sect. 2. The methodology developed to establish the link between the diurnal cycle of surface processes and the diurnal cycle of water in the UT and TL is presented in Sect. 3. The estimated diurnal injection of IWC in the UT and TL from deep convective activity is presented in Sect. 4. Finally, the influence of the convective dissipating stage on the decreasing phase of the IWC diurnal cycle in the UT and the TL is discussed in Sect. 5, and conclusions will be drawn in Sect. 6. This paper contains many abbreviations and acronyms. To facilitate reading, we compile them in the Appendix.
2.1 MLS
The MLS is a microwave instrument aboard the NASA's Earth Observing System (EOS) Aura platform (Livesey et al., 2017), measuring in a limb viewing geometry to maximise signal intensities and vertical resolution. The MLS instrument is aboard a sun-synchronous near-polar orbiter completing 233 revolution cycles every 16 d, giving a daily global coverage with about 14 orbits. Aura crosses the Equator at 01:30 local time (LT) and 13:30 LT. Among all the atmospheric parameters measured by the MLS, we focus on IWC, WV, TEMP, and RHI. Although IWC (mg m−3) is valid between 215 and 82 hPa, the number of scientifically exploitable measurements at 82 hPa within a 2∘ × 2∘ pixel is not significant. In our study, we will only use two levels to analyse IWC, at 180 and 100 hPa. WV (ppmv) is valid between 316 and 0.002 hPa, TEMP (K) between 261 and 0.001 hPa, and RHI (%) between 1000 and 1.0 hPa. The MLS IWC sensitivity thresholds are 0.1 mg m−3 in the UT and 0.02 mg m−3 in the TL (Livesey et al., 2017) and will imply an underestimation of the IWC measured values.
The MLS v4.2x data processing validated by Livesey et al. (2017) presents significant and minor differences with the previous MLS version. The total random noise in v4.2x IWC is larger than in v2.2. Compared with v3.3 of the MLS (used for instance in Carminati et al., 2014), v4.2 improves IWC composition profiles in cloudy regions, especially in the upper troposphere over the tropics, and improves the WV at global scale (Livesey et al., 2017).
Level 2 data quality tests (filter and data screening) from the v4.2x have been applied to WV, IWC, RHI, and TEMP as suggested by Livesey et al. (2017). The MLS measurements estimated from the averaging kernels (Livesey et al., 2017) are used to characterise the distribution of the four parameters on two layers: one at 146 hPa (UT) and one at 100 hPa (TL). The vertical resolution of the IWC measurements is ∼3 km; the horizontal resolution is ∼300 and 7 km along and across the track, respectively. The WV vertical resolution is 2.5±1.2 km, and the WV along-track horizontal resolution is between 170 and 350 km. The TEMP vertical resolution is 4.5 km.
In the study of Carminati et al. (2014), a 10∘ × 10∘ resolution was chosen with 7 years of MLS data processed with Version 3.3 (v.3.3). In our study, MLS data have been averaged over a much longer period (2004 to 2017) at a much higher horizontal resolution of 2∘ × 2∘ ( km). In each 2∘ × 2∘ bin, and for the 13-year average, any bin with fewer than 60 measurements in the daytime (day at 13:30 LT) or the nighttime (night at 01:30 LT) is excluded in order to obtain significant statistics. Thus, the maximum measurements per bin during the 13-year period is ∼470, and the minimum is fixed to be 60. The number of measurements over the MariCont region is on average the lowest over the tropics. Consistent with Carminati et al. (2014) and Liu and Zipser (2005), we use the difference between the MLS measurements performed during the day and the night to study the “day minus night” (day−night) signal.
2.2 TRMM
The TRMM satellite was launched in November 1997 (https://trmm.gsfc.nasa.gov/publications_dir/publications.html, last access: April 2019). The TRMM carried five instruments: a 3-sensor rainfall suite, the precipitation radar, the TRMM Microwave Imager, the Visible and Infrared Scanner, and two related instruments, the Lightning Imaging Sensor and the Clouds and the Earth's Radiant Energy System. In our study, we use Algorithm 3B42 which produces high-quality infrared precipitation and root-mean-square precipitation-error estimation from the TRMM Version 007. The rainfall level 3 measurements (mm h−1) are vertically integrated precipitation (Prec). TRMM Prec data are provided in the tropics within a 0.25∘ × 0.25∘ horizontal resolution extending from 50∘ S to 50∘ N. TRMM datasets used in our study are in coincidence with the MLS period of measurements from 2004 to 2017. In order to compare to the MLS measurements, we degraded the TRMM resolution to 2∘ × 2∘ in averaging the TRMM measurements in each 2∘ × 2∘ box of the MLS. Furthermore, as the TRMM follows an orbit precession, shifting a few minutes per day, the 24 h diurnal cycle can be averaged over the period of study, with 1 h resolution over the 24 h diurnal cycle.
2.3 SMILES
The Superconducting Submillimeter-Wave Limb-Emission Sounder (SMILES) was a Japanese atmospheric limb sounding instrument on board the International Space Station (ISS) platform. SMILES measurements of ice are used in this study. The instrument measured IWC between 120 and 80 hPa and the measurement of tropospheric ice, the partial ice water path (pIWP), integrated between 1000 and 180 hPa, during the short period of October 2009 to April 2010. As the ISS follows a low Earth orbit, with about 15 orbits a day, the ice measurements in the troposphere and tropopause layer over the entire 40∘ N–40∘ S band can be provided in about 2 months. Thus, the austral convective season of DJF is enough to cover the entire tropical band. Furthermore, as each orbit drifts about 20 min earlier each day, the entire diurnal cycle of ice can be provided during this period. In the present study, SMILES measurements will be used as a reference of the diurnal cycle of ice and will be compared to the climatology of the diurnal cycle of ice estimated in the UT and the TL.
In this section, we analyse the relationships between Prec and the water budget in the UT and the TL during the DJF season, a highly convective season of the Southern Hemisphere. Deep convection can affect water vapour and ice in the UT and the TL, whereas Prec measurements include the contribution of both shallow convection (that does not reach the UT) and deep convection (reaching the UT and the TL).
3.1 Tropical distribution of Prec and water budget in the UT and TL
The daily averaged () Prec measured by the TRMM at the resolution of 0.25∘ × 0.25∘ and 2∘ × 2∘ (the same horizontal resolution as the MLS) is shown in Fig. 1a and b, respectively. The fine structure of the horizontal distribution of Prec at the high resolution (0.25∘ × 0.25∘) over South Africa, South America, the western Pacific Ocean, and the Maritime Continent is degraded when considering Prec at low resolution (2∘ × 2∘). Figure 1c presents the local solar time (evaluated for each bin of 0.25∘ × 0.25∘) at which the diurnal cycle of Prec reaches its maximum in TRMM observations, showing the large variability and complexity of the diurnal maximum of Prec over the tropics. The daily averages of IWC, WV, the IWC fraction (), TEMP, and RHI from the MLS in the tropics are shown in Fig. 2 for the UT (at 146 hPa) and Fig. 3 for the TL (100 hPa).
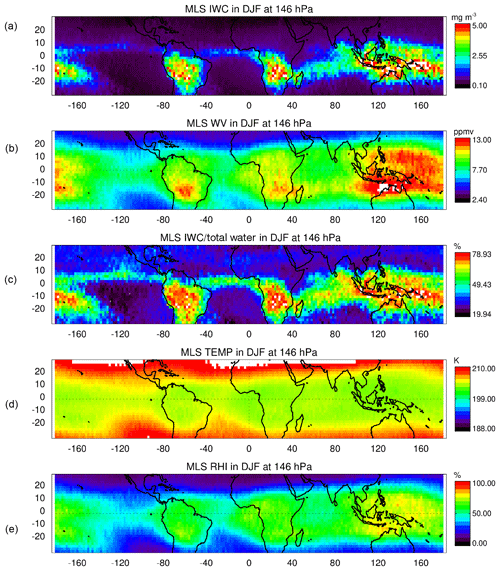
Figure 2(a) Daily averaged () ice water content (IWC), (b) water vapour (WV), (c) IWC fraction (), (d) temperature, and (e) relative humidity with respect to ice (RHI) in the upper troposphere (146 hPa) measured by the MLS over the tropics in DJF over the period 2004–2017.
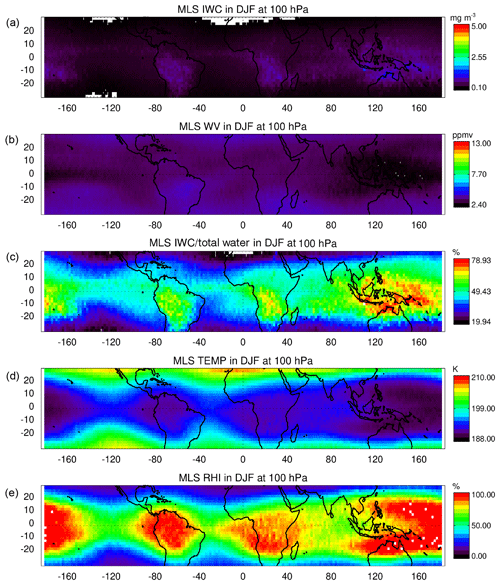
Figure 3(a) Daily averaged () ice water content (IWC), (b) water vapour (WV), (c) IWC fraction (), (d) temperature, and (e) relative humidity with respect to ice (RHI) in the tropopause layer (100 hPa) measured by the MLS over the tropics in DJF over the period 2004–2017.
In DJF, local maxima of Prec (Fig. 1), IWC, WV, the IWC fraction, and RHI in the UT (Fig. 2) are found over the main convective areas: South America, South Africa, MariCont, northern Australia, and along the intertropical convergence zone (ITCZ) and the South Pacific convergence zone (SPCZ). Maximum values of Prec, IWC, WV, and RHI over the whole tropics are located over the MariCont (and northern Australia) (Figs. 1a and b and 2a, b, c and e). Minima of Prec, IWC, WV, the IWC fraction, and RHI are found over the eastern Pacific Ocean and South Atlantic Ocean. Over the MariCont region, we observe the maximum of tropical IWC and the minimum of temperature (Fig. 2a and d). The IWC fraction shows that, over the region of high Prec (>0.20 mm h−1), up to 70 % of the ∑W is composed of ice. The RHI is higher over land than over ocean but never exceeds 100 % at 146 hPa, on average at 2∘ × 2∘ resolution (consistent with the RHI tropical vertical profile shown by Fueglistaler et al., 2009). The MariCont region exhibits the highest RHI, with values close to 100 %. In summary, there is a strong spatial link between Prec and water (IWC and WV) in the UT.
In the TL (Fig. 3), IWC is lower than in the UT (∼3 mg m−3 at 146 hPa vs. <1 mg m−3 at 100 hPa), but the horizontal distribution of IWC is correlated with the horizontal distribution of Prec and shows maxima over South America, South Africa, the MariCont region, and the western Pacific Ocean. The main difference between the UT and the TL is the minimum of WV observed over the MariCont region (>8 ppmv at 146 hPa and <3 ppmv at 100 hPa). With the decrease of temperature from the UT to the TL (Figs. 2 and 3) and the associated decrease of WV at saturation, the observed WV decreases by more than 11 ppmv over the MariCont region and by around 5 ppmv in other regions. In the TL, the IWC and the fraction of water in the ice form is larger over MariCont (beyond 1 mg m−3 and near 78 %, respectively) than elsewhere in the tropics. RHI in the TL reaches high values (RHI∼100 %), highlighting a saturated environment over central South America, Africa, the east of MariCont, and the western Pacific Ocean. In comparison to other tropical regions, the larger IWC over the MariCont can be explained by (i) the larger condensation of water vapour associated with the larger temperature drop from the UT to the TL and (ii) a larger transport of ice into the TL by deep convection.
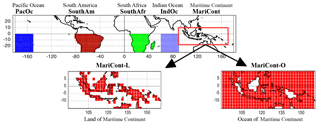
To investigate the vertical distribution and the diurnal cycles of water species in the TL, we have defined, from results presented in Figs. 1–3, seven tropical convective zones, shown in Fig. 4: South America (SouthAm; 0∘ N–30∘ S), South Africa (SouthAfr; 0∘ N–30∘ S), Pacific Ocean (PacOc; 0∘ N–30∘ S; 180∘ W–150∘ W), Indian Ocean (IndOc; 0∘ N–30∘ S; 60∘ E–90∘ E), MariCont (10∘ N–15∘ S; 90∘ E–160∘ E), MariCont land (MariCont-L), and MariCont ocean (MariCont-O). Land and ocean over the study zones have been separated using the Solar Radiation Data (SoDa; http://www.soda-pro.com/web-services/altitude/srtm-in-a-tile, last access: April 2019), providing a TIFF image with values from the Shuttle Radar Topography Mission (SRTM) digital elevation model. Each zone is defined at a horizontal resolution of 2∘ × 2∘.
3.2 Water budget in the UT and the TL
To investigate the processes in the UT and TL which drive the water budget, the vertical profiles of TEMP, WV, IWC, and RHI are shown for the different study zones in Fig. 5. To complete the comparison between the study zones, the DJF average of the tropopause pressure level is represented over all the tropics in Fig. 6 from the National Centers For Environmental Prediction (NCEP).
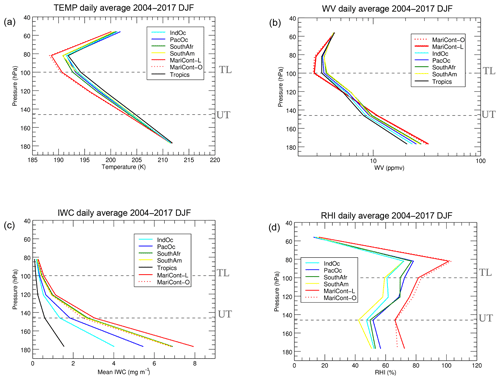
Figure 5Vertical profiles of (a) temperature, (b) water vapour (WV), (c) ice water content (IWC), and (d) relative humidity with respect to ice (RHI) from MLS data averaged from 2004 to 2017 in DJF over the six study zones: IndOc (light blue), PacOc (dark blue), SouthAfr (green), SouthAm (yellow), tropics (black), MariCont-L (red solid line), and MariCont-O (red dashed line).

Figure 6Pressure of the tropopause (hPa) over the tropics during DJF from 2004 to 2017, defined from the NCEP datasets.
In Fig. 5a, the tropical CPT is found between 100 and 80 hPa, consistent with previous results presented in, for example, Fueglistaler et al. (2009) and Kim and Son (2012). The tropical tropopause defined by NCEP (Fig. 6) is close to the level given by the MLS at 100 hPa, which we named the TL in this study (∼100–115 hPa). Furthermore, the tropopause pressure shown in Fig. 6 is lower (higher altitude) over ocean than over land, while the pressure at the tropopause over the western Pacific, the southern region of the Arabian Peninsula, and Caribbean Sea is the lowest (∼105 hPa). Furthermore, the tropopause is the coldest (Fig. 5a) and has the highest pressure (lower altitude) (Fig. 6) over the MariCont. Regarding WV, the tropical UT is more humid than the TL: the decrease from the UT at 146 hPa to the TL at 100 hPa is about 7 ppmv for WV and 1 mg m−3 for IWC (the two dashed lines in Fig. 5b and c, respectively). These results are consistent with previous studies, all presented in Fueglistaler et al. (2009).
RHI is lower in the UT than the TL by ∼10 % (Fueglistaler et al., 2009) (Figs. 2d and 3d, respectively). Since the UT is on average sub-saturated, convective-lifted ice can sublimate and can be seen as a source of WV. In the TL, as the atmosphere is on average close to saturation (RHI∼100 %) over SouthAm, SouthAfr, MariCont, and the western Pacific Ocean (Fig. 3), the convective-lifted ice is statistically more often transported into a saturated or supersaturated region. In such a context, the associated ice hydrometeors grow and sediment and can also be transported down by convective downdrafts. These processes contribute to the loss of ice in this layer. Furthermore, the TL is the level of greatest dehydration because of supersaturation with respect to ice (Jensen et al., 1996, 2005). In supersaturation conditions, the excess of water vapour can condensate on existing ice crystals (or form new ones in the presence of a condensation nucleus), allowing ice crystals to grow and sediment, which dehydrates the layer. Conversely, hydration may occur in the LS (if reached by convection) because this layer is subsaturated with respect to ice (Khaykin et al., 2009; Allison et al., 2018; Dauhut et al., 2017).
3.3 Spatial correlation between Prec and water in the UT
This section presents the relationship between deep convection and the water vapour and ice injected into the UT. We have calculated the Pearson linear correlation coefficient R between the horizontal distribution of Prec and both IWC and WV at 146 hPa during the day, the night, and the day−night over the study zones (see Table 1). We denote Prec, IWC, and WV at 146 hPa during the day, night, and day−night, by Precx, , and , respectively (where x=day, night, or day−night). The spatial correlation between IWC and Prec is defined by the following equation:
where αx is the regression coefficient, and βx is the offset.
Table 1Pearson's linear correlation coefficient R, regression coefficient α (), and the offset β (mg m−3) from the correlation between precipitation and ice water content (IWC), and water vapour (WV) in the upper troposphere (UT, at 146 hPa), at day, night, and day−night over the seven tropical zones and the average over the six zones (μ6zones).
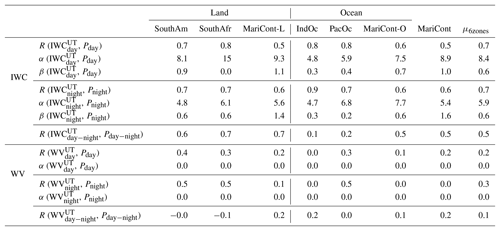
The spatial correlation for the six zones is shown in Table 1. The spatial correlation of and with Prec is high (R∼0.7–0.9) over SouthAm, SouthAfr, PacOc, and IndOc and smaller (R∼0.5–0.6) over the MariCont region (MariCont-L, MariCont-O, and MariCont). The spatial inhomogeneity of the MariCont surface with thousands of islands, seas, and coastal areas may probably explain the lower space correlation between Prec and IWC146. The regression coefficient between Precx and IWCx (Table 1), αx, can be interpreted as the efficiency of the convective system to inject ice in the UT. Comparing αx in day and night conditions, SouthAfr, SouthAm, MariCont-L, MariCont-O, and MariCont stand out with larger day values (αD=7.5–15.0 ) than IndOc and PacOc or than night values (αx=4.7–7.7 ). Over land, all regions under consideration show a better efficiency of injecting ice into the UT during the day than during the night. βx is considered as the IWC background. Over land and ocean regions, βx is close to zero. βday is the highest over the MariCont-L (1.1 mg m−3) and null over SouthAm (0.0 mg m−3). Over the oceans, there is no significant differences between βday and βnight for the injected ice in the UT, except over PacOc.
Following Liu and Zipser (2009) and Carminati et al. (2014), we also study the difference between day and night, to obtain information on the IWC146 diurnal cycle. Figure 7 shows the Precday−night, , and , respectively. Convective regions such as SouthAm and SouthAfr, even along the ITCZ, are characterised by a positive day−night signal in Precday−night and with values greater than 0.10 mm h−1 and 0.20 mg m−3, respectively (Fig. 7a and b). The spatial correlation R between Precday−night and is greater over the three land zones (R≥0.6–0.7) than over the three ocean zones (R≤0.1–0.5). The MariCont-O region shows the highest oceanic correlation (R∼0.5) compared to the PacOc and IndOc regions (R=0.2 and 0.1, respectively). The low R values over IndOc and PacOc could be explained by (i) the low IWCday−night variability compared to the high Precday−night variability observed over ocean and (ii) the low amplitude of the deep convection diurnal cycle over ocean (Liu and Zipser, 2005). We could hypothesise that IWC146 over the MariCont-O is more influenced by local deep convection than over IndOc and PacOc. However, considering IWC146 and Prec during the day and night independently, we find good correlation over the ocean (∼0.6–0.8 mg m−3).
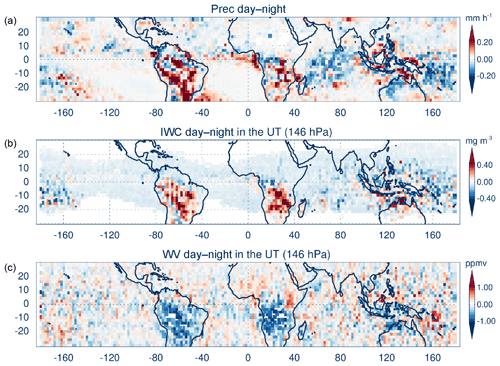
Figure 7Day−night of (a) precipitation (Prec) from the TRMM, (b) ice water content (IWC) from the MLS at 146 hPa, and (c) water vapour (WV) from the MLS at 146 hPa over the tropics and the period 2004–2017 in DJF.
The spatial correlation R between Precx and remains low in all configurations, with values of 0.0–0.5 (Table 1). The spatial correlation between the and Precday−night shows an average over the seven study zones of μzones∼0.07 with small negative correlations over SouthAm and SouthAfr and with a regression coefficient αx between WV146 and Prec calculated to be αx=0 (Table 1). We conclude that WV is not spatially correlated with the diurnal cycle of deep convection. These results are consistent with results from Liu and Zipser (2009) and Carminati et al. (2014) showing that the day−night signal of WV measured by the MLS is very different with the day−night signal of IWC measured by the MLS in the UT over land.
Deep convection does not inject WV directly into the UT, but it injects ice, which then may sublimate into WV. Modelling studies with cloud resolving models illustrate the sequence of mechanisms (ice uplift, mixing, sublimation) that leads convection to hydrate initially subsaturated layers (Dauhut et al., 2015, 2018; Lee et al., 2018). In Dauhut et al. (2015), the onset of the WV increase is delayed by 1–3 h with respect to the onset of deep convection (∼12:00 LT). Such a delay can explain why and Precday, night are not spatially correlated in observations (R∼0.2), while the space correlation R between and Precday, night is stronger (R∼0.7). For this reason, we now focus on the diurnal cycle of ice and on the amount of ice injected into the UT and the TL by deep convective systems traced by Prec.
3.4 Diurnal cycle of Prec
This section presents the diurnal cycle of Prec over the six study zones during the Southern Hemisphere convective season (DJF) from 2004 to 2017 over land and ocean, respectively (Fig. 8a and b).
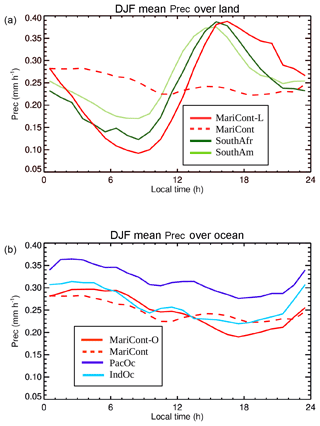
Figure 8Diurnal cycle of precipitation (Prec) over (a) the land study zones and (b) the ocean study zones during the period DJF 2004–2017.
Over land, the amplitude (peak to peak) of the Prec diurnal cycle varies between 0.2 and 0.3 mm h−1, with simultaneous minima between 08:00 and 09:00 LT within the regions. The MariCont-L area shows the driest minimum (0.09 mm h−1) and the wettest and latest maximum (16:00–17:00 LT, 0.385 mm h−1). SouthAm and SouthAfr maxima are found at 14:00–15:00 LT and 15:00–16:00 LT, respectively.
Over ocean, the amplitude of the Prec diurnal cycle varies between 0.08 and 0.1 mm h−1, with simultaneous minima between 17:00 and 18:00 LT. However, the maxima are spread between 01:00 and 06:00 LT.
The main differences between Prec diurnal cycle over tropical ocean and land are that (i) there is a morning maximum over ocean compared to early afternoon over land, (ii) the peak-to-peak diurnal cycle of Prec is larger over land than over ocean, and (iii) minima can be twice lower over land (0.1 mm h−1) than over ocean. The comparison of the Prec diurnal cycle over MariCont and MariCont-O or MariCont-L highlights the importance of analysing the diurnal cycle over land and over ocean in this region separately because MariCont-O and MariCont-L have two distinct behaviours which are hidden when the diurnal cycle is only considered over the MariCont global area.
3.5 Time correlation between Prec and IWC during the growing convective phase in the UT
In this section, we quantify the link between deep convection reaching the UT and Prec. The diurnal cycle of Prec is compared to the diurnal cycle of the frequency of overshooting precipitation feature (OPF) events (i.e. the proportion of all OPF events that occur in various ranges of time of day, adapted from Fig. 3 of Liu and Zipser (2005) from global satellite radar measurements) over land (Fig. 9a) and ocean (Fig. 9b) in the tropical band (20∘ S–20∘ N). The OPFs considered by Liu and Zipser, 2005, are tropical deep convective systems penetrating the tropical TL (called Ztropopause in Liu and Zipser, 2005). The OPFs are calculated from measurements from January 1998 to November 2000 and from December 2001 to December 2003 based on TRMM precipitation radar (PR) measured reflectivity into precipitation features (PFs) and using the method described by Nesbitt et al. (2000). The OPFs can be identified thanks to the high vertical resolution of the TRMM PR.
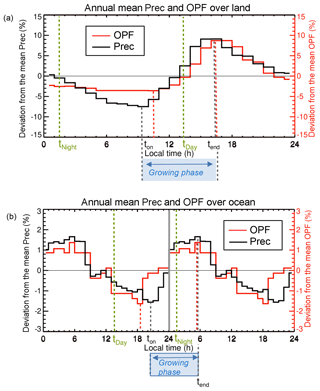
Figure 9(a) Deviation from the mean of the annual mean diurnal cycle of TRMM precipitation (Prec; black solid line) over land, from 2004 to 2017 and diurnal cycle of overshooting precipitation features (OPFs) at the tropopause (red solid line) over land, from 1998 to 2000 and from 2001 to 2003, adapted from Liu and Zipser (2005) over the tropics (20∘ N–20∘ S). (b) Same as (a) but over the ocean. Minimum and maximum Prec and OPFs are shown by vertical dotted lines (in black and red, respectively). ton is the time of the onset of the Prec, tend is the time of the diurnal maximum of Prec, and tday and tnight are the times of the two MLS measurements at day and night, respectively.
Over land, the diurnal cycle of Prec and OPFs shows a maximum at 16:00–17:00 LT and a minimum at 09:00–10:00 LT (Fig. 9a). The duration of the growing phase, defined as the period between the minimum and the maximum of Prec, is the same for OPFs and Prec and lasts Δt=7 h. The major difference in the diurnal cycles of Prec and OPFs occurs after the growing phase: the fraction of OPFs decreases more rapidly than that of Prec and stops decreasing around 00:00 LT, whereas that of Prec continues to decrease. This difference can be explained by the contribution to Prec of (1) the convection that does not reach the stratosphere and (2) the mature phase of the OPFs that produces stratiform rain for some hours after the overshooting time. These results over land are consistent with Pereira et al. (2006), showing that shallow convection is associated with 10 % of precipitation over the Amazonian region. Although OPF and Prec diurnal cycles are not calculated over the same study period, we can deduce from the present analysis that during the growing phase, the time evolution of Prec is a good proxy for the time evolution of deep convection reaching the TL (OPFs).
Over ocean, the sea surface temperature (SST) does not have a strong diurnal cycle (less than ∼1 K), with a peak in the early afternoon (e.g. Chen and Houze, 1997; Stuart-Menteth et al., 2003). The convective clouds usually develop after the SST peak, during the afternoon, and during the night, with a maximum in the early local morning. The diurnal cycles of Prec and OPFs (Fig. 9b) over the ocean have a maximum over night (05:00–06:00 LT) and a minimum at the end of the afternoon (18:00–19:00 LT for the OPFs and 20:00–21:00 LT for the Prec). The diurnal cycles of OPFs and Prec over the ocean show similar amplitudes in deviation from the mean. This result is consistent with Peirera and Rutledge (2006), showing that the shallow convection is associated with only 3 % of precipitation over the eastern Pacific region.
In summary, although OPFs are representative of deep convection reaching the TL, OPFs developed and presented in Liu and Zipser (2005) are not available during our study period of 2004–2017. However, our results in this section have shown that during the growing stage of deep convection, Prec is a good proxy for convection reaching the TL over land and ocean. Thus, as Prec is available in time coincidence with the MLS IWC and WV over 2004–2017, we will use Prec to interpret the time evolution of IWC in the UT and the TL.
In this section, we present the method we have developed to estimate the diurnal cycle of IWC in the UT (IWCUT(t)) and in the TL (IWCTL(t)) based on the diurnal cycle of Prec and on the two IWC measurements by the MLS per day. Like in the previous section for OPFs, we separate the diurnal cycle of IWC into a growing phase (period when deep convection develops to reach the UT and the TL) and a decreasing phase (period when deep convection dissipates). During the growing phase, Prec is a good indicator (proxy) of deep convection both over land and ocean (Sect. 3.5). This is not true during the decreasing phase, when shallow convection can have a significant impact on Prec. Since IWC is spatially highly correlated with Prec, and since the deep convection (OPFs) bringing ice into the TL increases with Prec during the growing phase, we expect ice to be injected up to the UT and the TL with a delay (δtUT,TL) after the onset of the deep convection ton during the growing phase.
The method developed focuses on the growing stage of deep convection. We quantify the amount of ice injected to the UT and the TL and determine the onset time of the ice injection and its duration. The amount of ice injected will be calculated from the estimation of the amplitude of the diurnal cycle of IWC in the UT and the TL.
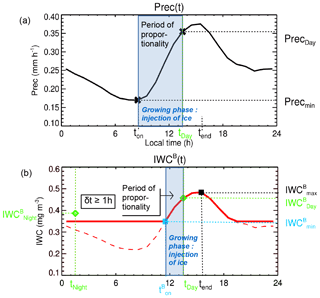
Figure 10Methodology to estimate the diurnal cycle of ice water content (IWC) over land: (a) diurnal cycle of precipitation, with × representing the minimum of precipitation (Precmin) with its associated time (ton) and Prec during the day (Precday) at tday=13:30 LT. (b) The diurnal cycle of IWCB(t) is shown by the red solid line, estimated from the diurnal cycle of Prec and from the two MLS measurements of ice (green diamonds, ), with the timing of the onset of the ice injection at . The black square represents the IWC maximum () and the blue square the when δtB>1 h. Note that when , the diurnal cycle of IWC is represented by the red dashed line.
4.1 IWC diurnal cycle in the UT and TL
The method to estimate IWCB(t)(B=UT or TL) is presented in this section. Figure 10 illustrates the methodology to find the IWCB(t) over land (the diagram over ocean would look different since maxima appear during local night). ton is defined as the time when Prec starts to increase, and is defined as the time when IWCB starts to increase. Our two main hypotheses are to assume that (i) IWCB starts to increase later than Prec (a delay δtBis assumed) because convective systems precipitate before reaching UT and TL, as follows,
and (ii) the IWCB(t) is proportional to the Prec(t) during the convective growing phase (see the period of proportionality in Fig. 10). This hypothesis considers deep convection represented by Prec as the main process bringing ice into the UT and the TL during the growing phase of the convection. Based on these two hypotheses, and knowing Precx and at tx and , we estimate as follows:
where x=day or N. We use tx=tday for land since only the day measurement occurs during the growing phase over land, and tx=tnight over sea since only the night measurement occurs during the growing phase over ocean. Knowing and , the time evolution IWCB(t) during the growing phase is then
Our method can then estimate the magnitude of the diurnal variation in the UT and the TL(ΔIWCB) over different regions of the tropics:
with tend being the time of the diurnal maximum of Prec. tend can be considered as the time of the end for ice injection or the time from which the downdraft processes are more important than the updraft processes. Thus, we define as the delay between tend and . Following hypothesis (ii) that considers that deep convection is the main process bringing ice into the UT and the TL, calculated ΔIWCB represents the amount of ice injected by deep convection in these two layers. Thus, the duration of the injection of ice during the growing phase, ΔtB, is then
In order to validate this method, we compare the estimation of the amount of ice injected (ΔIWCB) into the UT and the TL with the amount of ice measured in the troposphere and in the TL by the SMILES instrument on board the ISS during the short convective period of December 2009 to February 2010.
4.2 Evaluation of the method with SMILES measurements
The SMILES instrument measured IWC between 120 and 80 hPa and the overall measurement of tropospheric ice, the partial ice water path (pIWP) integrated between 1000 and 180 hPa, from October 2009 to April 2010. This period is an El Niño–Southern Oscillation (ENSO) period, increasing the convective activity over South Africa and the western Pacific Ocean and decreasing the convective activity over the MariCont region and South America. The diurnal cycle of IWC and pIWP calculated from SMILES has shown the well-separated signal over tropical land and ocean (Millán et al., 2013; Jiang et al., 2015). The anomalies of the diurnal cycle of IWC measured by SMILES near the TL, the diurnal cycle of pIWP in the troposphere, and the diurnal cycle of Prec measured during the convective period of December 2009 to February 2010 are presented in Fig. 11a over the three land study zones and in Fig. 11b over the three ocean study zones, both with a running average of 6 h. ton, , and are the times of the minimum of Prec (Precmin), pIWP (pIWPmin), and IWC (IWCmin), respectively.
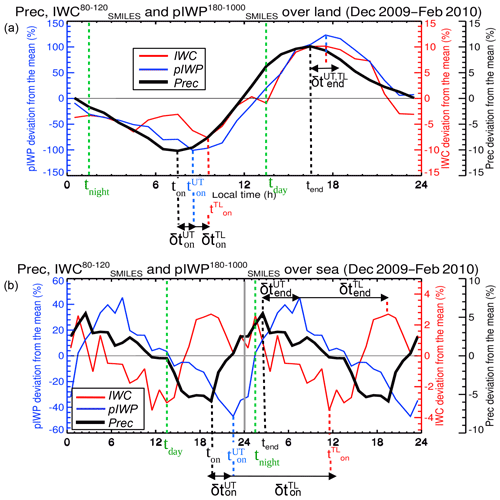
Figure 11Deviation from the mean (%) of the diurnal cycle of partial ice water path (pIWP; integrated between 1000 and 180 hPa), ice water content (IWC; averaged between 80 and 120 hPa) measured by SMILES, and precipitation (Prec) over (a) the tropical land (0–30∘ S) and (b) tropical ocean (0∘ N–30∘ S) from December 2009 to February 2010. ton, , and are the onsets of the Prec, pIWP, and IWC increase, respectively. tend is the end of the Prec increase. and are the delays between ton and and , respectively, and and are the delays between tend and the end of the pIWP and IWC increase, respectively. Data have been smoothed out using a 6 h running average.
Over land, during the growing phase, pIWP is proportional to Prec (Fig. 11a). Assuming that IWC146 evolves like pIWC, this implies that at ∼08:00–09:00 LT, and at ∼16:00–17:00 LT, with h and h. Then, the pIWP decreasing phase follows the same time evolution as Prec, reaching minima (Precmin and pIWPmin) around 07:00–09:00 LT. Thus, ice in the troposphere follows the same diurnal cycle as the Prec within a time resolution of 1 h. In the TL, IWC is still proportional to Prec, but IWC starts to increase later than () the pIWP in the UT (Fig. 11a). After tend, IWC decreases more rapidly than Prec and varies between +2 % and −7 % compared to the mean between 23:00 and 09:00 LT. Thus, as soon as the deep convection reaches one of these two levels, ice is brought by the updraft during the growing and mature stage of the convective activity. Then, ice decreases with the downdraft of the convective dissipating stage. However, the very deep convective activity reaching the TL starts later than the deep convection reaching the UT (δt≈1 h) and decreases quickly before reaching a background IWC minimum between 23:00 LT and 09:00 LT.
Over ocean during the growing phase (Fig. 11b), pIWP also increases proportionally to Prec. Assuming that IWC146 evolves like pIWC, this implies that at ∼21:00–22:00 LT, and at ∼04:00–05:00 LT, with h. Thus, as , the diurnal cycle of pIWP over ocean is synchronised with the diurnal cycle of Prec but delayed. In the TL and during the growing phase, IWC starts to increase later than pIWP (where h; Fig. 11b). This result is consistent with the diurnal cycle of OPFs presented in Fig. 9, where OPFs start to increase with a delay h with respect to the increase of Prec. According to Liu and Zipser (2005), only less than 5 % of OPFs reach the TL, so other processes in addition to deep convection govern the ice diurnal cycle in the TL over ocean, impacting the delay between the onset of ice injection and the onset of the convection ton. After , IWC takes around 13 h to reach a maximum at :00–20:00 LT.
Table 2Differences between the amount of ice water content (IWC) estimated by the TRMM and the MLS injected into the upper troposphere (UT) and the tropopause layer (TL) (ΔIWCUT and ΔIWCTL, respectively), and partial ice water path (pIWP) measured by SMILES in the UT (ΔpIWPSMILES) and IWC measured by SMILES in the TL (ΔIWCSMILES), during the period DJF 2009–2010, and their differences (ΔIWCUT−ΔpIWPSMILES and ΔIWCTL−ΔIWCSMILES, in the UT and the TL, respectively). The averages over the land and ocean zones (μ (Lands ZonesTropics) and μ (Oceans ZonesTropics), respectively) are also presented.
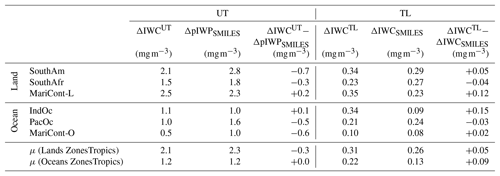
Table 2 presents the magnitude of diurnal variation of ice, that is to say, the amount of ice injected into the UT and the TL estimated using the model presented in Sect. 4.2 from the MLS and TRMM measurements (ΔIWCB) and the magnitude of diurnal variation of ice measured by SMILES (ΔpIWP and ΔIWCSMILES) over the six study zones and during DJF 2009–2010. ΔIWCUT and ΔIWCTL are close to ΔpIWPSMILES and ΔIWCSMILES, respectively (with differences between 0.02 and 0.28 mg m−3). Thus, during the ENSO period of DJF 2009–2010, the amount of ice injected into the UT (ΔIWCUT) is about 2.06–2.34 mg m−3 over land and 1.20–1.22 mg m−3 over ocean and into the TL (ΔIWCTL) is about 0.26–0.31 mg m−3 over land and 0.13–0.22 mg m−3 over ocean. NOAA Interpolated Outgoing Longwave Radiation (OLR) during DJF 2009–2010 is lower over land (mean OLR between 195 and 215 W m−2, not shown) than over ocean (between 235 and 270 W m−2), which is consistent with the more intense land convective activity compared to that of oceans.
In summary, our method based on the correlation between Prec from the TRMM and IWC from the MLS during the growing stage of the convection (presented in Sect. 4.1) allows the amount of ice injected into the UT and the TL (ΔIWCB) to be estimated and has been validated with the SMILES measurements over land and ocean. These results confirm that the diurnal cycle of Prec can be used as a proxy for deep convection reaching the UT and the TL during the growing stage of the deep convection. The analyses of SMILES data also suggest a good correlation of IWCUT and Prec during the dissipating stage of the convection in the UT over land.
4.3 Amount of ice injected into the austral convective UT
Using the method presented in the previous section, 13 years of MLS and TRMM observations are analysed. Table 3 presents the time of the beginning of the IWC injection in the UT (), the duration of the IWC injection (), the minimum value of IWC before the beginning of the IWC injection (), and the amount of ice injected into the UT (equivalent to the amplitude of the IWC diurnal cycle, ).
Table 3Time of the onset of the ice injection in the tropical upper troposphere (UT), , duration of the injection of ice in the UT (ΔtUT), minimum amount of ice in the UT (), and amount of ice injected into the UT (ΔIWCUT) as a function of the six study zones and averaged over the land and ocean zones (μ (Lands ZonesTropics) and μ (Oceans ZonesTropics), respectively) during DJF from 2004 to 2017. The bold values highlight the most important injection of ice and the associated regions.
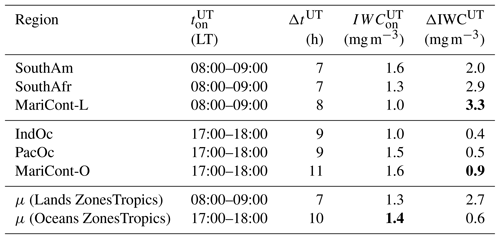
Over land, is found during the morning at 08:00–09:00 LT whatever the land zone. However, ΔtUT is longer over MariCont-L than SouthAm and SouthAfr (ΔtUT=8, 7,and 7 h, respectively). Furthermore, is lower over the MariCont-L than over SouthAm and SouthAfr (, 1.65, and 1.33 mg m−3, respectively), but ΔIWCUT is greater over the MariCont-L than over SouthAm and SouthAfr (ΔIWCUT=3.34, 1.99, and 2.86 mg m−3, respectively).
Over ocean, is found during the evening at 17:00–18:00 LT. ΔtUT is much longer over MariCont-O than over IndOc and PacOc (ΔtUT=11, 9, and 9 h, respectively). However is greater over MariCont-O than over IndOc and PacOc (, 1.01, and 1.46 mg m−3, respectively), and ΔIWCUT over MariCont-O is also greater than ΔIWCUT over PacOc and IndOc (ΔIWCUT=0.91, 0.46, and 0.43 mg m−3, respectively).
Thus, the convective growing stage is quicker over land (7 h) than over ocean (10 h). These results are consistent with a previous study by Takahashi and Luo (2014), showing that the lifetime of the mature stage of the deep convection is between 6 and 12 h after the onset of the deep convection considering the Northern and Southern Hemisphere over the tropics. Furthermore, while the estimated means of over land and ocean are very close (1.34 and 1.36 mg m−3, respectively), the means of the land and ocean ΔIWCUT show great differences (2.73 and 0.60 mg m−3, respectively). Thus, the ice minima are of similar amplitudes over land and ocean in the UT, but the amount of ice injected into the UT is about 4 times greater over land than over ocean. These results also show that the MariCont region is a region with a greater amount of ice injection in the UT compared to other tropical deep convective areas.
4.4 Amount of ice injected into the austral convective TL
From the method presented previously and the results from the SMILES instruments (Fig. 11), Table 4 presents , ΔtTL, , and ΔIWCTL with respect to time for ice to be injected into the TL after the onset of deep convection, δtTL, over the different study zones. We propose to use δtTL=0 to 3 h in order to always keep δtTL shorter than ton−tx, where x is selected during the growing phase (x=D over land and x=N over ocean) in order to perform a sensitivity study of our results.
Table 4As a function of the delay (δt=0, 1, 2, or 3 h) between the beginning of the Prec onset and the IWC onset in the tropical tropopause layer (TL): duration of the injection of ice in the TL (ΔtTL), minimum amount of ice in the TL (), and amount of ice injected into the TL (ΔIWCTL) as a function of the six study zones and averaged over the land and ocean zones (μ (Lands ZonesTropics) and μ (Oceans ZonesTropics), respectively) during DJF from 2004 to 2017. The bold values highlight the most important and ΔIWCTL and the associated regions.

Over land, for all , the period of injection (ΔtTL) is longer over MariCont-L than over SouthAm and SouthAfr (ΔtTL=8, 7, and 7 h, respectively). Depending on the δtTL (between 0 and 3 h), ΔtTL can be between 7 and 8 and 4 and 5 h. ΔIWCTL is greater over MariCont-L than over SouthAm and SouthAfr for all the δtTL(ΔIWCTL∼0.56–0.42, 0.26–0.13, and 0.40–0.24 mg m−3, respectively). As observed in the short time period study with SMILES, the injection of ice over MariCont-L is the most intense over tropics. Furthermore, the smaller the δtTL, the longer the ΔtTL and the greater the ΔIWCTL.
Over ocean, as observed with the SMILES measurements, cannot be estimated with our method. However, our method is able to estimate ΔtTL, , and ΔIWCTL as a function of δtTL (as demonstrated in Sect. 4.1). Over MariCont-O, ice injection into the TL is longer than over IndOc and PacOc (ΔtTL=8–11, 6–9, and 6–9 h, respectively). The amount of ice injected over MariCont-O is greater than over IndOc and PacOc (ΔIWCTL=0.16–0.19, 0.09–0.10, 0.08–0.09 mg m−3, respectively). Furthermore, the ice background in the TL is also greater over MariCont-O than over IndOc and PacOc (–0.37, 0.24–0.26, 0.29–0.30 mg m−3, respectively). Thus, while the diurnal cycle of Prec over MariCont-O is the weakest, the diurnal cycle of ice over MariCont-O would have the highest values.
As expected from the SMILES measurements, the MariCont region presents the largest ice injection in the TL. While the IWC background over MariCont-O is the largest, the injection of IWC over MariCont-L is the most important.
The previous section has shown that the growing phase of the diurnal cycle of deep convection in the tropics impacts on the growing phase of diurnal cycle of ice in the UT and the TL. In this section, the convective processes impacting the decreasing phase of the ice diurnal cycle in the UT and the TL are discussed. The decreasing phase of the diurnal cycle of ice in the UT and the TL represents the diurnal loss of ice. This loss can be caused by several processes, including sedimentation, downdraft convective processes during the dissipating stage, sublimation into water vapour, or horizontal advection and mixing. Quantifying the processes impacting the diurnal cycle of ice can help to quantify the amount of water that stays in the UT and TL, the part that falls down to the surface, and the part that is advected up to the LS at the temporal diurnal scale.
In this section, the comparison between the value of IWC measured by the MLS during the decreasing phase (IWCx) at (x=day or night) and IWC estimated at the same tx (IWC(tx)) is discussed. If IWCx∼IWC(tx), our model based on Prec evolution is a good predictive tool to consider that convective processes (as represented by Prec) control the decreasing phase of the ice diurnal cycle. Otherwise, non-convective processes also need to be investigated to explain the ice diurnal cycle. Table 5 presents the difference d () in the UT and the TL.
Table 5Difference d between ice water content measured by the MLS during the decreasing phase (IWCx) and ice water content estimated at the same hour (IWC(x)) in the upper troposphere (UT) and the tropopause layer (TL) (where x=day or night as a function of the timing of the decreasing phase of the ice diurnal cycle).
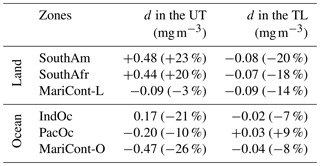
Over land in the UT, d is positive and less than 23 % over SouthAm and SouthAfr and close to zero over the MariCont-L. The fact that the amount of Prec over SouthAm and SouthAfr is greater than required to explain IWC suggests that a significant fraction of the convection is shallow and does not reach the UT. In contrast, over the MariCont-L, the diurnal cycle of Prec is very similar to the diurnal cycle of IWC, suggesting that the convective activity over this region brings a large amount of ice all over the 24 h. In the TL, d is found between −14 % and −20 %, implying that the ice decreases more slowly than Prec.
Over ocean in the UT, d is negative down to −26 %, showing that the ice stay longer in the UT compared to the Prec decreasing phase. In the TL, d varies between +9 and −7, showing low differences d at this level.
In summary, the method presented in the present paper allows the diurnal cycle of ice in the UT and the TL to be estimated within 26 % over the six tropical zones and to within 14 % over the MariCont-L region.
To quantify the amount of ice injected into the tropical upper troposphere (UT) and the tropopause layer (TL) and the processes linked to the ice diurnal variation, it is important to better understand the amount of total water in these layers and the amount of water entering into the LS. The information given by the MLS on the diurnal cycle of ice water content (IWC) in the UT and the TL and the method comparing the two measurements per day (Liu and Zipser, 2005; Carminati et al., 2014) are too limited to estimate the ice variability in these layers. Thus, the present study starts to assume that the diurnal cycle in ice is related to the diurnal cycle in precipitation (for which there are TRMM data with much better time resolution) in the austral convective tropics. The strong relationship between precipitation (Prec) measured by the TRMM and IWC measured by the MLS in the UT and the TL is shown in the study. As the MLS measures IWC only twice a day, at 01:30 (night) and 13:30 LT (day), we have proposed a simple model based on the diurnal cycle of Prec to estimate the diurnal cycle of IWC in the UT and in the TL. The method is validated using the short period of DJF 2009–2010 of ice measurement from the SMILES instrument in the troposphere and the TL.
Because of the strong space correlation between Prec and IWC, we show that Prec can be used as a proxy for deep convection reaching the UT and the TL during the growing stage of convection in order to bring ice into the UT and the TL. The method proposed in the study allows us to estimate (1) the diurnal cycle of ice into the UT and the TL and (2) the difference between the maximum and the minimum in the diurnal cycle of ice in these layers, namely the amount of ice injected by deep convection. Our method suggests that deep convection is the most important process in the austral convective tropics driving the diurnal increase of ice in these layers. Other processes may play a minor role, such as the decrease of the temperature in the TTL, increasing the saturation ratio and allowing the crystal nucleation and growth, or ice being brought into the UT and TL by horizontal advection.
The amount of ice injected into the UT (2.73 mg m−3 over land and 0.60 mg m−3 over ocean) is found to be much higher than the amount of ice injected into the TL (0.26–0.41 mg m−3 over land and 0.11–0.13 mg m−3 over ocean). Furthermore, the study highlights the importance of separating the land of the Maritime Continent (MariCont-L) from the ocean of the Maritime Continent (MariCont-O) to better understand the ice diurnal cycle in the UT and the TL over the complex and strong convective region of the Maritime Continent. It has been shown that the injection of ice over the MariCont-L into the UT and the TL (ΔIWCUT=3.34 mg m−3, ΔIWCTL=0.56–0.42 mg m−3) is the greatest in the tropics. This injection of ice has a strong importance for the amount of ice entering into the LS and for feeding what has been called the “stratospheric fountain” (Newell and Gould-Stewart, 1981) observed over the MariCont region.
The decreasing phase of the ice diurnal cycle is also evaluated with Prec and discussed. While it is difficult to quantify the impact of other processes than convective processes on the diurnal cycle of ice in the UT and the TL, we are able to establish that deep convection impacts the depletion of ice during the decreasing phase of the ice diurnal cycle (from Table 5: 97 % in the UT over the MariCont and ∼80 % in averaged UT and TL over other regions). Thus, Prec is also considered to be a good proxy for the decreasing phase of the convection, especially over the MariCont-L region in the UT (to within 3 %, according to Table 5), and convective processes are the main processes impacting the decreasing phase of the diurnal cycle of ice. Furthermore, our study has shown that the estimated diurnal variation of ice is the largest in the regions (identified by the TRMM) where the diurnal variation in temperature is also the largest, although horizontal transport may play a role, but it cannot be quantified using our methodology.
In summary, while the importance of deep convective processes and large-scale three-dimensional circulation processes for the ice and water injection up to the UT, TL, and LS are still debated, this study shows that the ice diurnal cycle in the UT and the TL is mainly governed by vertical processes linked to the convective activity that are much stronger than other processes, such as horizontal mixing, sublimation, and sedimentation.
Although it is beyond the scope of the present paper, some potentially new results might be achievable using our method, e.g. the part of ice sublimating during deep convection and the impact of intra-seasonal variability such as ENSO and the Madden–Jullian Oscillation (MJO) on the ice diurnal cycle. In fact, ENSO and MJO have a strong influence on the tropical deep convection and injection of moisture into the TTL (Gettelman and Forster, 2002; Wong and Dessler, 2007) and are associated to the cold anomalies near the TTL, especially over the Maritime Continent region (Zhang, 2013). We are expecting a strong impact on the diurnal ice injection timing and duration in the TL. The processes impacting the ice injection into the UT and the TL over the Maritime Continent regions at a local scale will be studied in a forthcoming paper.
The observational datasets are available from the following websites: https://trmm.gsfc.nasa.gov/publications_dir/publications.html (last access: 1 January 2019, Prec from TRMM), https://disc.gsfc.nasa.gov/datasets?age=1&keywords=ML2IWC_004 (last access: 1 January 2018, IWC from MLS), ftp://mls.jpl.nasa.gov/pub/outgoing/smiles (last access: 1 December 2018, IWC and pIWC from SMILES), and https://www.esrl.noaa.gov/psd/cgi-bin/db_search/DBSearch.pl?Variable=Tropopause+Pressure&group=0&submit=Search (last access: 1 January 2019, tropopause pressure from NCEP).
| CPT | cold point tropopause |
| DJF | December, January, February |
| IndOc | Indian Ocean |
| IWC | ice water content |
| LS | lower stratosphere |
| LT | local time |
| MariCont | Maritime Continent |
| MariCont-L | Maritime Continent land |
| MariCont-O | Maritime Continent ocean |
| MLS | Microwave Limb Sounder |
| Prec | precipitation |
| pIWP | partial ice water path |
| PacOc | Pacific Ocean |
| RHI | relative humidity with respect to ice |
| SouthAm | South America |
| SouthAfr | South Africa |
| TEMP | temperature |
| TL | tropopause layer |
| TRMM | Tropical Rain Measuring Mission |
| TST | troposphere to stratosphere transport |
| TTL | tropical tropopause layer |
| UT | upper troposphere |
| WV | water vapour |
IAD analysed the data, formulated the model used to combine MLS and TRMM data, and took primary responsibility for writing the paper. PR and PH contributed to the design of the study, the interpretation of the results, and the writing of the paper. FC provided advice on MLS data processing, TD contributed to discussion of the overall results, and both FC and TD provided comments on the paper.
The authors declare that they have no conflict of interest.
Our study takes place within the Turbulence Effects on Active Species in Atmosphere (TEASAO; http://www.legos.obs-mip.fr/projets/axes-transverses-processus/teasao, last access: 30 April 2019) project. We thank the National Center for Scientific Research (CNRS) and the Excellence Initiative (Idex) of Toulouse, France (TEASAO project, Peter Haynes, Attractivity Chair), for funding this study.
We would like to thank the teams that have provided the MLS data (https://disc.gsfc.nasa.gov/datasets/ML2IWC_V004, last access: 1 January 2018), the TRMM data (https://pmm.nasa.gov/data-access/downloads/trmm, last access: 1 January 2019), and the SMILES data (https://mls.jpl.nasa.gov/data/smiles, last access: 1 December 2018).
This paper was edited by Rolf Müller and reviewed by three anonymous referees.
Alcala, C. M. and Dessler, A. E.: Observations of deep convection in the tropics using the Tropical Rainfall Measuring Mission (TRMM) precipitation radar, J. Geophys. Res., 107, 4792, https://doi.org/10.1029/2002JD002457, 2002.
Allison, T., Fuelberg, H., and Heath, N.: Simulations of Vertical Water Vapor Transport for TC Ingrid (2013), J. Geophys. Res.-Atmos., 123, 8255–5282, https://doi.org/10.1029/2018JD028334, 2018.
Avery, M. A., Davis, S. M., Rosenlof, K. H., Ye, H., and Dessler, A. E.: Large anomalies in lower stratospheric water vapour and ice during the 2015–2016 El Nino, Nat. Geosci., 10, 405–409, https://doi.org/10.1038/ngeo2961, 2017.
Beucher, F.: Manuel de météorologie tropicale: des alizés au cyclone tropical, Météo-France, Paris, France, 2010.
Birner, T. and Charlesworth, E. J.: On the relative importance of radiative and dynamical heating for tropical tropopause temperatures, J. Geophys. Res.-Atmos., 122, 6782–6787, https://doi.org/10.1002/2016JD026445, 2017.
Carminati, F., Ricaud, P., Pommereau, J.-P., Rivière, E., Khaykin, S., Attié, J.-L., and Warner, J.: Impact of tropical land convection on the water vapour budget in the tropical tropopause layer, Atmos. Chem. Phys., 14, 6195–6211, https://doi.org/10.5194/acp-14-6195-2014, 2014.
Chen, S. S. and Houze, R. A.: Diurnal variation and life-cycle of deep convective systems over the tropical Pacific warm pool, Q. J. Roy. Meteor. Soc., 123, 357–388, 1997.
Corti, T., Luo, B. P., Fu, Q., Vömel, H., and Peter, T.: The impact of cirrus clouds on tropical troposphere-to-stratosphere transport, Atmos. Chem. Phys., 6, 2539–2547, https://doi.org/10.5194/acp-6-2539-2006, 2006.
Dauhut, T., Chaboureau, J.-P., Escobar, J., and Mascart, P.: Large-eddy simulations of Hector the convector making the stratosphere wetter, Atmos. Sci. Lett., 16, 135–140, https://doi.org/10.1002/asl2.534, 2015.
Dauhut, T., Chaboureau, J., Mascart, P., and Pauluis, O.: The Atmospheric Overturning Induced by Hector the Convector, J. Atmos. Sci., 74, 3271–3284, https://doi.org/10.1175/JAS-D-17-0035.1, 2017.
Fueglistaler, S., Dessler, A. E., Dunkerton, T. J., Folkins, I., Fu, Q., and Mote, P. W.: Tropical tropopause layer, Rev. Geophys., 47, RG1004, https://doi.org/10.1029/2008RG000267, 2009.
Gettelman, A. and Forster, P. M. de F.: A Climatology of the Tropical Tropopause Layer, J. Meteorol. Soc. Jpn. Ser II, 80, 911–924, https://doi.org/10.2151/jmsj.80.911, 2002.
Hartmann, D. L., Holton, J. R., and Fu, Q.: The heat balance of the tropical tropopause, cirrus, and stratospheric dehydration. Geophys. Res. Lett., 28, 1969–1972, 2001.
Holton, J. R. and Gettelman, A.: Horizontal transport and the dehydration of the stratosphere, Geophys. Res. Lett., 28, 2799–2802, https://doi.org/10.1029/2001GL013148, 2001.
Jensen, E. J., Toon, O. B., Pfisher, L., and Selkirk, H. B.: Dehydration of the upper troposphere and lower stratosphere by subvisible cirrus clouds near the tropical tropopause, Geophys. Res. Lett., 23, 825–828, https://doi.org/10.1029/96GL00722, 1996.
Jensen, E. J., Smith, J. B., Pfister, L., Pittman, J. V., Weinstock, E. M., Sayres, D. S., Herman, R. L., Troy, R. F., Rosenlof, K., Thompson, T. L., Fridlind, A. M., Hudson, P. K., Cziczo, D. J., Heymsfield, A. J., Schmitt, C., and Wilson, J. C.: Ice supersaturations exceeding 100 % at the cold tropical tropopause: implications for cirrus formation and dehydration, Atmos. Chem. Phys., 5, 851–862, https://doi.org/10.5194/acp-5-851-2005, 2005.
Jiang, J. H., Su, H., Zhai, C., Janice Shen, T., Wu, T., Zhang, J., Cole, J. N., von Salzen, K., Donner, L. J., Seman, C., Del Genio, A., Nazarenko, L. S., Dufresne, J., Watanabe, M., Morcrette, C., Koshiro, T., Kawai, H., Gettelman, A., Millán, L., Read, W. G., Livesey, N. J., Kasai, Y., and Shiotani, M.: Evaluating the Diurnal Cycle of Upper-Tropospheric Ice Clouds in Climate Models Using SMILES Observations, J. Atmos. Sci., 72, 1022–1044, https://doi.org/10.1175/JAS-D-14-0124.1, 2015.
Khaykin, S., Pommereau, J.-P., Korshunov, L., Yushkov, V., Nielsen, J., Larsen, N., Christensen, T., Garnier, A., Lukyanov, A., and Williams, E.: Hydration of the lower stratosphere by ice crystal geysers over land convective systems, Atmos. Chem. Phys., 9, 2275–2287, https://doi.org/10.5194/acp-9-2275-2009, 2009.
Khaykin, S. M., Pommereau, J.-P., and Hauchecorne, A.: Impact of land convection on temperature diurnal variation in the tropical lower stratosphere inferred from COSMIC GPS radio occultations, Atmos. Chem. Phys., 13, 6391–6402, https://doi.org/10.5194/acp-13-6391-2013, 2013.
Kim, J. and Son, S.-W.: Tropical Cold-Point Tropopause: Climatology, Seasonal Cycle, and Intraseasonal Variability Derived from COSMIC GPS Radio Occultation Measurements, J. Climate, 25, 5343–5360, https://doi.org/10.1175/JCLI-D-11-00554.1, 2012.
Lee, K.-O., Dauhut, T., Chaboureau, J.-P., Khaykin, S., Krämer, M., and Rolf, C.: Convective hydration in the tropical tropopause layer during the StratoClim aircraft campaign: Pathway of an observed hydration patch, Atmos. Chem. Phys. Discuss., https://doi.org/10.5194/acp-2018-1114, in review, 2018.
Liu, C. and Zipser, E. J.: Global distribution of convection penetrating the tropical tropopause, J. Geophys. Res.-Atmos., 110, D23104, https://doi.org/10.1029/2005JD006063, 2005.
Liu, C. and Zipser, E. J.: The global distribution of largest, deepest, and most intense precipitation systems, Geophys. Res. Lett., 42, 3591–3595, https://doi.org/10.1002/2015GL063776, 2015.
Liu, C., Zipser, E., Garrett, T., Jiang, J. H., and Su, H.: How do the water vapor and carbon monoxide “tape recorders” start near the tropical tropopause?, Geophys. Res. Lett., 34, L09804, https://doi.org/10.1029/2006GL029234, 2007.
Livesey, N. J., Read, W. G., and Wagner, P. A.: Earth Observing System (EOS) Aura Microwave Limb Sounder (MLS) version 4.2x Level 2 data quality and description document. Jet Propulsion Laboratory Tech. Rep. JPL, available at: https://mls.jpl.nasa.gov/data/v4-2_data_quality_document.pdf (last access: 7 May 2019), 2017.
Mehta, S. K., Krishna Murthy, B. V., Narayana Rao, D., Venkat Ratnam, M., Parameswaran, K., Rajeev, K., Suresh Raju, C., and Kusuma, G. R.: Identification of tropical convective tropopause and its association with cold point tropopause, J. Geophys. Res., 113, D00B04, https://doi.org/10.1029/2007JD009625, 2008.
Millán, L., Read, W., Kasai, Y., Lambert, A., Livesey, N., Mendrok, J., Sagawa, H., Sano, T., Shiotani, M., and Wu, D. L.: SMILES ice cloud products, J. Geophys. Res.-Atmos., 118, 6468–6477, https://doi.org/10.1002/jgrd.50322, 2013.
Nesbitt, S. W., Zipser, E. J., and Cecil, D. J.: A Census of Precipitation Features in the Tropics Using TRMM: Radar, Ice Scattering, and Lightning Observations, J. Climate, 13, 4087–4106, https://doi.org/10.1175/1520-0442(2000)013<4087:ACOPFI>2.0.CO;2, 2000.
Newell, R. E. and Gould-Stewart, S.: A Stratospheric Fountain?, J. Atmos. Sci., 38, 2789–2796, https://doi.org/10.1175/1520-0469(1981)038<2789:ASF>2.0.CO;2, 1981.
Pereira, L. G. and Rutledge, S. A.: Diurnal Cycle of Shallow and Deep Convection for a Tropical Land and an Ocean Environment and Its Relationship to Synoptic Wind Regimes, Mon. Weather Rev., 134, 2688–2701, https://doi.org/10.1175/MWR3181.1, 2006.
Peter, T., Marcolli, C., Spichtinger, P., Corti, T., Baker, M. B., and Koop, T.: When dry air is too humid, Science, 314, 1399–1402, 2006.
Pommereau, J.-P.: Troposphere-to-stratosphere transport in the tropics, Comptes Rendus Geoscience, 342, 331–338, https://doi.org/10.1016/j.crte.2009.10.015, 2010.
Randel, W. J. and Jensen, E. J.: Physical processes in the tropical tropopause layer and their role in a changing climate, Nat. Geosci., 6, 169–176, https://doi.org/10.1038/ngeo1733, 2013.
Schoeberl, M. R., Jensen, E. J., Pfister, L., Ueyama, R., Avery, M., and Dessler, A. E.: Convective hydration of the upper troposphere and lower stratosphere, J. Geophys. Res.-Atmos., 123, 4583–4593, https://doi.org/10.1029/2018JD028286, 2018.
Soden, B. J., Held, I. M., Colman, R., Shell, K. M., Kiehl, J. T., and Shields, C. A.: Quantifying Climate Feedbacks Using Radiative Kernels, J. Climate, 21, 3504–3520, https://doi.org/10.1175/2007JCLI2110.1, 2008.
Solomon, S., Rosenlof, K. H., Portmann, R. W., Daniel, J. S., Davis, S. M., Sanford, T. J., and Plattner, G. K.: Contributions of stratospheric water vapor to decadal changes in the rate of global warming, Science, 327, 1219–1223, https://doi.org/10.1029/1999RG900008, 2010.
Stuart-Menteth, A. C., Robinson, I. S., and Challenor, P. G.: A global study of diurnal warming using satellite-derived sea surface temperature, J. Geophys. Res.-Oceans, 108, 951–953, 2003.
Suneeth, K. V., Das, S. S., and Das, S. K.: Diurnal variability of the global tropical tropopause: results inferred from COSMIC observations, Clim. Dynam., 49, 3277–3292, https://doi.org/10.1007/s00382-016-3512-x, 2017.
Takahashi, H. and Luo, Z. J.: Characterizing tropical overshooting deep convection from joint analysis of CloudSat and geostationary satellite observations, J. Geophys. Res.-Atmos., 119, 112–121, https://doi.org/10.1002/2013JD020972, 2014.
Ueyama, R., Jensen, E. J., Pfister, L., and Kim, J.-E.: Dynamical, convective, and microphysical control on wintertime distributions of water vapour and clouds in the tropical tropopause layer, J. Geophys. Res.-Atmos., 120, 2015JD023318, https://doi.org/10.1002/2015JD023318, 2015.
Wong, S. and Dessler, A., E.: Regulation of H2O an CO in tropical tropopause layer by the Madden-Julian oscillation, J. Geophys. Res., 112, D14305, https://doi.org/10.1029/2006JD007940, 2007.
Wright, J. S., Fu, R., Fueglistaler, S., Liu, Y. S., and Zhang, Y.: The influence of summertime convection over Southeast Asia on water vapor in the tropical stratosphere, J. Geophys. Res., 116, D12302, https://doi.org/10.1029/2010JD015416, 2011.
Yang, G.-Y. and Slingo, J.: The diurnal cycle in the tropics, Mon. Weather Rev., 129, 784–801, https://doi.org/10.1175/1520-0493(2001)129<0784:TDCITT>2.0.CO;2, 2001.
Zhang, C.: Madden–Julian Oscillation: Bridging Weather and Climate, B. Am. Meteorol. Soc., 94, 1849–1870, https://doi.org/10.1175/BAMS-D-12-00026.1, 2013.
Zhou, C., Dessler, A. E., Zelinka, M. D., Yang, P., and Wang, T.: Cirrus feedback on interannual climate fluctuations, Geophys. Res. Lett., 41, 9166–9173, https://doi.org/10.1002/2014GL062095, 2014.
- Abstract
- Introduction
- Instruments
- Relationship between Prec and water budget in the austral convective UT and TL
- Amount of ice injected into the UT and the TL by deep convection
- Discussion on the processes driving the decreasing phase of the IWC diurnal cycle
- Conclusion and perspectives
- Data availability
- Appendix A: List of abbreviations and acronyms and their meanings
- Author contributions
- Competing interests
- Acknowledgements
- Review statement
- References


