the Creative Commons Attribution 4.0 License.
the Creative Commons Attribution 4.0 License.
 | 02 Dec 2021
Lightning-ignited wildfires and long continuing current lightning in the Mediterranean Basin: preferential meteorological conditions
Francisco J. Pérez-Invernón
Heidi Huntrieser
Sergio Soler
Francisco J. Gordillo-Vázquez
Nicolau Pineda
Javier Navarro-González
Víctor Reglero
Joan Montanyà
Oscar van der Velde
Nikos Koutsias
Lightning is the major cause of the natural ignition of wildfires worldwide and produces the largest wildfires in some regions. Lightning strokes produce about 5 % of forest fires in the Mediterranean Basin and are one of the most important precursors of the largest forest fires during the summer. Lightning-ignited wildfires produce significant emissions of aerosols, black carbon, and trace gases, such as CO, SO2, CH4, and O3, affecting air quality. Characterization of the meteorological and cloud conditions of lightning-ignited wildfires in the Mediterranean Basin can serve to improve fire forecasting models and to upgrade the implementation of fire emissions in atmospheric models.
This study investigates the meteorological and cloud conditions of lightning-ignited wildfires (LIWs) and long continuing current (LCC) lightning flashes in the Iberian Peninsula and Greece. LCC lightning and lightning in dry thunderstorms with a low precipitation rate have been proposed to be the main precursors of the largest wildfires. We use lightning data provided by the World Wide Lightning Location Network (WWLLN), the Earth Networks Total Lightning Network (ENTLN), and the Lightning Imaging Sensor (LIS) on board the International Space Station (ISS), together with four databases of wildfires produced in Spain, Portugal, southern France, and Greece, respectively, in order to produce a climatology of LIWs and LCC lightning over the Mediterranean Basin. In addition, we use meteorological data provided by the European Centre for Medium-Range Weather Forecasts (ECMWF) ERA5 reanalysis data set and by the Spanish State Meteorological Agency (AEMET), together with the Cloud Top Height product (CTHP) derived from Meteosat Second Generation (MSG) satellites measurements to investigate the meteorological conditions of LIWs and LCC lightning. According to our results, LIWs and a significant amount of LCC lightning flashes tend to occur in dry thunderstorms with weak updrafts. Our results suggest that LIWs tend to occur in clouds with a high base and with a vertical content of moisture lower than the climatological value, as well as with a higher temperature and a lower precipitation rate. Meteorological conditions of LIWs from the Iberian Peninsula and Greece are in agreement, although some differences possibly caused by the highly variable topography in Greece and a more humid environment are observed. These results show the possibility of using the typical meteorological and cloud conditions of LCC lightning flashes as proxy to parameterize the ignition of wildfires in atmospheric or forecasting models.
- Article
(7590 KB) - Full-text XML
-
Supplement
(20722 KB) - BibTeX
- EndNote


Every second, about 44 lightning flashes occur around the globe (Christian et al., 2003; Cecil et al., 2014). Apart from being one of the major sources of nitrogen oxides () in the troposphere (e.g., Schumann and Huntrieser, 2007, and references therein), lightning discharges are the main precursors of natural forest fires worldwide (Komarek, 1964; Pyne et al., 1998; Latham and Williams, 2001). Lightning-ignited wildfires (LIWs) produce significant emissions of aerosols, black carbon, and some trace gases such as CO, SO2, CH4, and O3 (e.g., Schultz et al., 2008; van der Werf et al., 2010, 2017; Huntrieser et al., 2016). However, there are still noteworthy questions about the meteorological conditions that favor the occurrence of LIWs, especially in Europe. For example, what is the relationship between the occurrence of dry thunderstorms and LIWs fires in the Mediterranean Basin? What is the role of long continuing current (LCC) lightning flashes in the ignition?
The link between lightning and forest fires has been widely investigated by several authors in different regions using data provided by aircraft campaigns, satellite observations, and lightning-detection networks (e.g., Lyons et al., 1998; Anderson, 2002; Stocks et al., 2002; Wotton and Martell, 2005; Hall and Brown, 2006; Fernandes et al., 2006; Kochtubajda et al., 2006; Lang and Rutledge, 2006; Rosenfeld et al., 2007; Hall, 2007; Altaratz et al., 2010; Dowdy and Mills, 2012; Nauslar, 2010; Lang et al., 2014; Veraverbeke et al., 2017). In Canada, LIWs account for 80 % (Anderson, 2002) of the total area burned, while in the western states of the USA, the total area burned by LIWs is about 60 % (Nauslar, 2010). However, European studies are rare. Lightning is the major cause of ignition in the European boreal forests (Granström, 2001; Larjavaara et al., 2005b, a; Granström and Niklasson, 2008; Rolstad et al., 2017) and one of the main causes of ignition in the Alps (Conedera et al., 2006; Moris et al., 2020). In the Mediterranean Basin, lightning causes about 5 % of the total number of forest fires (Vázquez and Moreno, 1998; Camia et al., 2010; Koutsias et al., 2013), while the rest of fires are caused by humans. However, LIWs are one of the most important precursors of the largest forest fires during the summer (Vázquez and Moreno, 1998; Badia et al., 2002; Amatulli et al., 2007; García-Ortega et al., 2011; Oliveira et al., 2012; San-Miguel-Ayanz et al., 2013; Ganteaume et al., 2013; San José et al., 2014). Contrary to fires with an anthropological origin, LIWs usually occur in remote areas and under extreme meteorological conditions that hinder the extinction work (Pineda et al., 2014; Pineda and Rigo, 2017). The important role of lightning in initiating the largest forest fires over the Mediterranean Basin highlights the need to develop novel forecasting methods.
The ignition (fire triggering), survival (smoldering), and arrival (flaming combustion) of LIWs (Anderson, 2002) is closely related to intense drought periods and high temperatures (Pineda and Rigo, 2017). The amount of precipitation at the surface (Colson, 1960; Hall, 2007) and the type of vegetation (Pineda et al., 2014; Gora et al., 2017; Baranovskiy and Yankovich, 2018) play a key role in the ignition of wildfires. Most of LIWs occur in forests with conifer vegetation (Krawchuk et al., 2006; Reineking et al., 2010; Müller et al., 2013; Pineda and Rigo, 2017; Moris et al., 2020), where dry thunderstorms and strong winds favor the ignition, survival, and arrival of fire (Rorig et al., 2007; Pineda and Rigo, 2017). The definition of a dry thunderstorm is not homogeneous in the literature. Some authors define dry thunderstorms as storms with total precipitation below nearly 2.5 mm (e.g., Rorig et al., 2007). In this work, we define dry thunderstorms as thunderstorms with 1 h accumulated precipitation below the climatological value to investigate the conditions at the moment of ignition and right before possible survival. Some studies over the USA suggest that dry lightning and LIWs tend to occur in clouds with a high base (Nauslar, 2010). Furthermore, significant efforts have been made to identify the shared meteorological conditions of fire-producing thunderstorms at ground level and in the lower troposphere. However, European studies are rare. For example, Rorig et al. (2007) investigated the role of the instability and content of moisture at the midlevel (850–500 hPa). Some research has been done so far on the meteorological conditions of fire-igniting thunderstorms near the upper troposphere, where electrification occurs. For example, Wallmann (2004) and Nauslar (2010) included the dynamics of the upper troposphere and the tropopause in the forecasting of dry thunderstorms over the USA.
Lightning discharges can be classified as intra-cloud (IC), cloud-to-cloud (CC), and cloud-to-ground (CG) discharges. CG lightning discharges are initiated between two cloud regions with opposite sign electrical charges before escaping from clouds (Rakov and Uman, 2003). After the onset of the discharge, an advancing streamer corona guides the propagation of the leader, a high-temperature plasma channel. When the leader connects the ground to the main charged cloud layer, electrical charge travels across the channel, producing one or several return strokes (RSs). The majority of the RSs are composed of a highly impulsive electrical current with a duration of less than 10 ms, producing electromagnetic radiation that can be detected thousands of kilometers away by lightning location systems (LLSs). However, some CG flashes have a continuing current phase lasting between tens to hundreds of milliseconds. These types of CG lightning discharges are known as long continuing current lightning flashes (LCC lightning flashes), which are able to transport a significant amount of electrical charge between the cloud and the attachment point. The continuing current phase of the discharge emits a radio signal in the extremely low frequency (ELF) range of frequencies, preventing their detection by typical LLSs that are developed to report radio signals emitted by lightning discharges in the very low frequency (VLF) range. However, the continuing phase of LCC lightning can be detected from optical measurements (Fuquay et al., 1967; Adachi et al., 2009). In this work, we use optical observations reported from the space-based instrument Lightning Imaging Sensor (LIS) to investigate the continuing current phase of lightning discharges over Europe (Bitzer, 2017). For a more extensive description of the physical characteristics of lightning discharges and their electromagnetic emissions, we refer to Rakov and Uman (2003),
Some evidence suggests that LCC lightning flashes are precursors of LIWs. This was originally proposed by McEachron and Hagenguth (1942), working with laboratory sparks, who suggested that ignition by natural lightning is usually caused by a discharge having an unusual LCC phase. Later, in 1967, this hypothesis was confirmed by Fuquay et al. (1967), who reported seven cases of fire-igniting lightning strokes with durations between 40 and 282 ms. Fuquay et al. (1967) and Adachi et al. (2009) showed that the optical signal emitted by lightning discharges can be related to the duration of the electrical discharge.
Bitzer (2017) reported the first tropical and midlatitude climatology of LCC lightning discharges with a duration larger than 10 ms. Bitzer (2017) provided the total number of LCC lightning, with durations up to 40 ms, from optical lightning measurements reported by LIS on board the Tropical Rainfall Measuring Mission (TRMM) satellite, following a low-Earth orbit between 1997 and 2015, providing lightning measurements in the range of latitude between 35∘ N and 35∘ S. According to Bitzer (2017), LCC lightning discharges tend to occur in oceanic and winter thunderstorms, where the updrafts are weaker than in typical summer thunderstorms over land. Bitzer (2017) proposed that thunderstorms with weaker updrafts would produce small charging rates, allowing the charging process to develop larger charge regions before the onset of lightning and providing the discharge with more energy to be transferred. However, the TRMM satellite did not cover the European continent. LIS is now operating on board the International Space Station (ISS), covering, for the first time, the Mediterranean Basin and providing optical measurements of the duration of lightning pulses.
In this work, we investigate the meteorological characteristics of fire-producing thunderstorms and the electrical characteristics of the lightning-igniting fires in the Mediterranean Basin. This approach will serve to improve fire forecasting methods and atmospheric models including fire-emissions. As we cannot directly connect LIWs to LCC flashes using LLSs, we search for shared meteorological conditions. We develop the first climatology of LCC lightning over Europe from the lightning data provided by LIS on board the International Space Station (ISS-LIS), with a duration longer than 20 ms, and its possible relationship with the occurrence of LIWs. This duration is lower than the lowest duration of the continuing phase of a fire-igniting lightning reported by Fuquay et al. (1967) (40 ms) but enough to be considered as a LCC lightning flash. In particular, we focus our analysis on the Iberian Peninsula (Spain, Portugal, and Mediterranean France) and Greece. We do not include data over Italy because they were not accessible. We combine five fire databases from these countries, with lightning measurements provided by the World Wide Lightning Location Network (WWLLN) and the Earth Networks Total Lightning Network (ENTLN). We use meteorological data provided by the European Centre for Medium-Range Weather Forecasts (ECMWF) ERA5 reanalysis data set and by the Spanish State Meteorological Agency (AEMET). For the first time, we combine LCC lightning data provided by LIS on board the International Space Station (ISS) with meteorological data sets.
Table 1 shows the main characteristics of the data sets employed in this study. In this section, we describe each of the data sets and the employed methodology to investigate the meteorological conditions of LIWs and LCC lightning flashes.
Table 1Data sets used in this study. References are given in the text of Sect. 2. Note: DE – detection efficiency; VLF – very low frequency; CAPE – convective available potential energy; CBH – cloud base height; LIWs – lightning-ignited wildfires; CTH – cloud top height.

2.1 Lightning measurements
We use ground-based lightning data provided by the lightning locations systems of WWLLN and ENTLN to search the lightning candidates for the forest fires in the periods 2009–2013 and 2014–2019, respectively. In addition, we use lightning optical measurements reported by ISS-LIS between 2017 and 2020 to investigate LCC lightning over Europe.
The ground-based WWLLN is composed by a global network of VLF sensors that can provide the position, time of occurrence, and energy radiation by lightning discharges (Dowden et al., 2002; Rodger et al., 2005). WWLLN is more sensitive to CG lightning discharges than IC, with a total global stroke detection efficiency (DE) between 2009 and 2013 of 8 %–13 % (Hutchins et al., 2012a; Rudlosky and Shea, 2013; Bitzer et al., 2016). The stroke location accuracy of WWLLN is between 5 and 10 km, while the temporal accuracy is about tens of microseconds (Abreu et al., 2010; Rudlosky and Shea, 2013). In this work, we use the relationship between the energy of the strokes measured by WWLLN and the peak current of the discharge, as reported by Hutchins et al. (2012b), to estimate the peak current of the fire-igniting lightning.
The ground-based ENTLN is a global network composed of VLF sensors that provide the position, time of occurrence, polarity, and peak current of lightning strokes. ENTLN has a DE of about 90 % for CG strokes over the USA (Zhu et al., 2017; Lapierre et al., 2020) and a total global stroke DE of about 57 % (Bitzer et al., 2016). The median stroke location error is 631 m (Mallick et al., 2015). In this work, we use the flash product provided by ENTLN. This product is based on the flash criteria proposed by Liu and Heckman (2011) to cluster these strokes into flashes, where two strokes are part of the same flash if they occur in a 0.7 s temporal window and in a 10 km spatial window.
After the end of operation of LIS on the TRMM satellite in 2015, a similar instrument was placed on the ISS for a 2- to 4-year mission, starting in March 2017, covering latitudes between 54.3∘ N and 54.3∘ S (Blakeslee et al., 2014, 2020). LIS detects optical emissions from lightning with a frame integration time of 1.79 ms (Bitzer and Christian, 2015) and with a spatial resolution of 4 km (Blakeslee et al., 2020). LIS assorts contiguous events into groups and clusters groups into flashes with a temporal criteria of 330 ms and a spatial criteria of 5.5 km (Mach et al., 2007). Bitzer (2017) proposed a method to identify LCC lightning flashes from the groups reported by TRMM-LIS. According to Bitzer (2017), optical emissions detected in five or more consecutive frames (time contiguous groups) that are in the same flash can be classified as a LCC lightning flash. In this work, we use the method proposed by Bitzer (2017) to produce a climatology of LCC lightning flashes over Europe based on ISS-LIS lightning measurements between March 2017 and September 2020. We use 20 ms as the lower limit to classify a flash as a LCC flash in order to avoid introducing CG flashes without continuing currents (typical CG) into our climatology.
2.2 Forest fire databases
The data of fires in Spain is provided by the Spanish Ministerio de Agricultura, Pesca y Alimentación (López-Santalla and López-Garcia, 2019). The database includes fires for the whole of Spain between 1968 and 2015 and for all the regions, except for the region of Castilla y León between 2016 and 2017. The causes of fires are provided when known. LIWs are identified by the Spanish Ministerio de Agricultura, Pesca y Alimentación, using lightning data from the Spanish State Meteorological Agency (AEMET). As the set of forest fires between 2016 and 2017 is not complete, we will exclude them from the analysis, except for calculating the spatial flash density associated with LIWs. The total number of fires in this database between 2009 and 2015 is 92 187, among which 3162 were ignited by lightning (about 3.2 %). In this study, we do not include forest fires over the Canary Islands.
Data of fires in Portugal are provided by the Instituto da Conservação da Natureza e das Florestas (Fernandes, 2015). The database includes fires between 1980 and 2015. The cause of most fires is not provided. The total number of fires in this database, between 2009 and 2015, is 163 190. We describe, in Sect. 2.4, a criterion to filter out some LIWs from this data set, thereby obtaining 359 LIWs (about 0.22 %).
Data of fires in the Mediterranean area in France are obtained from the Prométhée database (Délégation à la Protection de la Forêt Méditerranéenne, 2020). The database includes fires between 1973 and 2018. The causes of the fires are provided. In this study, we only include fires with reported geographical coordinates. The total number of fires in this database between 2009 and 2015, in which the geographical coordinates are provided, is 797, among which 36 were ignited by lightning (about 4.5 %).
The Hellenic Fire Service collects and publishes fire incidence data from 2000 onwards, after receiving (in the summer of 1998) the responsibility of fire extinction in Greece from the Forest Service, including the number of fires and the corresponding area burned (Koutsias et al., 2013). During the last few years, x and y coordinates of the fire ignition points have also been recorded but unfortunately without recording the fire cause. For 3 years during the period 2017–2019, these data were further checked for providing high positional accuracy and made available to be used here. The total number of fires in this database between 2017 and 2019 is 62 690. We use the criterion described in Sect. 2.4 to filter out some LIWs from this data set, thus obtaining 1999 LIWs (about 3.2 %).
2.3 Meteorological data and satellite measurements
We analyze the meteorological conditions of thunderstorms favoring fires or LCC lightning using meteorological data from the European Centre for Medium-Range Weather Forecasts (ECMWF) fifth generation reanalysis ERA5 (Hersbach et al., 2020) and the Cloud Top Height product (CTHP) provided by EUMETSAT (Schmetz et al., 2002). In addition, for some selected cases, we analyze the meteorological products provided by the Spanish State Meteorological Agency (AEMET; Gutiérrez Núñez et al., 2018).
ERA5 provides 1 h meteorological data using a 4D-Var assimilation scheme at 139 pressure levels with a horizontal resolution of 0.25∘. The product ERA5-Land provides meteorological data over land by replaying the land component of the ECMWF ERA5 climate reanalysis with an horizontal resolution of 0.1∘ (Poli et al., 2016). In this work, we analyzed the 1 h ERA5 meteorological data for cells and time steps containing lightning flashes reported by WWLLN and ENTLN in the Iberian Peninsula and Mediterranean France, for the period 2009–2015, and in Greece, for the period 2017–2019. In particular, we have included in the analysis ERA5 meteorological data for 133 147 and 78 701 cells per hour over, respectively, the Iberian Peninsula and Greece. In addition, we analyzed the ERA5 thermodynamical, dynamical, and microphysical variables for 8351 cells per hour, including lightning flashes reported by ISS-LIS over Europe between 2017–2019. The selected meteorological variables are the convective available potential energy (CAPE), the cloud base height (CBH), the horizontal wind components, the hourly accumulated precipitation, the specific humidity at 450 hPa and vertical profiles between ground and 200 hPa pressure level of the temperature, the relative humidity, the vertical velocity, the specific cloud ice water content, the specific cloud liquid water content, the specific rain water content, the specific snow water content, and the runoff index. The runoff index is the depth (in meters) the water would have if it were spread evenly over the grid box of ERA5 reanalysis, thus representing the amount of water contained in the soil.
AEMET provides meteorological measurements upon request. In this work, we selected some fire-igniting lightning flashes and some LCC lightning over Spain and collected radar echo top height measurements provided by AEMET (maximum height of the 12 dBZ echo). These heights correspond to the maximum heights populated by the precipitable particles.
We use the land cover map from 2015, produced by the European Space Agency (ESA) Climate Change Initiative (CCI) from the PROBA-Vegetation (PROBA-V) and Sentinel-3 OLCI (S3 OLCI) time series, to classify lightning flashes over coniferous and mixed forests. This classification of lightning flashes ensures that only lightning flashes occurring over areas with vegetation that can be ignited are included in our analysis, as most forest fires are due to the ignition of conifers or shrublands during the summer season (Pineda and Rigo, 2017). This map has a temporal resolution of 1 year and a horizontal resolution of 300 m. We consider that a lightning flash is taking place over coniferous or mixed forests if there is at least one 300 m×300 m grid cell with conifer or mixed trees 10 km around the flash position. In particular, we consider coniferous and mixed forests that include the label “needleleaved” in the D3.3.12-v1.3_PUGS_ICDR_LC_v2.1.x_PRODUCTS_v1.3 product. We use elevation data from the NASA Shuttle Radar Topographic Mission Farr et al. (2007) to obtain the elevation of LIWs.
The CTHP provided by EUMETSAT is based on measurements of the Meteosat Second Generation (MSG) satellites. The geostationary orbit of MSG satellites is centered at 0∘ N, 0∘ E so that data are reported at the rate of one Earth full-disk scan every 15 min. We investigate the CTH of fire-igniting thunderstorms because it is closely related to the level of convection in thunderstorms and the occurrence of lightning (Price and Rind, 1992). The CTHP is calculated by EUMETSAT from data acquired by the Spinning Enhanced Visible and InfraRed Imager (SEVIRI) instrument on board the MSG satellites, with a horizontal resolution of 4 km at the center of the orbit and a vertical resolution of 320 m that reaches a maximum altitude of 16 km. The CTHP has been provided every 15 min since June 2011, with a lower rate between 2009 and May 2011 (Schmetz et al., 2002). In this work, we collect all the possible CTH values for the lightning flashes reported by WWLLN and ENTLN in the Iberian Peninsula (and Mediterranean France) between 2012 and 2015. We also collect the CTH values for all the lightning flashes reported by ENTLN in Greece for the period 2017–2019.
2.4 Search of lightning candidates for the fires
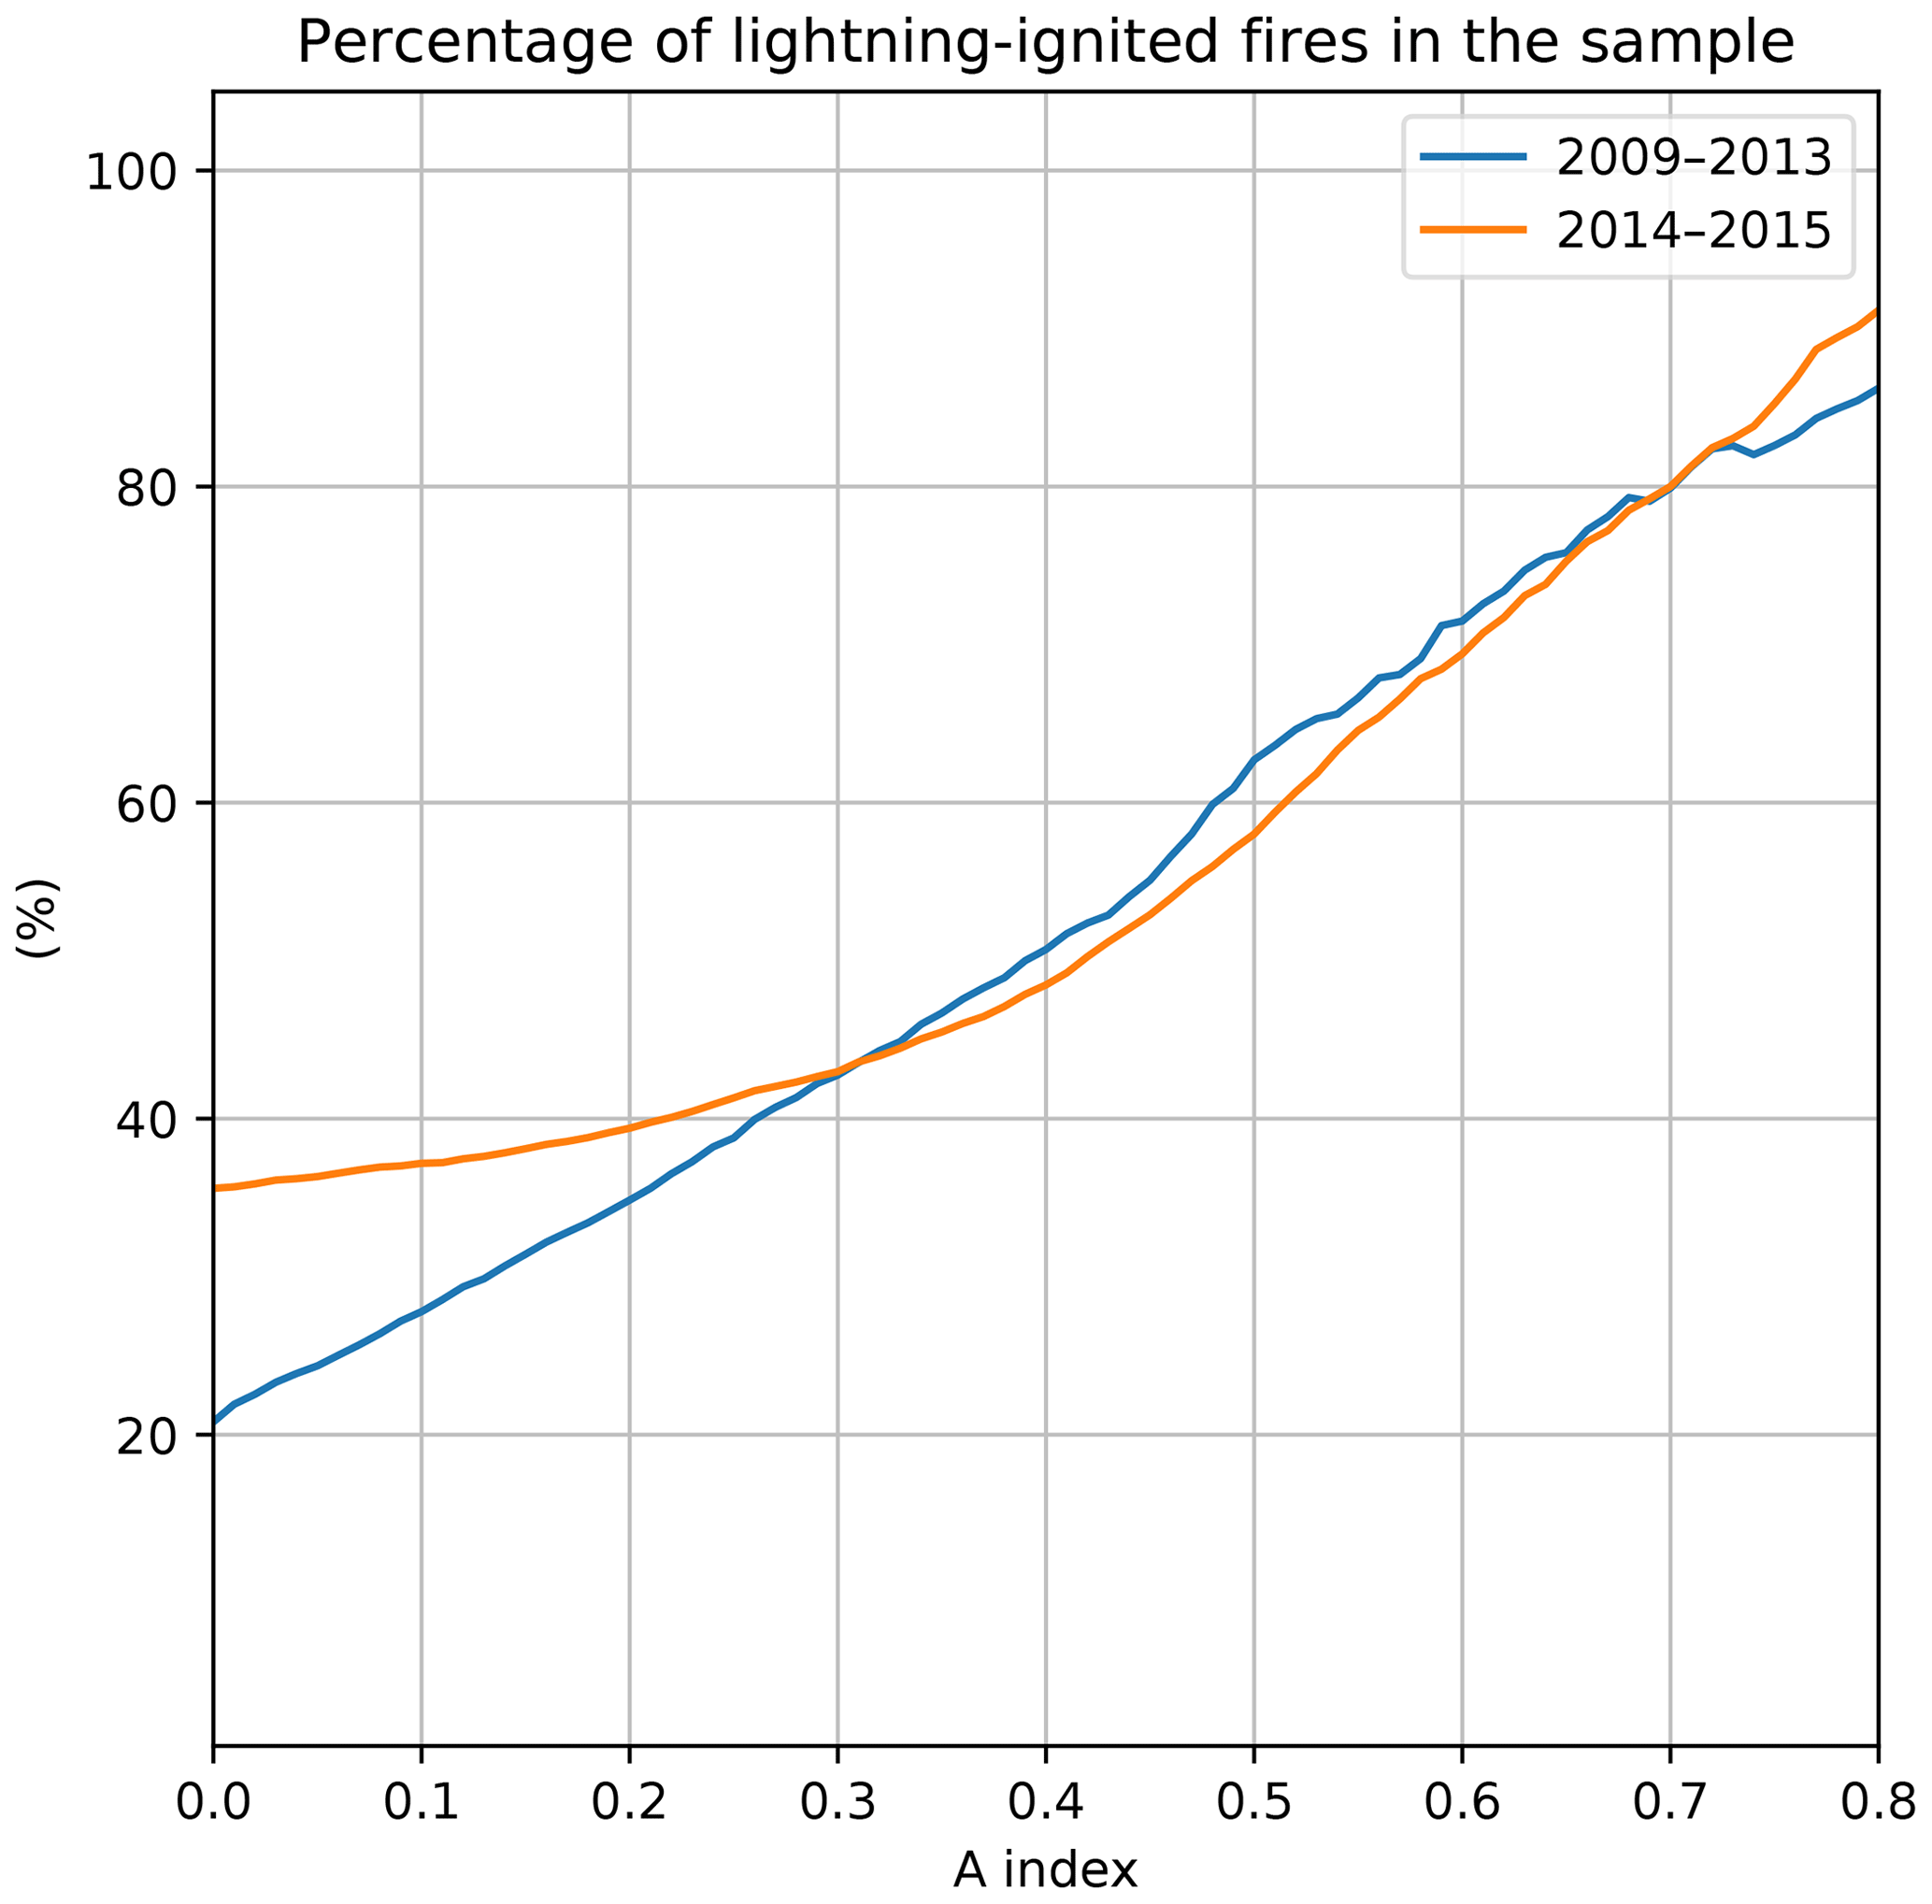
Figure 1Percentage of LIWs, with different A index values as the threshold, in Spain and France during the period 2009–2015.
We search the most probable CG lightning candidate for each fire using the proximity index A, proposed by Larjavaara et al. (2005b), as follows:
The proximity index A combines the distance between each fire and each lightning discharge (D) with the delay between them (T), which is also known as holdover. Parameters (Tmax) and (Dmax) correspond to the maximum holdover and distance between a fire and a lightning discharge to consider the latter as the cause of ignition. We set Tmax=14 d and Dmax=10 km (Larjavaara et al., 2005b). In the case of no CG lightning discharges taking place within the proposed spatiotemporal window with respect to a fire, we consider that the fire was not ignited by lightning. However, the proximity index can be greater than 0 for fires that were not ignited by lightning.
In the case of the database of fires taking place in Spain and Mediterranean France, the cause of ignition is provided. Therefore, we can easily discard the fires with A>0 that were not ignited by lightning. However, the databases of fires in Portugal and Greece do not provide the cause of ignition, and the proximity index can be greater than zero if a lightning discharge preceded a fire, even if the discharge did not cause the ignition. In order to discard the fires of Portugal and Greece that were not ignited by lightning, we estimate that the threshold value of the A index ensures that at least 80 % of the selected fires are ignited by lightning. To this end, we use the Spanish and French databases of fires. We plot, in Fig. 1, the percentage of fires in Spain and France ignited by lightning using different values of A as a threshold. According to this figure, setting the minimum value of A as 0.7 ensures that 80 % of the selected fires are produced by lightning. Therefore, in our analysis of LIWs over Portugal and Greece, we only consider fires with A≥0.7. This approach can exclude a significant number of LIWs from the analysis. However, it ensures that the sample is not influenced by fires that were not ignited by lightning. Following this approach, we find 359 (0.22 % of the total) and 1999 (3.2 % of the total) LIWs with A≥0.7 in Portugal and Greece, respectively. We have obtained a lower percentage of LIWs in Portugal, with respect to all fires, than in Greece, Spain, and Mediterranean France due to the low DE of WWLLN. Another interesting feature of Fig. 1 is that the percentage of LIWs in the sample with A values lower than 0.3 is higher in the period of 2014–2015 than in 2009–2013. This difference can be explained by the higher DE of ENTLN than WWLLN in the Iberian Peninsula.
As explained in Sect. 2.3, we will limit our analysis to LIWs occurring between May and September and in coniferous and mixed forest.
2.5 Classification of LCC lightning flashes
The standard ISS LIS product includes lightning data at event, group, and flash level (Mach et al., 2007). Groups are clustered into flashes if they occur within 330 ms and 5.5 km (Mach et al., 2007). In this work, we use group and flash data. We apply the method proposed by Bitzer (2017) for TRMM LIS to classify lightning flashes reported by ISS-LIS as LCC lightning flashes. We consider a flash as a LCC lightning flash if its optical emissions are detected in 10 or more consecutive frames, which means that the detected optical signal is continuous for about 20 ms. In addition, we have classified flashes with optical emissions detected in five or more consecutive frames (optical signal is continuous during about 10 ms; Bitzer, 2017) to investigate the possible relationships between the duration of the current and the meteorological conditions.
2.6 Analysis of meteorological conditions
We compare the meteorological variables of fire-igniting lightning flashes to typical CG lightning flashes over coniferous and mixed forest between May and September to identify the characteristics of fire-igniting flashes. In addition, we compare the meteorological conditions associated with LCC lightning flashes reported by ISS-LIS over land in Europe between May and September 2017–2020 to the meteorological conditions of typical lightning flashes to search for possible relationships between meteorology and the occurrence of LCC lightning flashes. The comparison of the meteorological variables is performed as follows:
-
We collect the 1 h values of the meteorological variables of every ERA5 grid cell containing lightning flashes. For forecasting purposes, we collect the maximum value 3 h before the discharge, as the value of CAPE during the passage of a thunderstorm is significantly lower than the value of CAPE during the development of the storm. For every lightning discharge, we collect the CTH value provided by EUMETSAT.
-
We define four samples, namely a first sample containing the meteorological variables of all the selected CG lightning discharges (CG lightning climatology), a second sample formed by the meteorological variables of all the fire-igniting lightning candidates (fire-igniting lightning climatology), a third sample containing the meteorological variables of all the LCC lightning flashes (LCC flashes climatology), and a fourth sample composed by the meteorological variables of all the lightning flashes reported by ISS-LIS without a continuing phase (typical lightning flashes).
-
We calculate the median values of each sample and compare them.
-
We perform a Kruskal–Wallis H test between both samples to check if the median value differs significantly across samples and calculate the corresponding p value. The p value is the level of marginal significance within the statistical hypothesis of equal median values, indicating the probability of an equal median for both samples. If the p value is lower than 0.05 (less than 5 % probability of equal median), we reject the hypothesis of equal medians and consider that both samples are statistically different (Kruskal and Wallis, 1952). It is important to mention that different medians do not necessary imply that the analyzed variable would be a good predictor of LIWs.
3.1 Lightning candidates for fires
The number of LIWs over coniferous and mixed forest included in our analysis over Spain, Portugal, France, and Greece are 3162, 359, 36, and 1999 (Table 1), respectively. In Fig. 2, we plot two maps showing the Iberian Peninsula and Greece, the position of coniferous/mixed forests, and the position of all the LIWs included in this study.
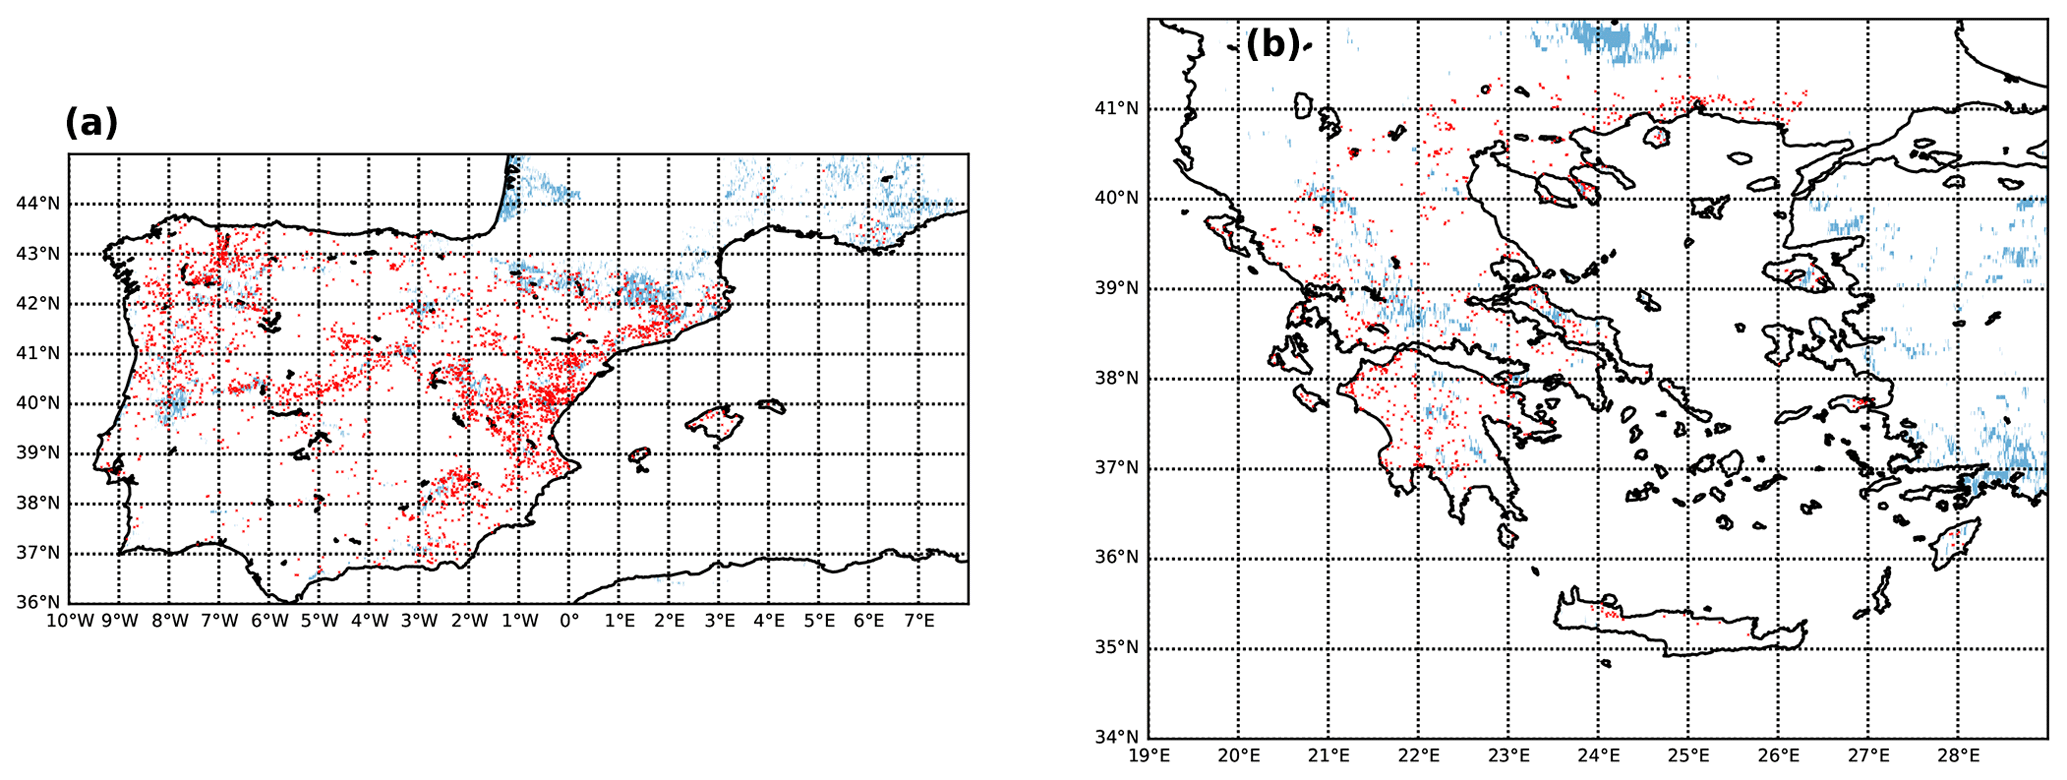
Figure 2Coniferous and mixed forest (blue area) and LIWs (red dots) included in this study. Panel (a) shows LIWs over the Iberian Peninsula between 2009 and 2015, while panel (b) shows LIWs over Greece between 2017 and 2019. We have degraded the resolution of the vegetation map in this plot from 300 m to 4.8 km.
From this point, we refer to the contiguous territory, including Spain, Portugal, Mediterranean France, and the Balearic islands, as the Iberian Peninsula. Figures 3a and 4a show the monthly total number of LIWs between May and September in the Iberian Peninsula and in Greece, respectively. In the Iberian Peninsula, the occurrence of LIWs reaches its peak in July, while in Greece the peak occurs in June and a secondary peak occurs in September.
Figures 3b and 4b show the frequency distribution of the lightning peak current of all the lightning taking place over coniferous and mixed forests and fire-igniting lightning during May and September for, respectively, the Iberian Peninsula and Greece. We do not include peak currents during 2009 and 2013, as the WWLLN lightning data do not include information about the polarity and the peak current of the flash. According to these figures, there is a slight shift to higher peaks with a positive polarity. The lack of positive lightning flashes reported by ENTLN with peak currents below 20 kA are a consequence of the data set that do not include positive CG flashes with peak currents below nearly 20 kA. Positive flashes with peak currents below nearly 20 kA are classified as IC (Cummins and Murphy, 2009).
Figures 3c–d and 4c–d show the distance and holdover between when the reported fire ignition and the lightning candidates for the Iberian Peninsula and Greece, respectively. In the Iberian Peninsula, the 25th, 50th, and 75th percentiles of the distance are respectively 1.30, 2.71, and 5.39 km, while in Greece they are 0.56, 0.93, and 1.48 km. The distance between fires and fire-igniting flashes is significantly lower in the case of Greece, possibly due to improvement in the detection efficiency of ENTLN between the periods 2014–2015 and 2017–2019. The 25th, 50th, and 75th percentiles of the holdovers in the Iberian Peninsula are, respectively, 0.48, 8.13, and 29.23 h, while they are 14.79, 29.43, and 48.78 h in Greece. Differences in the holdover between the Iberian Peninsula and Greece can be due to differences in the detection of fires by local authorities. Figures 3d and 4d suggest a diurnal cycle in the holdover that can be due to different conditions for arrival during the day, similar to what was obtained by Pineda and Rigo (2017) for LIWs over Catalonia. At noon, meteorological conditions can favor a rapid arrival after ignition (high temperature and low humidity). Ignitions separated from noon occur under meteorological conditions that do not favor rapid arrival.
We have found that the mean elevation of LIWs in the Iberian Peninsula is 775 m, while in the case of Greece the mean elevation is 319 m.
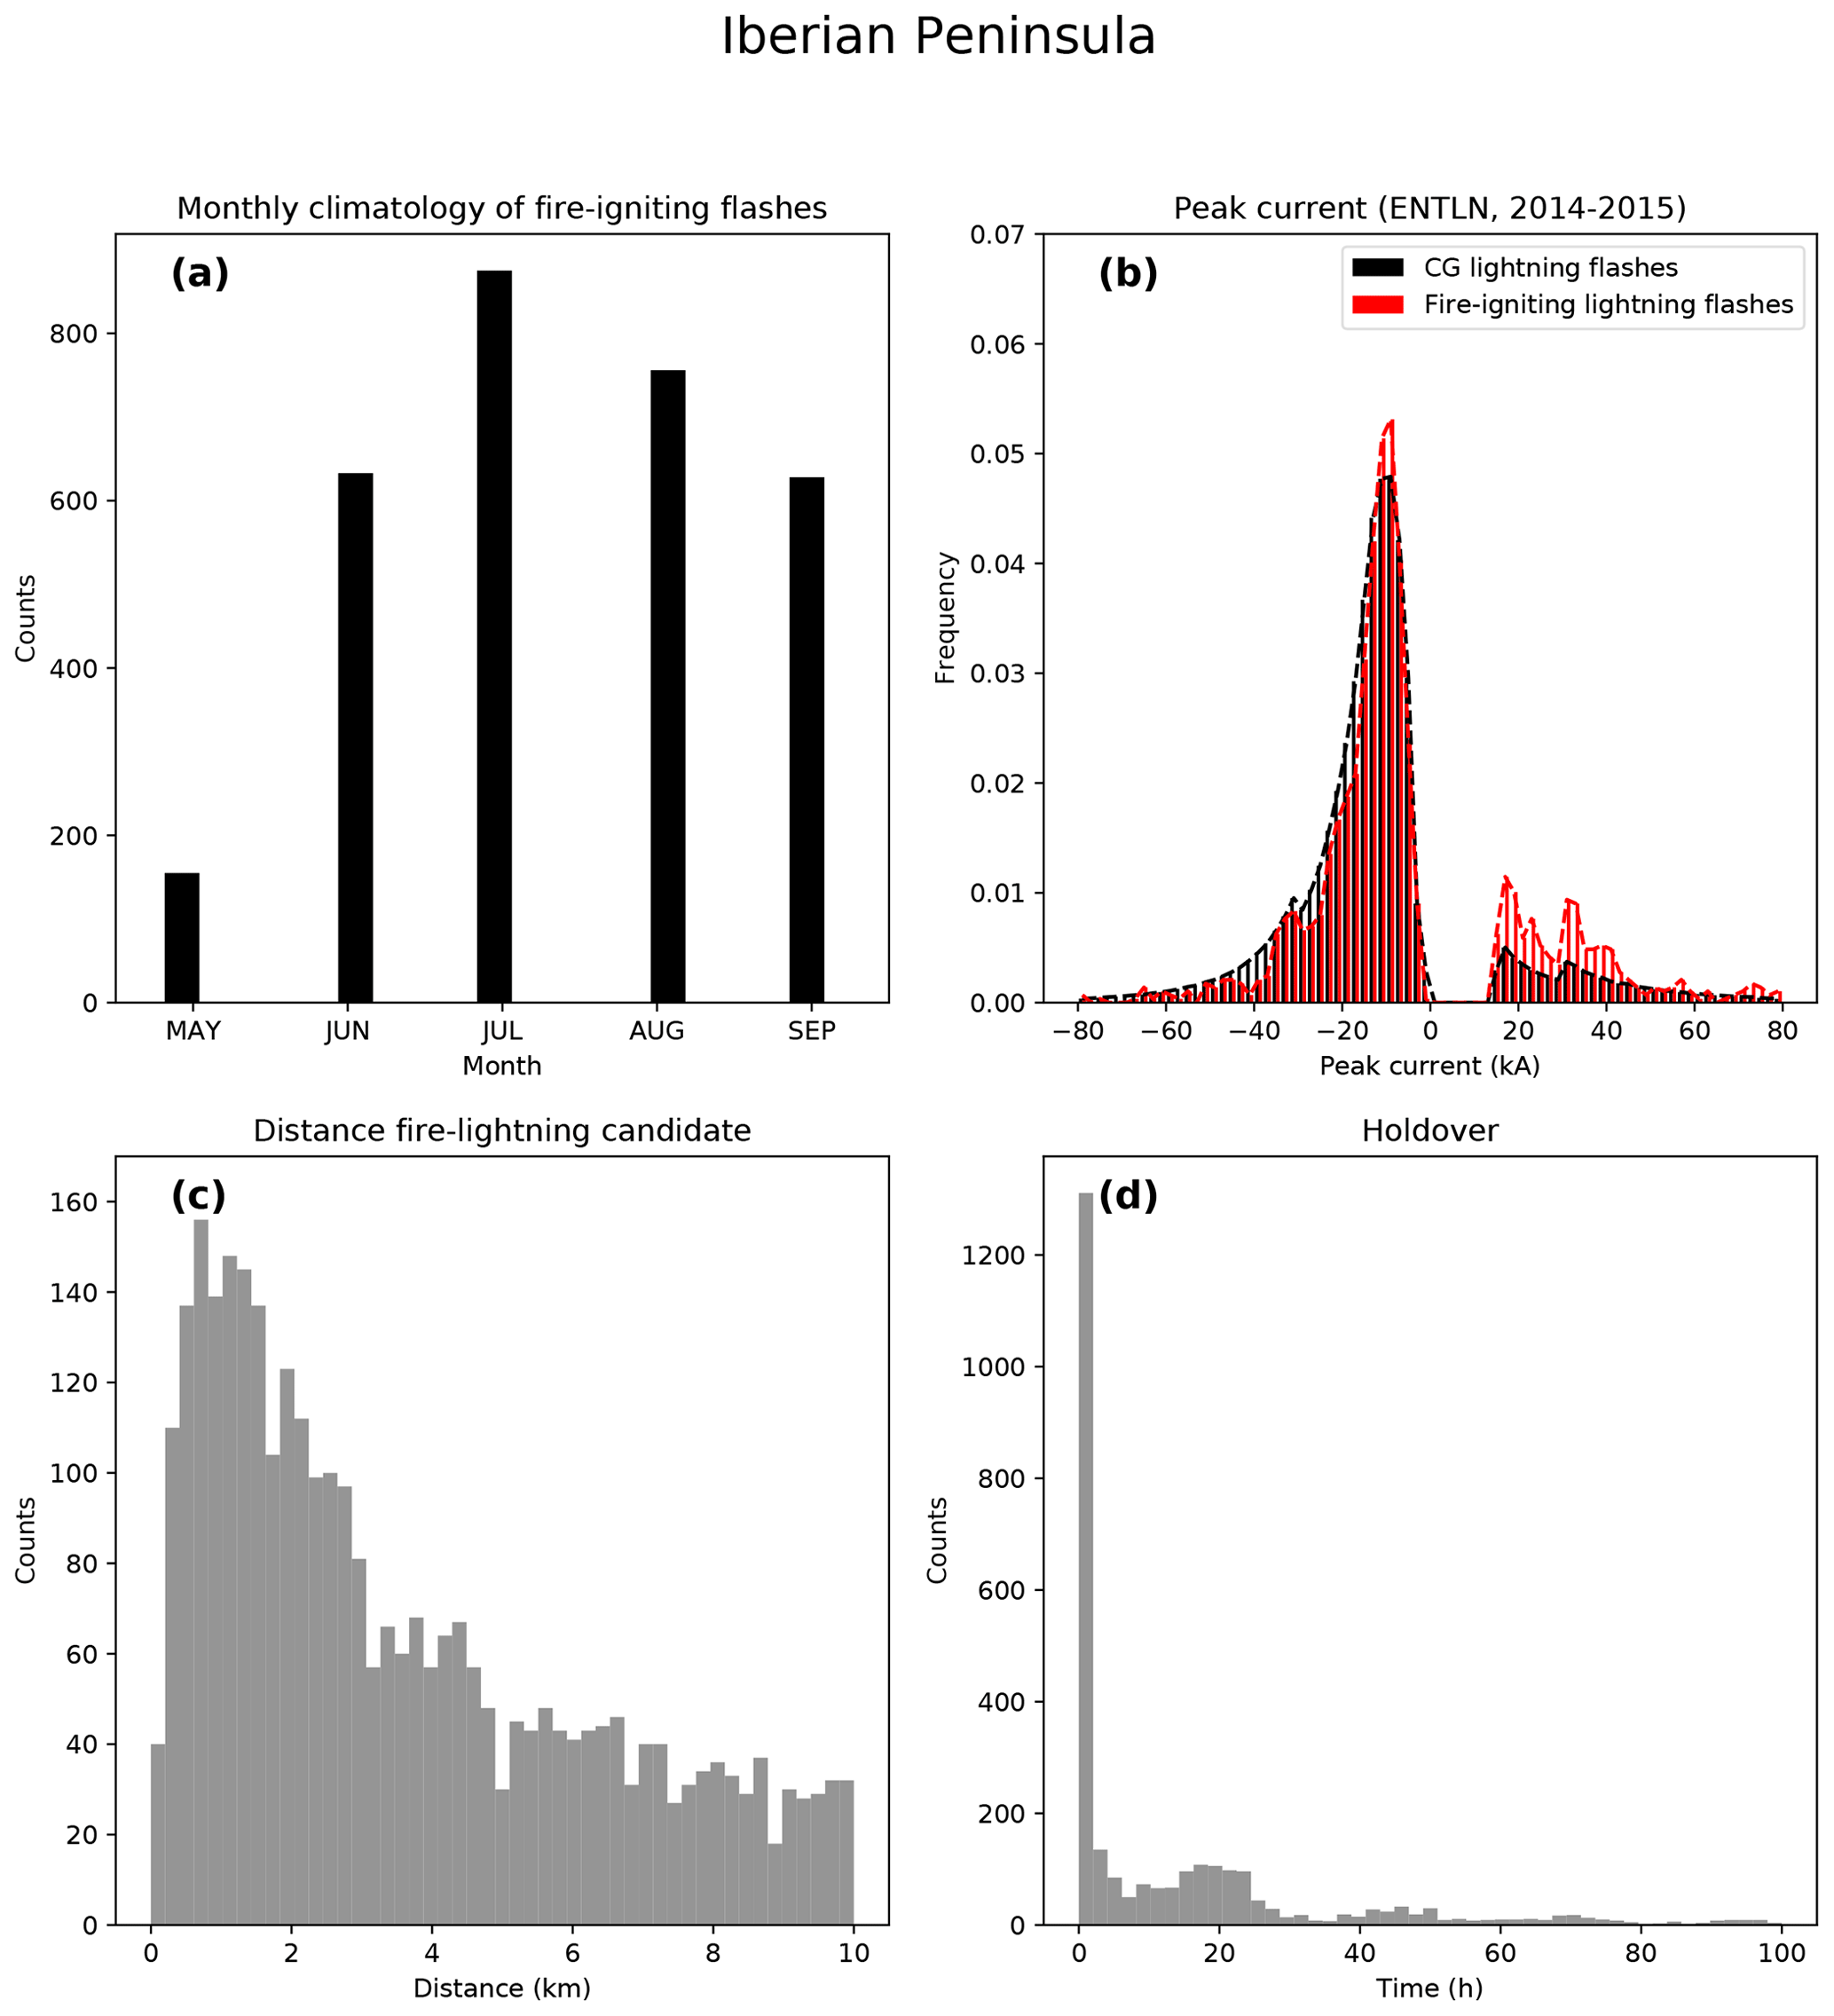
Figure 3Analysis of fire-igniting flashes in the Iberian Peninsula between 2009 and 2015. (a) Monthly distribution of the occurrence of fire-igniting lightning flashes. (b) Frequency distribution of the peak currents of all CG lightning taking place over coniferous and mixed forest during May and September (black) and of all fire-igniting lightning flashes (red) provided by ENTLN between 2014 and 2015. (c) Distribution of the distance between the reported position of ignition and the lightning candidate. (d) Distribution of the holdover (difference between the time of detection and the time of the lightning candidate).
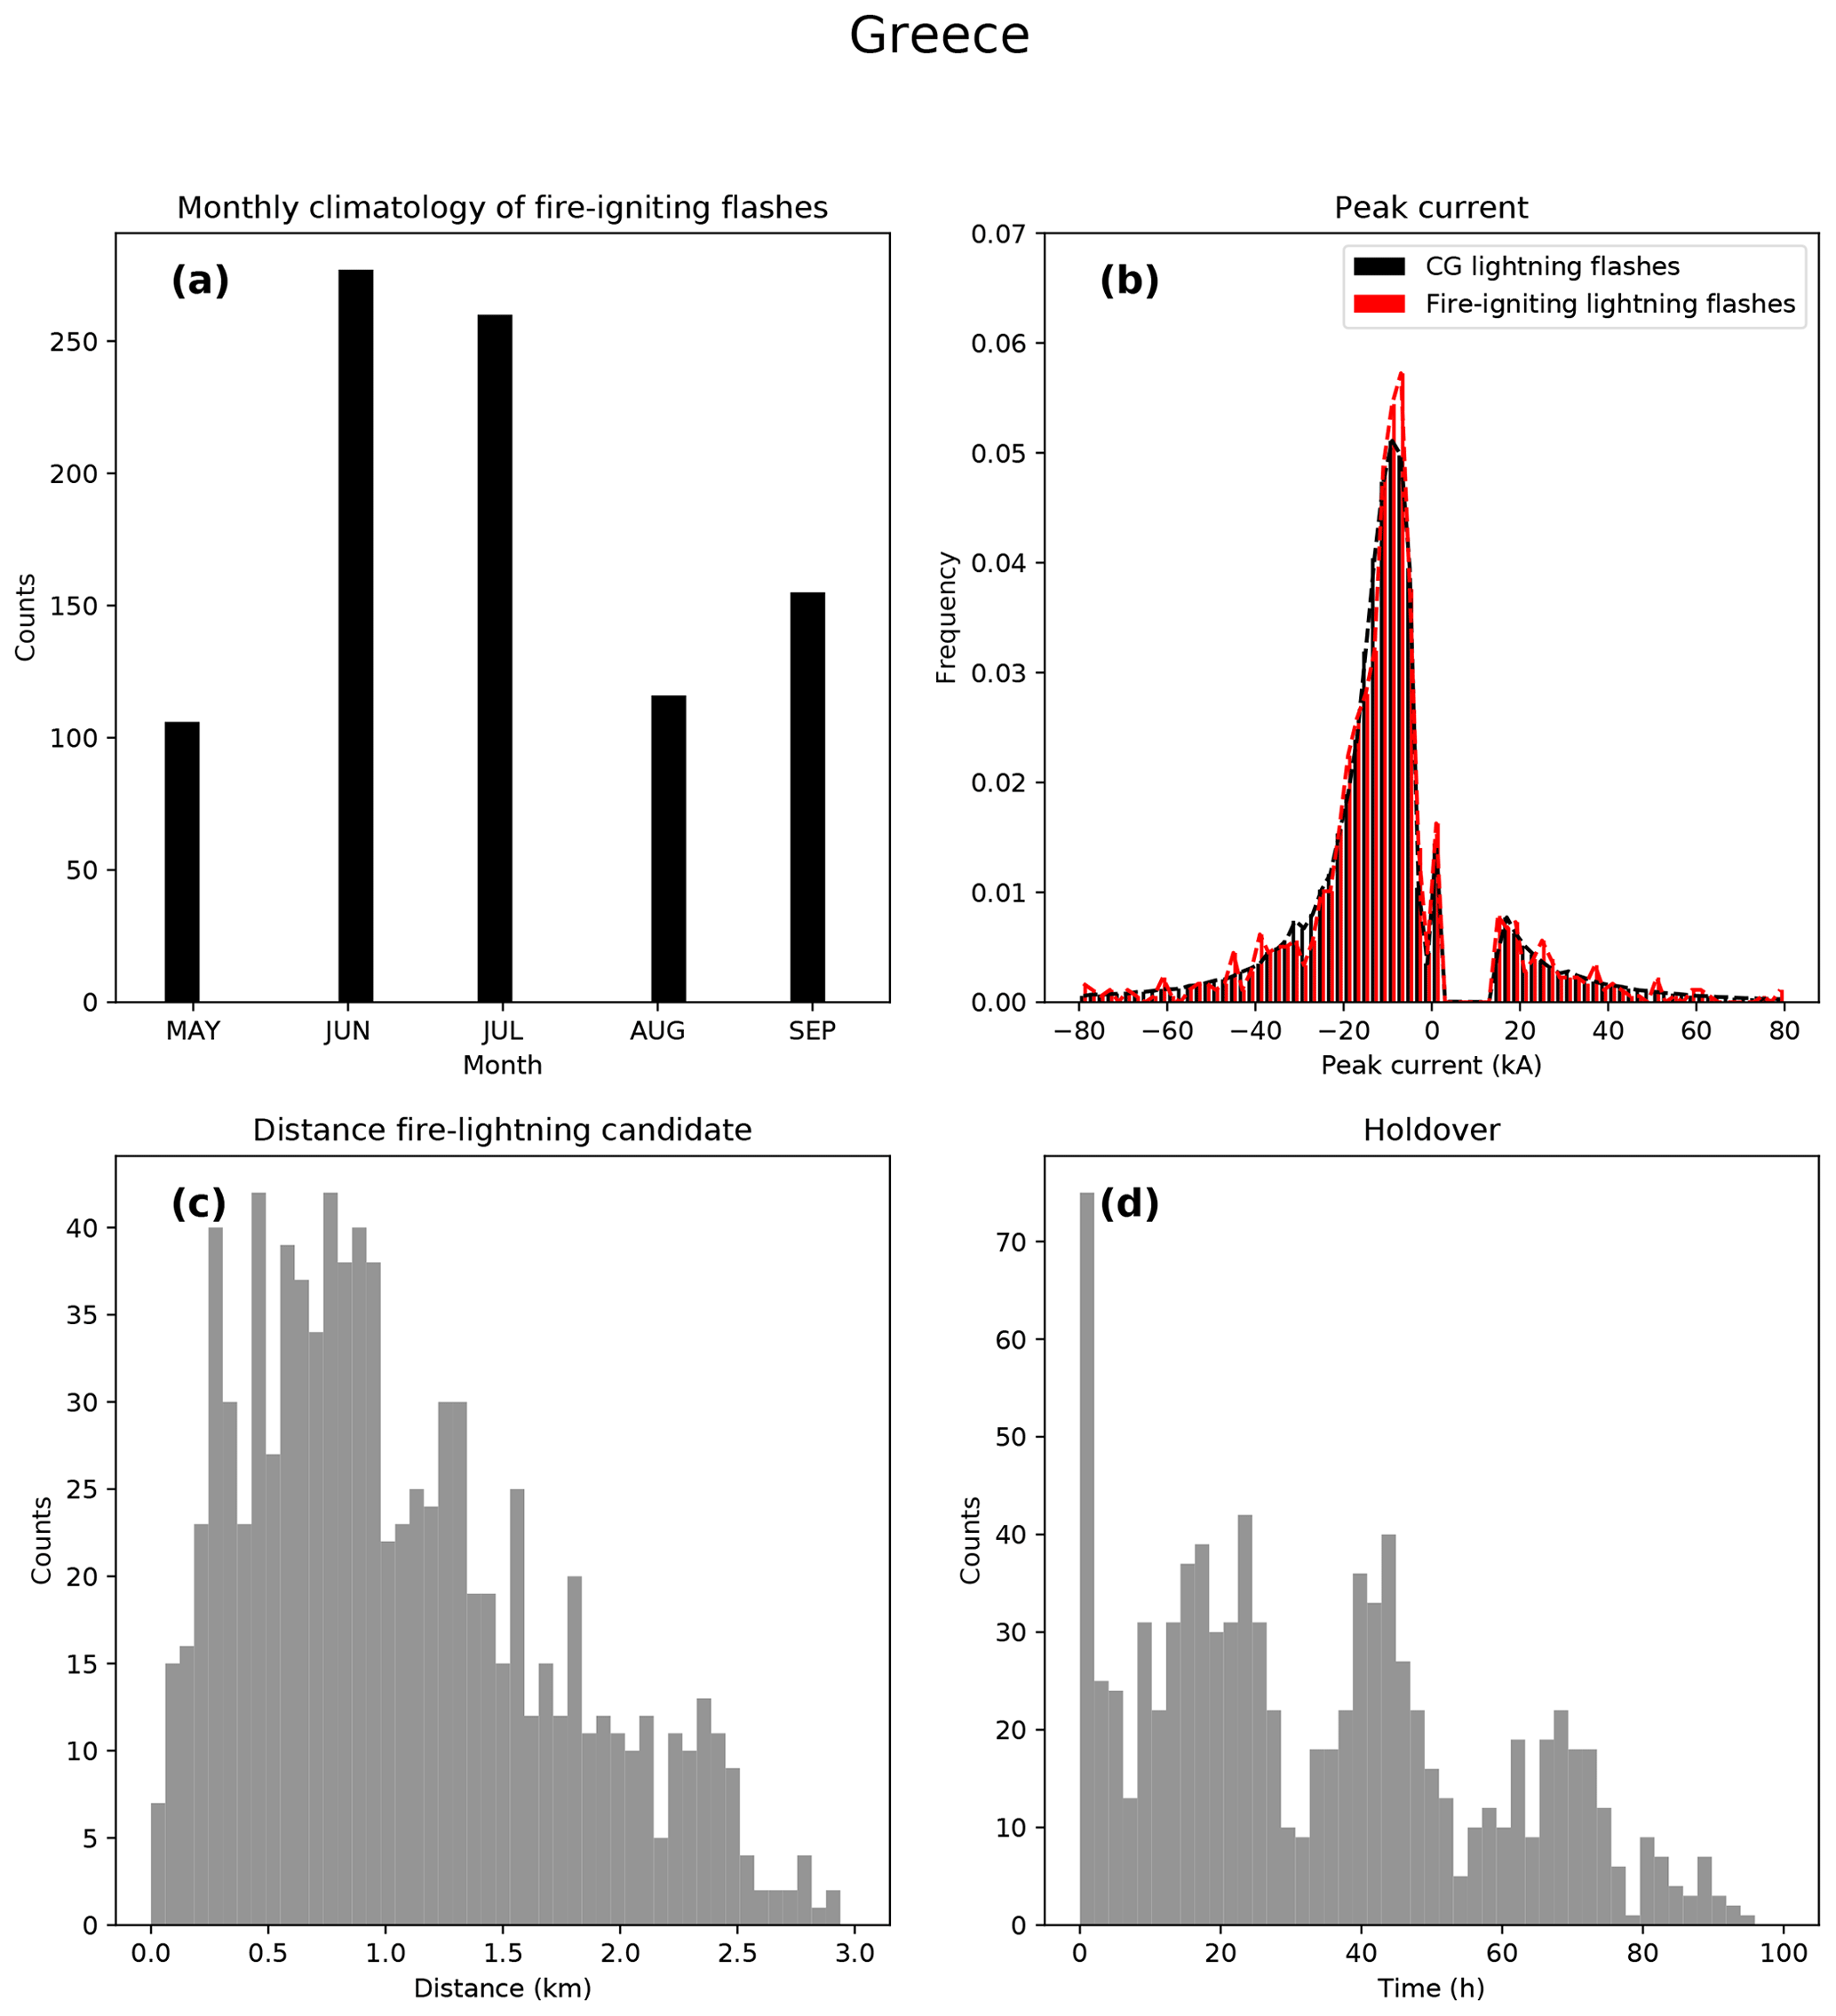
Figure 4Analysis of fire-igniting flashes in Greece between 2017 and 2019. (a) Monthly distribution of the occurrence of LIWs. (b) Frequency distribution of the peak currents of all CG lightning taking place over coniferous and mixed forest during May and September (black) and of all fire-igniting lightning flashes (red) detected with ENTLN. (c) Distribution of the distance between the reported position of ignition and the lightning candidate. (d) Distribution of the holdover.
3.2 Meteorological conditions of fire-igniting lightning
We investigate the meteorological conditions of LIWs using 1 h ERA5 reanalysis data. We compare several meteorological variables of fire-igniting lightning with typical CG lightning taking place over coniferous and mixed forest between May and September to find the meteorological conditions that favor the ignition of fires by lightning.
Figures 5a and 6a show the frequency distributions of CAPE for the CG lightning and the fire-igniting lightning climatologies for the Iberian Peninsula and Greece, respectively. We have selected the maximum value of CAPE 3 h before the occurrence of lightning. Comparison of both distributions indicates that high values of CAPE are more frequent in fire-igniting flashes than in typical CG lightning flashes. However, according to Nauslar (2010), lower tropospheric thunderstorm indices, such as CAPE, are not enough to forecast the potential of dry thunderstorms. Nevertheless, the p values lower than 0.05 suggest that local differences in the distributions of CAPE plotted in Figs. 5a and 6a are statistically significant.
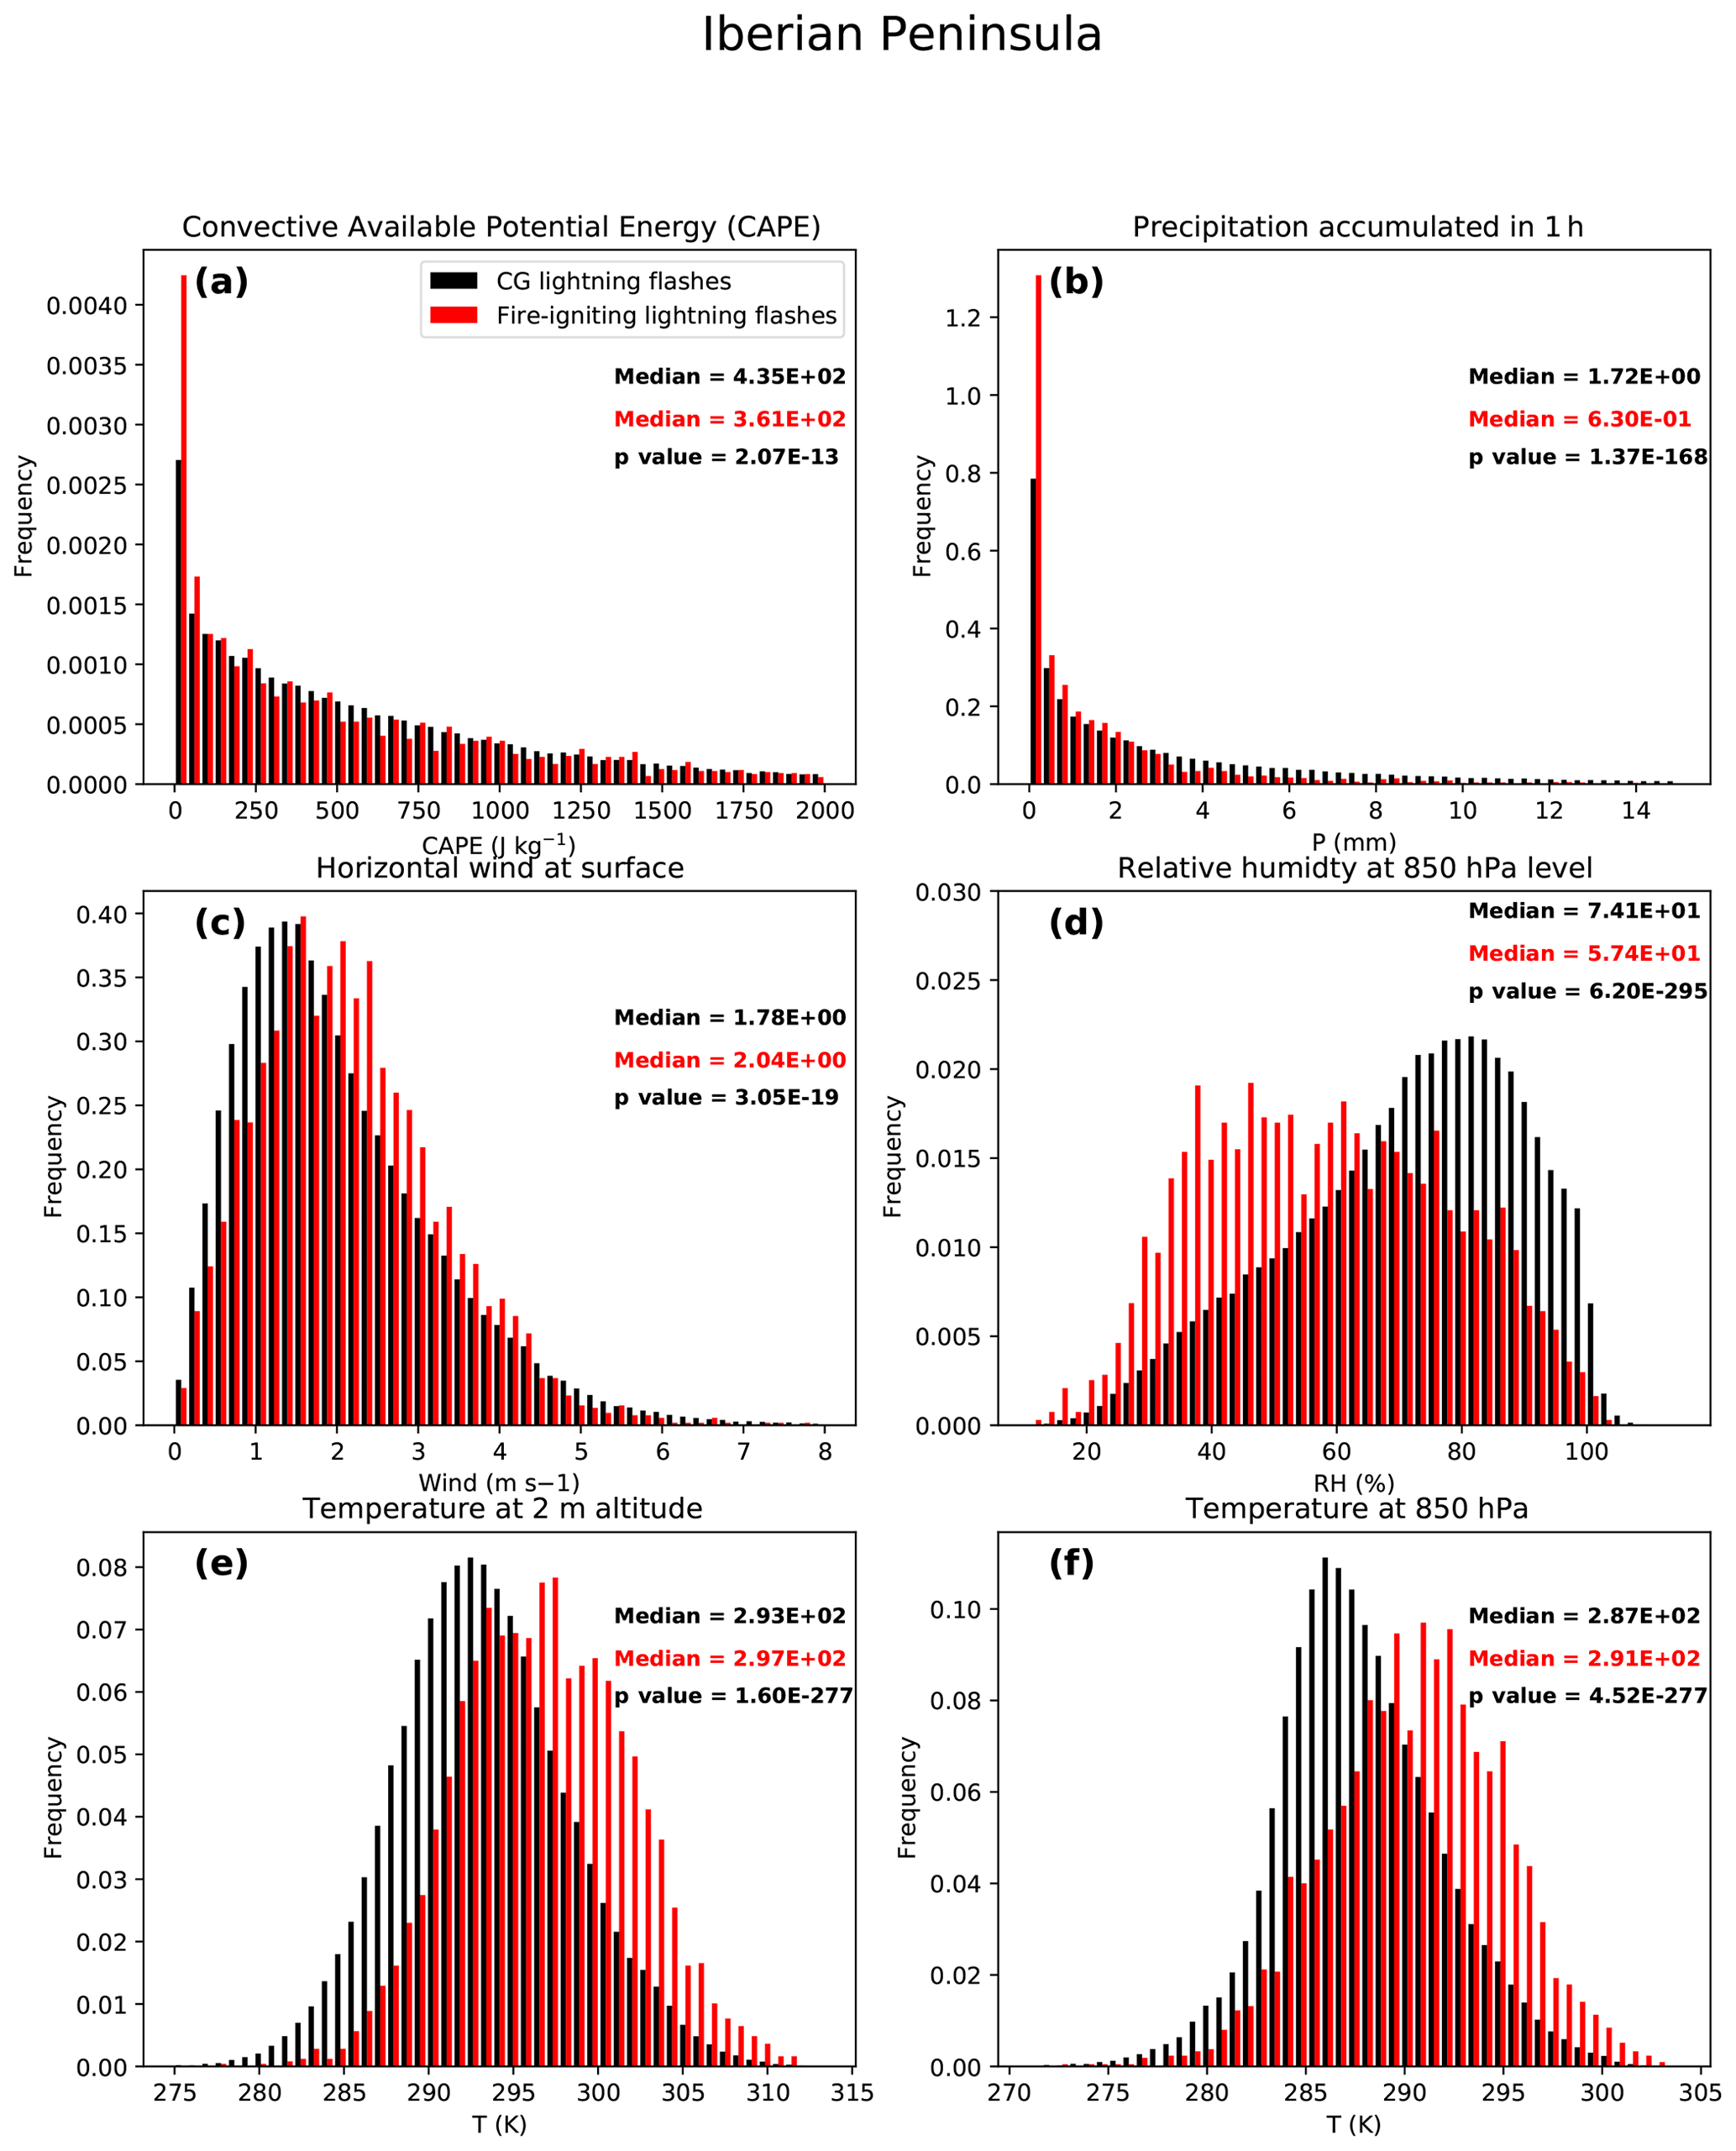
Figure 5Frequency distribution of the convective available potential energy (CAPE), the hourly accumulated precipitation, the horizontal wind at surface, the relative humidity at 850 hPa level and the air temperature at 2 m and at 850 hPa level for the CG lightning, and the fire-igniting lightning climatologies in the Iberian Peninsula between 2009 and 2015.
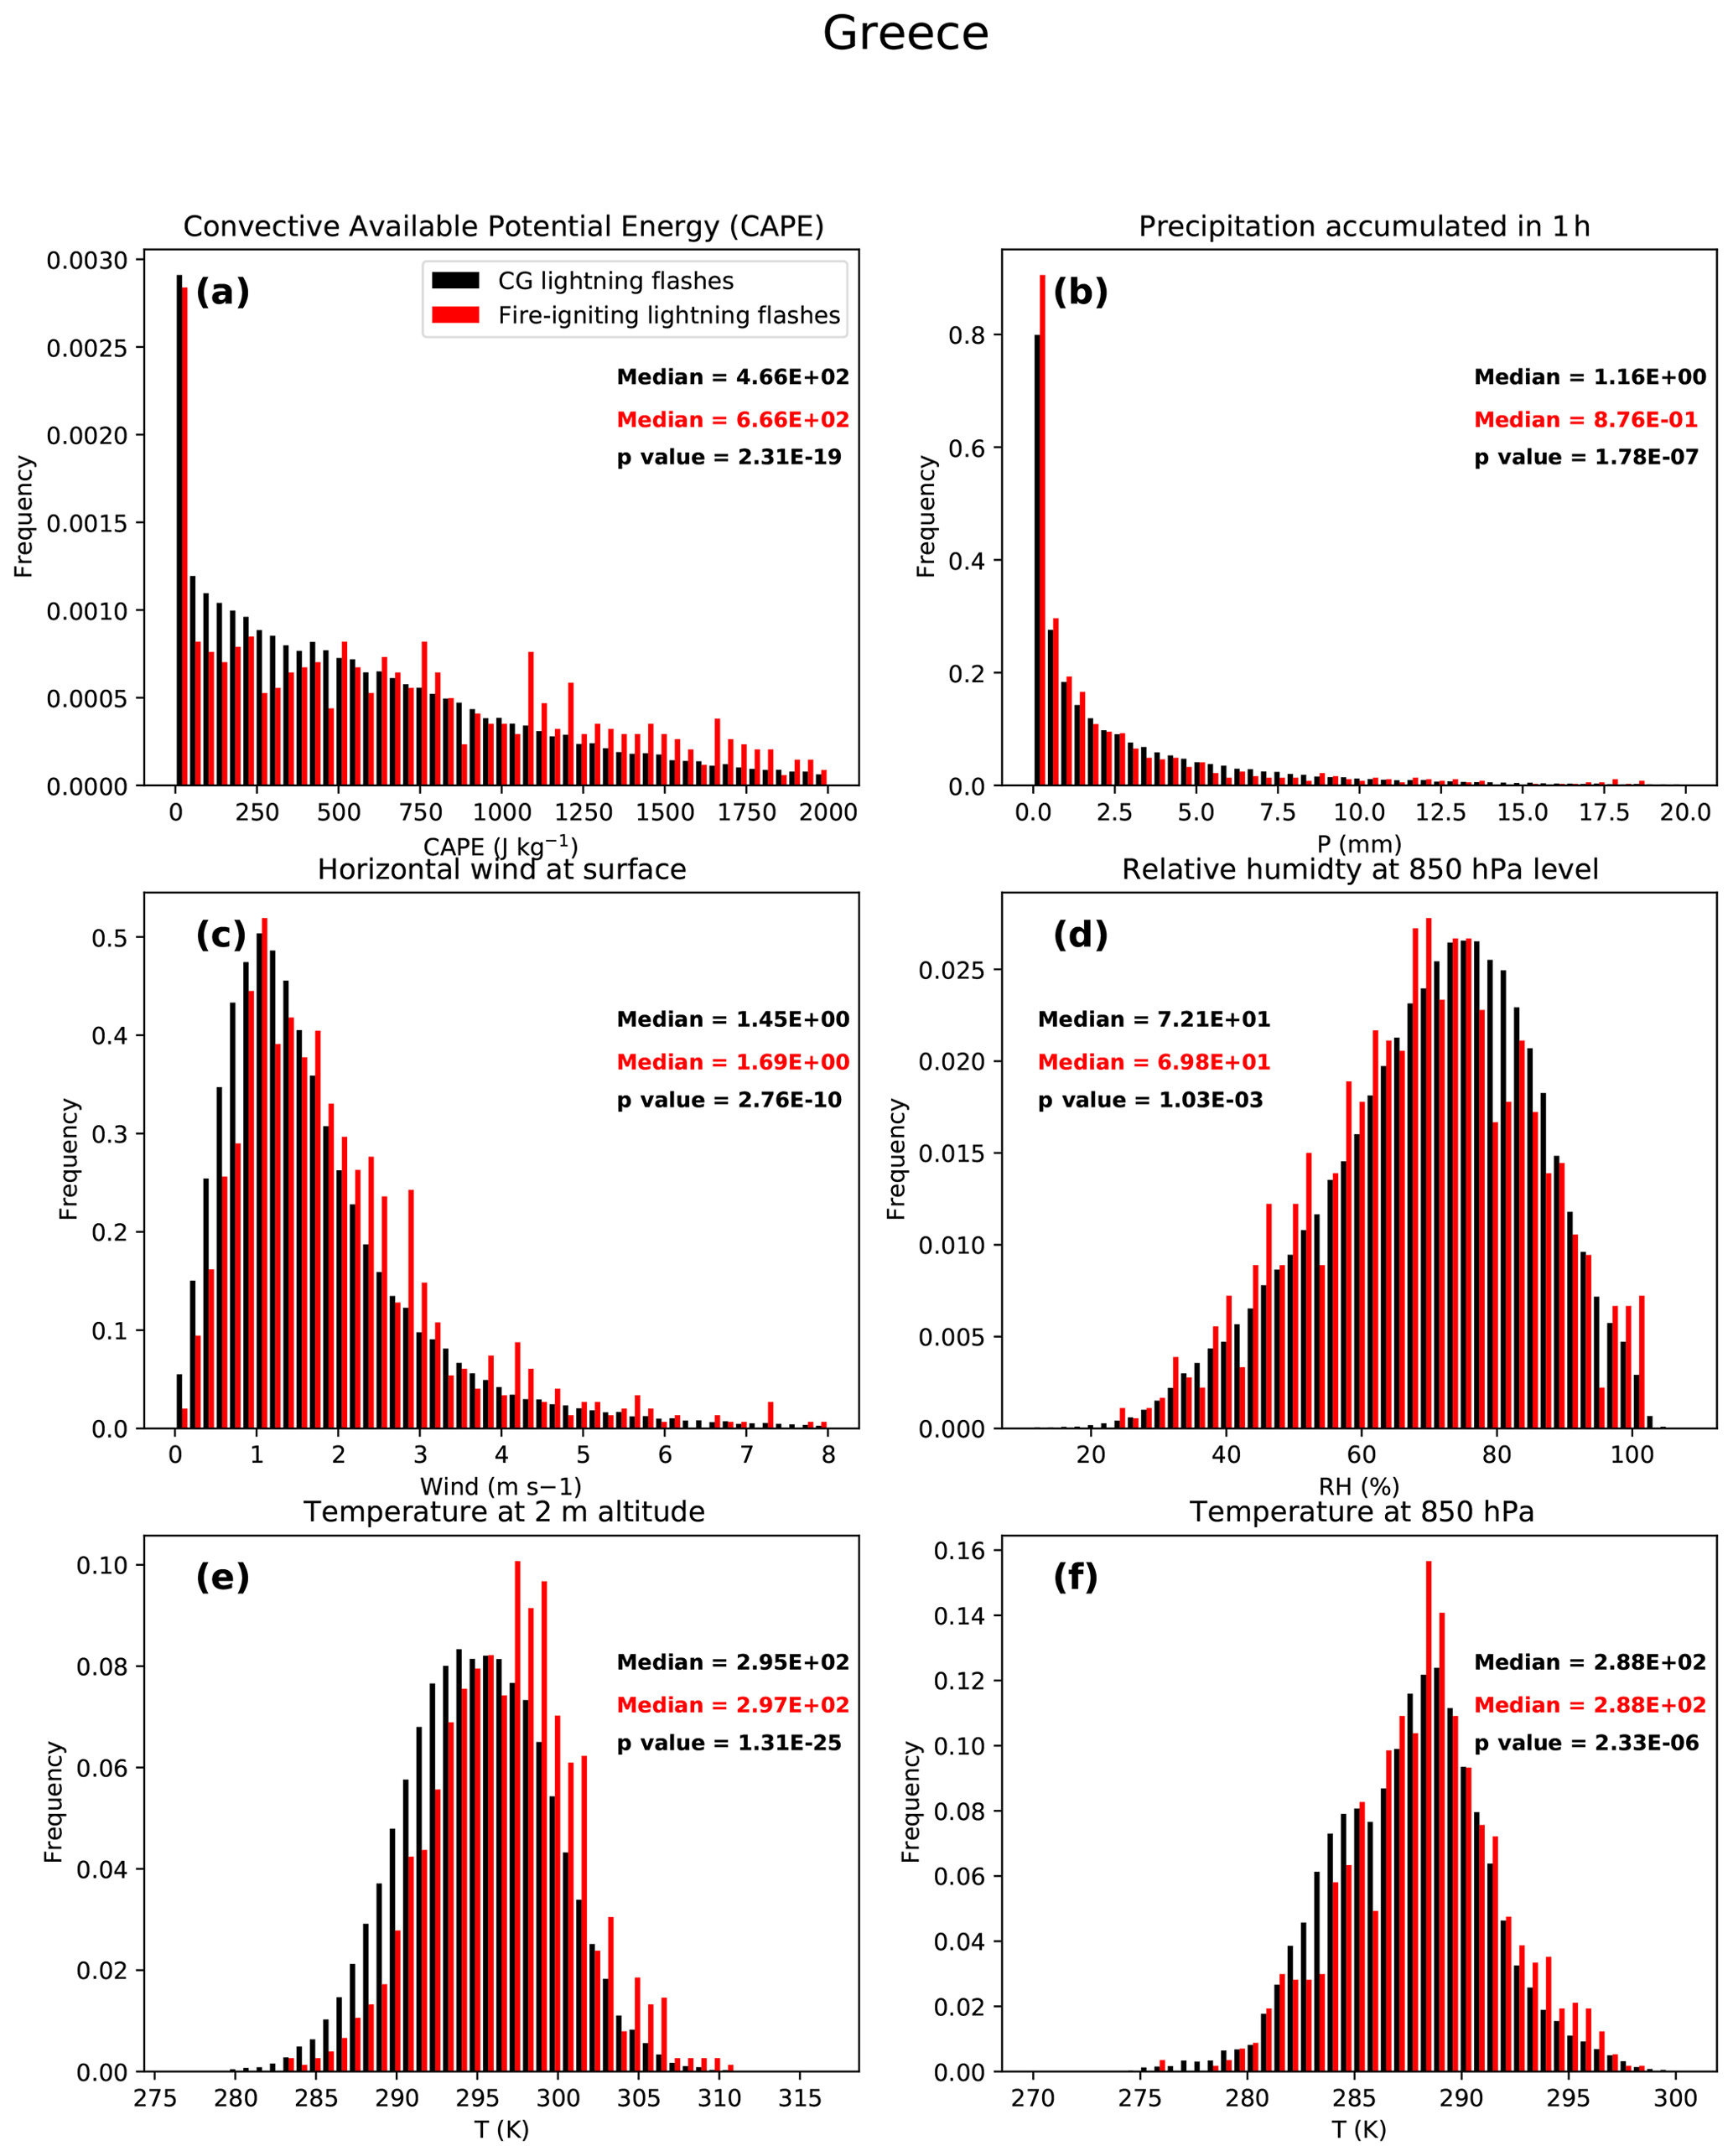
Figure 6Frequency distribution of the convective available potential energy (CAPE), the hourly accumulated precipitation, the horizontal wind at surface, the relative humidity at 850 hPa level and the air temperature at 2 m and at 850 hPa levels for the CG lightning, and the fire-igniting lightning climatologies in Greece between 2017 and 2019.
Figures 5b and 6b show the frequency distribution of the hourly accumulated precipitation for the CG lightning and the fire-igniting lightning climatologies. In accordance with previous studies over the USA (e.g., Colson, 1960; Hall, 2007; Pineda and Rigo, 2017), our results also suggest that thunderstorms with a low precipitation rate are associated with a higher probability of lightning-ignited fire production over Europe. In the Iberian Peninsula, the 25th, 50th, and 75th percentiles of the hourly accumulated precipitation for LIWs are, respectively, 0.10, 0.63, and 2.01 mm, while for Greece the percentiles are, respectively, 0.13, 0.88, and 2.76 mm. Again, the p values suggest that differences in the distributions of the accumulated precipitation plotted in Figs. 5b and 6b are statistically significant.
Holzworth et al. (2019) defined lightning superbolts as WWLLN strokes with energy above 106 J in the VLF band between 5 and 18 kHz. We have analyzed the stroke energies in the VLF band between 5 and 18 kHz for WWLLN data in the Iberian Peninsula. We have found 95 superbolts over coniferous and mixed forest and between May and September (among 207 116 strokes) and three superbolts that are also fire-igniting lightning candidates (among 1697 fire-igniting lightning candidates). Therefore, 0.18 % of fire-igniting lightning candidates are superbolts, while 0.05 % of all strokes in coniferous and mixed forest are superbolts. We can then conclude that the incidence of superbolts is higher for detected fire-igniting lightning than for typical lightning, although superbolts do not represent a significant portion of fire-igniting lightning.
We plot, in Figs. 5c and 6c, the comparison of the frequency distribution of the horizontal wind at the surface for the CG lightning and the fire-igniting lightning climatologies. Differences in the median values suggest that stronger winds favor the arrival of fires (distribution shifted to the right) in the Iberian Peninsula and Greece. The p values suggest that differences in the distributions of the horizontal winds plotted in Figs. 5c and 6c are statistically significant.
Figures 5d–f and 6d–f show the frequency distribution of, respectively, the relative humidity (RH) at 850 hPa level, the air temperature at 2 m altitude, and the air temperature at 850 hPa level pressure for the CG lightning and the fire-igniting lightning climatologies. The lower RH and the higher temperature at 850 hPa and 2 m altitude are characteristic conditions of dry thunderstorms over the USA (Rorig et al., 2007; Dowdy and Mills, 2012) and Australia (Bates et al., 2017; Dowdy, 2020). These conditions favor the evaporation of precipitable water before it reaches the ground (Nauslar, 2010), increasing the probability of fire ignition, survival, and arrival in the Iberian Peninsula and Greece. Differences in the distributions of RH and temperatures plotted in Figs. 5d–f and 6d–f are statistically significant, as suggested by p values lower than 0.05. However, Fig. 6d and f suggest that the RH at 850 hPa level and the air temperature at 850 hPa level pressure would not be good predictors for LIWs in Greece, as the plotted distributions of fire-igniting lightning and CG lightning are not substantially different. Differences in RH and temperature at 850 hPa between Greece and the Iberian Peninsula could be due to topographic effects. LIWs in the Iberian Peninsula tend to occur at higher elevation than in Greece (775 and 319 m, respectively). Therefore, meteorological conditions at 850 hPa would have a greater influence on the ignition, survival, and arrival of fires in the Iberian Peninsula than in Greece.
We have also calculated the median value of the variables plotted in Fig. 6, using A≥0.8 and A≥0.85. We have obtained the same results as when using A≥0.7 in terms of difference between meteorological variables of fire-igniting lightning and typical lightning. However, the p values are significantly higher, as the total number of fire-igniting lightning events included in the sample decreases significantly when increasing the minimum value of A.
The temperature difference between vertical levels can be used to investigate the instability of the atmosphere. We have found that the median temperature differences between 2 m altitude and 700 hPa pressure level for CG lightning in the Iberian Peninsula and Greece are, respectively, 16.8 and 19.0 K. In the case of fire-igniting lightning, the median temperature differences between 2 m altitude and 700 hPa pressure level are 18.8 and 19.9 K, respectively. These results indicate that the instability of the lower troposphere is higher in fire-igniting lightning flashes than in typical CG lightning flashes, as suggested by the analysis of CAPE (see Figs. 5a and 6a).
Figure 7 shows the frequency distribution of the CBH for lightning flashes over coniferous and mixed forest and for all the fire-igniting flashes, indicating that clouds with a high base favor the inception of LIWs. Clouds with a high base favor the evaporation of precipitation before it reaches the ground surface, increasing the probability of survival and arrival of LIWs. Clouds with a high base and low content of moisture in the low or mid level are the typical meteorological conditions of dry thunderstorms in the western USA, as demonstrated by Wallmann (2004) and Nauslar (2010). Our results suggest, for the first time, that clouds with a high base favor the occurrence and arrival of LIWs in the Iberian Peninsula and Greece. The p values suggest that differences in the distributions of CBH plotted in Fig. 7 are statistically significant.

Figure 7Frequency distribution of the CBH value for the CG lightning and the fire-igniting lightning climatologies in (a) the Iberian Peninsula between 2009 and 2015 and (b) in Greece between 2017 and 2019.
Finally, we have calculated the median value of the runoff index for fire-igniting lightning and for CG lightning flashes over coniferous and mixed forest. For the Iberian Peninsula, the median value of the runoff index for typical CG flashes is m, while it is m for fire-igniting flashes. For Greece, the median values of the runoff index for fire-igniting lightning and for CG lightning are and m, respectively. Therefore, the amount of water contained in the soil and, consequently, the state of vegetation can also influence the occurrence of LIWs.
3.2.1 Regional patterns over the Iberian Peninsula
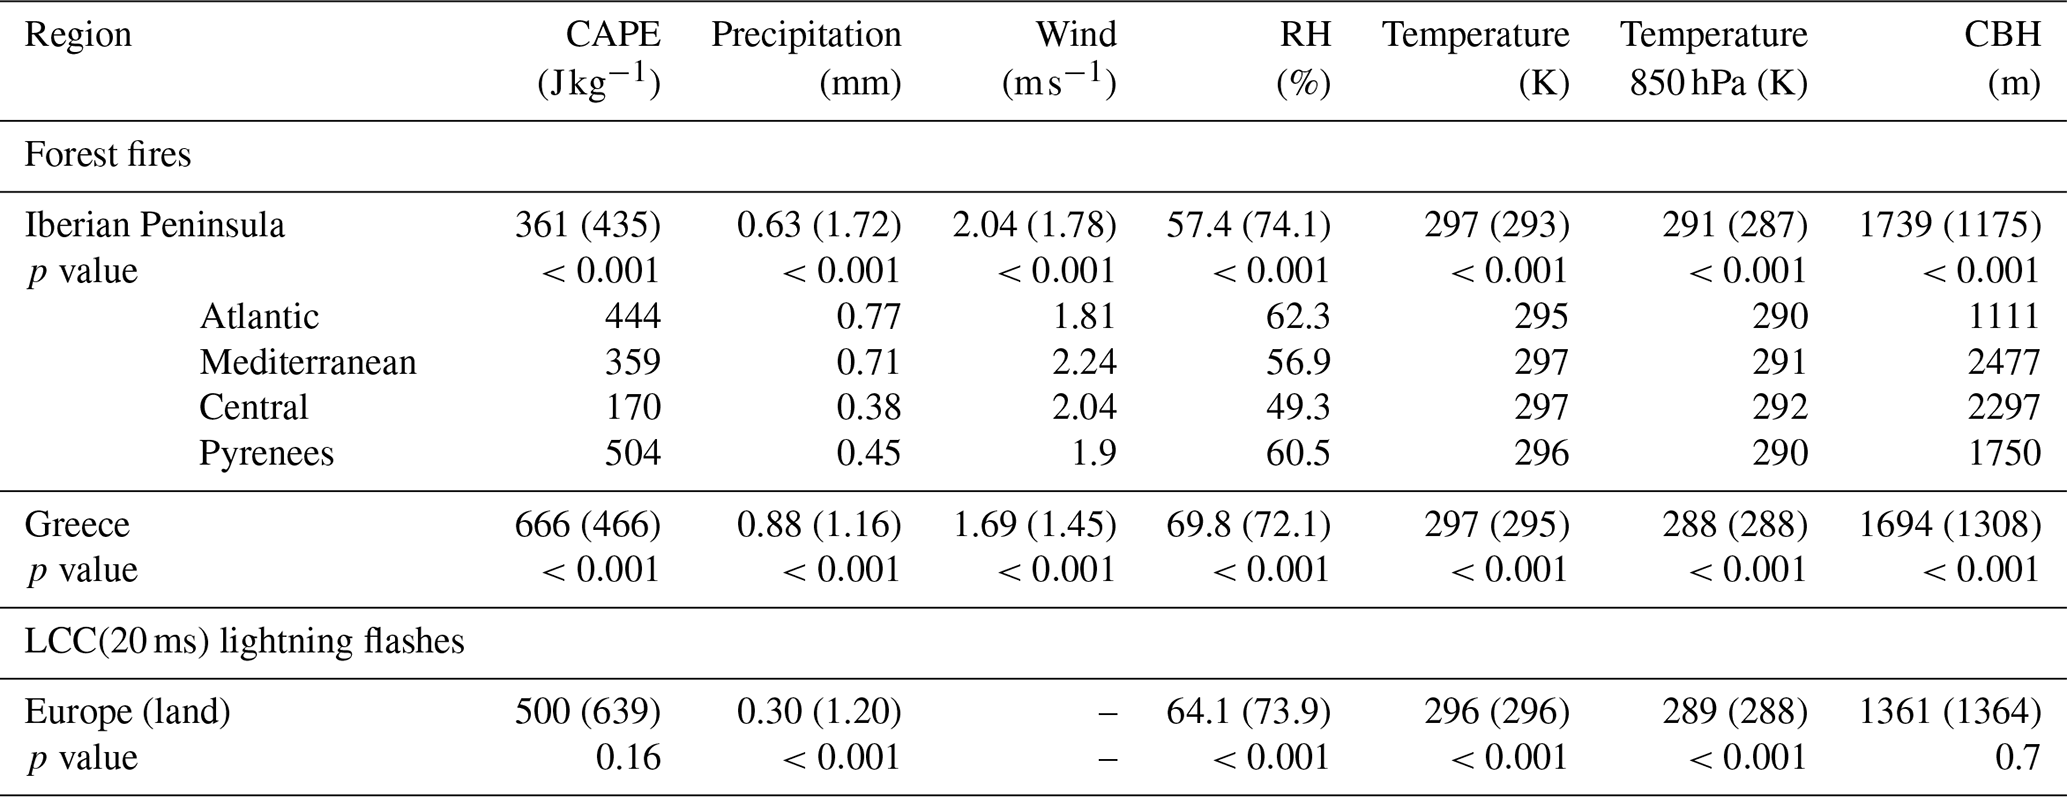
The inland area of the Iberian Peninsula is influenced by a complex spatial climate pattern. Climate in the Atlantic coast is characterized by a high accumulation of precipitation due to frequent Atlantic storms. The Mediterranean coast has a climate characterized by dry conditions during the summer, while the inland central part of the Iberian Peninsula is influenced by a continental climate with low precipitation and extreme temperatures during winter and summer. Finally, some areas, such as the Pyrenees, are influenced by a highland climate. We show in Table 2 the median value of the distributions plotted in Fig. 5 for each of the climate zones of the Iberian Peninsula. In all regions, the median values of 1 h precipitation and relative humidity are lower than the median values for all CG lightning flashes, while the median values of the wind, the temperatures at 2 m and 850 hPa, and the CBH are higher than the median values for all CG lightning flashes. The median value of CAPE for fire-igniting lightning in the Iberian Peninsula is lower than the climatological median.
Table 2Median value of the distributions of fire-igniting lightning plotted in Figs. 5–7 for each of the climate zones of the Iberian Peninsula and Greece. We include the median value of the distributions of CG lightning flashes in parentheses and the p values (zero when lower than the machine precision). We also include the median value of the meteorological variables of LCC(>20 ms) lightning, reported by ISS-LIS, taking place in clouds with a high base (Fig. 18) and the CBH of all LCC(>20 ms) lightning (Fig. 20), including the median value of the distributions of typical lightning flashes observed by ISS-LIS in parentheses.
3.2.2 Meteorological conditions in the upper troposphere
Let us now investigate the meteorological conditions of thunderstorms at altitudes above the 850 hPa pressure level. Hydrometeors (in the shape of water or ice) can play an important role in lightning activity (Deierling et al., 2005; Finney et al., 2014) and the precipitation rate (Tao et al., 2012). We plot, in Figs. 8 and 9, the vertical profiles of the specific cloud ice water content and the specific rain water content for the CG lightning and the fire-igniting lightning climatologies during May and September in the Iberian Peninsula and Greece, respectively. We plot, in the second column of Figs. 8 and 9, the vertical profile of the p values to indicate the pressure levels where differences are statistically significant.
The total cloud ice is lower for the case of fire-igniting lightning than for the CG lightning climatology (Figs. 8a and 9a), except at altitudes above 450 hPa pressure levels in the case of Greece. The lower content of ice particles in fire-igniting lightning suggests that fire-producing thunderstorms have a lower content of moisture than the climatological median. The low rain content in the lower troposphere (altitude below 700 hPa pressure level) for fire-igniting lightning (Figs. 8b and 9b) suggests that fire-igniting lightning flashes occur in dry thunderstorms (Nauslar, 2010). The red line in Fig. 8b disappears when the value is lower than 10−8 (below about 750 hPa pressure level), indicating that the specific rain water content is negligible. The only pressure levels where differences are not statistically significant (p value greater than 0.05) are the uppermost levels, which are plotted in each panel of Fig. 9.
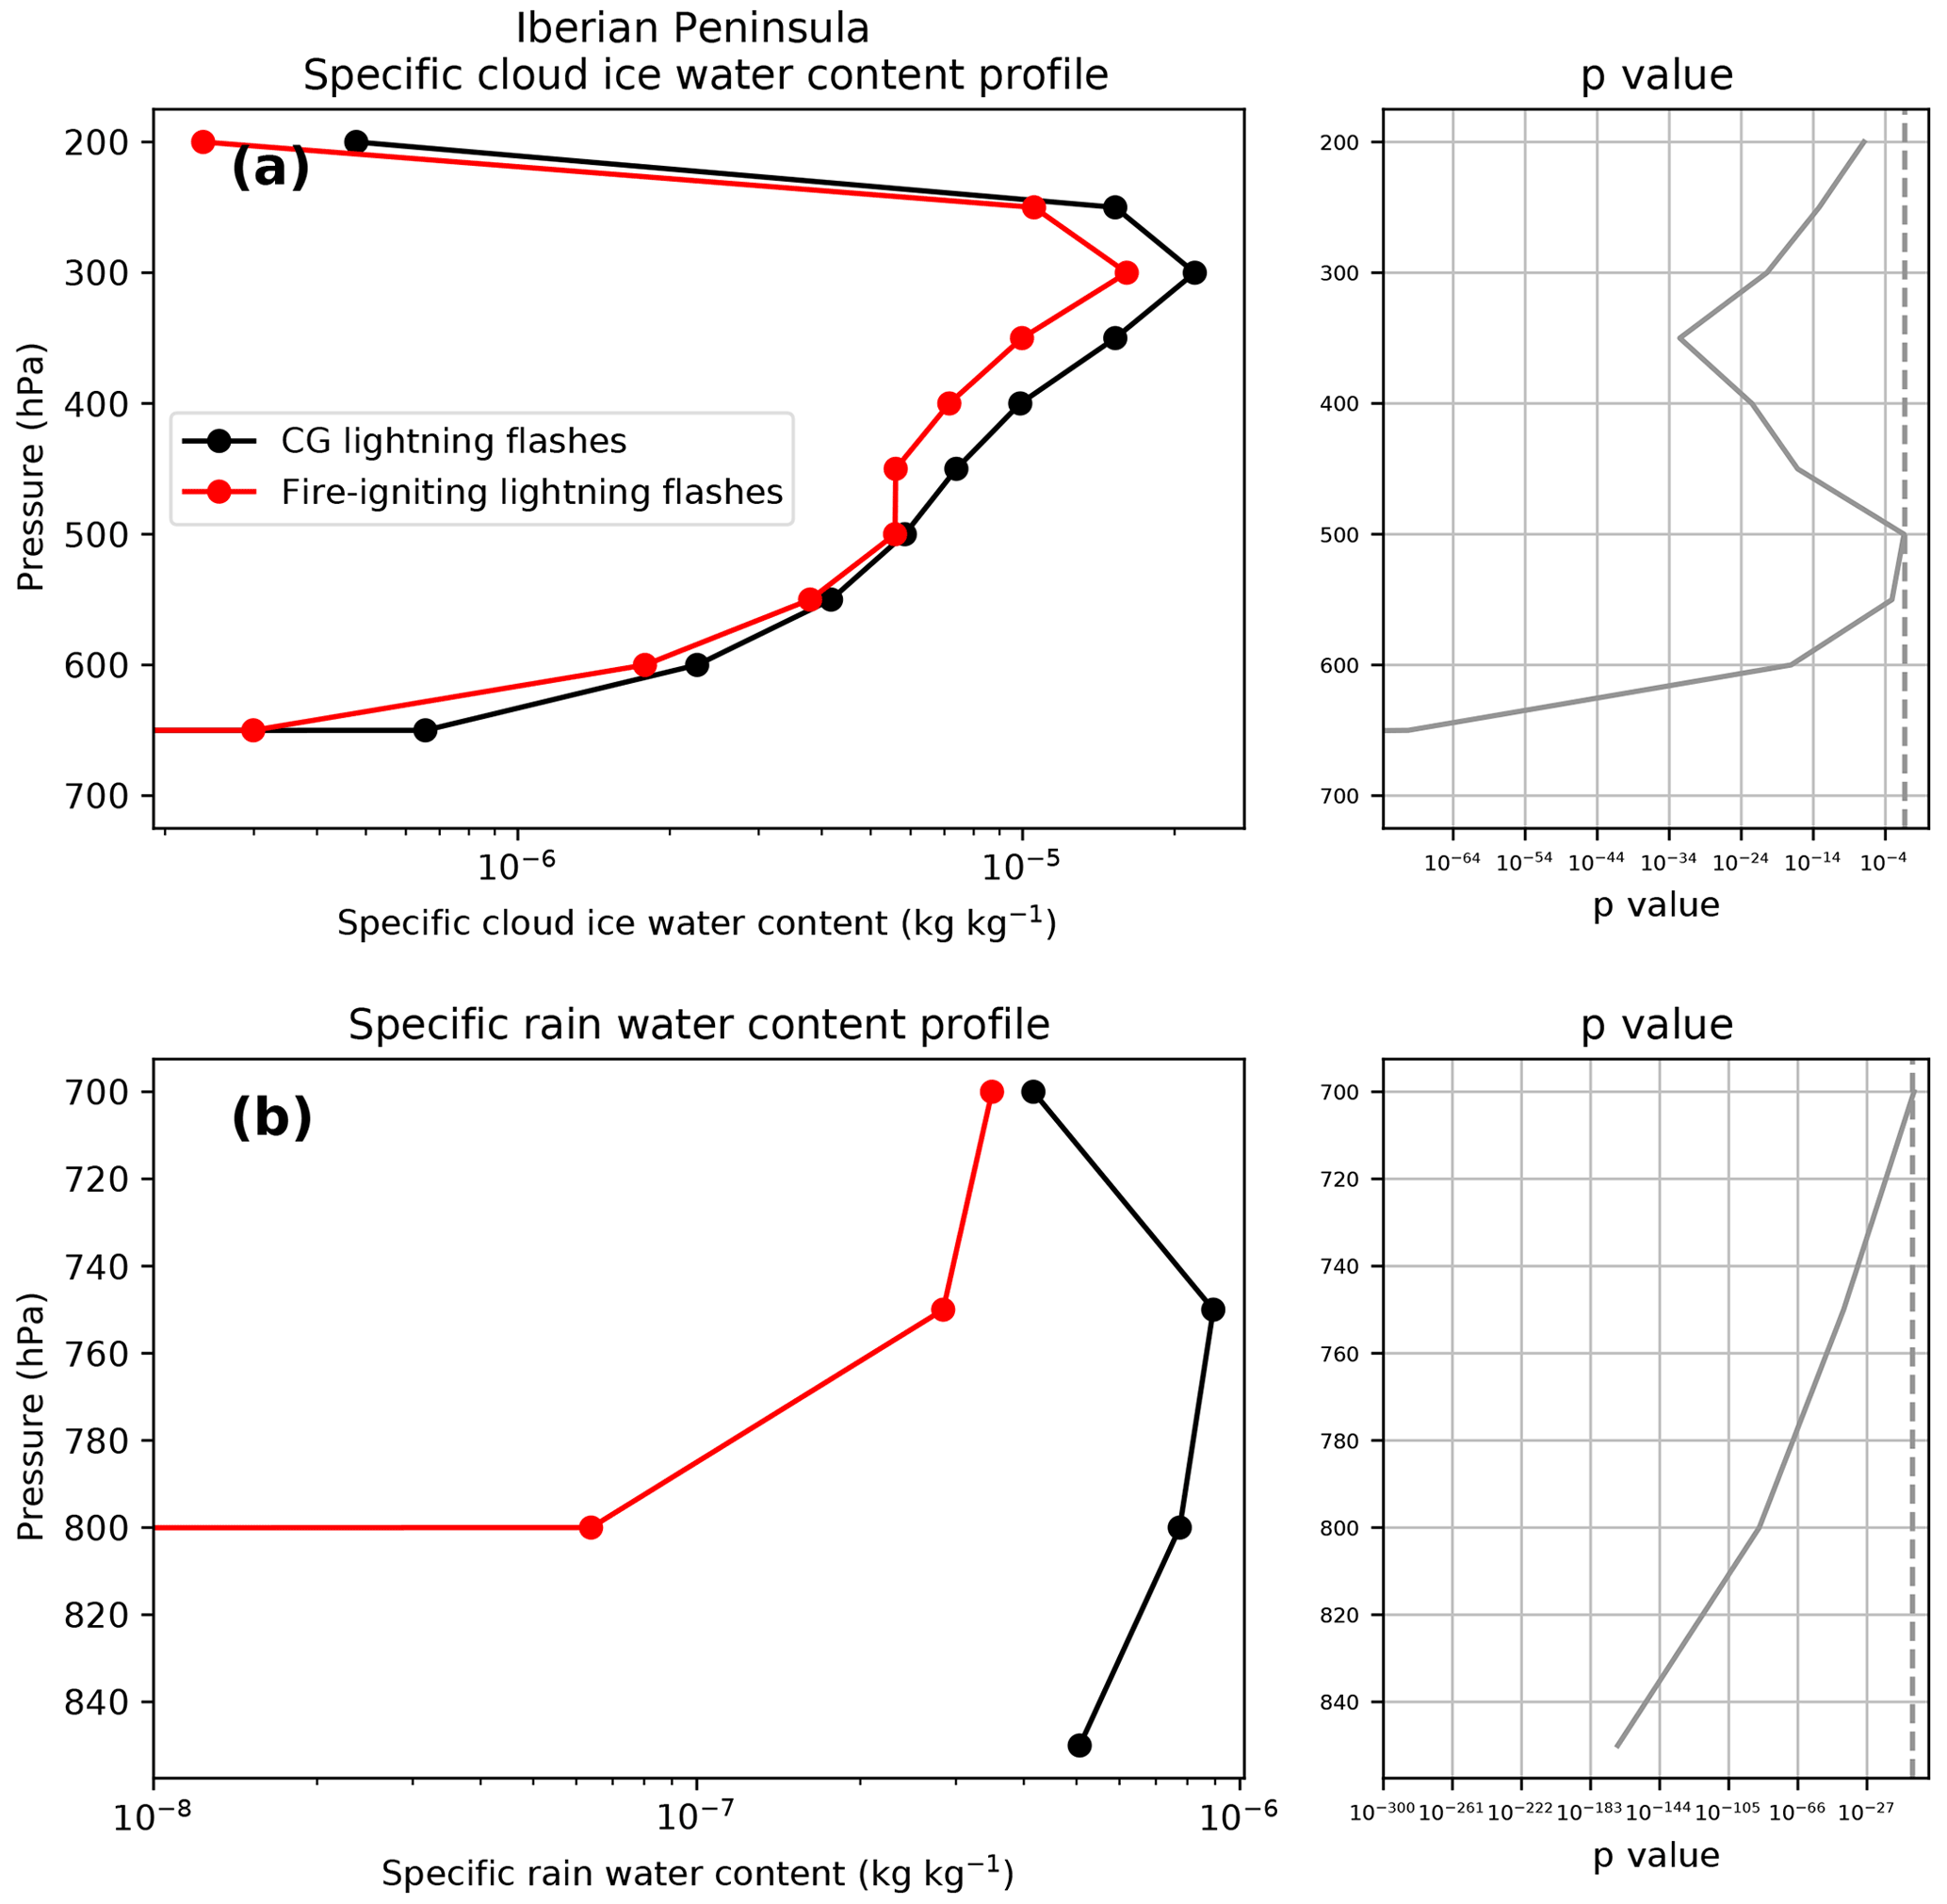
Figure 8The first column shows the vertical profiles of the specific cloud ice water content (a) and the specific rain water content (b) for the CG lightning and the fire-igniting lightning climatologies during May and September in the Iberian Peninsula between 2009 and 2015. The second column shows the p value (solid line) for each vertical level, representing the probability of equal median between both distributions, and a mark showing the limit at 0.05 (dashed line).
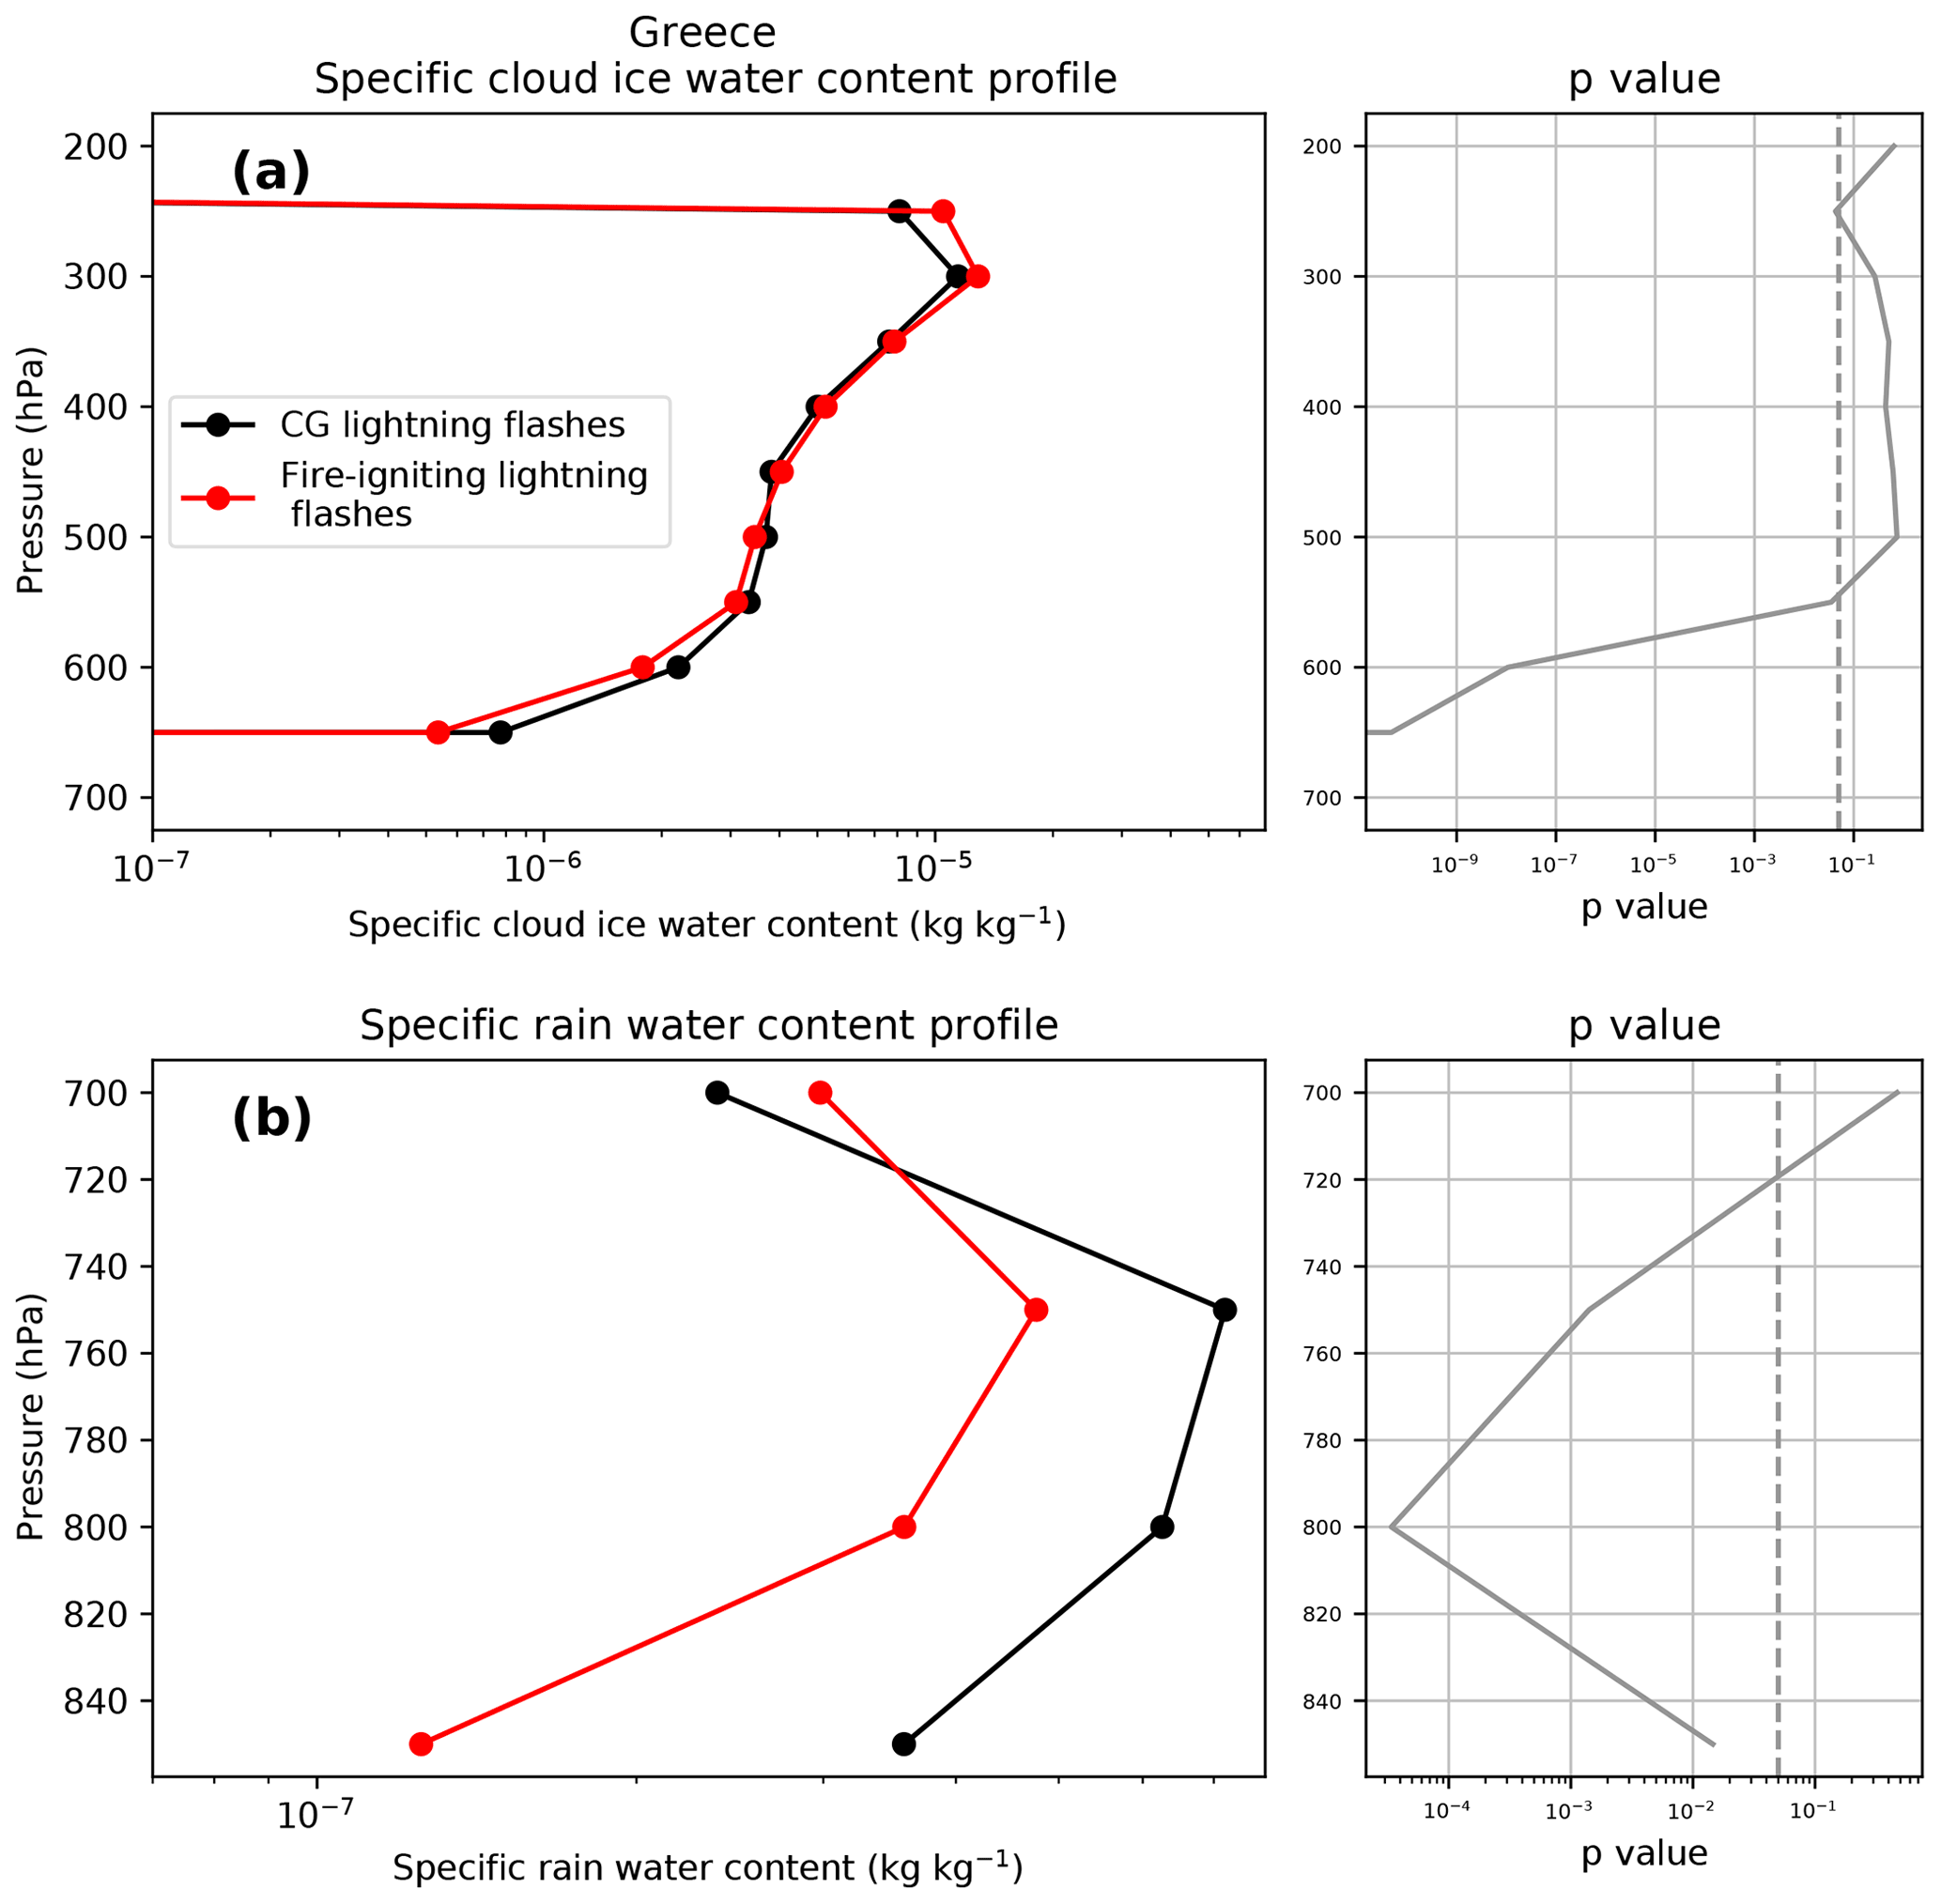
Figure 9The first column shows the vertical profiles of the specific cloud ice water content (a) and the specific rain water content (b) for the CG lightning and the fire-igniting lightning climatologies during May and September in Greece between 2017 and 2019. The second column shows the p value (solid line) for each vertical level, representing the probability of equal median between both distributions, and a mark showing the limit at 0.05 (dashed line).
Let us now analyze the temperature differences between 700 and 450 hPa pressure levels. The median temperature differences between 700 and 450 hPa pressure levels for CG lightning in the Iberian Peninsula and Greece are 22.4 and 21.8 K, respectively, while in the case of fire-igniting flashes, the median temperature differences between 700 and 450 hPa pressure level for the Iberian Peninsula and Greece are, respectively, 23.1 and 21.8 K. Therefore, the temperature differences between 700 and 450 hPa pressure levels are only slightly different (for the Iberian Peninsula) or similar (for Greece) for fire-producing thunderstorms than for the climatological median. Therefore, we expect that the different content of moisture between fire-producing thunderstorms and the climatological median plays a more important role in the instability of the atmosphere than the vertical temperature profile.
Finally, we plot, in Figs. 10 and 11, the vertical profile of the vertical velocity for the CG lightning and the fire-igniting lightning climatologies in the Iberian Peninsula and in Greece, respectively. The vertical velocity is the speed of air motion in the upward or downward direction, with negative values for upward motion and positive values for downward motion. It is important to mention that the median value that we have obtained is lower than zero at all pressure levels, which means that the vertical velocities plotted in Figs. 10 and 11 correspond to updrafts. Figure 10 indicates that fire-igniting lightning in the Iberian Peninsula tends to occur in areas with weaker vertical motion than in the case of typical CG lightning (p value lower than 0.05 at every level). We have calculated the median-specific humidity at 450 hPa for fire-producing lightning and CG lightning in the Iberian Peninsula, obtaining, respectively, and kg kg−1 (p value<0.05). Given that dry air is more dense than moist air (Picard et al., 2008), we suggest that the updraft of thunderstorms producing LIWs in the Iberian Peninsula is lower than the climatological median because they are composed by air that is drier than the climatological median.
We do not find the same trend in Greece, where the vertical profile of the vertical velocity in fire-producing lightning is only slightly different than the climatological median. Figure 11 shows that the vertical velocity is slightly higher for fire-igniting lightning than for CG lightning between 300 and 450 hPa, higher for altitudes below 800 hPa pressure level, and statistically similar in the rest of the vertical levels. In the case of Greece, fire-producing thunderstorms have the same content of moisture as the climatological median (see Fig. 9), which is in agreement with the comparison of the vertical velocity between fire-producing lightning and typical lightning (Fig. 11).

Figure 10Median vertical velocity profile for the CG lightning and the fire-igniting lightning climatologies in the Iberian Peninsula between May and September for the period between 2009 and 2015 (a). The p value (solid line), representing the probability of equal median between both distributions, and the mark showing the limit at 0.05 (dashed line) are shown (b).
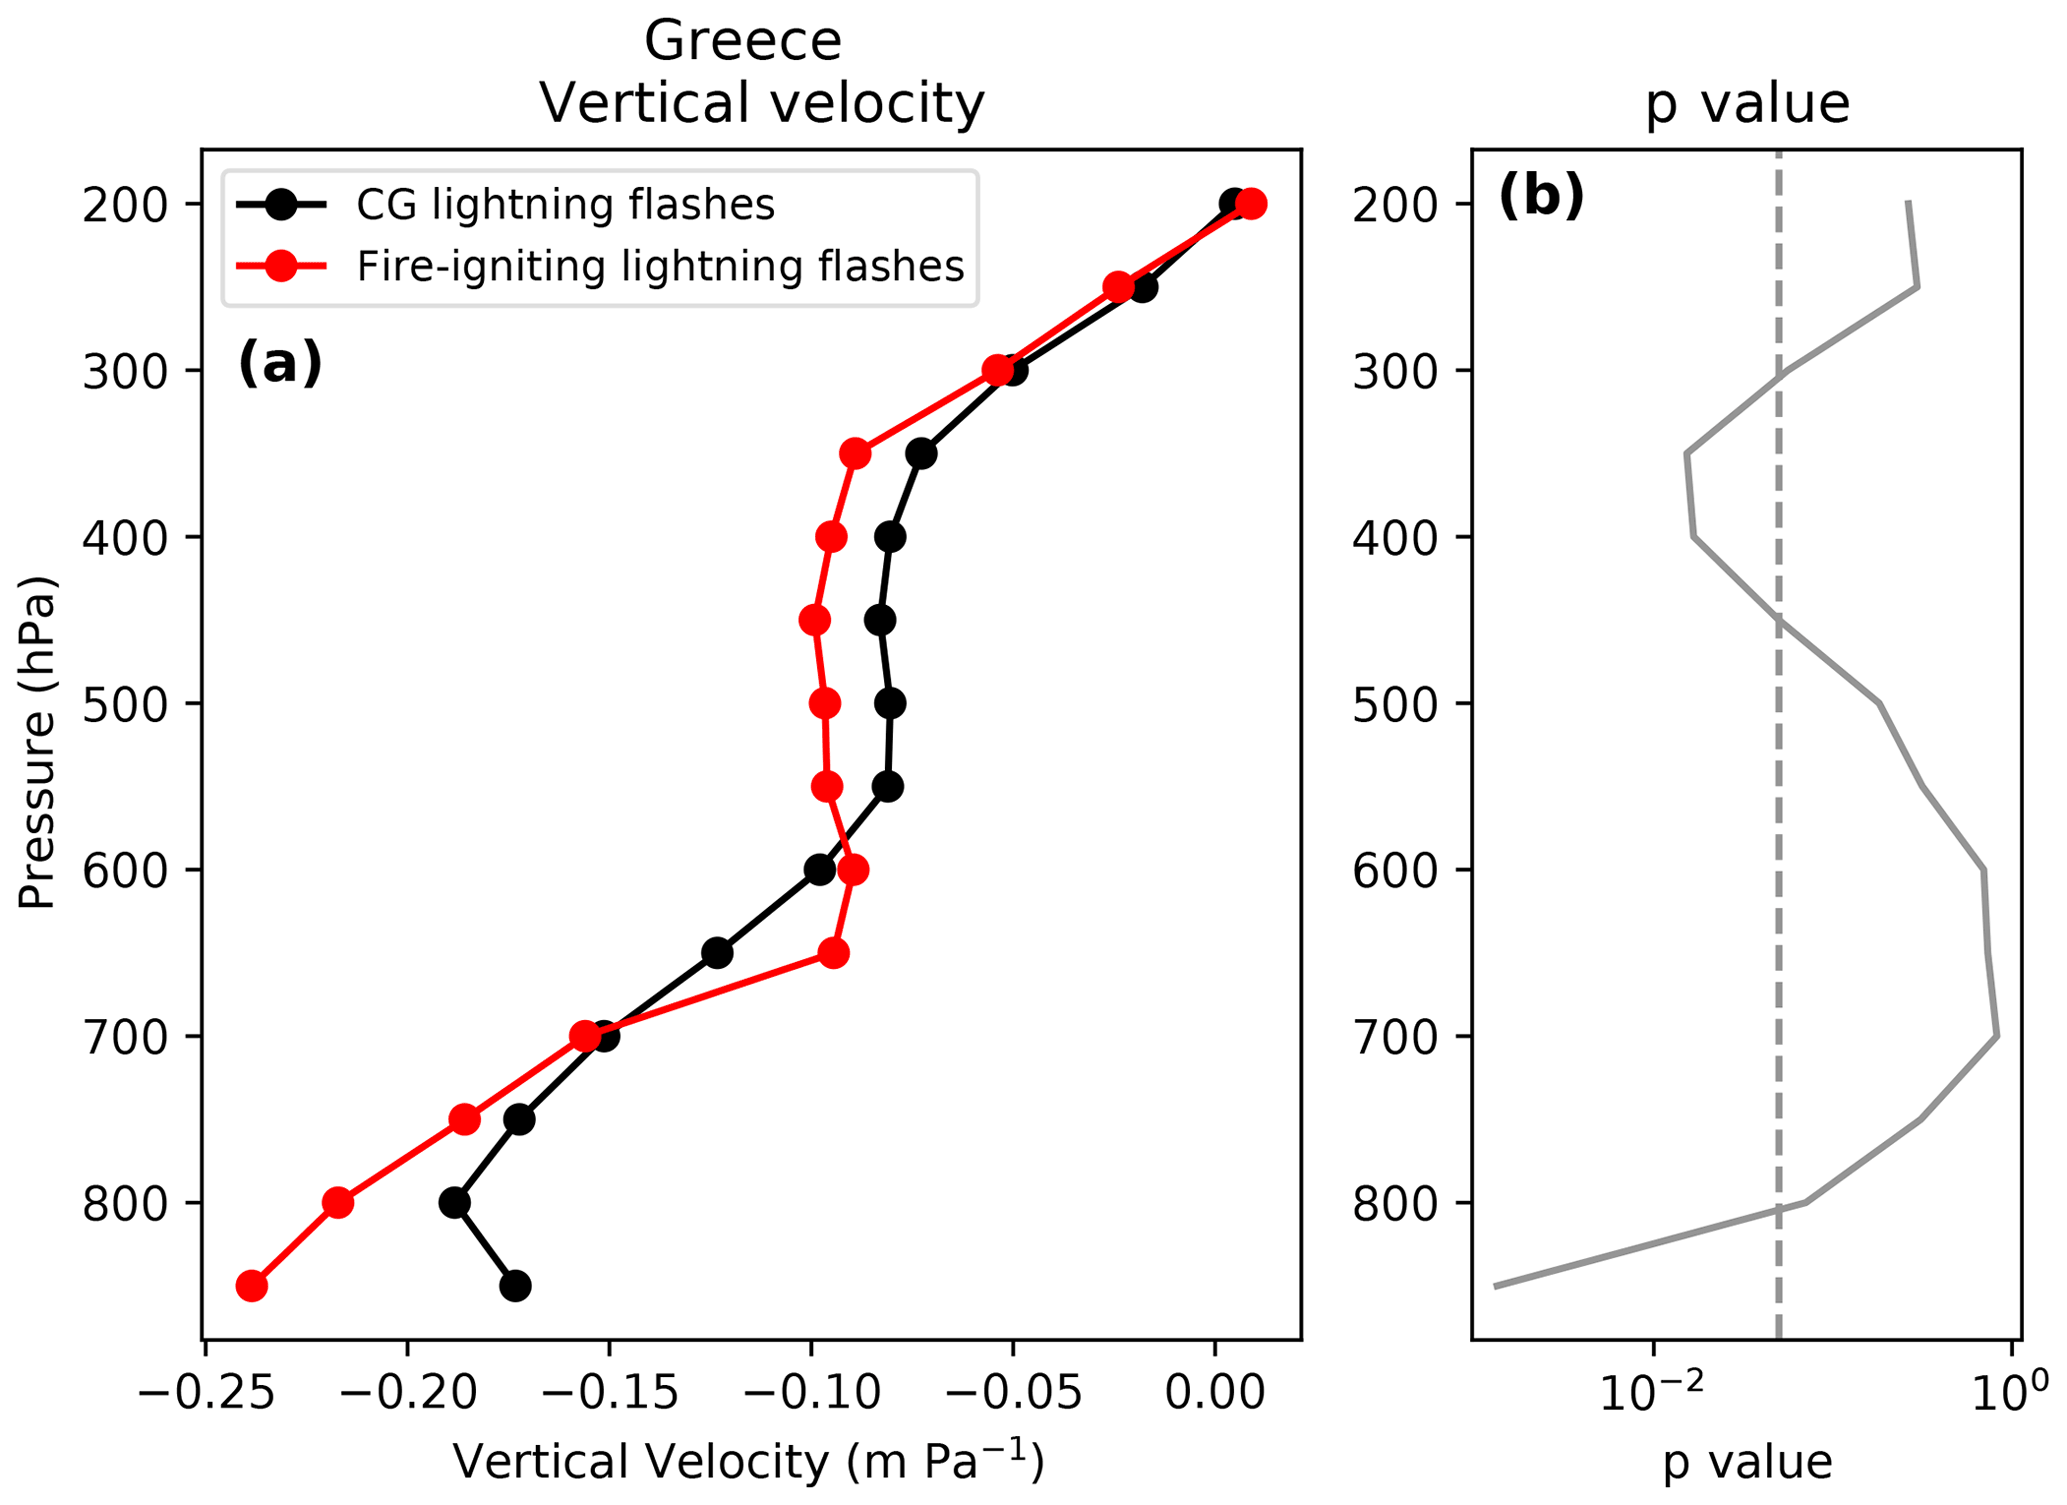
Figure 11Median vertical velocity profile for the CG lightning and the fire-igniting lightning climatologies in Greece between May and September for the period between 2017 and 2019 (a). The p value (solid line), representing the probability of equal median between both distributions, and the mark showing the limit at 0.05 (dashed line) are shown (b).
3.2.3 Cloud top height values
Let us now compare the CTH values associated with fire-igniting lightning and with typical lightning using the CTHP provided by EUMETSAT and based on measurements of the MSG satellites. Thunderstorms with high CTH values are related to high levels of convection and lightning activity (Price and Rind, 1992). We have collected the value of the CTH for all CG lightning flashes and fire-igniting lightning flashes for the periods between 2012 and 2015 (Iberian Peninsula) and between 2017 and 2019 (Greece), when it is provided in a temporal window of ±15 min around the occurrence of the discharge and when the reported quality of the estimation of CTH is not poor. As an example, we plot, in the Supplement, the CTH map derived from the MSG satellite for one fire-igniting thunderstorm taking place on the Mediterranean coast of the Iberian Peninsula on 15 June 2015 at 14:15 UTC.
We plot the frequency distribution of CTH values in Fig. 12 for both the CG lightning and the fire-igniting lightning climatologies in the Iberian Peninsula (upper panel) and in Greece (lower panel). We obtain a median CTH value of 11.3 (10.3 km) for fire-igniting lightning and a median value of 10.9 (10.3 km) for typical CG lightning flashes in the Iberian Peninsula (Greece). There are not significant differences in the distribution of CTH values between both climatologies over Greece (p value>0.05), while the difference in the median value of CTH in fire-igniting lightning and CG lightning is of the same order as the resolution of the measurements (320 m; Schmetz et al., 2002). However, Fig. 12 shows a tendency to have higher CTH values for fire-igniting lightning in the Iberian Peninsula. The frequency distribution of CTH is flatter for the case of fire-igniting lightning flashes than for the case of CG lightning flashes. The high total number of fire-producing thunderstorms over Greece with CTH above 12 km showed (lower left panel of Fig. 12) coincides with the high content of ice water at 200 hPa (plotted in Fig. 9).
There seems to be a disagreement between the CTH and the updrafts in LIWs, as fire-igniting lightning tends to occur under weak updrafts but not in thunderstorms with low CTH values. It is important to highlight that CTH data are reported every 15 min and with a horizontal resolution of 4 km by EUMETSAT, while ERA5 data are 1 h averaged with a resolution of in latitude and longitude (see Sect. 2.3). The cloud top height at a given point in a single thunderstorm can significantly change in 1 h (Emersic et al., 2011) and within an area of in latitude and longitude. Therefore, our results are compatible with fire-igniting lightning taking place in thunderstorms with weaker convection than the average at the spatiotemporal scale of ERA5 but at the time and position of high cloud tops.
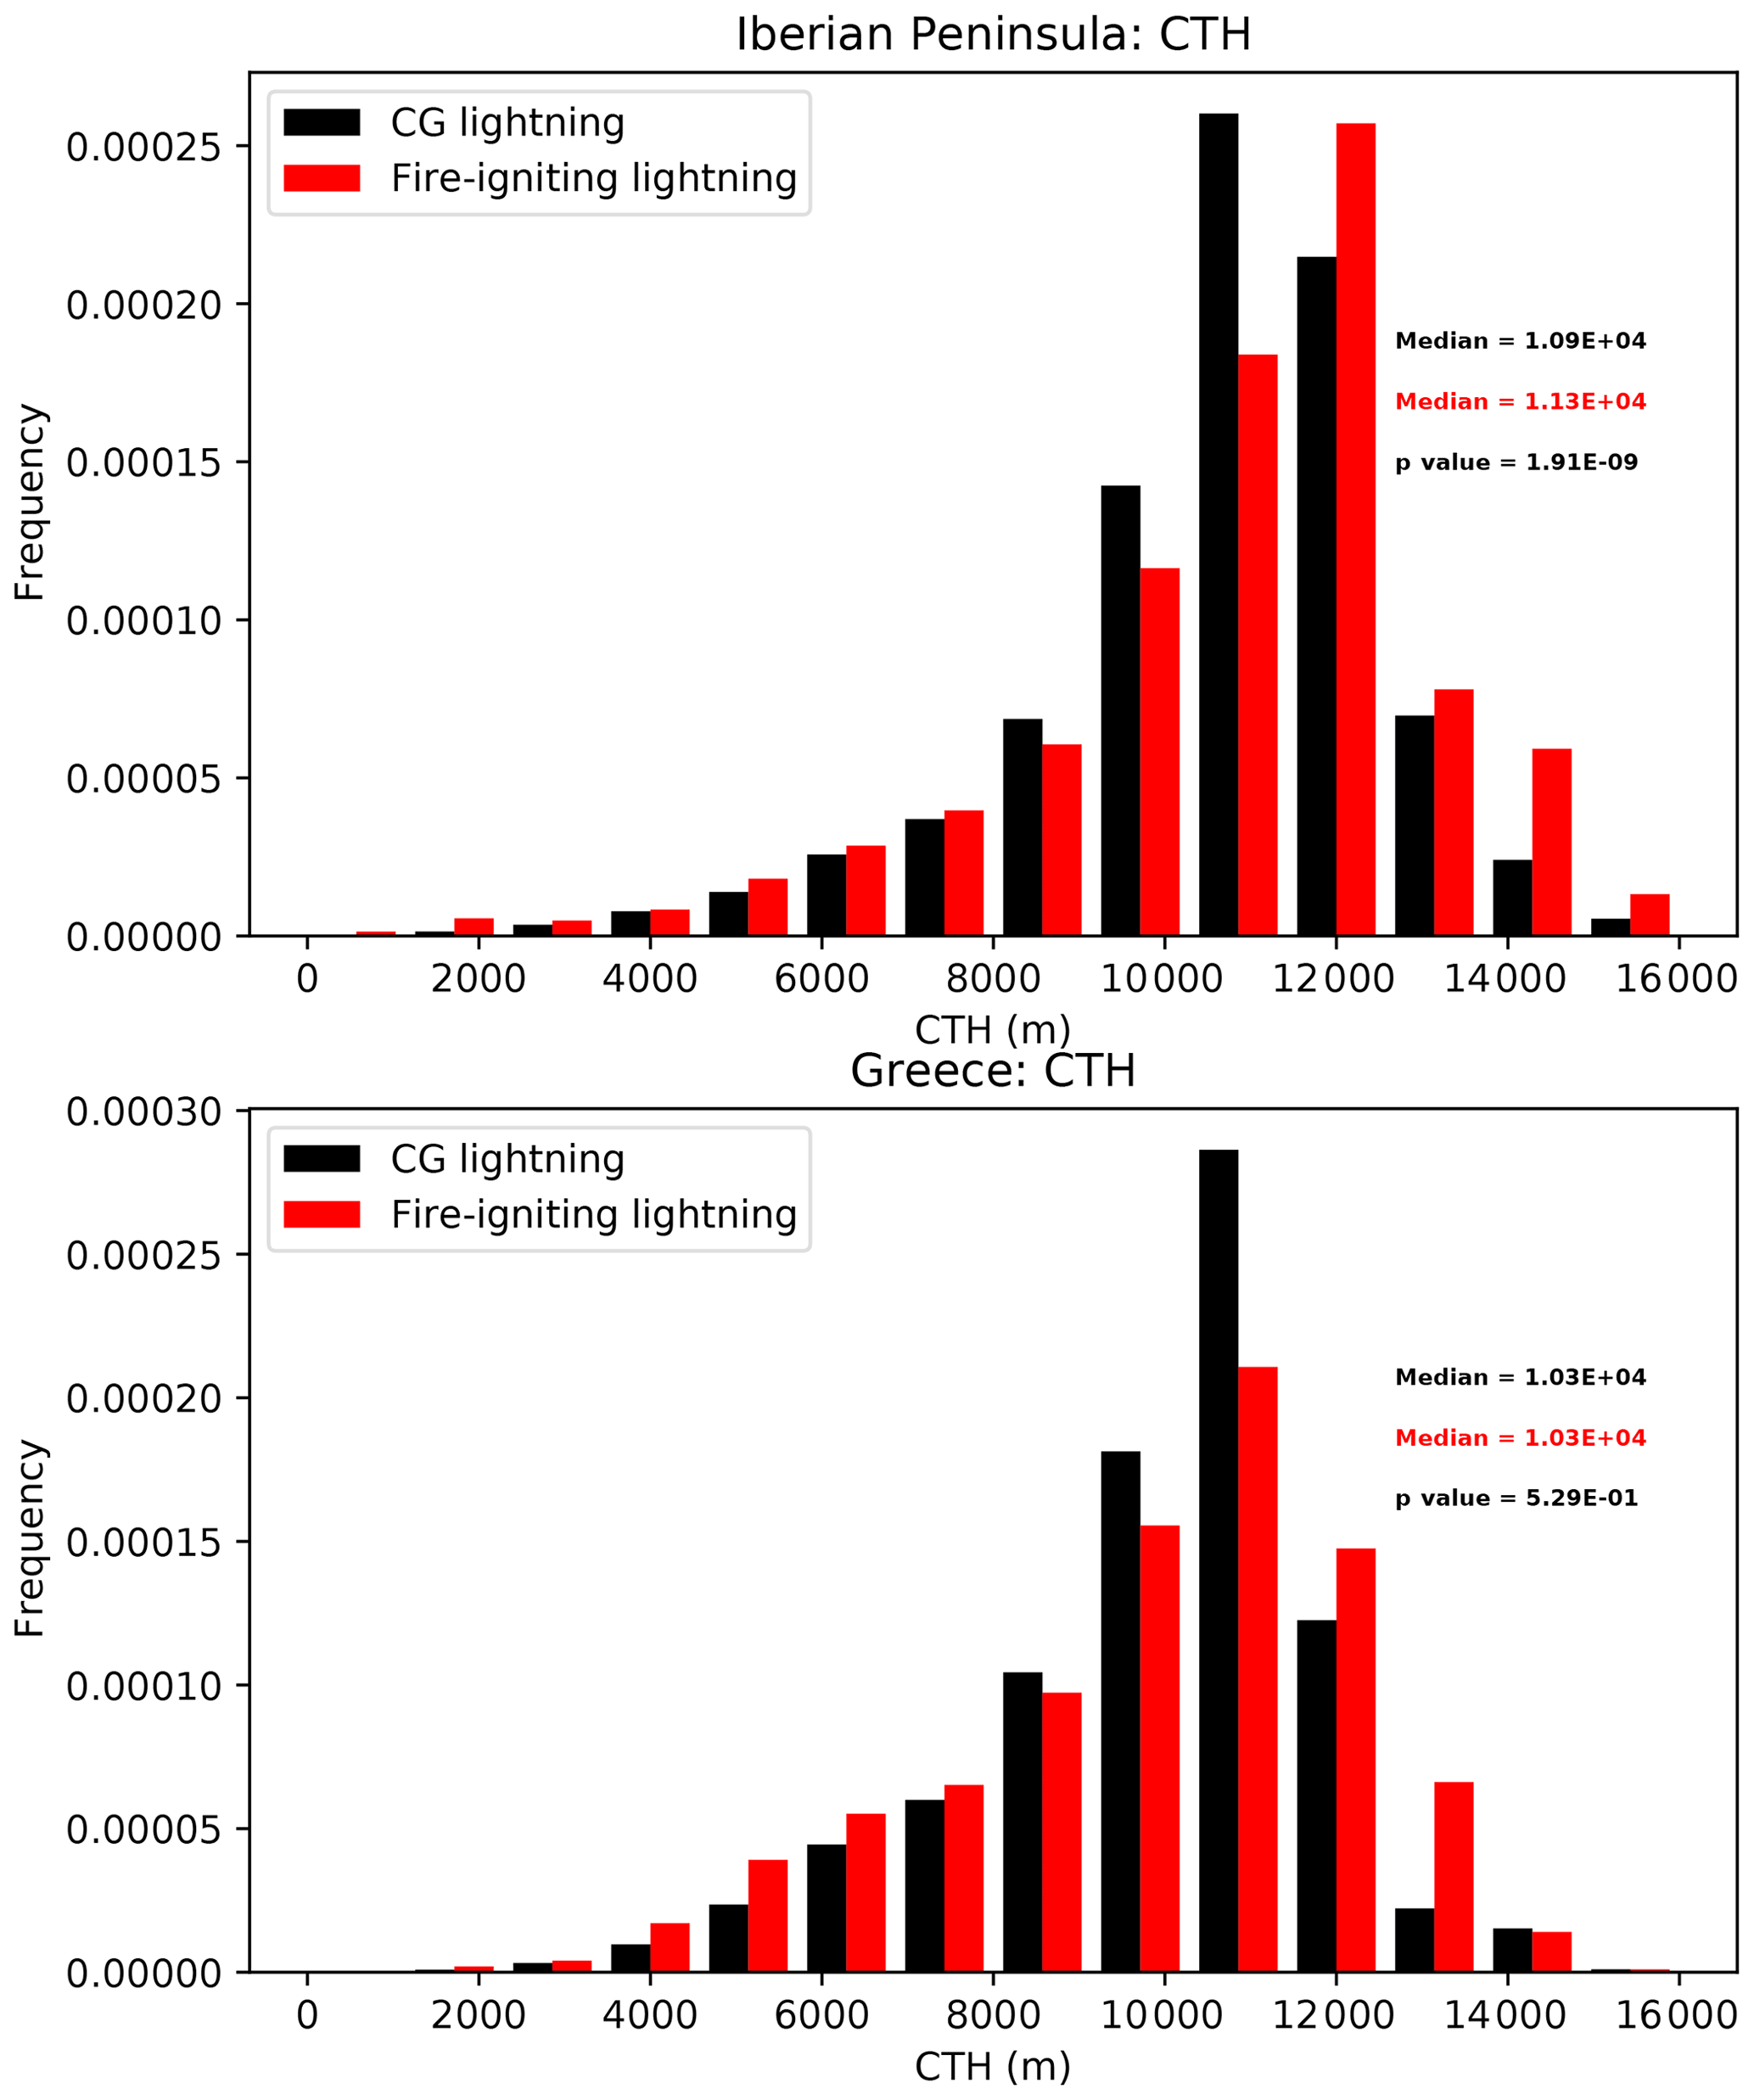
Figure 12Frequency distribution of the CTH values reported by EUMETSAT based on measurements of the MSG satellites for fire-igniting lightning and all CG lightning over coniferous and mixed forests in the Iberian Peninsula (2012–2015) and Greece (2017–2019).
3.3 Lightning flash frequency and density in fire-producing thunderstorms
Lightning flash frequency and density are used as proxy variables to forecast or parameterize the inception of lightning-ignited fires. For example, Krause et al. (2014) parameterized the inception of LIWs in a global model using the flash frequency, while Schultz et al. (2019) found that the majority of flash densities were less than 0.41 flashes per square kilometer in lightning-ignited fire days in the USA. In this section, we analyze the temporal evolution and the spatial characteristics of fire-producing thunderstorms in Spain between 2014 and 2015. We assume that the fire-producing thunderstorm is the one that contains the lightning candidate. However, identifying the thunderstorm containing a flash reported by a lightning network is not a trivial problem. Hutchins et al. (2014) proposed the use of the ST-DBSCAN (density-based spatial clustering of applications with noise) algorithm to cluster lightning flashes reported by WWLLN into thunderstorms. The ST-DBSCAN algorithm defines a cluster of flashes as the group of flashes that are neighbors according to selected spatial and temporal thresholds. Hutchins et al. (2014) reported that ST-DBSCAN produces a reliable daily global number of thunderstorms (660±70 on any given moment) by using 0.12∘ in latitude and longitude as a spatial parameter and 18 min as a temporal threshold to cluster WWLLN flashes into thunderstorms. In this work, we cluster lightning flashes reported by ENTLN in the region of interest by searching adequate clustering thresholds by using radar measurements of thunderstorms.
Radar echo top measurements at 12 dB provide the maximum height of precipitable particles (Gutiérrez Núñez et al., 2018). Areas where the height of precipitable particles is high are related to areas with strong updrafts that can favor the production of thunderclouds. We use radar echo top maps to identify the position of thunderstorms before clustering flashes into thunderstorms. Figure 13a and c show two echo top radar images around two fire-ignited lightning events taking place on the Mediterranean coast of the Iberian Peninsula on 17 June 2015 at 18:00 UTC and on 15 June 2015 at 14:15 UTC, respectively. Figure 13b and d show all the lightning flashes reported by ENTLN on the eastern coast of the Iberian Peninsula during 30 min on 17 June 2014 at 18:00 UTC and on 15 June 2015 at 14:15 UTC. Different colors indicate the clusters after applying the clustering algorithm ST-DBSCAN with the spatial and temporal parameters of 0.12∘ and 15 min, respectively. A comparison of both columns in Fig. 13 shows that the clustering parameters of 0.12∘ and 15 min can be used to identify thunderstorms from lightning measurements in the region of interest. Hutchins et al. (2014) used 18 min for WWLLN global lightning data. However, we found that using 18 min for ENTLN lightning data over the Iberian Peninsula would cluster all the lightning flashes shown in Fig. 13b and d into the same thunderstorm.

Figure 13Echo top radar images provided by AEMET showing the maximum height (in kilometers) of precipitable particle echoes at 12 dB and 15 min around one fire-ignited lightning on 17 June 2014 at 18:00 UTC (a) and on 15 June 2015 at 14:15 UTC (c). Lightning flashes reported by ENTLN on 15 June 2014 between 17:45 and 18:15 UTC (b) and on 15 June 2015 between 14:00 and 14:30 UTC (d). Different colors indicate different lightning clusters or thunderstorms using ST-DBSCAN, with the spatial and temporal parameters of 0.12∘ and 15 min, respectively.
Following this approach of clustering lightning flashes into thunderstorms, we have clustered the lightning flashes taking place in the Iberian Peninsula between 2014 and 2015 during some days with LIWs. Given that the clustering process requires high computational resources, we restrict our analysis to the period between 2014 and 2015. In order to select the cases of our study, we have only included fire-igniting thunderstorms containing a lightning candidate with a proximity index (A) greater than 0.95 with respect to the fire. Following these criteria, we have selected 77 cases. Figure 14 shows the cumulative number of flashes occurring in the selected cases 1400 min around the ignition of LIWs. Ignitions tend to occur at the moment when the lightning activity just starts to increase from the regime with the lowest lightning activity to the regimen with the highest lightning activity. The regime with a higher lightning activity coincides with a higher precipitation rate (Soriano et al., 2001) that contributes to inhibiting the possibility of fire ignition. We have found no relationships between the cumulative number of the different types and polarities of lightning discharges and the time of ignition.
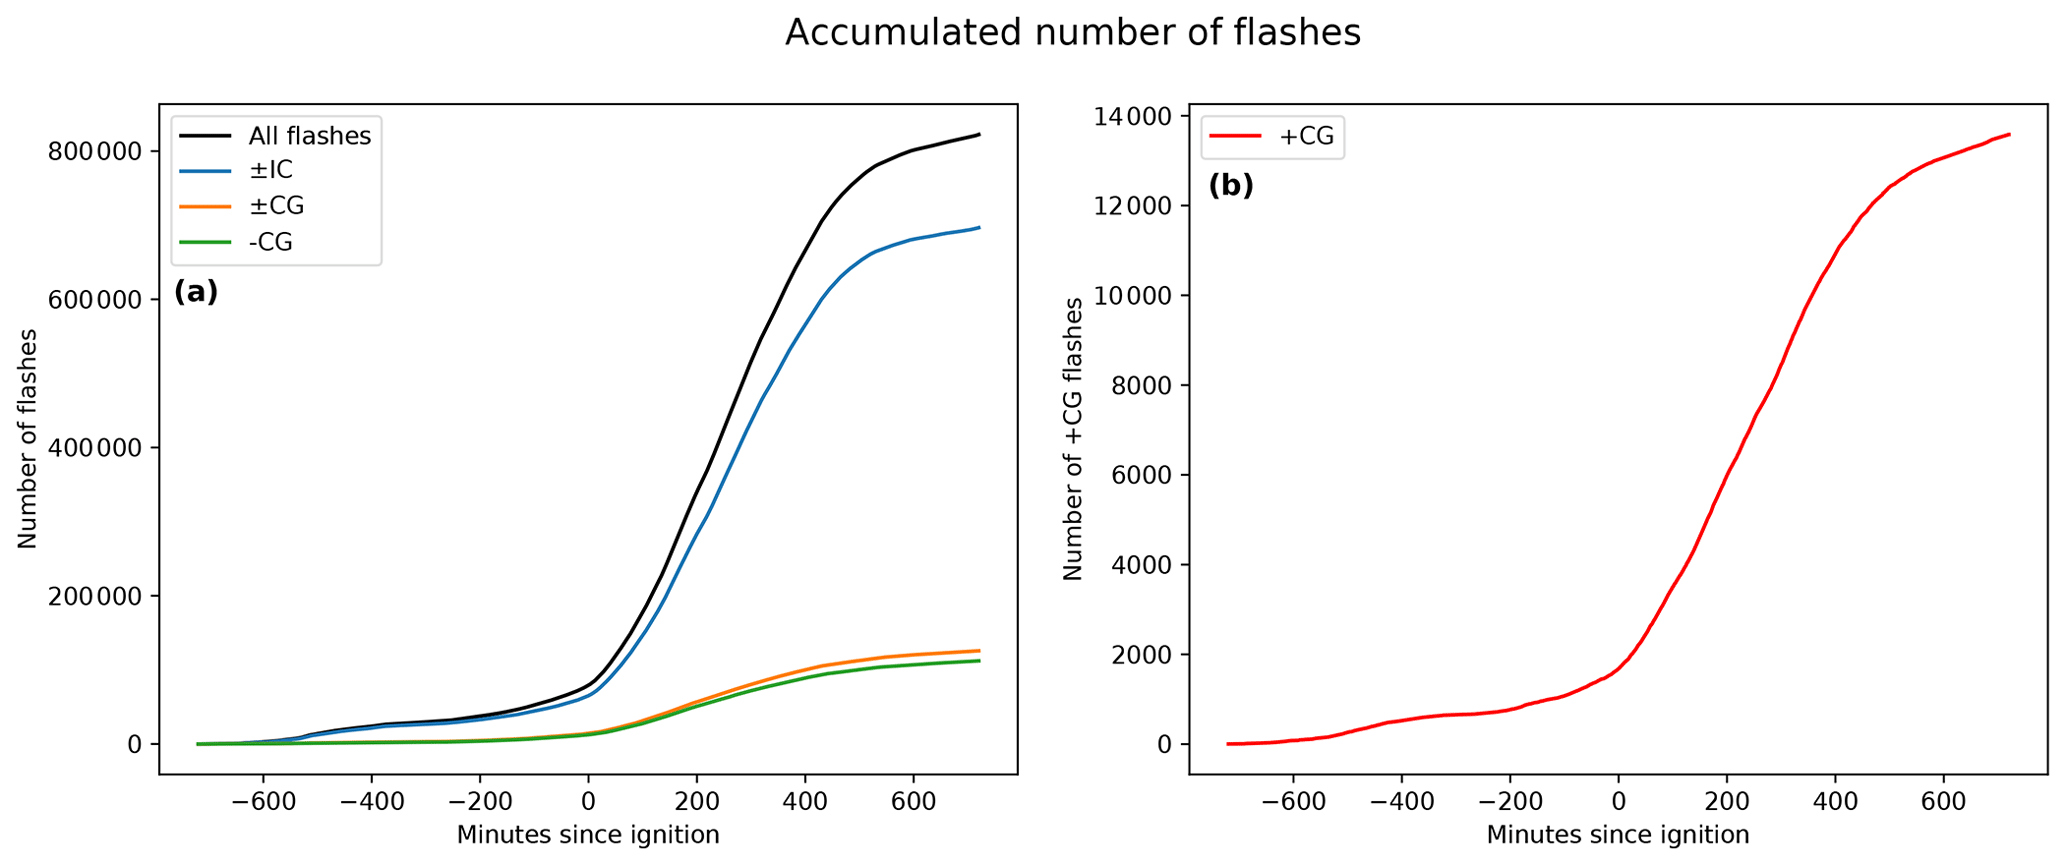
Figure 14Cumulative number of flashes occurring in 77 fire-igniting thunderstorms over the Iberian Peninsula during 1400 min around the ignition of a lightning-ignited fire. We plot all flashes, all IC flashes (±IC), all CG flashes (±CG), and −CG flashes in panel (a). We plot +CG flashes in panel (b).
Several authors have investigated the spatial density of CG flashes 24 h prior to the ignition as a proxy for the occurrence of fires in the USA, depending on the 100 h fuel moisture information (e.g., Latham and Schlieter, 1989; Hardy et al., 1999; Schultz et al., 2019). They have found a that the threshold value of the CG spatial flash density to ignite a fire and allow it to reach the arrival phase would strongly depend on the lightning detection system. In this work, we have calculated the CG spatial flash density for 5 km around 24 h before the ignition of all the LIWs in Spain during 2016 and 2017, using CG flashes reported by ENTLN. The DE of ENTLN could have increased during recent years. We have calculated the CG spatial flash density for the period between 2016 and 2017 for the case of utility, as the most recent years in our fire database in the Iberian Peninsula are 2016–2017. Therefore, is the most recent information. We obtain a median value of 0.44 flashes per square kilometer, a 25th percentile of 0.26 flashes per square kilometer, and a 75th percentile of 0.69 flashes per square kilometer. In addition to meteorological parameters, these values could be used in regional fire forecasting or atmospheric models to quantify the risk of ignition by thunderstorms, especially if radar measurements of the precipitation rate are not available.
3.4 Long continuing current (LCC) lightning
In this section, we investigate the climatology of LCC lightning flashes over Europe derived from ISS-LIS data between March 2017 and September 2020 and the meteorological and cloud conditions under which they take place. This approach will help us to identify possible relationships between LCC lightning and fire-igniting lightning flashes.
3.4.1 LCC lightning distribution over Europe
In order to perform this analysis, we compare three samples of lightning data. The first sample is formed by all lightning flashes without a long continuous phase of 20 ms or more reported by ISS-LIS over land in Europe between May–September 2017–2020, here referred to as typical lightning flashes. The second and third samples are composed of all the LCC lightning flashes reported by ISS-LIS over land in southern Europe, with a continuous phase duration equal to or greater than 20 and 10 ms, respectively. We refer to these climatologies as, respectively, LCC(>20 ms) and LCC(>10 ms). The total number of LCC(>20 ms) and LCC(>10 ms) lightning flashes reported by ISS-LIS over land in Europe between May–September 2017–2020 are 1227 and 9211, respectively, while the total number of typical lightning flashes is 148 482. Therefore, about 6.2 % of lightning flashes reported by ISS-LIS over Europe are LCC(>10 ms), while only about 0.8 % of lightning flashes are LCC(>20 ms). We plot the obtained geographical distribution of LCC(>20 ms) lightning flashes in Fig. 15 together with the geographical distribution of lightning flashes reported by ISS-LIS. According to this figure, LCC(>20 ms) lightning flashes tend to occur over the oceans and over coastal regions, even when the maximum occurrence rate of total lightning flashes is produced over land. Lightning flashes tend to be more energetic over ocean than over land (Said et al., 2013; Holzworth et al., 2019), which is in agreement with the different ratio of LCC(>20 ms) lightning flashes to total lightning flashes plotted in Fig. 15b.
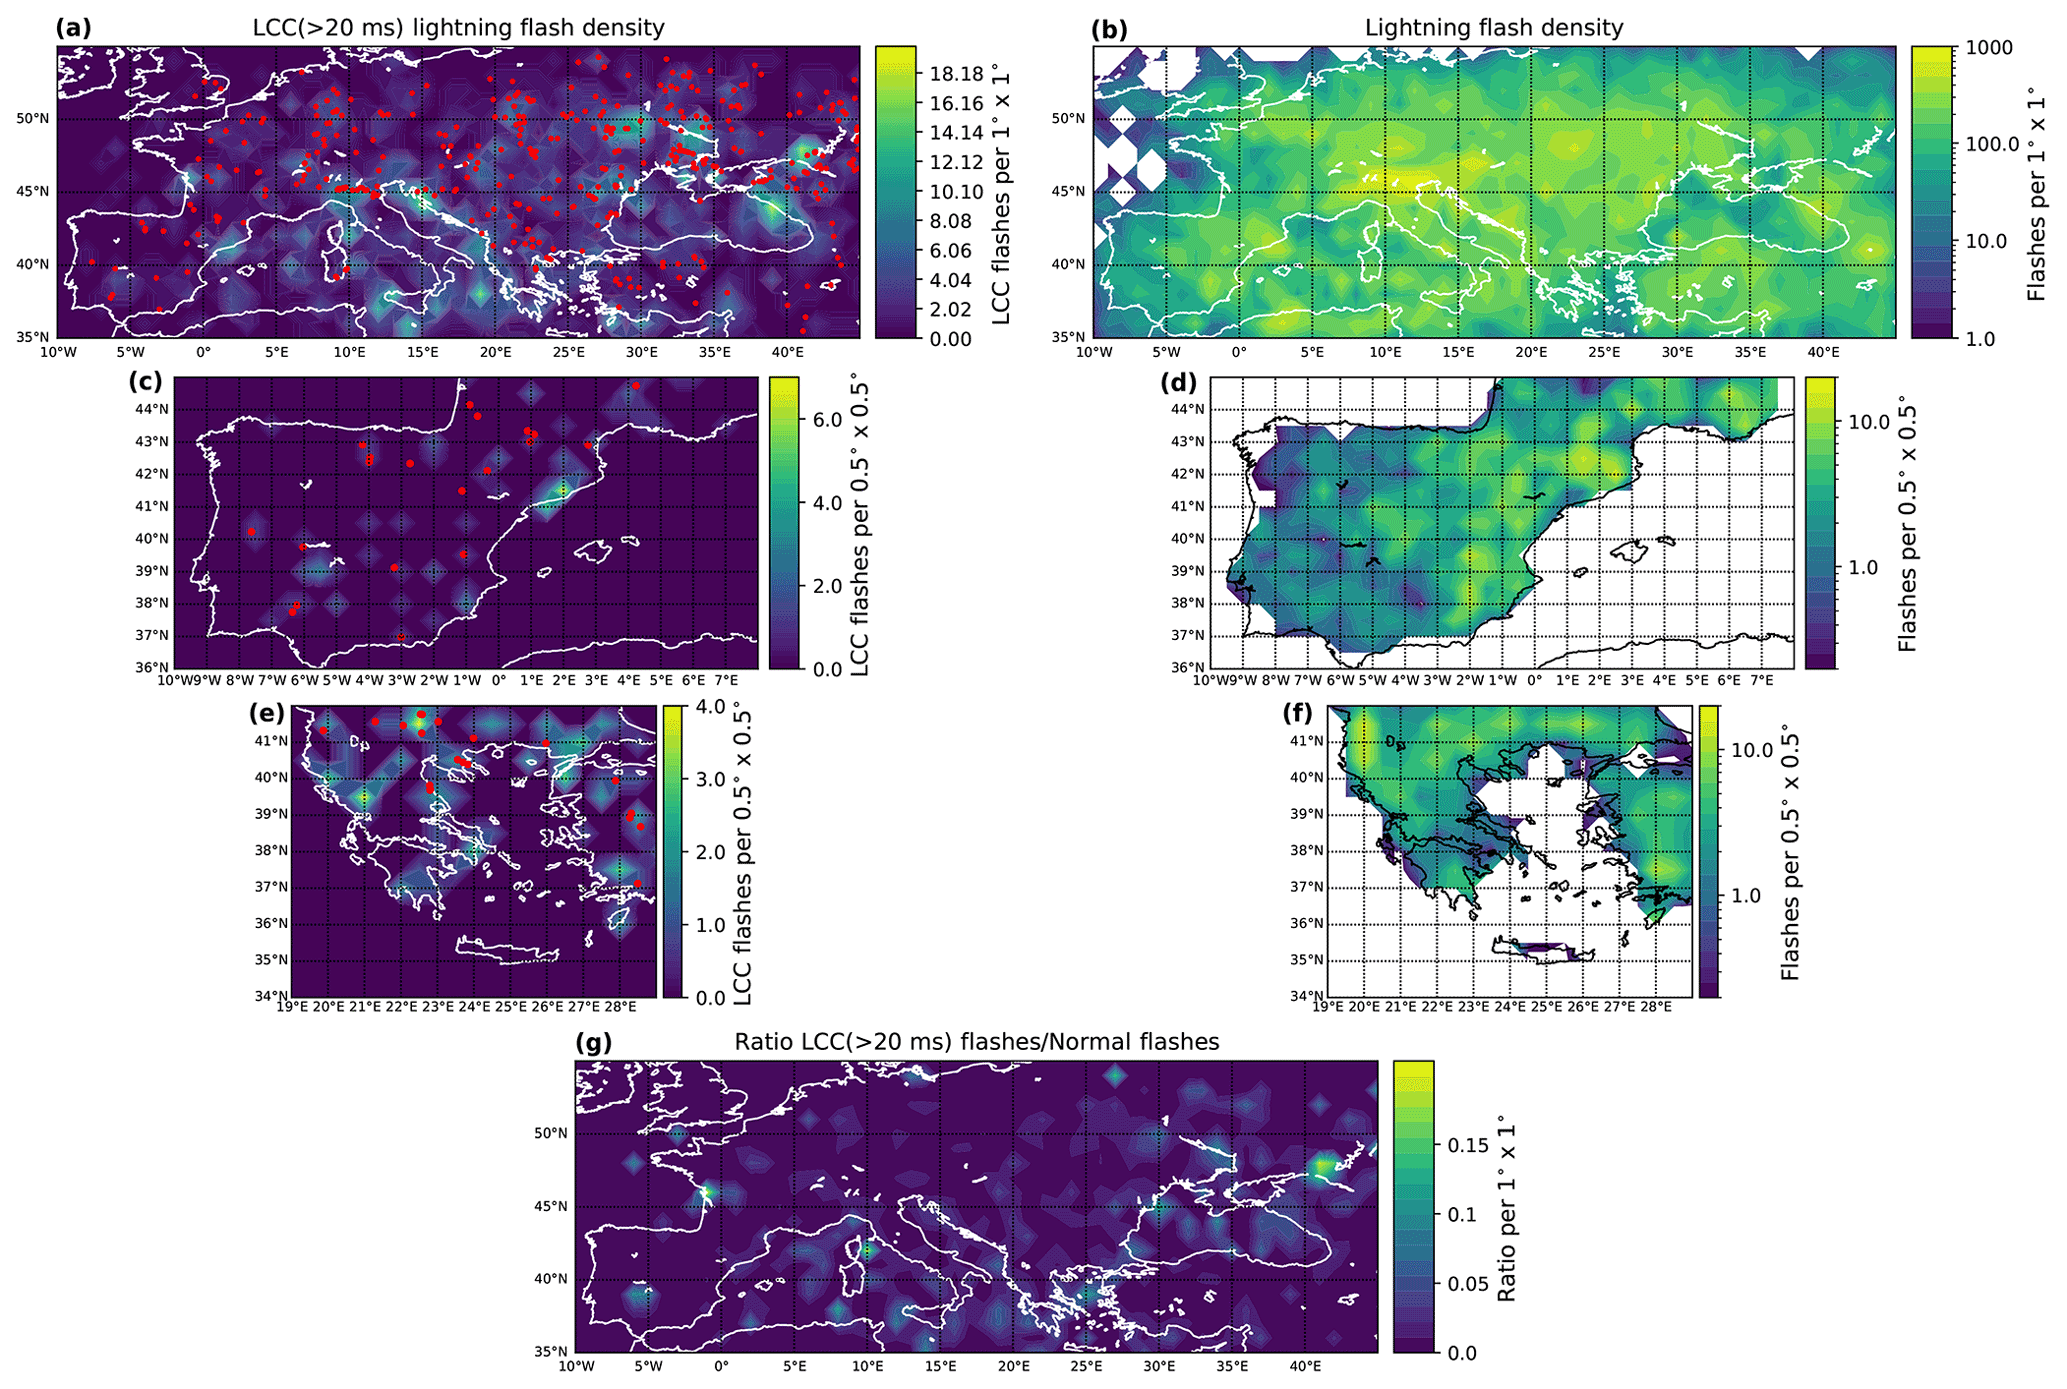
Figure 15LCC(>20 ms) lightning flash density (a, c, e), total lightning flash density (b, d, f), and the ratio between them (g) from ISS-LIS lightning measurements between March 2017 and September 2020. Panels (a, b) show maps over Europe with , while panels (c, d) and (e, f) show magnified views of the regions of interest (only flashes over land) in a cell. Red dots in the left row represent the LCC(>20 ms) lightning flashes taking place over land and with CBH larger than 2000 m. For the sake of clarity, in the map of Europe (g), the ratio in one cell is set to zero if there are fewer than 10 lightning flashes and fewer than 2 LCC(>20 ms) lightning flashes.
A comparison of the LIWs maps (Fig. 2) and LCC(>20 ms) lightning maps (Fig. 15) in the Iberian Peninsula and Greece is difficult as a consequence of the low total number of reported LCC(>20 ms) lightning flashes by ISS-LIS. However, it is interesting to highlight the high occurrence of LCC(>20 ms) flashes and fire-igniting lightning in the Mediterranean coast of the Iberian Peninsula. In addition, we have obtained a high occurrence of LIWs and LCC(>20 ms) lightning flashes over the Greek coastal regions and over some parts of the Pindus mountain range.
Figure 16 shows the monthly occurrence of typical lightning and LCC(>20 ms) lightning flashes over land in Europe. The peak in the occurrence rate of LCC(>20 ms) lightning flashes is reached during the summer season, while the peak in the ratio of LCC(>20 ms) lightning to typical lightning flashes occurs during the winter. The total number of flashes during winter is lower than during summer, causing the ratio of LCC(>20 ms) lightning to typical lightning flashes to oscillate more during winter than during summer. Winter thunderstorms are characterized by weak updrafts, which suggests that weaker convection in thunderstorms favors the occurrence of LCC(>20 ms) lightning flashes, as proposed by Bitzer (2017).
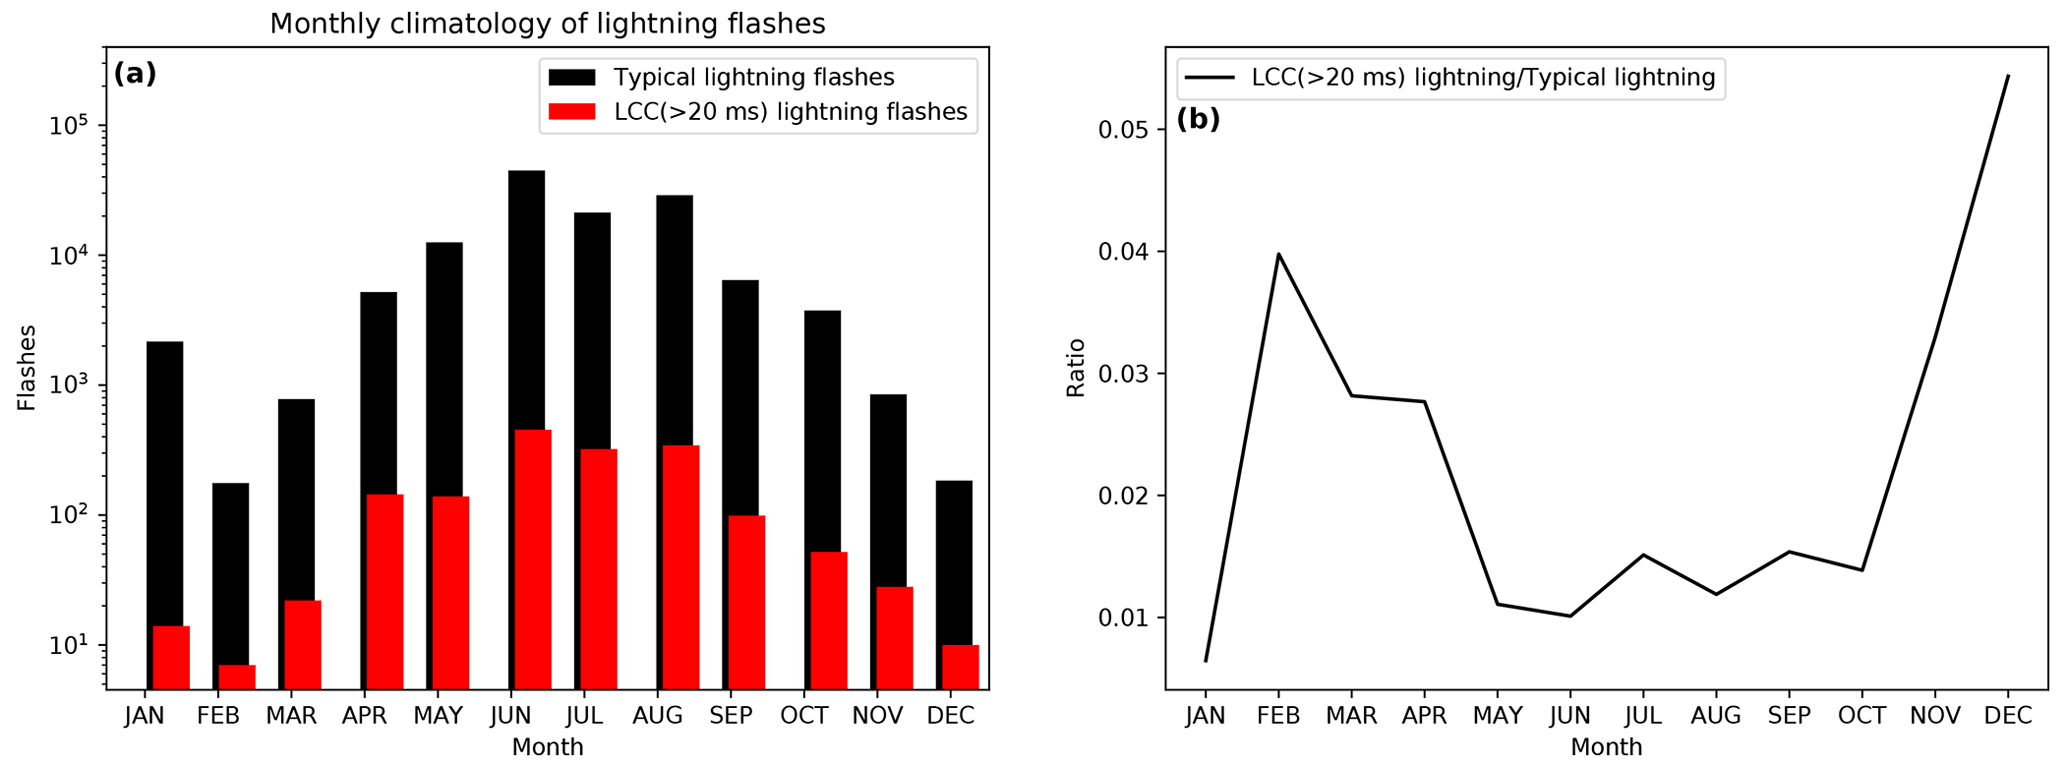
Figure 16Panel (a) shows the monthly occurrence of typical lightning and LCC(>20 ms) lightning flashes reported by ISS-LIS over land in Europe between March 2017 and September 2020. Panel (b) shows the monthly averaged ratio of LCC(>20 ms) lightning flashes to all flashes.
3.4.2 Meteorological conditions for LCC lightning
With the purpose of finding possible relationships between LIWs and LCC(>20 ms) lightning flashes, we analyze the meteorological conditions associated with LCC(>20 ms) lightning flashes reported by ISS-LIS over land in Europe between May and September 2017–2020. We exclude the LCC(>20 ms) lightning data from the winter and autumn seasons (January–April and October–December) from our analysis because the total number of LIWs during those seasons is negligible.
We show, in the Supplement, the frequency distribution of CAPE, the accumulated precipitation, the relative humidity at 850 hPa pressure level, and the temperature at 2 m altitude and at 850 hPa pressure level for typical lightning and LCC(>20 ms) lightning flashes. We also show the analysis of the vertical content of moisture in the Supplement, which suggests that LCC(>20 ms) flashes tend to occur in thunderstorms with a lower content of moisture than the climatological median. We have added these values to Table 2. We have not found any evident link between these meteorological conditions at the lower troposphere and the occurrence of LCC(>20 ms) lightning flashes.
However, two of the meteorological parameters that are relevant for the occurrence of fire-igniting lightning (Sect. 2.3) are also related with the occurrence of LCC(>20 ms) lightning flashes, namely the vertical velocity and the CBH. The median vertical profiles of the vertical velocity for typical and LCC(>20 ms) lightning plotted in Fig. 17 indicate that LCC(>20 ms) lightning flashes tend to occur under weaker convection than typical lightning flashes. The p value is below 0.05 for all the pressure levels at altitudes below 400 hPa, indicating that differences in medians of both distributions are statistically significant.
The median temperature differences between 700 and 450 hPa pressure levels for LCC(>20 ms) lightning flashes is 21.8 K, while the climatological median is 21.9 K. The median specific humidity at 450 hPa pressure levels for LCC(>20 ms) lightning flashes is kg kg−1, while the climatological median is kg kg−1. Therefore, we suggest that differences in the vertical velocity between LCC(>20 ms) lightning flashes and the climatology are due to differences in the vertical profiles of humidity and temperature.
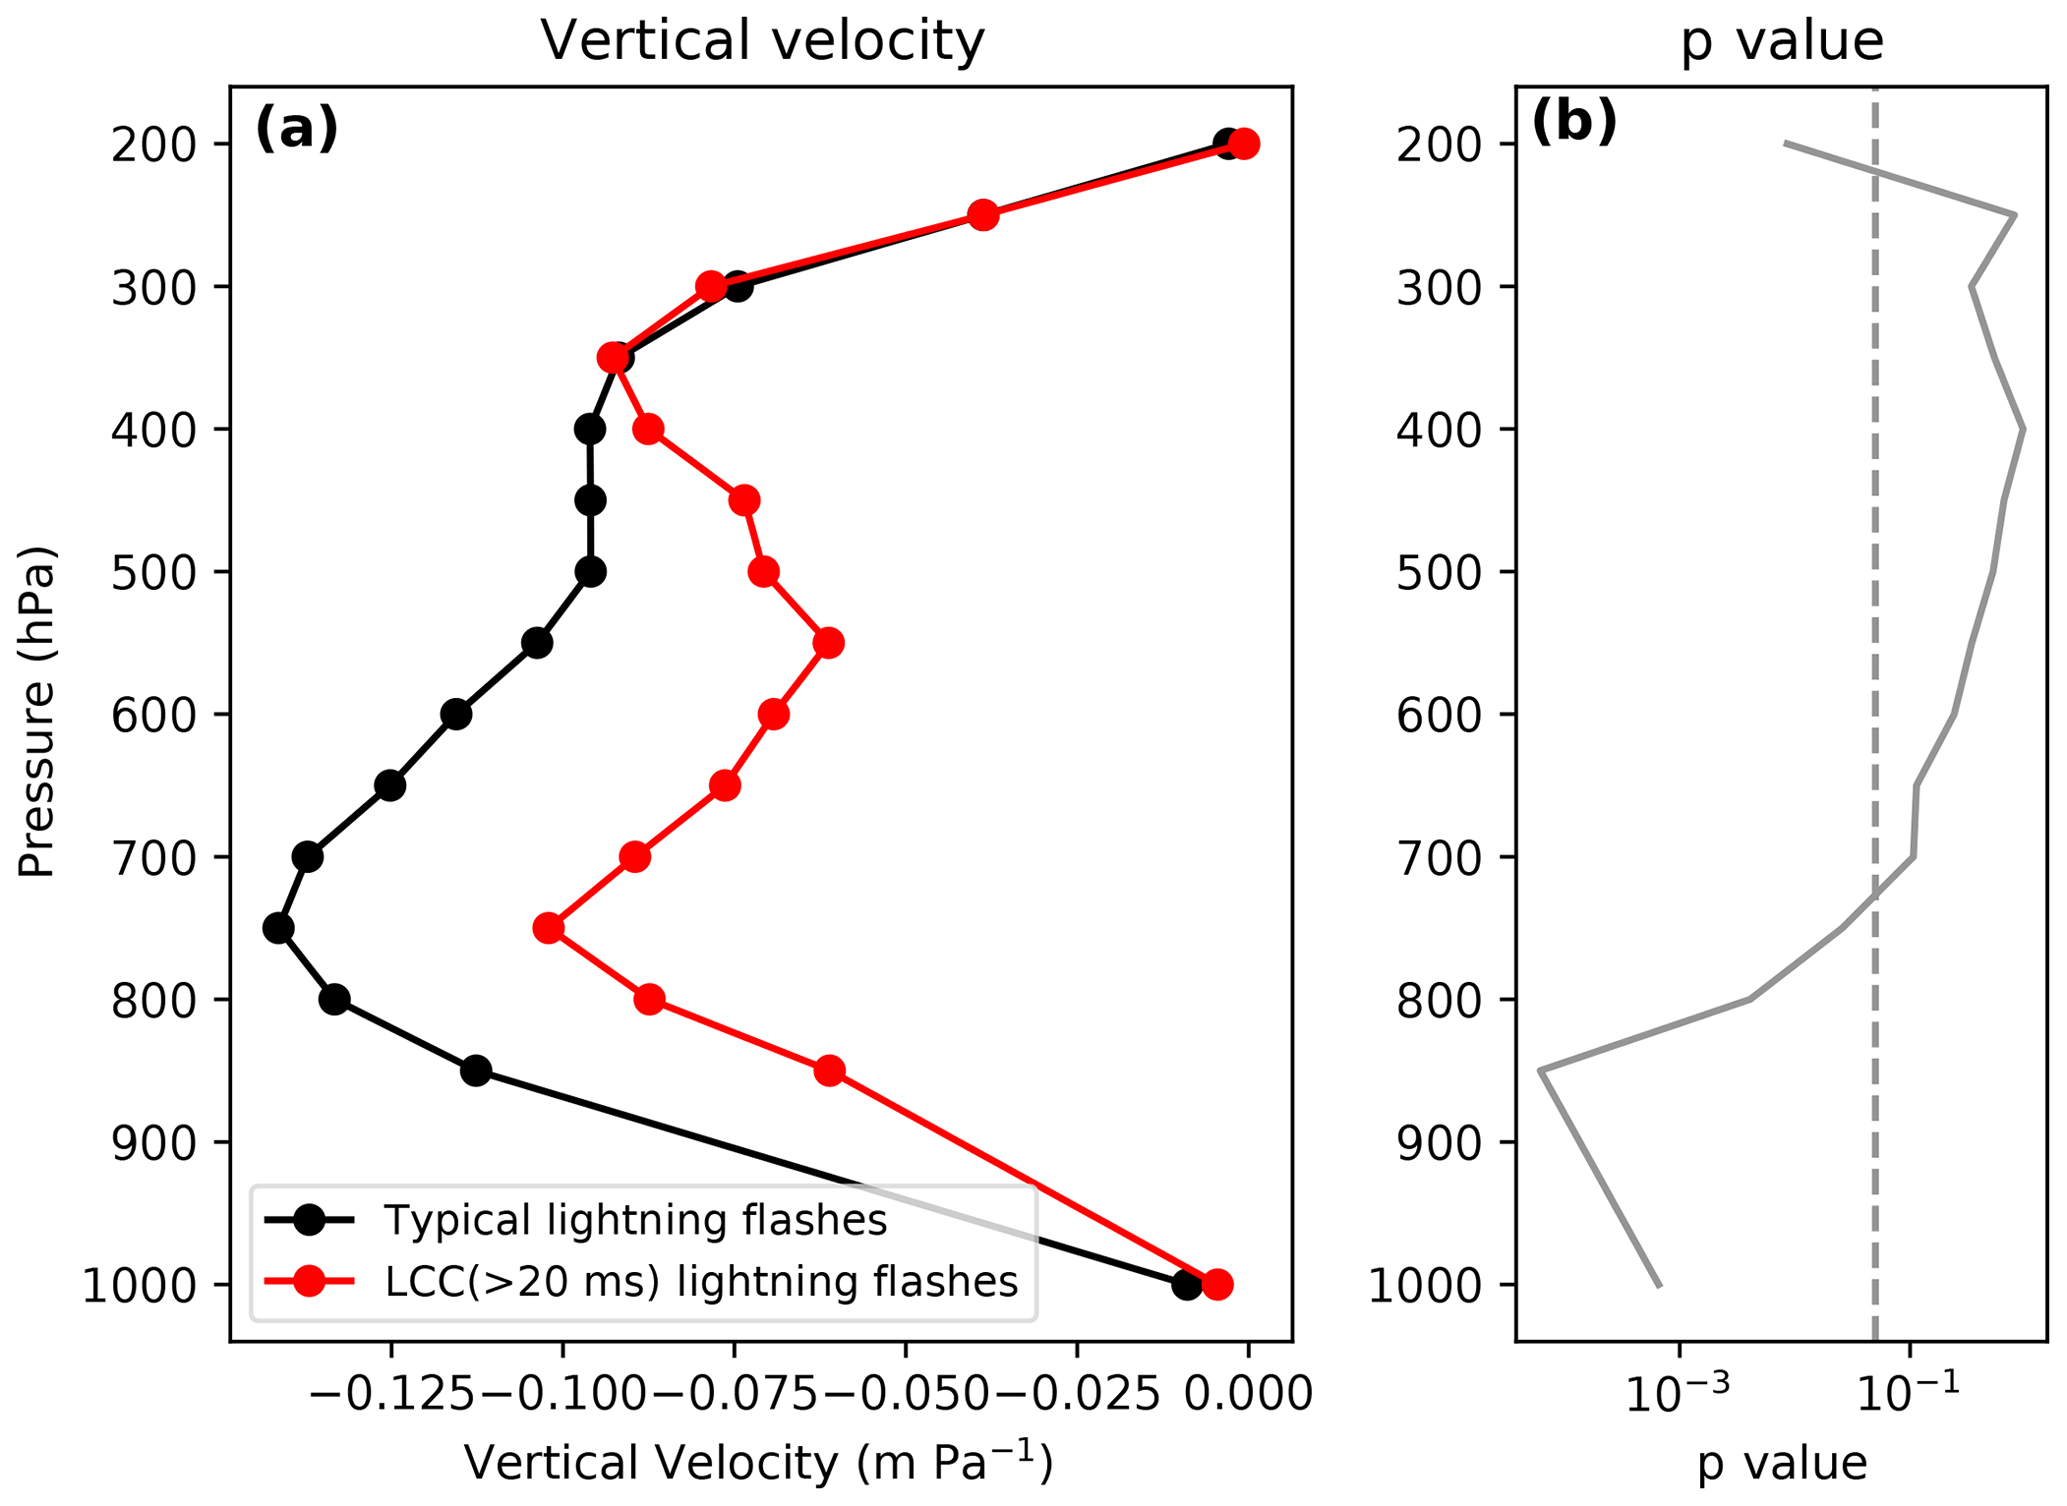
Figure 17Median vertical velocity profile of typical lightning flashes and LCC(>20 ms) lightning flashes reported by ISS-LIS over Europe between May and September in 2017–2020 (a). The p value (solid line) representing the probability of equal median between both distributions and mark showing the limit at 0.05 (dashed line) are shown (b).
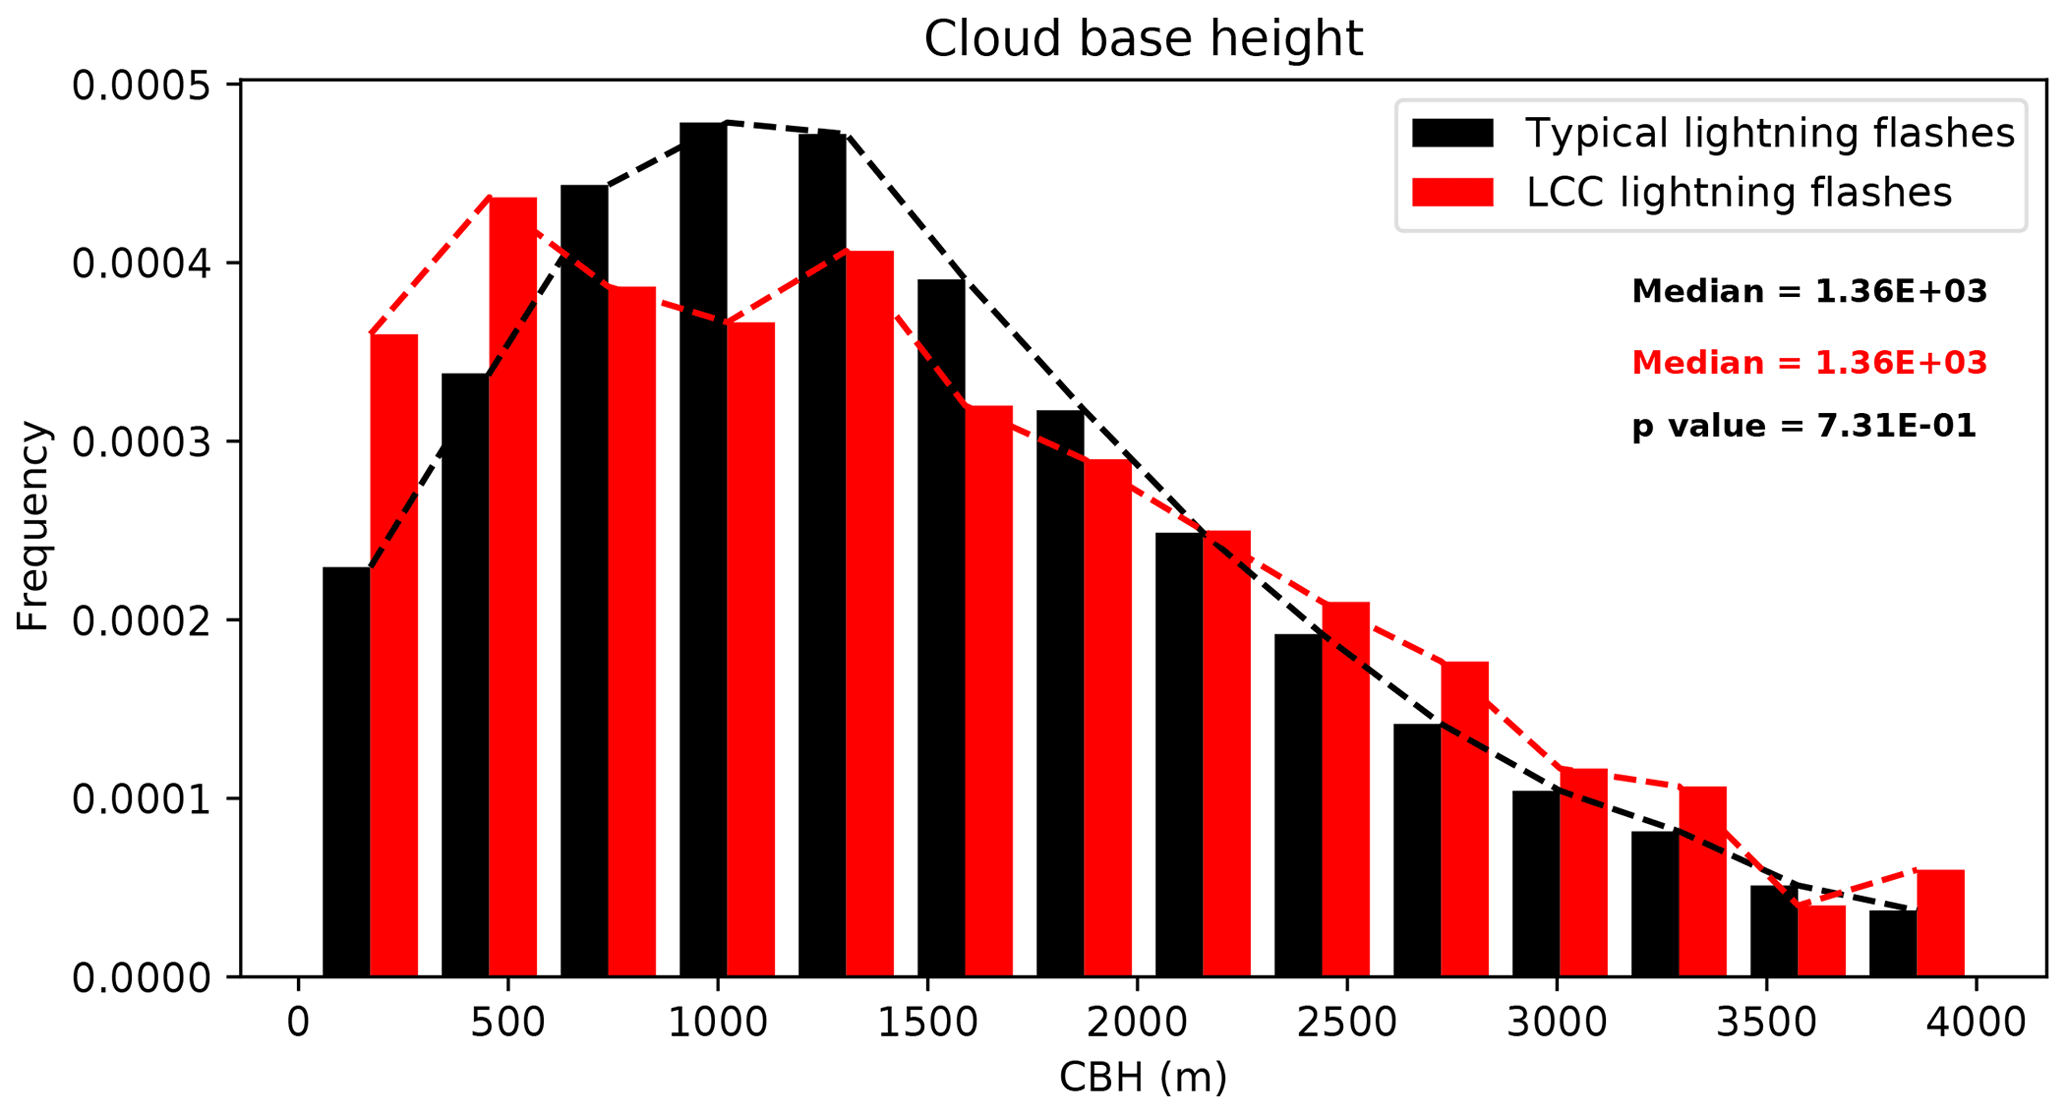
Figure 18Frequency distribution of the CBH value for typical lightning flashes and for LCC(>20 ms) lightning flashes reported by ISS-LIS over Europe between May and September in 2017–2020.
We plot, in Fig. 18, the frequency distribution of the CBH for typical lightning and LCC(>20 ms) lightning. The median value of the CBH associated with LCC(>20 ms) lightning flashes is similar to the value of CBH for typical lightning. The distribution of CBH for LCC(>20 ms) lightning has two peaks, one of them at about 500 and another at about 1250 m, while the distribution of CBH for typical lightning peaks is nearly 1000 m. The frequency distribution of CBH for LCC(>20 ms) lightning is higher than the frequency distribution for typical lightning in low-based clouds (CBH lower than 500 m) and in high-based thunderstorms (CBH>2000 m). The p value is below 0.05, indicating that differences in medians of the shown distributions are statistically significant. Probably, LCC(>20 ms) lightning flashes in low-based clouds do not produce a significant amount of LIWs because they are accompanied by high precipitation rates that do not favor the survival and arrival phases of fires. However, LCC(>20 ms) lightning occurring in clouds with a high base could be the main precursors of LIWs. We will explore this possible relationship between LCC(>20 ms) lightning and LIWs in Sect. 3.5.
We plot, as red dots, the LCC(>20 ms) lightning flashes in thunderstorm with CBH>2000 m in Fig. 15a. The geographical distribution of LCC(>20 ms) lightning flashes in thunderstorm with CBH>2000 m suggests that they tend to occur over mountains. However, a climatology covering a larger number of years is needed to explain the geographical distribution of LCC(>20 ms) lightning flashes with CBH>2000 m.
Figure 19 shows the frequency distribution of CTH values of typical and LCC(>20 ms) lightning flashes reported by ISS-LIS over Europe between 2017 and 2019. The median CTH value of LCC(>20 ms) lightning flashes is slightly below the median CTH value of typical lightning flashes (11.1 km). These results suggest that LCC(>20 ms) lightning flashes tend to occur in thunderstorms with weaker convection than the median, as suggested by Bitzer (2017), for LCC(>10 ms) lightning. The p value is below 0.05, indicating that differences in medians of the shown distributions are statistically significant.
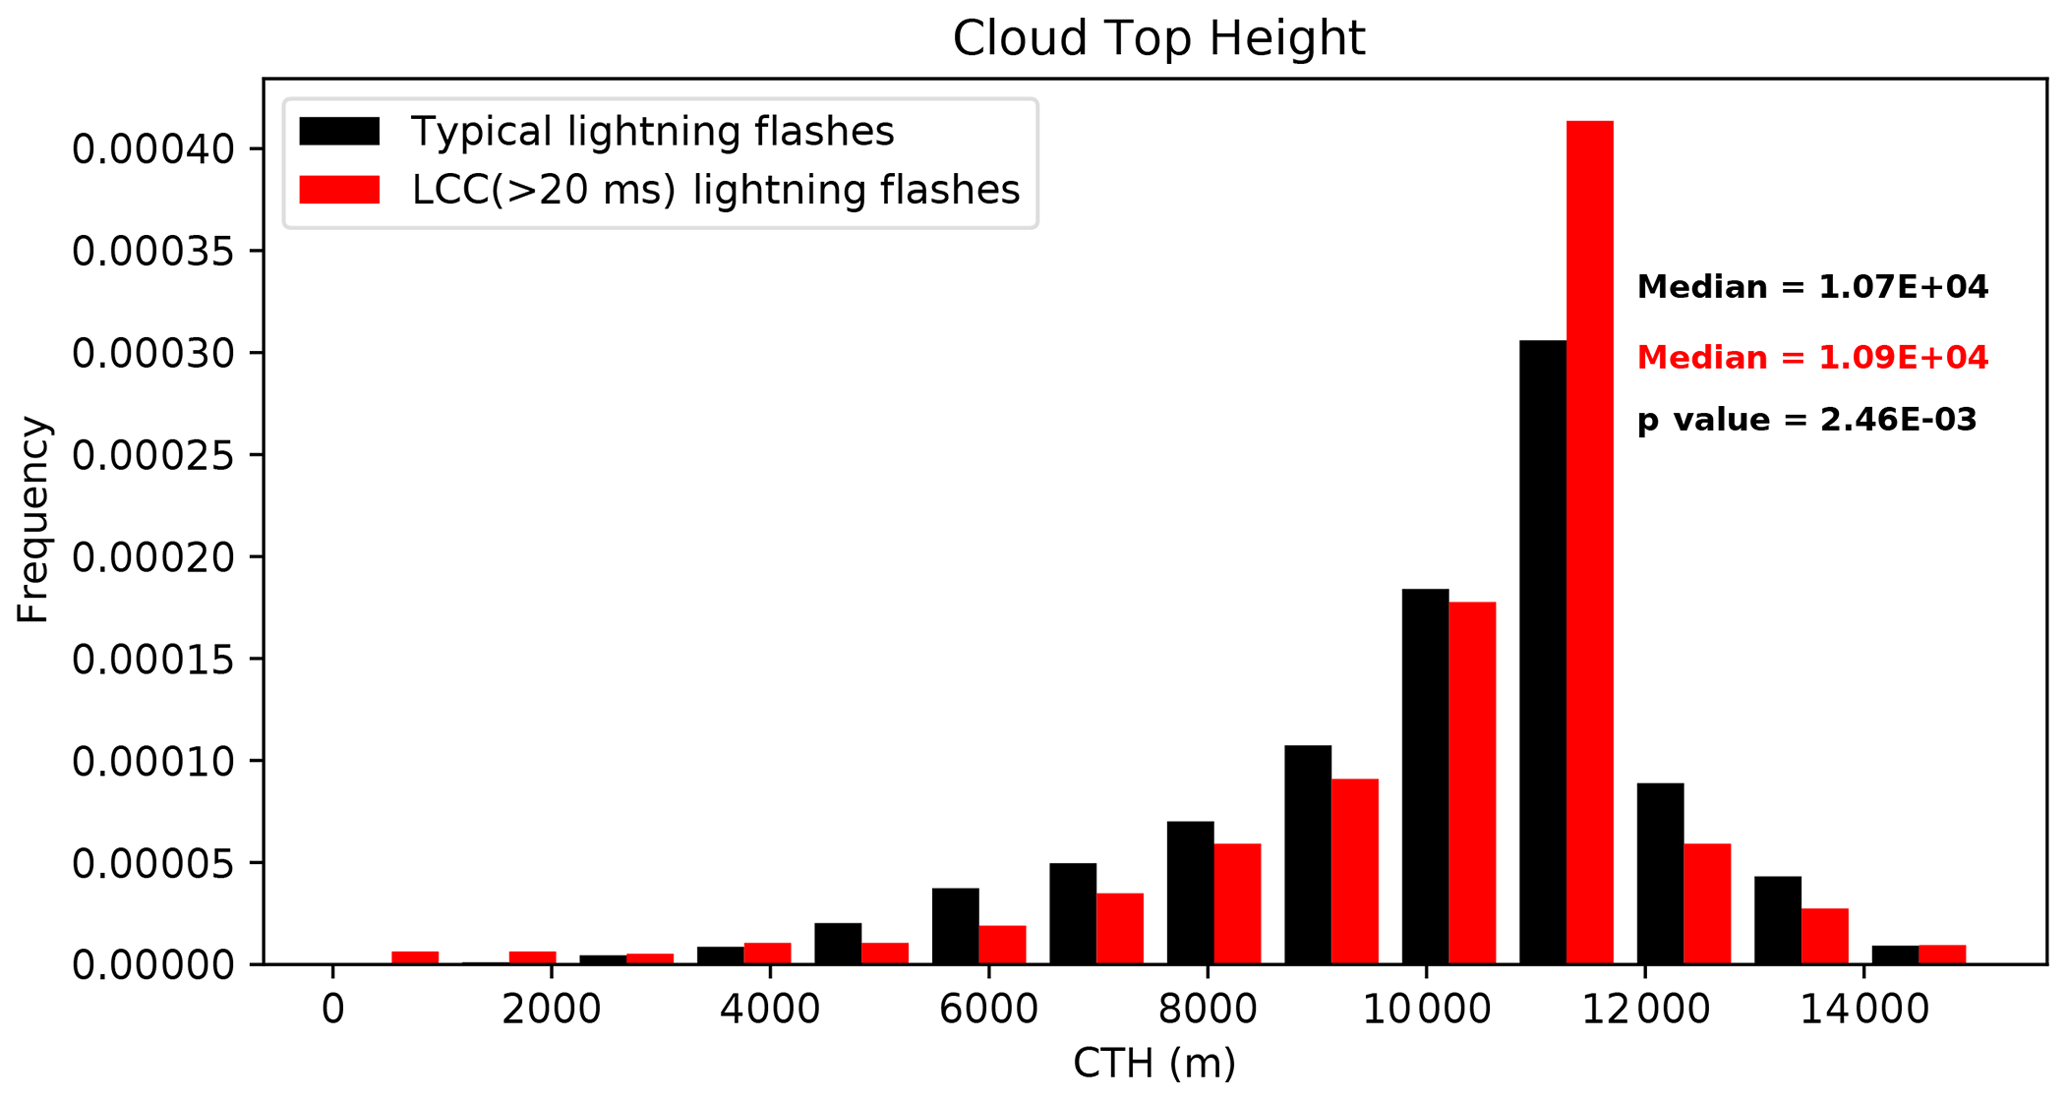
Figure 19Frequency distribution of the CTH values reported by EUMETSAT, based on measurements of the MSG satellites, for typical lightning flashes and LCC(>20 ms) lightning flashes reported by ISS-LIS over Europe between March and September in 2017–2019.
3.5 Possible relationship between thunderstorms producing fire-igniting lightning and LCC lightning
Let us now compare the meteorological and cloud conditions of fire-igniting lightning and LCC(>20 ms) lightning. According to Fig. 18, there exists a subset of LCC(>20 ms) lightning flashes taking place in clouds with a high base (CBH larger than 2000 m). As we discussed in Sect. 3.2, high-based thunderclouds favor the occurrence of dry lightning and LIWs. In particular, Fig. 8 shows that there is a significant total number of fire-igniting flashes taking place in thunderstorms with CBH larger than 2000 m. For this reason, in this section we analyze the meteorological conditions of LCC(>20 ms) lightning flashes taking place in clouds with a high base with CBH values larger than 2000 m. The total number of LCC(>20 ms) lightning flashes in high-based thunderclouds is 392. LCC(>20 ms) lightning flashes with CBH>2000 m are plotted as red dots in Fig. 15a.
Figure 20 shows the frequency distribution of some meteorological variables for typical lightning and LCC(>20 ms) lightning flashes in high-based thunderclouds. According to this figure, the median values of accumulated precipitation and RH at 850 hPa are lower for LCC(>20 ms) lightning flashes in high-based thunderclouds than for the climatological median, with p values lower than the threshold of 0.05. In addition, temperatures at 2 m altitude and at 850 hPa are higher for LCC(>20 ms) lightning flashes in high-based thunderclouds than for the climatological median, again with p values lower than the threshold of 0.05, indicating that differences are statistically significant. These are typical conditions of fire-igniting lightning flashes (see Sect. 3.2). We have found slightly lower values of CAPE for LCC(>20 ms) lightning flashes in high-based thunderclouds than for typical lightning.
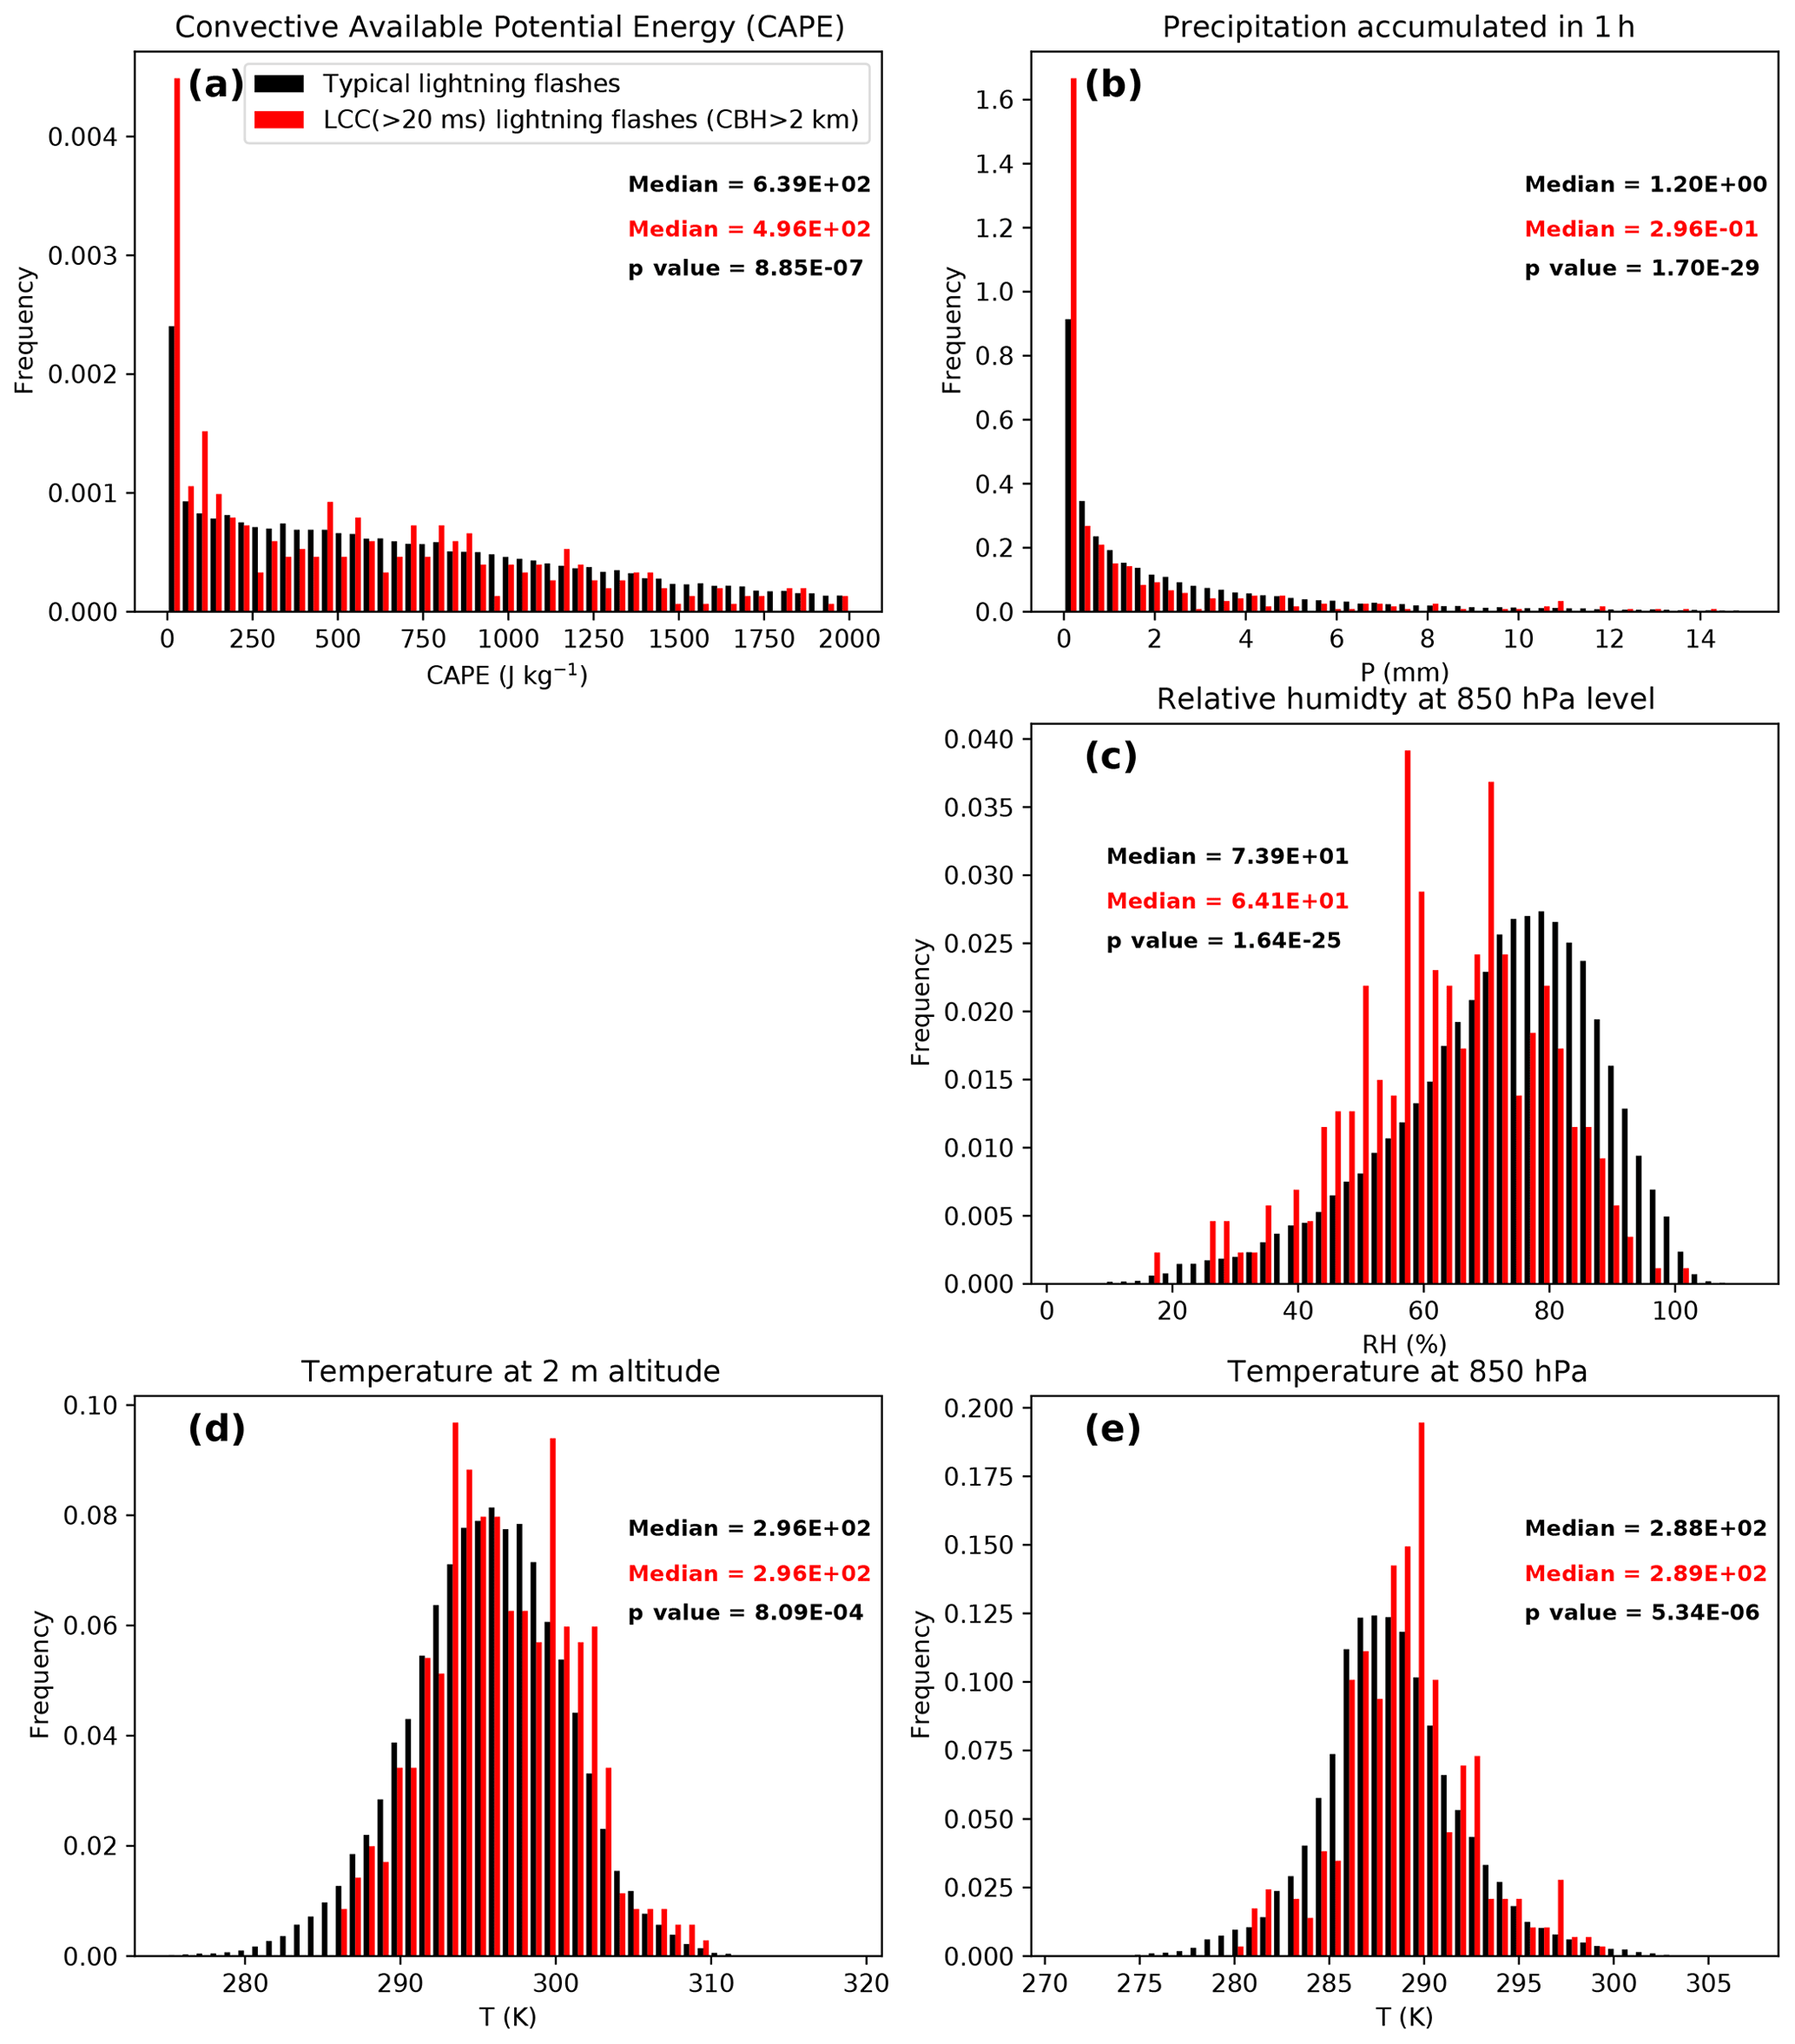
Figure 20Frequency distribution of the convective available potential energy (CAPE), the hourly accumulated precipitation, the relative humidity at 850 hPa level, and the air temperature at 2 m and at 850 hPa levels for typical lightning and LCC(>20 ms) lightning flashes in high-based thunderclouds (CBH>2000 m), as reported by ISS-LIS over land in Europe between May and September 2017–2020.
A comparison of Figs. 10 and 17 shows that fire-igniting lightning flashes in the Iberian Peninsula and LCC(>20 ms) lightning flashes take place in thunderstorms with weaker updrafts than the climatological median. We do not find the same tendency in Greece (see Fig. 10). As we show in Figs. 8 and S6 in the Supplement, the content of the moisture of LIWs-producing thunderstorms in the Iberian Peninsula and LCC(>20 ms) lightning-producing thunderstorms is lower than the climatological median, which could be the reason behind the weaker updrafts, as drier air is more dense than moist air (Picard et al., 2008). Deep convective clouds are usually associated with the 440 hPa level (Rossow, 1996), which is included in the region where the updraft is weaker than the climatological median for LIWs in the Iberian Peninsula and LCC(>20 ms) lightning. Several lightning parameterizations are based on the updraft mass flux at 440 hPa, where electrification occurs Grewe et al. (2001); Allen and Pickering (2002); Finney et al. (2014). Weaker updraft leads to a slower rime accretion rate (Takahashi, 1978). As suggested by Bitzer (2017), a weaker charging rate can lead to the development of larger charge regions before lightning is initiated, producing a larger charge region available to be neutralized by a lightning flash. Large charge regions can favor the occurrence of LCC(>20 ms) lightning (Bitzer, 2017) and, according to our results, could also favor the occurrence of LIWs.
We have compared the LCC(>20 ms) lightning flashes with CBH>2 km taking place in the Iberian Peninsula and Greece with ENTLN flash data. Among 39 LCC(>20 ms) lightning flashes reported by ISS-LIS, we have found 12 ENTLN lightning flashes (3 CG and 9 IC) taking place in a radius of 0.2∘ (latitude and longitude) around the flashes reported by ISS-LIS and within a temporal delay smaller than 2 s. Therefore, we conclude that ENTLN is not adequate to detect the continuing phase of LCC(>20 ms) flashes in the studied regions. These results are in agreement with Bitzer (2017), who reported that between 25 % and 40 % of LCC lightning flashes detected by TRMM-LIS only have an IC pulse detected by the National Lightning Detection Network (NLDN), with no CG strokes detected.
We also attempted to directly correlate LIWs in Greece (2017–2019) and over the Iberian Peninsula (2017) with LCC lightning flashes reported by ISS-LIS. However, we did not find any case in which ISS-LIS was flying over Greece or the Iberian Peninsula at the moment of ignition.
To the best of our knowledge, this study is the first that investigates the shared meteorological characteristics of LIWs and LCC lightning and the upper-tropospheric meteorological characteristics of LIWs and LCC lightning flashes in the Mediterranean. As extensively discussed in Sect. 1, past studies have reported the meteorological characteristics in the lower troposphere of LIWs in the Mediterranean Basin and the possible linkage between dry thunderstorms and fire-igniting flashes in the USA and Australia (Rorig et al., 2007; Dowdy and Mills, 2012; Bates et al., 2017; Dowdy, 2020). According to our results, dry thunderstorms with high-based thunderclouds are also the main precursor of LIWs in the Mediterranean Basin. In accordance with previous studies in Catalonia (e.g., Pineda and Rigo, 2017), our results also suggest that thunderstorms taking place with a high temperatures at the surface, at 850 hPa pressure level, and horizontal wind velocities at the surface tend to be related to LIWs.
Fuquay et al. (1967) proposed that LCC lightning could be the main precursors of LIWs. Bitzer (2017) reported the first climatology of LCC-flashes, without including the Mediterranean Basin. According to Bitzer (2017), LCC lightning tends to occur in thunderstorms with weaker updraft than the climatological median. We have found that LIWs over the Iberian Peninsula and LCC(>20 ms) lightning tend to occur in thunderstorms with weaker updrafts than the climatological median. In addition, we have found that a significant number of LIWs and LCC(>20 ms) lightning flashes take place in dry thunderstorms with high-based thunderclouds. The low content of moisture in these thunderstorms can be the reason for weaker updrafts, as dry air is more dense as moist air.
Some previous studies have developed statistical methods, machine learning approaches, or parameterizations based on meteorological variables to predict LIWs (e.g., Fuquay, 1979; Flannigan and Wotton, 1991; Krause et al., 2014; Coughlan et al., 2021). These methods typically use lightning parameterizations to predict the occurrence of lightning and then estimate the risk of LIWs according to environmental factors. However, the employed lightning parameterizations do not distinguish between regular/typical lightning and LCC lightning flashes. The analysis of meteorological conditions of LIWs and LCC(>20 ms) lightning in the Mediterranean Basin suggests that using the updraft between 300 and 450 hPa could serve to improve LIW forecasting methods. The common features of thunderstorms producing LIWs and LCC(>20 ms) lightning flashes confirm that monitoring the occurrence of LCC(>20 ms) lightning flashes and/or the characteristics of thunderstorms producing them could improve the forecast of fire ignition. In particular, calibrating existent lightning potential indexes (e.g., Yair et al., 2010; Lynn et al., 2012) against the occurrence of LCC(>20 ms) lightning could improve forecast capabilities in operational models. The parameterization of LCC(>20 ms) lightning flashes in global atmospheric models based on these features can also serve to produce a better estimate of the global fire emissions in a warmer climate. However, more data are needed to study the role of LCC(>20 ms) lightning in LIWs in other regions of the world.
The main objective of this work was to shed light on the following questions: what is the relationship between the occurrence of dry thunderstorms and LIW fires in the Mediterranean Basin? What is the role of long continuing current (LCC) lightning flashes in the ignition?
We have investigated the meteorological and cloud conditions of fire-igniting lightning over the Iberian Peninsula and Greece between 2009 and 2017 and between 2017 and 2019, respectively. In addition, we have analyzed, for the first time, the relationship between LCC(>20 ms) lightning determined from ISS-LIS data over Europe, with a continuous current lasting more than 20 ms, and fire-igniting lightning. We have focused our analysis on LCC(>20 ms) lightning flashes because the continuous phase of the discharge can transfer a significant amount of energy to trees, producing ignition. We have developed the first LCC(>20 ms) lightning map over the Mediterranean Basin, based on optical measurements of ISS-LIS between 2017 and 2020. However, more data are needed to produce a climatology.
We have searched the lightning candidate of each fire using a proximity index that combines the holdover and the distance between flashes and fires. The fire databases used in this study have been provided by national institutions from Spain, Portugal, France, and Greece, while the lightning data have been provided by WWLLN, ENTLN, and ISS-LIS. We have collected meteorological and cloud conditions for the lightning flashes included in this study from the ERA5-reanalysis data set, from the Spanish State Meteorological Agency (AEMET), and from the CTHP derived from Meteosat Second Generation (MSG) satellites measurements. Finally, we have compared the meteorological and cloud conditions of fire-producing lightning and LCC(>20 ms) lightning-producing thunderstorms with the climatological median. The main conclusions of this work are as follows:
-
Fire-igniting flashes over the studied region tend to occur in dry thunderstorms with a low accumulated precipitation value and a low content of moisture. Fire-producing thunderstorms are characterized by clouds with a high base and by weak updrafts between 300 and 450 hPa pressure levels. High temperatures at the surface, at 850 hPa pressure level, and horizontal wind velocities at the surface favor the ignition and spreading of lightning-produced fires. We have obtained a slightly higher probability of ignition for positive CG lightning flashes than for negative CG lightning flashes, in agreement with Latham and Williams (2001).
-
The common meteorological and cloud conditions of thunderstorms producing LIWs and LCC(>20 ms) lightning flashes are the low content of 1 h accumulated precipitation and the weak updrafts between 300 and 450 hPa pressure levels.
-
We have found that the temperature at 2 m altitude and at 850 hPa pressure level is higher than the climatological value in high-based thunderclouds (CBH larger than 2000 m) producing LCC(>20 ms) flashes, coinciding with the meteorological conditions of fire-producing thunderstorms. In total, about a third of all the analyzed LCC(>20 ms) lightning flashes occurs in high-based thunderclouds. This result suggests that parameterizing and/or monitoring the occurrence of LCC(>20 ms) lightning flashes could serve to improve fire forecasting models and LIW parameterizations.
Our analysis suggests that the LCC lightning occurrence over Europe can be parameterized in atmospheric models using meteorological variables as proxy. Such a parameterization can be used in future studies to improve the modeling of fire occurrence and its atmospheric emissions in such models, where different atmospheric variables are used as proxies for the occurrence of lightning (e.g., Tost et al., 2007; Murray et al., 2012; Gordillo-Vázquez et al., 2019). The launch of the Meteosat Third Generation (MTG) geostationary satellites of the EUropean Organization for the Exploitation of METeorological SATellites (EUMETSAT) in 2022 will provide, for the first time, a continuous monitoring of the occurrence of lightning flashes and fires in Europe and Africa through the instruments Lightning Imager (LI) and Flexible Combined Imager (FCI) from 2023, after the commissioning phase (Stuhlmann et al., 2005). MTG-LI will also provide, for the first time, a climatology of LCC flashes over Europe and Africa, enabling us to investigate the relationships between LIWs and LCC flashes in both continents. New flash and fire climatology provided by the MTG-LI and the MTG-FCI, together with meteorological measurements, will mean a substantial advance in the study of the meteorological conditions of LIWs in the Mediterranean Basin.
All data used in this paper are directly available after a request is made to authors Francisco J. Pérez-Invernón (franciscoJavier.perez-invernon@dlr.de) or Heidi Huntrieser (heidi.huntrieser@dlr.de). All the analyzed EUMETSAT CTHPs are freely accessible through the EUMETSAT Earth Observation Portal (https://navigator.eumetsat.int/product/EO:EUM:DAT:MSG:CTH, last access: 12 February 2021, EUMETSAT, 2021). The ERA5 meteorological data are freely accessible through the Copernicus Climate Change Service (C3S; 2017), including ERA5, which is the fifth generation of the ECMWF atmospheric reanalyses of the global climate. Also see the Copernicus Climate Change Service Climate Data Store (CDS; https://cds.climate.copernicus.eu/cdsapp, last access: 12 February 2021; https://doi.org/10.24381/cds.bd0915c6, https://doi.org/10.24381/cds.adbb2d47, Hersbach et al., 2018a, b, and https://doi.org/10.24381/cds.e2161bac, Muñoz Sabater, 2019, 2021). WWLLN lightning data are available from the University of Valencia (http://wwlln.net/, last access: 12 February 2021, WWLLN, 2021). ENTLN lightning data are available from Earth Networks (https://www.earthnetworks.com/, last access: 12 February 2021; Earth Networks, 2021). ISS-LIS lightning data are freely accessible through the NASA Global Hydrology Resource Center (https://ghrc.nsstc.nasa.gov/lightning/data/data_lis_iss, last access: 12 February 2021; https://doi.org/10.5067/LIS/ISSLIS/DATA110, Blakeslee, 2021). Echo top radar measurements are available through AEMET (http://www.aemet.es/ca/eltiempo/observacion/radar, last access: 12 February 2021; AEMET, 2021). Fire data over Spain are available through the Spanish Ministerio de Agricultura, Pesca y Alimentación. Fire data over Portugal are freely available through ICNF Sistema de Gestão de Informação de Incêndios Florestais (http://www2.icnf.pt/portal/florestas/dfci/inc; ICNF, 2021). Fire data over France are freely available through Prométhée database (https://www.promethee.com, last access: 12 February 2021; Délégation à la Protection de la Forêt Méditerranéenne, 2020). Fire data over Greece are provided by the Hellenic Fire Service.
The supplement related to this article is available online at: https://doi.org/10.5194/acp-21-17529-2021-supplement.
FJPI took responsibility for the conceptualization, methodology, validation, formal analysis, investigation, data curation, and writing of the original draft. HH also contributed to the conceptualization, methodology, validation, and formal analysis. HH assisted with the supervision and investigation and reviewed and edited the paper with FJGV, NP, JM, and OvdV. FJGV, NP, JM, and OvdV contributed to the conceptualization and validation. Moreover, FJGV, SS, JNG, VR, and NK curated the data.
The contact author has declared that neither they nor their co-authors have any competing interests
Publisher's note: Copernicus Publications remains neutral with regard to jurisdictional claims in published maps and institutional affiliations.
This article is part of the special issue “The role of fire in the Earth system: understanding interactions with the land, atmosphere, and society (ESD/ACP/BG/GMD/NHESS inter-journal SI)”. It is a result of the EGU General Assembly 2020, 3–8 May 2020.
The authors would like to thank NASA for providing the LIS-ISS lightning data, Earth Networks for providing the ENTLN lightning data, WWLLN for providing the WWLLN lightning data, the Spanish State Meteorological Agency (AEMET) for providing the echo top radar measurements, EUMETSAT for providing the CTHP data, ECMWF for providing us with the data of the ERA5 forecasting models, the Spanish Ministerio de Agricultura, Pesca y Alimentación for providing fire data over Spain, the Instituto da Conservaçao da Natureza e das Florestas for providing fire data over Portugal, the Prométhée database for providing fire data over Mediterranean France, and the Hellenic Fire Service for providing fire data over Greece. The Authors would also like to thank Luca Bugliaro Goggia (Deutsches Zentrum für Luft-und Raumfahrt – DLR), for his support in the processing of METEOSAT data, and Matthias Nützel (DLR), for providing valuable comments on this paper. Francisco J. Pérez-Invernón acknowledges the sponsorship provided by the Federal Ministry for Education and Research of Germany through the Alexander von Humboldt Foundation. Additionally, this work was supported by the Spanish Ministry of Science and Innovation (under grant no. PID2019-109269RB-C43 and the FEDER program). Francisco J. Gordillo-Vázquez and Sergio Soler acknowledge financial support from the State Agency for Research of the Spanish MCIU through the “Center of Excellence Severo Ochoa” award for the Instituto de Astrofísica de Andaluca (grant no. SEV-2017-0709). The contribution of the Universitat Politècnica de Catalunya was supported by research grants from the Spanish Ministry of Economy and the European Regional Development Fund (FEDER; grant no. PID2019-109269RB-C42).
This research has been supported by the Federal Ministry for Education and Research of Germany through the Alexander von Humboldt Foundation, the Spanish Ministry of Science and Innovation (grant nos. PID2019-109269RB-C43 and PID2019-109269RB-C42 and the FEDER program), and the Spanish MCIU through the “Center of Excellence Severo Ochoa” award for the Instituto de Astrofísica de Andalucía (grant no. SEV-2017-0709).
The article processing charges for this open-access publication were covered by the German Aerospace Center (DLR).
This paper was edited by Manvendra K. Dubey and reviewed by two anonymous referees.
Abreu, D., Chandan, D., Holzworth, R. H., and Strong, K.: A performance assessment of the World Wide Lightning Location Network (WWLLN) via comparison with the Canadian Lightning Detection Network (CLDN), Atmos. Meas. Tech., 3, 1143–1153, https://doi.org/10.5194/amt-3-1143-2010, 2010. a
Adachi, T., Cummer, S. A., Li, J., Takahashi, Y., Hsu, R.-R., Su, H.-T., Chen, A. B., Mende, S. B., and Frey, H. U.: Estimating lightning current moment waveforms from satellite optical measurements, Geophys. Res. Lett., 36, L18808, https://doi.org/10.1029/2009GL039911, 2009. a, b
Agencia Estatal de Meteorologica (AEMET): Homepage, available at: http://www.aemet.es/ca/eltiempo/observacion/radar, last access: 12 February 2021. a
Allen, D. J. and Pickering, K. E.: Evaluation of lightning flash rate parameterizations for use in a global chemical transport model, J. Geophys. Res.-Atmos., 107, ACH-15, 2002. a
Altaratz, O., Koren, I., Yair, Y., and Price, C.: Lightning response to smoke from Amazonian fires, Geophys. Res. Lett., 37, L07801, https://doi.org/10.1029/2010GL042679, 2010. a
Amatulli, G., Peréz-Cabello, F., and de la Riva, J.: Mapping lightning/human-caused wildfires occurrence under ignition point location uncertainty, Ecol. Model., 200, 321–333, 2007. a
Anderson, K.: A model to predict lightning-caused fire occurrences, Int. J. Wildland Fire, 11, 163–172, 2002. a, b, c
Badia, A., Saurí, D., Cerdan, R., and Llurdés, J.-C.: Causality and management of forest fires in Mediterranean environments: an example from Catalonia, Glob. Environ. Change Part B: Environ. Hazards, 4, 23–32, 2002. a
Baranovskiy, N. and Yankovich, E.: GIS-Technologies and Mathematical Simulation to Predict Lightning-caused Forest Fire Danger, Radio Electronics, Computer Science, Control, 1839, 2–15, 2018. a
Bates, B. C., Dowdy, A. J., and Chandler, R. E.: Classification of Australian thunderstorms using multivariate analyses of large-scale atmospheric variables, J. Appl. Meteorol. Clim., 56, 1921–1937, 2017. a, b
Bitzer, P. M.: Global distribution and properties of continuing current in lightning, J. Geophys. Res.-Atmos., 122, 1033–1041, 2017. a, b, c, d, e, f, g, h, i, j, k, l, m, n, o, p, q
Bitzer, P. M. and Christian, H. J.: Timing uncertainty of the lightning imaging sensor, J. Atmos. Ocean. Tech., 32, 453–460, 2015. a
Bitzer, P. M., Burchfield, J. C., and Christian, H. J.: A Bayesian approach to assess the performance of lightning detection systems, J. Atmos. Ocean. Tech., 33, 563–578, 2016. a, b
Blakeslee, R. J., Lang, T. J., Koshak, W. J., Buechler, D., Gatlin, P., Mach, D. M., Stano, G. T., Virts, K. S., Walker, T. D., Cecil, D. J., Ellett, W., Goodman, S. J., Harrison, S., Hawkins, D. L., Heumesser, M., Lin, H., Maskey, M., Schultz, C. J., Stewart, M., Bateman, M., Chanrion, O., and Christian, H.: Lightning Imaging Sensor (LIS) for the International Space Station (ISS): mission description and science goals, in: International Conference on Atmospheric Electricity (ICAE 2014), Norman, OK, USA, 16–20 June 2014, No. M14-3658, 2014. a
Blakeslee, R. J., Lang, T. J., Koshak, W. J., Buechler, D., Gatlin, P., Mach, D. M., Stano, G. T., Virts, K. S., Walker, T. D., Cecil, D. J., Ellett, W., Goodman, S. J., Harrison, S., Hawkins, D. L., Heumesser, M., Lin, H., Maskey, M., Schultz, C. J., Stewart, M., Bateman, M., Chanrion, O., and Christian, H.: Three years of the Lightning Imaging Sensor onboard the International Space Station: Expanded Global Coverage and Enhanced Applications, Earth Space Sci. Open Archive, 35812, 83, 2020. a, b
Blakeslee, R. J.: Non-Quality Controlled Lightning Imaging Sensor (LIS) on International Space Station (ISS) Science Data, [indicate subset used], NASA Global Hydrology Resource Center DAAC [data set], Huntsville, Alabama, U.S.A., https://doi.org/10.5067/LIS/ISSLIS/DATA110, 2021. a
Camia, A., Durrant Houston, T., and San-Miguel-Ayanz, J.: The European fire database: development, structure and implementation, in: Proceedings of the VI International conference on forest fire research, Coimbra, Portugal, 15 November 2010, edited by: Viegas, D. X., A20, 2010. a
Cecil, D. J., Buechler, D. E., and Blakeslee, R. J.: Gridded lightning climatology from TRMM-LIS and OTD: Dataset description, Atmos. Res., 135, 404–414, 2014. a
Christian, H. J., Blakeslee, R. J., Boccippio, D. J., Boeck, W. L., Buechler, D. E., Driscoll, K. T., Goodman, S. J., Hall, J. M., Koshak, J. M., Mach, D. M., and Stewart, M. F.: Global frequency and distribution of lightning as observed from space by the Optical Transient Detector, J. Geophys. Res., 108, ACL 4-1, https://doi.org/10.1029/2002JD002347, 2003. a
Colson, D.: High level thunderstorms of July 31–August 1, 1959, Mon. Weather Rev., 88, 279–285, 1960. a, b
Conedera, M., Cesti, G., Pezzatti, G., Zumbrunnen, T., and Spinedi, F.: Lightning-induced fires in the Alpine region: An increasing problem, Forest Ecol. Manag., 234, S68, 2006. a
Coughlan, R., Di Giuseppe, F., Vitolo, C., Barnard, C., Lopez, P., and Drusch, M.: Using machine learning to predict fire-ignition occurrences from lightning forecasts, Meteorol. Appl., 28, e1973, 2021. a
Cummins, K. L. and Murphy, M. J.: An overview of lightning locating systems: History, techniques, and data uses, with an in-depth look at the US NLDN, IEEE T. Electromagn. C., 51, 499–518, 2009. a
Deierling, W., Latham, J., Petersen, W. A., Ellis, S. M., and Christian, H. J.: On the relationship of thunderstorm ice hydrometeor characteristics and total lightning measurements, Atmos. Res., 76, 114–126, https://doi.org/10.1016/j.atmosres.2004.11.023, 2005. a
Dowden, R. L., Brundell, J. B., and Rodger, C. J.: VLF lightning location by time of group arrival (TOGA) at multiple sites, J. Atmos. Sol.-Terr. Phy., 64, 817–830, 2002. a
Dowdy, A. J.: Climatology of thunderstorms, convective rainfall and dry lightning environments in Australia, Clim. Dynam., 54, 3041–3052, 2020. a, b
Dowdy, A. J. and Mills, G. A.: Atmospheric and fuel moisture characteristics associated with lightning-attributed fires, J. Appl. Meteorol. Clim., 51, 2025–2037, 2012. a, b, c
Délégation à la Protection de la Forêt Méditerranéenne: PROMÉTHÉE 2: Forest fires database for Mediterranean area in France, Délégation à la Protection de la Forêt Méditerranéenne [data set], https://www.promethee.com/ (last access: 12 February 2021), 2020. a, b
Earth Networks: Homepage, available at: https://www.earthnetworks.com/, last access: 12 February 2021. a
Emersic, C., Heinselman, P., MacGorman, D. R., and Bruning, E.: Lightning activity in a hail-producing storm observed with phased-array radar, Mon. Weather Rev., 139, 1809–1825, 2011. a
EUMETSAT: Cloud Top Height – MSG – 0 degree, EUMETSAT [data set], available at: https://navigator.eumetsat.int/product/EO:EUM:DAT:MSG:CTH, last access: 12 February 2021. a
Farr, T. G., Rosen, P. A., Caro, E., Crippen, R., Duren, R., Hensley, S., Kobrick, M., Paller, M., Rodriguez, E., Roth, L., Seal, D., Shaffer, S., Shimada, J., Umland, J., Werner, M., Oskin, M., Burbank, D., and Alsdorf, D.: The Shuttle Radar Topography Mission, Rev. Geophys., 45, RG2004, https://doi.org/10.1029/2005RG000183, 2007. a
Fernandes, S.: Incêndios Florestais em Portugal Continental fora do “período crítico”. Contributos para o seu conhecimento, Master's thesis, Departamento de Geografia e Turismo, NICIF, CEGOT e RISCOS, Faculdade de Letras, Universidade de Coimbra, Portugal, https://doi.org/10.14195/1647-7723_25-1_15, 2015. a
Fernandes, W. A., Pinto, I. R., Pinto Jr, O., Longo, K. M., and Freitas, S. R.: New findings about the influence of smoke from fires on the cloud-to-ground lightning characteristics in the Amazon region, Geophys. Res. Lett., 33, L20810, https://doi.org/10.1029/2006GL027744, 2006. a
Finney, D. L., Doherty, R. M., Wild, O., Huntrieser, H., Pumphrey, H. C., and Blyth, A. M.: Using cloud ice flux to parametrise large-scale lightning, Atmos. Chem. Phys., 14, 12665–12682, https://doi.org/10.5194/acp-14-12665-2014, 2014. a, b
Flannigan, M. and Wotton, B.: Lightning-ignited forest fires in northwestern Ontario, Can. J. Forest Res., 21, 277–287, 1991. a
Fuquay, D. M.: A model for predicting lightning fire ignition in wildland fuels, vol. 217, Intermountain Forest and Range Experiment Station, Forest Service, US, 1979. a
Fuquay, D. M., Baughman, R., Taylor, A., and Hawe, R.: Characteristics of seven lightning discharges that caused forest fires, J. Geophys. Res., 72, 6371–6373, 1967. a, b, c, d, e
Ganteaume, A., Camia, A., Jappiot, M., San-Miguel-Ayanz, J., Long-Fournel, M., and Lampin, C.: A review of the main driving factors of forest fire ignition over Europe, Environ. Manage., 51, 651–662, 2013. a
García-Ortega, E., Trobajo, M. T., López, L., and Sánchez, J. L.: Synoptic patterns associated with wildfires caused by lightning in Castile and Leon, Spain, Nat. Hazards Earth Syst. Sci., 11, 851–863, https://doi.org/10.5194/nhess-11-851-2011, 2011. a
Gora, E. M., Bitzer, P. M., Burchfield, J. C., Schnitzer, S. A., and Yanoviak, S. P.: Effects of lightning on trees: A predictive model based on in situ electrical resistivity, Ecol. Evol., 7, 8523–8534, 2017. a
Gordillo-Vázquez, F. J., Pérez-Invernón, F. J., Huntrieser, H., and Smith, A. K.: Comparison of Six Lightning Parameterizations in CAM5 and the Impact on Global Atmospheric Chemistry, Earth Space Sci., 6, 2317–2346, https://doi.org/10.1029/2019EA000873, 2019. a
Granström, A.: Fire management for biodiversity in the European boreal forest, Scand. J. Forest Res., 16, 62–69, 2001. a
Granström, A. and Niklasson, M.: Potentials and limitations for human control over historic fire regimes in the boreal forest, Philos. T. R. Soc. B, 363, 2351–2356, 2008. a
Grewe, V., Brunner, D., Dameris, M., Grenfell, J., Hein, R., Shindell, D., and Staehelin, J.: Origin and variability of upper tropospheric nitrogen oxides and ozone at northern mid-latitudes, Atmos. Environ., 35, 3421–3433, 2001. a
Gutiérrez Núñez, J. M., Guerrero Peralta, I., and Momblona, D.: Radar meteorológico y red de rayos, https://doi.org/10.31978/014-18-009-X.08, 2018. a, b
Hall, B. L.: Precipitation associated with lightning-ignited wildfires in Arizona and New Mexico, Int. J. Wildland Fire, 16, 242–254, 2007. a, b, c
Hall, B. L. and Brown, T. J.: Climatology of positive polarity flashes and multiplicity and their relation to natural wildfire ignitions, in: Preprints, International Lightning Detection Conference, Tucson, Arizona, USA, 24–25 April 2006. a
Hardy, C. C., Bunnell, D. L., Menakis, J., Schmidt, K., Long, D., Simmerman, D., and Johnston, C.: Coarse-scale spatial data for wildland fire and fuel management, USDA Forest Service, Rocky Mountain Research Station, Fire Sciences Laboratory, Missoula, Montana, USA, 1999. a
Hersbach, H., Bell, B., Berrisford, P., Biavati, G., Horányi, A., Muñoz Sabater, J., Nicolas, J., Peubey, C., Radu, R., Rozum, I., Schepers, D., Simmons, A., Soci, C., Dee, D., and Thépaut, J.-N.: ERA5 hourly data on pressure levels from 1979 to present, Copernicus Climate Change Service (C3S) Climate Data Store (CDS) [data set], https://doi.org/10.24381/cds.bd0915c6, 2018a. a
Hersbach, H., Bell, B., Berrisford, P., Biavati, G., Horányi, A., Muñoz Sabater, J., Nicolas, J., Peubey, C., Radu, R., Rozum, I., Schepers, D., Simmons, A., Soci, C., Dee, D., and Thépaut, J.-N.: ERA5 hourly data on single levels from 1979 to present, Copernicus Climate Change Service (C3S) Climate Data Store (CDS) [data set], https://doi.org/10.24381/cds.adbb2d47, 2018b. a
Hersbach, H., Bell, B., Berrisford, P., Hirahara, S., Horányi, A., Muñoz-Sabater, J., Nicolas, J., Peubey, C., Radu, R., Schepers, D., Simmons, A., Soci, C., Abdalla, S., Abellan, X., Balsamo, G., Bechtold, P., Biavati, G., Bidlot, J., Bonavita, M., De Chiara, G., Dahlgren, P., Dee, D., Diamantakis, M., Dragani, R., Flemming, J., Forbes, R., Fuentes, M., Geer, A., Haimberger, L., Healy, S., Hogan, R. J., Hólm, E., Janisková, M., Keeley, S., Laloyaux, P., Lopez, P., Lupu, C., Radnoti, G., de Rosnay, P., Rozum, I., Vamborg, F., Villaume, S., and Thépaut, J.-N.: The ERA5 global reanalysis, Q. J. Roy. Meteor. Soc., 146, 1999–2049, 2020. a
Holzworth, R., McCarthy, M., Brundell, J., Jacobson, A., and Rodger, C.: Global distribution of superbolts, J. Geophys. Res.-Atmos., 124, 9996–10005, 2019. a, b
Huntrieser, H., Lichtenstern, M., Scheibe, M., Aufmhoff, H., Schlager, H., Pucik, T., Minikin, A., Weinzierl, B., Heimerl, K., Pollack, I. B., Peischl, J., Ryerson, T. B., Weinheimer, A. J., Honomichl, S., Ridley, B. A., Biggerstaff, M. I., Betten, D. P., Hair, J. W., Butler, C. F., Schwartz, M. J., and Barth, M. C.: Injection of lightning-produced NOx, water vapor, wildfire emissions, and stratospheric air to the UT/LS as observed from DC3 measurements, J. Geophys. Res.-Atmos., 121, 6638–6668, 2016. a
Hutchins, M., Holzworth, R., Brundell, J., and Rodger, C.: Relative detection efficiency of the world wide lightning location network, Radio Sci., 47, 1–9, 2012a. a
Hutchins, M. L., Holzworth, R. H., Rodger, C. J., and Brundell, J. B.: Far-field power of lightning strokes as measured by the World Wide Lightning Location Network, J. Atmos. Ocean. Tech., 29, 1102–1110, 2012b. a
Hutchins, M. L., Holzworth, R. H., and Brundell, J. B.: Diurnal variation of the global electric circuit from clustered thunderstorms, J. Geophys. Res.-Space, 119, 620–629, 2014. a, b, c
Instituto da Conservação da Natureza e das Florestas (ICNF): Incêndios Rurais, ICNF [data set], available at: http://www2.icnf.pt/portal/florestas/dfci/inc, last access: 12 February 2021. a
Kochtubajda, B., Flannigan, M., Gyakum, J., Stewart, R., Logan, K., and Nguyen, T.-V.: Lightning and fires in the Northwest Territories and responses to future climate change, Arctic, 59, 211–221, 2006. a
Komarek, E.: The natural history of lightning, in: Proceedings of the Tall Timbers fire ecology conference, Tallahassee, Florida, 9–10 April 1964, vol. 3, 139–183, 1964. a
Koutsias, N., Xanthopoulos, G., Founda, D., Xystrakis, F., Nioti, F., Pleniou, M., Mallinis, G., and Arianoutsou, M.: On the relationships between forest fires and weather conditions in Greece from long-term national observations (1894–2010), Int. J. Wildland Fire, 22, 493–507, 2013. a, b
Krause, A., Kloster, S., Wilkenskjeld, S., and Paeth, H.: The sensitivity of global wildfires to simulated past, present, and future lightning frequency, J. Geophys. Res.-Biogeo., 119, 312–322, 2014. a, b
Krawchuk, M., Cumming, S., Flannigan, M. D., and Wein, R.: Biotic and abiotic regulation of lightning fire initiation in the mixedwood boreal forest, Ecology, 87, 458–468, 2006. a
Kruskal, W. H. and Wallis, W. A.: Use of ranks in one-criterion variance analysis, J. Am. Stat. Assoc., 47, 583–621, 1952. a
Lang, T. J. and Rutledge, S. A.: Cloud-to-ground lightning downwind of the 2002 Hayman forest fire in Colorado, Geophys. Res. Lett., 33, L03804, https://doi.org/10.1029/2005GL024608, 2006. a
Lang, T. J., Rutledge, S. A., Dolan, B., Krehbiel, P., Rison, W., and Lindsey, D. T.: Lightning in wildfire smoke plumes observed in Colorado during summer 2012, Mon. Weather Rev., 142, 489–507, 2014. a
Lapierre, J. L., Laughner, J. L., Geddes, J. A., Koshak, W. J., Cohen, R. C., and Pusede, S. E.: Observing US regional variability in lightning NO2 production rates, J. Geophys. Res.-Atmos., 125, e2019JD031362, 2020. a
Larjavaara, M., Kuuluvainen, T., and Rita, H.: Spatial distribution of lightning-ignited forest fires in Finland, Forest Ecol. Manag., 208, 177–188, 2005a. a
Larjavaara, M., Pennanen, J., and Tuomi, T.: Lightning that ignites forest fires in Finland, Agr. Forest Meteorol., 132, 171–180, 2005b. a, b, c
Latham, D. and Williams, E.: Lightning and forest fires, in: Forest Fires, Elsevier, San Diego, https://doi.org/10.1016/B978-012386660-8/50013-1, 375–418, 2001. a, b
Latham, D. J. and Schlieter, J. A.: Ignition probabilities of wildland fuels based on simulated lightning discharges, vol. 411, US Department of Agriculture, Forest Service, Intermountain Research Station, Missoula, 1989. a
Liu, C. and Heckman, S.: The application of total lightning detection and cell tracking for severe weather prediction, in: 91st American Meteorological Society Annual Meeting, Seattle, WA, 23–27 January 2011, 1–10, 2011. a
López-Santalla, A. and López-Garcia, M.: Los Incendios Forestales en España. Decenio 2006–2015, Madrid, 003-19-031-5, 2019. a
Lynn, B. H., Yair, Y., Price, C., Kelman, G., and Clark, A. J.: Predicting Cloud-to-Ground and Intracloud Lightning in Weather Forecast Models, Weather Forecast., 27, 1470–1488, https://doi.org/10.1175/WAF-D-11-00144.1, 2012. a
Lyons, W. A., Nelson, T. E., Williams, E. R., Cramer, J. A., and Turner, T. R.: Enhanced Positive Cloud-to-Ground Lightning in Thunderstorms Ingesting Smoke from Fires, Science, 282, 77, https://doi.org/10.1126/science.282.5386.77, 1998. a
Mach, D. M., Christian, H. J., Blakeslee, R. J., Boccippio, D. J., Goodman, S. J., and Boeck, W. L.: Performance assessment of the optical transient detector and lightning imaging sensor, J. Geophys. Res.-Atmos., 112, D09210, https://doi.org/10.1029/2006JD007787, 2007. a, b, c
Mallick, S., Rakov, V., Hill, J., Ngin, T., Gamerota, W., Pilkey, J., Jordan, D., Uman, M., Heckman, S., Sloop, C. D., and Liu, C.: Performance characteristics of the ENTLN evaluated using rocket-triggered lightning data, Electr. Pow. Syst. Res., 118, 15–28, 2015. a
McEachron, K. and Hagenguth, J.: Effect of lightning on thin metal surfaces, IEEE T. Commun., 61, 559–564, 1942. a
Moris, J. V., Conedera, M., Nisi, L., Bernardi, M., Cesti, G., and Pezzatti, G. B.: Lightning-caused fires in the Alps: Identifying the igniting strokes, Agr. Forest Meteorol., 290, 107990, 2020. a, b
Müller, M. M., Vacik, H., Diendorfer, G., Arpaci, A., Formayer, H., and Gossow, H.: Analysis of lightning-induced forest fires in Austria, Theor. Appl. Climatol., 111, 183–193, 2013. a
Muñoz Sabater, J.: ERA5-Land hourly data from 1981 to present, Copernicus Climate Change Service (C3S) Climate Data Store (CDS) [data set], https://doi.org/10.24381/cds.e2161bac, 2019. a
Muñoz Sabater, J.: ERA5-Land hourly data from 1950 to 1980, Copernicus Climate Change Service (C3S) Climate Data Store (CDS) [data set], https://doi.org/10.24381/cds.e2161bac, 2021. a
Murray, L. T., Jacob, D. J., Logan, J. A., Hudman, R. C., and Koshak, W. J.: Optimized regional and interannual variability of lightning in a global chemical transport model constrained by LIS/OTD satellite data, J. Geophys. Res.-Atmos., 117, D20307, https://doi.org/10.1029/2012JD017934, 2012. a
Nauslar, N. J.: A forecast procedure for dry thunderstorms, Order No. 1484044, ProQuest Dissertations & Theses Global, 839910451, available at: https://www.proquest.com/dissertations-theses/forecast-procedure-dry-thunderstorms/docview/839910451/se-2?accountid=10336 (last access: 12 February 2021), 2010. a, b, c, d, e, f, g, h
Oliveira, S., Oehler, F., San-Miguel-Ayanz, J., Camia, A., and Pereira, J. M.: Modeling spatial patterns of fire occurrence in Mediterranean Europe using Multiple Regression and Random Forest, Forest Ecol. Manag., 275, 117–129, 2012. a
Picard, A., Davis, R., Gläser, M., and Fujii, K.: Revised formula for the density of moist air (CIPM-2007), Metrologia, 45, 149, 2008. a, b
Pineda, N. and Rigo, T.: The rainfall factor in lightning-ignited wildfires in Catalonia, Agr. Forest Meteorol., 239, 249–263, 2017. a, b, c, d, e, f, g, h
Pineda, N., Montanyà, J., and Van der Velde, O. A.: Characteristics of lightning related to wildfire ignitions in Catalonia, Atmos. Res., 135, 380–387, 2014. a, b
Poli, P., Hersbach, H., Dee, D. P., Berrisford, P., Simmons, A. J., Vitart, F., Laloyaux, P., Tan, D. G., Peubey, C., Thépaut, J.-N., Trémolet, Y., Hólm, E. V., Bonavita, M., Isaksen, L., and Fisher, M.: ERA-20C: An atmospheric reanalysis of the twentieth century, J. Climate, 29, 4083–4097, 2016. a
Price, C. and Rind, D.: A simple lightning parameterization for calculating global lightning distributions, J. Geophys. Res.-Atmos., 97, 9919–9933, 1992. a, b
Pyne, S. J., Andrews, P. L., Laven, R. D., and Cheney, N.: Introduction to wildland fire, Forestry, 71, 82–82, 1998. a
Rakov, V. A. and Uman, M. A.: Lightning Physics and Effects, Cambridge University Press, Cambridge, 2003. a, b
Reineking, B., Weibel, P., Conedera, M., and Bugmann, H.: Environmental determinants of lightning-v. human-induced forest fire ignitions differ in a temperate mountain region of Switzerland, Int. J. Wildland Fire, 19, 541–557, 2010. a
Rodger, C. J., Brundell, J. B., and Dowden, R. L.: Location accuracy of VLF World-Wide Lightning Location (WWLL) network: Post-algorithm upgrade, Ann. Geophys., 23, 277–290, https://doi.org/10.5194/angeo-23-277-2005, 2005. a
Rolstad, J., Blanck, Y.-l., and Storaunet, K. O.: Fire history in a western Fennoscandian boreal forest as influenced by human land use and climate, Ecol Monogr., 87, 219–245, 2017. a
Rorig, M. L., McKay, S. J., Ferguson, S. A., and Werth, P.: Model-generated predictions of dry thunderstorm potential, J. Appl. Meteorol. Clim., 46, 605–614, 2007. a, b, c, d, e
Rosenfeld, D., Fromm, M., Trentmann, J., Luderer, G., Andreae, M. O., and Servranckx, R.: The Chisholm firestorm: observed microstructure, precipitation and lightning activity of a pyro-cumulonimbus, Atmos. Chem. Phys., 7, 645–659, https://doi.org/10.5194/acp-7-645-2007, 2007. a
Rossow, W. B.: International Satellite Cloud Climatology Project (ISCCP) documentation of new cloud datasets, WMO/TD737, World Climate Research Programme (ICSU and WMO), World Climate Research Programme, Geneva, Switzerland, 115, 1996. a
Rudlosky, S. D. and Shea, D. T.: Evaluating WWLLN performance relative to TRMM/LIS, Geophys. Res. Lett., 40, 2344–2348, 2013. a, b
Said, R. K., Cohen, M. B., and Inan, U. S.: Highly intense lightning over the oceans: Estimated peak currents from global GLD360 observations, J. Geophys. Res.-Atmos., 118, 6905–6915, 2013. a
San José, R., Pérez, J. L., González, R. M., Pecci, J., and Palacios, M.: Analysis of fire behaviour simulations over Spain with WRF-FIRE, Int. J. Environ. Pollut., 55, 148–156, 2014. a
San-Miguel-Ayanz, J., Moreno, J. M., and Camia, A.: Analysis of large fires in European Mediterranean landscapes: lessons learned and perspectives, Forest Ecol. Manag., 294, 11–22, 2013. a
Schmetz, J., Pili, P., Tjemkes, S., Just, D., Kerkmann, J., Rota, S., and Ratier, A.: An introduction to Meteosat second generation (MSG), B. Am. Meteorol. Soc., 83, 977–992, 2002. a, b, c
Schultz, C. J., Nauslar, N. J., Wachter, J. B., Hain, C. R., and Bell, J. R.: Spatial, Temporal and Electrical Characteristics of Lightning in Reported Lightning-Initiated Wildfire Events, Fire, 2, 18, 2019. a, b
Schultz, M. G., Heil, A., Hoelzemann, J. J., Spessa, A., Thonicke, K., Goldammer, J. G., Held, A. C., Pereira, J. M., and van Het Bolscher, M.: Global wildland fire emissions from 1960 to 2000, Global Biogeochem. Cy., 22, GB2002, https://doi.org/10.1029/2007GB003031, 2008. a
Schumann, U. and Huntrieser, H.: The global lightning-induced nitrogen oxides source, Atmos. Chem. Phys., 7, 3823–3907, https://doi.org/10.5194/acp-7-3823-2007, 2007. a
Soriano, L. R., De Pablo, F., and Díez, E. G.: Relationship between convective precipitation and cloud-to-ground lightning in the Iberian Peninsula, Mon. Weather Rev., 129, 2998–3003, 2001. a
Stocks, B. J., Mason, J. A., Todd, J. B., Bosch, E. M., Wotton, B. M., Amiro, B. D., Flannigan, M. D., Hirsch, K. G., Logan, K. A., Martell, D. L., and Skinner, W. R.: Large forest fires in Canada, 1959–1997, J. Geophys. Res.-Atmos., 107, FFR-5, 2002. a
Stuhlmann, R., Rodriguez, A., Tjemkes, S., Grandell, J., Arriaga, A., Bézy, J.-L., Aminou, D., and Bensi, P.: Plans for EUMETSAT's Third Generation Meteosat geostationary satellite programme, Adv. Space Res., 36, 975–981, 2005. a
Takahashi, T.: Riming electrification as a charge generation mechanism in thunderstorms, J. Atmos. Sci., 35, 1536–1548, 1978. a
Tao, W.-K., Chen, J.-P., Li, Z., Wang, C., and Zhang, C.: Impact of aerosols on convective clouds and precipitation, Rev. Geophys., 50, RG2001, https://doi.org/10.1029/2011RG000369, 2012. a
Tost, H., Jöckel, P., and Lelieveld, J.: Lightning and convection parameterisations – uncertainties in global modelling, Atmos. Chem. Phys., 7, 4553–4568, https://doi.org/10.5194/acp-7-4553-2007, 2007. a
van der Werf, G. R., Randerson, J. T., Giglio, L., Collatz, G. J., Mu, M., Kasibhatla, P. S., Morton, D. C., DeFries, R. S., Jin, Y., and van Leeuwen, T. T.: Global fire emissions and the contribution of deforestation, savanna, forest, agricultural, and peat fires (1997–2009), Atmos. Chem. Phys., 10, 11707–11735, https://doi.org/10.5194/acp-10-11707-2010, 2010. a
van der Werf, G. R., Randerson, J. T., Giglio, L., van Leeuwen, T. T., Chen, Y., Rogers, B. M., Mu, M., van Marle, M. J. E., Morton, D. C., Collatz, G. J., Yokelson, R. J., and Kasibhatla, P. S.: Global fire emissions estimates during 1997–2016, Earth Syst. Sci. Data, 9, 697–720, https://doi.org/10.5194/essd-9-697-2017, 2017. a
Vázquez, A. and Moreno, J. M.: Patterns of lightning-, and people-caused fires in peninsular Spain, Int. J. Wildland Fire, 8, 103–115, 1998. a, b
Veraverbeke, S., Rogers, B. M., Goulden, M. L., Jandt, R. R., Miller, C. E., Wiggins, E. B., and Randerson, J. T.: Lightning as a major driver of recent large fire years in North American boreal forests, Nat. Clim. Change, 7, 529, 2017. a
Wallmann, J.: A procedure for forecasting dry thunderstorms in the Great Basin using the dynamic tropopause and alternate tools for assessing instability, NOAA/NWS WR Tech. Attach, Reno, NV, 04–08, 2004. a, b
World Wide Lightning Location Network (WWLLN): Homepage, available at: http://wwlln.net/, last access: 12 February 2021. a
Wotton, B. and Martell, D. L.: A lightning fire occurrence model for Ontario, Can. J. Forest Res., 35, 1389–1401, 2005. a
Yair, Y., Lynn, B., Price, C., Kotroni, V., Lagouvardos, K., Morin, E., Mugnai, A., and Llasat, M. d. C.: Predicting the potential for lightning activity in Mediterranean storms based on the Weather Research and Forecasting (WRF) model dynamic and microphysical fields, J. Geophys. Res., 115, D04205, https://doi.org/10.1029/2008JD010868, 2010. a
Zhu, Y., Rakov, V. A., Tran, M. D., Stock, M. G., Heckman, S., Liu, C., Sloop, C. D., Jordan, D. M., Uman, M. A., Caicedo, J. A., Kotovsky, D. A., Wilkes, R. A., Carvalho, F. L., Ngin, T., Gamerota, W. R., Pilkey, J. T., and Hare, B. M.: Evaluation of ENTLN performance characteristics based on the ground truth natural and rocket-triggered lightning data acquired in Florida, J. Geophys. Res.-Atmos., 122, 9858–9866, 2017. a