the Creative Commons Attribution 4.0 License.
the Creative Commons Attribution 4.0 License.
 | 12 Mar 2020
A predictive group-contribution model for the viscosity of aqueous organic aerosol
Natalie R. Gervasi
David O. Topping
The viscosity of primary and secondary organic aerosol (SOA) has important implications for the processing of aqueous organic aerosol phases in the atmosphere, their involvement in climate forcing, and transboundary pollution. Here we introduce a new thermodynamics-based group-contribution model, which is capable of accurately predicting the dynamic viscosity of a mixture over several orders of magnitude ( to >1012 Pa s) as a function of temperature and mixture composition, accounting for the effect of relative humidity on aerosol water content. The mixture viscosity modelling framework builds on the thermodynamic activity coefficient model AIOMFAC (Aerosol Inorganic–Organic Mixtures Functional groups Activity Coefficients) for predictions of liquid mixture non-ideality, including liquid–liquid phase separation, and the calorimetric glass transition temperature model by DeRieux et al. (2018) for pure-component viscosity values of organic components. Comparing this new model with simplified modelling approaches reveals that the group-contribution method is the most accurate in predicting mixture viscosity, although accurate pure-component viscosity predictions (and associated experimental data) are key and one of the main sources of uncertainties in current models, including the model presented here. Nonetheless, we find excellent agreement between the viscosity predictions and measurements for systems in which mixture constituents have a molar mass below 350 g mol−1. As such, we demonstrate the validity of the model in quantifying mixture viscosity for aqueous binary mixtures (glycerol, citric acid, sucrose, and trehalose), aqueous multicomponent mixtures (citric acid plus sucrose and a mixture of nine dicarboxylic acids), and aqueous SOA surrogate mixtures derived from the oxidation of α-pinene, toluene, or isoprene. We also use the model to assess the expected change in SOA particle viscosity during idealized adiabatic air parcel transport from the surface to higher altitudes within the troposphere. This work demonstrates the capability and flexibility of our model in predicting the viscosity for organic mixtures of varying degrees of complexity and its applicability for modelling SOA viscosity over a wide range of temperatures and relative humidities.
- Article
(4127 KB) - Full-text XML
-
Supplement
(2208 KB) - BibTeX
- EndNote


Viscosity measurements of laboratory-made proxy aerosol particles were the first evidence suggesting that secondary organic aerosol (SOA) particles could exist in a highly viscous state (Zobrist et al., 2008; Murray, 2008). Shortly after, field measurements demonstrated that ambient SOA exhibits semi-solid or glassy behaviour in certain environments (Virtanen et al., 2010). In the decade since these discoveries, the implications of highly viscous aerosols (or organic-rich phases thereof) have been a focus of intense study. Viscosity can impact the chemical and physical properties of organic aerosol (OA) particles, prolonging their equilibration with the surrounding gas phase. As an example, the gas–particle partitioning of water (Bones et al., 2012; Berkemeier et al., 2014; Price et al., 2015), semi-volatile organics (Abramson et al., 2013; Marshall et al., 2016), and oxidizing compounds (Berkemeier et al., 2016) have been shown to be kinetically limited by slow diffusion in highly viscous or glassy particles. The slowed uptake of semi-volatile organics from the gas phase can retard SOA formation and growth. Conversely, the slow diffusion of these molecules out of the particle bulk can impede evaporation. Oxidation reactions within a particle or diffusion of reactants to the particle surface are also slowed, leading to the extended preservation of organic species within aerosol phases that would otherwise undergo photodegradation (Zelenyuk et al., 2017). Reduced evaporation and shielding from oxidation may increase the residence time of organic species, giving these particles and their constituents an advantage in undergoing long-range transport (Schum et al., 2018; Zhou et al., 2019) and, in turn, contributing to transboundary pollution (Shrivastava et al., 2017).
Oxidation or multiphase reactions in viscous SOA not only have implications for air quality but also for climate. Liu et al. (2018) demonstrated that the production of brown carbon aerosol can be viscosity limited. SOA that would normally undergo browning due to multiphase chemical reactions instead remains translucent due to slowed reaction kinetics. Their translucency causes them to preferentially scatter, rather than absorb, solar radiation. While the prevention of brown carbon by viscous organics has a direct influence on aerosol–radiation–climate effects, SOA phase state may in addition impact climate and weather indirectly via its potential role in ice nucleation. There is potential for extremely viscous, glassy SOA particles to act as ice nuclei and therefore play a role in ice cloud formation and related optical and lifetime properties of cold clouds (Berkemeier et al., 2014; Lienhard et al., 2015; Knopf et al., 2018; Fowler et al., 2020).
In order to fully understand the implications of viscous SOA, we must be able to quantify how frequently SOA precursors and atmospheric conditions, namely relative humidity (RH) and temperature, favour their formation. Semi-solid anhydrous SOA can be formed from biogenic precursors, like monoterpenes (Renbaum-Wolff et al., 2013; Grayson et al., 2016) and isoprene (Song et al., 2015) or from anthropogenic precursors, like polycyclic aromatic hydrocarbons (Zelenyuk et al., 2017). The type of precursor as well as the degree of oxidation governs the degree of functionalization of the resulting SOA species. The pure-component viscosity of an organic species is more sensitive to certain oxygen-bearing functional groups compared to others; although, oxygen-bearing functional group addition is directly proportional to viscosity (Rothfuss and Petters, 2017). Indeed, prolonged oxidation, leading to increased functionalization of precursor and derived hydrocarbons has been shown to increase SOA viscosity at low relative humidity (Saukko et al., 2012).
The hygroscopicity of the SOA mixture also dictates particle viscosity. For a given ambient relative humidity (of typically > 20 %), less hygroscopic SOA components will tend to form more viscous mixtures as compared to their more hygroscopic counterparts of similar molar mass due to the plasticizing effect of absorbed water under equilibrium conditions (Zobrist et al., 2008). Therefore, closely related to hygroscopicity in effect, relative humidity (or water activity in the particle) is a strong modulator of particle viscosity (Price et al., 2015; Ye et al., 2016). We can expect SOA particles of a given composition to have a higher viscosity under dry conditions, and it is possible for organics to undergo a moisture-driven glass transition at typical surface-level temperatures (Dette et al., 2014). More ubiquitous is temperature-driven vitrification, where a compound or mixture is cooled rapidly enough to avoid crystallization, and instead the motion of the molecules is slowed to such an extent that they cannot reach the most stable equilibrium positions (i.e. those at lattice positions of a crystal) on an experimental timescale.
Of course, the effects of temperature and relative humidity cannot be fully decoupled in the atmosphere. Close to the Earth's surface, highly viscous SOA is found in colder, dryer regions (Virtanen et al., 2010), whereas primarily liquid-like SOA dominates in warmer, humid locations (Bateman et al., 2016). The viscosity of SOA at higher tropospheric altitudes remains an open question due to the competing effects of decreasing temperature and increasing relative humidity (Knopf et al., 2018). Recently, a similar ambiguity was observed on a diurnal timescale at the surface in a mixed forest environment, where SOA particles were found to be more viscous during the night as compared to during the day, despite a lower daytime relative humidity. The observed diel cycle of viscosity appears to be dominated by chemical changes in submicron-sized SOA composition (Slade et al., 2019). Therefore, for an advanced assessment of the climate impact of aerosol viscosity, it is imperative that we understand the interplay of chemical composition, ambient temperature, and relative humidity in order to quantify the spatio-temporal range of aerosol viscosity in different geographic regions and vertical levels of the atmosphere.
To this end, several groups have developed novel techniques to measure both laboratory-made proxy particles and ambient SOA viscosity (see Reid et al., 2018, and references therein). Work has also been carried out on developing predictive tools to model SOA viscosity; although, a lack of experimental data to constrain the models, coupled with an incomplete characterization of SOA chemical composition, has made this work challenging. Most of the models developed so far have been trained and tested with simple organic mixtures in the liquid regime (where the dynamic viscosity ηmix<102 Pa s). These models vary in complexity; for example, Cao et al. (1993a) employ a group-contribution approach adopted from a statistical thermodynamics treatment (Cao et al., 1993b), while the work by Bosse (2005) outlines a simple mole-fraction-based mixing rule. Song et al. (2016c) demonstrated the validity of the Bosse (2005) mixing rule for binary aqueous mixtures with alcohol and di- or tricarboxylic acids up to a mixture viscosity of 104 Pa s. They also showed this simple model overestimated the viscosity of binary aqueous mono-, di-, and trisaccharide mixtures. Recently, Rovelli et al. (2019) compared the Bosse (2005) model with their own water-activity-dependent viscosity mixing rule. They show that the water-activity-dependent predictions outperformed the Bosse (2005) model for most of their ternary aqueous sucrose / citric acid and aqueous sucrose / NaNO3 mixtures up to ηmix∼106–107 Pa s. Shiraiwa et al. (2017) were the first to use a semi-empirical modelling approach to constrain the phase state of SOA based on estimations of the (calorimetric) glass transition temperature of SOA species. DeRieux et al. (2018) expanded on that approach, using glass transition temperature estimations, to predict the viscosity of α-pinene SOA, toluene SOA, isoprene SOA, and biomass burning particles.
In this study, we introduce our thermodynamics-based group-contribution approach developed to predict the viscosity of aqueous OA phases covering several orders of magnitude in viscosity ( to >1012 Pa s) as a function of organic mixture composition, temperature, and relative humidity. To this end, our mixing model is coupled with pure-component glass transition temperature estimations by the DeRieux et al. (2018) method. This new development aims for extending the predictability and accuracy beyond the range of existing approaches. The rest of this article is structured as follows: we begin by detailing the model framework and discussing model limitations, followed by comparing the performance of the model with simplified mixing rules. We then discuss the training of the model for a dozen binary aqueous organic mixtures followed by presenting the model's predictive ability for well-constrained multicomponent aqueous organic mixtures. Furthermore, model predictions of the RH-dependent mixture viscosities of α-pinene SOA, toluene SOA, and isoprene SOA are compared to viscosity measurements of laboratory-generated SOA. Finally, we discuss atmospheric implications of our model's predictions by exploring the mixture viscosity of the aforementioned SOA systems across the atmospherically relevant temperature and relative humidity space.
We have built a method to predict the viscosity of (aqueous) organic mixtures within the Aerosol Inorganic–Organic Mixtures Functional groups Activity Coefficients (AIOMFAC) model framework (Zuend et al., 2008, 2011); this new method is abbreviated as AIOMFAC-VISC. In general terms, our model combines temperature-dependent physicochemical pure-component properties of organic molecules and water with a non-linear mixing model for dynamic viscosity. Hence, the general approach is similar to predictions of the equilibrium vapour pressures of solution components, which also involves pure-component properties and mixing effects.
At the core of AIOMFAC-VISC are a set of equations relating the viscosity of a mixture to the structural features of chemical components, their relative abundance in a phase and to temperature. These equations are based on those from an existing group-contribution thermodynamics-based viscosity model called GC-UNIMOD (Cao et al., 1993a) but modified in several important ways. Within AIOMFAC-VISC, AIOMFAC supplies predictions of non-ideal thermodynamic mixing effects in a solution phase in the form of component activity coefficients, while two additional parameterizations are used for pure-component properties. First, the parameterization described by Dehaoui et al. (2015) is used to estimate the viscosity of water as a function of temperature. Second, the method introduced by DeRieux et al. (2018) is used to estimate the pure-component viscosity of individual organic molecules for a given temperature. In the following, we describe the combination of models and parameterizations that comprise the AIOMFAC-VISC method.
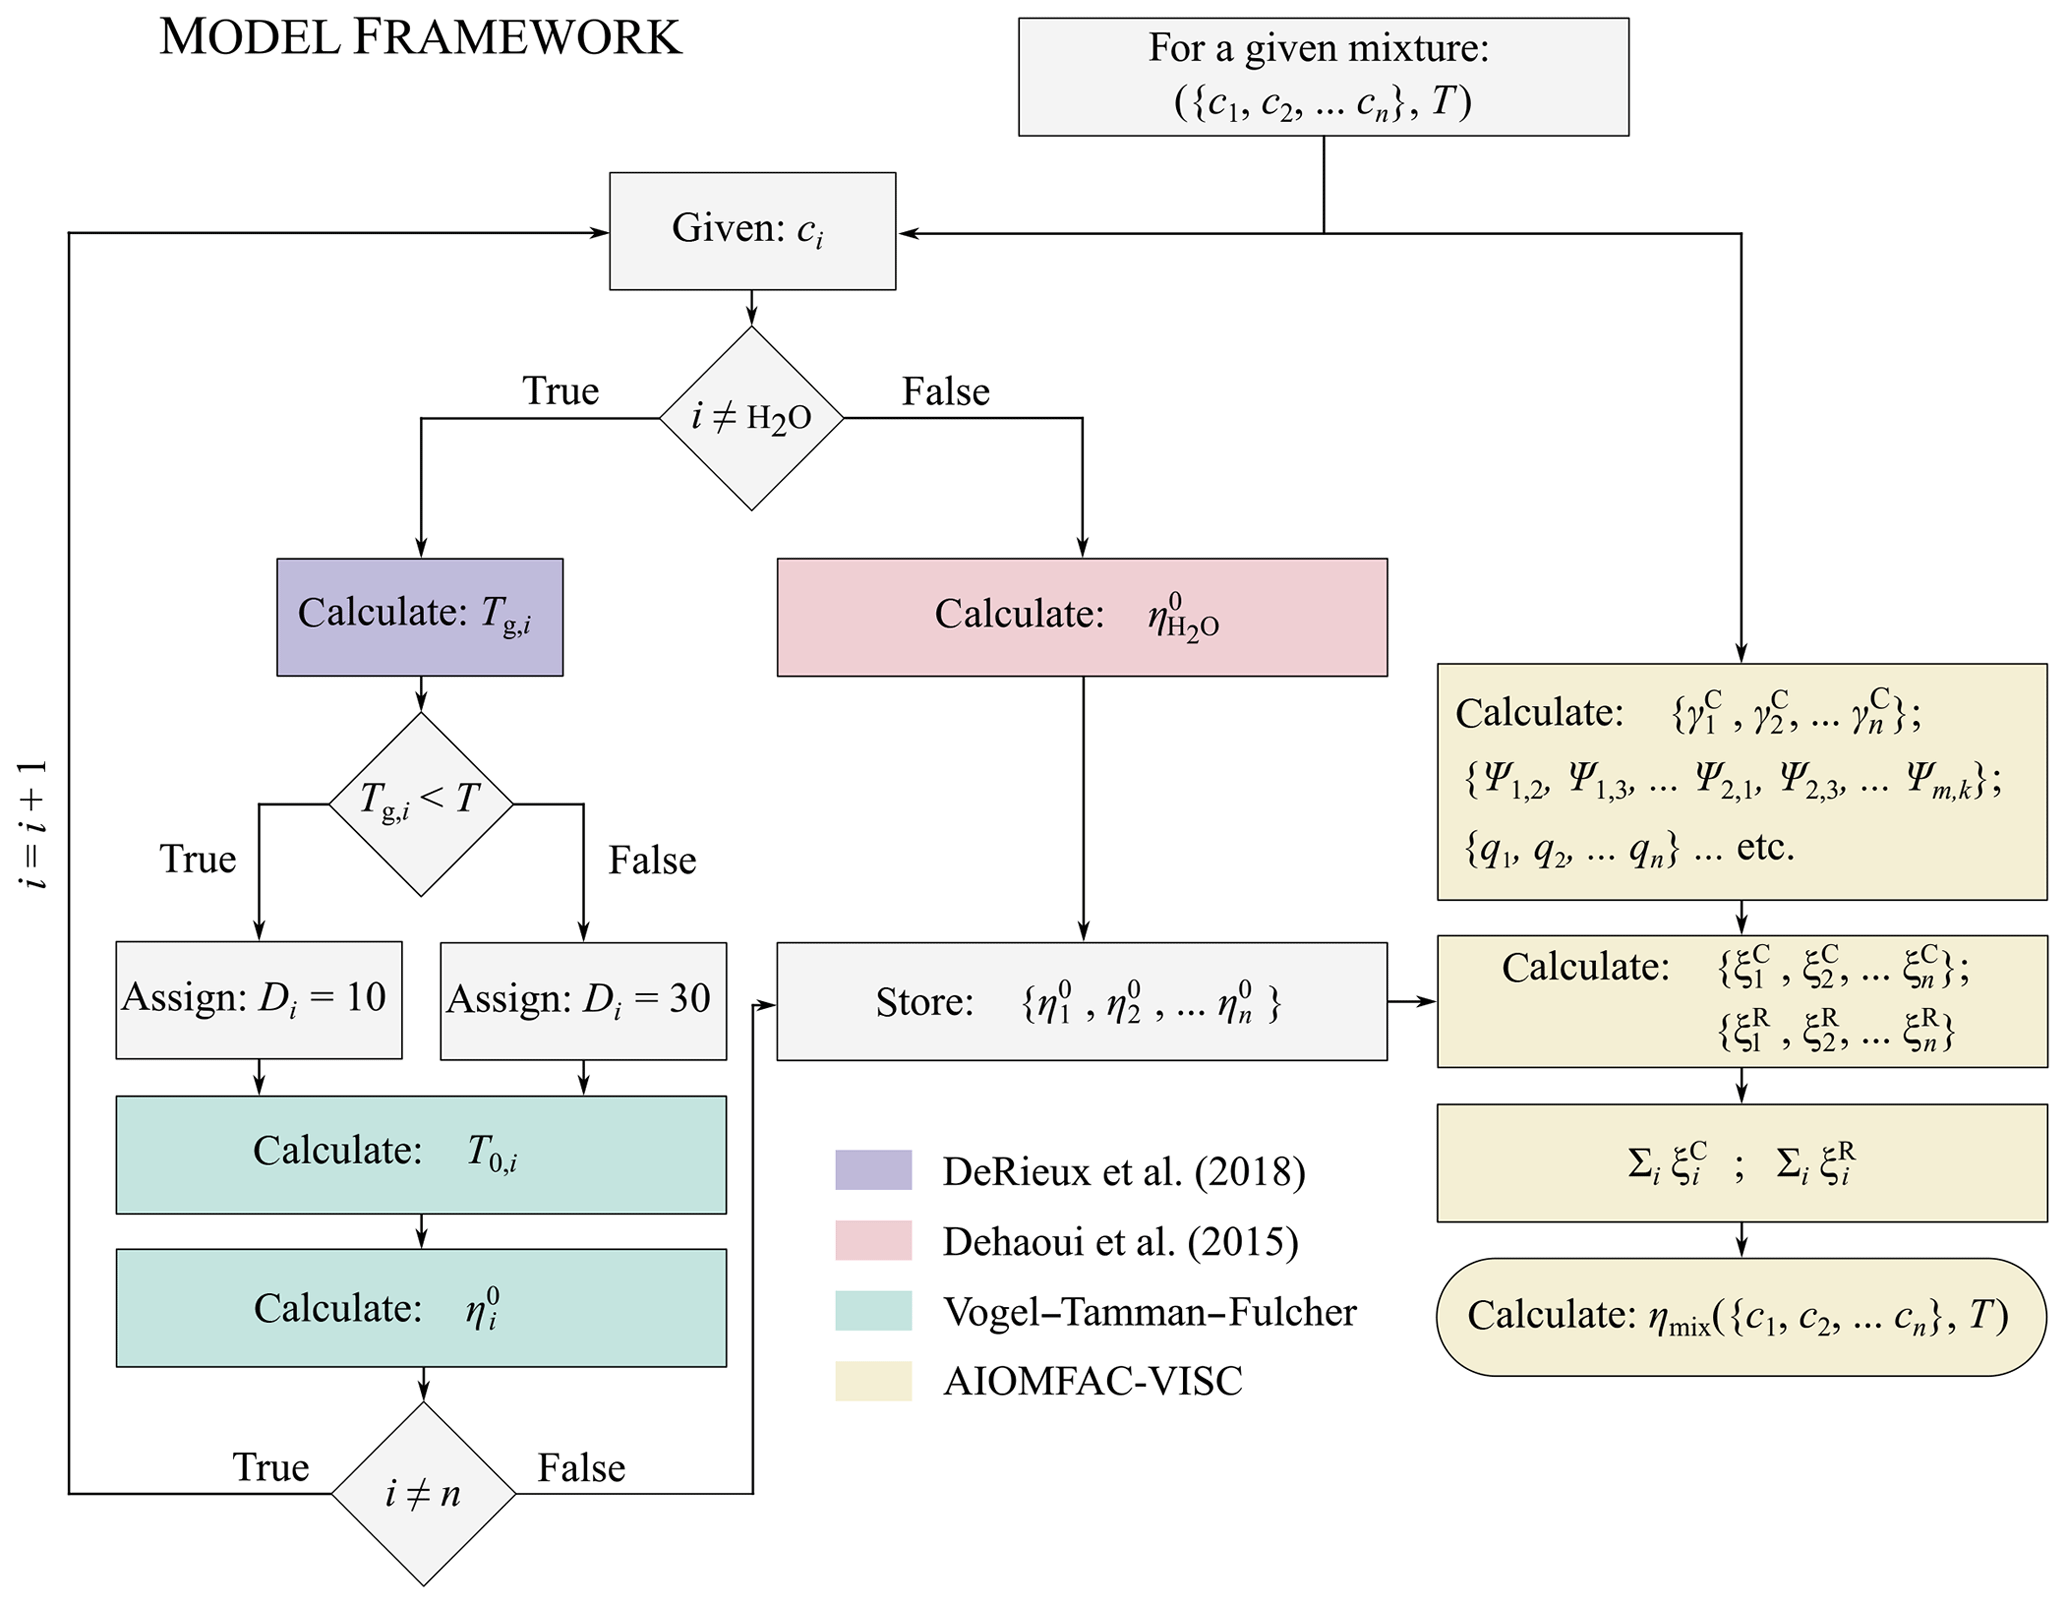
Figure 1A flow chart showing a simplified schematic of the AIOMFAC-VISC model framework. The colour shadings of the boxes denote the model or parameterization being used at a given point in the framework. Blue indicates the use of the DeRieux et al. (2018) model to predict the pure-component calorimetric glass transition temperature, green indicates the use of the modified Vogel–Tammann–Fulcher equation to predict the pure-component viscosity of the organic components, red indicates the use of the Dehaoui et al. (2015) parameterization to estimate the pure-component viscosity of water, and yellow indicates the use of AIOMFAC-VISC to calculate the mixture viscosity. The model components shown in blue, green, and red are interchangeable with other methods of calculating the pure-component viscosities. Should more accurate methods of predicting pure-component viscosity become available in the future, the AIOMFAC-VISC framework can be updated.
2.1 Mixture viscosity predictions
We have modified the semi-empirical viscosity equations of GC-UNIMOD to better represent atmospherically relevant organic mixtures. Following Cao et al. (1993a), the natural logarithm of the dynamic viscosity of a mixture, ηmix, is expressed in AIOMFAC-VISC as
Here, n is the number of individual mixture components (molecules), and and are the combinatorial and residual viscosity contributions of the ith molecule, respectively. The combinatorial contributions represent the geometric properties of each molecule in a simplified form, whereas the residual contributions account for the inter-molecular interactions, e.g. due to van der Waals forces. Specifically, and unlike the equation for in GC-UNIMOD, we introduce the combinatorial contribution of the ith molecule as the product of pure-component viscosity times combinatorial activity,
where is the combinatorial activity coefficient, xi is the molar fraction (with respect to the mixture of molecules), and is the temperature-dependent pure-component viscosity. The mole-fraction-based combinatorial activity () is routinely computed as part of the Universal quasi-chemical Functional group Activity Coefficients (UNIFAC) model (Fredenslund et al., 1975) equations within the AIOMFAC model. It can be considered an effective measure of composition – a modification of the mole fraction composition scale to account for differences in shapes and sizes of molecules, which is important when mixtures contain small molecules like water as well as significantly larger molecules like sucrose, raffinose, or various oligomers.
The residual contributions are written as
where is the residual viscosity of (sub)group k for component i (indicated by the superscript) in the mixture of components and with being the number of groups, k, within molecule i. is the group residual viscosity of group k for component i in the pure-component solution of the ith component, representing a reference value for each component. Both terms are expressed as
where for the ith molecule there exist functional subgroups k, while subgroup-index m covers here all subgroups from all molecules of the mixture (with the definition of a subgroup as in UNIFAC, AIOMFAC). Hence, in the reference value calculation for , index m covers all subgroups of that molecule (i). For subgroup k, Qk and Rk are its relative van der Waals surface area and volume parameters, respectively (Hansen et al., 1991). The parameter is computed as follows (Cao et al., 1993a):
where
Variables qi and ri are the molecule-specific relative surface area and volume parameters, respectively. The lattice coordination number, z, is set as a constant of value 10 (Zuend et al., 2008).
Next, we note that the local interaction composition of subgroups, Γm,k (Eq. 4), is described by the following set of expressions involving the fractional relative subgroup surface area Θm:
where
Here Ψm,k is a function of the AIOMFAC subgroup interaction parameter, am,k, and temperature, T; Xm in Eq. (7) is the molar fraction of subgroup m within the mixture of subgroups. For additional information regarding Θm and Ψm,k, we refer the reader to Zuend et al. (2008).
Finally, returning to Eq. (3), the volume fraction, Φi, which is here based on the relative van der Waals molecular volumes (Eq. 6), can be expressed as
We note that the residual contribution to viscosity, , is nearly identical to the formulation of GC-UNIMOD, except for the expression for ; our expression (Eq. 5) differs from its counterpart in GC-UNIMOD by a factor of −1 (both are semi-empirical expressions and not fundamentally derived from theory). Doing so allows for significantly better agreement between AIOMFAC-VISC and measurements of dynamic viscosity for binary aqueous mixtures (see the Supplement Sect. S5).
2.2 Pure-component viscosity predictions
2.2.1 Water
AIOMFAC-VISC requires knowledge of the pure-component dynamic viscosity (η0) of the individual mixture components. The pure-component viscosity is the viscosity of a given component in its pure liquid, semi-solid, or amorphous solid state as a function of temperature. Bulk measurements for a range of pure-component viscosity values (10−3–108 Pa s) can be made using conventional equipment, like a viscometer or rheometer at temperatures typically between −40 and 200 ∘C (Reid et al., 2018). With a sufficient number of measurements, the pure-component viscosity can be described empirically or semi-empirically for the temperature range over which the measurements were made.
For example, in this work we estimate the pure-component viscosity of water using the semi-empirical power law parameterization given by Dehaoui et al. (2015):
where is the pure-component viscosity of water, T is the temperature in kelvin (K), and A and B are constants with values of (1.3788±0.0026) and 1.6438±0.0052, respectively. Ts is theorized to be the mode-coupling temperature of water with a value of 225.66±0.18 K. The Dehaoui et al. (2015) parameterization is supported by experimental data over the temperature range ∼230–400 K (and likely reasonable to lower T), covering most of the atmospherically relevant temperature range (see Fig. S1 in the Supplement).
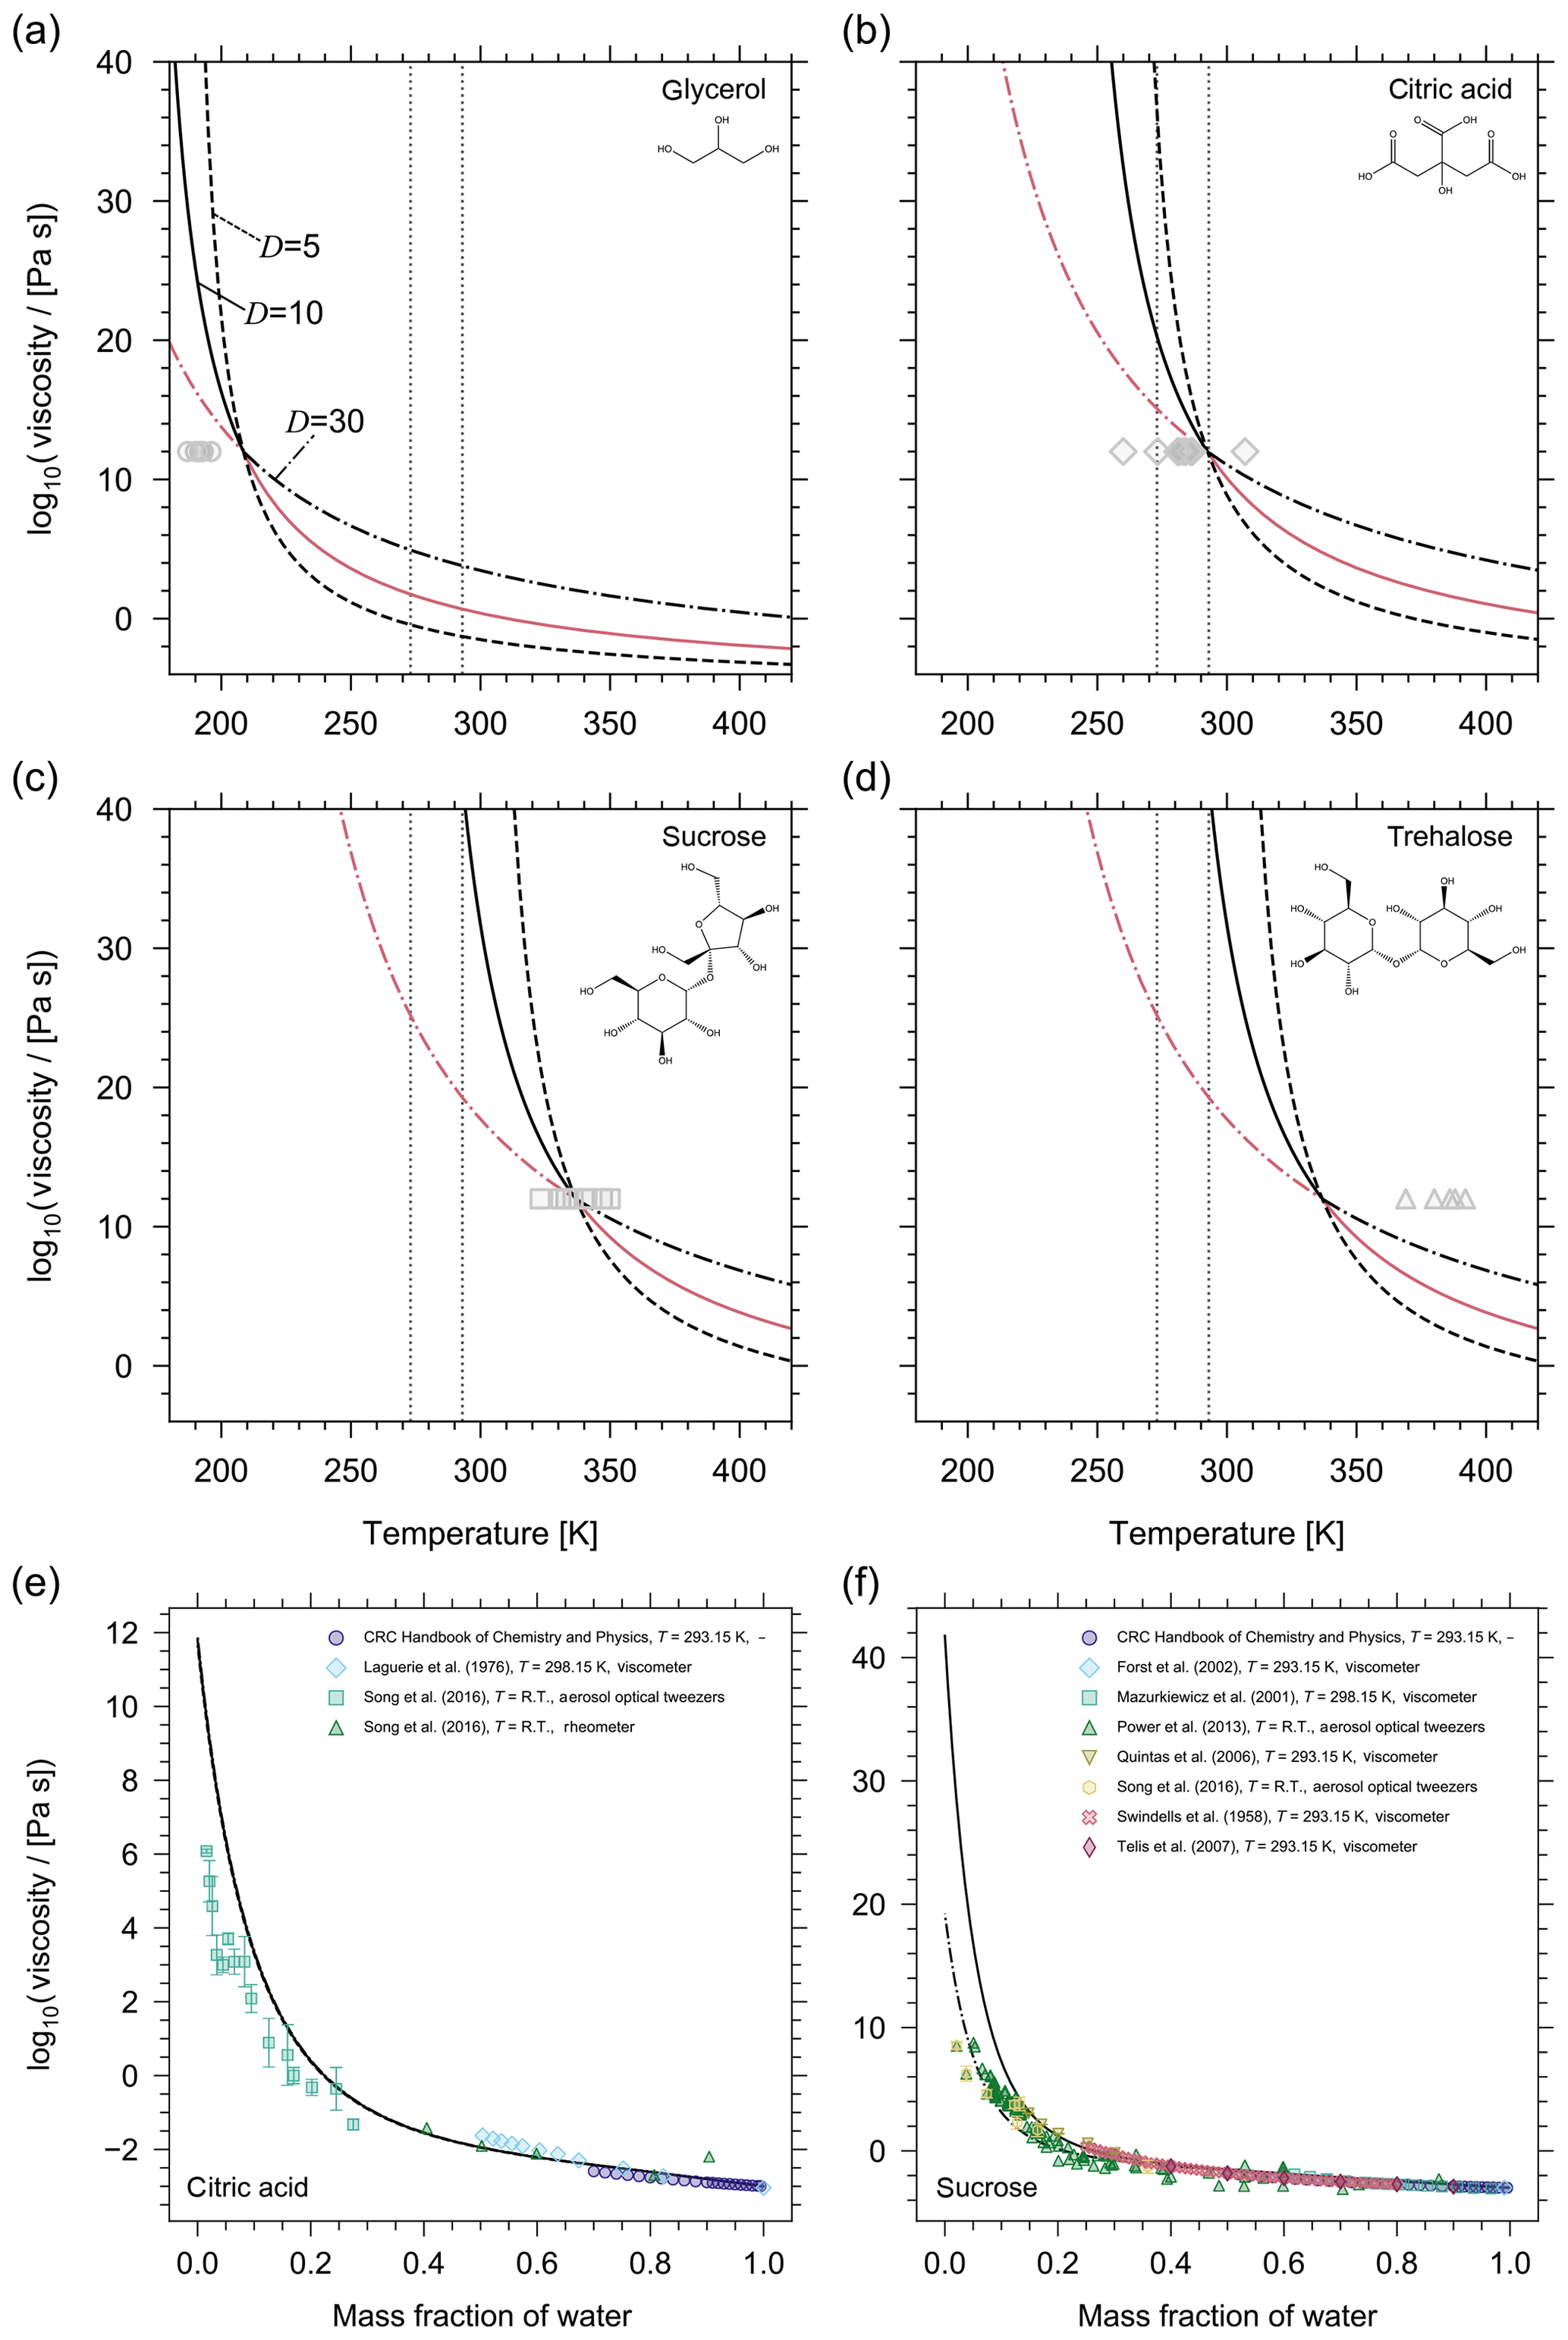
Figure 2Prediction of the pure-component viscosity (η0) as a function of temperature using the method by DeRieux et al. (2018) for (a) glycerol, (b) citric acid, (c) sucrose, and (d) trehalose. The three curves in each panel show the effect of different fragility parameters on the pure-component viscosity prediction (solid, D=10; dashed, D=5; dash-dotted, D=30). The pink lines illustrate which fragility parameter the model uses as a function of temperature; i.e. when T>Tg then D=10 and when T<Tg then D=30. The grey symbols are reference values of Tg (either measured or parameterized) where horizontal error bars have been omitted for clarity (additional information and the sources of the Tg values can be found in Table S1). The reference values of Tg have been plotted using the convention that η0(Tg)=1012 Pa s. The vertical grey dotted lines denote 0 ∘C and 22 ∘C. (e, f) Mixture viscosity predictions from AIOMFAC-VISC for (e) citric acid and (f) sucrose are shown for different fragility parameters where the curve line styles follow the same convention as in (a–d). For citric acid, the model results with D=5, D=10, and D=30 are nearly identical, so the curves are indistinguishable. For sucrose, D=10 (solid) and D=30 (dash-dotted) are shown. For a detailed discussion of the AIOMFAC-VISC results, see Fig. 5 and Sect. 3.2.
2.2.2 Organic compounds
It should be noted that AIOMFAC-VISC typically does not consider the crystallization of organic compounds; rather, the model assumes that all components remain amorphous over the entire temperature and relative humidity space. In practice, this is a reasonable assumption because crystallization in complex SOA mixtures is likely suppressed owing to the variety of compounds that comprise the SOA phase. As a result, this assumption necessitates supplying AIOMFAC-VISC with the pure-component viscosity for all individual components.
Given the abundance of experimental data and the quality of the Dehaoui et al. (2015) power-law fit, we have a high degree of confidence in the predicted temperature-dependent pure-component viscosity of water for a range of atmospherically relevant temperatures. However, the estimate of the temperature-dependent pure-component viscosity for organic components is a significantly more nuanced problem. First, for most atmospherically relevant organics there are no measurements of their pure-component viscosity. Often the lack of data is a result of the organics having ultra-high pure-component viscosities (>108 Pa s) near room temperature, making their measurement experimentally inaccessible. For those organics whose pure-component viscosities have been measured, the experiments are typically performed at room temperature (∼20–25 ∘C), which limits our ability to determine the temperature dependence and to parameterize the functional form to lower temperatures. Therefore, the lack of available data precludes our use of empirically determined pure-component viscosity values.
The scarcity of high-viscosity experimental data motivated us to instead use the group-contribution model developed by Nannoolal et al. (2009) for the prediction of the pure-component viscosity values. However, the Nannoolal et al. (2009) model was developed and validated only for predicting liquid-like viscosities much less than 1 Pa s, and therefore it is not reliable for predicting viscosity in the semi-solid and glassy regime for the compounds we are interested in. Sastri and Rao (1992) have developed a group-contribution model for pure-component viscosity based on a relationship of viscosity with pure-component vapour pressure; however, this model was also developed for liquid-state viscosities only.
We also attempted to determine a semi-empirical relationship between pure-component viscosity and pure-component vapour pressure. We compared experimentally determined and modelled values of pure-component viscosity with modelled pure-component vapour pressures. Modelled viscosity values were calculated using the Nannoolal et al. (2009) group-contribution approach and vapour pressure values were determined using the online tool UManSysProp (http://umansysprop.seaes.manchester.ac.uk, last access: 11 June 2019) (Topping et al., 2016) with the model by Nannoolal et al. (2008) or by using the EVAPORATION model (Compernolle et al., 2011) without the empirical factor for functionalized dicarboxylic acids. At lower viscosity and vapour pressure, the relationship is linear in double logarithmic space; however, this relationship does not apply sufficiently well at higher viscosity values (see Fig. S2).
Ultimately, at present it is not possible to rely on directly measured or predicted pure-component viscosity values of organic compounds over the atmospheric temperature range. As a result, we employ the method developed by DeRieux et al. (2018), which uses the calorimetric glass transition temperature, Tg (herein called the glass transition temperature) to predict the pure-component viscosity of organic compounds. This method is an updated Tg parameterization based on previous work done by Shiraiwa et al. (2017). Compared to the Shiraiwa et al. (2017) method (validated for compounds ), the DeRieux et al. (2018) method was designed to perform better also for higher molar mass compounds. With the DeRieux et al. (2018) method, we first predict Tg of the organic compounds. We then use the glass transition temperature to calculate the pure-component viscosity of the organics via the modified Vogel–Tammann–Fulcher equation (Angell, 1991; DeRieux et al., 2018). A semi-empirical elemental-contribution model is used by DeRieux et al. (2018) to predict the glass transition temperature for a given organic molecule:
where yC, yH, and yO are the number of carbon, hydrogen, and oxygen atoms of the molecule. bC, bH, bO, bCH, and bCO are model parameters determined by optimization using Tg training data from experiments. For the parameter values and a full description of the model, the reader is referred to the aforementioned work. The estimated glass transition temperature is then used to calculate the Vogel temperature, T0, and subsequently the pure-component viscosity (Angell, 1991):
where Angell (1991) has assumed that
The Vogel temperature, T0, and the fragility parameter, D, are component-specific properties. T0 is thought to be related to the Kauzmann temperature (the ideal glass transition temperature) (Angell, 1997). The fragility parameter, D, indicates whether the (liquid) compound is a “strong” or “fragile” glass-former. Strong glass-formers show an approximately linear increase in log 10(η0) (Arrhenius behaviour) as they are cooled toward their glass transition (Debenedetti and Stillinger, 2001). In other words, the activation energy for viscous flow in strong liquids is temperature independent (i.e. T0 is a constant in Eq. 12). Conversely, as a fragile glass-former undergoes cooling it will show very little increase in viscosity until near the glass transition, whereupon it will experience a steep increase in viscosity (so-called super-Arrhenius behaviour). In the case of a fragile glass-former, the activation energy for viscous flow is temperature dependent (i.e. T0=T0(T) in Eq. 12). In practice, D is calculated from a so-called Arrhenius plot. An Arrhenius plot illustrates the curve produced on a graph of vs. . The slope of the curve at produces the fragility index, m, from which the fragility parameter is derived by (DeRieux et al., 2018).
Predictions of pure-component viscosity as a function of temperature using Eqs. (11) and (12) are shown for glycerol, citric acid, sucrose, and trehalose in Fig. 2. Grey symbols indicating reference Tg values (either measured or parameterized) are also shown according to the convention that η0(Tg)=1012 Pa s. Although, it is important to note that for fragile glass-formers η0(Tg) may be up to 4 orders of magnitude lower than 1012 Pa s (Angell, 1995). As such, including the reference Tg values does not provide a clear picture of the performance of the DeRieux et al. (2018) method for individual components; however, it allows us to make relative comparisons among certain components. For example, sucrose and trehalose, both disaccharides, are structural isomers differing in their composition from two monosaccharides, with reference Tg values that reflect this difference; however, both compounds have the same number of carbon, hydrogen, and oxygen atoms, so the DeRieux et al. (2018) method produces identical pure-component viscosity predictions. The inherent omission of more detailed structural information illustrates one potential limitation of that pure-component viscosity prediction method. Nonetheless, the fact that the pure-component viscosity prediction can be made for any organic over a large temperature range affords a level of flexibility and predictability that, at present, outweighs the potential inaccuracies. More importantly, the potential inaccuracy of this method may be largely associated with our choice of the fragility parameter. For organic compounds, D values typically range from ∼5 to 30 (Angell, 1997; DeRieux et al., 2018) and for most organics at or around room temperature; assuming a fragility parameter of 10 has been shown to be appropriate (Shiraiwa et al., 2017; DeRieux et al., 2018). We believe this to be especially true in the context of complex SOA mixtures where individual components may have fragility parameters that deviate from D=10; however, with a sufficient number of components in the mixture, these deviations will be offset. Moreover, for some organics whose Tg is close to the temperature of interest in a mixture viscosity calculation, the choice of fragility parameter may only have a small influence on the pure-component viscosity prediction. Figure 2 illustrates that, for citric acid near 298 K, any value of D between 5 and 30 will produce nearly identical values of pure-component viscosity. However, we highlight this case in particular, because it appears to be the exception. For glycerol, sucrose, and trehalose in Fig. 2 the choice of D at room temperature presents a large discrepancy (several orders of magnitude) in the pure-component viscosity. This is true for most organics studied in this work.
In general, the choice of D becomes most influential in the supercooled regime, specifically beyond the organic's Tg if Tg occurs at the conventionally assigned viscosity of 1012 Pa s. For example, D=10 will produce similar values of pure-component viscosity at either room temperature or at 273 K for glycerol; however, the opposite is true for citric acid, sucrose, and trehalose (Fig. 2). As such, we must consider our choice of D not only for comparison with laboratory (room temperature) data but also for temperatures representative of where we expect viscous aerosol to be most relevant (around and below 15 ∘C). The temperature at which we must begin to concern ourselves with the influence of the fragility parameter varies from compound to compound, but for each compound this issue always presents itself above and below its Tg.
There is also recent evidence to suggest that some liquid glass-formers undergo a fragile-to-strong crossover (FSC) at a temperature Tx, where , with TM being the melting temperature. The physical reason behind the FSC is poorly understood at present, but it is thought to be related to a spatially inhomogeneous arrest of molecules in the liquid or amorphous phase during cooling. This phenomenon, known as “spatially heterogeneous dynamics” postulates that correlated domains in a liquid may exhibit different relaxation dynamics than the average over the entire bulk (Ediger, 2000). The FSC has been observed for water (Jagla, 2001) and silicon dioxide (La Nave et al., 2002; Saika-Voivod et al., 2004) and recently for a number of organics (see Novikov and Sokolov, 2003, and Mallamace et al., 2010, and references therein). Both of these latter works suggest there is a universal material-independent FSC pure-component viscosity based on experiments of relaxation dynamics for glass-forming liquids. Novikov and Sokolov (2003) suggest that η× is on the order of 106 Pa s. However, Mallamace et al. (2010) find that ηx is on the order of 103 Pa s. Notwithstanding this discrepancy, the presence of the FSC motivates our choice to change the assignment of D from 10 to 30 on a per-component basis if the temperature of a simulation case is below the component's Tg. We note that the results of the aforementioned studies would suggest that for at least some organics the FSC occurs at temperatures warmer than Tg. This is also supported by recent measurements of a super-Arrhenius-to-Arrhenius transition observed in citric acid, having occurred at 302–312 K, which is approximately 20–30 K warmer than average values of the citric acid glass transition reported in the literature. While it would be more appropriate to change the D assignment at the FSC viscosity, we do not have a clear scientific basis to assign universal pure-component FSC. At least for temperatures below Tg it is reasonable to assume that the FSC has occurred.
To summarize, we choose to assign a fragility parameter of D=10 for all organic compounds, with the exception of those whose Tg is warmer than the simulation temperature. For compounds with a Tg warmer than the simulation temperature, a fragility parameter of D=10 drastically overestimates the pure-component viscosity, and, by extension, the mixture viscosity (see Fig. 2f). The FSC provides us with the theoretical basis to assign a fragility parameter of D=30 in these cases, which provides much better agreement between the model and experiment.

Figure 3Prediction of Tg using the methods presented in (a) DeRieux et al. (2018) and (b) Shiraiwa et al. (2017) versus measured reference Tg values for some of the binary aqueous mixtures considered in this study. The grey markers represent individual reference Tg values, and the coloured markers represent the average Tg. Error bars for reference values have been omitted for clarity. For a list of the reference values and their uncertainties, see Table S1. The grey dashed 1:1 lines represent perfect agreement between predicted and reference values.
2.3 Estimation of pure-component viscosity uncertainty
The uncertainty in the pure-component viscosity as predicted by the DeRieux et al. (2018) method arises from the uncertainty in the prediction of Tg and the uncertainty in D. Given that the Tg model is parameterized using a collection of measured Tg values, any uncertainty in Tg measurements will be propagated into the fitted DeRieux et al. (2018) model parameters. In addition, the fragility parameter is derived from measurements of Tg, so any uncertainty in Tg will also propagate into the value of D. Therefore, we assess the uncertainty in the pure-component viscosity prediction by prescribing an uncertainty for Tg; Tg measurements are made by cooling a compound until a liquid-to-glass phase transition occurs. For example, differential scanning calorimetry reveals a change in heat capacity of the single-component substance when Tg is reached (e.g. Angell et al., 2002; Lienhard et al., 2012). However, in some ways the glass transition temperature is a misnomer; the measured vitrification temperature of a liquid is dependent on the cooling rate from liquid (or the heating rate starting from the glassy state). In reality, the calorimetric glass transition temperature is not a discrete value; rather, it describes a range of temperatures (or a retrieved average temperature) corresponding to appropriate cooling rates that induce vitrification. Faster cooling rates will result in a slightly warmer Tg value than if the same substance were cooled at a slower rate (Debenedetti and Stillinger, 2001; Angell et al., 2002). For cooling rates that differ by an order of magnitude, the resulting Tg range is approximately 3–5 K (Debenedetti and Stillinger, 2001). Another more consequential factor that contributes to experimental Tg measurement uncertainty is the purity of the substance being measured. In essence, depending on laboratory conditions and sample preparation procedure, it is possible that the substance being measured is not entirely anhydrous – and trace amounts of water, being an excellent plasticizer, may cause a lower measured Tg value than what is true for the anhydrous compound.
Factoring in the effects of cooling rate and the substance purity on Tg, we choose to assign a 5 % uncertainty. For a compound whose glass transition is within the range of atmospherically relevant temperatures, an uncertainty of ∼10–20 K is produced. This is also in good agreement with findings from DeRieux et al. (2018), who state that, for the compounds they investigated, their model can estimate Tg within ±21 K based on a 68 % prediction interval. We also note that this appears to be a reasonable uncertainty based on the spread in reference Tg values for the components we have studied, where glass transition temperature data are available (see Table S1). The reference values of Tg are either values measured experimentally or extrapolated from parameterizations of measurements of pure-component viscosity. Independent reference values of Tg for the same pure-component can differ by as little as 1 or 2 K, but in the most extreme case considered here (citric acid), values span almost 50 K.
Figure 3 shows a comparison of the Tg values predicted by the DeRieux et al. (2018) and Shiraiwa et al. (2017) models with the reference values listed in Table S1. The average relative difference between the predicted values and the mean of the reference values are 6.76 % and 8.71 % for the DeRieux et al. (2018) and Shiraiwa et al. (2017) models, respectively. This demonstrates that, for the compounds studied here, the DeRieux et al. (2018) model is more appropriate. In addition, we note that a 5 % uncertainty in Tg is in good agreement with the difference between the predicted and reference Tg values.
2.4 Estimation of AIOMFAC-VISC sensitivity
We calculated the sensitivity of AIOMFAC-VISC as a proxy for the uncertainty in the mixture viscosity prediction. We chose to prescribe the AIOMFAC-VISC sensitivity as the response of the mixture viscosity prediction to a small change in mixture composition. The mixture composition adjustment was done by adjusting the mixture water content by a small amount. This is meant to represent the uncertainty in the composition measurement in a laboratory setting, which would be typical of all experiments. The calculation of AIOMFAC-VISC sensitivity is described in Sect. S3 of the Supplement.
2.5 Treatment of secondary organic aerosol systems
For SOA mixtures, we used the AIOMFAC-VISC method within the MCM–EVAPORATION–AIOMFAC equilibrium gas–particle partitioning framework (Zuend and Seinfeld, 2012) to account for complex aerosol composition and the potential for liquid–liquid phase separation (LLPS). The Master Chemical Mechanism (MCM; Jenkin et al., 1997; Saunders et al., 2003; Jenkin et al., 2015) simulates the oxidation of parent hydrocarbons in the gas phase and provides a set of reaction products and stoichiometric yields for prescribed environmental conditions. We select a subset of the MCM reaction products, using those to generate surrogate mixtures of 14–21 components as a representation of the SOA composition formed from a specific precursor, as is done frequently when molecular-structure input information is required by models (e.g. Zuend and Seinfeld, 2012; Rastak et al., 2017; Gorkowski et al., 2019). The procedures used to determine the molar concentrations of SOA components along with the lists of MCM products used for the three SOA systems studied are provided in Sect. S6 of the Supplement.
3.1 Comparison with simplified models
A group-contribution model like AIOMFAC-VISC has the potential to offer a high degree of fidelity, owing to its relatively detailed description of a given mixture of organics plus water. However, it is important to question whether the estimation of mixture viscosity actually requires the complexity offered by a group-contribution model or if a simpler mixing rule would suffice. To this end, we have compared the performance of AIOMFAC-VISC with four different expressions:
Here, xi is the mole fraction, ϕi is the volume fraction, σi is the surface area fraction, and γixi is the mole-fraction-based activity of the ith mixture component. Implicit in these expressions is the assumption that mixture viscosity can be described simply as a weighted mean of the pure-component viscosities of the mixture components. The weighting is representative of the fractional amount of each component present in the mixture by their number of moles, their occupied volume, their surface area, or their activity.
Figure 4 shows a comparison of these different mixture viscosity models at T=293.15 K for two binary systems: water plus glycerol and water plus citric acid. To remove the influence of a potential inaccuracy in the pure-component viscosity prediction on the model intercomparison, the panels on the left in Fig. 4 (Fig. 4a, c) show the systems with the pure-component viscosities taken from measurements or a case-specific model estimation. For glycerol, the pure-component viscosity has been determined experimentally, while for citric acid experimental data exist at very low mass fractions of water, allowing for an extrapolation to the pure-component viscosity by leaving the pure-component viscosity of citric acid at the system temperature as a single fit parameter of our AIOMFAC-VISC model. With assigned pure-component viscosities, it becomes clear that the mixing rules based on molecular volume fraction or surface area fraction in the mixture are unsuitable predictors of mixture viscosity. The mole-fraction-weighted mixing and the activity-weighted mixing rules perform reasonably for glycerol, but AIOMFAC-VISC remains the most accurate mixing model. For the aqueous citric acid system, the mole-fraction-weighted mixing rule, the activity-weighted mixing rule, and the AIOMFAC-VISC predictions are similar and all three are in good agreement with the available experimental data. At least for binary aqueous systems, the mole-fraction-weighting rule appears to be the best among the simple mixing rules. A more detailed, quantitative comparison of AIOMFAC-VISC with the expressions in Eq. 14 demonstrates that when the pure-component viscosities are well constrained, AIOMFAC-VISC predictions are an improvement over the simple mixing rules (see Sect. S7 of the Supplement). Additionally, it is confirmed that the mole-fraction-weighted mixing rule is the best choice among the simple mixing rules.
The combinatorial contribution of AIOMFAC-VISC (Eq. 2) is similar in formulation to the mole-fraction- and activity-weighted mixing rules, which suggests that the residual contribution of viscosity in AIOMFAC-VISC is less important, but not negligible, in the mixture viscosity prediction. This is further demonstrated when comparing the mixture viscosity results of AIOMFAC-VISC with those of GC-UNIMOD. The GC-UNIMOD prediction of mixture viscosity is not shown in Fig. 4, although it provides a nearly identical result to that of the volume-fraction-weighted mixture viscosity. As detailed in Sect. 2, the most significant changes made to GC-UNIMOD were in the modification of the combinatorial contributions to viscosity, which account for most of the improvement from GC-UNIMOD to AIOMFAC-VISC (see Sect. S4 and Fig. S3).
Comparing the panels from the left column with the right column in Fig. 4 (Fig. 4a and c to b and d) highlights the effect of uncertainty in the pure-component viscosity prediction on the mixture viscosity and the variability in the quality of this prediction, depending on the component. For glycerol, the DeRieux et al. (2018) method only slightly overpredicts the pure-component viscosity. For citric acid, the overprediction of spans almost 4 orders of magnitude. It should also be noted that while the pure-component viscosity is overpredicted for both citric acid and glycerol, this is not the case for every organic. For 11 single-organic component systems studied, for which we have reference values of Tg, was overpredicted for 6 of the components and underpredicted for 5 of the components, related to overpredictions or underpredictions of the corresponding Tg values (Fig. 3).
Figure 4 demonstrates that the AIOMFAC-VISC prediction of mixture viscosity is highly sensitive to the pure-component viscosity value. With the appropriate pure-component viscosity value (either from experiment or a model fit) we have the ability to make the mixture viscosity prediction highly accurate (in these specific cases, but not generally). In using the DeRieux et al. (2018) method we sacrifice some accuracy in predicting mixture viscosity in order to have the flexibility of predicting the mixture viscosity for systems containing organics for which we have no information about their pure-component viscosity from experimental data. This is especially important in the context of SOA systems.
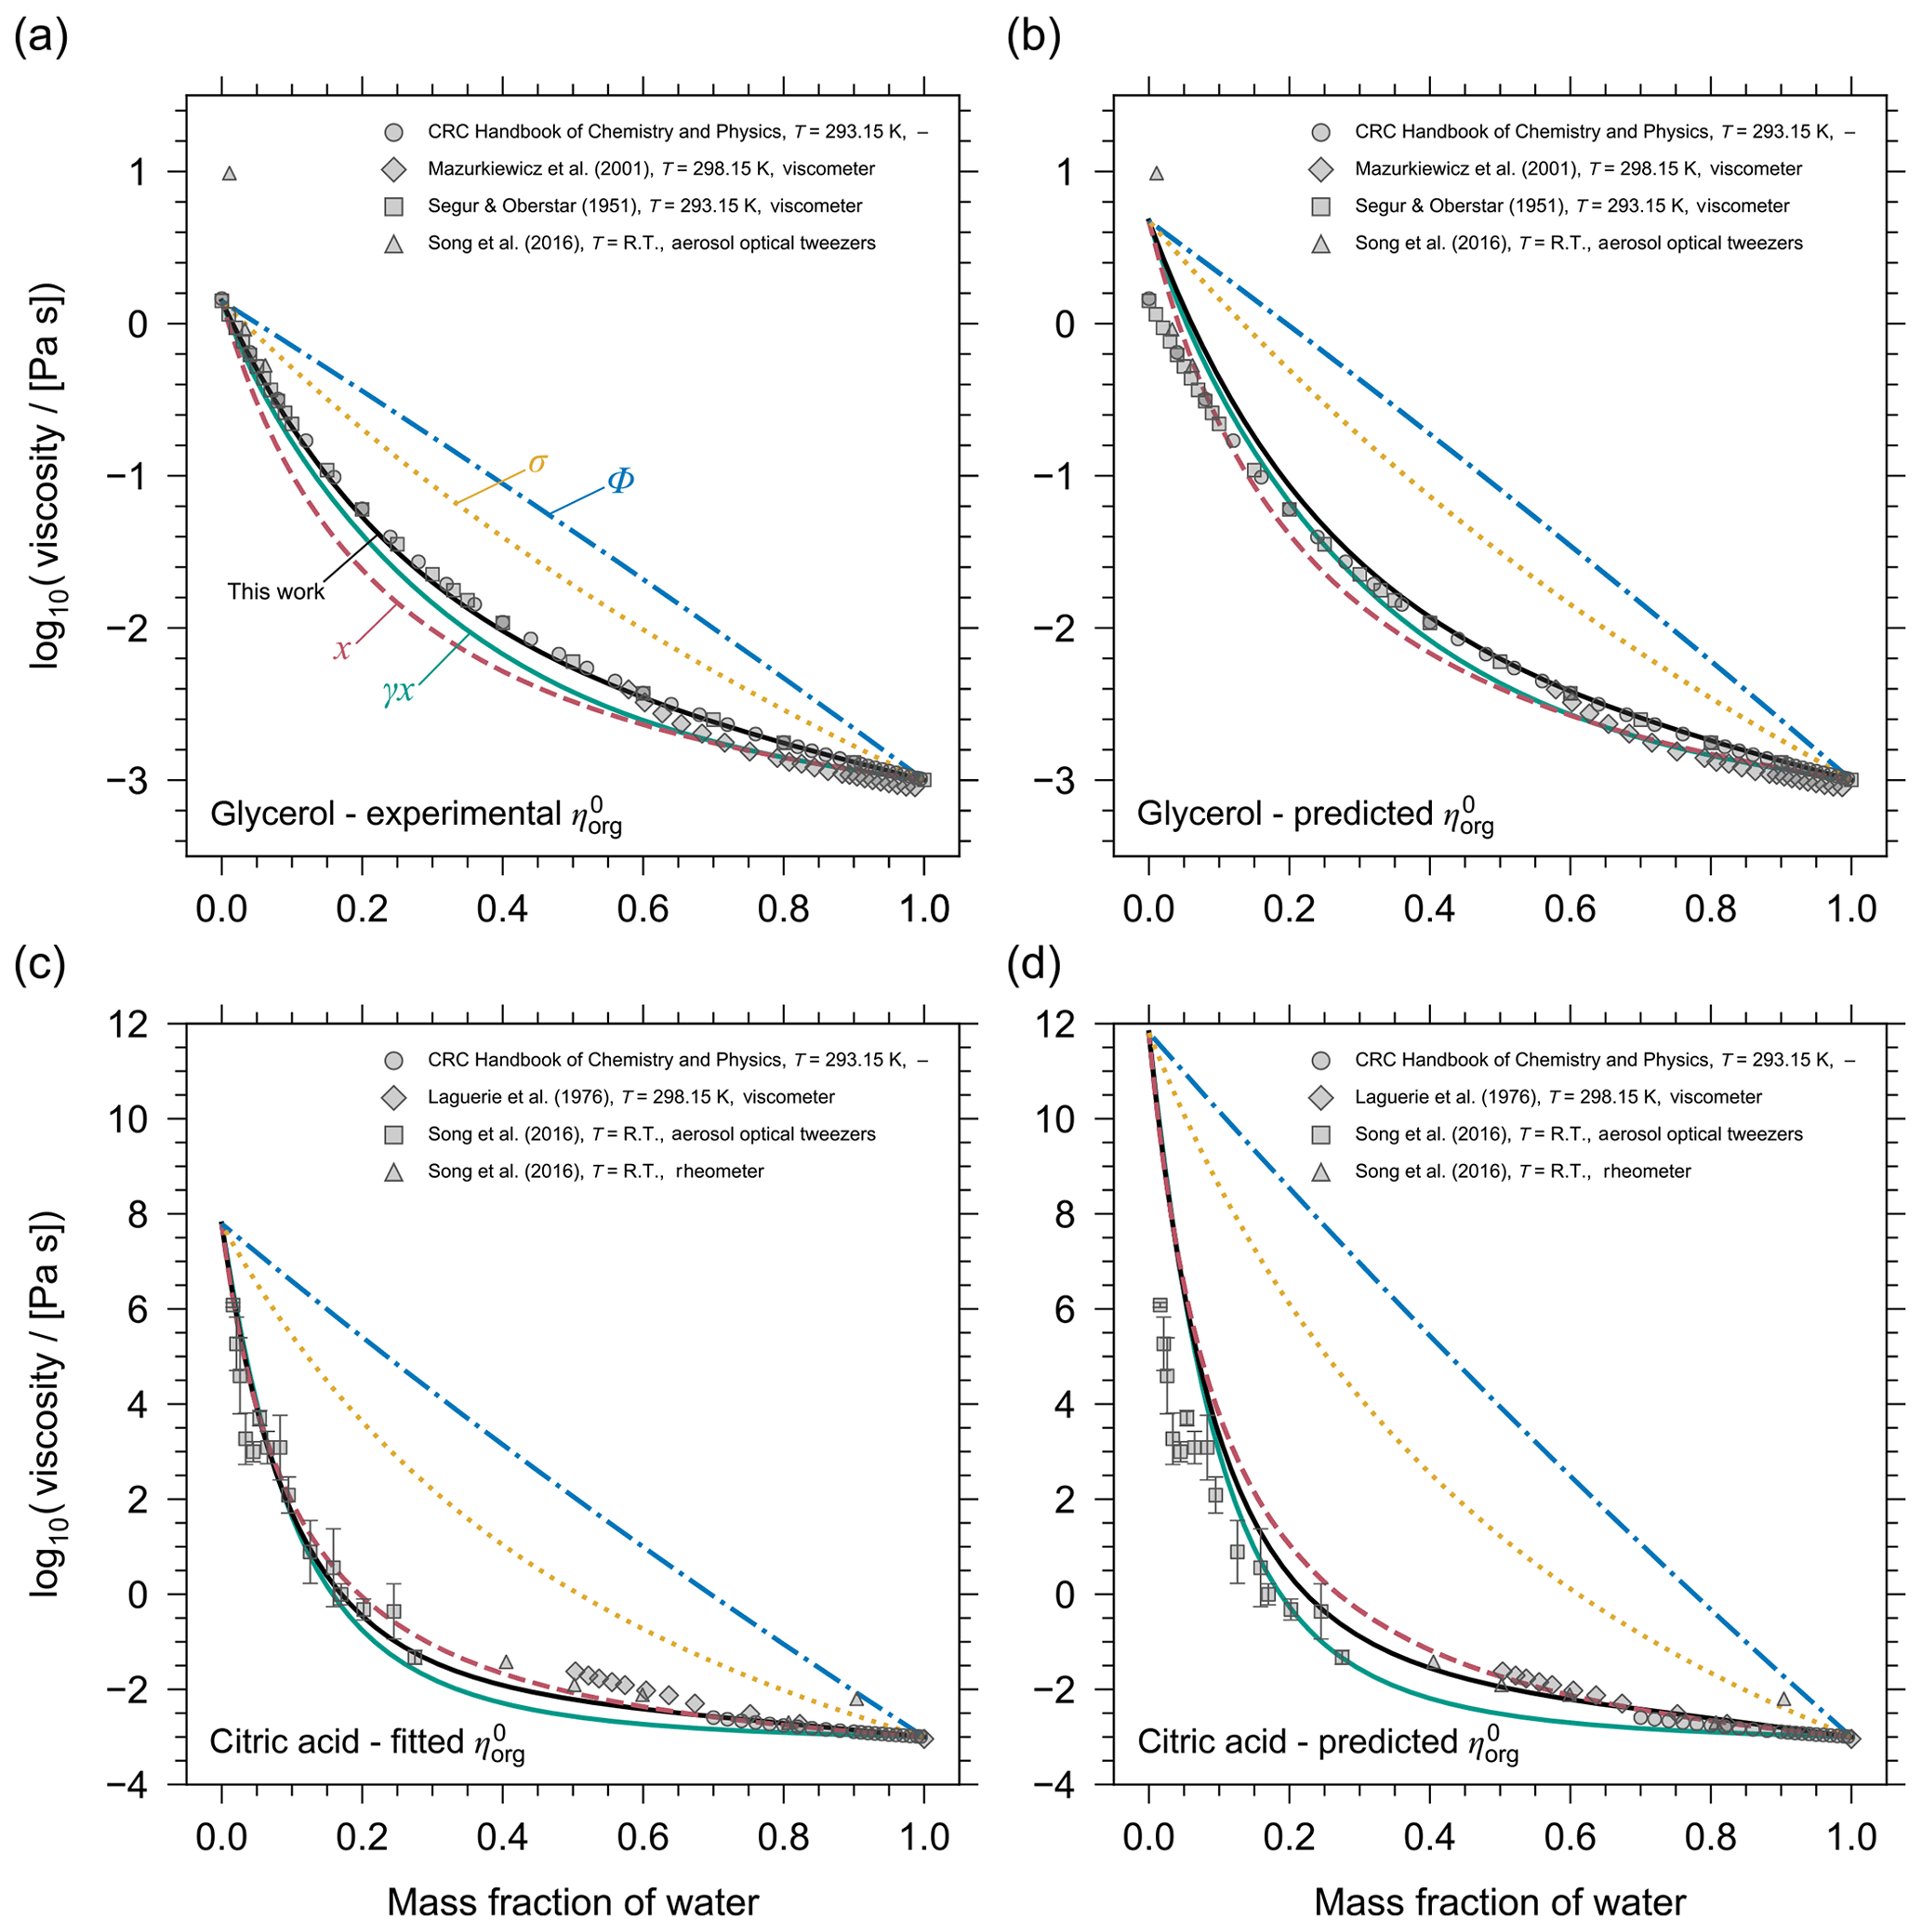
Figure 4Model intercomparison of mixture viscosity predictions as a function of mass fraction of water at T=293.15 K. The mixing models shown are AIOMFAC-VISC (black solid lines) and four simple viscosity mixing rules (Eq. 14): molecular mole-fraction-weighted (pink dashed lines), volume-fraction-weighted (blue dash-dotted lines), surface-area-fraction-weighted (yellow dotted lines), and mole-fraction-based activity-weighted (green solid lines) means of pure-component viscosities. Top row: the binary mixture of glycerol and water, with the pure-component viscosity of glycerol assigned from (a) the measured value or (b) predicted by the DeRieux et al. (2018) method. Bottom row: the binary mixture of citric acid and water, with the pure-component viscosity of citric acid assigned (c) based on an AIOMFAC-VISC fit of using the shown experimental data or (d) predicted by the DeRieux et al. (2018) method. Grey markers show experimental data from different methods (see key).
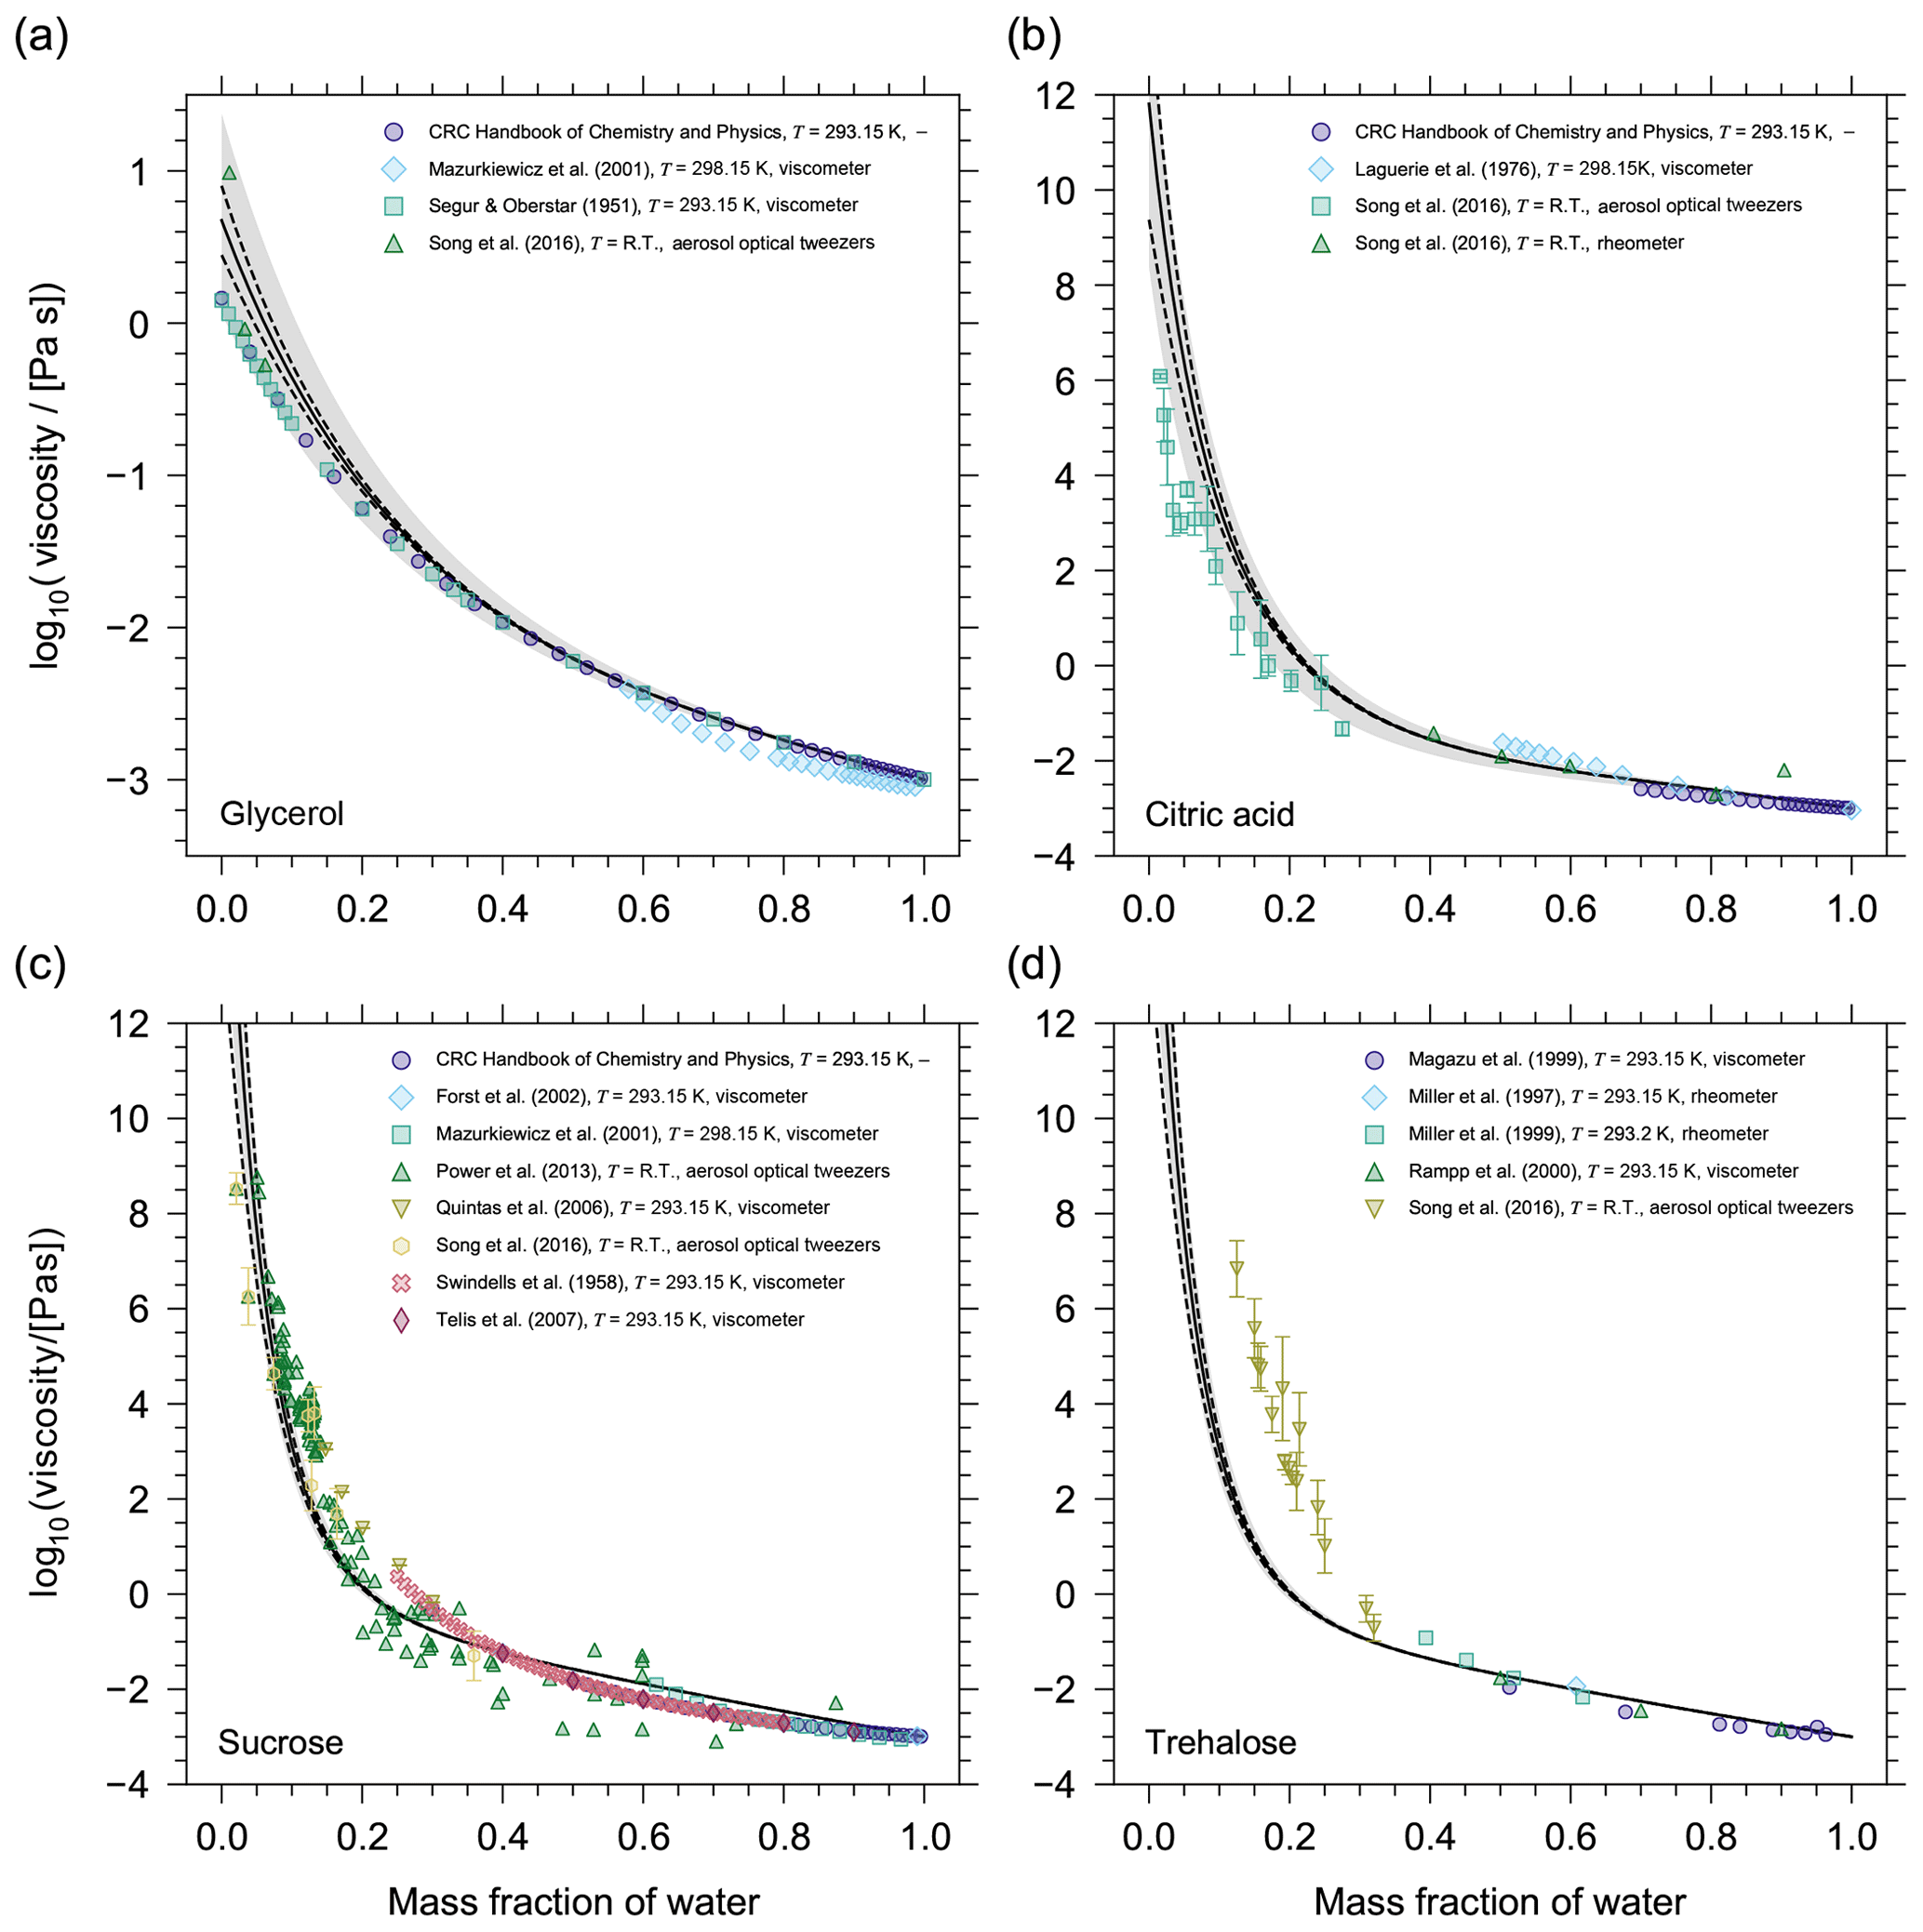
Figure 5AIOMFAC-VISC mixture viscosity predictions as a function of mass fraction of water at 293.15 K for (a) glycerol, (b) citric acid, (c) sucrose, and (d) trehalose. The solid black line is the AIOMFAC-VISC mixture viscosity prediction. The dashed black lines show the AIOMFAC-VISC sensitivity. The model sensitivity is assessed by calculating the response of the model to a small change in mixture composition (see Sect. 2.4). The grey shaded area denotes a 5 % uncertainty in the prediction of Tg. Markers show experimental data. Error bars have been omitted when the length of the error bar does not exceed the width of the marker.
3.2 Binary aqueous organic mixtures
Before running AIOMFAC-VISC for multicomponent mixtures, including a selection of SOA systems, the model was first tested with a dozen binary aqueous mixtures, which were chosen based on the availability of experimental data covering the low-viscosity and semi-solid regimes. The binary aqueous mixtures were used to test and validate the model; i.e. we tested potential adjustments to the AIOMFAC-based viscosity equations (Eqs. 2–3) to optimally predict the viscosity of as many binary aqueous mixtures as possible. Figure 5 shows the results for four of these systems. For aqueous glycerol and aqueous citric acid mixtures, the AIOMFAC-VISC model (solid line) slightly overpredicts the mixture viscosity at lower mass fractions of water due to the overestimation in η0. The experimental data at low mass fractions of water lie within the η0 uncertainty (grey shaded region) for glycerol, although not for citric acid. At higher mass fractions of water, the experimental data for both systems agree very well with the model prediction. For sucrose, we observe a similar pattern; the model shows higher predictive power at higher mass fractions of water. The agreement of the model with experimental data where ηmix>108 Pa s is especially encouraging for modelling ultra-high viscosities. However, we note that the logarithmic scale leads to seemingly good agreement at higher viscosities and seemingly higher scatter among experimental data at lower viscosity, while in absolute (non-logarithmic) terms, the agreement at lower viscosity is typically far better.
For compounds with a small molar mass () the AIOMFAC-VISC mixture viscosity prediction works well. Assessing the validity of the AIOMFAC-VISC viscosity prediction for compounds with larger molar masses () is challenging, because experimental data are available only for a select few binary aqueous mixtures with large molecules (sucrose, trehalose, maltose, and raffinose). Moreover, these data sets are all for cyclic sugars, so it is questionable whether they serve as a widely applicable assessment for AIOMFAC-VISC validity at higher molar mass or just AIOMFAC-VISC validity for mono-, di-, and trisaccharides. Nonetheless, it appears as molar mass increases, the AIOMFAC-VISC prediction starts to deviate from experimental data for the binary mixtures tested that contain larger, highly functionalized organic molecules. For example, this is evident for binary aqueous mixtures with trehalose. This reduction in predictability may be occurring for two reasons. First, the η0 prediction becomes less accurate for larger molecules, particularly those with a molar mass above 350 g mol−1. Second, AIOMFAC-VISC may not be able to capture certain structural characteristics of the mixture components with the group-contribution approach. Namely, as the mass fraction of water decreases, the movement of trehalose molecules in the mixture may become restricted due to an increase in the so-called free volume of each molecule. The free volume of trehalose molecules would be greater than the volume predicted based on the sum of contributing group volumes.
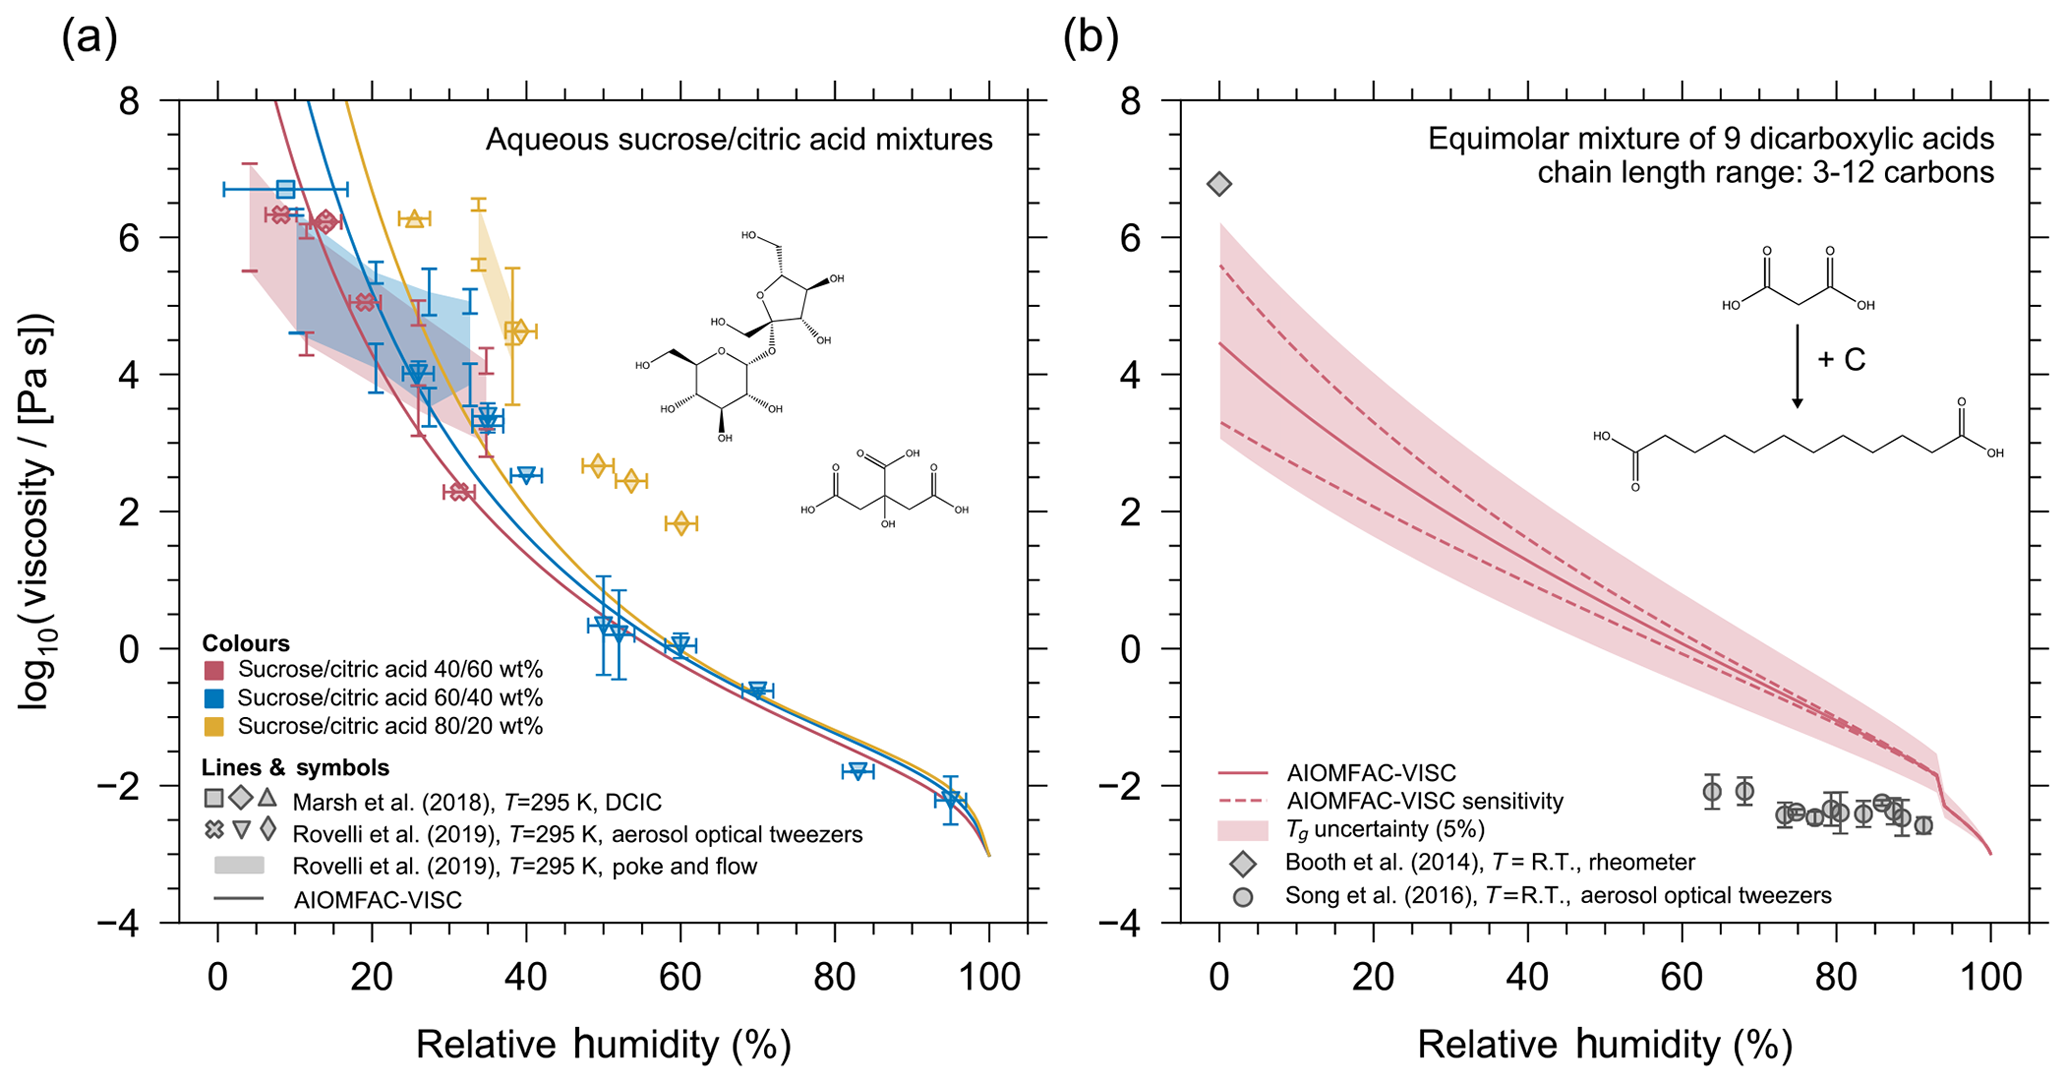
Figure 6(a) AIOMFAC-VISC mixture viscosity predictions as a function of relative humidity (lines) for aqueous mixtures of sucrose and citric acid compared with aerosol optical tweezers experimental data (symbols) and poke-and-flow experimental data (shaded regions). The colours of the markers and curves correspond to mixtures with different concentrations of sucrose and citric acid. The three mixtures are composed of dry compositions of 40:60 (pink), 60:40 (blue), and 80:20 (yellow) percent mass fraction of sucrose / citric acid. (b) AIOMFAC-VISC mixture viscosity for the equimolar dicarboxylic acid mixture presented in Cappa et al. (2008). The solid line shows the AIOMFAC-VISC predicted mixture viscosity, dashed lines represent model sensitivity, and the shaded region represents a 5 % uncertainty in Tg. Grey markers show the viscosity measurements in a limited RH range.
3.3 Multicomponent aqueous organic mixtures
A direct way to assess the accuracy of AIOMFAC-VISC mixture viscosity predictions is by evaluating model predictions against available experimental data for aqueous multicomponent mixtures for which we know the mass or mole fractions of components in the mixture. An example of an aqueous multicomponent system is shown in Fig. 6, where AIOMFAC-VISC is tested for aqueous sucrose and citric acid systems of different organic mixing ratios (40:60, 60:40, and 80:20 percent mass fraction of sucrose / citric acid). The model is run at the same temperature of 295 K as the mixture viscosity measurements conducted by Marsh et al. (2018) and Rovelli et al. (2019). We have omitted the model sensitivity envelope in Fig. 6 for clarity. Fitted pure-component viscosity values were used for this simulation for citric acid and sucrose in order to assess the AIOMFAC-VISC mixture viscosity prediction without introducing uncertainty from the DeRieux et al. (2018) pure-component viscosity prediction method. The model shows good agreement with the aerosol optical tweezers data for the 40:60 and 60:40 aqueous sucrose / citric acid mixtures. The model is less accurate for the 80:20 mixture, in which case the model consistently underestimates the measured viscosities. Based on Fig. 5, it appears the model is more accurate for predicting the mixture viscosity of binary, aqueous citric acid than for binary, aqueous sucrose. This may explain the better model performance in the case of the 40:60 and 60:40 sucrose / citric acid mixtures as compared to the 80:20 mixture. Furthermore, we note that these optical tweezers measurements do not provide an independent estimation of the water contents at given RH; hence, a part of the model–measurement deviations may also be attributed to overpredictions or underestimations of the actual mixture water content by AIOMFAC.
Well-characterized mixtures of known molecular compositions for viscosity purposes are scarce. The only other multicomponent mixture data to which we can compare our model to is shown in Fig. 6b. This multicomponent mixture (herein termed the “Cappa mixture”) was first presented in Cappa et al. (2008). The Cappa mixture is comprised of equimolar amounts of nine dicarboxylic acids (C3–C12). As before, the solid line in Fig. 6b indicates the AIOMFAC-VISC prediction, the dashed lines indicate the model sensitivity, and the shaded region represents the 5 % uncertainty in Tg. Both the anhydrous and aqueous viscosity was measured experimentally by Booth et al. (2014) (diamond marker) and Song et al. (2016a) (circle markers) for the Cappa mixture. Booth et al. (2014) measured the water-free viscosity to be approximately 6×10⁶ Pa s, and they also reported that the aqueous mixture viscosity remained semi-solid above 105 Pa s above ∼0.8 mole fraction of water. This appears to differ from experimental data on the same system by Song et al. (2016a), which suggests that the viscosity of the Cappa mixture is in the liquid regime () even between 60 % and 70 % RH. The AIOMFAC-VISC prediction does not agree well with either set of experimental data, although it falls in between the measured range, and it does exhibit the same trend of moderate viscosity at low relative humidity, which steeply declines with increasing relative humidity.
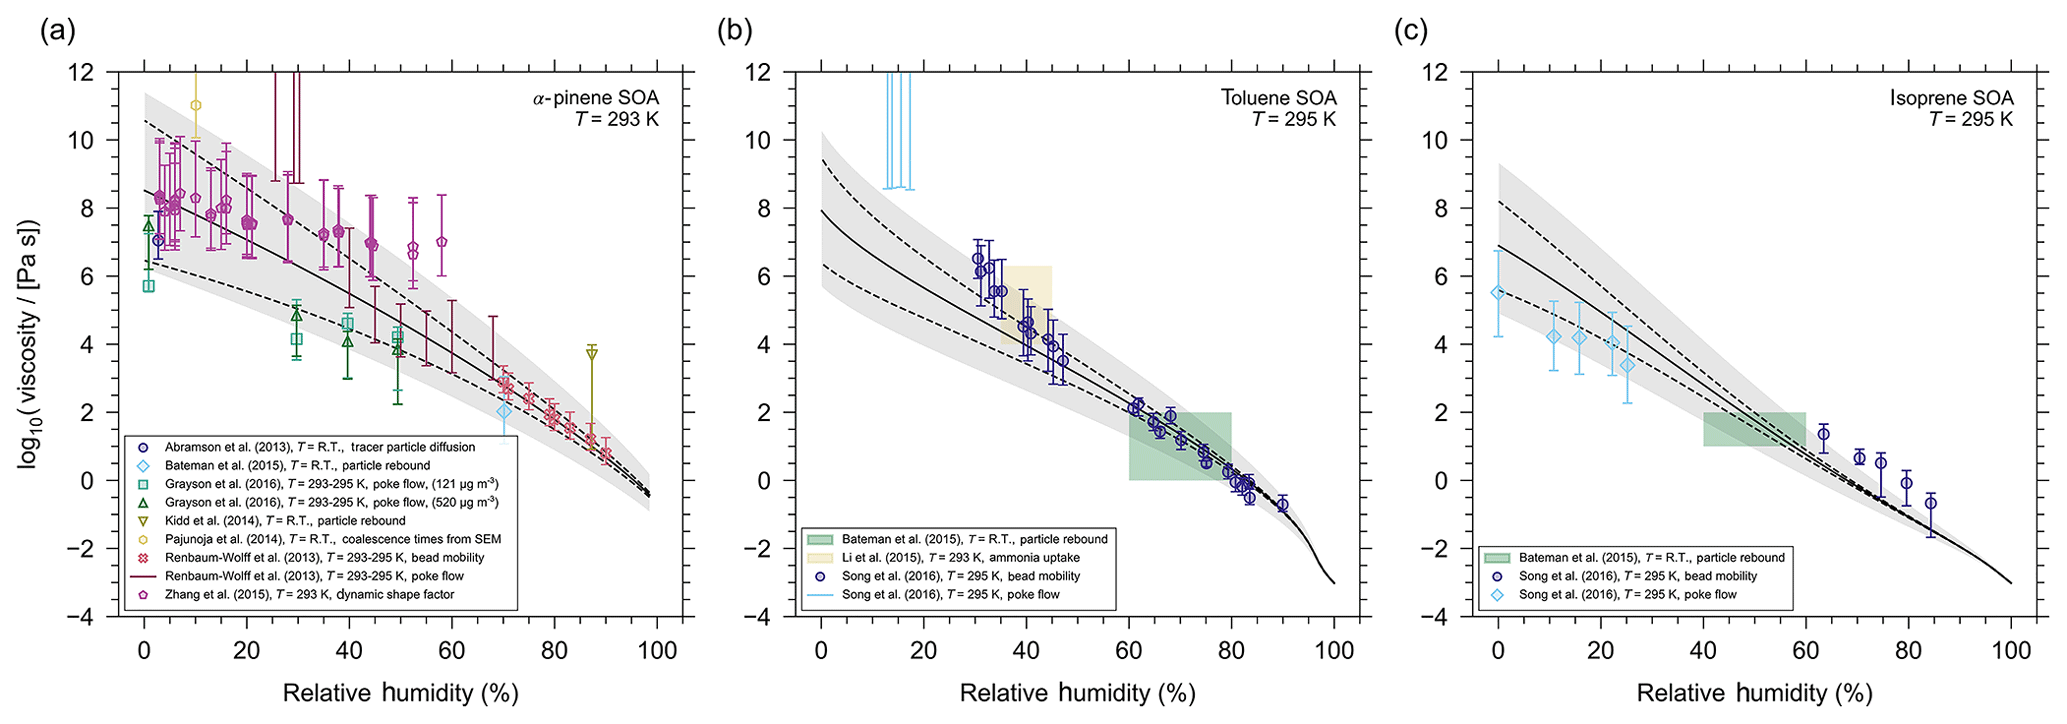
Figure 7AIOMFAC-VISC mixture viscosity predictions (solid line) for (a) α-pinene SOA at T=293 K, (b) toluene SOA at T=295 K, and (c) isoprene SOA at T=295 K. The dashed lines represent the model sensitivity and the grey shaded regions represent a 5 % uncertainty in estimated Tg values. The markers and colour shaded regions represent experimental data obtained by different methods (see legend). indicates that the measurements were taken at room temperature ( K).
3.4 Secondary organic aerosol systems
Finally, we test the AIOMFAC-VISC predictions against experimental data for three secondary organic aerosol systems: SOA derived from the oxidation of α-pinene, toluene, or isoprene (Fig. 7). In the case of α-pinene SOA, there are several distinct experimental data sets from the literature, which we used to compare to the AIOMFAC-VISC prediction. Most of the measurements were carried out at or near room temperature (), without a clearly quantified temperature range. A few sets of measurements are specified to have been taken between 293–295 K. Here we assume room temperature to be approximately 20 ∘C, and so we have chosen to run the AIOMFAC-based gas–particle partitioning computations as well as AIOMFAC-VISC at 293 K. In the case of toluene- and isoprene-derived SOA, there are fewer experimental data sets and most measurements have been made at ∼295 K, so for these two systems we matched our simulation temperature accordingly. For further details about the surrogate mixtures and compositions for all SOA defined in AIOMFAC-VISC, see Sect. S6 of the Supplement.
3.4.1 SOA formed from α-pinene oxidation
In the case of laboratory measurements, α-pinene SOA is the most studied SOA system in the viscosity literature. Despite this, its viscosity remains poorly constrained in relative humidity space; i.e. there are large discrepancies in viscosity measurements taken at approximately the same relative humidity. Some of these discrepancies span several orders of magnitude. For example, at ∼30 % RH, measurements of viscosity range from ∼104 to 109 Pa s (Fig. 7a). The differences between those data sets occur likely for two reasons. First, a range of novel experimental techniques are used to measure the aerosol viscosity. The novelty of these techniques is owing to the non-trivial challenge of measuring ultra-high viscosities in situ. As a result, these techniques have a high degree of uncertainty and often only a range of possible viscosities can be provided rather than a precise viscosity measurement. With large experimental uncertainties it is unsurprising that we also see a disparity between data sets. Second, the laboratory-made α-pinene SOA mixtures may vary greatly in composition from data set to data set, depending on the method of SOA generation and sample extraction and/or preparation for viscosity measurements. For example, an SOA particle that experiences a longer oxidation time (or higher exposure to ozone and/or OH radicals) may contain a mixture with a higher average O:C ratio when compared to a particle that experienced a shorter oxidation time. A higher average O:C ratio for the particle mixture suggests it may contain a larger fraction of molecules with oxygen-bearing functional groups and potentially more diversity in the branching characteristics of molecular structures from the parent hydrocarbon. The molecules may also be larger and of higher molar mass on average (barring substantial fragmentation). As a result, the SOA particle that was given more time to oxidize may have a higher mixture viscosity (particularly at low RH). Grayson et al. (2016) also provide evidence that production aerosol mass concentrations are inversely proportional to the SOA viscosity. From gas–particle partitioning theory and experimental evidence, a higher abundance of less-oxidized components in the SOA is expected for high aerosol loading chamber experiments. This provides further evidence that the production method of α-pinene SOA can have a non-trivial influence on the measured viscosity. It also suggests that the viscosity of laboratory-generated SOA may underestimate ambient SOA viscosity, because laboratory-generated SOA mass concentrations (for viscosity measurement purposes) have often been several orders of magnitude higher than the concentrations typical in ambient air.
Ultimately, the spread in experimental data makes it difficult to assess AIOMFAC-VISC's viscosity prediction capabilities in great detail. Of course, AIOMFAC-VISC cannot simultaneously agree with all experimental data sets. However, we can compare the AIOMFAC-VISC prediction with specific measurements by adjusting our representative α-pinene SOA mixture in the model. Specifically, we adjust the molar ratios of products in our representative α-pinene SOA mixture, such that its average O:C ratio is similar to the average O:C of the SOA reported for the experimental data set in question. For the viscosity simulations, we further turn off partitioning of organics between the particle and the gas phases in order to ensure that the O:C ratio remains constant and the particle composition remains fixed (except for water content) regardless of relative humidity. This approach mimics the conditions under which viscosity measurements at different RH levels are typically done with a specific SOA sample extracted during a laboratory experiment. We have chosen to “target” the data set of bead mobility measurements from Renbaum-Wolff et al. (2013), because they report an expected O:C ratio for the mixtures used in their bead mobility experiments, and this is the data set with the smallest experimental uncertainty across all measurements (for RH >70 %). The small uncertainties are likely a result of the higher relative humidity and therefore lower mixture viscosity. Consequently, if we have a high degree of confidence in this data set, then we can assume AIOMFAC-VISC's prediction to be an extrapolation of the SOA properties from these measurements over the whole RH range.
Renbaum-Wolff et al. (2013) report that the expected O:C of their SOA mixtures is approximately 0.3 to 0.4, which they justify from previous measurements of O:C for α-pinene generated via ozonolysis in an environmental chamber (see the Supplement from Renbaum-Wolff et al., 2013). In Fig. 7a we have adjusted the composition of the representative α-pinene SOA mixture such that AIOMFAC-VISC is in excellent agreement with bead mobility viscosity measurements from Renbaum-Wolff et al. (2013). Although, the adjustments made to achieve this agreement results in an average O:C of 0.51. If SOA constituent concentrations are modified to produce an average mixture O:C of ∼0.4, then the model is in agreement with the measurements from Grayson et al. (2016) but not with those of Renbaum-Wolff et al. (2013). By choosing to fit the model to the data of Renbaum-Wolff et al. (2013), the general shape of the AIOMFAC-VISC prediction curve appears reasonable and ensures most of the experimental data fall within the uncertainty in Tg values. Furthermore, the Tg value predictions produce a water-free mixture viscosity for the SOA mixture that agrees well with the data by Zhang et al. (2015) for RH < 1 %. Although, we acknowledge that this approach removes an element of predictability from AIOMFAC-VISC.
We also note that AIOMFAC-VISC is capable of predicting the mixture viscosity of multiple aerosol phases should liquid–liquid phase separation (LLPS) occur. For example, in α-pinene SOA free of ammonium sulfate, LLPS is still expected to occur at high RH, although it is not resolved in Fig. 7 because LLPS occurs in this case at very high water activity only.
3.4.2 SOA formed from toluene and isoprene oxidation
Similarly, for comparison with the toluene SOA experimental data, we also adjusted the representative toluene SOA mixture (see the Supplement). Song et al. (2016b) determined an average O:C ratio of 1.08 for SOA particles that they generated with a mass concentration of 60–100 µg m−3 during production. They also note that this is in agreement with previous measurements of toluene SOA O:C of 0.9–1.3 generated under similar conditions. The toluene SOA particles investigated by Li et al. (2015) also have an O:C in the range of 1.0–1.2. Therefore, we adjusted our representative mixture in terms of relative surrogate compound composition, such that an O:C of 1.2 resulted. The AIOMFAC-VISC viscosity predictions for the adjusted toluene SOA system can be found in Fig. 7b. Accounting for error and model sensitivity, the predictions agree very well with the data for RH >40 %, while the agreement decreases below 40 % RH. It seems the model lacks the curvature necessary to fully capture the experimental data at low relative humidity; however, both the experimental uncertainty and model sensitivity span orders of magnitude in mixture viscosity for RH <30 %. In addition, as mentioned above, the chemical makeup of toluene SOA was likely different in different experiments, with the specific O:C having an influence on the water uptake and thereby viscosity, which may lead to a lower viscosity of higher-O:C ratio SOA samples, especially for RH >10 %, where water uptake is non-negligible in these systems of relatively high average O:C.
Neither Song et al. (2016a) nor Bateman et al. (2015) have provided O:C values for their isoprene SOA; however, Li et al. (2015) produced isoprene SOA under similar conditions, and they measure an O:C of 0.8–1.0. After adjustment, the O:C of our representative isoprene SOA mixture is 1.1 (see the Supplement for details), and the AIOMFAC-VISC viscosity prediction for this mixture is shown in Fig. 7c. Here, the model slightly underpredicts the viscosity of isoprene SOA at high relative humidity and slightly overpredicts at low relative humidity. However, considering the combination of experimental error and model uncertainty, there is reasonable agreement between the AIOMFAC-VISC predictions and most data points. Overall, the model does a reasonable job of representing isoprene SOA in comparison to these experimental data sets.
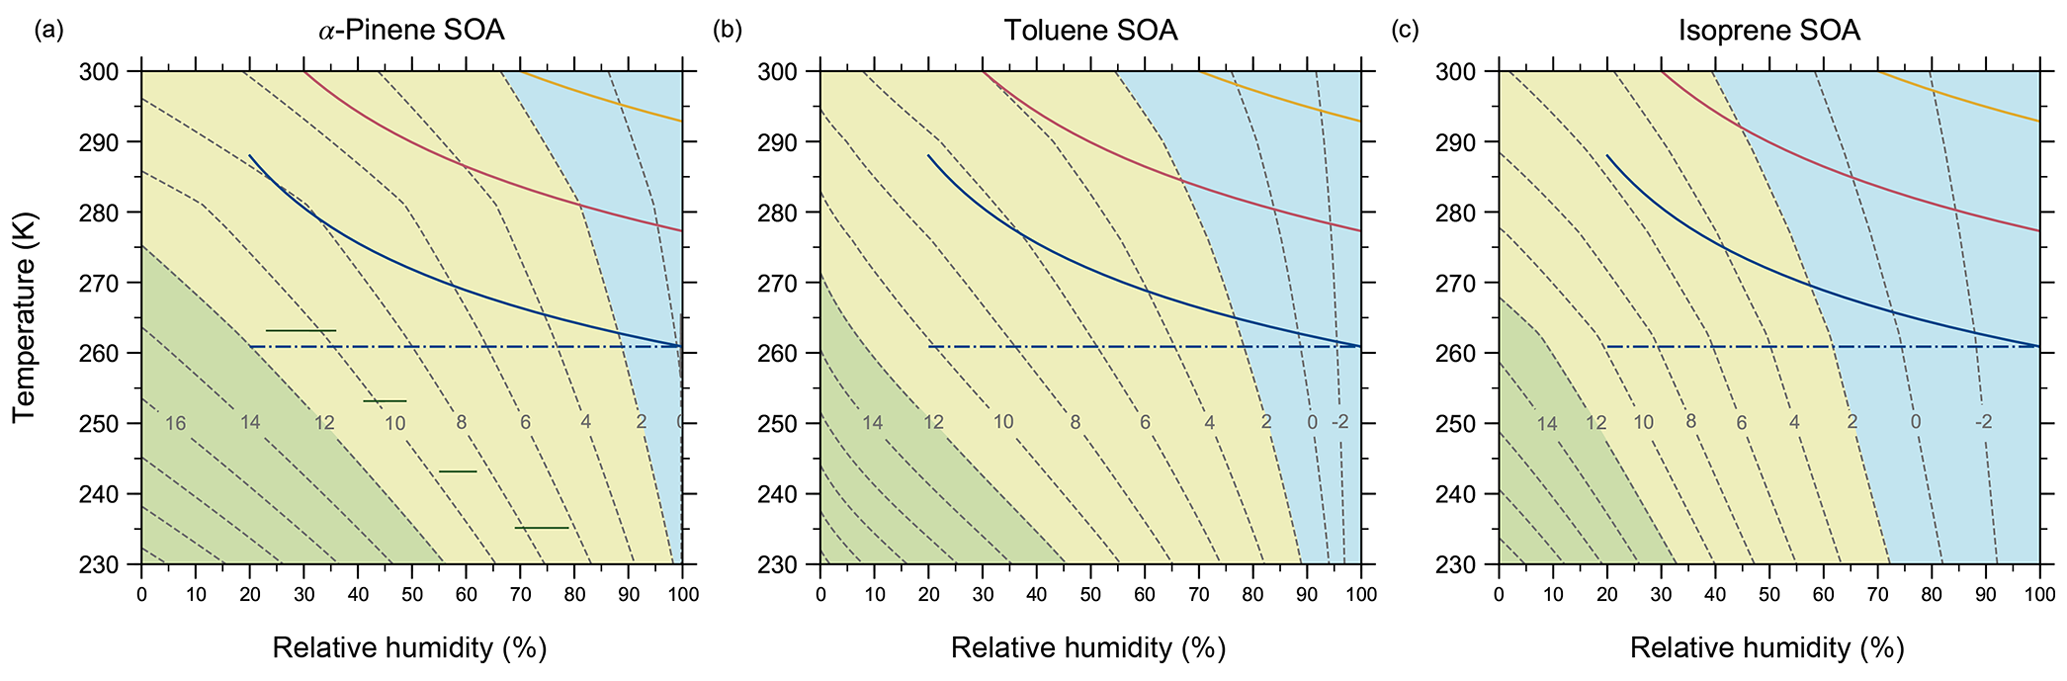
Figure 8Mixture viscosity predicted by AIOMFAC-VISC as a function of temperature and relative humidity for simulated (a) α-pinene SOA, (b) toluene SOA, and (c) isoprene SOA. Dashed contour lines denote the values of log 10(ηmix Pa s). Coloured regions indicate conventional, viscosity-based classifications of liquid (blue), semi-solid (yellow), and amorphous solid (green) physical states. The green horizontal lines in (a) denote ranges of RH and T for which Järvinen et al. (2016) measured a viscosity “phase” transition from solid or semi-solid to liquid in α-pinene SOA. They determined this viscosity transition to occur at ηmix=107 Pa s. The solid coloured lines indicate three trajectories in temperature versus RH space for an idealized adiabatic air parcel uplift containing SOA particles for different initial conditions. The assigned initial conditions are T=288 K, RH=20 % (blue); T=300 K, RH=30 % (pink); and T=300 K, RH=70 % (yellow). The dash-dotted blue line depicts the possible range of relative humidity experienced by SOA particles should they survive cloud processing and remain at their saturation altitude.
While SOAs reside largely in the planetary boundary layer (PBL) (Tsigaridis and Kanakidou, 2003), there are aircraft- (Heald et al., 2006) and ground-based measurements (Schum et al., 2018) of significant SOA concentrations in the free troposphere (FT). As such, we can expect SOA to be exposed to a wide range of temperature and relative humidity conditions. Shiraiwa et al. (2017) investigated the phase state of SOA for ambient temperature and relative humidity conditions for the PBL and the FT. Using a global chemistry climate model and estimating SOA phase state based on a glass transition temperature approach, they conclude that SOA phase state is largely dependent on relative humidity in the PBL. Their results showed SOAs exist mostly in the liquid state in the tropics and polar regions, while SOAs are in the semi-solid phase state in arid, continental regions. Shiraiwa et al. (2017) also predict that SOA would be almost entirely semi-solid and/or glassy in the FT.
The aforementioned work is also consistent with the results from Maclean et al. (2017) for the PBL. Maclean et al. (2017) used a parameterization of viscosity as a function of temperature and relative humidity based on experimental data for laboratory-generated α-pinene SOA. They found that the mixing times within α-pinene SOA particles were less than 1 h in the PBL, where SOA concentrations were most spatially and temporally significant, suggesting SOA would be mostly liquid or somewhat semi-solid.
Both Shiraiwa et al. (2017) and Maclean et al. (2017) consider the phase state of SOA strictly based on averaged ambient temperature and relative humidity conditions. In effect, this approach provides a snapshot of SOA phase state for a given location in the atmosphere, but it ignores the temperature and relative humidity changes the SOA particles are exposed to during transport. The snapshot approach may overestimate the significance of semi-solid and glassy SOA at higher tropospheric altitudes. Indeed, SOA transported from the PBL to the FT may be lifted in convective updrafts, in which they will experience a decrease in temperature but simultaneously an increase in relative humidity. Due to the plasticizing effect of water, initially viscous SOA carried in an updraft may transition from semi-solid to liquid and go on to activate as cloud condensation nuclei (CCN) or experience in-cloud scavenging. Alternatively, SOA may undergo some plasticizing in an updraft but remain viscous enough to avoid substantial cloud processing, depending on their CCN ability and whether cloud formation conditions are reached during transport. SOA may avoid such drastic temperature and relative humidity changes altogether if they meander to higher altitudes in slowly moving air masses. Of course, these scenarios are all contingent on the initial SOA viscosity and hygroscopicity and the extent of relative humidity increase the SOA experiences, which is linked to the type and duration of upward or downward transport. Ultimately, the history of the SOA is important for understanding the potential of viscous aerosol particles to act as ice nuclei or to be involved in long-range transport of pollutants.
To this end, we have used the AIOMFAC-VISC model to simulate the change in viscosity during an idealized adiabatic uplift of an air parcel containing α-pinene, toluene, or isoprene SOAs. In Fig. 8, we first compute the relationship between SOA viscosity, temperature, and relative humidity as predicted by the model. We note that the simulated SOA mixtures used to generate Fig. 8 are the same as those shown in Fig. 7. Comparing the three SOA cases investigated, α-pinene SOA is highly viscous for a larger area of the tropospherically relevant temperature–relative-humidity space than toluene or isoprene SOA, with the enhanced hygroscopicities of the latter contributing to their lower viscosity at higher temperatures and RH >60 %. Overlaid on the contour plots of Fig. 8 are three idealized adiabatic air parcel updrafts represented by their temperature and relative humidity relationship prior to cloud formation (i.e. for RH <100 %). Each updraft has a temperature lapse rate of 10 K km−1 and is assumed to start near 0 m above sea level, where the mean air pressure is 1000 hPa.
The three convective updrafts have different initial temperature and RH conditions, which are meant to represent different surface climates. Colder and rather dry surface conditions are represented by the blue curves, which have an initial temperature of 288 K and relative humidity of 20 %, where the lifting condensation level (RH =100 %) of the SOA-containing air parcel is ∼2712 m above sea level. These initial conditions are meant to mirror the ambient conditions of the field experiments done by Virtanen et al. (2010). By considering the conventional viscosity-based phase state classifications, the viscosity for all three SOAs in this simulation are initially semi-solid, but all transition to liquid at higher altitudes. If we consider that fragile organic compounds may transition to a glassy state at viscosities up to 4 orders of magnitude lower than 1012 Pa s, then the α-pinene SOA may be glassy just above the surface. In this case, the final altitude of the SOA before saturation suggests it can reach the free troposphere if we assume that the PBL does not extend beyond 1 km altitude, which may be a reasonable assumption for cold and dry regions during daytime.
The pink curves in Fig. 8 show relatively warm (300 K) and dry (30 % RH) surface conditions, meant to represent arid climates. Here the lifting condensation level of the parcel is reached at ∼2272 m altitude. Again, all three SOA types are semi-solid near the surface where the intermediate relative humidity level dominates over the warmer temperature concerning mixture viscosity. At higher altitudes, the transition from semi-solid to liquid occurs. In subtropical arid regions, we expect the PBL to extend to higher altitudes, so it is possible for SOA-containing updrafts to reach water saturation prior to entering the free troposphere. Finally, warm and wet climates are represented by the yellow curves with an initial temperature of 300 K and RH of 70 %, where the parcel altitude reached at 100 % RH is 717 m. In this case, none of the three SOA mixtures will have viscosities greater than that of a liquid, and they will experience water saturation within the PBL.
The initial conditions of the updrafts were chosen to demonstrate examples of mixture viscosity values we can expect for ambient SOA at equilibrium with their environment. This is to say that we do not expect to frequently see drier conditions at the surface than what is represented with the blue curves in Fig. 8. As a result, we can expect that SOAs carried adiabatically to higher altitudes have the potential to become highly viscous, but not necessarily glassy, before they experience their first cloud-processing event. After spending time in a cloud along their parcel trajectory, in the absence of wet removal via precipitation, such SOA particles (potentially cloud processed) may remain at similar altitude in the upper PBL or the FT and experience there conditions of lower RH (moving horizontally in the diagrams of Fig. 8), leading to evaporative loss of aerosol water accompanied by an increase in viscosity. Hence, while the aerosols may end up remaining for hours to days in the FT in a semi-solid or glassy viscosity range at lower temperatures, these particles may have experienced conditions of liquid-like viscosity and associated fast internal mixing and gas–aerosol exchange during certain times of their journey to the free troposphere.
The main product of this work is a new model, AIOMFAC-VISC, which predicts the viscosity of atmospherically relevant mixtures as a function of temperature, relative humidity, and mixture composition over a wide range of phase states. The model uses a thermodynamic group-contribution approach to predict mixture viscosity. The mixture viscosity prediction is constrained by parameterizations of the pure-component viscosity values of the individual mixture components. For water, we use a parameterization by Dehaoui et al. (2015). For the organic components, we use the method of DeRieux et al. (2018). Over the course of developing the model we found that the parameterization of the pure-component viscosity of the organic constituents is likely the largest source of uncertainty in the AIOMFAC-VISC predictions. This uncertainty arises from an underlying uncertainty in the prediction of pure-component glass transition temperatures and the choice of the fragility parameter.
We have assessed the validity of the AIOMFAC-VISC mixture viscosity predictions for binary as well as multicomponent aqueous mixtures, where the pure-component viscosities of the organics are well constrained by experimental data. In those cases we did not use the DeRieux et al. (2018) pure-component viscosity prediction method; instead, we supplied the mixing model with known pure-component viscosity values. By doing so, we demonstrate that AIOMFAC-VISC can predict mixture viscosity over a range of greater than 12 orders of magnitude (validated by data from to 109 Pa s). To further motivate the use of a complex mixing model, we compared the predictions of AIOMFAC-VISC to the predictions of several simple mixing rules. Of all simple mixing rules evaluated in this work, a mole-fraction-weighted scaling of the logarithms of pure-component viscosity values was shown to perform best and to be nearly as robust as AIOMFAC-VISC, particularly when the mixture viscosity varies by several orders of magnitude with composition. The mole-fraction-scaled mixing model is therefore a viable alternative when the application of a simple model is more practical. A quantitative comparison of both models revealed that, for the binary aqueous systems here, AIOMFAC-VISC outperforms the mole-fraction-scaled mixing model when the mixing models are supplied with pure-component viscosity values known from experiment or when well constrained by measurements at mixture compositions near the pure organic viscosity.
Using the DeRieux et al. (2018) pure-component viscosity prediction method can introduce a notable error in the predicted mixture viscosity. However, at present, the DeRieux et al. (2018) method is the most widely applicable and reliable way for the prediction of pure-component viscosities of multifunctional organics of atmospheric relevance. Ultimately, in order to fully realize the predictive power of the method, or any mixture viscosity prediction tool discussed here, the pure-component viscosity prediction will need to be improved.
At present, the improvement and new development of accurate, predictive pure-component viscosity models, targeting multifunctional compounds and the temperature range of interest in the context of atmospheric aerosols, suffers from a scarce amount of experimental data for model training and validation. This necessitates reliable measurements of pure-component viscosities and binary mixture viscosities across a wide temperature range for a variety of compounds. Such a comprehensive data set will be integral to developing more sophisticated pure-component viscosity models. While the use of models to estimate the glass transition temperatures of pure components offers predictive capabilities, this study, alongside previous work, shows that relatively large uncertainties are involved. The limitations appear both in the accuracy of the Tg estimates based on bulk elemental composition as well as the assumptions involved in the estimation of pure-component viscosity values derived from Tg-based models. Our evaluation of (i) pure-component viscosities derived from glass transition temperatures in comparison to (ii) direct viscosity measurements or estimates based on model extrapolation of fitted mixture viscosities to the pure-component limit suggests strongly that the commonly assumed viscosity of ∼1012 Pa s at the glass transition temperature remains a rough estimate of the glass transition viscosity of organic compounds. Pure-component viscosity values at a component's Tg of 1 or 2 orders of magnitude higher or lower than 1012 Pa s are indicated in certain cases.
Notwithstanding, the AIOMFAC-VISC mixture viscosity prediction alongside the DeRieux et al. (2018) pure-component viscosity prediction method is shown to be valid for SOA mixtures where the model can be compared to room temperature experimental data (α-pinene, toluene, and isoprene SOAs) and where adequate SOA surrogate mixtures can be established. Mixture viscosity was also simulated for relevant ranges in temperature (230–300 K) and relative humidity (0–100 %) to determine expected viscosity regimes for ambient SOA. The validity of the AIOMFAC-VISC prediction for SOA mixtures provides insight into the viscosity of SOA formed near the Earth's surface that are then transported to higher altitudes. By simulating an idealized adiabatic updraft, we determine that under most conditions α-pinene, toluene, and isoprene SOA will either be semi-solid or liquid close to the surface, but that an increase in relative humidity with upward transport will result in a transition to the liquid state. Only in the coldest and driest conditions can we expect SOA to approach a glassy state and remain semi-solid during transport into the free troposphere. In the lower troposphere at temperatures above 0 ∘C, given the slight-to-moderate hygroscopicity of SOA phases, our model predicts that such particles are typically semi-solid or liquid-like particles. Associated diffusion times for water are fast; however, the gas–particle equilibration time of organic compounds is on the order of seconds to minutes (Koop et al., 2011). While relatively fast, such viscosities may impact the interpretation of ground-based or aircraft aerosol measurements with instruments within which the aerosol sample experiences a residence time of the order of 10 s or less (Shingler et al., 2016).
The ability of AIOMFAC-VISC to provide mixture viscosity predictions for complex multicomponent mixtures is owing to the flexibility afforded by the group-contribution approach and the DeRieux et al. (2018) pure-component viscosity prediction method. While further investigation will be needed to refine the pure-component viscosity prediction, at present AIOMFAC-VISC is suitably robust to make predictions of SOA mixture viscosity from the liquid to the amorphous glassy regime. Future work will involve extending AIOMFAC-VISC to account for the effect of dissolved inorganic electrolyte components present in aerosol phases.
The source code of AIOMFAC-VISC is available as part of the AIOMFAC model code repository on GitHub (https://github.com/andizuend/AIOMFAC, Zuend and Gervasi, 2019). Data shown in the figures are provided in the Supplement. AIOMFAC-VISC predictions are also available as part of the AIOMFAC web model at https://aiomfac.lab.mcgill.ca (Zuend et al., 2012).
The supplement related to this article is available online at: https://doi.org/10.5194/acp-20-2987-2020-supplement.
AZ conceptualized the project and developed the methodology. NRG and AZ wrote the software. NRG established a database, analyzed the data, and created the visualizations. DOT provided the original data. NRG, AZ, and DOT co-wrote the paper.
The authors declare that they have no conflict of interest.
We thank Jonathan Reid, Manabu Shiraiwa, and Wing-Sy DeRieux for providing us with access to their data.
This research has been supported by the Fonds de recherche du Québec – Nature et technologies (FRQNT) (grant no. 2015-NC-181620), and the Natural Sciences and Engineering Research Council of Canada (NSERC) (grant no. RGPIN/04315-2014).
This paper was edited by Nga Lee Ng and reviewed by two anonymous referees.
Abramson, E., Imre, D., Beránek, J., Wilson, J., and Zelenyuk, A.: Experimental determination of chemical diffusion within secondary organic aerosol particles, Phys. Chem. Chem. Phys., 15, 2983, https://doi.org/10.1039/c2cp44013j, 2013. a
Angell, C.: Relaxation in liquids, polymers and plastic crystals – strong/fragile patterns and problems, J. Non-Cryst. Solids, 131, 13–31, https://doi.org/10.1016/0022-3093(91)90266-9, 1991. a, b, c
Angell, C.: Entropy and Fragility in Supercooling Liquids, J. Res. Natl. Inst. Stand. Technol., 102, 171, https://doi.org/10.6028/jres.102.013, 1997. a, b
Angell, C. A.: Formation of Glasses from Liquids and Biolymers, Adv. Sci., 267, 1924–1935, https://doi.org/10.1126/science.267.5206.1924, 1995. a
Angell, C. A., Bressel, R. D., Green, J. L., Kanno, H., Oguni, M., and Sare, E. J.: Liquid Fragility and the Glass Transition in Water and Aqueous Solutions, J. Food Eng., 102, 2627–2650, https://doi.org/10.1016/0260-8774(94)90028-0, 2002. a, b
Bateman, A. P., Bertram, A. K., and Martin, S. T.: Hygroscopic influence on the semisolid-to-liquid transition of secondary organic materials, J. Phys. Chem. A, 119, 4386–4395, https://doi.org/10.1021/jp508521c, 2015. a
Bateman, A. P., Gong, Z., Liu, P., Sato, B., Cirino, G., Zhang, Y., Artaxo, P., Bertram, A. K., Manzi, A. O., Rizzo, L. V., Souza, R. A., Zaveri, R. A., and Martin, S. T.: Sub-micrometre particulate matter is primarily in liquid form over Amazon rainforest, Nat. Geosci., 9, 34–37, https://doi.org/10.1038/ngeo2599, 2016. a
Berkemeier, T., Shiraiwa, M., Pöschl, U., and Koop, T.: Competition between water uptake and ice nucleation by glassy organic aerosol particles, Atmos. Chem. Phys., 14, 12513–12531, https://doi.org/10.5194/acp-14-12513-2014, 2014. a, b
Berkemeier, T., Steimer, S. S., Krieger, U. K., Peter, T., Pöschl, U., Ammann, M., and Shiraiwa, M.: Ozone uptake on glassy, semi-solid and liquid organic matter and the role of reactive oxygen intermediates in atmospheric aerosol chemistry, Phys. Chem. Chem. Phys., 18, 12662–12674, https://doi.org/10.1039/c6cp00634e, 2016. a
Bones, D. L., Reid, J. P., Lienhard, D. M., and Krieger, U. K.: Comparing the mechanism of water condensation and evaporation in glassy aerosol, P. Natl. Acad. Sci. USA, 109, 11613–11618, https://doi.org/10.1073/pnas.1200691109, 2012. a
Booth, A. M., Murphy, B., Riipinen, I., Percival, C. J., and Topping, D. O.: Connecting bulk viscosity measurements to kinetic limitations on attaining equilibrium for a model aerosol composition, Environ. Sci. Technol., 48, 9298–9305, https://doi.org/10.1021/es501705c, 2014. a, b
Bosse, D.: Diffusion, Viscosity, and Thermodynamics in Liquid Systems, Ph.D. thesis, available at: https://kluedo.ub.uni-kl.de/frontdoor/deliver/index/docId/1691/file/PhD-Bosse-published.pdf (6 March 2020), 2005. a, b, c, d
Cao, W., Knudsen, K., Fredenslund, A., and Rasmussen, P.: Group-Contribution Viscosity Predictions of Liquid Mixtures Using UNIFAC-VLE Parameters, Ind. Eng. Chem. Res., 32, 2088–2092, https://doi.org/10.1021/ie00021a034, 1993a. a, b, c, d
Cao, W., Knudsen, K., Fredenslund, A., and Rasmussen, P.: Simultaneous correlation of viscosity and vapor–liquid equilibrium data, Ind. Eng. Chem. Res., 32, 2077–2087, https://doi.org/10.1021/ie00021a033, 1993b. a
Cappa, C. D., Lovejoy, E. R., and Ravishankara, A. R.: Evidence for liquid-like and nonideal behavior of a SCIENCES, P. Natl. Acad. Sci. USA, 105, 18687–18691, 2008. a, b
Compernolle, S., Ceulemans, K., and Muller, J. F.: EVAPORATION: a new vapour pressure estimation methodfor organic molecules including non-additivity and intramolecular interactions, Atmos. Chem. Phys., 11, 9431–9450, https://doi.org/10.5194/acp-11-9431-2011, 2011. a
Debenedetti, P. G. and Stillinger, F. H.: Supercooled liquids and the glass transition, Nature, 410, 259–267, 2001. a, b, c
Dehaoui, A., Issenmann, B., and Caupin, F.: Viscosity of deeply supercooled water and its coupling to molecular diffusion, P. Natl. Acad. Sci. USA, 112, 12020–12025, https://doi.org/10.1073/pnas.1508996112, 2015. a, b, c, d, e, f
DeRieux, W.-S. W., Li, Y., Lin, P., Laskin, J., Laskin, A., Bertram, A. K., Nizkorodov, S. A., and Shiraiwa, M.: Predicting the glass transition temperature and viscosity of secondary organic material using molecular composition, Atmos. Chem. Phys., 18, 6331–6351, https://doi.org/10.5194/acp-18-6331-2018, 2018. a, b, c, d, e, f, g, h, i, j, k, l, m, n, o, p, q, r, s, t, u, v, w, x, y, z, aa, ab, ac, ad, ae, af, ag, ah
Dette, H. P., Qi, M., Schröder, D. C., Godt, A., and Koop, T.: Glass-forming properties of 3-methylbutane-1,2,3-tricarboxylic acid and its mixtures with water and pinonic acid, J. Phys. Chem. A, 118, 7024–7033, https://doi.org/10.1021/jp505910w, 2014. a
Ediger, M. D.: Spatially heterogeneous dynamics in supercooled liquids., Ann. Rev. Phys. Chem., 51, 99–128, https://doi.org/10.1146/annurev.physchem.51.1.99, 2000. a
Fowler, K., Connolly, P., and Topping, D.: Modelling the effect of condensed-phase diffusion on the homogeneous nucleation of ice in ultra-viscous particles, Atmos. Chem. Phys., 20, 683–698, https://doi.org/10.5194/acp-20-683-2020, 2020. a
Fredenslund, A., Jones, R. L., and Prausnitz, J. M.: Group-Contribution Estimation of Activity Coefficients in Nonideal Liquid Mixtures, AICHE J., 21, 1086–1099, 1975. a
Gorkowski, K., Preston, T. C., and Zuend, A.: Relative-humidity-dependent organic aerosol thermodynamics via an efficient reduced-complexity model, Atmos. Chem. Phys., 19, 13383–13407, https://doi.org/10.5194/acp-19-13383-2019, 2019. a
Grayson, J. W., Zhang, Y., Mutzel, A., Renbaum-Wolff, L., Böge, O., Kamal, S., Herrmann, H., Martin, S. T., and Bertram, A. K.: Effect of varying experimental conditions on the viscosity of α-pinene derived secondary organic material, Atmos. Chem. Phys., 16, 6027–6040, https://doi.org/10.5194/acp-16-6027-2016, 2016. a, b, c
Hansen, H. K., Rasmussen, P., Fredenslund, A., Schiller, M., and Gmehling, J.: Vapor–liquid-equilibria by UNIFAC group contribution. 5. Revision and extension, Ind. Eng. Chem. Res., 30, 2352–2355, 1991. a
Heald, C. L., Jacob, D. J., Turquety, S., Hudman, R. C., Weber, R. J., Sullivan, A. P., Peltier, R. E., Atlas, E. L., de Gouw, J. A., Warneke, C., Holloway, J. S., Neuman, A., Flocke, F. M., and Seinfeld, J. H.: Concentrations and sources of organic carbon aerosols in the free troposphere over North America, J. Geophys. Res.-Atmos., 111, 23–47, https://doi.org/10.1029/2005JD007705, 2006. a
Jagla, E. A.: Fragile-strong transitions and polyamorphism in glass forming fluids, Mol. Phys., 99, 753–757, https://doi.org/10.1080/00268970010030031, 2001. a
Järvinen, E., Ignatius, K., Nichman, L., Kristensen, T. B., Fuchs, C., Hoyle, C. R., Höppel, N., Corbin, J. C., Craven, J., Duplissy, J., Ehrhart, S., El Haddad, I., Frege, C., Gordon, H., Jokinen, T., Kallinger, P., Kirkby, J., Kiselev, A., Naumann, K. H., Petäjä, T., Pinterich, T., Prevot, A. S., Saathoff, H., Schiebel, T., Sengupta, K., Simon, M., Slowik, J. G., Tröstl, J., Virtanen, A., Vochezer, P., Vogt, S., Wagner, A. C., Wagner, R., Williamson, C., Winkler, P. M., Yan, C., Baltensperger, U., Donahue, N. M., Flagan, R. C., Gallagher, M., Hansel, A., Kulmala, M., Stratmann, F., Worsnop, D. R., Möhler, O., Leisner, T., and Schnaiter, M.: Observation of viscosity transition in α-pinene secondary organic aerosol, Atmos. Chem. Phys., 16, 4423–4438, https://doi.org/10.5194/acp-16-4423-2016, 2016. a
Jenkin, M. E., Saunders, S. M., and Pilling, M. J.: The tropospheric degradation of volatile organic compounds: A protocol for mechanism development, Atmos. Environ., 31, 81–104, https://doi.org/10.1016/S1352-2310(96)00105-7, 1997. a
Jenkin, M. E., Young, J. C., and Rickard, A. R.: The MCM v3.3.1 degradation scheme for isoprene, Atmos. Chem. Phys., 15, 11433–11459, https://doi.org/10.5194/acp-15-11433-2015, 2015. a
Knopf, D. A., Alpert, P. A., and Wang, B.: The Role of Organic Aerosol in Atmospheric Ice Nucleation: A Review, ACS Earth Space Chem., 2, 168–202, https://doi.org/10.1021/acsearthspacechem.7b00120, 2018. a, b
Koop, T., Bookhold, J., Shiraiwa, M., and Pöschl, U.: Glass transition and phase state of organic compounds: Dependency on molecular properties and implications for secondary organic aerosols in the atmosphere, Phys. Chem. Chem. Phys., 13, 19238–19255, https://doi.org/10.1039/C1CP22617G, 2011. a
La Nave, E., Stanley, H. E., and Sciortino, F.: Configuration Space Connectivity across the Fragile-to-Strong Transition in Silica, Phys. Rev. Lett., 88, 035501, https://doi.org/10.1103/PhysRevLett.88.035501, 2002. a
Li, Y. J., Liu, P., Gong, Z., Wang, Y., Bateman, A. P., Bergoend, C., Bertram, A. K., and Martin, S. T.: Chemical Reactivity and Liquid/Nonliquid States of Secondary Organic Material, Environ. Sci. Technol., 49, 13264–13274, https://doi.org/10.1021/acs.est.5b03392, 2015. a, b
Lienhard, D. M., Zobrist, B., Zuend, A., Krieger, U. K., and Peter, T.: Experimental evidence for excess entropy discontinuities in glass-forming solutions, J. Chem. Phys., 136, 74515, https://doi.org/10.1063/1.3685902, 2012. a
Lienhard, D. M., Huisman, A. J., Krieger, U. K., Rudich, Y., Marcolli, C., Luo, B. P., Bones, D. L., Reid, J. P., Lambe, A. T., Canagaratna, M. R., Davidovits, P., Onasch, T. B., Worsnop, D. R., Steimer, S. S., Koop, T., and Peter, T.: Viscous organic aerosol particles in the upper troposphere: Diffusivity-controlled water uptake and ice nucleation?, Atmos. Chem. Phys., 15, 13599–13613, https://doi.org/10.5194/acp-15-13599-2015, 2015. a
Liu, P., Li, Y. J., Wang, Y., Bateman, A. P., Zhang, Y., Gong, Z., Bertram, A. K., and Martin, S. T.: Highly Viscous States Affect the Browning of Atmospheric Organic Particulate Matter, ACS Central Sci., 4, 207–215, https://doi.org/10.1021/acscentsci.7b00452, 2018. a
Maclean, A. M., Butenhoff, C. L., Grayson, J. W., Barsanti, K., Jimenez, J. L., and Bertram, A. K.: Mixing times of organic molecules within secondary organic aerosol particles: A global planetary boundary layer perspective, Atmos. Chem. Phys., 17, 13037–13048, https://doi.org/10.5194/acp-17-13037-2017, 2017. a, b, c
Mallamace, F., Branca, C., Corsaro, C., Leone, N., Spooren, J., Chen, S.-H., and Stanley, H. E.: Transport properties of glass-forming liquids suggest that dynamic crossover temperature is as important as the glass transition temperature, P. Natl. Acad. Sci. USA, 107, 22457–22462, https://doi.org/10.1073/pnas.1015340107, 2010. a, b
Marsh, A., Petters, S. S., Rothfuss, N. E., Rovelli, G., Song, Y. C., Reid, J. P., and Petters, M. D.: Amorphous phase state diagrams and viscosity of ternary aqueous organic/organic and inorganic/organic mixtures, Phys. Chem. Chem. Phys., 20, 15086–15097, https://doi.org/10.1039/c8cp00760h, 2018. a
Marshall, F. H., Miles, R. E., Song, Y. C., Ohm, P. B., Power, R. M., Reid, J. P., and Dutcher, C. S.: Diffusion and reactivity in ultraviscous aerosol and the correlation with particle viscosity, Chem. Sci., 7, 1298–1308, https://doi.org/10.1039/c5sc03223g, 2016. a
Murray, B. J.: Inhibition of ice crystallisation in highly viscous aqueous organic acid droplets, Atmos. Chem. Phys., 8, 5423–5433, https://doi.org/10.5194/acp-8-5423-2008, 2008. a
Nannoolal, Y., Rarey, J., and Ramjugernath, D.: Estimation of pure component properties – Part 3. Estimation of the vapor pressure of non-electrolyte organic compounds via group contributions and group interactions, Fluid Phase Equilib., 269, 117–133, https://doi.org/10.1016/j.fluid.2008.04.020, 2008. a
Nannoolal, Y., Rarey, J., and Ramjugernath, D.: Estimation of pure component properties. Part 4: Estimation of the saturated liquid viscosity of non-electrolyte organic compounds via group contributions and group interactions, Fluid Phase Equilibr., 281, 97–119, https://doi.org/10.1016/j.fluid.2009.02.016, 2009. a, b, c
Novikov, V. N. and Sokolov, A. P.: Universality of the dynamic crossover in glass-forming liquids: A “magic” relaxation time, Phys. Rev. E, 67, 031507, https://doi.org/10.1103/PhysRevE.67.031507, 2003. a, b
Price, H. C., Mattsson, J., Zhang, Y., Bertram, A. K., Davies, J. F., Grayson, J. W., Martin, S. T., O'Sullivan, D., Reid, J. P., Rickards, A. M., and Murray, B. J.: Water diffusion in atmospherically relevant α-pinene secondary organic material, Chem. Sci., 6, 4876–4883, https://doi.org/10.1039/c5sc00685f, 2015. a, b
Rastak, N., Pajunoja, A., Acosta Navarro, J. C., Ma, J., Song, M., Partridge, D. G., Kirkevåg, A., Leong, Y., Hu, W. W., Taylor, N. F., Lambe, A., Cerully, K., Bougiatioti, A., Liu, P., Krejci, R., Petäjä, T., Percival, C., Davidovits, P., Worsnop, D. R., Ekman, A. M. L., Nenes, A., Martin, S., Jimenez, J. L., Collins, D. R., Topping, D. O., Bertram, A. K., Zuend, A., Virtanen, A., and Riipinen, I.: Microphysical explanation of the RH-dependent water affinity of biogenic organic aerosol and its importance for climate, Geophys. Res. Lett., 44, 5167–5177, https://doi.org/10.1002/2017GL073056, 2017. a
Reid, J. P., Bertram, A. K., Topping, D. O., Laskin, A., Martin, S. T., Petters, M. D., Pope, F. D., and Rovelli, G.: The viscosity of atmospherically relevant organic particles, Nat. Commun., 9, 956, https://doi.org/10.1038/s41467-018-03027-z, 2018. a, b
Renbaum-Wolff, L., Grayson, J. W., Bateman, A. P., Kuwata, M., Sellier, M., Murray, B. J., Shilling, J. E., Martin, S. T., and Bertram, A. K.: Viscosity of -pinene secondary organic material and implications for particle growth and reactivity, P. Natl. Acad. Sci. USA, 110, 8014–8019, https://doi.org/10.1073/pnas.1219548110, 2013. a, b, c, d, e, f, g
Rothfuss, N. E. and Petters, M. D.: Influence of Functional Groups on the Viscosity of Organic Aerosol, Environ. Sci. Technol., 51, 271–279, https://doi.org/10.1021/acs.est.6b04478, 2017. a
Rovelli, G., Song, Y. C., Maclean, A. M., Topping, D. O., Bertram, A. K., and Reid, J. P.: Comparison of Approaches for Measuring and Predicting the Viscosity of Ternary Component Aerosol Particles, Anal. Chem., 91, 5074–5082, https://doi.org/10.1021/acs.analchem.8b05353, 2019. a, b
Saika-Voivod, I., Sciortino, F., and Poole, P. H.: Free energy and configurational entropy of liquid silica: Fragile-to-strong crossover and polyamorphism, Phys. Rev. E, 69, 041503, https://doi.org/10.1103/PhysRevE.69.041503, 2004. a
Sastri, S. and Rao, K.: A new group contribution method for predicting viscosity of organic liquids, Chem. Eng. J., 50, 9–25, https://doi.org/10.1016/0300-9467(92)80002-R, 1992. a
Saukko, E., Lambe, A. T., Massoli, P., Koop, T., Wright, J. P., Croasdale, D. R., Pedernera, D. A., Onasch, T. B., Laaksonen, A., Davidovits, P., Worsnop, D. R., and Virtanen, A.: Humidity-dependent phase state of SOA particles from biogenic and anthropogenic precursors, Atmos. Chem. Phys., 12, 7517–7529, https://doi.org/10.5194/acp-12-7517-2012, 2012. a
Saunders, S. M., Jenkin, M. E., Derwent, R. G., and Pilling, M. J.: Protocol for the development of the Master Chemical Mechanism, MCM v3 (Part A): tropospheric degradation of non-aromatic volatile organic compounds, Atmos. Chem. Phys., 3, 161–180, https://doi.org/10.5194/acp-3-161-2003, 2003. a
Schum, S. K., Zhang, B., Dzepina, K., Fialho, P., Mazzoleni, C., and Mazzoleni, L. R.: Molecular and physical characteristics of aerosol at a remote free troposphere site: Implications for atmospheric aging, Atmos. Chem. Phys., 18, 14017–14036, https://doi.org/10.5194/acp-18-14017-2018, 2018. a, b
Shingler, T., Crosbie, E., Ortega, A., Shiraiwa, M., Zuend, A., Beyersdorf, A., Ziemba, L., Anderson, B., Thornhill, L., Perring, A. E., Schwarz, J. P., Campazano-Jost, P., Day, D. A., Jimenez, J. L., Hair, J. W., Mikoviny, T., Wisthaler, A., and Sorooshian, A.: Airborne characterization of subsaturated aerosol hygroscopicity and dry refractive index from the surface to 6.5 km during the SEAC4RS campaign, J. Geophys. Res.-Atmos., 121, 4188–4210, https://doi.org/10.1002/2015JD024498, 2016. a
Shiraiwa, M., Li, Y., Tsimpidi, A. P., Karydis, V. A., Berkemeier, T., Pandis, S. N., Lelieveld, J., Koop, T., and Pöschl, U.: Global distribution of particle phase state in atmospheric secondary organic aerosols, Nat. Commun., 8, 1–7, https://doi.org/10.1038/ncomms15002, 2017. a, b, c, d, e, f, g, h, i, j
Shrivastava, M., Cappa, C. D., Fan, J., Goldstein, A. H., Guenther, A. B., Jimenez, J. L., Kuang, C., Laskin, A., Martin, S. T., Ng, N. L., Petaja, T., Pierce, J. R., Rasch, P. J., Roldin, P., Seinfeld, J. H., Shilling, J., Smith, J. N., Thornton, J. A., Volkamer, R., Wang, J., Worsnop, D. R., Zaveri, R. A., Zelenyuk, A., and Zhang, Q.: Recent advances in understanding secondary organic aerosol: Implications for global climate forcing, Rev. Geophys., 55, 509–559, https://doi.org/10.1002/2016RG000540, 2017. a
Slade, J. H., Ault, A. P., Bui, A. T., Ditto, J. C., Lei, Z., Bondy, A. L., Olson, N. E., Cook, R. D., Desrochers, S. J., Harvey, R. M., Erickson, M. H., Wallace, H. W., Alvarez, S. L., Flynn, J. H., Boor, B. E., Petrucci, G. A., Gentner, D. R., Griffin, R. J., and Shepson, P. B.: Bouncier Particles at Night: Biogenic Secondary Organic Aerosol Chemistry and Sulfate Drive Diel Variations in the Aerosol Phase in a Mixed Forest, Environ. Sci. Technol., 53, 4977–4987, https://doi.org/10.1021/acs.est.8b07319, 2019. a
Song, M., Liu, P. F., Hanna, S. J., Li, Y. J., Martin, S. T., and Bertram, A. K.: Relative humidity-dependent viscosities of isoprene-derived secondary organic material and atmospheric implications for isoprene-dominant forests, Atmos. Chem. Phys., 15, 5145–5159, https://doi.org/10.5194/acp-15-5145-2015, 2015. a
Song, M., Liu, P. F., Hanna, S. J., Zaveri, R. A., Potter, K., You, Y., Martin, S. T., and Bertram, A. K.: Relative humidity-dependent viscosity of secondary organic material from toluene photo-oxidation and possible implications for organic particulate matter over megacities, Atmos. Chem. Phys., 16, 8817–8830, https://doi.org/10.5194/acp-16-8817-2016, 2016a. a, b, c
Song, Y. C., Haddrell, A. E., Bzdek, B. R., Reid, J. P., Bannan, T., Topping, D. O., Percival, C., and Cai, C.: Supporting information: Measurements and Predictions of Binary Component Aerosol Particle Viscosity, S1–S19, J. Phys. Chem. A, 120, 8123–8137, https://doi.org/10.1021/acs.jpca.6b07835, 2016b. a
Song, Y. C., Haddrell, A. E., Bzdek, B. R., Reid, J. P., Bannan, T., Topping, D. O., Percival, C., and Cai, C.: Measurements and Predictions of Binary Component Aerosol Particle Viscosity, J. Phys. Chem. A, 120, 8123–8137, https://doi.org/10.1021/acs.jpca.6b07835, 2016c. a
Topping, D., Barley, M., Bane, M. K., Higham, N., Aumont, B., Dingle, N., and McFiggans, G.: UManSysProp v1.0: an online and open-source facility for molecular property prediction and atmospheric aerosol calculations, Geosci. Model Dev., 9, 899–914, https://doi.org/10.5194/gmd-9-899-2016, 2016. a
Tsigaridis, K. and Kanakidou, M.: Global modelling of secondary organic aerosol in the troposphere: A sensitivity analysis, Atmos. Chem. Phys., 3, 1849–1869, https://doi.org/10.5194/acp-3-1849-2003, 2003. a
Virtanen, A., Joutsensaari, J., Koop, T., Kannosto, J., Yli-Pirilä, P., Leskinen, J., Mäkelä, J. M., Holopainen, J. K., Pöschl, U., Kulmala, M., Worsnop, D. R., and Laaksonen, A.: An amorphous solid state of biogenic secondary organic aerosol particles, Nature, 467, 824–827, https://doi.org/10.1038/nature09455, 2010. a, b, c
Ye, Q., Robinson, E. S., Ding, X., Ye, P., Sullivan, R. C., and Donahue, N. M.: Mixing of secondary organic aerosols versus relative humidity, P. Natl. Acad. Sci. USA, 113, 12649–12654, https://doi.org/10.1073/pnas.1604536113, 2016. a
Zelenyuk, A., Imre, D. G., Wilson, J., Bell, D. M., Suski, K. J., Shrivastava, M., Beránek, J., Alexander, M. L., Kramer, A. L., and Massey Simonich, S. L.: The effect of gas-phase polycyclic aromatic hydrocarbons on the formation and properties of biogenic secondary organic aerosol particles, Faraday Discuss., 200, 143–164, https://doi.org/10.1039/c7fd00032d, 2017. a, b
Zhang, Y., Sanchez, M. S., Douet, C., Wang, Y., Bateman, A. P., Gong, Z., Kuwata, M., Renbaum-Wolff, L., Sato, B. B., Liu, P. F., Bertram, A. K., Geiger, F. M., and Martin, S. T.: Changing shapes and implied viscosities of suspended submicron particles, Atmos. Chem. Phys., 15, 7819–7829, https://doi.org/10.5194/acp-15-7819-2015, 2015. a
Zhou, S., Hwang, B. C. H., Lakey, P. S. J., Zuend, A., Abbatt, J. P. D., and Shiraiwa, M.: Multiphase reactivity of polycyclic aromatic hydrocarbons is driven by phase separation and diffusion limitations, P. Natl. Acad. Sci. USA, 116, 11658, https://doi.org/10.1073/pnas.1902517116, 2019. a
Zobrist, B., Marcolli, C., Pedernera, D. A., and Koop, T.: Do atmospheric aerosols form glasses?, Atmos. Chem. Phys., 8, 5221–5244, https://doi.org/10.5194/acp-8-5221-2008, 2008. a, b
Zuend, A. and Gervasi, N. R.: AIOMFAC-web v2.31 – Public model code repository, available at: https://github.com/andizuend/AIOMFAC (last access: 6 March 2020), 2019. a
Zuend, A. and Seinfeld, J. H.: Modeling the gas-particle partitioning of secondary organic aerosol: The importance of liquid-liquid phase separation, Atmos. Chem. Phys., 12, 3857–3882, https://doi.org/10.5194/acp-12-3857-2012, 2012. a, b
Zuend, A., Marcolli, C., Luo, B. P., and Peter, T.: A thermodynamic model of mixed organic-inorganic aerosols to predict activity coefficients, Atmos. Chem. Phys., 8, 4559–4593, https://doi.org/10.5194/acp-8-4559-2008, 2008. a, b, c
Zuend, A., Marcolli, C., Booth, A. M., Lienhard, D. M., Soonsin, V., Krieger, U. K., Topping, D. O., McFiggans, G., Peter, T., and Seinfeld, J. H.: New and extended parameterization of the thermodynamic model AIOMFAC: Calculation of activity coefficients for organic-inorganic mixtures containing carboxyl, hydroxyl, carbonyl, ether, ester, alkenyl, alkyl, and aromatic functional groups, Atmos. Chem. Phys., 11, 9155–9206, https://doi.org/10.5194/acp-11-9155-2011, 2011. a
Zuend, A., Levac, N., and Seinfeld, J. H.: AIOMFAC-web website and online model, available at: https://aiomfac.lab.mcgill.ca/index.html (last access: 6 March 2020), 2012. a