the Creative Commons Attribution 4.0 License.
the Creative Commons Attribution 4.0 License.
 | 05 Nov 2020
Detection and attribution of wildfire pollution in the Arctic and northern midlatitudes using a network of Fourier-transform infrared spectrometers and GEOS-Chem
Kimberly Strong
Dylan B. A. Jones
Thomas Blumenstock
Stephanie Conway
Jenny A. Fisher
James W. Hannigan
Frank Hase
Yasuko Kasai
Emmanuel Mahieu
Maria Makarova
Isamu Morino
Tomoo Nagahama
Justus Notholt
Ivan Ortega
Mathias Palm
Anatoly V. Poberovskii
Ralf Sussmann
Thorsten Warneke
We present a multiyear time series of column abundances of carbon monoxide (CO), hydrogen cyanide (HCN), and ethane (C2H6) measured using Fourier-transform infrared (FTIR) spectrometers at 10 sites affiliated with the Network for the Detection of Atmospheric Composition Change (NDACC). Six are high-latitude sites: Eureka, Ny-Ålesund, Thule, Kiruna, Poker Flat, and St. Petersburg, and four are midlatitude sites: Zugspitze, Jungfraujoch, Toronto, and Rikubetsu. For each site, the interannual trends and seasonal variabilities of the CO time series are accounted for, allowing background column amounts to be determined. Enhancements above the seasonal background were used to identify possible wildfire pollution events. Since the abundance of each trace gas emitted in a wildfire event is specific to the type of vegetation burned and the burning phase, correlations of CO to the long-lived wildfire tracers HCN and C2H6 allow for further confirmation of the detection of wildfire pollution. A GEOS-Chem tagged CO simulation with Global Fire Assimilation System (GFASv1.2) biomass burning emissions was used to determine the source attribution of CO concentrations at each site from 2003 to 2018. For each detected wildfire pollution event, FLEXPART back-trajectory simulations were performed to determine the transport times of the smoke plume. Accounting for the loss of each species during transport, the enhancement ratios of HCN and C2H6 with respect to CO were converted to emission ratios. We report mean emission ratios with respect to CO for HCN and C2H6 of 0.0047 and 0.0092, respectively, with a standard deviation of 0.0014 and 0.0046, respectively, determined from 23 boreal North American wildfire events. Similarly, we report mean emission ratios for HCN and C2H6 of 0.0049 and 0.0100, respectively, with a standard deviation of 0.0025 and 0.0042, respectively, determined from 39 boreal Asian wildfire events. The agreement of our emission ratios with literature values illustrates the capability of ground-based FTIR measurements to quantify biomass burning emissions. We provide a comprehensive dataset that quantifies HCN and C2H6 emission ratios from 62 wildfire pollution events. Our dataset provides novel emission ratio estimates, which are sparsely available in the published literature, particularly for boreal Asian sources.
- Article
(12013 KB) - Full-text XML
- BibTeX
- EndNote


The Arctic is a major receptor for pollution from midlatitude regions (Stohl et al., 2006; Law and Stohl, 2007; Shindell et al., 2008). Boreal wildfires are well known to have considerable impacts on the Arctic atmosphere and climate (Amiro et al., 2009; Warneke et al., 2009). In the Northern Hemisphere, boreal wildfires are a dominant source of particulate and trace gas emissions, brought on by persistent warm and dry conditions resulting in increased fire risk and ignition from lightning. Periods of both greater fire risk and lightning activity are expected to occur with increasing frequency at northern high latitudes as a result of anthropogenically induced climate change (Krause et al., 2014; Veraverbeke et al., 2017). The magnitude and intensity of boreal wildfire activity are also projected to increase with future climate change (Amiro et al., 2009; Westerling et al., 2006; Flannigan et al., 2009; Wotton et al., 2010; Boulanger et al., 2014).
Boreal wildfires contribute to the emission of a large number of reactive trace gas species, including volatile organic compounds (VOCs), which promote the production of tropospheric ozone (O3) and the formation of aerosols (Jaffe et al., 1999, 2004; Parrington et al., 2013; Wentworth et al., 2018) and therefore negatively impact air quality. Emissions of these species remain highly uncertain as a result of the dependence of emissions on fuel types and combustion conditions (Andreae and Merlet, 2001; Akagi et al., 2011; Andreae, 2019); emissions from a particular event are strongly influenced by local meteorology, which has a direct influence on the burning phase and the emission of each species (Yokelson et al., 1996, 1999, 2003; Goode et al., 1999, 2000). Additionally, these reactive species may have lifetimes that range from days to weeks, which may be long enough for them to undergo long-range transport to the Arctic. Furthermore, these species may have secondary sources within a smoke plume, while the injection of a smoke plume into the free troposphere may further extend their lifetime. Therefore it is necessary to measure the concentrations of these reactive trace gas species downwind in order to predict their influence on a global scale.
Quantifying the influence of biomass burning on the Arctic atmosphere requires long-term dedicated measurements of the transported emissions in the Arctic. The Arctic is a difficult region to study as a result of the lack of dedicated measurement stations. Ground-based solar-absorption Fourier-transform infrared (FTIR) spectrometers have proven to be a useful tool for quantifying trace species abundances. The Network for the Detection of Atmospheric Composition Change (NDACC; http://www.ndacc.org, last access: 18 May 2020; De Mazière et al., 2018) provides a global network of FTIR instruments that routinely measure the biomass burning tracers CO, hydrogen cyanide (HCN), and ethane (C2H6), in addition to a multitude of other trace gas species. The FTIR instruments of NDACC have previously been utilized to study biomass burning emissions. Zhao et al. (1997, 2000, 2002) identified Asian and Siberian biomass burning sources as a major contribution to the measured concentrations of CO, HCN, and C2H6 from ground-based FTIR measurements in Rikubetsu (43∘ N, 143∘ E), Japan. Paton-Walsh et al. (2004, 2005, 2010) used solar-absorption FTIR measurements in Australia (Darwin, 34∘ S, 150∘ E; Wollongong, 34∘ S, 150∘ E) to quantify emissions of various trace gas species from Australian wildfires. Vigouroux et al. (2012) examined the influence of biomass burning in southern Africa and Madagascar on FTIR measurements of HCN, C2H6, acetylene (C2H2), methanol (CH3OH), and formic acid (HCOOH) at Réunion (21∘ S, 55∘ E) located in the Indian Ocean.
More recently, FTIR measurements in the Arctic have proven to be particularly useful, providing observational coverage of trace gas species where measurements from other platforms are scarce or nonexistent. Viatte et al. (2013) identified enhancements of CO, HCN, and C2H6 in FTIR measurements at Eureka (80∘ N, 86∘ W), Canada, that were attributed to the 2010 Russian wildfires. A subsequent study by Viatte et al. (2014) demonstrated the utility of FTIR spectrometry in measuring the biomass burning species acetylene (C2H2), methanol (CH3OH), formic acid (HCOOH), and formaldehyde (H2CO) at Eureka. Analogous retrievals of these species were also performed for measurements from a second high-Arctic site at Thule (77∘ N, 69∘ W), Greenland, and emission ratios and emissions factors were derived for these species from FTIR measurements at both Thule and Eureka by Viatte et al. (2015). Measurements of ammonia (NH3) by solar-absorption FTIR spectrometry was first demonstrated by Paton-Walsh et al. (2004) and later by Dammers et al. (2015). Lutsch et al. (2016) provided the first measurements of NH3 in the high Arctic and determined emission ratios and emission factors for the 2014 Northwest Territories wildfires of Canada. The contribution of 2017 Canadian wildfires to NH3 in the Arctic was examined using FTIR measurements at Eureka and Thule by Lutsch et al. (2019). The results of these studies highlight the ability of FTIR spectrometry to measure a number of trace gas species, many of which are difficult to assess using satellite-based or other platforms. Furthermore, the ability of ground-based FTIR instruments to measure a variety of trace gas species over a long-term time period is particularly useful in order to investigate composition of transported wildfire plumes.
These previous studies have illustrated the ability of FTIR measurements to quantify biomass burning emissions by determining the emission ratios and emission factors of various trace gas species. Accurate emission ratios and emission factors are required to simulate biomass burning in chemical transport models; however, previously reported values are highly variable (Andreae and Merlet, 2001; Akagi et al., 2011; Andreae, 2019, and the references therein) as a result of the natural variability of emissions as well as possible discrepancies in sampling methods.
Each of these previously mentioned FTIR studies have only considered individual events or events that occurred in a short time series. Measurements using FTIR spectrometry have been routinely made since the mid-1980s (Zander et al., 2008), and the number of measurement sites has increased since the inception of the Network for the Detection of Stratospheric Change (NDSC; Kurylo, 1991) in 1991, which has been formally known as NDACC since 2005 (De Mazière et al., 2018). Several global FTIR sites have been measuring the biomass burning tracers CO, HCN, and C2H6 over the last 2 decades. Yurganov (2004) identified enhanced CO columns in 1998 using FTIR measurements at several northern midlatitude to high-latitude NDACC FTIR sites from 1996 to 2002. The 1998 CO anomaly was attributed to Siberian wildfires. A similar study by Yurganov et al. (2005) examined the 2002 and 2003 CO anomalies from Siberian wildfires using satellite-based, in situ, and FTIR measurements in the Northern Hemisphere. Currently, no study has explicitly examined the long-term and interannual variability of biomass burning species using FTIR measurements.
In this paper, the influence of wildfires on atmospheric composition from 2003 to 2018 is examined using FTIR measurements of multiple trace gas species from three high-Arctic NDACC sites: Eureka, Canada; Ny-Ålesund, Norway; and Thule, Greenland. Three Arctic sites are also included: Kiruna, Sweden; Poker Flat, Alaska; and St. Petersburg, Russia. Additional measurements are obtained at four midlatitude sites: Zugspitze, Germany; Jungfraujoch, Switzerland; Toronto, Canada; and Rikubetsu, Japan. Potential wildfire pollution events are first identified in the CO time series at each site through the detection of anomalous enhancements of CO. For the CO enhancements detected at each site, enhancement ratios of HCN and C2H6 with respect to CO are calculated. Since CO, HCN, and C2H6 are co-emitted from biomass burning sources, a linear correlation for the enhancement ratios of HCN and C2H6 indicates wildfire pollution events. The detection of wildfire pollution at each site was further confirmed using total aerosol optical depth (AOD) measurements from adjacent AERONET (Aerosol Robotic Network) sites. A GEOS-Chem tagged CO simulation from 2003 to 2018 was performed to identify the source attribution for the detected events at each FTIR site in addition to quantifying the contribution to CO from various biomass burning source regions.
This paper quantifies the impact of more than 60 detected wildfire events, on six Arctic sites and four midlatitude sites using FTIR measurements of multiple trace gas species. In addition to replicating published emissions ratios, we provide, for the first time, a comprehensive set of emission ratios for HCN and C2H6 across multiple wildfire events. The reported emission ratios comport with published values, demonstrating the ability of FTIR spectrometry to capture wildfire plumes, as well as provide much needed longer-term estimates of emissions ratios and their variability. Furthermore, we identify and characterize the contribution of biomass burning to CO measurements specifically at each FTIR site.
The structure of this paper is summarized as follows. Section 2.1–2.4 provides an overview of each FTIR site, the GEOS-Chem tagged CO simulation, AERONET data, and FLEXPART model used in the this study. Section 2.5 describes the methods used to detect wildfire pollution events in the FTIR time series. A comparison of the GEOS-Chem model to FTIR measurements is provided in Sect. 3.2. The retrieved FTIR products for CO, HCN, and C2H6 are presented in Sect. 3.1, and the detected wildfire pollution events at each FTIR site are presented in Sect. 3.3. In Sect. 4.1, the calculated emission ratios are discussed, while in Sect. 4.2, a description of the wildfire contribution to CO measurements at each site is provided. The conclusions and summary of this study are highlighted in Sect. 5.
2.1 FTIR sites and retrievals
The NDACC FTIR sites included in this study were selected to provide coverage of high-latitude and midlatitude regions and are listed in Table 1. Due to the broad spectral range measured at high resolution, typically from 700 to 4400 cm−1 at 0.0035 cm−1 resolution, a multitude of trace gas species may be retrieved from solar-absorption FTIR measurements. Measurements of CO, HCN, and C2H6, all of which are standard products of the NDACC Infrared Working Group (IRWG), are the focus of this study. Retrievals of each species were performed by processing solar-absorption spectra using the SFIT4 (https://wiki.ucar.edu/display/sfit4/, last access: 18 May 2020) or PROFITT9 (Hase et al., 2004, for Kiruna and Zugspitze) retrieval algorithm which use the optimal estimation method (Rodgers, 2000) to obtain volume mixing ratio (VMR) profiles and integrated column abundances by iteratively adjusting VMR profiles to minimize the difference between the measured and calculated spectra (Pougatchev et al., 1995; Rinsland et al., 1998). Further details of the instrumentation and retrievals for each FTIR site are given in the references listed in Table 1.
Batchelor et al. (2009); Lutsch et al. (2016, 2019)Viatte et al. (2013, 2014, 2015)Saha et al. (2010); O'Neill et al. (2012)Notholt et al. (1997a, b, 2000)Rozwadowska et al. (2010)Hannigan et al. (2009); Viatte et al. (2015)Lutsch et al. (2019)Tomasi et al. (2015)Blumenstock et al. (1997, 2009)Rodríguez et al. (2012)Kasai et al. (2005a, b)Eck et al. (2009)Makarova et al. (2011); Timofeyev et al. (2016)Arola et al. (2007)Sussmann and Schäfer (1997)Sussmann and Buchwitz (2005)Gubler et al. (2012)Mahieu et al. (1997); Zander et al. (2008)Gubler et al. (2012)Wiacek et al. (2007); Whaley et al. (2015)Lutsch et al. (2016)Sioris et al. (2017)Zhao et al. (1997, 2000, 2002)Makar et al. (2018)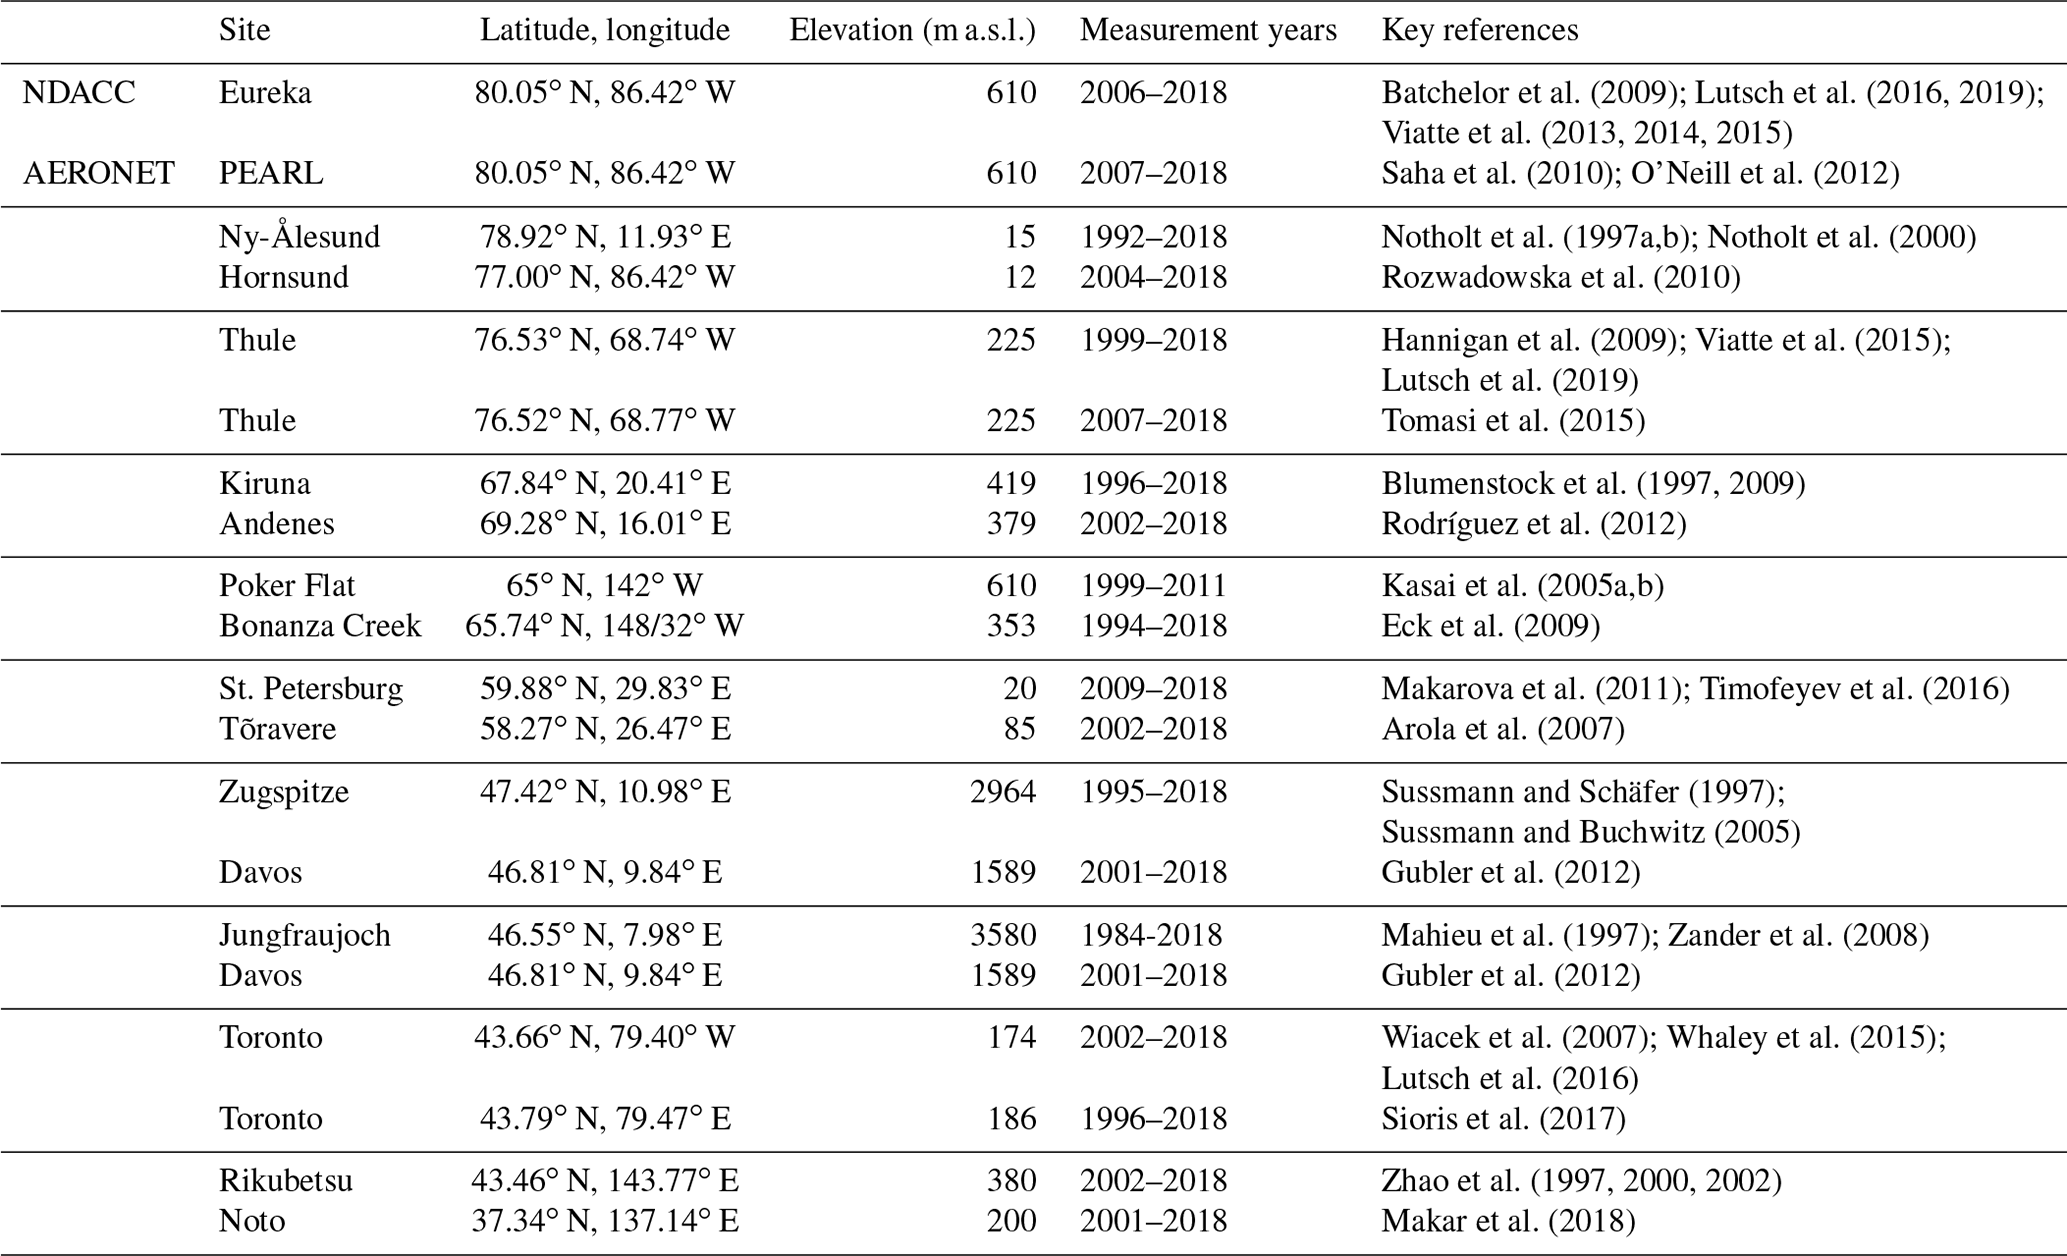
2.1.1 High-Arctic sites
The highest-latitude FTIR site of NDACC is Eureka, located on Ellesmere Island in the Canadian Archipelago. It has been shown in previous studies that Eureka is regularly influenced by the transport of boreal wildfire emissions from North America and Asia (Viatte et al., 2013, 2014, 2015; Lutsch et al., 2016, 2019). Located approximately 500 km from Eureka is the site Thule on the northwest coast of Greenland, which provides complementary measurements to Eureka as wildfire pollution events detected at Eureka are generally also observed in measurements at Thule (Viatte et al., 2015; Lutsch et al., 2019). Ny-Ålesund in Spitsbergen, Norway, is the second highest-latitude FTIR site of NDACC. Ny-Ålesund is isolated from the direct influence of anthropogenic and wildfire emissions, but it is affected by the long-range transport of pollution originating from Northern Hemisphere midlatitudes. For the purposes of this study, Eureka, Ny-Ålesund, and Thule will be referred to as the “clean” high-Arctic (>75∘ N) sites because they are free of local pollution sources.
2.1.2 Arctic sites
The Arctic sites are defined as those located between 60 and 75∘ N and include Poker Flat, Alaska; Kiruna, Sweden; and St. Petersburg, Russia. Poker Flat is strongly influenced by the transport of anthropogenic pollution from Siberia and Asia (Kasai et al., 2005b). Asian anthropogenic emissions have been found to be a predominant source of pollution in Alaska, with a greater influence in years with strong El Niño conditions (Fisher et al., 2010). Siberian wildfires are a substantial source of summertime pollution in Alaska (Jaffe et al., 2004; Warneke et al., 2009) in addition to local wildfires within the boreal forests of Alaska. It should be noted that for this reason, and the dependence of FTIR measurements on clear-sky conditions, smoke plumes within Alaska may prevent measurements by FTIR spectrometers. As a result, summertime measurements at Poker Flat can be sparse.
Kiruna is mainly influenced by anthropogenic emissions from midlatitude Europe; however, aerosol smoke layers from injection of Canadian wildfire emissions into the lower stratosphere have been identified in the past at Kiruna (Fromm et al., 2000). Similarly, the urban site of St. Petersburg would be most sensitive to local sources within Europe. Both Kiruna and St. Petersburg may sample the long-range transport of boreal Asian plumes that could circle the Northern Hemisphere (Damoah et al., 2004), although such plumes would be well aged and diluted. Through injection of wildfire emissions into the upper troposphere and lower stratosphere, North American boreal wildfire plumes may be efficiently transported to Europe (Khaykin et al., 2018; Hu et al., 2019). Although the effects of the long-range transport of wildfire emissions on air quality are likely to be minimal, they can have an influence on tropospheric composition of long-lived species.
2.1.3 Alpine sites
Both Zugspitze and Jungfraujoch are considered clean Alpine sites, isolated from local pollution sources, and therefore provide measurements that are representative of background concentrations of central Europe (Franco et al., 2015). For the purpose of this study, as the result of the close proximity between the two sites (∼200 km), Zugspitze and Jungfraujoch are considered to be complementary to one another. Differences in measured column amounts between the two sites as a result of long-range transport are likely due to their altitude differences, 2964 and 3580 m a.s.l. for Zugspitze and Jungfraujoch, respectively. It has been previously shown that Zugspitze is weakly influenced by nearby pollution sources, while Jungfraujoch is considered a remote site, mainly influenced by long-range transport (Henne et al., 2010). However, as a result of the high altitudes of these sites, the measured composition is largely driven by long-range transport in the middle to upper troposphere.
2.1.4 Midlatitude sites
Toronto, an urban site, is most sensitive to local pollution sources in southeast Canada and the United States (Whaley et al., 2015) and periodically subject to wildfire pollution episodes as demonstrated by Griffin et al. (2013) and Whaley et al. (2015). Rikubetsu, located in Hokkaido, Japan, is free of considerable local anthropogenic pollution sources, with contributions of CO mainly due to transported Asian anthropogenic emissions (Zhao et al., 2000). In the summertime, Rikubetsu is influenced by the transport of biomass burning pollution from within Asia (Li et al., 2000), while the region of Hokkaido is often affected by pollution episodes from Siberian wildfires of boreal Asia (Jeong et al., 2008; Tanimoto et al., 2000; Yasunari et al., 2018).
2.2 GEOS-Chem
To interpret the influence of anthropogenic, chemical, and biomass burning sources on CO columns at each FTIR site, the GEOS-Chem chemical transport model is used (http://geos-chem.org/, last access: 18 May 2020; Bey et al., 2001b) in a tagged simulation of CO at a horizontal resolution of 22.5∘ with 47 vertical hybrid levels. GEOS-Chem version 12.1.1 (The International GEOS-Chem User Community, 2018) was used and driven by global meteorological inputs from MERRA-2 (Modern-Era Retrospective Analysis for Research and Applications, Version 2; Gelaro et al., 2017) from the NASA Global Modeling and Assimilation Office (GMAO). MERRA-2 is produced with the GMAO/GEOS-5 (Goddard Earth Observing System) Data Assimilation System Version 5.12.4. The GEOS-Chem simulation was initialized with a 1-year spin-up from 1 January 2002 to 1 January 2003. Chemical and transport operator time steps of 1 h and 10 min, respectively, were used.
Biomass burning emissions are from GFASv1.2 (Global Fire Assimilation System, Kaiser et al., 2012; Giuseppe et al., 2018), which assimilates Moderate Resolution Imaging Spectroradiometer (MODIS) burned area and fire radiative power (FRP) products to estimate emissions for open fires. GFASv1.2 emissions have a horizontal resolution with daily temporal resolution. GFAS was chosen for the availability of emissions over the analysis period from 2003 to 2018. Global anthropogenic emissions are provided from the EDGARv4.3.1 (Emission Database for Global Atmospheric Research, Crippa et al., 2016) emissions inventory, overwritten by regional emission inventories in the Northern Hemisphere as described in Fisher et al. (2010). Biogenic emissions of precursor VOCs are from the Model of Emissions of Gases and Aerosols from Nature (MEGANv2.1; Guenther et al., 2012), and biofuel emissions are taken from Yevich and Logan (2003).
The main loss mechanism for CO is from photochemical oxidation by the hydroxyl radical (OH). The OH fields are prescribed in the tagged CO simulation and were obtained from the TransCom experiment (Patra et al., 2011) which implements semiempirically calculated tropospheric OH concentrations from Spivakovsky et al. (2000) to reduce the high bias of OH from the GEOS-Chem full-chemistry simulation (Shindell et al., 2006). Surface emissions in GEOS-Chem are released within the boundary layer, and boundary layer mixing is implemented using the nonlocal mixing scheme of Holtslag and Boville (1993). Biomass emissions are released by uniformly distributing emissions from the surface to the mean altitude of maximum injection based on the injection height information as described in Rémy et al. (2017), which includes an injection height parameterization by Sofiev et al. (2012) and a plume rise model by Freitas et al. (2007).
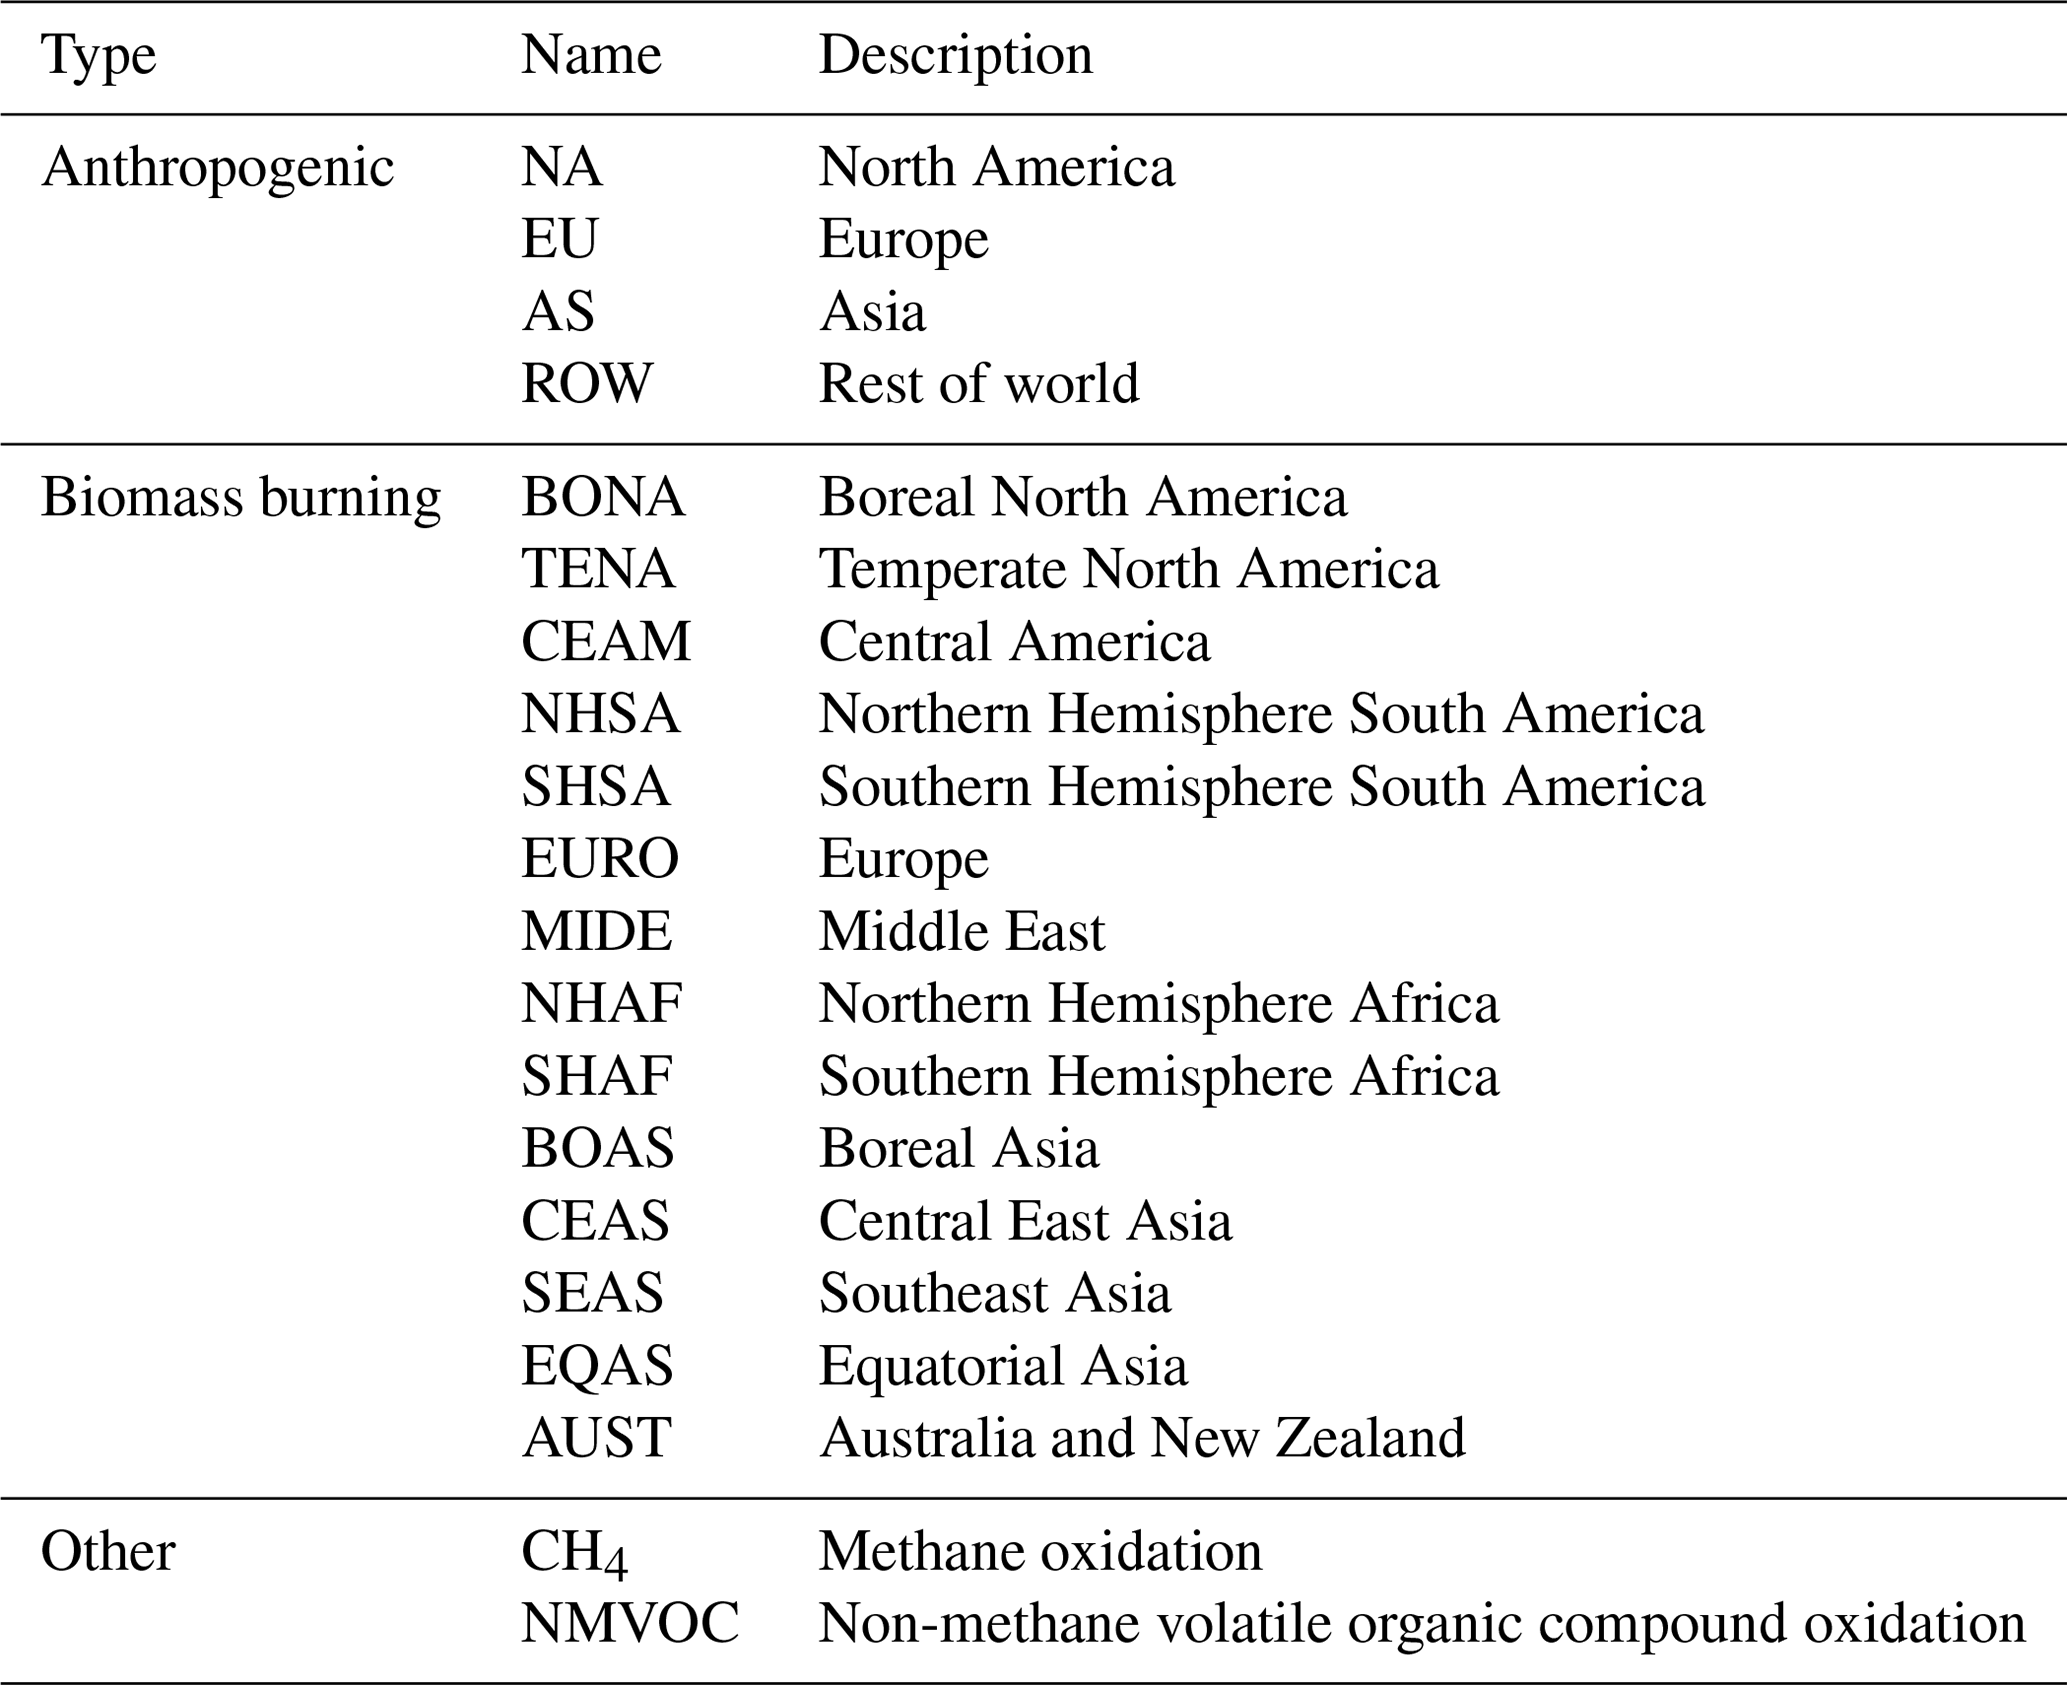
The GEOS-Chem version 12.1.1 tagged CO simulation includes the improved secondary CO production scheme of Fisher et al. (2017), which assumes production rates of CO from CH4 and nonmethane volatile organic compound (NMVOC) oxidation from a GEOS-Chem full-chemistry simulation, therefore reducing the mismatch between the CO-only simulation and the full-chemistry simulation. The anthropogenic source regions are shown in Fig. 1, while biomass burning source regions are implemented following the standard GFED (Giglio et al., 2013) regions and are also shown in Fig. 1.
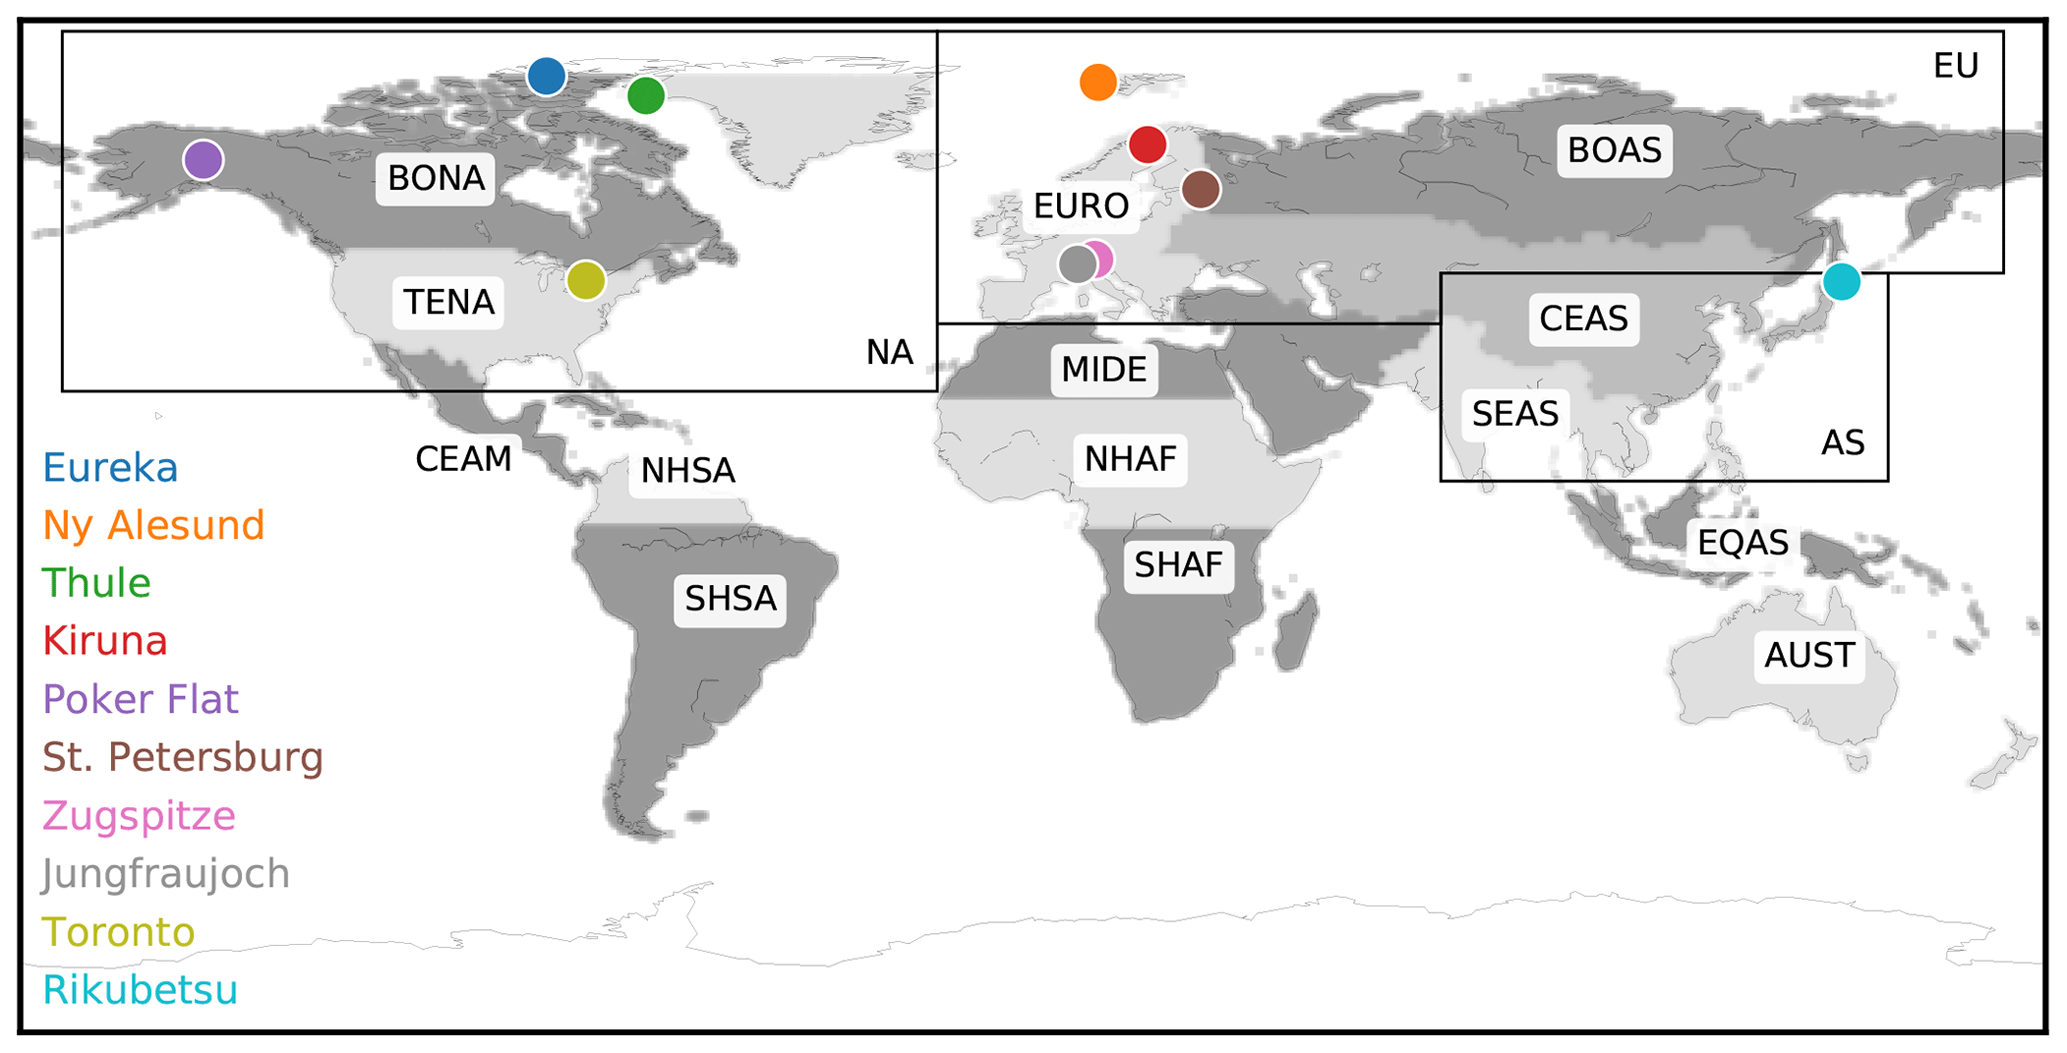
Figure 1Locations of ground-based FTIR sites used in this study. The biomass burning regions (shaded) and anthropogenic source regions (black rectangles) used for the GEOS-Chem tagged CO simulation are also shown and summarized in Table 2.
2.3 AERONET
The Aerosol Robotic Network (AERONET; https://aeronet.gsfc.nasa.gov, last access: 18 May 2020; Holben et al., 1998) is a federation of ground-based remote sensing aerosol networks established by NASA and PHOTONS (PHOtométrie pour le Traitement Opérationnel de Normalisation Satellitaire; Univ. of Lille 1, CNES, and CNRS-INSU). AERONET consists of a network of CIMEL sun photometers which provides globally distributed observations of spectral aerosol optical depth (AOD). At each AERONET site, observations are recorded every 15 min and are cloud screened. Inversion of aerosol products and cloud screening for the AERONET Version 3 database are described in Giles et al. (2019). AERONET sites selected for this study were based on the availability of data during the operational period of the FTIR instruments and proximity to the FTIR site. The selected AERONET sites closest to the NDACC FTIR sites are listed in Table 1.
2.4 FLEXPART
The FLEXPART (FLEXible PARTicle; Stohl et al., 2005) Lagrangian transport model version 10.02 is used to diagnose the potential emission sensitivity (PES) of FTIR measurements in order to estimate the travel times of identified wildfire plumes at each FTIR site. The model is driven by meteorological data from the National Centers for Environmental Prediction (NCEP) Climate Forecast System (CFSv2) 6-hourly product (Saha et al., 2011) at horizontal resolution. In this study, an ensemble of 24 000 particles is released from the location of each FTIR site for each day of fire-affected measurements. The particles are released from the surface to an altitude of 12.71 km at each FTIR site, which corresponds to the FTIR tropospheric column. The FLEXPART model is run backwards in time for a total of 14 d, simulating the transport of the released particles. The FLEXPART output is the surface residence time of the released particles in each 0.5∘ model output grid box. The residence time is related to the PES and is indicative of the sensitivity of the released particles to source emissions.
2.5 Detection and attribution of wildfire pollution events
2.5.1 Enhancement detection in FTIR CO time series
As will be shown in Sect. 3.1.1, a seasonal cycle of CO is observed, with the amplitude varying by site location. Over a long time series, CO may be subject to interannual trends as a result of changing emissions of CO and its precursors. Additionally, non-clear-sky conditions and instrument downtime result in periodic gaps in measurements and nonuniform time intervals between measurements. As a result of these factors it can be difficult to determine baseline or ambient column amounts of CO and therefore to detect enhancements of CO in the FTIR time series. To mitigate these influences, we account for the seasonal cycle and interannual variability of the CO time series measured at each FTIR site following Thoning et al. (1989):
where C is the CO column amount as a function of time t. The coefficient an account for the interannual trends of CO, while the fourth-order Fourier series with coefficients bn and cn captures the seasonal cycle of CO. The choice of order for both the polynomial and Fourier components of the fits were limited to the third and fourth order, respectively, following past studies (Thoning et al., 1989; Zellweger et al., 2009).
Enhancements in CO are identified following Zellweger et al. (2009). First, the fitted function is subtracted from the data to yield the residual. Assuming a normal distribution of baseline values around the fitted function, the negative residual is mirrored into the positive direction. Enhanced CO measurements are defined as those greater than a specified threshold of the mirrored residual above the fitted function. The threshold is defined as a multiple of the standard deviation σ of the mirrored negative residual. The threshold is 1σ for all sites, with the exception of Rikubetsu and Poker Flat where a 2σ standard deviation was used as a result of the greater variability in CO due to nearby Asian anthropogenic and biomass burning sources, respectively. It should be noted that the contribution of the biomass burning sources to the fitted function of Eq. (1) is representative of an increase in the seasonal background of CO due to the accumulation of CO from biomass burning sources during the wildfire season. Enhanced CO measurements detected by the method described above would therefore correspond to anomalous enhancements which exceed the seasonal background.
For each event, all fire-affected measurements are found based on a qualitative assessment of the CO time series in conjunction with GEOS-Chem CO and AERONET AOD time series. Periods of fire-affected measurements are determined for periods in which an increase in the GEOS-Chem total biomass burning contribution to CO is observed. The total biomass burning contribution is defined as the sum of all biomass burning tracers in Table 2. The AERONET AOD provides additional evidence for the presence of wildfire smoke when enhanced AOD is observed simultaneously with enhanced FTIR CO and GEOS-Chem biomass burning CO. It should be noted that enhanced AOD may also be the result of anthropogenic pollution; however, enhanced AOD is likely of wildfire origin when simultaneously enhanced with GEOS-Chem biomass burning CO. Furthermore, aerosol scavenging from a smoke plume may result in the absence of enhanced AOD (Franklin et al., 2014). For these reasons, AOD is only used as a supplementary means of identifying wildfire pollution.
Table 2Summary of the source regions used in the GEOS-Chem tagged CO simulation.
2.5.2 Trace gas correlations
To isolate potential wildfire pollution events, we exploit the fact that trace gas emissions from wildfires are specific to burning phase and vegetation type (Ward and Hardy, 1991; Yokelson et al., 1999; Andreae and Merlet, 2001; Yokelson et al., 2009; Akagi et al., 2011; Urbanski, 2013, 2014), and therefore it would be expected that emissions of CO, HCN, and C2H6 originating from a wildfire source would be correlated within a plume. Emissions at the fire source are characterized by the emission ratio (ER; Andreae and Merlet, 2001; Akagi et al., 2011) relative to CO, which quantifies the amount of a trace gas species emitted relative to the amount of CO emitted. Since FTIR observations of this kind are measuring the emissions downwind of the source, the enhancement ratio (EnhR; Lefer et al., 1994) is considered:
where [X] is the column amount of the trace gas of interest, and [CO] is the column of CO. Here, we have used the regression slope enhancement ratio, rather than the excess mixing ratio method of Lefer et al. (1994). The enhancement ratio is related to the emission ratio with the influence of plume aging by chemical loss, deposition, and dilution of the plume during transport. Lifetimes of CO, HCN, and C2H6 are generally longer than plume transport times, which range from several days to approximately 2 weeks (Damoah et al., 2004), and therefore these species do not undergo considerable chemical loss. Furthermore, we do not take into account the background concentrations, which can cause uncertainty in interpreting the enhancement ratio as the ambient conditions are likely to vary along the plume trajectory (Yokelson et al., 2013). This assumption has been employed extensively in past studies of wildfire emissions using FTIR spectrometry (Paton-Walsh et al., 2010; Vigouroux et al., 2012; Viatte et al., 2013, 2015; Lutsch et al., 2016, 2019) as taking into account a constant background of each species does not influence the slope of the trace gas correlations.
To calculate the enhancement ratios from the FTIR measurements, the detected CO enhancements for each event were paired with the nearest HCN and C2H6 measurements taken within 1 h at all sites with the exception of St. Petersburg and Toronto where a 2 h window was used. The time interval was chosen to maximize the number of pairs since CO, HCN, and C2H6 are measured using different spectral filters, and hence the measurements do not occur simultaneously. For events with paired measurements of HCN or C2H6 with CO that are fewer than six, the event is omitted. Setting a minimum number of pairs mitigates the potential of false detections as a result of spurious measurements.
The unified least-squares fitting procedure of York et al. (2004) which accounts for errors in both the ordinal and abscissa coordinates was used to determine a linear regression for the paired fire-affected measurements. The errors correspond to the reported retrieval uncertainties of the respective species. The slope of the linear regression is the enhancement ratio for the respective species defined in Eq. (2). To identify enhancements due to wildfire pollution events, we require that the correlation coefficient (r) be greater than or equal to 0.6 for the enhancement ratios of both HCN and C2H6, unless otherwise stated.
HCN is retrieved from NDACC filter 2 measurements, which is generally covered at least once per measurement sequence of all filters. Similarly, C2H6 is retrieved through NDACC filter 3. All filters have a different response to the input solar beam intensity, and therefore, the measurement noise may vary between subsequent measurements of different filters. For this reason, adequate signal may not be obtained through all filters in the case of partially cloudy or non-clear-sky conditions. It was found that for all sites, with the exception of Jungfraujoch, there are a greater number of CO measurements than HCN or C2H6. Because of this nonuniform distribution of measurements, the number of detected wildfire events is limited by the number of paired measurements for HCN or C2H6 with CO. For this reason, for Ny-Ålesund, Poker Flat, and Rikubetsu, the enhancement ratio correlation criteria were omitted, resulting in a lower confidence for the detected wildfire pollution events.
Lastly, source attribution of the detected wildfire events was performed using the GEOS-Chem tagged CO simulation. For each event, the mean contribution of each of the biomass burning CO tracers over the period of the event was determined. The source region was then attributed to the CO tracer for which the mean contribution was a maximum.
2.6 Estimation of plume travel times
For each of the detected wildfire pollution events at each FTIR site, the travel time of the plume from the source region to the FTIR site was determined as follows. For each day of fire-affected measurements, the FLEXPART model was initialized releasing an ensemble of 24 000 air-tracer particles over a 24 h period. Particles were released from the surface of the FTIR site to a maximum altitude of 12.71 km, corresponding to the FTIR tropospheric columns used in this study. The FLEXPART model was run backwards in time for 14 d to yield the surface residence time of the released particles at a temporal resolution of 3 h and horizontal resolution of with global coverage. The daily GFAS global CO emissions were regridded from to to match the horizontal resolution of the FLEXPART output.
For each day of the FLEXPART output, the daily total residence time in each model grid box was determined. The product of GFAS CO emissions (molec. s−1) and the residence time (s) of the FLEXPART air-tracer particles are indicative of the sensitivity of the released particles to wildfire CO emissions. The travel time for each FLEXPART simulation is then estimated by the number of days backwards in time for which the sensitivity is a maximum for the identified wildfire source region of the respective event. A mean travel time for each plume is determined by the mean of all travel times for each day of fire-affected measurements in the identified event; the standard deviation is an estimation of the uncertainty.
2.7 Emission ratios
The enhancement ratios (Sect. 2.5.2), which were used to isolate wildfire pollution events, and the travel times (Sect. 2.6) were used to calculate the emission ratio (ER) of the respective trace gas species. The emission ratio represents the wildfire source emissions, assuming the plume was unaged (Lefer et al., 1994). To calculate the emission ratio, we assume the first-order loss of each species following Viatte et al. (2013, 2015) and Lutsch et al. (2016). The emission ratio may then be related to the enhancement ratio as
where X is the trace gas of interest, t is the plume travel time, and τ is the lifetime of the species. We assume lifetimes of 30, 75, and 45 d for CO, HCN, and C2H6, respectively, following Viatte et al. (2013, 2015) and Lutsch et al. (2016). For each identified wildfire event the emission ratio of HCN and C2H6 is calculated using Eq. (3) and mean travel time for the event. The uncertainty of the calculated emission ratios includes the enhancement ratio uncertainty, determined from the standard error of the linear regression, and the travel time uncertainty. The uncertainty of the lifetime of each species was not included as the lifetime can be variable during plume transport and therefore cannot be quantified.
3.1 Retrieved FTIR products
3.1.1 Time series
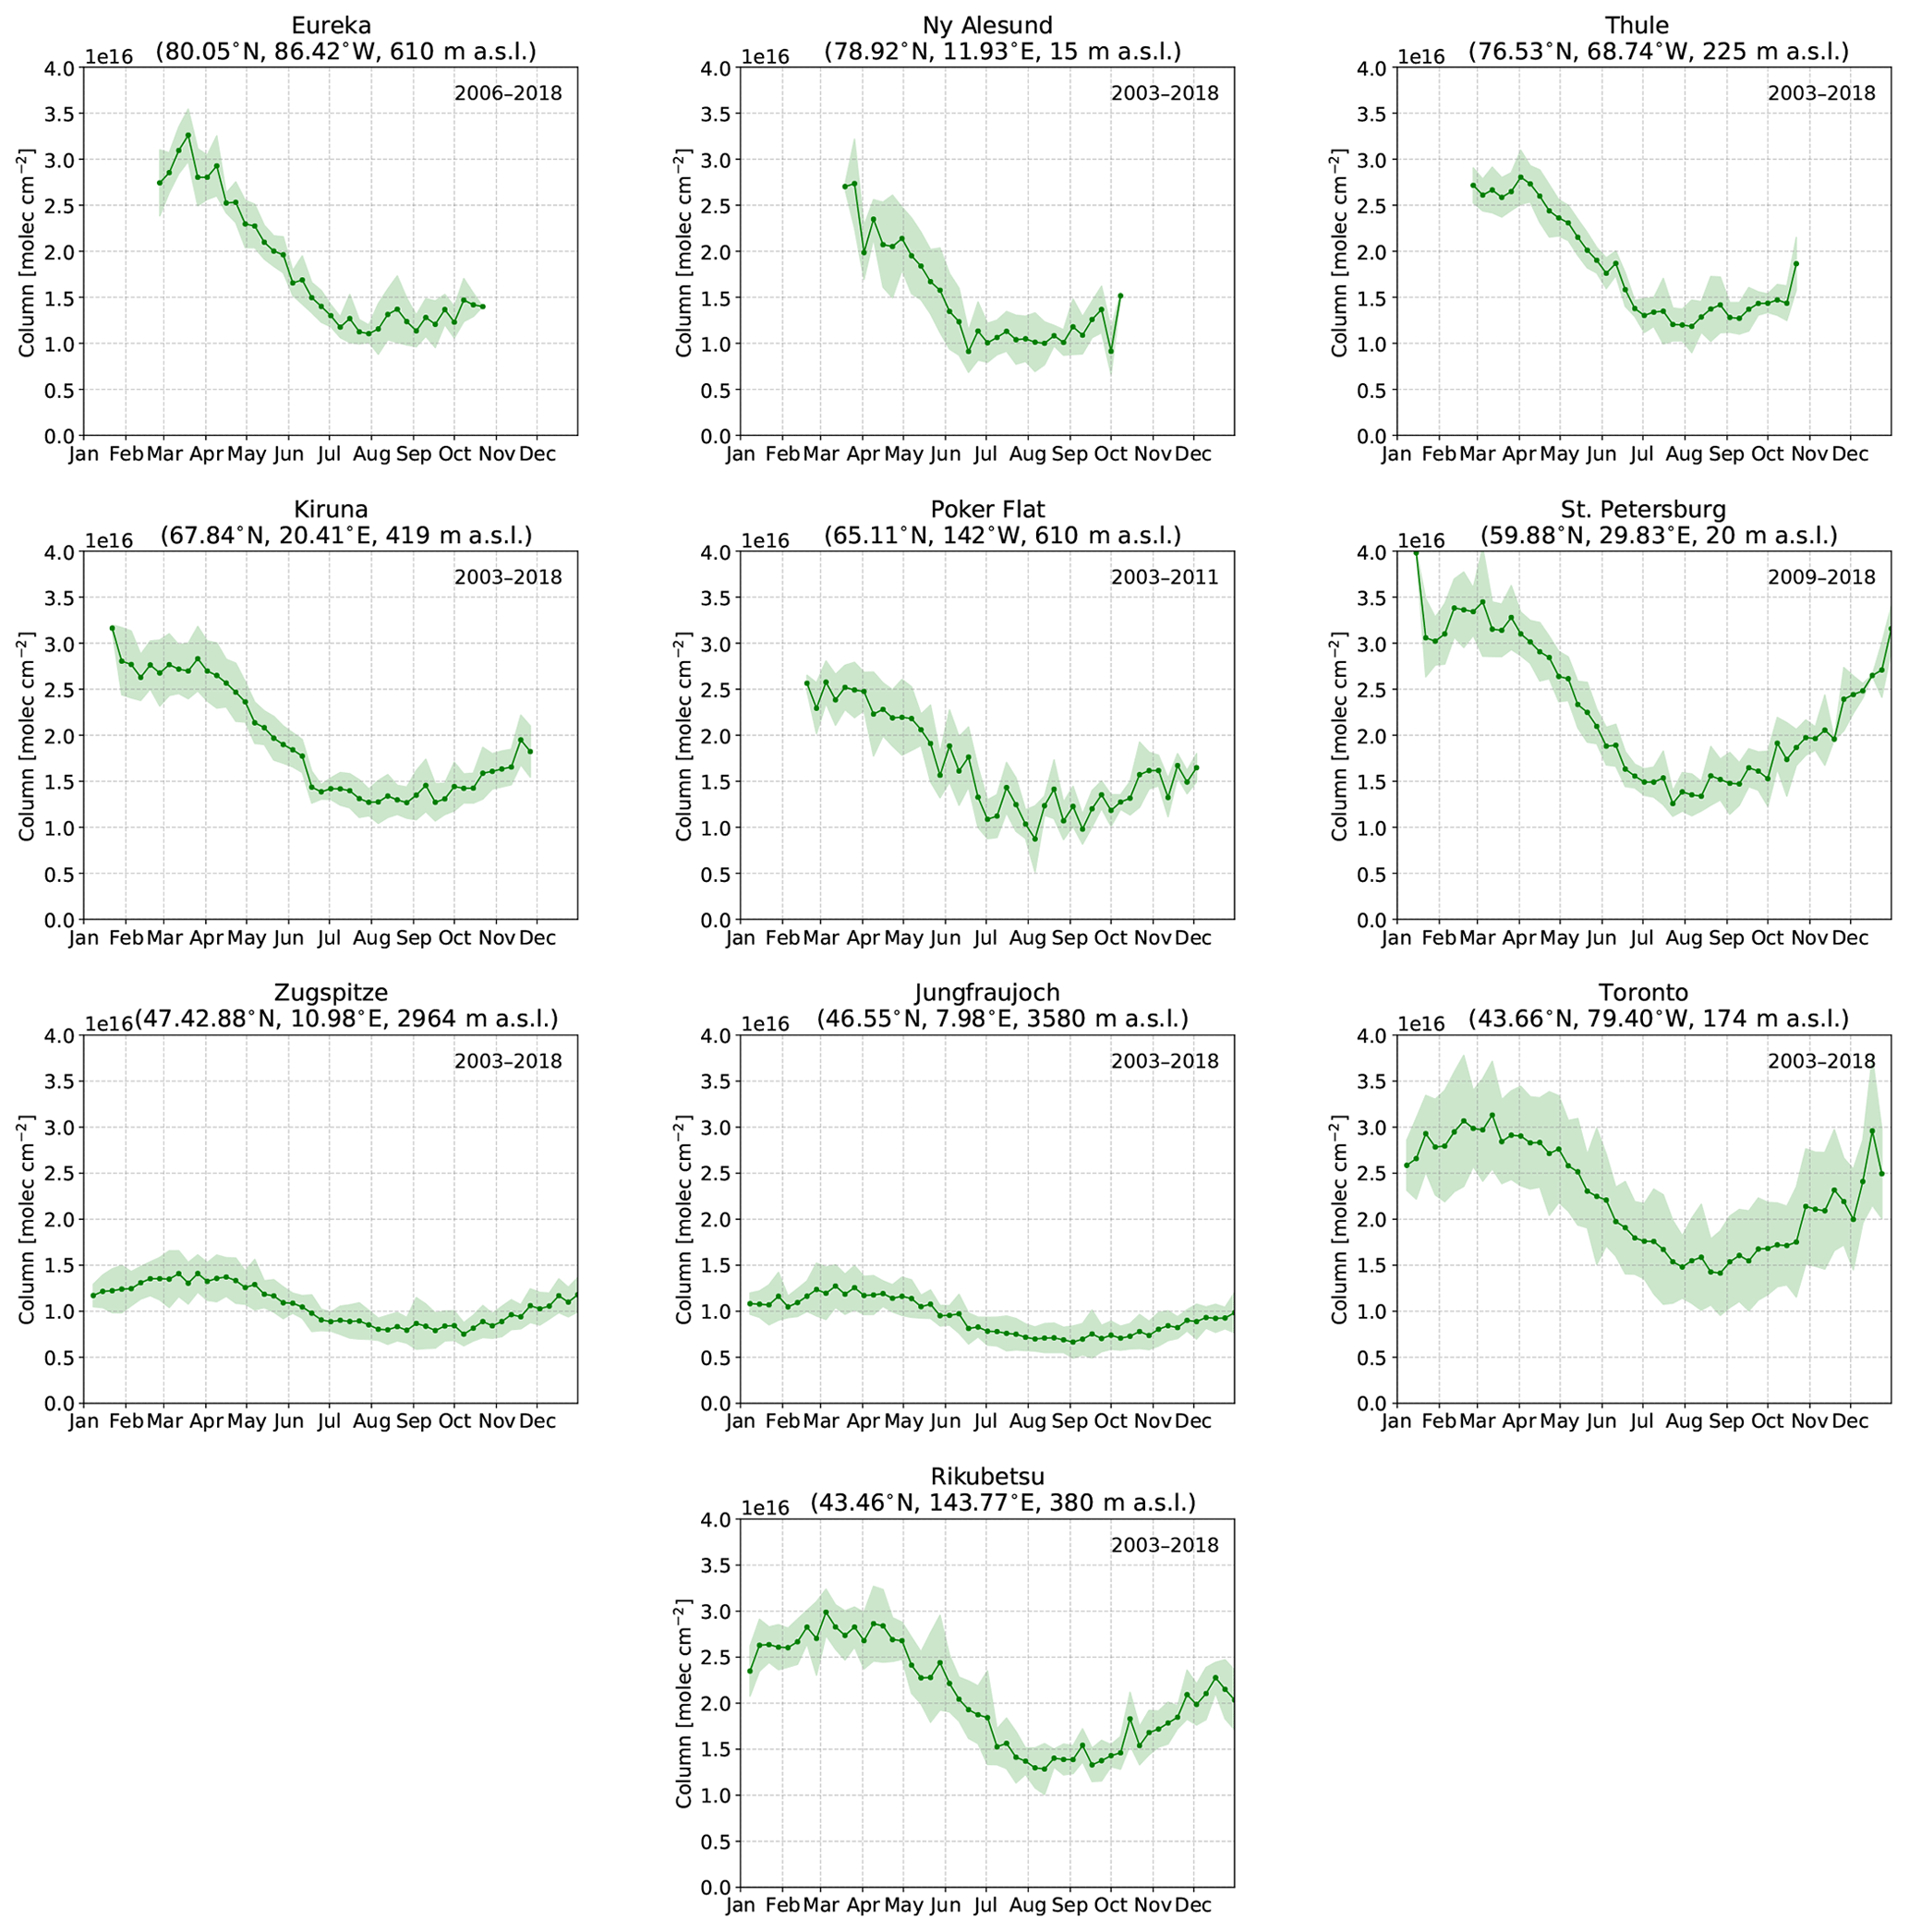
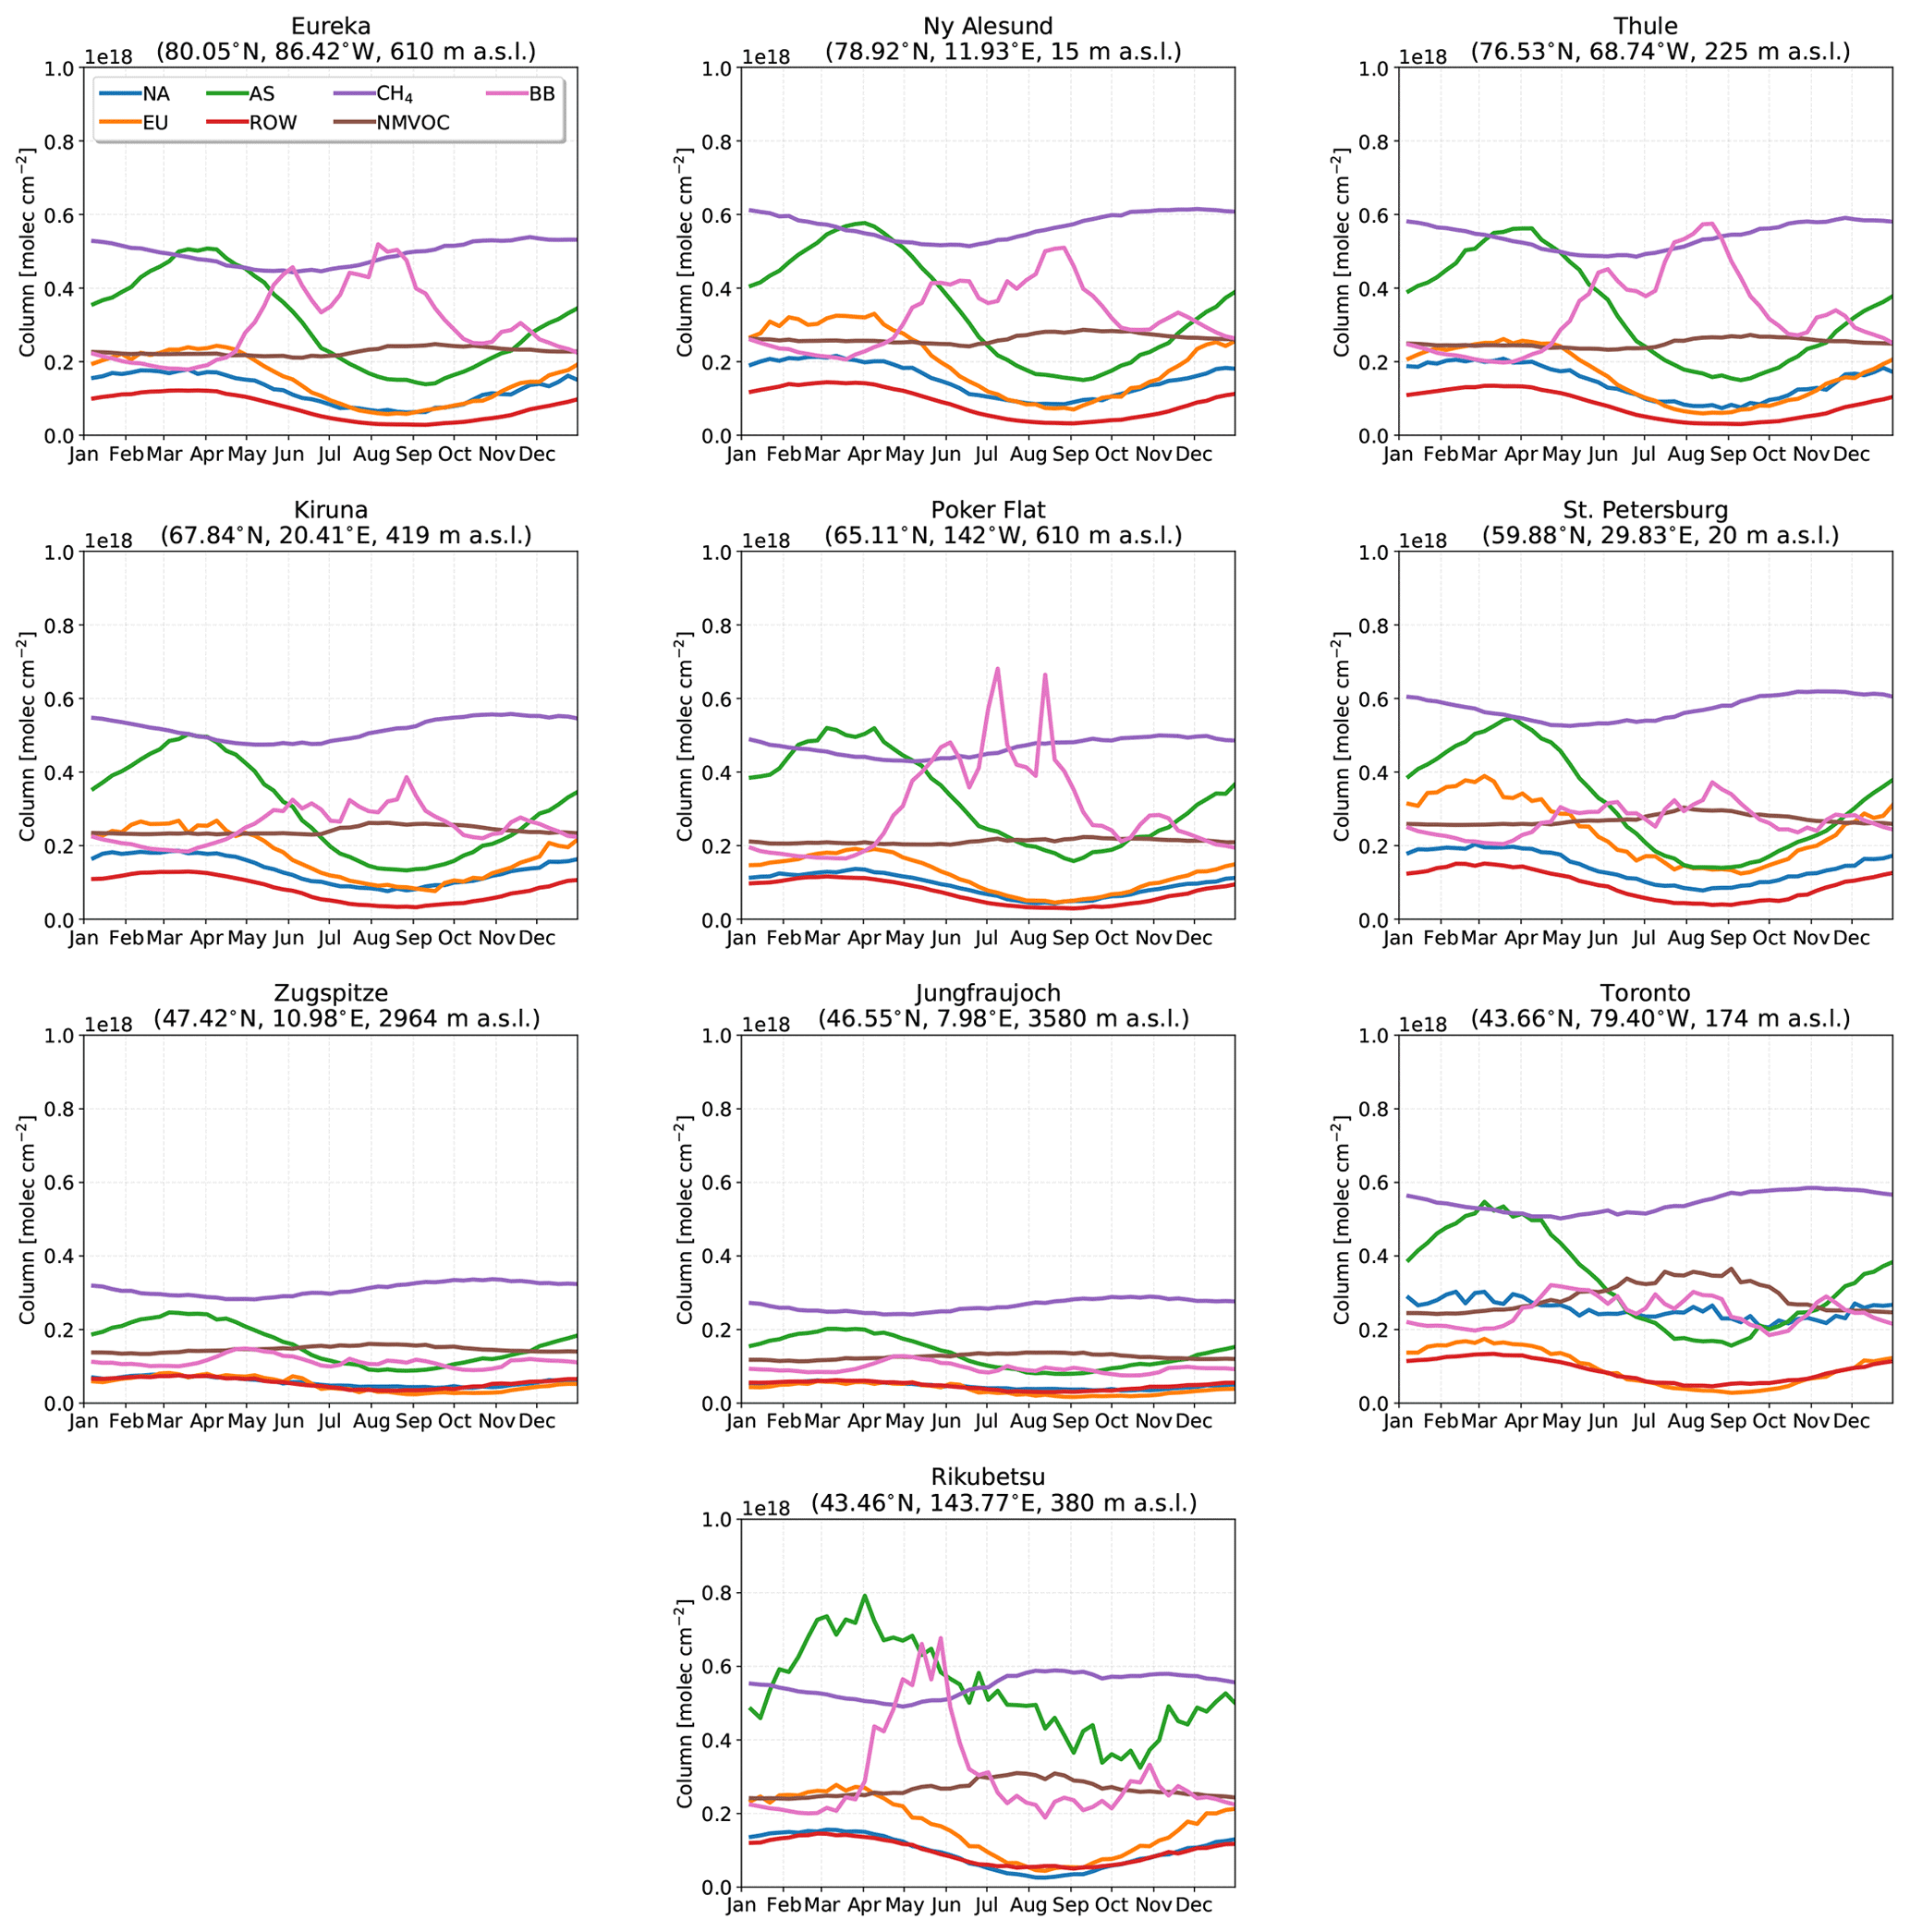
The weekly-mean time series of CO, HCN, and C2H6 tropospheric partial columns for each site are shown in Figs. 2, 3, and 4, respectively. The tropospheric partial columns are the integrated column amounts from the surface to an altitude of 12.71 km at each site. In this study, all presented column amounts correspond to this partial column for CO, HCN, and C2H6. The weekly mean is taken over all years of measurements for the respective species at each site, while the shaded region indicates a 1σ deviation from the mean. For all sites, the seasonal cycle of CO shows a maximum in winter and early spring (February–March), with decreasing total columns through the spring. The main sources of CO are the combustion of fossil fuels and biomass burning, while oxidation of VOCs and CH4 are also a considerable source (Holloway et al., 2000). The main sink of CO is due to reaction with OH, leading to a lifetime of approximately 1–2 months (Bey et al., 2001a). In winter and spring months, decreased sunlit hours limits OH production by photolysis of ozone, therefore minimizing the loss of CO. The seasonal cycle of OH largely drives the seasonal variations in CO. Transport of CO from midlatitude to high-latitude regions also contributes to the seasonal cycle as the isentropic transport is greater in the winter and spring months (Klonecki, 2003; Stohl et al., 2006). Furthermore, the stronger seasonal cycle of OH production also contributes to the greater seasonal amplitudes at high latitudes as observed in Fig. 2.

Figure 2Mean CO tropospheric partial columns weekly averaged over all years of measurements at each site. The years included in the mean are listed in the top right corner of each panel. The shaded region represents a 1σ standard deviation from the mean.
Enhanced tropospheric columns of CO are observed in the summertime, mainly in July–September at all sites as illustrated in Fig. 2 as a result of the hemispheric influence of boreal wildfires (Honrath, 2004). These enhancements are most pronounced at the clean high-Arctic sites of Eureka and Thule, which are strongly influenced by boreal fires in North America and Asia as will be shown in Sect. 4.2. Ny-Ålesund also exhibits an increase in CO beginning in August as a result of the accumulation of CO from Northern Hemisphere biomass burning sources. Poker Flat, located in the boreal forests of Alaska, is greatly influenced by boreal wildfire emissions in these regions; however, in many instances these events result in smokey conditions that prevent FTIR measurements. As a result, the number of wildfire enhancement events detected at Poker Flat is likely to be an underestimate.
A slight increase in CO concentrations is observed at Zugspitze and Jungfraujoch as a result of the long-range transport of boreal wildfire emissions. Emissions from these events are often lofted into the free troposphere where long-range transport is favored (Jaffe et al., 2004; Val Martin et al., 2006). However, the transport of emissions over continental scales results in the dilution of the smoke plume, and therefore, the enhancements observed at Zugspitze and Jungfraujoch are not as pronounced as for the other sites.
St. Petersburg and Toronto are urban sites that are strongly influenced by local anthropogenic sources, but enhanced columns of CO are observed in July and August as a result of the boreal wildfire influence as will be shown in Sect. 4.2. Rikubetsu is strongly affected by anthropogenic CO sources from Asia, resulting in the large variability of CO (Zhao et al., 1997, 2002). The greatest enhancements at Rikubetsu are observed in July and August, due to boreal Asian wildfires in Siberia as will be discussed in Sect. 4.2.
HCN has a long atmospheric lifetime ranging from weeks to months, while its dominant source is due to biomass burning emissions (Li et al., 2000, 2003, 2009). Plant and fungal emissions represent a minor source of HCN, while dry deposition to the ocean and oxidation by OH are the main sinks (Cicerone and Zellner, 1983). As a result, HCN will accumulate in the Northern Hemisphere in the summer months due to the influence of wildfire and biogenic emissions. The seasonal cycle of HCN peaks in the summer months with low total columns in the winter and fall as illustrated in Fig. 3. A sharp maximum is observed in August at the high-Arctic sites (Eureka, Thule, and Ny-Ålesund) due to activation of its biogenic sources and the onset of wildfire emissions. A similar increase in the HCN total columns is observed at the high-latitude sites (Kiruna, Poker Flat, and St. Petersburg), although not as pronounced. For Toronto, enhanced total columns are also observed in August due to wildfires, consistent with the CO time series. Rikubetsu shows the greatest concentrations of HCN in the spring in May, with a secondary peak in August. The springtime enhancements of HCN are due to the earlier onset of East and Southeast Asian biomass burning, which occurs annually from March to May (Streets et al., 2003).

The seasonal cycle of C2H6 is similar to that of CO, as shown in Fig. 4. The primary sources of C2H6 include natural gas production, biofuel use, and biomass burning (Rudolph, 1995; Logan et al., 1981; Xiao et al., 2008). The main loss of C2H6 is due to reaction with OH, resulting in an average lifetime of approximately 3 months (Xiao et al., 2008). The summertime wildfire influence of C2H6 is less pronounced than for CO and HCN. Enhancements of C2H6 are particularly evident at Eureka and Thule, due to the generally clean background of these sites, while wildfire enhancements of C2H6 are not evident at the other sites due to the influence of local sources in addition to dilution of the plume during long-range transport. Therefore, C2H6 enhancements due to wildfire pollution are not generally apparent over background concentrations. Additionally, the emissions of C2H6 are an order of magnitude lower than those of HCN for boreal forest, temperate forests, and peatland burning sources (Andreae and Merlet, 2001; Akagi et al., 2011; Andreae, 2019).
3.1.2 Retrieved VMR profiles and total column averaging kernels
The VMR profiles of CO, HCN, and C2H6 for all sites are shown in the appendix Figs. A1, A2, and A3. A priori profiles for CO, HCN, and C2H6 are from a 40-year (1980–2020) mean from the Whole Atmosphere Community Climate Model (WACCMv4; Eyring et al., 2007; Marsh et al., 2013), which has been chosen by the NDACC IRWG for use by all sites. For all sites, a single a priori profile is used for each species, with the exception of Thule where monthly-mean a priori profiles derived from the 40-year WACCMv4 simulation are used. In all cases, the profiles of each species are similar between sites and tend not to show drastic differences. It should be noted that these profiles do not represent the true atmospheric profile of the species due to limited vertical resolution of the measurement, which is inherent in remote sensing measurements of this kind. The retrieved profiles generally follow a similar shape to the a priori profile, where deviations from the a priori are a result of the measurement. In general, the profiles of all species exhibit the greatest variability in the troposphere due to the abundance of these species in this region. The tropospheric columns of CO, HCN, and C2H6 comprise, on average, greater than approximately 90 % of the total column for CO, 95 % for HCN, and 98 % for C2H6.
For the purposes of this study, normalized total column averaging kernel values near unity throughout the troposphere are desired, which would minimize biases due to differences in the vertical sensitivities when computing the ratios of columns of different species in calculating the enhancement ratio described in Sect. 2.5.1. The mean normalized total column averaging kernels, referred to as simply the total column averaging kernel hereinafter, for CO, HCN, and C2H6 are described in Appendix A and shown in Appendix Fig. A4. For all sites, the total column averaging kernels of CO show a value near 1 throughout the troposphere, with a slight decrease to values below unity above 5 km. For HCN, the total column averaging kernels increase from the surface, with maximum values in the upper troposphere. The total column averaging kernels of C2H6 show a similar structure to HCN, with maximum values in the middle to upper troposphere. For all sites, it can be concluded that CO retrievals exhibit minimal sensitivity bias in the troposphere. For HCN and C2H6, the total column averaging kernel is greatest in the upper troposphere.
3.2 GEOS-Chem to FTIR CO comparison
In order to use the GEOS-Chem tagged CO simulation to interpret the FTIR measurements, it is necessary to evaluate the performance of the model with respect to FTIR measurements. To do so, GEOS-Chem CO partial column profiles are smoothed by the normalized FTIR CO total column averaging kernel following Rodgers and Connor (2003):
where is the smoothed model total column, xa is the FTIR a priori total column, xm is the model partial column profile, a is the FTIR total column averaging kernel, and xa is the FTIR a priori partial column profile. Although the smoothing has a minor influence on the smoothed partial column (∼1 %), it is performed here to mitigate any biases as a result of the a priori profile. The GEOS-Chem CO profiles, FTIR CO profiles, and total column averaging kernels are daily averaged, and the daily averaged GEOS-Chem profiles are subsequently smoothed. Correlations of the smoothed GEOS-Chem and FTIR CO tropospheric partial columns are shown in Table 3.
Table 3Correlation coefficient (r) and slope of GEOS-Chem versus FTIR CO tropospheric partial columns and the monthly-mean relative difference of GEOS-Chem minus FTIR [(model-FTIR)/FTIR] CO tropospheric partial columns over all years for measurements from 2003 to 2018.
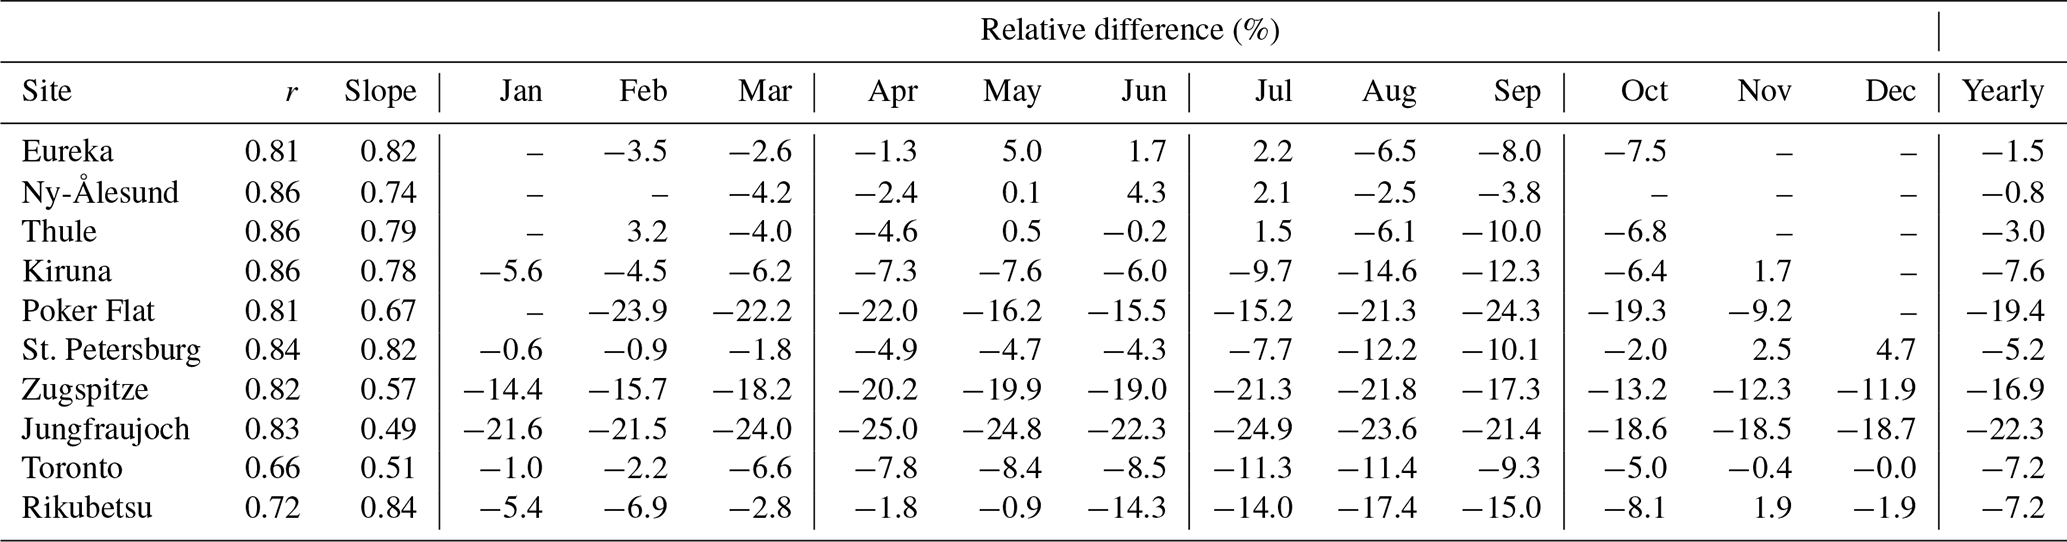
For all sites, moderate to strong linear correlations are observed with correlation coefficients (r) ranging from a minimum of 0.66 for Toronto to a maximum of 0.86 at Ny-Ålesund, Thule, and Kiruna. The slope of the linear regression is indicative of the GEOS-Chem bias relative to the FTIR measurements, with a slope greater than 1.0 representing a high bias and a slope less than 1.0 representing a low bias. For all sites, GEOS-Chem has a low bias as seen in Table 3. The slopes range from a minimum of 0.49 at Jungfraujoch to a maximum of 0.84 at Rikubetsu.
The underestimation of GEOS-Chem CO is common amongst global chemical transport models (CTMs) as a result of errors in emissions, transport, and biases in the OH concentrations (Shindell et al., 2006). It is likely that the consistent underestimation of GEOS-Chem CO at all sites is partly due to a high bias of OH (Muller et al., 2018). Seasonal variability of the GEOS-Chem bias is observed as shown Table 3. The consistent underestimation of GEOS-Chem at Zugspitze and Jungfraujoch may be the result of excessive stratosphere-to-troposphere exchange (Fischer et al., 2000; Hoor et al., 2002; Pan et al., 2004) due to the coarse model resolution, resulting in a low bias of CO in the upper troposphere. A similar underestimation of GEOS-Chem CO in a full-chemistry simulation in comparison to Jungfraujoch FTIR measurements was observed by Té et al. (2016). The high altitude of Zugspitze and Jungfraujoch makes these sites more susceptible to this bias in comparison to the lower-altitude sites (Ordóñez et al., 2007). The underestimation at Toronto, and the lower correlation (0.66) than at all other sites, is possibly the result of the temporal and spatial variability of CO being not well captured due to the coarse model resolution ().
Seasonal variability of the GEOS-Chem minus FTIR relative difference is also observed as shown in Table 3. The representation of the seasonal variability of transport at midlatitudes and errors in the seasonality are likely to be contributing factors to the variability of the GEOS-Chem minus FTIR CO difference. However, biomass burning emissions are also seasonally dependent, and underestimation of GEOS-Chem CO may be partially reflective of an underestimation of GFAS emissions. Particularly evident is the greater underestimation of GEOS-Chem at Rikubetsu in the summer months, during the boreal wildfire season. Eureka and Thule exhibit a greater underestimation of GEOS-Chem in July and August when the boreal wildfire influence is greatest as will be shown in Sect. 8. A similar decrease in the GEOS-Chem minus FTIR relative difference is also observed at Kiruna, Poker Flat, St. Petersburg, and Toronto. These differences could be indicative of the unresolved plume transport in the model as a result of its coarse vertical resolution (Rastigejev et al., 2010; Eastham and Jacob, 2017). Additionally, the summertime low CO bias in GEOS-Chem may also be contributed by an underestimation of the secondary production of CO from biogenic emissions of NMVOCs.
3.3 Detected wildfire pollution events
Wildfire events in the FTIR time series at each site were identified using the method described in Sect. 2.5. Enhancements of CO were first identified following Sect. 2.5.1 and correlated with coincident measurements of HCN and C2H6 to calculate their enhancement ratios with respect to CO as described in Sect. 2.5.2. For the period of fire-affected measurements for each identified event, source attribution was determined using the GEOS-Chem tagged CO simulation. The source attribution for the detected wildfire pollution events in the FTIR time series is illustrated in Fig. 5. Examples of the linear regressions used to determine the enhancement ratios of HCN and C2H6 at each site are shown for BONA and BOAS sources in Figs. A5 and A6, respectively. The mean travel times determined using the FLEXPART back-trajectory simulations and the calculated emission ratios of HCN and C2H6 are tabulated in Table 4.
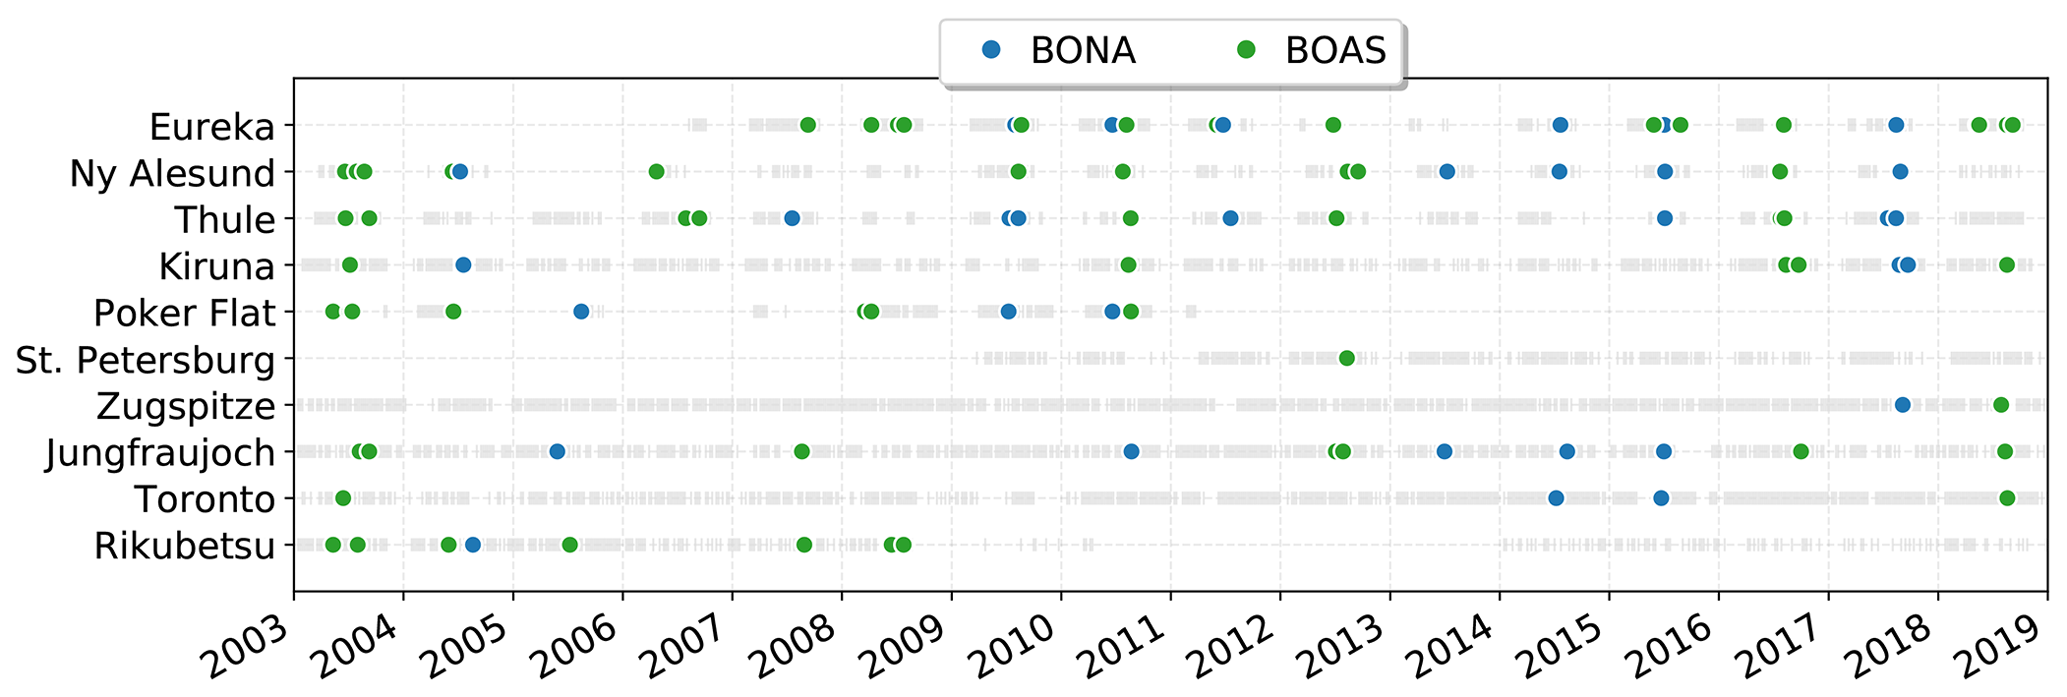
Figure 5Summary of detected wildfire pollution events. The grey bars indicate periods of CO measurements, and the colored points represent the identified wildfire pollution events and their respective source attributed by the GEOS-Chem tagged CO simulation.
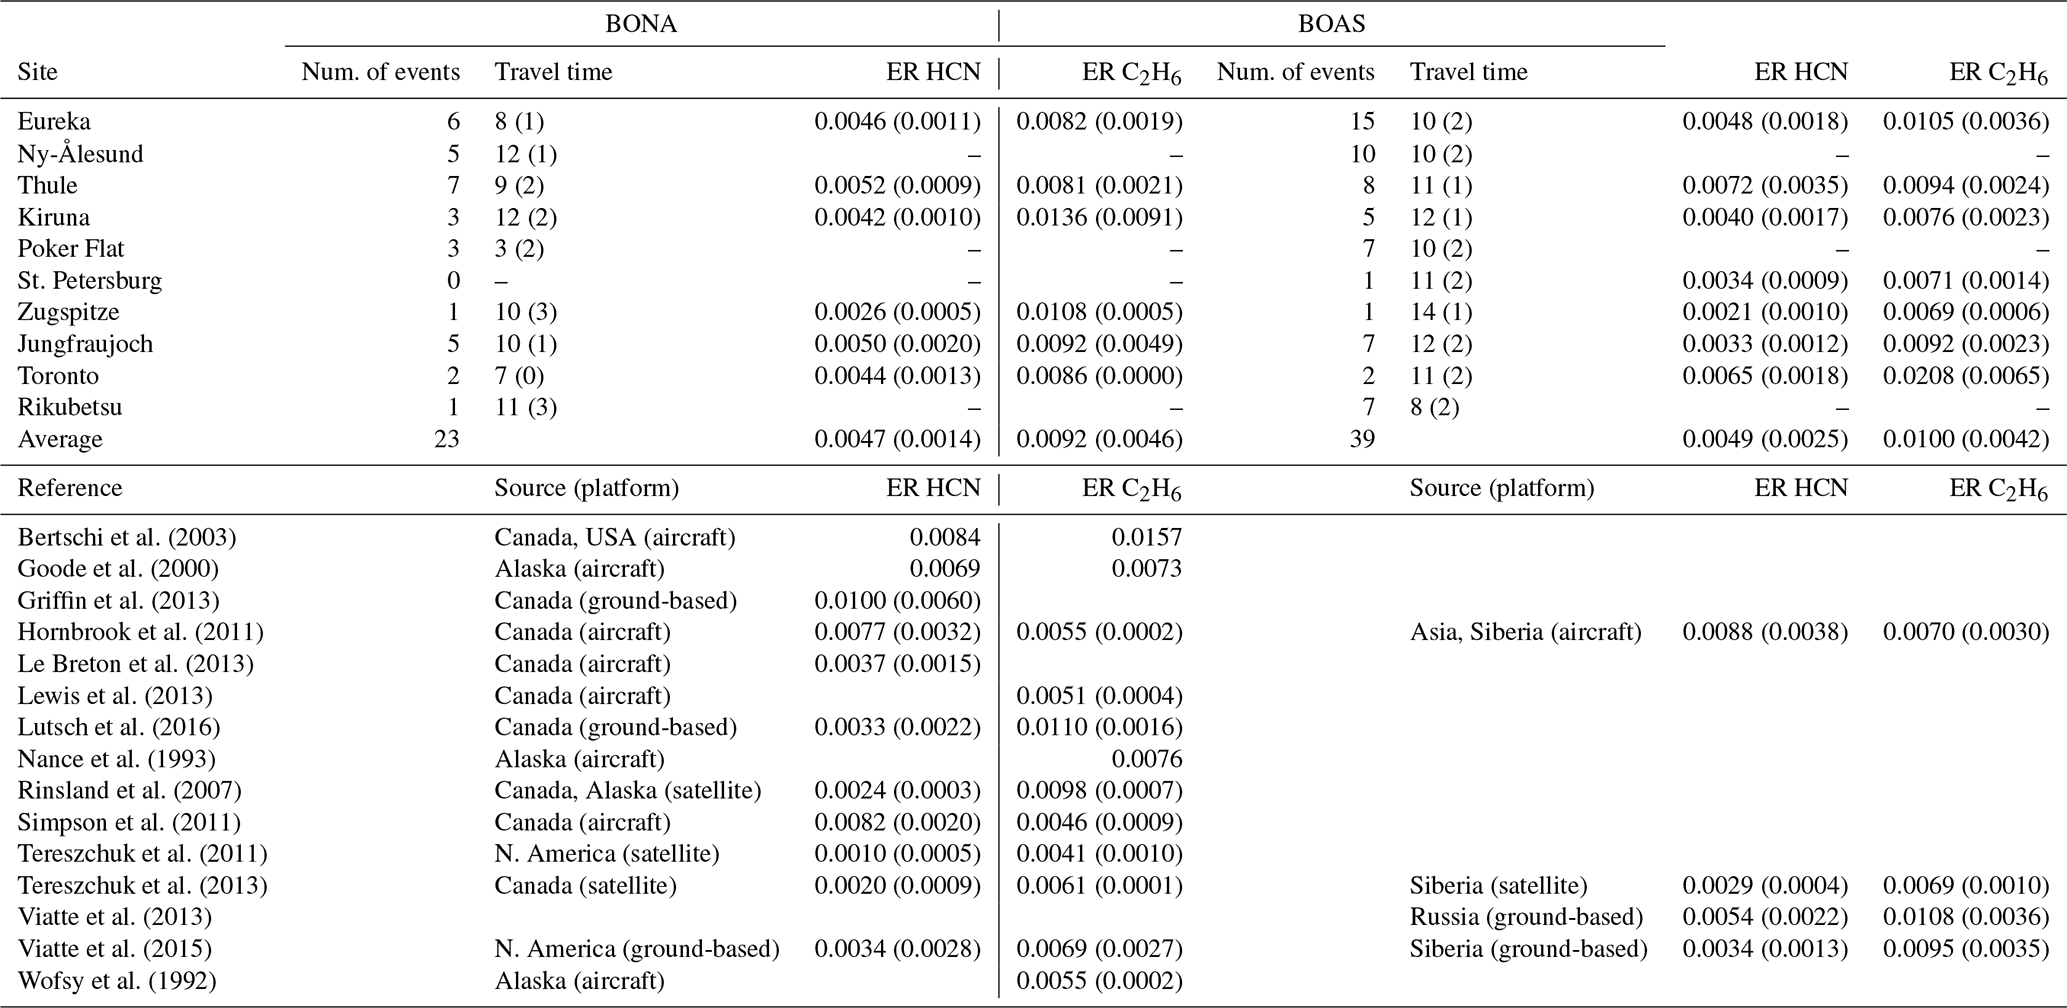
Table 4Mean emission ratios (molec. cm−2/molec. cm−2) of HCN and C2H6 for BONA and BOAS for all detected wildfire events. The value in parentheses is the 1σ standard deviation of the mean, or the uncertainty for single events. The number of detected events for each site and mean travel times (days) are also given. The summarized studies were selected based on the availability of HCN and C2H6 emission ratios for boreal North American and boreal Asian sources. The studies included consist of emission ratios derived from multiple platforms including aircraft, ground-based FTIR spectrometry, and satellite observations. For each of these studies, emissions ratios are reported for a single event or for the mean of several events. The value in parentheses is the reported error or standard deviation.
The detected episodic wildfire pollution events at all sites were attributed to either BONA or BOAS sources. Missed detections of wildfire events in the FTIR time series are largely the result of the gaps in measurements, which may either be due to non-clear-sky conditions or instrument downtime. For Poker Flat, the presence of nearby wildfire sources results in large gaps in measurement as a result of the wildfire smoke. Coincident measurements of CO, HCN, and C2H6 are generally not limiting factors for the detection of wildfire events. Under normal conditions, measurements are made by cycling through a series of spectral filters, and all filters are usually sampled equally. The NDACC IRWG recommends the use of seven broadband spectral filters. They are used at all sites, with the exception of St. Petersburg and Jungfraujoch, where nonstandard filters are used. Measurements of CO can be made through two of the seven spectral filters, while HCN and C2H6 are made through a single spectral filter. When a sufficient number of CO enhancements were detected, the coincident criterion of six paired measurements of HCN or C2H6 for the calculation of the enhancement ratio was achieved. However, the exceptions are Ny-Ålesund, Poker Flat, and Rikubetsu, where the lower measurement density of these sites prevented the calculation of enhancement ratios. For all sites where the enhancement ratios of HCN and C2H6 were used as part of the detection, there may be missed events due to assigning a minimum correlation coefficient of 0.6 to the calculations. There may be cases where CO, HCN, and C2H6 are simultaneously enhanced due to wildfire emissions; however, there may be poor correlation as a result of mixing of the plume with ambient air or mixing of plumes of separate sources. However, setting a minimum correlation coefficient for the enhancement would ensure that only coherent plumes are detected, therefore providing more reliable estimates of the emission ratios.
The reported mean travel times are found to vary by site and source region as shown in Table 4. A minimum mean plume travel time of 3 d was found for Poker Flat from BONA sources due to nearby Alaskan wildfire sources. The travel times are typically longer at all sites, 10 d or greater for BOAS sources. Comparable travel times between BONA and BOAS sources are observed for Ny-Ålesund, Kiruna, Zugspitze, and Jungfraujoch. For Eureka, Thule, and Toronto, mean travel times of 8, 9, and 7 d are found for BONA and are shorter than BOAS, due to the proximity of these sites to BONA sources.
Temporal correlation of events amongst all sites is observed, with events occurring close in time at different sites being attributed to the same source. Particularly evident are the 2012 Siberian wildfires (Kozlov et al., 2014; Teakles et al., 2017) observed at several sites and attributed to BOAS. Similarly, the 2017 Canadian wildfires (Khaykin et al., 2018; Peterson et al., 2018; Kirchmeier-Young et al., 2019; Lutsch et al., 2019) are also observed at a number of sites. Although the majority of detected events from 2003 to 2018 are attributed to BOAS (63), from 2013 to 2018 there is an observed increase in the number of events attributed to BONA, with 18 BONA and 17 BOAS events detected during this period amongst all sites. Prior to 2013, 14 BONA and 46 BOAS events were detected. The recent increase in BONA events could be indicative of changes in large-scale climatic patterns (Macias Fauria and Johnson, 2008), resulting in an increase in lightning-induced wildfires (Macias Fauria and Johnson, 2006; Veraverbeke et al., 2017). However, this apparent increase in BONA events does not take into account the possibility of missed detections due to instrument downtime or cloudy-sky conditions. The calculated emission ratios will be discussed in the following section, and the contributions of the biomass burning source regions to CO tropospheric columns at each site will be presented in Sect. 4.2.
4.1 Emission ratios
The calculated emission ratios of HCN and C2H6 are compared to the literature values in Table 4. For BONA, our mean emission ratios of HCN range from 0.0026 (Zugspitze) to 0.0052 (Thule), whereas our mean emission ratios of C2H6 range from 0.0081 (Thule) to 0.0136 (Kiruna). Our values derived from FTIR-based methods are well within the range of literature values derived from ground-, satellite-, and aircraft-based methods. Furthermore, across all sites, our mean emission ratios of C2H6 are greater than the mean emission ratios of HCN. Similarly, previous studies have reported greater C2H6 relative to HCN emission ratios, with the exception of the values reported by Hornbrook et al. (2011) and Simpson et al. (2011).
For BOAS, our mean emission ratios of HCN range from 0.0021 (Zugspitze) to 0.0072 (Thule), whereas our mean emission ratios of C2H6 range from 0.0071 (St. Petersburg) to 0.0105 (Eureka). There are a limited number of literature values for BOAS, particularly those derived from aircraft-based studies. Notwithstanding, our FTIR-derived HCN and C2H6 emission ratios are within the range of available published values (Table 4) across all sites, with the exception of C2H6 in Toronto. The higher C2H6 emission ratio estimate for Toronto, relative to other sites, may be explained by nearby anthropogenic sources of C2H6, which may contaminate the plume and yield higher emission ratio estimates (Franco et al., 2016; Tzompa‐Sosa et al., 2017). As was observed for BONA, the mean C2H6 emission ratios are greater than the mean HCN emission ratios for BOAS across all sites. This comparison of C2H6 to HCN emission ratios is in agreement with published findings, with the exception of Hornbrook et al. (2011).
Our FTIR-derived HCN emission ratios are greater than published estimates based on Atmospheric Chemistry Experiment Fourier Transform Spectrometer (ACE-FTS) measurements, as reported by Tereszchuk et al. (2011), Rinsland et al. (2007), and Tereszchuk et al. (2013) for BONA and Tereszchuk et al. (2013) for BOAS. Solar occultation measurements of the ACE-FTS have a lower altitude range, of approximately 6 km. Consequently, a plume detected by ACE-FTS may correspond to flaming combustion and injection of emissions into the upper troposphere. Flaming, relative to smoldering combustion, is associated with lower HCN emissions (Urbanski, 2013). Indeed, literature values of HCN ratios derived from ground-based FTIR measurement were higher than those derived from ACE-FTS solar occultation measurements (Griffin et al., 2013; Viatte et al., 2015; Lutsch et al., 2016).
Aircraft instruments tend to measure the composition of fresh plumes with minimal plume aging. Therefore, the variability of the emission ratios reported for aircraft-based studies is likely to be reflective of the variability of emissions due to multiple factors that influence the emissions within a wildfire event, such as the type of vegetation that is burned (Akagi et al., 2011; Andreae and Merlet, 2001; Andreae, 2019), the burning phase (Yokelson et al., 1996, 1999, 2003; Goode et al., 1999, 2000; Urbanski, 2013), and pyrolysis temperature (Sekimoto et al., 2018) of the burn. These factors, however, are likely to vary regionally and may also vary with time in a particular event.
Taken together, our FTIR-derived mean emission ratios of HCN and C2H6 for BONA and BOAS sources are congruent with published literature values, supporting the validity of the use of FTIR-based methods to quantify the transport of emissions from BONA and BOAS sources. We report HCN and C2H6 emission ratios across multiple sites in the Arctic and midlatitude regions. Moreover, the FTIR-derived emission ratios presented here provide novel estimates for regions wherein published values are not available, particularly for BOAS sources, adding to the sparsely populated dataset and providing greater insight into the variability of emissions.
Precise knowledge of the emission ratios of various trace and particulate species is required for more accurate modeling of biomass burning emissions in chemical transport models. The emission ratio, may be converted to an equivalent emission factor with the use of the emission factor of the reference species, usually CO. The emission factor of CO is determined from reported literature values (i.e., Andreae and Merlet, 2001; Akagi et al., 2011; Andreae, 2019) which are derived from laboratory or field measurements, relating the mass of CO emitted per unit mass of dry matter burned for various vegetation types. Given the dependence of the emission factor of the species of interest on the emission factor of CO, it is advantageous to consider the emission ratios. Biomass burning emission inventories are dependent on a single emission factor for each species per vegetation type or biome. These values are obtained from literature values such as reported by Akagi et al. (2011), Andreae and Merlet (2001), and Andreae (2019). These literature values are the reported means of emission ratios or emission factors obtained from laboratory studies or field observations from ground-based, aircraft, or satellite measurement platforms. Measurements of emission ratios by these methods may only sample a single or small number of events. Aircraft measurements are often made on a campaign basis, targeting biomass burning plumes near the source or along a flight transect. As a result, measurements made by aircraft may only sample the plume over a short period of time and may not capture the natural variability of emissions.
Satellite observations are particularly useful as they provide global coverage; however, emission ratios derived from satellite observations are limited by the instrument's capability to measure multiple trace gas species simultaneously. To our knowledge, the only satellite-based measurements of HCN and C2H6 emission ratios for boreal vegetation types are reported by Rinsland et al. (2007) and Tereszchuk et al. (2011, 2013) using ACE-FTS. Although ACE-FTS has global coverage, observations of biomass burning plumes are dependent on the temporal and spatial sampling of the instrument intersecting the biomass burning plume. As result, measurements within of a biomass burning plume may only occur in a small number of instances.
Ground-based measurements, particularly by FTIR spectrometry, have sampled boreal wildfire plumes on several occasions (i.e., Viatte et al., 2013, 2015 and Lutsch et al., 2016), providing emission ratios of both HCN and C2H6. Each of these studies have only considered a single or select number of events. Measurements of emissions ratios using FTIR spectrometry are dependent on the smoke plume passing over the FTIR site. However, FTIR measurements within a smoke plume may sample the plume over several days, providing temporal converge. The emission ratios derived by FTIR measurements may therefore capture the temporal variability of the emissions, resulting in a time-averaged emission ratio since the emission ratio is derived from the slope of trace gas correlations during the course of the wildfire pollution event.
Using a long-term time series and network of FTIR instruments provides several advantages to quantifying the emission ratios of biomass burning species. The long-term time series enables the detection of a greater number of wildfire pollution events as was illustrated in Sect. 3.3, all of which may have variable emissions due to vegetation type and the burning phase of combustion. The transport of emissions from a particular wildfire source to each FTIR site is dependent on the meteorological conditions; therefore each site is likely to sample different plumes of varying origins, providing a means of capturing the variability of emissions between events. These aspects enable a network of FTIR instruments to capture a large number of wildfire events to quantify the emission ratios of HCN and C2H6 along with its variability. Emission ratios derived by a network of FTIR instruments therefore provide more robust estimates of the emission ratios and their respective variability.
Our reported mean emission ratios, and their comparison to literature values, should be interpreted in light of several limitations. The enhancement and emission ratios were obtained from measurements spanning several days and therefore may not sufficiently capture shorter-term variability in wildfire emissions (e.g., Lutsch et al., 2019) and may be more susceptible to smoldering phase combustion. Smoldering phase combustion may be a persistent source of emissions that may last several weeks, leading to prolonged periods of fire-affected measurements. Chemical aging of the plume may also affect the calculated emission ratios. Here we have assumed lifetimes of CO, HCN, and C2H6; however, the actual lifetimes of these species may vary within a smoke plume, which is dependent on the availability of OH. The assumed transport times of the plume may also influence emission ratio estimates. In this study, we calculated plume travel times based on the FLEXPART back trajectories, which correspond to the sensitivity of column measurements to surface emissions. The injection of wildfire emissions into the free troposphere could enable more efficient transport, decreasing the plume travel time (Heilman et al., 2014). Thus, it is likely that the assumed travel times exceed the actual travel times. However, differences in travel times of several days will only have a minor influence on the calculated emission ratio as the assumed lifetimes of each species are much longer than the travel times. Plume diffusion and mixing with background air (McKeen and Liu, 1993; McKeen et al., 1996; Ehhalt et al., 1998; Xiao et al., 2007) may also decrease the emission ratios, which are not accounted for by the first-order loss assumed for each species; however, plume mixing may be partially captured by the loss of the linear correlation between the trace gas species in ambient or background conditions.
4.2 Wildfire contribution to CO
The GEOS-Chem tagged CO simulation provides a means of evaluating the contribution of CO from anthropogenic, chemical, and biomass burning sources to the measured CO columns at each FTIR site. Figures 7 to 10 show the daily-averaged GEOS-Chem and FTIR CO tropospheric columns (surface to 12.71 km) for the simulation period from 2003 to 2018. The relative contributions of biomass burning tracers are also shown. Biomass burning tracers with a mean contribution of less than 3 % are not shown. For all GEOS-Chem tagged CO tracers, the partial column profile was linearly interpolated onto the FTIR retrieval grid to account for the differences in surface elevation of the model and FTIR sites.
For all sites, the oxidation of CH4 is the greatest contribution to the tropospheric CO column as illustrated in Fig. 6. The magnitude of this source is similar amongst all sites, with the exception of Zugspitze and Jungfraujoch due to their high altitude. Anthropogenic Asian CO sources exhibit the greatest seasonal amplitude at all sites, due to the magnitude of the emissions and the influence of seasonally variable transport (Klonecki, 2003; Stohl et al., 2006; Fisher et al., 2010). European and North American anthropogenic sources show a similar seasonal cycle but smaller in amplitude in comparison to the Asian source. Of note, at Zugspitze and Jungfraujoch, comparable contributions from anthropogenic sources in Asia, North America, Europe, and the rest of the world are observed. The oxidation of NMVOCs is a considerable source at all sites, with little seasonal dependence. A slight increase in the NMVOC contribution is observed in the summertime, particularly in July and August, as a result of emissions of NMVOC from biogenic sources and wildfires (Guenther et al., 2000; Wentworth et al., 2018).
Biomass burning sources of CO exhibit the greatest differences amongst sites as seen in Fig. 6. For most sites, the onset of the biomass burning contribution begins in May with a maximum in August. Similar to the anthropogenic influence, Zugspitze and Jungfraujoch are generally isolated from the direct influence of biomass burning emissions and only show a minor enhancement in the summer. For Rikubetsu, the onset of the biomass burning contributions is observed earlier than for the other sites beginning in March as a result of the influence of Asian biomass burning sources (CEAS, SEAS, and EQAS), with slight influence in the summer for boreal emissions from BOAS. The contributions of the biomass burning sources to each site are discussed below.
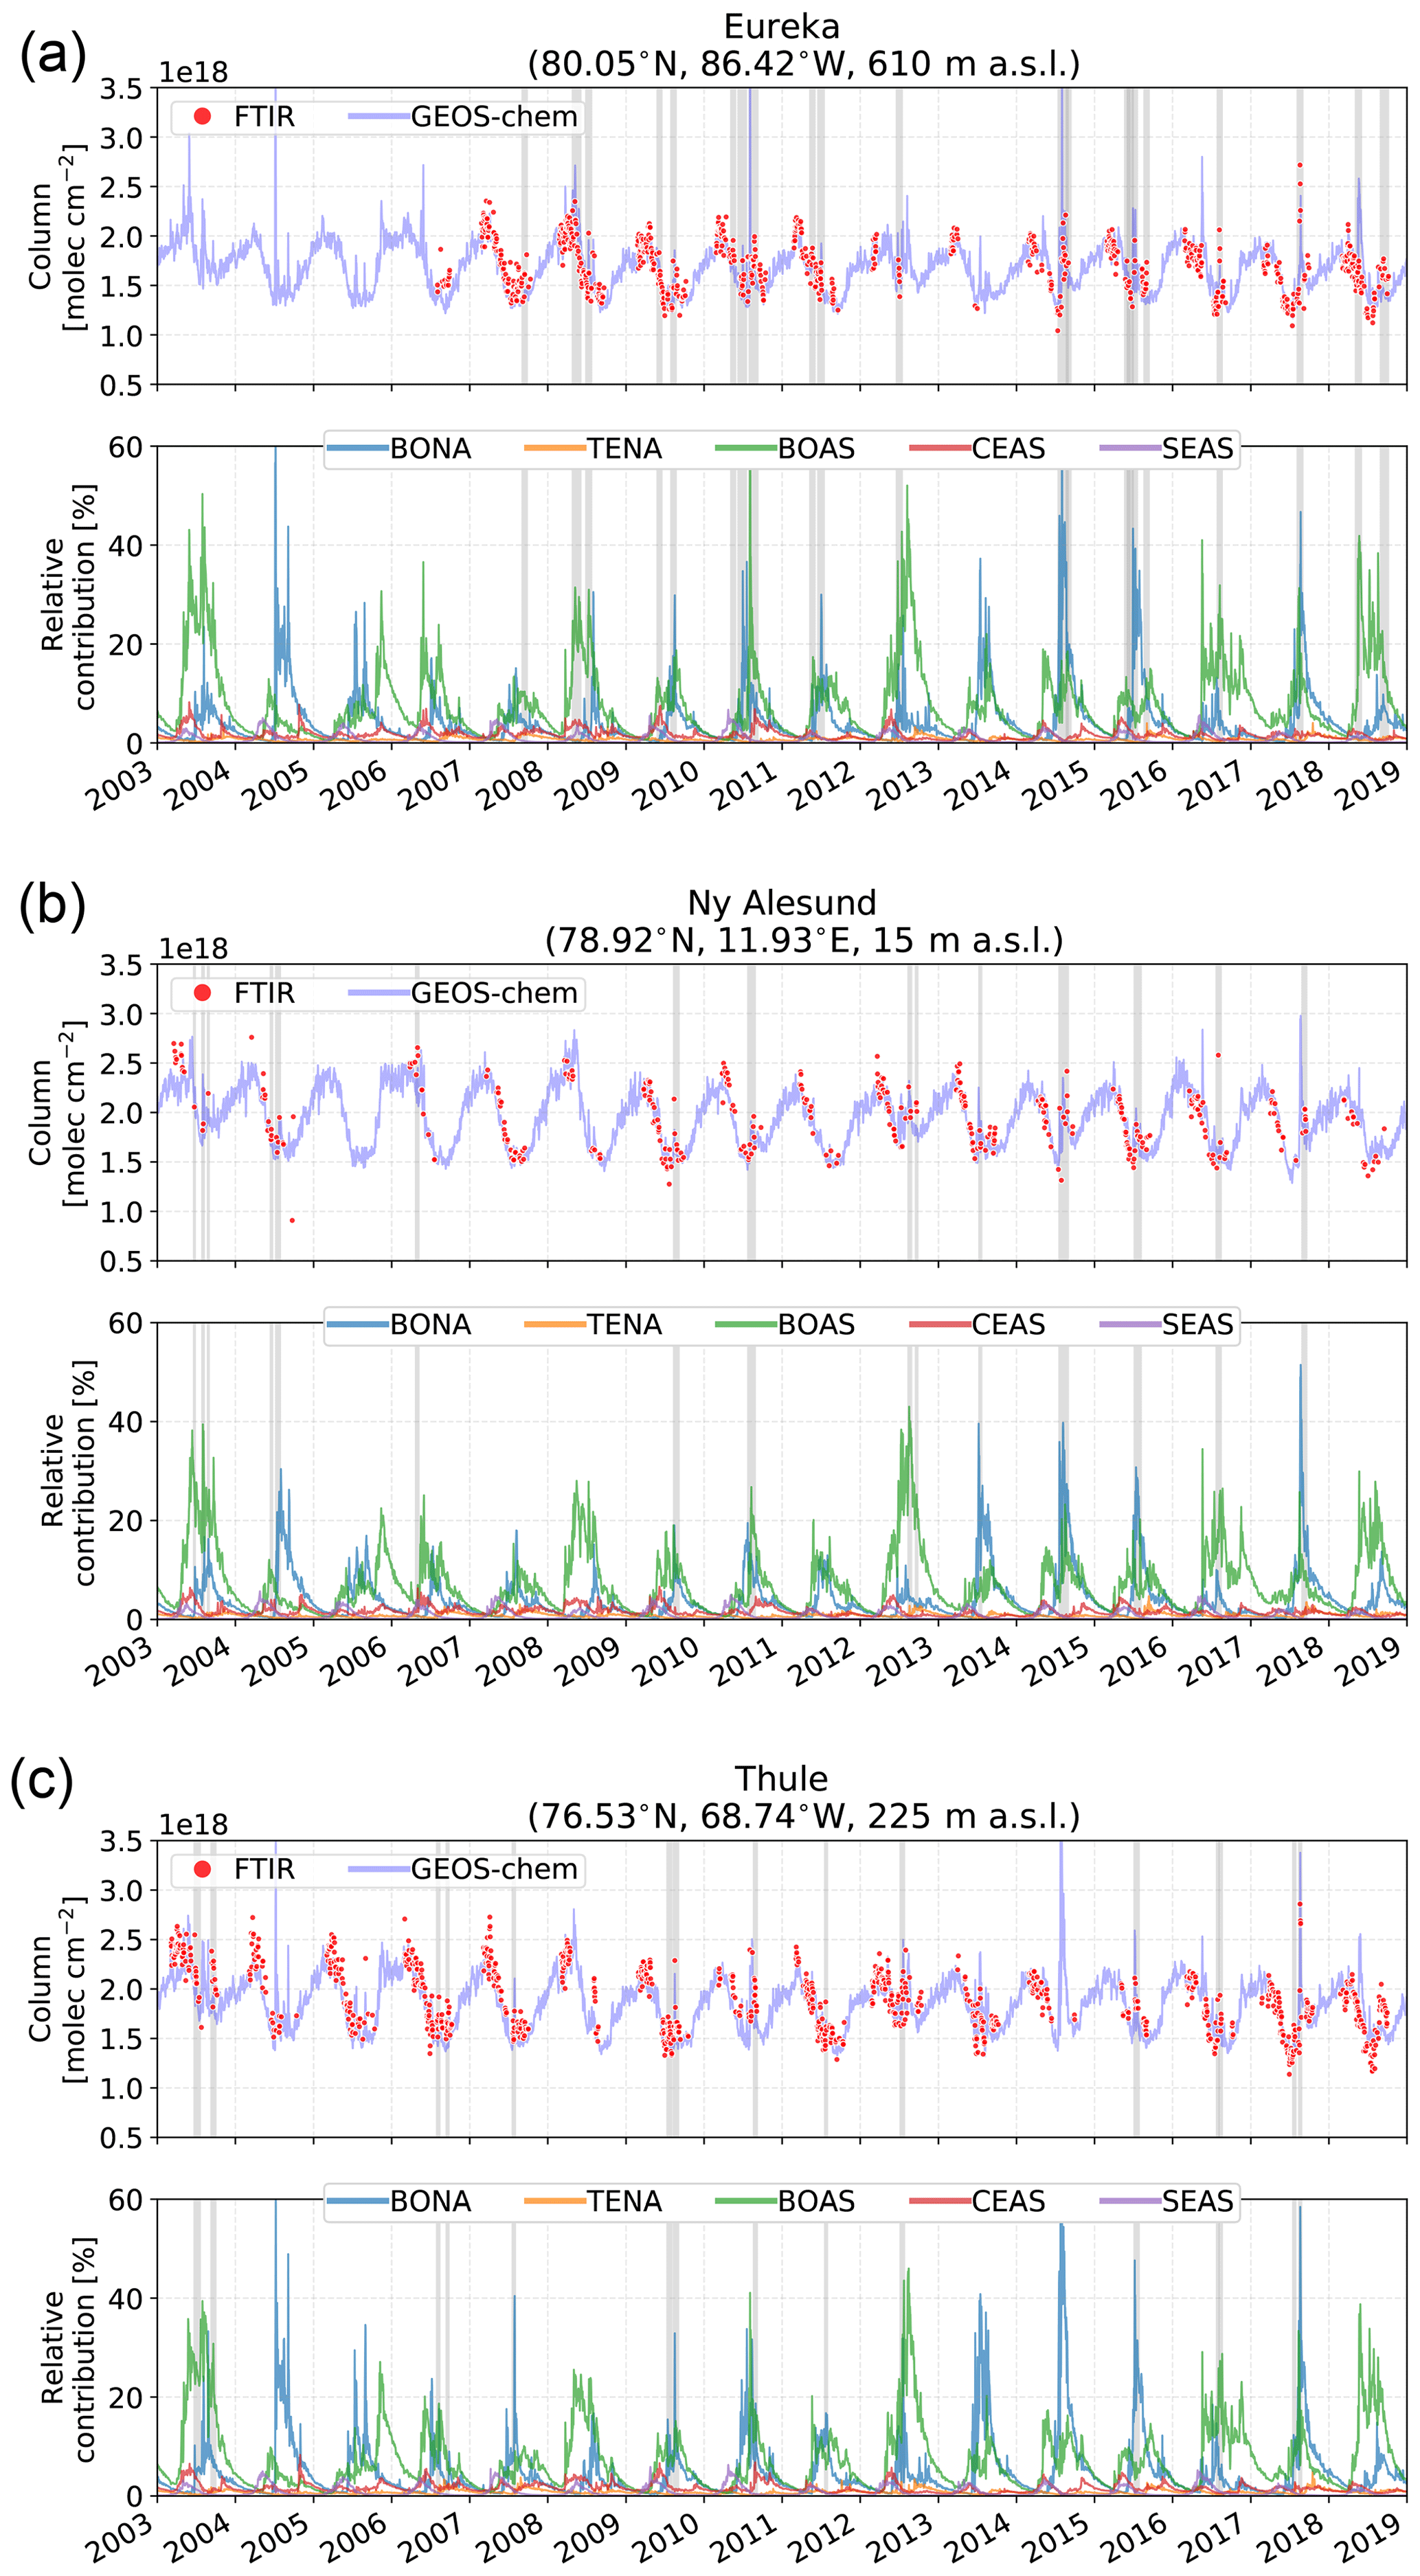
Figure 7Daily-mean CO tropospheric column time series for FTIR measurements and GEOS-Chem from 2003 to 2018 for the high-Arctic sites: (a) Eureka, (b) Ny-Ålesund, and (c) Thule. The bottom panel of each subfigure shows the relative contribution (%) of the BONA, TENA, BOAS, CEAS, and SEAS CO tracers in the GEOS-Chem simulation to the total CO tropospheric column. The grey shaded regions indicate periods of fire-affected measurements identified in the FTIR time series and summarized in Fig. 5.
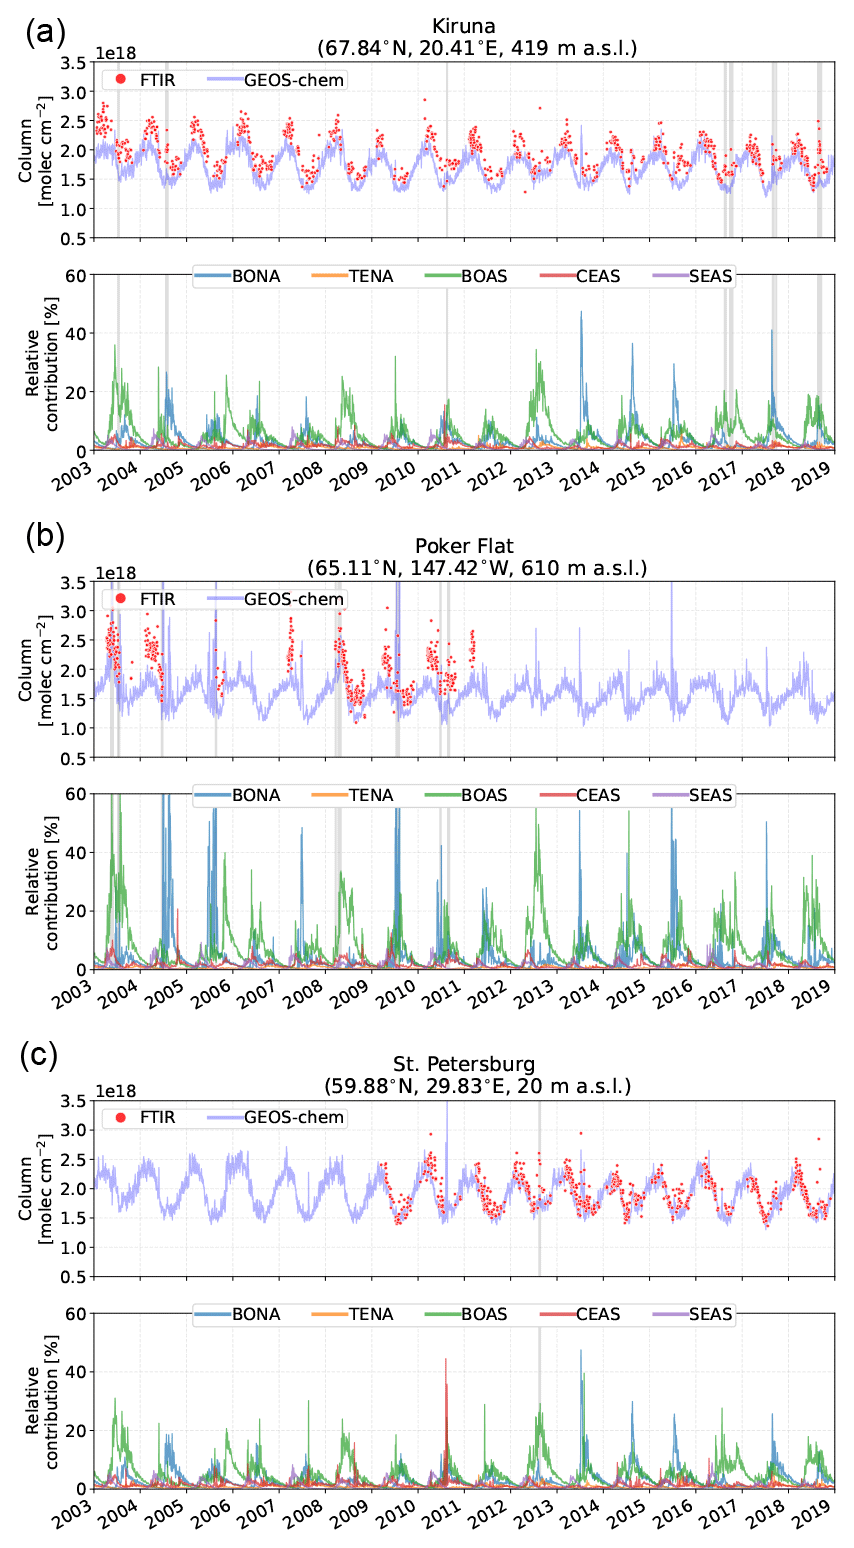
Figure 8Same as Fig. 7 but for the Arctic sites: (a) Kiruna, (b) Poker Flat, and (c) St. Petersburg.
4.2.1 High-Arctic sites
The high-Arctic sites of Eureka, Ny-Ålesund, and Thule illustrate strong summertime enhancements of CO and HCN as seen in Figs. 2 and 3, with a moderate enhancement of C2H6 shown in Fig. 4. These enhancements have a maximum in July and August, and from Fig. 7 it is observed that the enhancements are largely due to the influence of BONA and BOAS wildfires. Wildfires in temperate regions (TENA and CEAS) are a small contribution to the CO tropospheric column (<5 %) but do not contribute to the detected episodic enhancements. A moderate contribution to CO from CEAS and SEAS is observed, but these are not a source of anomalous enhancements.
Similar contributions are observed for BONA and BOAS among the high-Arctic sites, with a stronger influence from BONA to Eureka and Thule resulting in episodic enhancements of CO contributing greater than 40 % to the CO tropospheric column. The strong influence of these sources is the result of the proximity of the high-Arctic sites to these source regions, as well as the efficient summertime isentropic transport (Stohl, 2006). As a result, the direct influence of wildfire plumes at the high-Arctic sites is observed in the FTIR time series, where the effects of plume dilution are minimal.

Furthermore, an early onset in April of the BOAS contribution is observed and is likely the result of the contribution from Siberian wildfires. Siberian wildfires are associated with low-level injected emissions, mainly within the planetary boundary layer and lower free troposphere (Val Martin et al., 2018). The low-level injection of these emissions and the high latitudes of the sources favor efficient transport to the Arctic (Stohl, 2006). In contrast, the Asian sources, CEAS and SEAS, show minor contributions to the CO tropospheric columns at the high-Arctic sites. Transport of these emissions to the Arctic is limited due to the higher potential temperature of these regions in the summertime, preventing isentropic transport to the Arctic (Klonecki, 2003; Stohl, 2006).
4.2.2 Arctic sites
For the high-latitude European sites Kiruna and St. Petersburg, smaller contributions to CO from BONA and BOAS sources are observed, with peak contributions ranging from approximately 5 % to 44 % for BONA and 12 % to 37 % for BOAS, with slightly smaller contributions at Kiruna, as shown in Fig. 8. The smaller contributions from these sites in comparison to the high-Arctic sites are partly due to the greater distances from the wildfire sources. The transport of emissions to these sites is a result of long-range westerly transport that exceeds 11 d as shown in Table 4. Because of the long travel times, the plume is often diluted and therefore does not generally lead to the episodic enhancements observed at the high-Arctic sites. In contrast, Poker Flat is predominantly influenced by Alaskan wildfires, with contributions to the CO tropospheric column exceeding 50 % in many cases. Similarly, the proximity of Poker Flat to BOAS sources makes BOAS a significant contributor to episodic CO enhancements, comparable to the local BONA source.
Similar to the high-Arctic sites, contributions from TENA, CEAS, and SEAS to the Arctic sites are minimal and do not contribute to the episodic enhancements of CO, HCN, and C2H6 detected in the FTIR time series. However, Poker Flat and St. Petersburg generally exhibit greater contributions from CEAS. For Poker Flat, this is the result of Asian outflow transporting emissions from Asia over the Atlantic to Alaska. For St. Petersburg, the proximity to the CEAS sources makes it susceptible to this source. Particularly evident is the large enhancement in July and August of 2010 due to wildfires in the Moscow region (Konovalov et al., 2011; Witte et al., 2011; Yurganov et al., 2011) although not detected in the FTIR time series as there were no measurements during that period.
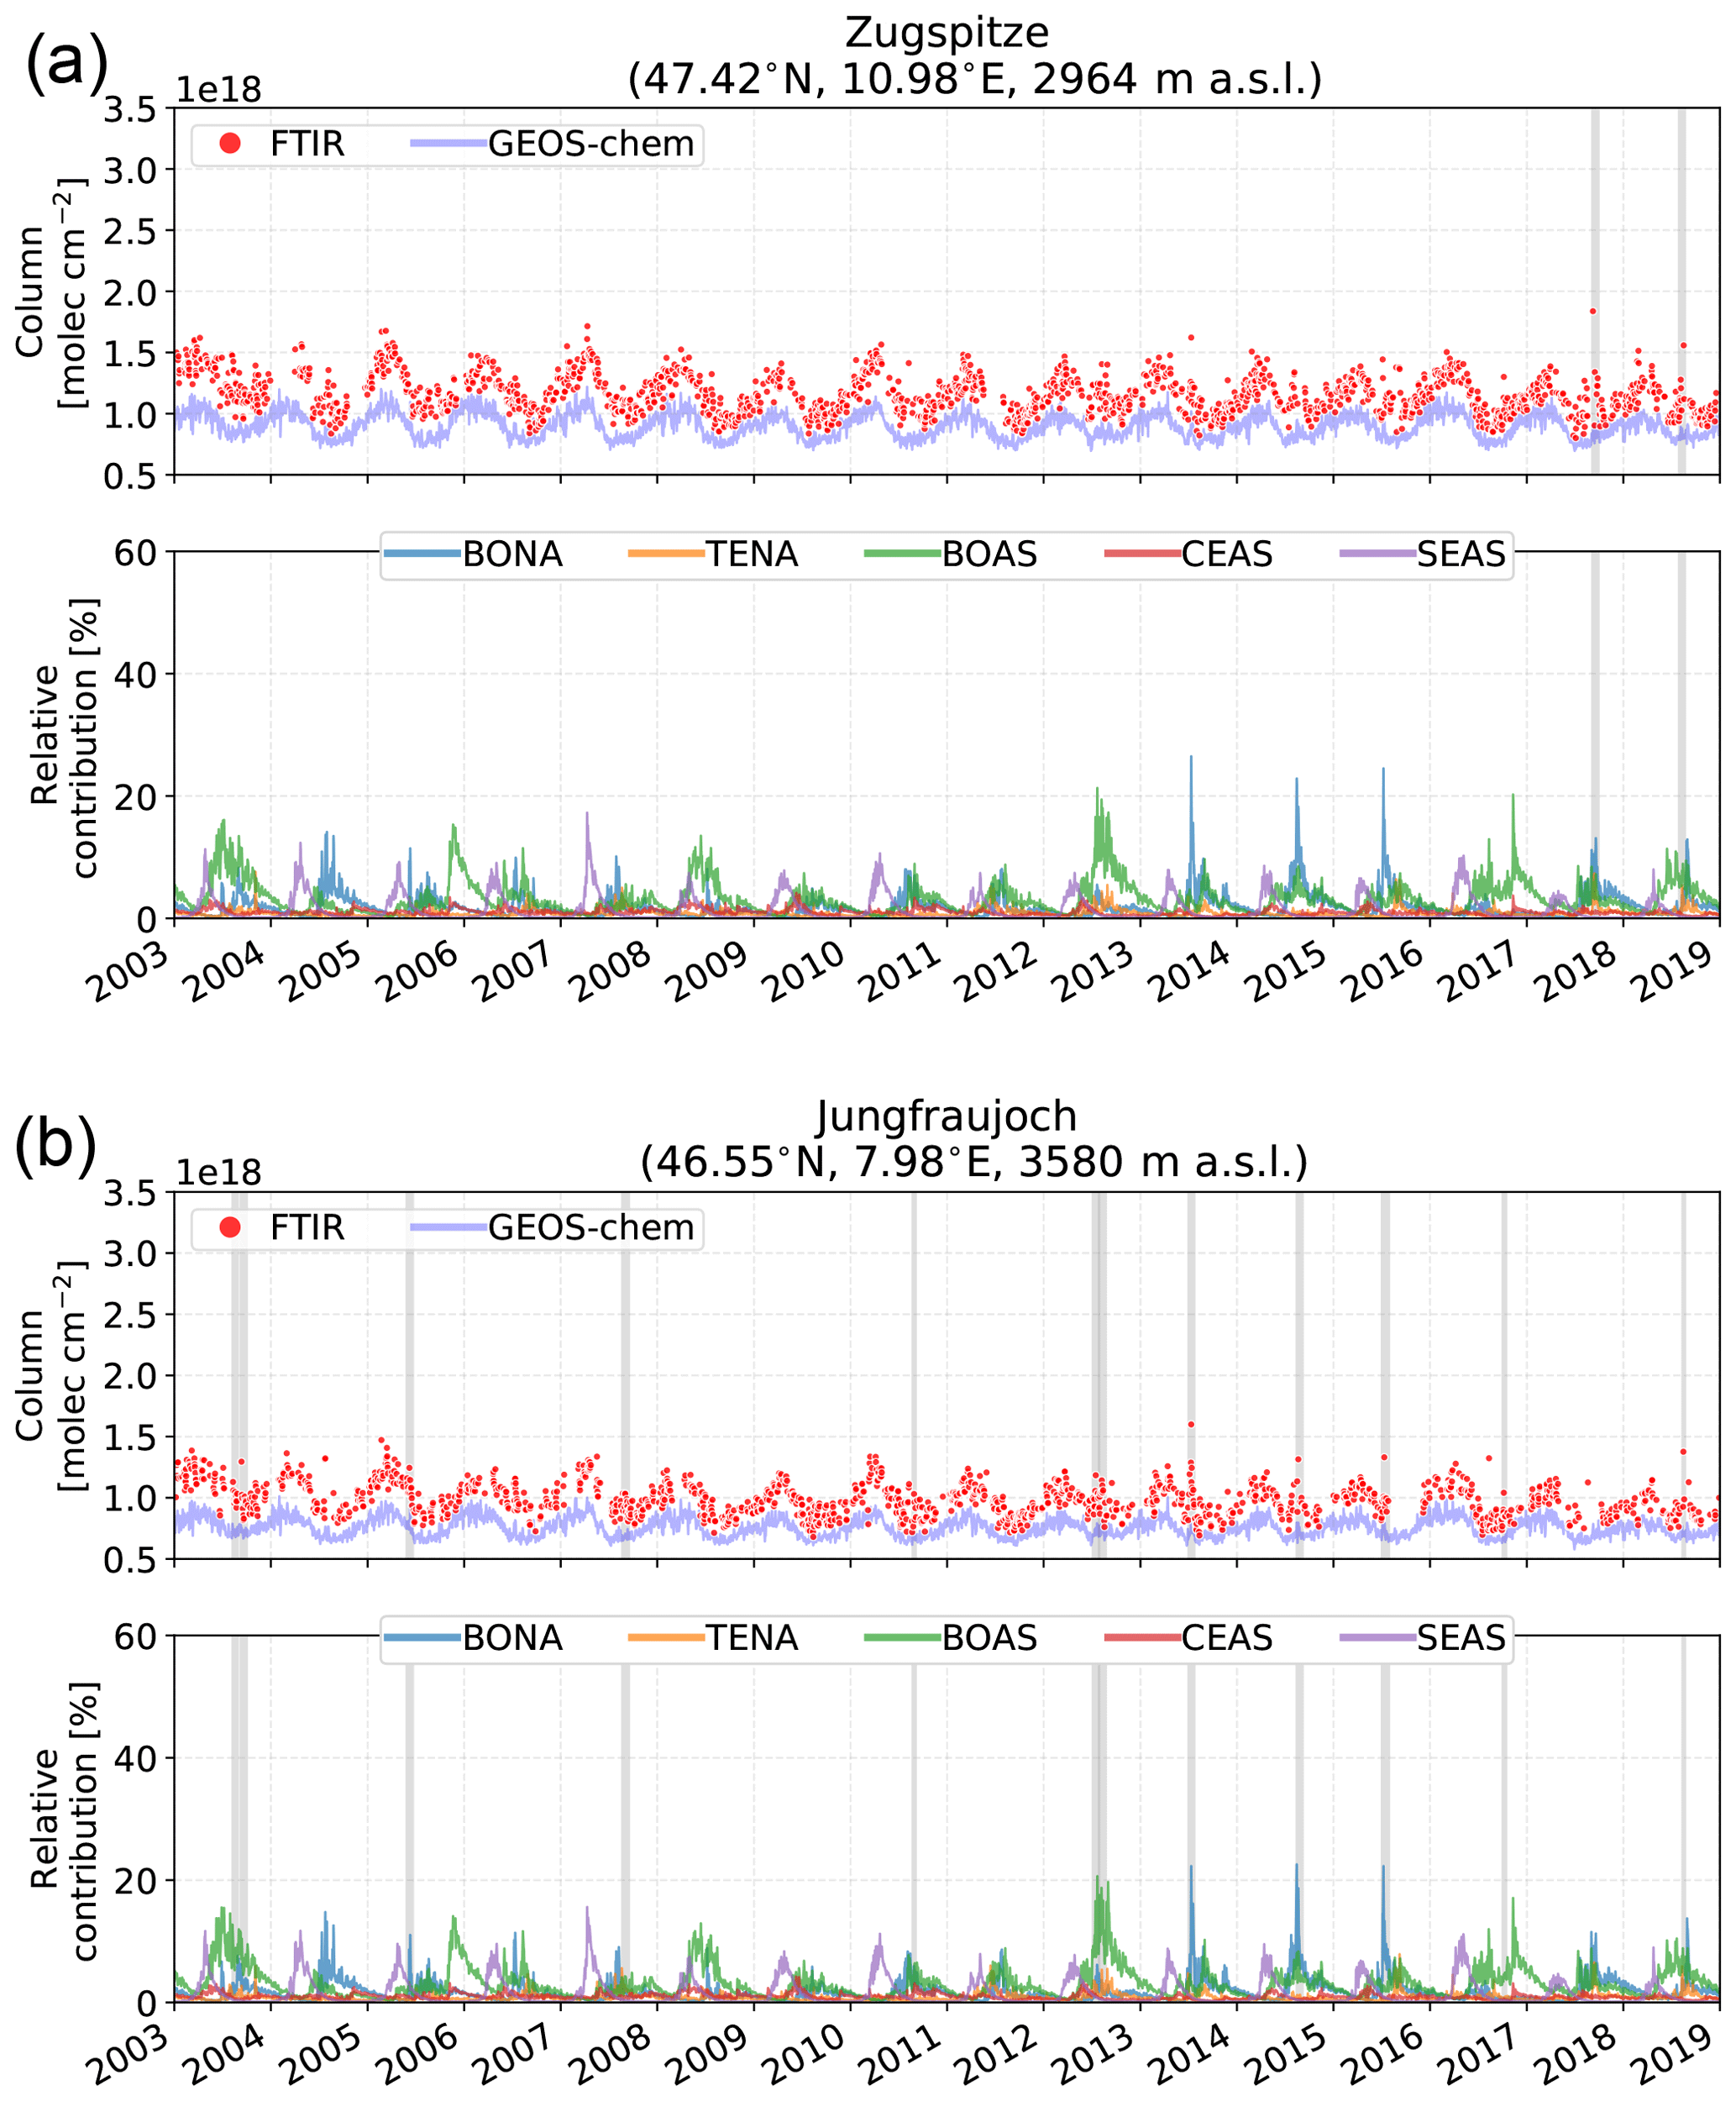
4.2.3 Alpine sites
The Alpine sites, Zugspitze and Jungfraujoch shown in Fig. 9, differ the most from the other sites considered in this study as a result of their high altitude. It is seen that Zugspitze and Jungfraujoch are most strongly influenced by BOAS, with a mean seasonal maximum contribution of approximately 14 % at both sites. The contribution of BOAS emissions to the enhanced columns at Zugspitze and Jungfraujoch is due to hemispheric-scale transport with transport times exceeding 10 d, leading to a perturbation in background concentrations of each species. As a result, the enhancements detected in the FTIR time series or GEOS-Chem do not result in the large episodic enhancements observed at the high-Arctic sites. The contributions from transatlantic transport of BONA emissions, however, exhibit these anomalous enhancements on occasion. Particularly evident are the BONA wildfires of 2013–2015 and 2018. Emissions from boreal Canadian wildfires may be injected into the free troposphere (Val Martin et al., 2018) and in some cases the lower stratosphere (Fromm et al., 2000; Khaykin et al., 2018; Peterson et al., 2018), which may enable the efficient transport of the plume over intercontinental scales (Heilman et al., 2014).
SEAS emissions are a larger contributor to CO enhancements for Zugspitze and Jungfraujoch than for the Arctic or high-Arctic sites. However, such enhancements are not observed in the FTIR time series as the contribution from SEAS is small in comparison to Asian anthropogenic sources as illustrated in Fig. 6. Transport of Asian biomass burning CO emissions to Europe had been identified in the springtime by Petetin et al. (2018) and attributed to uplifting of emissions into the free troposphere and efficient transport of the westerlies (Bey et al., 2001a). In all cases, Zugspitze and Jungfraujoch are most susceptible to emissions that reach the free troposphere where long-range transport is favored (Petetin et al., 2018).
4.2.4 Midlatitude sites
Anomalous enhancements in the Rikubetsu time series are dominated by the outflow of BOAS emissions that begin in early springtime and persist throughout the summer and fall. Episodic BOAS enhancements are observed annually, with contributions that generally exceed 20 % and are larger than 50 % in many years. The greatest enhancement from BOAS was observed in 2003 as result of the exceptional emissions from Siberia wildfires (Jaffe et al., 2004; Ikeda and Tanimoto, 2015). Although the contribution from BOAS at Rikubetsu is highly variable between years, anomalous enhancements are observed annually in the GEOS-Chem time series, while detection of events in the FTIR time series is limited by the temporal sampling of the FTIR instrument. CEAS and SEAS have moderate contributions (∼10 %) to the CO tropospheric column at Rikubetsu in the spring and fall, although the influence of these sources is often masked by the greater BOAS emissions during these periods. Other biomass burning sources have minimal contributions, and Asian anthropogenic sources are dominant throughout the year as shown in Fig. 6.
Toronto is most strongly influenced by wildfires of BONA, with detected events in the FTIR time series including 2014 from the Northwest Territories wildfires (Lutsch et al., 2016; Kochtubajda et al., 2019), 2015 from wildfires in Saskatchewan (Dreessen et al., 2016), and the 2017 British Columbia wildfires (Peterson et al., 2018). Although it is in close proximity to TENA sources, mainly from the western and southern United States, Toronto is minimally influenced by TENA as the magnitude of these emissions is much smaller than for BONA. Background contributions from CEAS and SEAS are also observed in the springtime, although the contribution from Asian anthropogenic sources is dominant. BOAS is also a significant contribution to CO at Toronto in the summertime but does not generally result in anomalous enhancements as a result of the longer transport times from this region. The 2018 enhancements were attributed to BOAS, while in June 2012, enhancements were present in the FTIR time series and appear to occur simultaneously with the large BOAS contribution (>30 %). Minor contributions (<5 %) from CEAS are observed in the springtime and fall, while a moderate influence from SEAS of ∼10 % is observed in the spring.
Boreal wildfires of North America (BONA) and Asia (BOAS) were found to be the greatest contributors to episodic CO enhancements at 10 Northern Hemisphere FTIR sites: Eureka, Ny-Ålesund, Thule, Kiruna, Poker Flat, St. Petersburg, Zugspitze, Jungfraujoch, Toronto, and Rikubetsu. Wildfire pollution events were identified by detection of enhancements of CO in the FTIR time series. With the exception of Ny-Ålesund, Poker Flat, and Rikubetsu, detected CO enhancements were correlated with coincident measurements of HCN and C2H6 to determine their enhancement ratios with respect to CO, providing evidence for wildfires as the source of these pollution events.
For the detected wildfire events, the calculated enhancement ratios of HCN and C2H6 were converted to emission ratios using a mean plume travel time calculated from FLEXPART back trajectories. Plume travel times were found to vary between sites and source regions, with a minimum of 3 d for BONA events transported to Poker Flat and a maximum of 14 d for BOAS transported to Zugspitze. With the exception of Rikubetsu (8 d) and Zugspitze (14 d), travel times were comparable for BOAS sources at all sites, ranging from 10 to 12 d on average. For BONA, the travel times varied by site, with a minimum of 3 d at Poker Flat and a maximum of 12 d at Kiruna and Ny-Ålesund.
A total of 23 emission ratios of HCN and C2H6 were found for BONA and 38 for BOAS. The calculated emission ratios were found to agree well with previous published values, illustrating the FTIR observations of this kind are able to capture the long-range transport of wildfire emissions. Average emission ratios of HCN and C2H6 for BONA of 0.0047 and 0.0092, respectively, were found, with standard deviations of 0.0014 and 0.0046, respectively. Similarly, for BOAS, mean HCN and C2H6 emissions ratios of 0.0049 and 0.0100, respectively, with standard deviations of 0.0025 and 0.0042, respectively, were found. Due to the similarity of emission ratios found for BONA and BOAS, there is no clear distinction in emissions between the two sources. Furthermore, the emission ratios found here provide additional constraints on the variability of HCN and C2H6 emissions, adding to the sparsely populated literature dataset, particularly for BOAS. Moreover, the emission ratios quantified using the long-term time series obtained from a network of FTIR instruments enabled the detection of a larger number of wildfire pollution events, allowing for more robust estimates of the HCN and C2H6 emission ratios, whereas previous studies from aircraft-, satellite-, or ground-based measurement platforms have only focused on single and or few events.
The results of this study confirm the ability of ground-based FTIR measurements to capture the transport of boreal wildfire emissions. Furthermore, we extend our findings by quantifying the contribution of wildfire sources to CO measurements at each site using the GEOS-Chem tagged CO simulations. For Eureka and Thule, BONA and BOAS sources were found to contribute to greater than 40 % of the CO tropospheric partial column in many cases. A similar influence of BONA and BOAS wildfires was observed at Ny-Ålesund. Kiruna was also strongly influenced by the transatlantic transport of BONA emissions and hemispheric transport of BOAS emissions, which may contribute ∼5 %–40 % of the CO tropospheric partial column during the summer months from June though September of each year. A similar contribution was observed at St. Petersburg, albeit lower in magnitude. The GEOS-Chem tagged CO simulation illustrated the strong influence of both BONA and BOAS sources at Poker Flat, which in several years exceeded 60 % of the CO tropospheric column.
The Alpine sites, Zugspitze and Jungfraujoch, are isolated from major biomass burning sources, but on occasion they are subject to the transport of both BONA and BOAS emissions, which were detected in the FTIR time series at both sites. However, these emissions are generally a small contribution to the tropospheric CO partial column (∼10 %). Toronto was mainly influenced by North American wildfires of BONA contributing ∼10 %–20 % of the CO column. Asian anthropogenic sources strongly influence the CO background at Rikubetsu, which was also considerably influenced by BOAS wildfires.
Given the substantial contribution of wildfire sources to CO at sites in this study, and the ability of FTIR spectrometers to quantify wildfire emissions, future studies should examine the long-term effect of biomass burning emissions on reactive trace gas species. Reactive trace gas species of interest that are be readily measured by FTIR spectrometry include acetylene (C2H2; e.g., Paton-Walsh et al., 2010; Vigouroux et al., 2012; Viatte et al., 2014, 2015), methanol (CH3OH; e.g., Rinsland et al., 2009; Vigouroux et al., 2012; Viatte et al., 2014, 2015), formic acid (HCOOH; e.g., Zander et al., 2010; Viatte et al., 2014, 2015), formaldehyde (H2CO;Paton-Walsh et al., 2004; Vigouroux et al., 2009; Viatte et al., 2014, 2015; Vigouroux et al., 2018), and ammonia (NH3; e.g., Paton-Walsh et al., 2004; Dammers et al., 2015; Lutsch et al., 2016, 2019). FTIR measurements can inform future studies to characterize the long-range transport of these species to elucidate the chemical mechanisms within a smoke plume and potential impacts on air quality.
The averaging kernel characterizes the vertical information content of the retrievals as described in Rodgers (2000). We consider the total column averaging kernel (a) rather than the averaging kernel matrix (A). We define the total column averaging kernel vector:
where C is the total column operator in units of molecules per square centimeter, and T denotes the transpose. The VMR averaging kernel matrix A is in VMR ∕ VMR units. The total column averaging kernel may be normalized:
where i is the index of the ith level of the FTIR vertical retrieval grid. The normalized total column averaging kernel () is unitless and represents the sensitivity to a change in partial column for the vertical level i. The normalized total column averaging kernel may then be applied to the partial column profile to obtain the smoothed column, as shown in Sect. 3.2.
For all species and sites, the total column averaging kernels are not highly variable in time. The variability of the total column averaging kernel is mainly due the changes in the vertical distribution of the species. In particular, total column averaging kernel values generally increase with greater concentration of the species. There is some dependence on the solar zenith angle (SZA) of the measurement which varies seasonally, as the SZA is related to the sampled slant path through the atmosphere. At high SZAs, the longer slant path results in greater degrees of freedom for signal (DOFS) and hence greater averaging kernel values. The a priori covariance matrix, which is site and species dependent, also influences the total column averaging kernel.

Figure A1Mean retrieved (red) and a priori (black) VMR profiles of CO taken over all years of measurements at each site. The shaded region indicates the 1σ standard deviation from the mean. The circle markers indicate the layer centers of the FTIR vertical retrieval grid.

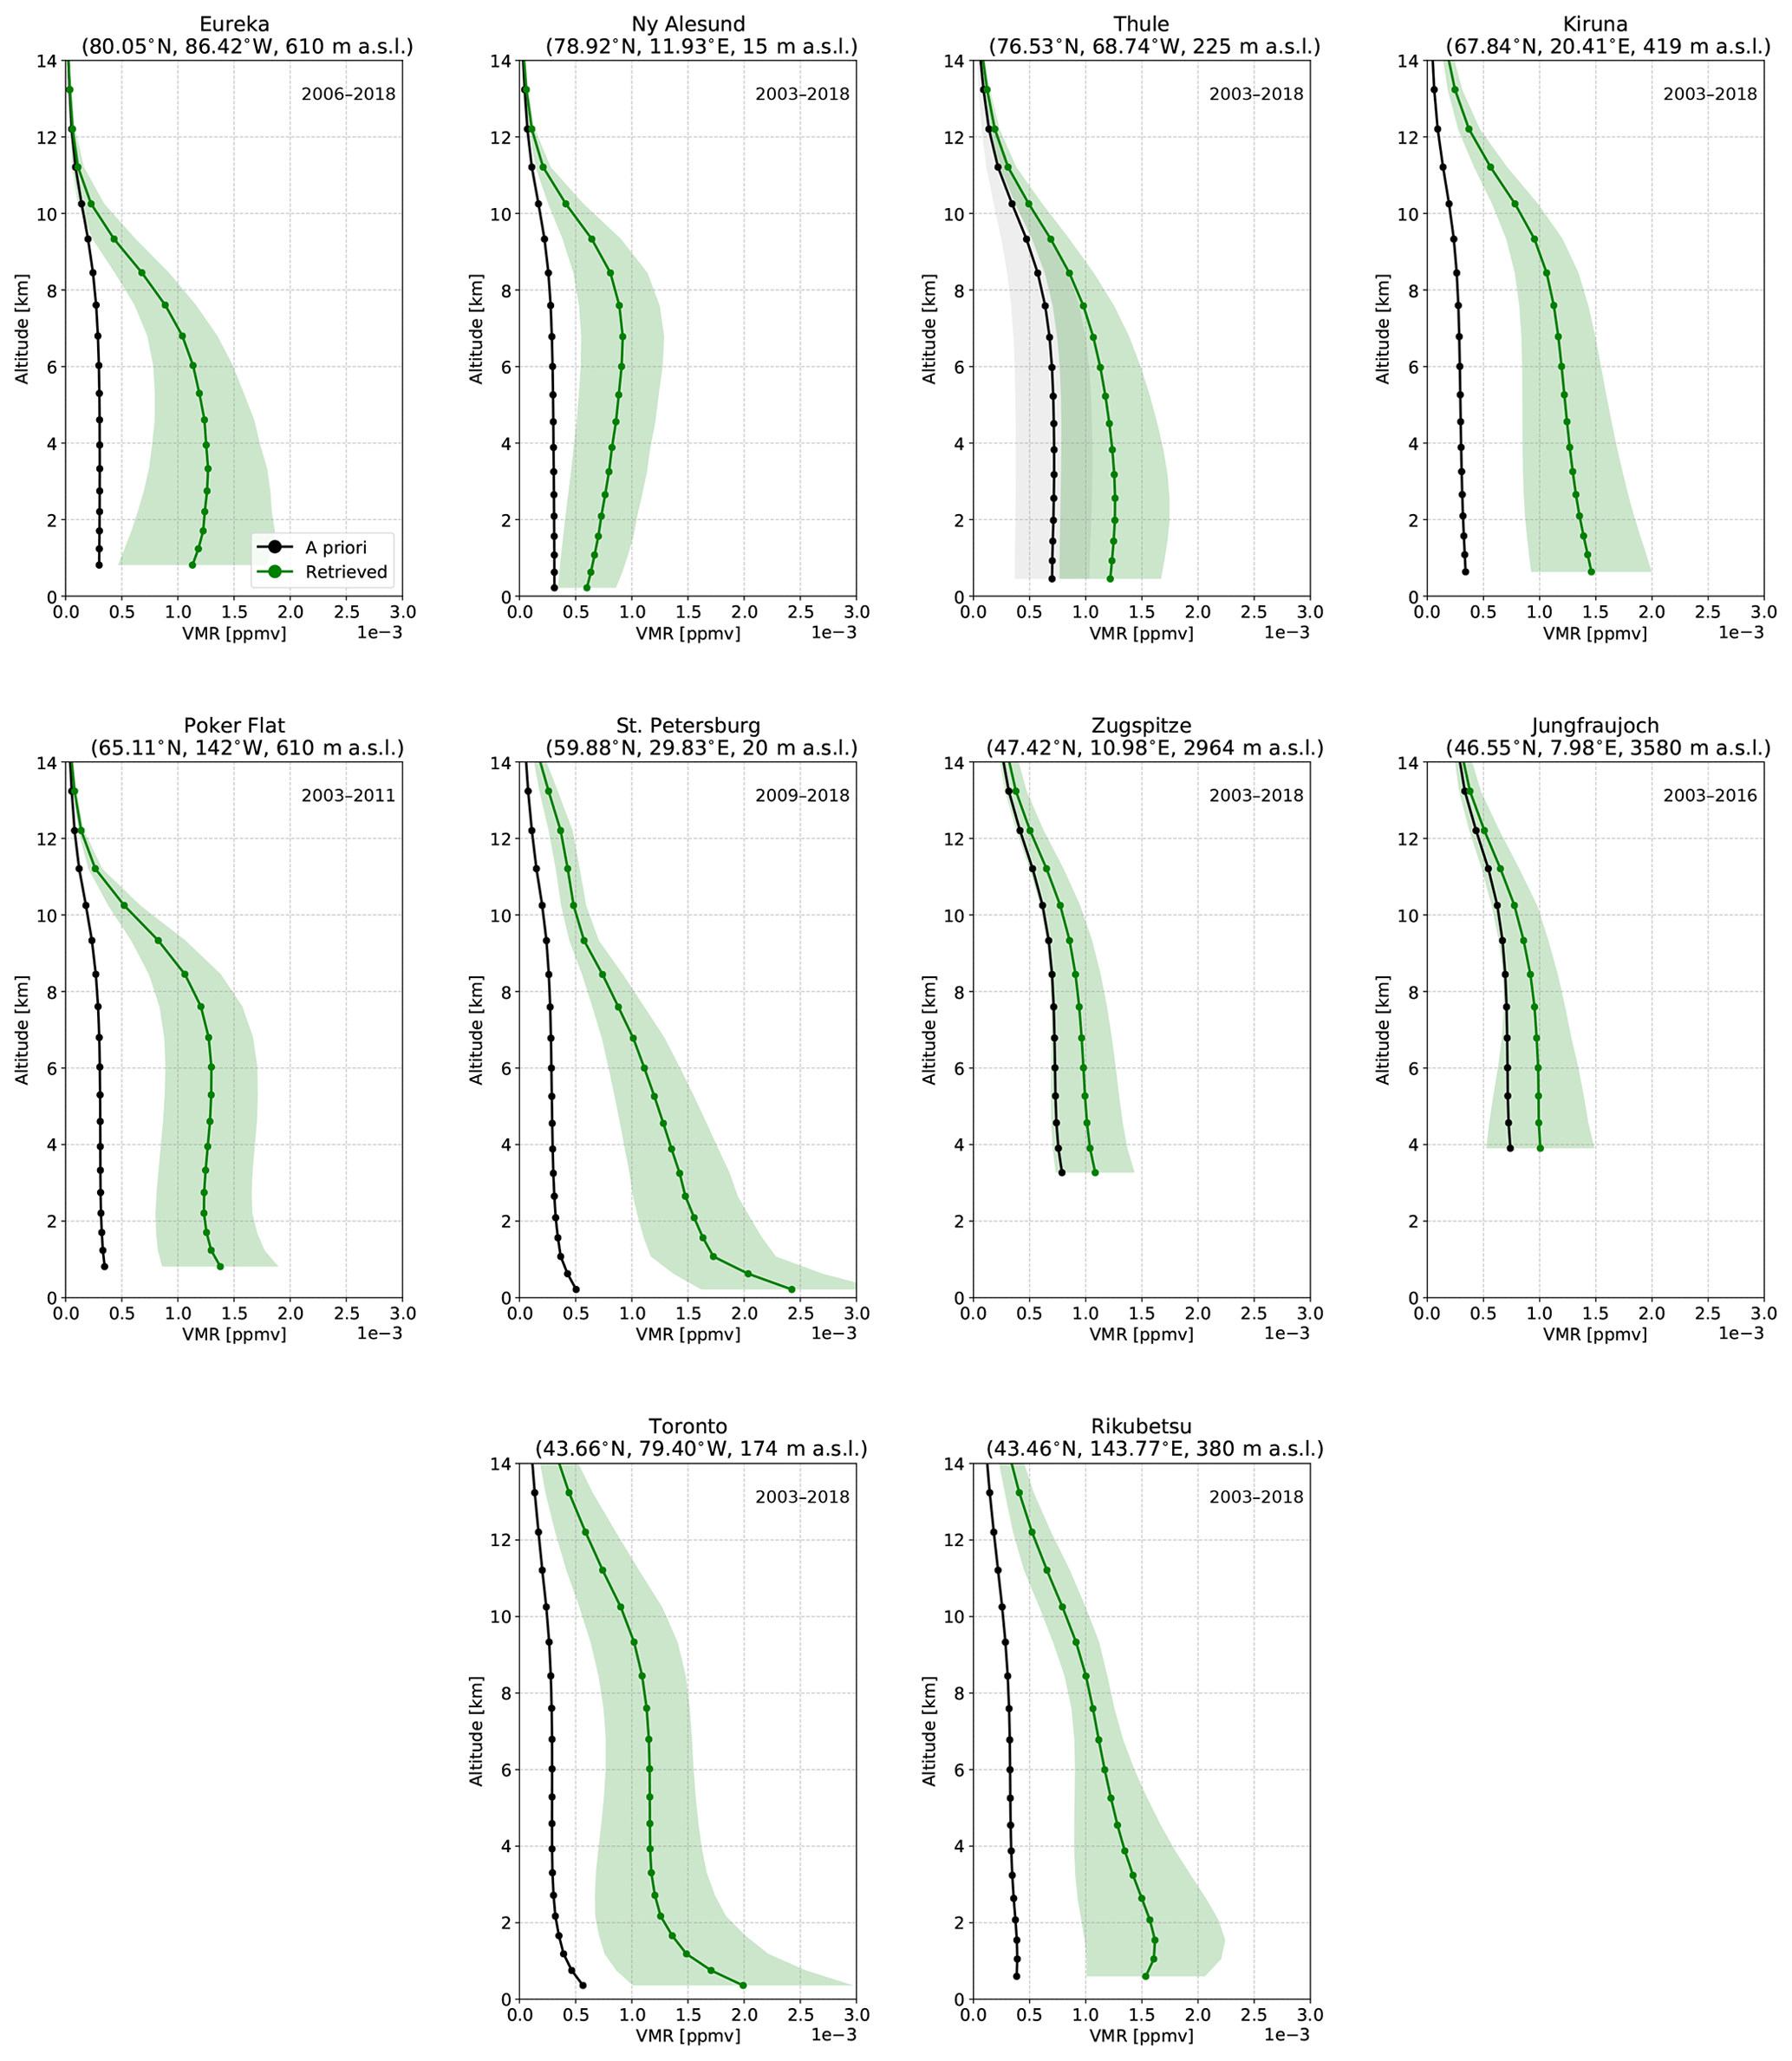

Figure A4Mean CO, HCN, and C2H6 normalized total column averaging kernels (molec. cm−2/molec. cm−2), taken over all years of measurements at each site. The shaded region indicates a 1σ standard deviation from the mean. The circle markers indicate the layer centers of the FTIR vertical retrieval grid.
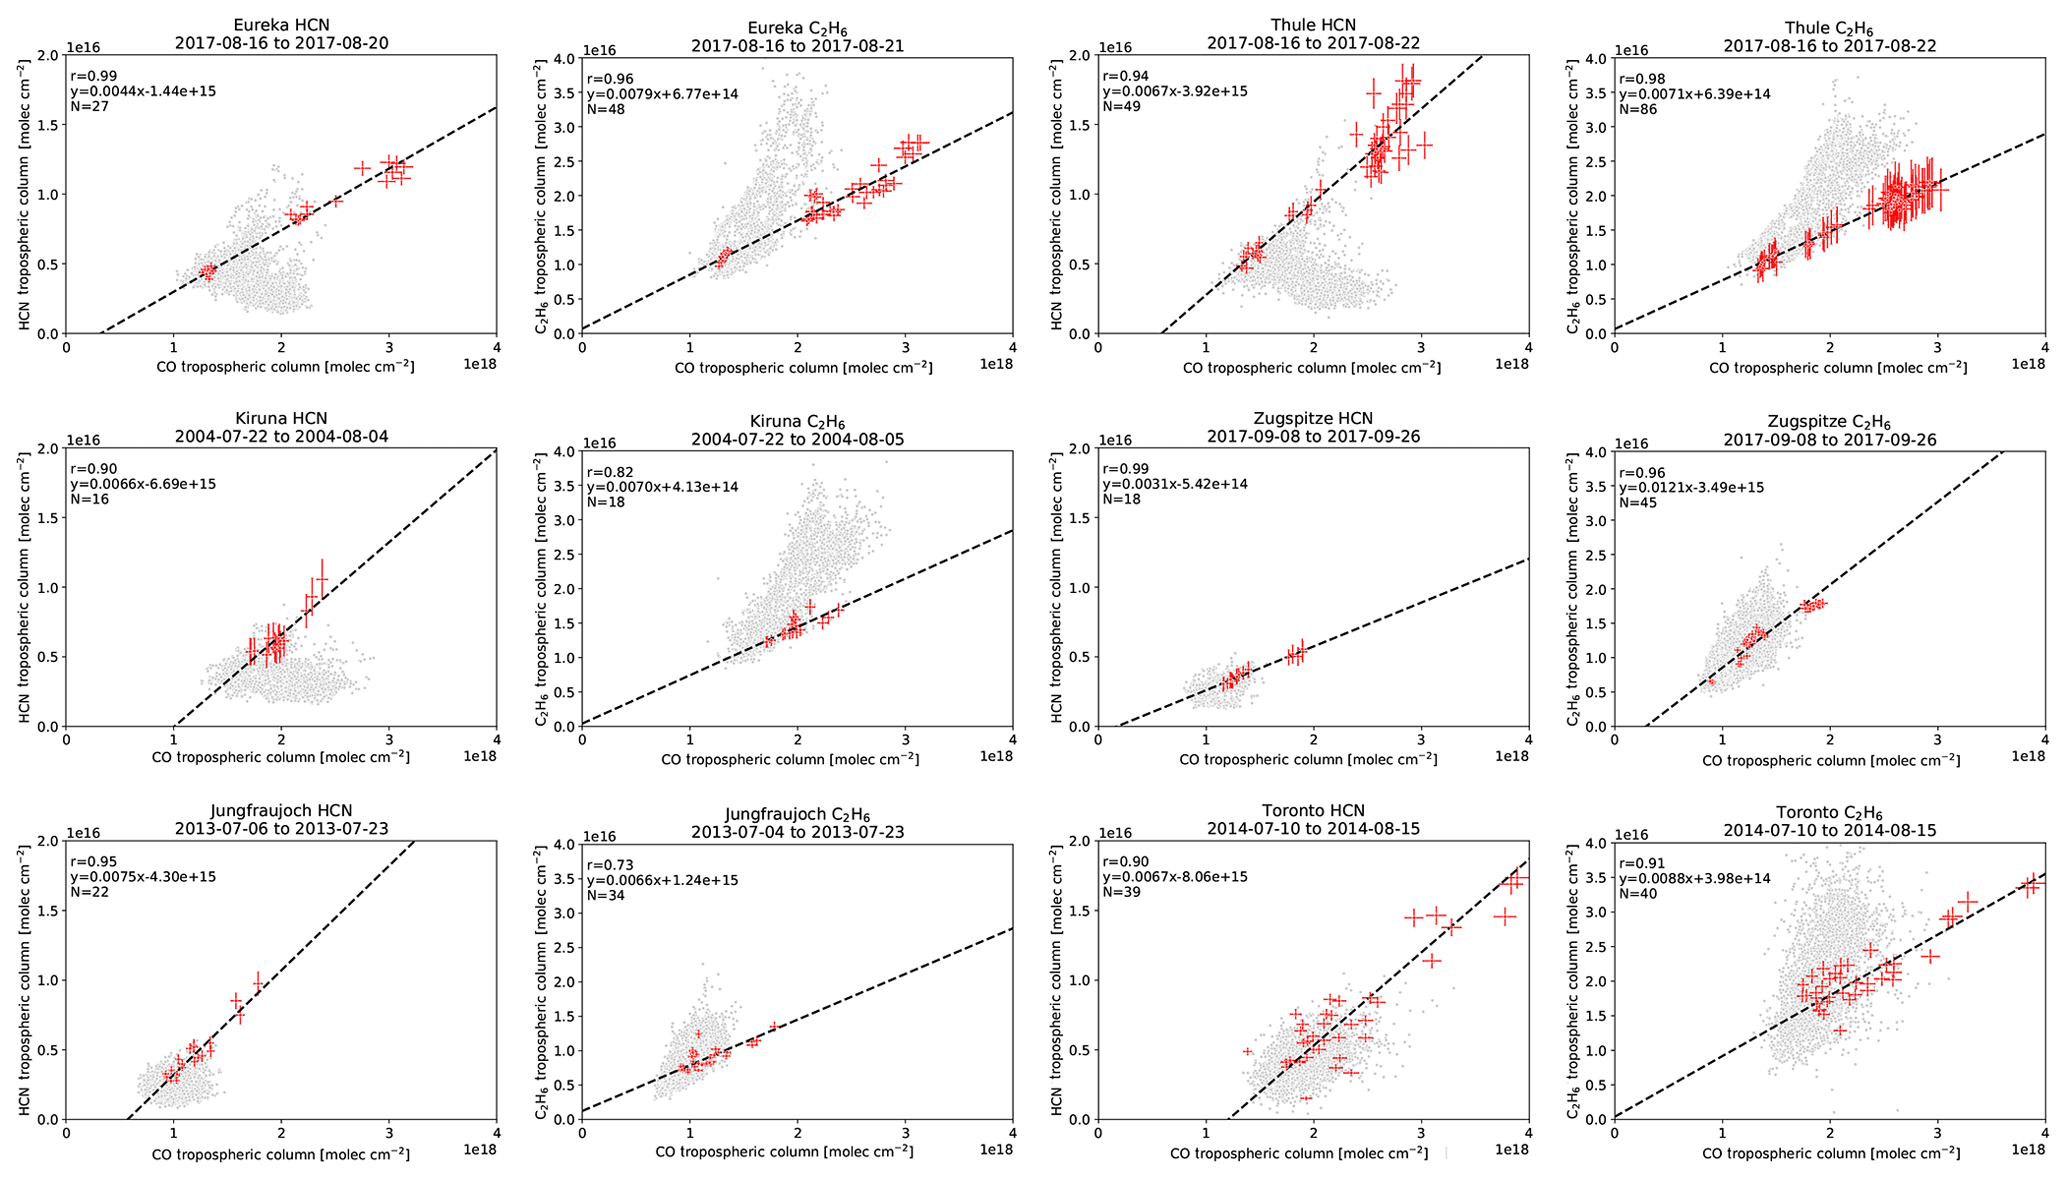
Figure A5Examples of the enhancement ratios of HCN and C2H6 for a selected BONA wildfire pollution event at each site. The grey points indicate all years of measurements. The red points are measurements taken during the fire-affected period stated in the subplot title. The dashed black line is the linear regression to the red points. The number of measurements (N), linear equation, and correlation coefficient (r) are also shown.
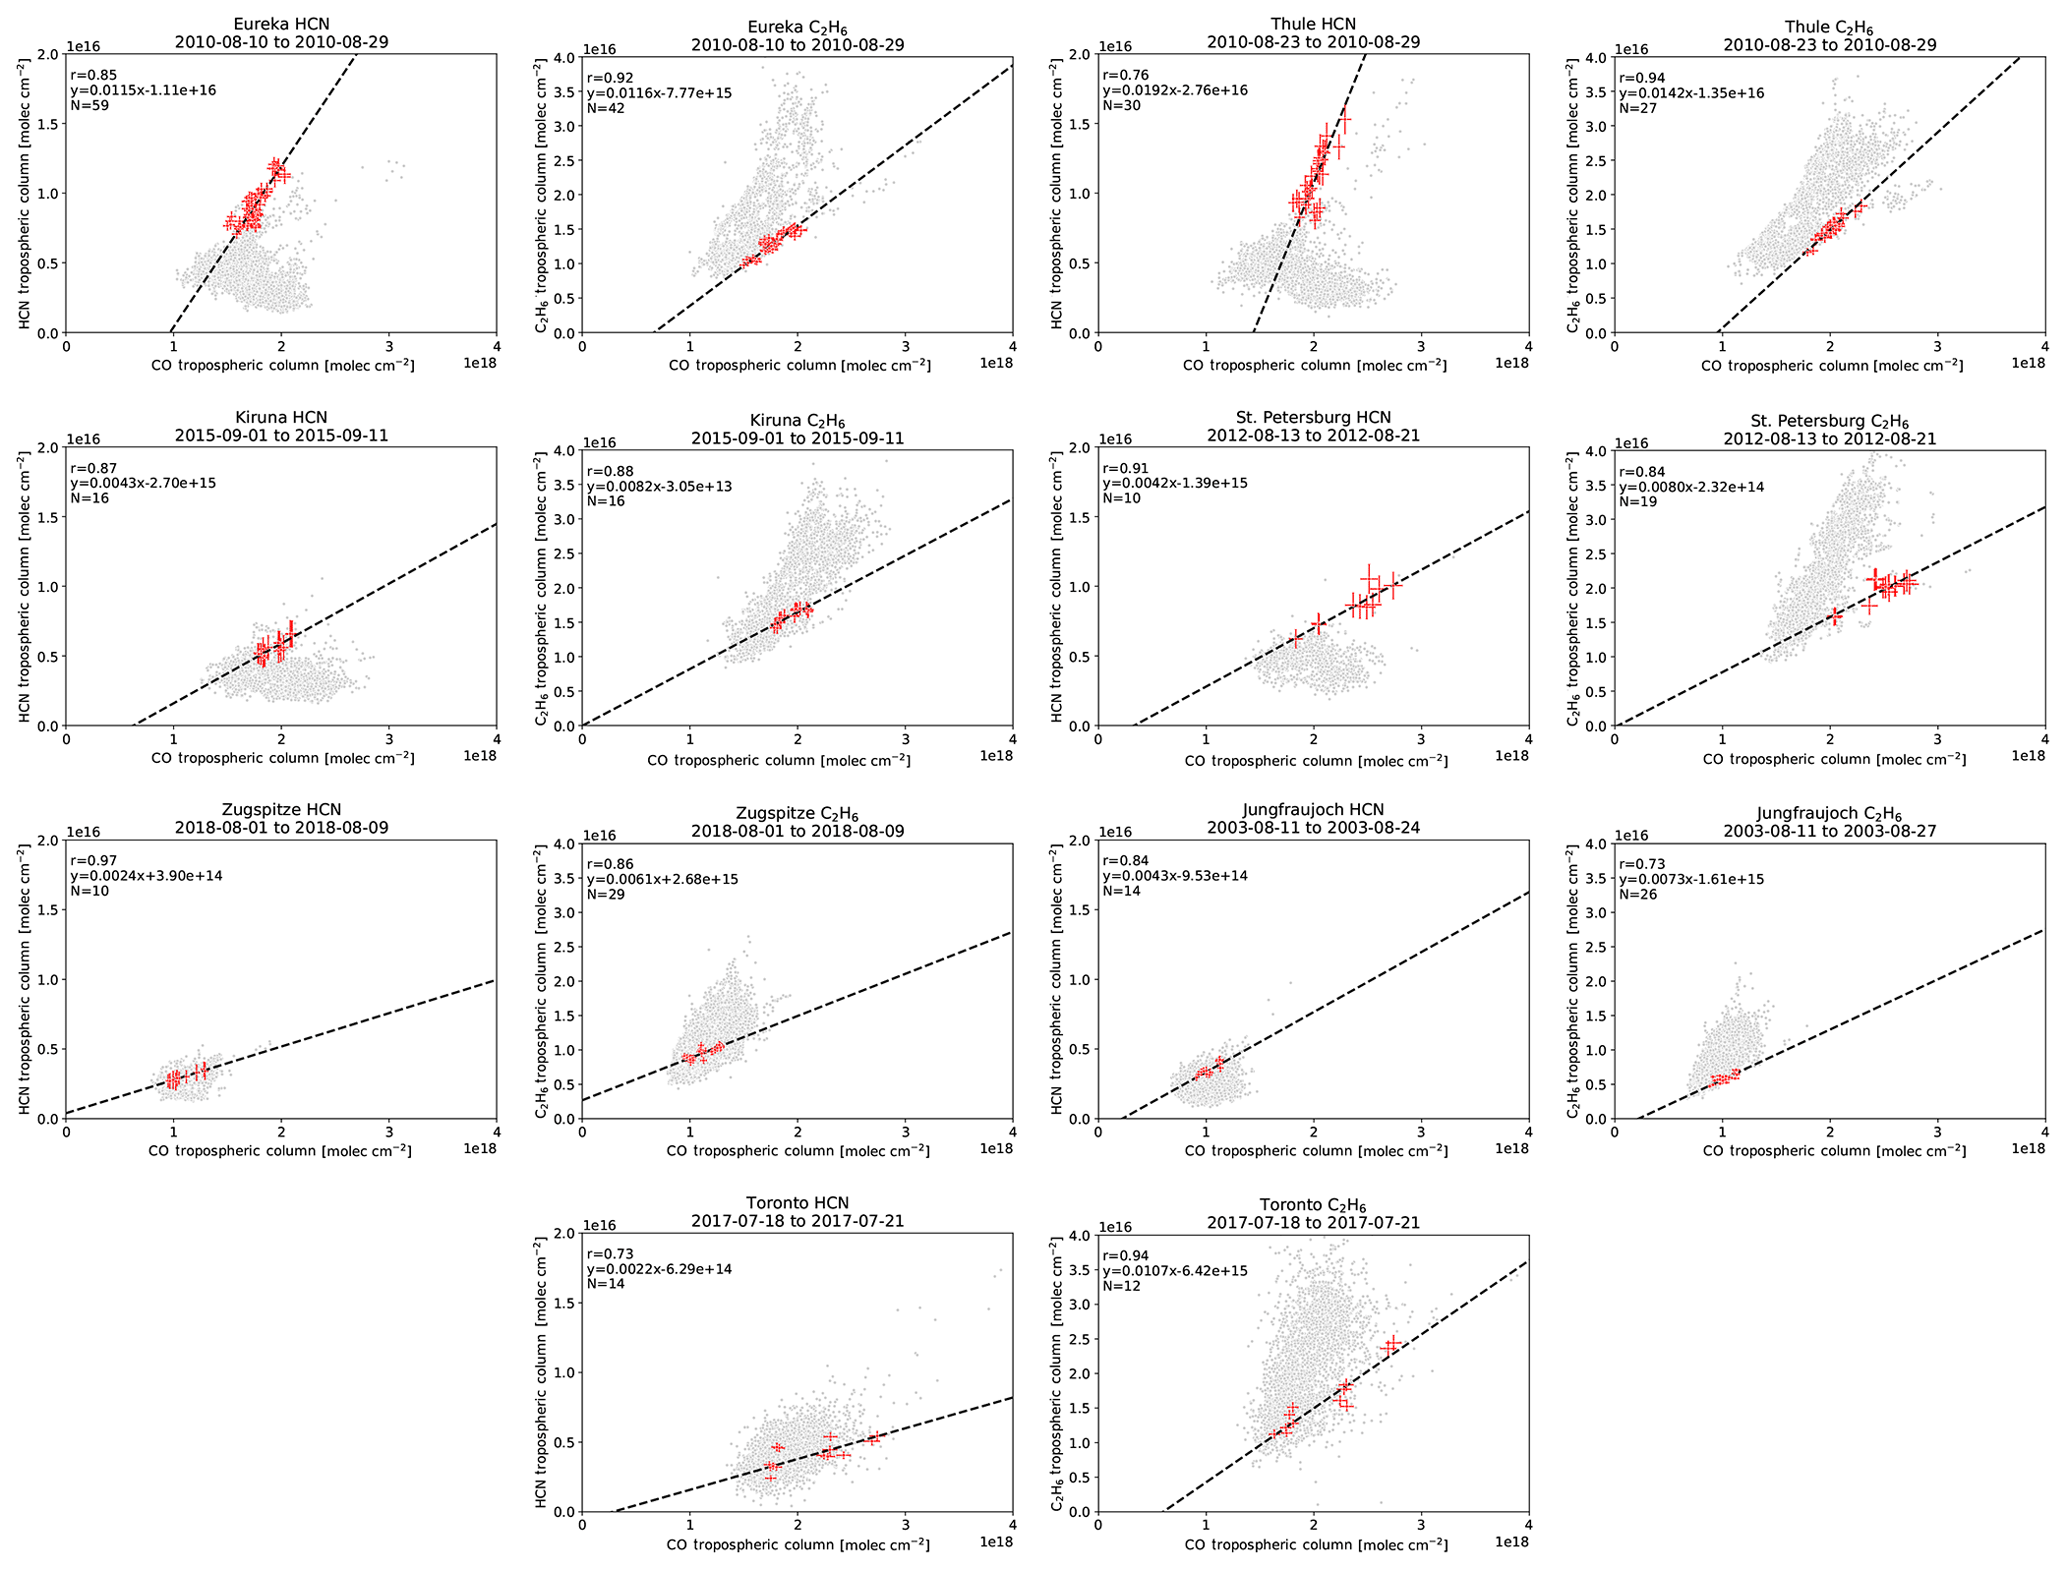
The FTIR data are available from the NDACC data repository at ftp://ftp.cpc.ncep.noaa.gov/ndacc/ (InfraRed working Group, 2020). The GEOS data used in this study have been provided by the Global Modeling and Assimilation Office (GMAO) at NASA Goddard Space Flight Center. The GEOS-Chem model code used is available here: https://doi.org/10.5281/zenodo.2249246 (The International GEOS-Chem User Community, 2018). The AERONET data used are available here: https://aeronet.gsfc.nasa.gov/cgi-bin/draw_map_display_aod_v3 (Arosol Robotic Network, 2019). FLEXPART was downloaded from https://www.flexpart.eu/downloads (Flexible Particle Model Developers, 2019). Any additional data may be obtained from Erik Lutsch (elutsch@physics.utoronto.ca).
This study was designed by EL, KS, and DBAJ. TB, SC, JWH, FH, YK, EM, MM, IM, TN, JN, IO, MO, AVP, RS, and TW contributed to the FTIR measurements used. JAF contributed to the updated GEOS-Chem tagged CO simulation that was used. The analysis was performed by EL. The paper was prepared by EL with contributions from all authors.
The authors declare they have no competing interests.
Bruker FTIR measurements were made at PEARL by the Canadian Network for the Detection of Atmospheric Composition Change (CANDAC), which has been supported by the Atlantic Innovation Fund/Nova Scotia Research Innovation Trust, Canada Foundation for Innovation, Canadian Foundation for Climate and Atmospheric Sciences, Canadian Space Agency (CSA), Environment and Climate Change Canada (ECCC), Government of Canada International Polar Year funding, Natural Sciences and Engineering Research Council (NSERC), Northern Scientific Training Program, Ontario Innovation Trust, Polar Continental Shelf Program, and Ontario Research Fund. Erik Lutsch was partially supported by the NSERC CREATE Training Program in Arctic Atmospheric Science and the Probing Atmosphere in the High Arctic (PAHA) project. We thank CANDAC/PEARL/PAHA PI James Drummond, Canadian Arctic ACE/OSIRIS Validation Campaign PI Kaley Walker, PEARL Site Manager Pierre Fogal, CANDAC Data Manager Yan Tsehtik, the CANDAC operators, and the staff at ECCCs Eureka Weather Station for their contributions to data acquisition, and for logistical and on-site support.
The National Center for Atmospheric Research (NCAR) is sponsored by the U.S. National Science Foundation (NSF). The NCAR FTIR observation program at Thule, Greenland, is supported under contract by the National Aeronautics and Space Administration (NASA). The Thule work is also supported by the NSF Office of Polar Programs (OPP). We wish to thank the Danish Meteorological Institute for support at the Thule site. KIT, IMK-ASF would like to thank Uwe Raffalski and Peter Voelger from the Swedish Institute of Space Physics (IRF) for their continuing support of the NDACC-FTIR site Kiruna. St. Petersburg State University was supported by the RFBR project no. 18-05-00011. Mathias Palm gratefully acknowledges funding from the Deutsche Forschungsgemeinschaft (DFG, German Research Foundation; project number 268020496, TRR 172) within the Transregional Collaborative Research Center ArctiC Amplification: Climate Relevant Atmospheric and SurfaCe Processes, and Feedback Mechanisms (AC)3” in subproject E02. St. Petersburg FTIR measurements were carried out by the instrumentation of the Geomodel Resource Center of SPbU. The monitoring program of ULiège at Jungfraujoch was primarily supported by the Fonds de la Recherche Scientifique – FNRS under grant no. J.0147.18, the Fédération Wallonie-Bruxelles, and MeteoSwiss (GAW-CH program). Emmanuel Mahieu is a Research Associate with the F.R.S.–FNRS. We thank the International Foundation High Altitude Research Stations Jungfraujoch and Gornergrat (HFSJG, Bern). We are grateful to all colleagues who contributed to spectra acquisition for the Jungfraujoch site. JAF acknowledges funding from the University of Wollongong and the Australian Research Council (DP160101598) as well as computational resources provided at the NCI National Facility systems at the Australian National University through the National Computational Merit Allocation Scheme supported by the Australian Government. Operation at the Rikubetsu site is supported in part by the GOSAT series project.
The authors acknowledge the use of AERONET data and thank Norm O'Neill, Ihab Abboud Vitali Fioletov, Brent Holben, Piotr Sobolewski, Piotr Glowacki, Grzegorz Karasinski, Victoria E. Cachorro Revilla, Sandra Blindheim, John R. Vande Castle, Margit Aun, Natalia Kouremeti, Itaru Sano, and their staff for establishing and maintaining the nine sites used in this investigation. The authors acknowledge the use of the GFASv1.2 emissions inventory, which contains modified Copernicus Atmosphere Monitoring Service information (2019). We also acknowledge Mathew J. Evans, Eleanor Morris, and Killian Murphy for providing the GFASv1.2 netCDF files. The authors also acknowledge the use of the FLEXPART Lagrangian dispersion model (https://www.flexpart.eu/wiki/FpDownloads, last access: 15 November 2019). The GEOS data used in this study have been provided by the Global Modeling and Assimilation Office (GMAO) at NASA Goddard Space Flight Center.
This research has been supported by the National Science and Engineering Research Council (grant no. 384996-2010) and the National Science and Engineering Research Council (grant no. 433842-2012).
This paper was edited by Robert McLaren and reviewed by two anonymous referees.
Arosol Robotic Network: AERONET datasets, AERONET, available at: https://aeronet.gsfc.nasa.gov/cgi-bin/draw_map_display_aod_v3, last access: 1 January 2019. a
Akagi, S. K., Yokelson, R. J., Wiedinmyer, C., Alvarado, M. J., Reid, J. S., Karl, T., Crounse, J. D., and Wennberg, P. O.: Emission factors for open and domestic biomass burning for use in atmospheric models, Atmos. Chem. Phys., 11, 4039–4072, https://doi.org/10.5194/acp-11-4039-2011, 2011. a, b, c, d, e, f, g, h
Amiro, B. D., Cantin, A., Flannigan, and de Groot, W. J.: Future emissions from Canadian boreal forest fires, Can. J. Forest Res., 39, 383–395, https://doi.org/10.1139/X08-154, 2009. a, b
Andreae, M. O.: Emission of trace gases and aerosols from biomass burning – an updated assessment, Atmos. Chem. Phys., 19, 8523–8546, https://doi.org/10.5194/acp-19-8523-2019, 2019. a, b, c, d, e, f
Andreae, M. O. and Merlet, P.: Emission of trace gases and aerosols from biomass burning, Global Biogeochem. Cy., 15, 955–966, https://doi.org/10.1029/2000GB001382, 2001. a, b, c, d, e, f, g, h
Arola, A., Lindfors, A., Natunen, A., and Lehtinen, K. E. J.: A case study on biomass burning aerosols: effects on aerosol optical properties and surface radiation levels, Atmos. Chem. Phys., 7, 4257–4266, https://doi.org/10.5194/acp-7-4257-2007, 2007. a
Batchelor, R. L., Strong, K., Lindenmaier, R., Mittermeier, R. L., Fast, H., Drummond, J. R., and Fogal, P. F.: A new Bruker IFS 125HR FTIR spectrometer for the Polar Environment Atmospheric Research Laboratory at Eureka, Nunavut, Canada: measurements and comparison with the existing Bomem DA8 spectrometer, J. Atmos. Ocean. Tech., 26, 1328–1340, https://doi.org/10.1175/2009JTECHA1215.1, 2009. a
Bertschi, I., Yokelson, R. J., Ward, D. E., Babbitt, R. E., Susott, R. A., Goode, J. G., and Hao, W. M.: Trace gas and particle emissions from fires in large diameter and belowground biomass fuels, J. Geophys. Res.-Atmos., 108, 8472, https://doi.org/10.1029/2002JD002100, 2003. a
Bey, I., Jacob, D. J., Logan, J. A., and Yantosca, R. M.: Asian chemical outflow to the Pacific in spring: Origins, pathways, and budgets, J. Geophys. Res.-Atmos., 106, 23097–23113, https://doi.org/10.1029/2001JD000806, 2001a. a, b
Bey, I., Jacob, D. J., Yantosca, R. M., Logan, J. A., Field, B. D., Fiore, A. M., Li, Q., Liu, H. Y., Mickley, L. J., and Schultz, M. G.: Global modeling of tropospheric chemistry with assimilated meteorology: Model description and evaluation, J. Geophys. Res.-Atmos., 106, 23073–23095, https://doi.org/10.1029/2001JD000807, 2001b. a
Blumenstock, T., Hase, F., Kramer, I., Mikuteit, S., Fischer, H., Goutail, F., and Raffalski, U.: Winter to winter variability of chlorine activation and ozone loss as observed by ground-based FTIR measurements at Kiruna since winter 1993/94, Int. J. Remote Sens., 30, 4055–4064, https://doi.org/10.1080/01431160902821916, 2009. a
Blumenstock, T. H., Fisher, H., Friedle, A., Hase, F., and Thomas, P.: Column Amounts of ClONO2, HCl, HNO3, and HF from Ground-Based FTIR Measurements Made Near Kiruna, Sweden, in Late Winter 1994, J. Atmos. Chem., 26, 311–321, https://doi.org/10.1023/A:1005728713762, 1997. a
Boulanger, Y., Gauthier, S., and Burton, P. J.: A refinement of models projecting future Canadian fire regimes using homogeneous fire regime zones, Canadian Fournal of Forest Research, 44, 365–376, https://doi.org/10.1139/cjfr-2013-0372, 2014. a
Cicerone, R. J. and Zellner, R.: The atmospheric chemistry of hydrogen cyanide (HCN), J. Geophys. Res.-Atmos., 88, 10689–10696, https://doi.org/10.1029/JC088iC15p10689, 1983. a
Crippa, M., Janssens-Maenhout, G., Dentener, F., Guizzardi, D., Sindelarova, K., Muntean, M., Van Dingenen, R., and Granier, C.: Forty years of improvements in European air quality: regional policy-industry interactions with global impacts, Atmos. Chem. Phys., 16, 3825–3841, https://doi.org/10.5194/acp-16-3825-2016, 2016. a
Dammers, E., Vigouroux, C., Palm, M., Mahieu, E., Warneke, T., Smale, D., Langerock, B., Franco, B., Van Damme, M., Schaap, M., Notholt, J., and Erisman, J. W.: Retrieval of ammonia from ground-based FTIR solar spectra, Atmos. Chem. Phys., 15, 12789–12803, https://doi.org/10.5194/acp-15-12789-2015, 2015. a, b
Damoah, R., Spichtinger, N., Forster, C., James, P., Mattis, I., Wandinger, U., Beirle, S., Wagner, T., and Stohl, A.: Around the world in 17 days – hemispheric-scale transport of forest fire smoke from Russia in May 2003, Atmos. Chem. Phys., 4, 1311–1321, https://doi.org/10.5194/acp-4-1311-2004, 2004. a, b
De Mazière, M., Thompson, A. M., Kurylo, M. J., Wild, J. D., Bernhard, G., Blumenstock, T., Braathen, G. O., Hannigan, J. W., Lambert, J.-C., Leblanc, T., McGee, T. J., Nedoluha, G., Petropavlovskikh, I., Seckmeyer, G., Simon, P. C., Steinbrecht, W., and Strahan, S. E.: The Network for the Detection of Atmospheric Composition Change (NDACC): history, status and perspectives, Atmos. Chem. Phys., 18, 4935–4964, https://doi.org/10.5194/acp-18-4935-2018, 2018. a, b
Dreessen, J., Sullivan, J., and Delgado, R.: Observations and impacts of transported Canadian wildfire smoke on ozone and aerosol air quality in the Maryland region on June 9–12, 2015, J. Air Waste Manage., 66, 842–862, https://doi.org/10.1080/10962247.2016.1161674, 2016. a
Eastham, S. D. and Jacob, D. J.: Limits on the ability of global Eulerian models to resolve intercontinental transport of chemical plumes, Atmos. Chem. Phys., 17, 2543–2553, https://doi.org/10.5194/acp-17-2543-2017, 2017. a
Eck, T. F., Holben, B. N., Reid, J. S., Sinyuk, A., Hyer, E. J., O'Neill, N. T., Shaw, G. E., Vande Castle, J. R., Chapin, F. S., Dubovik, O., Smirnov, A., Vermote, E., Schafer, J. S., Giles, D., Slutsker, I., Sorokine, M., and Newcomb, W. W.: Optical properties of boreal region biomass burning aerosols in central Alaska and seasonal variation of aerosol optical depth at an Arctic coastal site, J. Geophys. Res.-Atmos., 114, 722–4740, https://doi.org/10.1029/2008JD010870, 2009. a
Ehhalt, D. H., Rohrer, F., Wahner, A., Prather, M. J., and Blake, D. R.: On the use of hydrocarbons for the determination of tropospheric OH concentrations, J. Geophys. Res.-Atmos., 103, 18981–18997, https://doi.org/10.1029/98JD01106, 1998. a
Eyring, V., Waugh, D. W., Bodeker, G. E., Cordero, E., Akiyoshi, H., Austin, J., Beagley, S. R., Boville, B. A., Braesicke, P., Brühl, C., Butchart, N., Chipperfield, M. P., Dameris, M., Deckert, R., Deushi, M., Frith, S. M., Garcia, R. R., Gettelman, A., Giorgetta, M. A., Kinnison, D. E., Mancini, E., Manzini, E., Marsh, D. R., Matthes, S., Nagashima, T., Newman, P. A., Nielsen, J. E., Pawson, S., Pitari, G., Plummer, D. A., Rozanov, E., Schraner, M., Scinocca, J. F., Semeniuk, K., Shepherd, T. G., Shibata, K., Steil, B., Stolarski, R. S., Tian, W., and Yoshiki, M.: Multimodel projections of stratospheric ozone in the 21st century, J. Geophys. Res.-Atmos., 112, D03304, https://doi.org/10.1029/2006JD008332, 2007. a
Fischer, H., Wienhold, F. G., Hoor, P., Bujok, O., Schiller, C., Siegmund, P., Ambaum, M., Scheeren, H. A., and Lelieveld, J.: Tracer correlations in the northern high latitude lowermost stratosphere: Influence of cross-tropopause mass exchange, Geophys. Res. Lett., 27, 97–100, https://doi.org/10.1029/1999GL010879, 2000. a
Fisher, J. A., Jacob, D. J., Purdy, M. T., Kopacz, M., Le Sager, P., Carouge, C., Holmes, C. D., Yantosca, R. M., Batchelor, R. L., Strong, K., Diskin, G. S., Fuelberg, H. E., Holloway, J. S., Hyer, E. J., McMillan, W. W., Warner, J., Streets, D. G., Zhang, Q., Wang, Y., and Wu, S.: Source attribution and interannual variability of Arctic pollution in spring constrained by aircraft (ARCTAS, ARCPAC) and satellite (AIRS) observations of carbon monoxide, Atmos. Chem. Phys., 10, 977–996, https://doi.org/10.5194/acp-10-977-2010, 2010. a, b, c
Fisher, J. A., Murray, L. T., Jones, D. B. A., and Deutscher, N. M.: Improved method for linear carbon monoxide simulation and source attribution in atmospheric chemistry models illustrated using GEOS-Chem v9, Geosci. Model Dev., 10, 4129–4144, https://doi.org/10.5194/gmd-10-4129-2017, 2017. a
Flannigan, M. D., Krawchuk, M. A., de Groot, W. J., Mike Wotton, B., and Gowman, L. M.: Implications of changing climate for global wildland fire, Int. J. Wildland Fire, 18, 483–507, https://doi.org/10.1071/WF08187, 2009. a
Flexible Particle Model Developers: FLEXPART dispersion model FLEXPART, available at: https://www.flexpart.eu/downloads, last access: 15 November 2019. a
Franco, B., Bader, W., Toon, G. C., Bray, C., Perrin, A., Fischer, E. V., Sudo, K., Boone, C. D., Bovy, B., Lejeune, B., Servais, C., and Mahieu, E.: Retrieval of ethane from ground-based FTIR solar spectra using improved spectroscopy: Recent burden increase above Jungfraujoch, J. Quant. Spectrosc. Ra., 160, 36–49, https://doi.org/10.1016/j.jqsrt.2015.03.017, 2015. a
Franco, B., Mahieu, E., Emmons, L. K., Tzompa-Sosa, Z. A., Fischer, E. V., Sudo, K., Bovy, B., Conway, S., Griffin, D., Hannigan, J. W., Strong, K., and Walker, K. A.: Evaluating ethane and methane emissions associated with the development of oil and natural gas extraction in North America, Environ. Res. Lett., 11, 044010, https://doi.org/10.1088/1748-9326/11/4/044010, 2016. a
Franklin, J. E., Drummond, J. R., Griffin, D., Pierce, J. R., Waugh, D. L., Palmer, P. I., Parrington, M., Lee, J. D., Lewis, A. C., Rickard, A. R., Taylor, J. W., Allan, J. D., Coe, H., Walker, K. A., Chisholm, L., Duck, T. J., Hopper, J. T., Blanchard, Y., Gibson, M. D., Curry, K. R., Sakamoto, K. M., Lesins, G., Dan, L., Kliever, J., and Saha, A.: A case study of aerosol scavenging in a biomass burning plume over eastern Canada during the 2011 BORTAS field experiment, Atmos. Chem. Phys., 14, 8449–8460, https://doi.org/10.5194/acp-14-8449-2014, 2014. a
Freitas, S. R., Longo, K. M., Chatfield, R., Latham, D., Silva Dias, M. A. F., Andreae, M. O., Prins, E., Santos, J. C., Gielow, R., and Carvalho Jr., J. A.: Including the sub-grid scale plume rise of vegetation fires in low resolution atmospheric transport models, Atmos. Chem. Phys., 7, 3385–3398, https://doi.org/10.5194/acp-7-3385-2007, 2007. a
Fromm, M., Alfred, J., Hoppel, K., Hornstein, J., Bevilacqua, R., Shettle, E., Servranckx, R., Li, Z., and Stocks, B.: Observations of boreal forest fire smoke in the stratosphere by POAM III, SAGE II, and lidar in 1998, Geophys. Res. Lett., 27, 1407–1410, https://doi.org/10.1029/1999GL011200, 2000. a, b
Gelaro, R., McCarty, W., Suárez, M. J., Todling, R., Molod, A., Takacs, L., Randles, C. A., Darmenov, A., Bosilovich, M. G., Reichle, R., Wargan, K., Coy, L., Cullather, R., Draper, C., Akella, S., Buchard, V., Conaty, A., da Silva, A. M., Gu, W., Kim, G.-K., Koster, R., Lucchesi, R., Merkova, D., Nielsen, J. E., Partyka, G., Pawson, S., Putman, W., Rienecker, M., Schubert, S. D., Sienkiewicz, M., and Zhao, B.: The Modern-Era Retrospective Analysis for Research and Applications, Version 2 (MERRA-2), J. Climate, 30, 5419–5454, https://doi.org/10.1175/JCLI-D-16-0758.1, 2017. a
Giglio, L., Randerson, J. T., and van der Werf, G. R.: Analysis of daily, monthly, and annual burned area using the fourth-generation global fire emissions database (GFED4), J. Geophys. Res.-Biogeo., 118, 317–328, https://doi.org/10.1002/jgrg.20042, 2013. a
Giles, D. M., Sinyuk, A., Sorokin, M. G., Schafer, J. S., Smirnov, A., Slutsker, I., Eck, T. F., Holben, B. N., Lewis, J. R., Campbell, J. R., Welton, E. J., Korkin, S. V., and Lyapustin, A. I.: Advancements in the Aerosol Robotic Network (AERONET) Version 3 database – automated near-real-time quality control algorithm with improved cloud screening for Sun photometer aerosol optical depth (AOD) measurements, Atmos. Meas. Tech., 12, 169–209, https://doi.org/10.5194/amt-12-169-2019, 2019. a
Giuseppe, F. D., Rémy, S., Pappenberger, F., and Wetterhall, F.: Using the Fire Weather Index (FWI) to improve the estimation of fire emissions from fire radiative power (FRP) observations, Atmospheric Chemistry and Physics, 18, 5359–5370, https://doi.org/10.5194/acp-18-5359-2018, 2018. a
Goode, J. G., Yokelson, R. J., Susott, R. A., and Ward, D. E.: Trace gas emissions from laboratory biomass fires measured by open-path Fourier transform infrared spectroscopy: Fires in grass and surface fuels, J. Geophys. Res.:-Atmos., 104, 21237–21245, https://doi.org/10.1029/1999JD900360, 1999. a, b
Goode, J. G., Yokelson, R. J., Ward, D. E., Susott, R. A., Babbitt, R. E., Davies, M. A., and Hao, W. M.: Measurements of excess O3, CO2, CO, CH4, C2H4, C2H2, HCN, NO, NH3, HCOOH, CH3COOH, HCHO, and CH3OH in 1997 Alaskan biomass burning plumes by airborne Fourier transform infrared spectroscopy (AFTIR), J. Geophys. Res.-Atmos., 105, 22147–22166, https://doi.org/10.1029/2000JD900287, 2000. a, b, c
Griffin, D., Walker, K. A., Franklin, J. E., Parrington, M., Whaley, C., Hopper, J., Drummond, J. R., Palmer, P. I., Strong, K., Duck, T. J., Abboud, I., Bernath, P. F., Clerbaux, C., Coheur, P.-F., Curry, K. R., Dan, L., Hyer, E., Kliever, J., Lesins, G., Maurice, M., Saha, A., Tereszchuk, K., and Weaver, D.: Investigation of CO, C2H6 and aerosols in a boreal fire plume over eastern Canada during BORTAS 2011 using ground- and satellite-based observations and model simulations, Atmos. Chem. Phys., 13, 10227–10241, https://doi.org/10.5194/acp-13-10227-2013, 2013. a, b, c
Gubler, S., Gruber, S., and Purves, R. S.: Uncertainties of parameterized surface downward clear-sky shortwave and all-sky longwave radiation., Atmos. Chem. Phys., 12, 5077–5098, https://doi.org/10.5194/acp-12-5077-2012, 2012. a, b
Guenther, A., Geron, C., Pierce, T., Lamb, B., Harley, P., and Fall, R.: Natural emissions of non-methane volatile organic compounds, carbon monoxide, and oxides of nitrogen from North America, Atmos. Environ., 34, 2205–2230, https://doi.org/10.1016/S1352-2310(99)00465-3, 2000. a
Guenther, A. B., Jiang, X., Heald, C. L., Sakulyanontvittaya, T., Duhl, T., Emmons, L. K., and Wang, X.: The Model of Emissions of Gases and Aerosols from Nature version 2.1 (MEGAN2.1): an extended and updated framework for modeling biogenic emissions, Geosci. Model Dev., 5, 1471–1492, https://doi.org/10.5194/gmd-5-1471-2012, 2012. a
Hannigan, J. W., Coffey, M. T., and Goldman, A.: Semiautonomous FTS Observation System for Remote Sensing of Stratospheric and Tropospheric Gases, J. Atmos. Ocean. Tech., 26, 1814–1828, https://doi.org/10.1175/2009JTECHA1230.1, 2009. a
Hase, F., Hannigan, J. W., Coffey, M. T., Goldman, A., Höpfner, M., Jones, N. B., Rinsland, C. P., and Wood, S. W.: Intercomparison of retrieval codes used for the analysis of high-resolution, ground-based FTIR measurements, J. Quant. Spectrosc. Ra., 87, 25–52, https://doi.org/10.1016/j.jqsrt.2003.12.008, 2004. a
Heilman, W. E., Liu, Y., Urbanski, S., Kovalev, V., and Mickler, R.: Wildland fire emissions, carbon, and climate: Plume rise, atmospheric transport, and chemistry processes, Forest Ecol. Manag., 317, 70–79, https://doi.org/10.1016/j.foreco.2013.02.001, 2014. a, b
Henne, S., Brunner, D., Folini, D., Solberg, S., Klausen, J., and Buchmann, B.: Assessment of parameters describing representativeness of air quality in-situ measurement sites, Atmos. Chem. Phys., 10, 3561–3581, https://doi.org/10.5194/acp-10-3561-2010, 2010. a
Holben, B. N., Eck, T. F., Slutsker, I., Tanré, D., Buis, J. P., Setzer, A., Vermote, E., Reagan, J. A., Kaufman, Y. J., Nakajima, T., Lavenu, F., Jankowiak, I., and Smirnov, A.: AERONET – A Federated Instrument Network and Data Archive for Aerosol Characterization, Remote Sen. Environ., 66, 1–16, https://doi.org/10.1016/S0034-4257(98)00031-5, 1998. a
Holloway, T., Levy, H., and Kasibhatla, P.: Global distribution of carbon monoxide, J. Geophys. Res.-Atmos., 105, 12123–12147, https://doi.org/10.1029/1999JD901173, 2000. a
Holtslag, A. A. M. and Boville, B. A.: Local Versus Nonlocal Boundary-Layer Diffusion in a Global Climate Model, J. Climate, 6, 1825–1842, https://doi.org/10.1175/1520-0442(1993)006<1825:LVNBLD>2.0.CO;2, 1993. a
Honrath, R. E.: Regional and hemispheric impacts of anthropogenic and biomass burning emissions on summertime CO and O3 in the North Atlantic lower free troposphere, J. Geophys. Res.-Atmos., 109, D24310, https://doi.org/10.1029/2004JD005147, 2004. a
Hoor, P., Fischer, H., Lange, L., Lelieveld, J., and Brunner, D.: Seasonal variations of a mixing layer in the lowermost stratosphere as identified by the CO-O3 correlation from in situ measurements, J. Geophys. Res.-Atmos., 107, ACL 1–1–ACL 1–11, https://doi.org/10.1029/2000JD000289, 2002. a
Hornbrook, R. S., Blake, D. R., Diskin, G. S., Fried, A., Fuelberg, H. E., Meinardi, S., Mikoviny, T., Richter, D., Sachse, G. W., Vay, S. A., Walega, J., Weibring, P., Weinheimer, A. J., Wiedinmyer, C., Wisthaler, A., Hills, A., Riemer, D. D., and Apel, E. C.: Observations of nonmethane organic compounds during ARCTAS − Part 1: Biomass burning emissions and plume enhancements, Atmos. Chem. Phys., 11, 11103–11130, https://doi.org/10.5194/acp-11-11103-2011, 2011. a, b, c
Hu, Q., Goloub, P., Veselovskii, I., Bravo-Aranda, J.-A., Popovici, I. E., Podvin, T., Haeffelin, M., Lopatin, A., Dubovik, O., Pietras, C., Huang, X., Torres, B., and Chen, C.: Long-range-transported Canadian smoke plumes in the lower stratosphere over northern France, Atmospheric Chemistry and Physics, 19, 1173–1193, https://doi.org/10.5194/acp-19-1173-2019, 2019. a
Ikeda, K. and Tanimoto, H.: Exceedances of air quality standard level of PM2.5 in Japan caused by Siberian wildfires, Environ. Res. Lett., 10, 105001, https://doi.org/10.1088/1748-9326/10/10/105001, 2015. a
InfraRed working Group: NDACC datasets, NDACC, available at: ftp://ftp.cpc.ncep.noaa.gov/ndacc/, last access: 18 May 2020. a
Jaffe, D., Anderson, T., Covert, D., Kotchenruther, R., Trost, B., Danielson, J., Simpson, W., Berntsen, T., Karlsdottir, S., Blake, D., Harris, J., Carmichael, G., and Uno, I.: Transport of Asian air pollution to North America, Geophys. Res. Lett., 26, 711–714, https://doi.org/10.1029/1999GL900100, 1999. a
Jaffe, D., Bertschi, I., Jaeglé, L., Novelli, P., Reid, J. S., Tanimoto, H., Vingarzan, R., and Westphal, D. L.: Long-range transport of Siberian biomass burning emissions and impact on surface ozone in western North America, Geophys. Res. Lett., 31, L16106, https://doi.org/10.1029/2004GL020093, 2004. a, b, c, d
Jeong, J. I., Park, R. J., and Youn, D.: Effects of Siberian forest fires on air quality in East Asia during May 2003 and its climate implication, Atmos. Environ., 42, 8910–8922, https://doi.org/10.1016/j.atmosenv.2008.08.037, 2008. a
Kaiser, J. W., Heil, A., Andreae, M. O., Benedetti, A., Chubarova, N., Jones, L., Morcrette, J.-J., Razinger, M., Schultz, M. G., Suttie, M., and van der Werf, G. R.: Biomass burning emissions estimated with a global fire assimilation system based on observed fire radiative power, Biogeosciences, 9, 527–554, https://doi.org/10.5194/bg-9-527-2012, 2012. a
Kasai, Y. J., Kagawa, A., Jones, N., Fujiwara, A., Seki, K., Murayama, Y., and Murcray, F.: Seasonal variations of CO and HCN in the troposphere measured by solar absorption spectroscopy over Poker Flat, Alaska, Geophys. Res. Lett., 32, 1–4, https://doi.org/10.1029/2005GL022826, 2005a. a
Kasai, Y. J., Koshiro, T., Endo, M., Jones, N. B., and Murayama, Y.: Ground-based measurement of strato–mesospheric CO by a FTIR spectrometer over Poker Flat, Alaska, Adv. Space Res., 35, 2024–2030, https://doi.org/10.1016/j.asr.2005.04.099, 2005b. a, b
Khaykin, S. M., Godin‐Beekmann, S., Hauchecorne, A., Pelon, J., Ravetta, F., and Keckhut, P.: Stratospheric Smoke With Unprecedentedly High Backscatter Observed by Lidars Above Southern France, Geophys. Res. Lett., 45, 1639–1646, https://doi.org/10.1002/2017GL076763, 2018. a, b, c
Kirchmeier-Young, M. C., Gillett, N. P., Zwiers, F. W., Cannon, A. J., and Anslow, F. S.: Attribution of the Influence of Human-Induced Climate Change on an Extreme Fire Season, Earth's Future, 7, 2–10, https://doi.org/10.1029/2018EF001050, 2019. a
Klonecki, A.: Seasonal changes in the transport of pollutants into the Arctic troposphere-model study, J. Geophys. Res.-Atmos., 108, 8367, https://doi.org/10.1029/2002JD002199, 2003. a, b, c
Kochtubajda, B., Stewart, R. E., Flannigan, M. D., Bonsal, B. R., Cuell, C., and Mooney, C. J.: An Assessment of Surface and Atmospheric Conditions Associated with the Extreme 2014 Wildfire Season in Canada's Northwest Territories, Atmos.-Ocean, 57, 73–90, https://doi.org/10.1080/07055900.2019.1576023, 2019. a
Konovalov, I. B., Beekmann, M., Kuznetsova, I. N., Yurova, A., and Zvyagintsev, A. M.: Atmospheric impacts of the 2010 Russian wildfires: integrating modelling and measurements of an extreme air pollution episode in the Moscow region, Atmos. Chem. Phys., 11, 10031–10056, https://doi.org/10.5194/acp-11-10031-2011, 2011. a
Kozlov, V. S., Yausheva, E. P., Terpugova, S. A., Panchenko, M. V., Chernov, D. G., and Shmargunov, V. P.: Optical–microphysical properties of smoke haze from Siberian forest fires in summer 2012, Int. J. Remote Sens., 35, 5722–5741, https://doi.org/10.1080/01431161.2014.945010, 2014. a
Krause, A., Kloster, S., Wilkenskjeld, S., and Paeth, H.: The sensitivity of global wildfires to simulated past, present, and future lightning frequency, J. Geophys. Res.-Biogeo., 119, 312–322, https://doi.org/10.1002/2013JG002502, 2014. a
Kurylo, M. J.: Network for the Detection of Stratospheric Change, Proc. SPIE, 1491, Remote Sensing of Atmospheric Chemistry, https://doi.org/10.1117/12.46658, 1991. a
Law, K. S. and Stohl, A.: Arctic air pollution: origins and impacts, Science, 315, 1537–1540, https://doi.org/10.1126/science.1137695, 2007. a
Le Breton, M., Bacak, A., Muller, J. B. A., O'Shea, S. J., Xiao, P., Ashfold, M. N. R., Cooke, M. C., Batt, R., Shallcross, D. E., Oram, D. E., Forster, G., Bauguitte, S. J.-B., Palmer, P. I., Parrington, M., Lewis, A. C., Lee, J. D., and Percival, C. J.: Airborne hydrogen cyanide measurements using a chemical ionisation mass spectrometer for the plume identification of biomass burning forest fires, Atmos. Chem. Phys., 13, 9217–9232, https://doi.org/10.5194/acp-13-9217-2013, 2013. a
Lefer, B. L., Talbot, R. W., Harriss, R. H., Bradshaw, J. D., Sandholm, S. T., Olson, J. O., Sachse, G. W., Collins, J., Shipham, M. A., Blake, D. R., Klemm, K. I., Klemm, O., Gorzelska, K., and Barrick, J.: Enhancement of acidic gases in biomass burning impacted air masses over Canada, J. Geophys. Res.-Atmos., 99, 1721–1737, https://doi.org/10.1029/93JD02091, 1994. a, b, c
Lewis, A. C., Evans, M. J., Hopkins, J. R., Punjabi, S., Read, K. A., Purvis, R. M., Andrews, S. J., Moller, S. J., Carpenter, L. J., Lee, J. D., Rickard, A. R., Palmer, P. I., and Parrington, M.: The influence of biomass burning on the global distribution of selected non-methane organic compounds, Atmos. Chem. Phys., 13, 851–867, https://doi.org/10.5194/acp-13-851-2013, 2013. a
Li, Q., Jacob, D. J., Bey, I., Yantosca, R. M., Zhao, Y., Kondo, Y., and Notholt, J.: Atmospheric hydrogen cyanide (HCN): Biomass burning source, ocean sink?, Geophys. Res. Lett., 27, 357–360, https://doi.org/10.1029/1999GL010935, 2000. a, b
Li, Q., Jacob, D. J., Yantosca, R. M., Heald, C. L., Singh, H. B., Koike, M., Zhao, Y., Sachse, G. W., and Streets, D. G.: A global three-dimensional model analysis of the atmospheric budgets of HCN and CH3CN: Constraints from aircraft and ground measurements, J. Geophys. Res.-Atmos., 108, 8827, https://doi.org/10.1029/2002JD003075, 2003. a
Li, Q., Palmer, P. I., Pumphrey, H. C., Bernath, P., and Mahieu, E.: What drives the observed variability of HCN in the troposphere and lower stratosphere?, Atmos. Chem. Phys., 9, 8531–8543, https://doi.org/10.5194/acp-9-8531-2009, 2009. a
Logan, J. A., Prather, M. J., Wofsy, S. C., and McElroy, M. B.: Tropospheric chemistry: A global perspective, J. Geophys. Res.-Oceans, 86, 7210–7254, https://doi.org/10.1029/JC086iC08p07210, 1981. a
Lutsch, E., Dammers, E., Conway, S., and Strong, K.: Long-range transport of NH3, CO, HCN, and C2H6 from the 2014 Canadian Wildfires, Geophys. Res. Lett., 43, 8286–8297, https://doi.org/10.1002/2016GL070114, 2016. a, b, c, d, e, f, g, h, i, j, k, l
Lutsch, E., Strong, K., Jones, D. B. A., Ortega, I., Hannigan, J. W., Dammers, E., Shephard, M. W., Morris, E., Murphy, K., Evans, M. J., Parrington, M., Whitburn, S., Van Damme, M., Clarisse, L., Coheur, P., Clerbaux, C., Croft, B., Martin, R. V., Pierce, J. R., and Fisher, J. A.: Unprecedented Atmospheric Ammonia Concentrations Detected in the High Arctic From the 2017 Canadian Wildfires, J. Geophys. Res.-Atmos., 124, 8178–8202, https://doi.org/10.1029/2019JD030419, 2019. a, b, c, d, e, f, g, h, i
Macias Fauria, M. and Johnson, E. A.: Large-scale climatic patterns control large lightning fire occurrence in Canada and Alaska forest regions, J. Geophys. Res.-Biogeo., 111, G04008, https://doi.org/10.1029/2006JG000181, 2006. a
Macias Fauria, M. and Johnson, E. A.: Climate and wildfires in the North American boreal forest, Philos. T. R. Soc. Lond. B 363, 2315–2327, https://doi.org/10.1098/rstb.2007.2202, 2008. a
Mahieu, E., Zander, R., Delbouille, L., Demoulin, P., Roland, G., and Servais, C.: Observed trends in total vertical column abundances of atmospheric gases from IR solar spectra recorded at the Jungfraujoch, J. Atmos. Chem., 28, 227–243, https://doi.org/10.1023/A:1005854926740, 1997. a
Makar, P. A., Akingunola, A., Aherne, J., Cole, A. S., Aklilu, Y.-A., Zhang, J., Wong, I., Hayden, K., Li, S.-M., Kirk, J., Scott, K., Moran, M. D., Robichaud, A., Cathcart, H., Baratzedah, P., Pabla, B., Cheung, P., Zheng, Q., and Jeffries, D. S.: Estimates of exceedances of critical loads for acidifying deposition in Alberta and Saskatchewan, Atmos. Chem. Phys., 18, 9897–9927, https://doi.org/10.5194/acp-18-9897-2018, 2018. a
Makarova, M. V., Poberovskii, A. V., and Osipov, S. I.: Time variations of the total CO content in the atmosphere near St. Petersburg, Izvestiya, Atmos. Ocean. Phys., 47, 739–746, https://doi.org/10.1134/S0001433811060090, 2011. a
Marsh, D. R., Mills, M. J., Kinnison, D. E., Lamarque, J.-F., Calvo, N., and Polvani, L. M.: Climate Change from 1850 to 2005 Simulated in CESM1 (WACCM), J. Climate, 26, 7372–7391, https://doi.org/10.1175/JCLI-D-12-00558.1, 2013. a
McKeen, S. A. and Liu, S. C.: Hydrocarbon ratios and photochemical history of air masses, Geophys. Res. Lett., 20, 2363–2366, https://doi.org/10.1029/93GL02527, 1993. a
McKeen, S. A., Liu, S. C., Hsie, E.-Y., Lin, X., Bradshaw, J. D., Smyth, S., Gregory, G. L., and Blake, D. R.: Hydrocarbon ratios during PEM-WEST A: A model perspective, J. Geophys. Res.-Atmos., 101, 2087–2109, https://doi.org/10.1029/95JD02733, 1996. a
Muller, J.-F., Stavrakou, T., Bauwens, M., George, M., Hurtmans, D., Coheur, P.-F., Clerbaux, C., and Sweeney, C.: Top-Down CO Emissions Based On IASI Observations and Hemispheric Constraints on OH Levels, Geophys. Res. Lett., 45, 1621–1629, https://doi.org/10.1002/2017GL076697, 2018. a
Nance, J. D., Hobbs, P. V., Radke, L. F., and Ward, D. E.: Airborne measurements of gases and particles from an Alaskan wildfire, J. Geophys. Res.-Atmos., 98, 14873–14882, https://doi.org/10.1029/93JD01196, 1993. a
Notholt, J., Toon, G., Stordal, F., Solberg, S., Schmidbauer, N., Becker, E., Meier, A., and Sen, B.: Seasonal variations of atmospheric trace gases in the high Arctic at 79∘ N, J. Geophys. Res.-Atmos., 102, 12855–12861, https://doi.org/10.1029/97JD00337, 1997a. a
Notholt, J., Toon, G. C., Lehmann, R., Sen, B., and Blavier, J.-F.: Comparison of Arctic and Antarctic trace gas column abundances from ground-based Fourier transform infrared spectrometry, J. Geophys. Res.-Atmos., 102, 12863–12869, https://doi.org/10.1029/97JD00358, 1997b. a
Notholt, J., Toon, G. C., Rinsland, C. P., Pougatchev, N. S., Jones, N. B., Connor, B. J., Weller, R., Gautrois, M., and Schrems, O.: Latitudinal variations of trace gas concentrations in the free troposphere measured by solar absorption spectroscopy during a ship cruise, J. Geophys. Res.-Atmos., 105, 1337–1349, https://doi.org/10.1029/1999JD900940, 2000. a
O'Neill, N. T., Perro, C., Saha, A., Lesins, G., Duck, T. J., Eloranta, E. W., Nott, G. J., Hoffman, A., Karumudi, M. L., Ritter, C., Bourassa, A., Abboud, I., Carn, S. A., and Savastiouk, V.: Properties of Sarychev sulphate aerosols over the Arctic, J. Geophys. Res.-Atmos., 117, D04203, https://doi.org/10.1029/2011JD016838, 2012. a
Ordóñez, C., Brunner, D., Staehelin, J., Hadjinicolaou, P., Pyle, J. A., Jonas, M., Wernli, H., and Prévôt, A. S. H.: Strong influence of lowermost stratospheric ozone on lower tropospheric background ozone changes over Europe, Geophys. Res. Lett., 34, L07805, https://doi.org/10.1029/2006GL029113, 2007. a
Pan, L. L., Randel, W. J., Gary, B. L., Mahoney, M. J., and Hintsa, E. J.: Definitions and sharpness of the extratropical tropopause: A trace gas perspective, J. Geophys. Res.-Atmos., 109, D23103, https://doi.org/10.1029/2004JD004982, 2004. a
Parrington, M., Palmer, P. I., Lewis, A. C., Lee, J. D., Rickard, A. R., Di Carlo, P., Taylor, J. W., Hopkins, J. R., Punjabi, S., Oram, D. E., Forster, G., Aruffo, E., Moller, S. J., Bauguitte, S. J.-B., Allan, J. D., Coe, H., and Leigh, R. J.: Ozone photochemistry in boreal biomass burning plumes, Atmos. Chem. Phys., 13, 7321–7341, https://doi.org/10.5194/acp-13-7321-2013, 2013. a
Paton-Walsh, C., Jones, N., Wilson, S., Meier, A., Deutscher, N., Griffith, D., Mitchell, R., and Campbell, S.: Trace gas emissions from biomass burning inferred from aerosol optical depth, Geophys. Res. Lett., 31, L05116, https://doi.org/10.1029/2003GL018973, 2004. a, b, c, d
Paton-Walsh, C., Jones, N. B., Wilson, S. R., Haverd, V., Meier, A., Griffith, D. W. T., and Rinsland, C. P.: Measurements of trace gas emissions from Australian forest fires and correlations with coincident measurements of aerosol optical depth, J. Geophys. Res.-Atmos., 110, D24305, https://doi.org/10.1029/2005JD006202, 2005. a
Paton-Walsh, C., Deutscher, N. M., Griffith, D. W. T., Forgan, B. W., Wilson, S. R., Jones, N. B., and Edwards, D. P.: Trace gas emissions from savanna fires in northern Australia, J. Geophys. Res.-Atmos., 115, D16314, https://doi.org/10.1029/2009JD013309, 2010. a, b, c
Patra, P. K., Houweling, S., Krol, M., Bousquet, P., Belikov, D., Bergmann, D., Bian, H., Cameron-Smith, P., Chipperfield, M. P., Corbin, K., Fortems-Cheiney, A., Fraser, A., Gloor, E., Hess, P., Ito, A., Kawa, S. R., Law, R. M., Loh, Z., Maksyutov, S., Meng, L., Palmer, P. I., Prinn, R. G., Rigby, M., Saito, R., and Wilson, C.: TransCom model simulations of CH4 and related species: linking transport, surface flux and chemical loss with CH4 variability in the troposphere and lower stratosphere, Atmos. Chem. Phys., 11, 12813–12837, https://doi.org/10.5194/acp-11-12813-2011, 2011. a
Peterson, D. A., Campbell, J. R., Hyer, E. J., Fromm, M. D., Kablick, G. P., Cossuth, J. H., and DeLand, M. T.: Wildfire-driven thunderstorms cause a volcano-like stratospheric injection of smoke, Climate and Atmospheric Science, 1, 30, https://doi.org/10.1038/s41612-018-0039-3, 2018. a, b, c
Petetin, H., Sauvage, B., Parrington, M., Clark, H., Fontaine, A., Athier, G., Blot, R., Boulanger, D., Cousin, J.-M., Nédélec, P., and Thouret, V.: The role of biomass burning as derived from the tropospheric CO vertical profiles measured by IAGOS aircraft in 2002–2017, Atmos. Chem. Phys., 18, 17277–17306, https://doi.org/10.5194/acp-18-17277-2018, 2018. a, b
Pougatchev, N. S., Connor, B. J., and Rinsland, C. P.: Infrared measurements of the ozone vertical distribution above Kitt Peak, J. Geophys. Res.-Atmos., 100, 16689–16697, https://doi.org/10.1029/95JD01296, 1995. a
Rastigejev, Y., Park, R., Brenner, M. P., and Jacob, D. J.: Resolving intercontinental pollution plumes in global models of atmospheric transport, J. Geophys. Res.-Atmos., 115, D02302, https://doi.org/10.1029/2009JD012568, 2010. a
Rémy, S., Veira, A., Paugam, R., Sofiev, M., Kaiser, J. W., Marenco, F., Burton, S. P., Benedetti, A., Engelen, R. J., Ferrare, R., and Hair, J. W.: Two global data sets of daily fire emission injection heights since 2003, Atmos. Chem. Phys., 17, 2921–2942, https://doi.org/10.5194/acp-17-2921-2017, 2017. a
Rinsland, C. P., Jones, N. B., Connor, B. J., Logan, J. A., Pougatchev, N. S., Goldman, A., Murcray, F. J., Stephen, T. M., Pine, A. S., Zander, R., Mahieu, E., and Demoulin, P.: Northern and Southern hemisphere ground-based infrared spectroscopic measurements of tropospheric carbon monoxide and ethane, J. Geophys. Res.-Atmos., 103, 28197–28217, https://doi.org/10.1029/98JD02515, 1998. a
Rinsland, C. P., Dufour, G., Boone, C. D., Bernath, P. F., Chiou, L., Coheur, P.-F., e, and Clerbaux, C.: Satellite boreal measurements over Alaska and Canada during June–July 2004: Simultaneous measurements of upper tropospheric CO, C2H6, HCN, CH3Cl, CH4, C2H2, CH3OH, HCOOH, OCS, and SF6 mixing ratios, Global Biogeochem. Cy., 21, GB3008, https://doi.org/10.1029/2006GB002795, 2007. a, b, c
Rinsland, C. P., Mahieu, E., Chiou, L., and Herbin, H.: First ground-based infrared solar absorption measurements of free tropospheric methanol (CH3OH): Multidecade infrared time series from Kitt Peak (31.9∘ N 111.6∘ W), J. Geophys. Res.-Atmos., 114, D04309, https://doi.org/10.1029/2008JD011003, 2009. a
Rodgers, C. D.: Inverse Methods for Atmospheric Sounding: Theory and Practice, Series on Atmospheric, Oceanic and Planetary Physics, World Scientific, River Edge, N. J., 2, 2000. a, b
Rodgers, C. D. and Connor, B. J.: Intercomparison of remote sounding instruments, J. Geophys. Res.-Atmos., 108, 4116, https://doi.org/10.1029/2002JD002299, 2003. a
Rodríguez, E., Toledano, C., Cachorro, V. E., Ortiz, P., Stebel, K., Berjón, A., Blindheim, S., Gausa, M., and de Frutos, A. M.: Aerosol characterization at the sub-Arctic site Andenes (69∘ N, 16∘ E), by the analysis of columnar optical properties, Q. J. Roy. Meteor. Soc., 138, 471–482, https://doi.org/10.1002/qj.921, 2012. a
Rozwadowska, A., Zieliński, T., Petelski, T., and Sobolewski, P.: Cluster analysis of the impact of air back-trajectories on aerosol optical properties at Hornsund, Spitsbergen, Atmos. Chem. Phys., 10, 877–893, https://doi.org/10.5194/acp-10-877-2010, 2010. a
Rudolph, J.: The tropospheric distribution and budget of ethane, J. Geophys. Res.-Atmosp., 100, 11369–11381, https://doi.org/10.1029/95JD00693, 1995. a
Saha, A., O'Neill, N. T., Eloranta, E., Stone, R. S., Eck, T. F., Zidane, S., Daou, D., Lupu, A., Lesins, G., Shiobara, M., and Others: Pan-Arctic sunphotometry during the ARCTAS-A campaign of April 2008, Geophys. Res. Lett., 37, L05803, https://doi.org/10.1029/2009GL041375, 2010. a
Saha, S., Moorthi, S., Wu, X., Wang, J., Nadiga, S., Tripp, P., Behringer, D., Hou, Y.-T., Chuang, H.-Y., Iredell, M., Ek, M., Meng, J., Yang, R., Mendez, M. P., van den Dool, H., Zhang, Q., Wang, W., Chen, M., and Becker, E.: NCEP Climate Forecast System Version 2 (CFSv2) 6-hourly Products, https://doi.org/10.5065/D61C1TXF, 2011. a
Sekimoto, K., Koss, A. R., Gilman, J. B., Selimovic, V., Coggon, M. M., Zarzana, K. J., Yuan, B., Lerner, B. M., Brown, S. S., Warneke, C., Yokelson, R. J., Roberts, J. M., and de Gouw, J.: High- and low-temperature pyrolysis profiles describe volatile organic compound emissions from western US wildfire fuels, Atmos. Chem. Phys., 18, 9263–9281, https://doi.org/10.5194/acp-18-9263-2018, 2018. a
Shindell, D. T., Faluvegi, G., Stevenson, D. S., Krol, M. C., Emmons, L. K., Lamarque, J.-F., Pétron, G., Dentener, F. J., Ellingsen, K., Schultz, M. G., Wild, O., Amann, M., Atherton, C. S., Bergmann, D. J., Bey, I., Butler, T., Cofala, J., Collins, W. J., Derwent, R. G., Doherty, R. M., Drevet, J., Eskes, H. J., Fiore, A. M., Gauss, M., Hauglustaine, D. A., Horowitz, L. W., Isaksen, I. S. A., Lawrence, M. G., Montanaro, V., Müller, J.-F., Pitari, G., Prather, M. J., Pyle, J. A., Rast, S., Rodriguez, J. M., Sanderson, M. G., Savage, N. H., Strahan, S. E., Sudo, K., Szopa, S., Unger, N., van Noije, T. P. C., and Zeng, G.: Multimodel simulations of carbon monoxide: Comparison with observations and projected near-future changes, J. Geophys. Res.-Atmos., 111, L01104, https://doi.org/10.1029/2006JD007100, 2006. a, b
Shindell, D. T., Chin, M., Dentener, F., Doherty, R. M., Faluvegi, G., Fiore, A. M., Hess, P., Koch, D. M., MacKenzie, I. A., Sanderson, M. G., Schultz, M. G., Schulz, M., Stevenson, D. S., Teich, H., Textor, C., Wild, O., Bergmann, D. J., Bey, I., Bian, H., Cuvelier, C., Duncan, B. N., Folberth, G., Horowitz, L. W., Jonson, J., Kaminski, J. W., Marmer, E., Park, R., Pringle, K. J., Schroeder, S., Szopa, S., Takemura, T., Zeng, G., Keating, T. J., and Zuber, A.: A multi-model assessment of pollution transport to the Arctic, Atmos. Chem. Phys., 8, 5353–5372, https://doi.org/10.5194/acp-8-5353-2008, 2008. a
Simpson, I. J., Akagi, S. K., Barletta, B., Blake, N. J., Choi, Y., Diskin, G. S., Fried, A., Fuelberg, H. E., Meinardi, S., Rowland, F. S., Vay, S. A., Weinheimer, A. J., Wennberg, P. O., Wiebring, P., Wisthaler, A., Yang, M., Yokelson, R. J., and Blake, D. R.: Boreal forest fire emissions in fresh Canadian smoke plumes: C1-C10 volatile organic compounds (VOCs), CO2, CO, NO2, NO, HCN and CH3CN, Atmos. Chem. Phys., 11, 6445–6463, https://doi.org/10.5194/acp-11-6445-2011, 2011. a, b
Sioris, C. E., Abboud, I., Fioletov, V. E., and McLinden, C. A.: AEROCAN, the Canadian sub-network of AERONET: Aerosol monitoring and air quality applications, Atmos. Environ., 167, 444–457, https://doi.org/10.1016/j.atmosenv.2017.08.044, 2017. a
Sofiev, M., Ermakova, T., and Vankevich, R.: Evaluation of the smoke-injection height from wild-land fires using remote-sensing data, Atmos. Chem. Phys., 12, 1995–2006, https://doi.org/10.5194/acp-12-1995-2012, 2012. a
Spivakovsky, C. M., Logan, J. A., Montzka, S. A., Balkanski, Y. J., Foreman-Fowler, M., Jones, D. B. A., Horowitz, L. W., Fusco, A. C., Brenninkmeijer, C. A. M., Prather, M. J., Wofsy, S. C., and McElroy, M. B.: Three-dimensional climatological distribution of tropospheric OH: Update and evaluation, J. Geophys. Res.-Atmos., 105, 8931–8980, https://doi.org/10.1029/1999JD901006, 2000. a
Stohl, A.: Characteristics of atmospheric transport into the Arctic troposphere, J. Geophys. Res.-Atmos., 111, D11306, https://doi.org/10.1029/2005JD006888, 2006. a, b, c
Stohl, A., Forster, C., Frank, A., Seibert, P., and Wotawa, G.: Technical note: The Lagrangian particle dispersion model FLEXPART version 6.2, Atmos. Chem. Phys., 5, 2461–2474, https://doi.org/10.5194/acp-5-2461-2005, 2005. a
Stohl, A., Andrews, E., Burkhart, J. F., Forster, C., Herber, A., Hoch, S. W., Kowal, D., Lunder, C., Mefford, T., Ogren, J. A., Sharma, S., Spichtinger, N., Stebel, K., Stone, R., Ström, J., Tørseth, K., Wehrli, C., and Yttri, K. E.: Pan-Arctic enhancements of light absorbing aerosol concentrations due to North American boreal forest fires during summer 2004, J. Geophys. Res.-Atmos., 111, D22214, https://doi.org/10.1029/2006JD007216, 2006. a, b, c
Streets, D. G., Yarber, K. F., Woo, J.-H., and Carmichael, G. R.: Biomass burning in Asia: Annual and seasonal estimates and atmospheric emissions, Global Biogeochem. Cy., 17, 1099, https://doi.org/10.1029/2003GB002040, 2003. a
Sussmann, R. and Buchwitz, M.: Initial validation of ENVISAT/SCIAMACHY columnar CO by FTIR profile retrievals at the Ground-Truthing Station Zugspitze, Atmos. Chem. Phys., 5, 1497–1503, https://doi.org/10.5194/acp-5-1497-2005, 2005. a
Sussmann, R. and Schäfer, K.: Infrared spectroscopy of tropospheric trace gases: combined analysis of horizontal and vertical column abundances, Appl. Opt., 36, 735–741, https://doi.org/10.1364/AO.36.000735, 1997. a
Tanimoto, H., Kajii, Y., Hirokawa, J., Akimoto, H., and Minko, N. P.: The atmospheric impact of boreal forest fires in far eastern Siberia on the seasonal variation of carbon monoxide: Observations at Rishiri, A northern remote island in Japan, Geophys. Res. Lett., 27, 4073–4076, https://doi.org/10.1029/2000GL011914, 2000. a
Té, Y., Jeseck, P., Franco, B., Mahieu, E., Jones, N., Paton-Walsh, C., Griffith, D. W. T., Buchholz, R. R., Hadji-Lazaro, J., Hurtmans, D., and Janssen, C.: Seasonal variability of surface and column carbon monoxide over the megacity Paris, high-altitude Jungfraujoch and Southern Hemispheric Wollongong stations, Atmos. Chem. Phys., 16, 10911–10925, https://doi.org/10.5194/acp-16-10911-2016, 2016. a
Teakles, A. D., So, R., Ainslie, B., Nissen, R., Schiller, C., Vingarzan, R., McKendry, I., Macdonald, A. M., Jaffe, D. A., Bertram, A. K., Strawbridge, K. B., Leaitch, W. R., Hanna, S., Toom, D., Baik, J., and Huang, L.: Impacts of the July 2012 Siberian fire plume on air quality in the Pacific Northwest, Atmos. Chem. Phys., 17, 2593–2611, https://doi.org/10.5194/acp-17-2593-2017, 2017. a
Tereszchuk, K. A., González Abad, G., Clerbaux, C., Hurtmans, D., Coheur, P.-F., and Bernath, P. F.: ACE-FTS measurements of trace species in the characterization of biomass burning plumes, Atmos. Chem. Phys., 11, 12169–12179, https://doi.org/10.5194/acp-11-12169-2011, 2011. a, b, c
Tereszchuk, K. A., González Abad, G., Clerbaux, C., Hadji-Lazaro, J., Hurtmans, D., Coheur, P.-F., and Bernath, P. F.: ACE-FTS observations of pyrogenic trace species in boreal biomass burning plumes during BORTAS, Atmos. Chem. Phys., 13, 4529–4541, https://doi.org/10.5194/acp-13-4529-2013, 2013. a, b, c, d
The International GEOS-Chem User Community: geoschem/geos-chem: GEOS-Chem 12.1.1, Zenodo, https://doi.org/10.5281/zenodo.2249246, 2018. a, b
Thoning, K. W., Tans, P. P., and Komhyr, W. D.: Atmospheric carbon dioxide at Mauna Loa Observatory: 2. Analysis of the NOAA GMCC data, 1974–1985, J. Geophys. Res.-Atmos., 94, 8549–8565, https://doi.org/10.1029/JD094iD06p08549, 1989. a, b
Timofeyev, Y., Virolainen, Y., Makarova, M., Poberovsky, A., Polyakov, A., Ionov, D., Osipov, S., and Imhasin, H.: Ground-based spectroscopic measurements of atmospheric gas composition near Saint Petersburg (Russia), J. Mol. Spectrosc., 323, 2–14, https://doi.org/10.1016/j.jms.2015.12.007, 2016. a
Tomasi, C., Kokhanovsky, A. A., Lupi, A., Ritter, C., Smirnov, A., O'Neill, N. T., Stone, R. S., Holben, B. N., Nyeki, S., Wehrli, C., Stohl, A., Mazzola, M., Lanconelli, C., Vitale, V., Stebel, K., Aaltonen, V., de Leeuw, G., Rodriguez, E., Herber, A. B., Radionov, V. F., Zielinski, T., Petelski, T., Sakerin, S. M., Kabanov, D. M., Xue, Y., Mei, L., Istomina, L., Wagener, R., McArthur, B., Sobolewski, P. S., Kivi, R., Courcoux, Y., Larouche, P., Broccardo, S., and Piketh, S. J.: Aerosol remote sensing in polar regions, Earth-Sci. Rev., 140, 108–157, https://doi.org/10.1016/j.earscirev.2014.11.001, 2015. a
Tzompa‐Sosa, Z. A., Mahieu, E., Franco, B., Keller, C. A., Turner, A. J., Helmig, D., Fried, A., Richter, D., Weibring, P., Walega, J., Yacovitch, T. I., Herndon, S. C., Blake, D. R., Hase, F., Hannigan, J. W., Conway, S., Strong, K., Schneider, M., and Fischer, E. V.: Revisiting global fossil fuel and biofuel emissions of ethane, J. Geophys. Res.-Atmos., 122, 2493–2512, https://doi.org/10.1002/2016JD025767, 2017. a
Urbanski, S.: Wildland fire emissions, carbon, and climate: Emission factors, Forest Ecol. Manag., 317, 51–60, https://doi.org/10.1016/j.foreco.2013.05.045, 2014. a
Urbanski, S. P.: Combustion efficiency and emission factors for wildfire-season fires in mixed conifer forests of the northern Rocky Mountains, US, Atmos. Chem. Phys., 13, 7241–7262, https://doi.org/10.5194/acp-13-7241-2013, 2013. a, b, c
Val Martin, M., Honrath, R. E., Owen, R. C., Pfister, G., Fialho, P., and Barata, F.: Significant enhancements of nitrogen oxides, black carbon, and ozone in the North Atlantic lower free troposphere resulting from North American boreal wildfires, J. Geophys. Res.-Atmos., 111, D23S60, https://doi.org/10.1029/2006JD007530, 2006. a
Val Martin, M., Kahn, R. A., and Tosca, M. G.: A Global Analysis of Wildfire Smoke Injection Heights Derived from Space-Based Multi-Angle Imaging, Remote Sensing, 10, 1609, https://doi.org/10.3390/rs10101609, 2018. a, b
Veraverbeke, S., Rogers, B. M., Goulden, M. L., Jandt, R. R., Miller, C. E., Wiggins, E. B., and Randerson, J. T.: Lightning as a major driver of recent large fire years in North American boreal forests, Nat. Clim. Change, 7, 529–534, https://doi.org/10.1038/nclimate3329, 2017. a, b
Viatte, C., Strong, K., Paton-Walsh, C., Mendonca, J., O'Neill, N. T., and Drummond, J. R.: Measurements of CO, HCN, and C2H6 total columns in smoke plumes transported from the 2010 Russian boreal forest fires to the Canadian high Arctic, Atmos.-Ocean, 51, 522–531, https://doi.org/10.1080/07055900.2013.823373, 2013. a, b, c, d, e, f, g, h
Viatte, C., Strong, K., Walker, K. A., and Drummond, J. R.: Five years of CO, HCN, C2H6, C2H2, CH3OH, HCOOH and H2CO total columns measured in the Canadian high Arctic, Atmos. Meas. Tech., 7, 1547–1570, https://doi.org/10.5194/amt-7-1547-2014, 2014. a, b, c, d, e, f, g
Viatte, C., Strong, K., Hannigan, J., Nussbaumer, E., Emmons, L. K., Conway, S., Paton-Walsh, C., Hartley, J., Benmergui, J., and Lin, J.: Identifying fire plumes in the Arctic with tropospheric FTIR measurements and transport models, Atmos. Chem. Phys., 15, 2227–2246, https://doi.org/10.5194/acp-15-2227-2015, 2015. a, b, c, d, e, f, g, h, i, j, k, l, m, n, o
Vigouroux, C., Hendrick, F., Stavrakou, T., Dils, B., De Smedt, I., Hermans, C., Merlaud, A., Scolas, F., Senten, C., Vanhaelewyn, G., Fally, S., Carleer, M., Metzger, J.-M., Müller, J.-F., Van Roozendael, M., and De Mazière, M.: Ground-based FTIR and MAX-DOAS observations of formaldehyde at Réunion Island and comparisons with satellite and model data, Atmos. Chem. Phys., 9, 9523–9544, https://doi.org/10.5194/acp-9-9523-2009, 2009. a
Vigouroux, C., Stavrakou, T., Whaley, C., Dils, B., Duflot, V., Hermans, C., Kumps, N., Metzger, J.-M., Scolas, F., Vanhaelewyn, G., Müller, J.-F., Jones, D. B. A., Li, Q., and De Mazière, M.: FTIR time-series of biomass burning products (HCN, C2H6, C2H2, CH3OH, and HCOOH) at Reunion Island (21∘ S, 55∘ E) and comparisons with model data, Atmos. Chem. Phys., 12, 10367–10385, https://doi.org/10.5194/acp-12-10367-2012, 2012. a, b, c, d
Vigouroux, C., Bauer Aquino, C. A., Bauwens, M., Becker, C., Blumenstock, T., De Mazière, M., García, O., Grutter, M., Guarin, C., Hannigan, J., Hase, F., Jones, N., Kivi, R., Koshelev, D., Langerock, B., Lutsch, E., Makarova, M., Metzger, J.-M., Müller, J.-F., Notholt, J., Ortega, I., Palm, M., Paton-Walsh, C., Poberovskii, A., Rettinger, M., Robinson, J., Smale, D., Stavrakou, T., Stremme, W., Strong, K., Sussmann, R., Té, Y., and Toon, G.: NDACC harmonized formaldehyde time series from 21 FTIR stations covering a wide range of column abundances, Atmos. Meas. Tech., 11, 5049–5073, https://doi.org/10.5194/amt-11-5049-2018, 2018. a
Ward, D. E. and Hardy, C. C.: Smoke emissions from wildland fires, Environment International, 17, 117–134, https://doi.org/10.1016/0160-4120(91)90095-8, 1991. a
Warneke, C., Bahreini, R., Brioude, J., Brock, C. A., de Gouw, J. A., Fahey, D. W., Froyd, K. D., Holloway, J. S., Middlebrook, A., Miller, L., Montzka, S., Murphy, D. M., Peischl, J., Ryerson, T. B., Schwarz, J. P., Spackman, J. R., and Veres, P.: Biomass burning in Siberia and Kazakhstan as an important source for haze over the Alaskan Arctic in April 2008, Geophys. Res. Lett., 36, L02813, https://doi.org/10.1029/2008GL036194, 2009. a, b
Wentworth, G. R., Aklilu, Y.-A., Landis, M. S., and Hsu, Y.-M.: Impacts of a large boreal wildfire on ground level atmospheric concentrations of PAHs, VOCs and ozone, Atmos. Environ., 178, 19–30, https://doi.org/10.1016/j.atmosenv.2018.01.013, 2018. a, b
Westerling, A. L., Hidalgo, H. G., Cayan, D. R., and Swetnam, T. W.: Warming and earlier spring increase western US forest wildfire activity, Science, 313, 940–943, https://doi.org/10.1126/science.1128834, 2006. a
Whaley, C. H., Strong, K., Jones, D. B. A., Walker, T. W., Jiang, Z., Henze, D. K., Cooke, M. A., McLinden, C. A., Mittermeier, R. L., Pommier, M., and Fogal, P. F.: Toronto area ozone: Long-term measurements and modeled sources of poor air quality events, J. Geophys. Res.-Atmos., 120, 11368–11390, https://doi.org/10.1002/2014JD022984, 2015. a, b, c
Wiacek, A., Taylor, J. R., Strong, K., Saari, R., Kerzenmacher, T. E., Jones, N. B., and Griffith, D. W. T.: Ground-Based Solar Absorption FTIR Spectroscopy: Characterization of Retrievals and First Results from a Novel Optical Design Instrument at a New NDACC Complementary Station, J. Atmos. Ocean. Tech., 24, 432–448, https://doi.org/10.1175/JTECH1962.1, 2007. a
Witte, J. C., Douglass, A. R., da Silva, A., Torres, O., Levy, R., and Duncan, B. N.: NASA A-Train and Terra observations of the 2010 Russian wildfires, Atmos. Chem. Phys., 11, 9287–9301, https://doi.org/10.5194/acp-11-9287-2011, 2011. a
Wofsy, S. C., Sachse, G. W., Gregory, G. L., Blake, D. R., Bradshaw, J. D., Sandholm, S. T., Singh, H. B., Barrick, J. A., Harriss, R. C., Talbot, R. W., Shipham, M. A., Browell, E. V., Jacob, D. J., and Logan, J. A.: Atmospheric chemistry in the Arctic and subarctic: Influence of natural fires, industrial emissions, and stratospheric inputs, J. Geophys. Res.-Atmos., 97, 16731–16746, https://doi.org/10.1029/92JD00622, 1992. a
Wotton, B. M., Nock, C. A., and Flannigan, M. D.: Forest fire occurrence and climate change in Canada, Int. J. Wildland Fire, 19, 253–271, https://doi.org/10.1071/WF09002, 2010. a
Xiao, Y., Jacob, D. J., and Turquety, S.: Atmospheric acetylene and its relationship with CO as an indicator of air mass age, J. Geophys. Res., 112, D12305, https://doi.org/10.1029/2006JD008268, 2007. a
Xiao, Y., Logan, J. A., Jacob, D. J., Hudman, R. C., Yantosca, R., and Blake, D. R.: Global budget of ethane and regional constraints on U.S. sources, J. Geophys. Res.-Atmos., 113, D21306, https://doi.org/10.1029/2007JD009415, 2008. a, b
Yasunari, T. J., Kim, K.-M., da Silva, A. M., Hayasaki, M., Akiyama, M., and Murao, N.: Extreme air pollution events in Hokkaido, Japan, traced back to early snowmelt and large-scale wildfires over East Eurasia: Case studies, Sci. Rep.-UK, 8, 6413, https://doi.org/10.1038/s41598-018-24335-w, 2018. a
Yevich, R. and Logan, J. A.: An assessment of biofuel use and burning of agricultural waste in the developing world, Global Biogeochem. Cy., 17, 1095, https://doi.org/10.1029/2002GB001952, 2003. a
Yokelson, R. J., Griffith, D. W. T., and Ward, D. E.: Open-path Fourier transform infrared studies of large-scale laboratory biomass fires, J. Geophys. Res.-Atmos., 101, 21067–21080, 1996. a, b
Yokelson, R. J., Goode, J. G., Ward, D. E., Susott, R. A., Babbitt, R. E., Wade, D. D., Bertschi, I., Griffith, D. W. T., and Hao, W. M.: Emissions of formaldehyde, acetic acid, methanol, and other trace gases from biomass fires in North Carolina measured by airborne Fourier transform infrared spectroscopy, J. Geophys. Res.-Atmos., 104, 30109–30125, https://doi.org/10.1029/1999JD900817, 1999. a, b, c
Yokelson, R. J., Bertschi, I. T., Christian, T. J., Hobbs, P. V., Ward, D. E., and Hao, W. M.: Trace gas measurements in nascent, aged, and cloud-processed smoke from African savanna fires by airborne Fourier transform infrared spectroscopy (AFTIR), J. Geophys. Res.-Atmos., 108, 8478, https://doi.org/10.1029/2002JD002322, 2003. a, b
Yokelson, R. J., Crounse, J. D., DeCarlo, P. F., Karl, T., Urbanski, S., Atlas, E., Campos, T., Shinozuka, Y., Kapustin, V., Clarke, A. D., Weinheimer, A., Knapp, D. J., Montzka, D. D., Holloway, J., Weibring, P., Flocke, F., Zheng, W., Toohey, D., Wennberg, P. O., Wiedinmyer, C., Mauldin, L., Fried, A., Richter, D., Walega, J., Jimenez, J. L., Adachi, K., Buseck, P. R., Hall, S. R., and Shetter, R.: Emissions from biomass burning in the Yucatan, Atmos. Chem. Phys., 9, 5785–5812, https://doi.org/10.5194/acp-9-5785-2009, 2009. a
Yokelson, R. J., Andreae, M. O., and Akagi, S. K.: Pitfalls with the use of enhancement ratios or normalized excess mixing ratios measured in plumes to characterize pollution sources and aging, Atmos. Meas. Tech., 6, 2155–2158, https://doi.org/10.5194/amt-6-2155-2013, 2013. a
York, D., Evensen, N. M., Martińez, M. L., and De Basabe Delgado, J.: Unified equations for the slope, intercept, and standard errors of the best straight line, Am. J. Phys., 72, 367–375, https://doi.org/10.1119/1.1632486, 2004. a
Yurganov, L. N.: A quantitative assessment of the 1998 carbon monoxide emission anomaly in the Northern Hemisphere based on total column and surface concentration measurements, J. Geophys. Res.-Atmos., 109, D15305, https://doi.org/10.1029/2004JD004559, 2004. a
Yurganov, L. N., Duchatelet, P., Dzhola, A. V., Edwards, D. P., Hase, F., Kramer, I., Mahieu, E., Mellqvist, J., Notholt, J., Novelli, P. C., Rockmann, A., Scheel, H. E., Schneider, M., Schulz, A., Strandberg, A., Sussmann, R., Tanimoto, H., Velazco, V., Drummond, J. R., and Gille, J. C.: Increased Northern Hemispheric carbon monoxide burden in the troposphere in 2002 and 2003 detected from the ground and from space, Atmos. Chem. Phys., 5, 563–573, https://doi.org/10.5194/acp-5-563-2005, 2005. a
Yurganov, L. N., Rakitin, V., Dzhola, A., August, T., Fokeeva, E., George, M., Gorchakov, G., Grechko, E., Hannon, S., Karpov, A., Ott, L., Semutnikova, E., Shumsky, R., and Strow, L.: Satellite- and ground-based CO total column observations over 2010 Russian fires: accuracy of top-down estimates based on thermal IR satellite data, Atmos. Chem. Phys., 11, 7925–7942, https://doi.org/10.5194/acp-11-7925-2011, 2011. a
Zander, R., Mahieu, E., Demoulin, P., Duchatelet, P., Roland, G., Servais, C., De Mazière, M., Reimann, S., and Rinsland, C. P.: Our changing atmosphere: evidence based on long-term infrared solar observations at the Jungfraujoch since 1950, Sci. Total Environ., 391, 184–195, https://doi.org/10.1016/j.scitotenv.2007.10.018, 2008. a, b
Zander, R., Duchatelet, P., Mahieu, E., Demoulin, P., Roland, G., Servais, C., Auwera, J. V., Perrin, A., Rinsland, C. P., and Crutzen, P. J.: Formic acid above the Jungfraujoch during 1985–2007: observed variability, seasonality, but no long-term background evolution, Atmos. Chem. Phys., 10, 10047–10065, https://doi.org/10.5194/acp-10-10047-2010, 2010. a
Zellweger, C., Hüglin, C., Klausen, J., Steinbacher, M., Vollmer, M., and Buchmann, B.: Inter-comparison of four different carbon monoxide measurement techniques and evaluation of the long-term carbon monoxide time series of Jungfraujoch, Atmos. Chem. Phys., 9, 3491–3503, https://doi.org/10.5194/acp-9-3491-2009, 2009. a, b
Zhao, Y., Kondo, Y., Murcray, F. J., Liu, X., Koike, M., Kita, K., Nakajima, H., Murata, I., and Suzuki, K.: Carbon monoxide column abundances and tropospheric concentrations retrieved from high resolution ground-based infrared solar spectra at 43.5∘ N over Japan, J. Geophys. Res.-Atmos., 102, 23403–23411, https://doi.org/10.1029/97JD01970, 1997. a, b, c
Zhao, Y., Kondo, Y., Murcray, F. J., Liu, X., Koike, M., Irie, H., Strong, K., Suzuki, K., Sera, M., and Ikegami, Y.: Seasonal variations of HCN over Northern Japan measured by ground-based infrared solar spectroscopy, Geophys. Res. Lett., 27, 2085–2088, https://doi.org/10.1029/1999GL011218, 2000. a, b, c
Zhao, Y., Strong, K., Kondo, Y., Koike, M., Matsumi, Y., Irie, H., Rinsland, C. P., Jones, N. B., Suzuki, K., Nakajima, H., Nakane, H., and Murata, I.: Spectroscopic measurements of tropospheric CO, C2H6, C2H2, and HCN in Northern Japan, J. Geophys. Res.-Atmos., 107, 4343–4359, https://doi.org/10.1029/2001JD000748, 2002. a, b, c