the Creative Commons Attribution 3.0 License.
the Creative Commons Attribution 3.0 License.
Space–time variability in UTLS chemical distribution in the Asian summer monsoon viewed by limb and nadir satellite sensors
Jiali Luo
Laura L. Pan
Shawn B. Honomichl
John W. Bergman
William J. Randel
Gene Francis
Cathy Clerbaux
Maya George
Xiong Liu
Wenshou Tian
The Asian summer monsoon (ASM) creates a hemispheric-scale signature in trace-gas distributions in the upper troposphere and lower stratosphere (UTLS). Data from satellite retrievals are the best source of information for characterizing these large-scale signatures. Measurements from the Microwave Limb Sounder (MLS), a limb-viewing satellite sensor, have been the most widely used retrieval products for these types of studies. This work explores the information for the ASM influence on UTLS chemical distribution from two nadir-viewing sensors, the Infrared Atmospheric Sounding Interferometer (IASI) and the Ozone Monitoring Instrument (OMI), together with the MLS. Day-to-day changes in carbon monoxide (CO) and ozone (O3) tracer distributions in response to dynamical variability are examined to assess how well the data from different sensors provide useful information for studying the impact of sub-seasonal-scale dynamics on chemical fields. Our results, using June–August 2008 data, show that although the MLS provides relatively sparse horizontal sampling on daily timescales, interpolated daily CO distributions show a high degree of dynamical consistency with the synoptic-scale structure of and variability in the anticyclone. Our analysis also shows that the IASI CO retrieval has sufficient sensitivity to produce upper tropospheric (UT) CO with variabilities independent from the lower to middle tropospheric CO. The consistency of IASI CO field with the synoptic-scale anticyclone dynamical variability demonstrates that the IASI UT CO product is a physically meaningful dataset. Furthermore, IASI CO vertical cross sections combined with the daily maps provide the first observational evidence for a model analyses-based hypothesis on the preferred ASM vertical transport location and the subsequent horizontal redistribution via east–west eddy shedding. Similarly, the OMI O3 profile product is shown to be capable of distinguishing the tropospheric-dominated air mass in the anticyclone from the stratospheric-dominated background on a daily timescale, providing consistent and complementary information to the MLS. These results not only highlight the complementary information between nadir and limb sensors but also demonstrate the value of “process-based” retrieval evaluation for characterizing satellite data information content.
- Article
(59430 KB) - Full-text XML
- BibTeX
- EndNote
As a prominent atmospheric circulation feature in the upper troposphere and lower stratosphere (UTLS) during boreal summer, the Asian summer monsoon (ASM) anticyclone's large-scale dynamical behavior has been investigated widely in recent years (e.g., Hoskins and Rodwell, 1995; Highwood and Hoskins, 1998; Zhang et al., 2002; Liu et al., 2007; Wu et al., 2015). The ASM anticyclone is bounded by the westerly jet to the north and easterly jet to the south, and this circulation is linked to enhanced air confinement (e.g., Dunkerton, 1995; Randel and Park, 2006; Garny and Randel, 2016; Fan et al., 2017). Due to the influences of deep convection and air confinement, seasonal-mean chemical composition within the anticyclone near the tropopause displays distinctly surface-like characteristics; boundary layer and tropospheric tracers, such as CO, H2O, HCN, and a large set of hydrocarbons, are significantly enhanced, while O3 as a stratospheric tracer is significantly decreased (Park et al., 2004; Li et al., 2005; Randel and Park, 2006; Park et al., 2007; Randel et al., 2010; Vernier et al., 2011; Garny and Randel, 2013).
Although the ASM anticyclone is a strong and steady feature of seasonal-scale circulations in the UTLS, it undergoes variations on sub-seasonal timescales. These include 10–20-day east–west migrations and the associated eddy shedding (Hsu and Plumb, 2000; Popovic and Plumb, 2001; Zhang et al., 2002; Garny and Randel, 2013). Previous studies have shown that the monsoon circulation has active–break cycles that are linked to oscillations of deep convection with timescales of 10–20 and 30–60 days (e.g., Krishnamurti and Bhalme, 1976; Krishnamurti and Ardanuy, 1980; Annamalai and Slingo, 2001; Randel and Park, 2006). Zhang et al. (2002) found that the center of the anticyclone shows bimodality in its longitude location that they classify in terms of the Tibetan mode (centered at about 90∘ E) and the Iranian mode (centered at about 60∘ E), although the degree of bimodality appears dependent on the meteorological dataset (Nützel et al., 2016). A number of recent studies have shown that sub-seasonal-scale dynamical processes in the ASM region may play a significant role in UTLS transport of trace gases (Yan et al., 2011; Garny and Randel, 2013; Pan et al., 2016; Vogel et al., 2016). It is evident that diagnosing intra-seasonal variability in chemical tracers in the UTLS and their interactions with dynamical fields is important for a more complete understanding of the ASM anticyclone's chemical impact.
Satellite observations provide an essential source of information in ASM UTLS-related studies. The Aura Microwave Limb Sounder (MLS) and the Atmospheric Chemistry Experiment Fourier Transform Spectrometer (ACE-FTS), in particular, are two widely used datasets from limb-viewing sensors for this purpose (e.g., Park et al., 2007; Randel et al., 2010). These limb sounders offer relatively high vertical resolution but have limited horizontal sampling on daily timescales. Nadir-viewing instruments, however, offer better horizontal sampling and daily coverage but have limited vertical resolution and are primarily used to study column abundances.
This study aims to examine the representation of sub-seasonal chemical variability in the ASM UTLS from limb- and nadir-viewing sensors. Two specific nadir datasets we explore are CO from the Infrared Atmospheric Sounding Interferometer (IASI) and O3 from the Ozone Monitoring Instrument (OMI). These two datasets will be examined together with MLS CO and O3 data. CO is a pollution tracer and is also an effective tracer of transport in the troposphere and lower stratosphere (LS) (e.g., Bowman, 2006), with a photochemical lifetime of ∼2 months in the troposphere (Xiao et al., 2007). O3 is an effective transport tracer in the UTLS because of the large gradient in its mixing ratio across the tropopause and its long lifetime relative to transport timescales in the UTLS region. In the UTLS, O3 mostly serves as a stratospheric tracer, although it also has tropospheric pollution sources. Short-term variations in O3 in the UTLS are largely linked to synoptic-scale disturbances in the tropopause region (e.g., Shapiro, 1980). These satellite datasets are examined with meteorological analyses from the Global Forecast System (GFS) to address the following questions. (1) Do these nadir-viewing instruments, designed primarily for retrieving trace-gas column abundance, have sufficient information to show the ASM dynamically driven trace-gas distributions and variability at UTLS levels? (2) Are the data from nadir sensors consistent with the limb-viewing data on sub-seasonal scales with respect to dynamical variability in tracers in the ASM region? (3) What can we learn from the complementary information from limb- and nadir-viewing instruments?
Although the IASI CO and OMI O3 are compared with MLS CO and O3, respectively, it is not the goal of this work to evaluate the quantitative agreement between the nadir and limb data. The difference in viewing geometries makes limb-viewing and nadir-viewing datasets fundamentally different quantities since the air masses they are sensing represent very different volume and spatial extent (described in Sect. 2). The goal of these comparisons, therefore, is to evaluate whether data from the two types of sensors provide a consistent picture of the ASM dynamical impact on the UTLS tracer distributions and variability. We characterize this type of analysis as process-based retrieval evaluation. This analysis provides a perspective of whether the high-density horizontal sampling from the nadir sensors supplements information from the limb-viewing sensors, despite the relatively coarse vertical resolution, in the region of strong synoptic-scale horizontal dynamical variability. This work is therefore not a validation study, but rather, it aims to complement previous validation studies of the MLS CO and O3, the IASI CO, and the OMI O3 profile products (Livesey et al., 2008; George et al., 2009; Liu et al., 2010a, b; Kroon et al., 2011; De Wachter et al., 2012; Bak et al., 2013; Safieddine et al., 2016; Barret et al., 2016; Huang et al., 2017).
Although both CO and O3 are examined in this work, the focus is on their relationship with the ASM dynamical structure. No attempt is included here to use a tracer–tracer relationship as an additional diagnostic for UTLS transport. In the CO analysis, we focus on the upper troposphere (UT) variability associated with convective pumping and the horizontal redistribution by the dynamics of the anticyclone. In the O3 analysis, we focus on the tropopause level and the sensitivity of data to the tropopause structure. Overall, we give more focus on the CO analysis.
2.1 Satellite data
For limb-viewing observations, we use MLS version 4, level 2, 215 hPa CO, 147 hPa CO, and 100 hPa O3 data. MLS is a forward-looking sounder onboard the Aura satellite launched in July 2004 (Waters et al., 2006). Accurate data descriptions of CO and O3, including uncertainties, are given in Livesey et al. (2017). Briefly, the vertical resolution of CO retrievals at 147 hPa (215 hPa) is 5.1 km (5.4 km) and the single-profile precision is ∼16 ppbv (19 ppbv). The systematic uncertainty for 147 hPa CO is the root sum square (RSS) of 26 ppbv and 30 %. For 215 hPa CO it is 30 ppbv and 30 %. The O3 retrieval has a vertical resolution of 3 km at 100 hPa. The single-profile precision is estimated to be ∼30 ppbv. The systematic uncertainty for 100 hPa O3 is estimated to be 5 ppbv+7 % (Livesey et al., 2017). As a limb sounder, MLS's field of view produces a horizontal resolution of ∼6 km across the track and ∼300 km, 570 km, and 590 km along the track for 100 hPa O3, 147 hPa, and 215 hPa CO, respectively, MLS has a relatively low daily sampling density (∼240 limb scans per orbit with ∼3500 profiles during both day and night). In order to make the daily output easier to interpret, daily maps are made by interpolating the output onto a regular grid.
Nadir-viewing observations of CO are obtained from IASI (level 2 data) aboard EUMETSAT's Metop satellite. IASI measures the thermal infrared (TIR) spectrum emitted by the Earth–atmosphere system with twice daily near-global coverage (with 4 simultaneous pixels of 12 km diameter every 50 km), but limited vertical resolution (Clerbaux et al., 2009). The tropospheric CO product is derived from the spectra using the FORLI retrieval algorithm, which uses a single a priori profile and covariance matrix (Hurtmans et al., 2012; George et al., 2015). The IASI CO level 2 retrieval product is provided as mixing ratios in 19 1 km layers from surface to 19 km altitude. The retrieval information content analysis, however, shows 0.8 to 2.4 (1.5 to 2.0 at mid-latitudes) independent pieces of information (or degrees of freedom for signal (DOFS); George et al., 2009). How well this information content allows IASI CO retrieval to capture UT variability at midlatitudes and tropical latitudes is one of the foci of this study. Our analysis will complement previous validation studies, including in situ measurements from the “Measurements of ozone, water vapor, carbon monoxide and nitrogen oxides by Airbus in-service aircraft” (MOZAIC) project (correlations ∼0.7; De Wachter et al., 2012), and satellite observations from the Measurements Of Pollution In The Troposphere (MOPITT) instrument (George et al., 2015). This work also aims to complement previous IASI data analyses, which show the data reproduce monthly mean large-scale features in the UTLS over the ASM region comparable to model results from GEOS-Chem (a chemical transport model coupled to meteorological analysis from the Goddard Earth Observing System GEOS-5; Barret et al., 2016).
Nadir-viewing observations of O3 are obtained from OMI, an O3 sounder aboard the Aura satellite that provides daily global coverage in a 13 km × 24 km footprint (Levelt et al., 2006). OMI O3 products include retrievals of both total O3 columns and vertical profiles. In this study, we use the O3 profile product by Liu et al. (2010b) and Huang et al. (2017). O3 profiles are retrieved at 24 vertical layers covering the surface to ∼60 km using the optimal estimation technique constrained by a monthly and zonal mean O3 profile climatology (McPeters et al., 2007). The OMI profile retrievals have 6.0–7.0 degrees of freedom (5.0–6.7 in the stratosphere; Liu et al., 2005, 2010b, a). The distribution of the information content is sufficient to resolve the UTLS transition region in part owing to the large O3 gradient across the tropopause, as demonstrated by a number of previous works (Pittman et al., 2009; Liu et al., 2010a, b; Bak et al., 2013). For vertical distribution of the averaging kernels and information content, see Liu et al. (2010b). In this work, we use a level 3 product gridded to 1∘ longitude × 1∘ latitude horizontal resolution. Only the layer 18 product is used, which is a layer centered approximately at the 100 hPa level, with retrieval information from a broad layer of approximately 10 km (Liu et al., 2010b). In the ASM anticyclone region, this layer is contributed to more from the UT inside the anticyclone and from the LS outside. OMI has known cross-track-dependent biases (Liu et al., 2010a, b). Thus the data points from view zenith angles (VZAs) greater than 58∘ are not used in the mapping process.
To highlight the horizontal sampling density and vertical sensitivity differences between the limb-viewing and nadir-viewing sensors, Fig. 1 shows the geolocations of all IASI and MLS profiles and the relevant averaging kernels for the study domain (0–180∘ E, 10∘ S–60∘ N) in a single day (1 August 2008). Both daytime and nighttime samplings are included. It is apparent from Fig. 1a that IASI has a much denser horizontal coverage than the MLS. Note that both datasets have data gaps: while the MLS orbit tracks are separated by ∼20∘ longitude, the IASI retrieval also has a significant data gap each day due to the cloud coverage (no IASI products are available if the cloud fraction in the pixel exceeds 25 %). The comparison of O3 data sampling densities between OMI and MLS is not shown but it is conceptually similar to that shown in Fig. 1a. This disparity of sampling density and its implications for representing synoptic-scale variability motivates this work of exploring the utility of nadir-viewing data in characterizing chemical distributions in the UTLS on daily to sub-seasonal timescales.
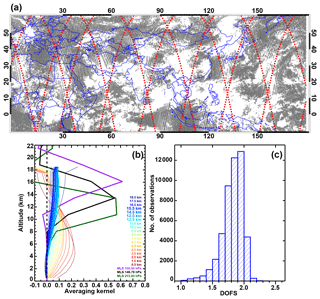
Figure 1(a) Retrieval geolocations for IASI CO (gray crosses) and MLS CO (red dots) on 1 August 2008 for the study domain (0–180∘ E, 10∘ S–60∘ N). Both day and night observations are included. (b) IASI averaging kernels for 19 retrieval layers from the surface to 19 km, labeled by the layer-center altitudes, and the standard MLS averaging kernels for the UTLS products (215, 147, and 100 hPa). The IASI curves are the averages of all profiles from the study domain on 1 August 2008. (c) Distribution of degrees of freedom for signal (DOFS) for all IASI profiles on 1 August 2008 within (0, 40∘ N) latitude and (40–150∘ E) longitude.
Figure 1b shows the vertical information distribution for both IASI and MLS UT CO retrievals. The IASI averaging kernels for the CO product in 19 layers are shown, which are the average of all individual profiles included in Fig. 1a. Note that the altitude labels for these layers are referring to the centers of the 1 km layer as part of the product identification and they are not intended for representing independent information from each layer. The physical information for these layer products is contributed from a broad layer, as indicated by the averaging kernels (Fig. 1b). To provide a perspective of retrieval information content in the study region, we show the distribution of DOFS for IASI profiles in Fig. 1c. The distribution shows that the majority of the profiles are estimated to have DOFS close to 2, which supports that IASI CO retrievals should have sufficient information for independent variability in the upper and the middle troposphere (MT). In this study, we aim to evaluate the upper tropospheric CO variability using the IASI CO product. The most relevant retrieval product layers are 12–16 km. Averaging kernels for these layers are highlighted in Fig. 1b.
MLS vertical sensitivity is shown by the standard CO averaging kernels for the 215, 147, and 100 hPa products (Livesey et al., 2017). Although we focus on the 147 hPa product in this analysis, 215 and 100 hPa averaging kernels are included in the figure to contrast the sensitivity distributions in the two instruments. The figure provides a perspective that IASI retrieval information content is optimized for the MT. The UT information is much weaker, maximized over a range of UT layers, and is not sharply peaked at a particular retrieval layer. In contrast, MLS information for 147 hPa CO shows a strong maximum near 14 km (∼150 hPa). The figure also indicates that both the nadir- and the limb-viewing sensors are expected to have “smoothing errors” in the retrieval.
A similar figure for OMI is not shown since for ozone analysis we are not focusing on independent information between the UT and lower troposphere to MT, rather we focus on stratospheric versus tropospheric influence in ozone distribution near the tropopause level (∼100 hPa pressure level) and expect the contrast between the air mass inside and outside the anticyclone to be dominated by the tropopause structure of the region. For more complete averaging kernel discussions, see the MLS data quality document (Livesey et al., 2017) and the work of George et al. (2009) for IASI data and Liu et al. (2010b) for OMI data.
2.2 Meteorological analysis data
We use wind fields, geopotential height (GPH), tropopause height, and potential temperature (derived from temperature and pressure) from the GFS operational analysis (a product of the National Centers for Environmental Prediction, NCEP) to diagnose the dynamical variability in the ASM anticyclone. These 6-hourly data have a horizontal resolution of 1∘ on 26 pressure levels (from 1000 to 10 hPa) (National Centers for Environmental Prediction/National Weather Service/NOAA/U.S. Department of Commerce, 2000). Having pressure and height for the tropopause in the product, and the determination of these levels using the native GFS grid, is a major strength of the product that motivated our choice (Pan and Munchak, 2011).
Figure 1a highlights the sampling gaps from both MLS and IASI for mapping daily CO distributions. Careful data interpolation and smoothing to fill data gaps are essential steps for producing daily maps from the available retrievals on each given day. In general, the daily representation from MLS data requires interpolation to increase the density in coverage, while the IASI (and OMI) data densities are reduced by binned averages. We have explored three interpolation algorithms, cosine smoothing, natural neighbor, and inverse distance, for mapping data. All three methods are similar, conceptually, in filling an empty cell with weighted mean of nearby observations, but the weightings are determined differently. After experimenting with various grid sizes and mapping methods, we choose to use longitudes and latitudes for mapping MLS data and 3 for the IASI data. The results shown in this paper are mapped using the natural neighbor method (Watson, 1992) followed by a Gaussian smoothing. We find that these steps produce daily maps with a good balance between representing the synoptic-scale variability and the information from the data in localized structures.
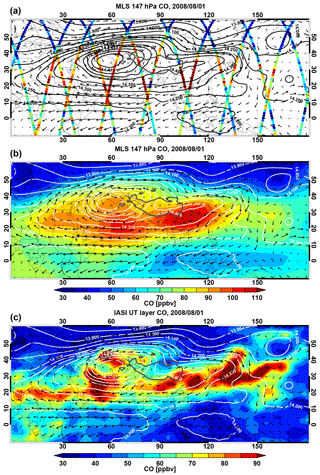
Figure 2(a) MLS 147 hPa CO mixing ratio at retrieval geolocations on 1 August 2008, (b) the interpolated map of MLS CO, and (c) the interpolated map of IASI CO in the upper troposphere (UT) layer on 1 August 2008. The selected geopotential height (GPH) contours (white) and horizontal winds (black arrows) at 150 hPa are superimposed. The MLS CO map is made with longitude and latitude grids. The IASI CO map is made using grids. Both are interpolated using the natural neighbor algorithm (Watson, 1992).
Figure 2 provides an example using 1 August 2008 data, in which maps of retrieved MLS 147 hPa CO (Fig. 2a), interpolated MLS 147 hPa CO (Fig. 2b), and IASI CO in the UT layer (Fig. 2c) are shown. The IASI UT layer CO mixing ratio is produced by interpolating the layer product to 150 hPa. Although the interpolation aimed to find the CO mixing ratio approximation for 150 hPa, it is clear from the averaging kernel that the retrieval represents a layer. The retrieval information for this layer is represented by the averaging kernels for 12.5–15.5 km layers as highlighted in Fig. 1b. To emphasize this limitation in vertical resolution, we refer to this layer as the UT layer in the rest of the paper. Note we have used different color scales for MLS and IASI CO and the rationale for this is given in the next section. The dynamical fields of 150 hPa GPH and the horizontal wind are superimposed for identifying the location and structure of the ASM anticyclone. Comparison of the MLS data on the orbital tracks (Fig. 2a) and the interpolated map (Fig. 2b) provides a useful perspective that the mapping procedure we choose highlights the large-scale dynamical consistency of the CO and the flow pattern instead of the fine-scale structure. Comparison of MLS (Fig. 2b) and IASI (Fig. 2c) CO maps provides additional perspective that although both datasets show CO enhancement in the region of the ASM anticyclone, the appearance and detail of the enhancement are quite different. These differences are contributed to by several factors. For example, the missing data in IASI (due to cloud contamination) and the larger grid size in MLS may both contribute to the difference in the spatial pattern of the enhancement between 90–120∘ E and 20–30∘ N. Similarly, the filamentary structure in IASI CO near 150∘ E and 30∘ N, although hinted at in the MLS orbital data, is represented differently in the MLS CO map. Additionally, IASI signal-to-noise ratio is likely degraded over the region of elevated terrain, which will be discussed in later examples. The two datasets are also obtained at slightly different sampling times, as the MLS and the IASI cross the Equator at around 01:30 and 09:30 local time, respectively. These factors need to be kept in mind when interpreting the details.
Although the focus of this study is to characterize chemical tracers' space–time variability and dynamical consistency, we make quantitative comparisons between the MLS and IASI CO data in this section. The comparisons focus on the consistency between the two datasets in representing CO UT variability in the study domain and their representation of the well-demonstrated large-scale spatial pattern associated with the ASM anticyclone on the seasonal scale. Vertical ranges of the data were chosen to optimize the overlap of information from nadir- and limb-viewing instruments with the vertical extent of the anticyclone. Based on the analyses of the dynamical fields and trajectory calculations, the maximum chemical confinement in the anticyclone in the vertical range is between 200–100 hPa or 12–16 km (Randel and Park, 2006), although elevated levels of tropospheric tracers in the ASM anticyclone are evident at up to 68 hPa in the MLS data (Park et al., 2007). Moreover, the strongest closed circulation of the anticyclone occurs at ∼14–15 km, above the main convective outflow level (∼12 km) (Park et al., 2008). Based on this structure and the vertical information content of IASI CO retrieval (George et al., 2009), we choose to use the IASI UT layer CO mixing ratio and the 147 hPa MLS CO retrieval product. The June–July–August (JJA) season of a single year of 2008 is examined.
Figure 3 shows a scatter plot of IASI CO in the UT layer versus the MLS 147 hPa CO level 2 product. Each point represents a co-located daily average in a ∘ longitude–latitude bin in the study domain for all days in the JJA 2008 period. The scatter plot shows that variations in CO in the two datasets are generally consistent and correlated (r=0.8), although the IASI CO shows a smaller range of variability than MLS (indicated by the slope of the linear fit, 0.55). The smaller variability in IASI CO is likely contributed to by a weaker detection sensitivity in the UT and the use of a single a priori profile in CO retrieval (George et al., 2015).
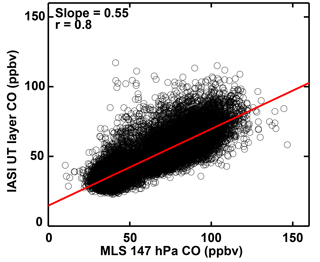
Figure 3Scatter plot of IASI UT layer CO versus MLS 147 hPa CO for June, July, and August (JJA) 2008. Each data point represents a daily average of CO level 2 data from IASI and MLS in the same ∘ longitude–latitude box in the study domain. The red line shows a linear fit. Correlation and slope for the linear fit are given in the upper left corner of the panel.
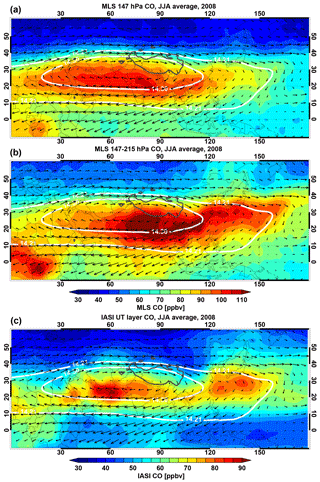
Figure 4JJA 2008 seasonal average CO mixing ratio for (a) MLS 147 hPa, (b) the MLS 147 and 215 hPa average, and (c) the IASI UT layer. Superimposed white contours are the 14.3 and 14.2 km GPH (from GFS analysis) at 150 hPa. Note that the color scales for IASI and MLS CO are different. Both MLS and IASI are longitude–latitude binned averages.
Figure 4 shows JJA seasonal averages for (a) MLS 147 hPa CO, (b) the MLS CO average of the 147 and 215 hPa products, and (c) IASI UT layer CO for 2008. Note that different ranges are used in the MLS and IASI color bar to adjust for the smaller range of variability in IASI CO as indicated in Fig. 3. Selected GPH contours and wind vectors at 150 hPa for the same period are shown on all three maps to indicate the seasonal mean location of the anticyclone. The chemical signature of the ASM anticyclone is evident for all three seasonal averages. The clear chemical signature indicates that, despite the relatively weak UT sensitivity, the IASI data are capable of showing the impact of the ASM circulation on UT CO. Spatially, the MLS 147 hPa and IASI UT layer CO mixing ratio fields show noticeable differences in their horizontal locations. The IASI enhancement pattern shows an overall eastward shift relative to the MLS. There is a pattern of strong enhancement between 120 and 150∘ E in IASI CO seasonal average that is not clearly present in the MLS 147 hPa seasonal average. In view of the broad vertical structure in IASI averaging kernels for the UT layer, we also constructed a seasonal average layer using both MLS 147 and 215 hPa products (Fig. 4b), which have a region of CO enhancement very comparable to the IASI UT CO pattern. This result shows that IASI UT layer CO is consistent with MLS CO from the combined 147 and 215 hPa product on seasonal timescales. The comparison also suggests that the region's UT CO enhancement has an east–west tilted vertical structure. The dynamical factors that contribute to the tilted chemical structure likely involve the vertical range of the anticyclone confinement and the altitudinal distributions of the easterly and westerly jets.
In addition to the weaker enhancement and the location offset, CO enhancements over the Tibetan and Iranian plateaus are largely missing in the IASI average. This is likely a result of weakened signal-to-noise ratio in the nadir sensor retrieval due to the higher surface elevation. We re-visit this issue in later sections using daily examples.
Overall, these comparisons provide quantitative and qualitative characterizations on the seasonal and the ASM regional scale variabilities represented in the IASI CO product relative to the MLS data, which have been widely used to investigate chemical tracer distributions and transport in this region (e.g., Park et al., 2007; Santee et al., 2017). We now proceed to analyze the sub-seasonal-scale variability.
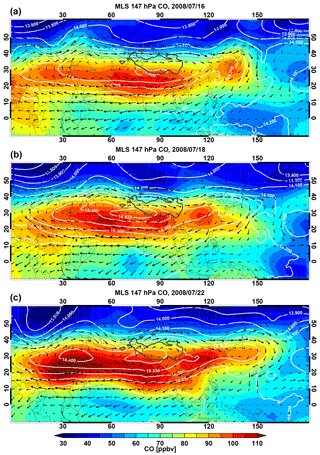
Figure 5Daily maps of MLS CO mixing ratio at 147 hPa (color shading) on (a) 16 July, (b) 18 July, and (c) 22 July 2008. Dynamical fields of GPH (white contours) and horizontal winds (black arrows) are superimposed. Maps are interpolated using the natural neighbor algorithm (Watson, 1992) to longitude–latitude grids. The location of the Tibetan Plateau (using 3 km elevation) is also shown in the maps (thick gray).
5.1 UT CO variability from MLS data
We begin our examination of daily maps in Fig. 5, which shows mixing ratios of MLS CO at 147 hPa and the dynamical fields (winds and GPH) at 150 hPa for selected days. During the time period, the dynamical evolution of the anticyclone, as indicated by the selected GPH contours, shows different phases of the east–west oscillation (Pan et al., 2016). In this sequence, the anticyclone was initially in the Tibetan mode (16 July, when the maximum of the anticyclone as represented by the GPH was located near the southern edge of the Tibetan Plateau). In subsequent days the anticyclone elongates, and the center migrates westward toward the Iranian mode (18 July). As the anticyclone further elongates, the center eventually splits, and the anticyclone forms a double center (22 July), with the two maxima located around 30 and 80∘ E and a hinted at third center near 135∘ E as indicated by the wind field. During this time period, the center of maximum CO enhancement also migrated westward from south of the Tibetan Plateau (16 July) to around 60∘ E (18 July) and 30∘ E (22 July). Additional effect of the anticyclone elongation is the appearance of an additional CO maximum east of the Tibetan Plateau, which eventually migrates eastward to the western Pacific near southern Japan (see Fig. 7a, 26 July), similar to the configuration of 16 July (Fig. 5a). The 16–26 July time period therefore provided an example of ASM dynamical and chemical variations in a cycle of a 10–20-day east–west oscillation. We refer to this additional CO maximum and associated anticyclonic circulation over the region of the western Pacific near Japan as the western Pacific mode, which is likely related to a system locally referred to as the Bonin high (Enomoto et al., 2003).
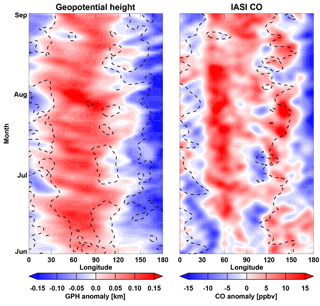
To quantify the correlation of CO enhancement with the dynamics of the anticyclone east–west oscillation, we compare the anomaly fields of the GPH and CO through the season in Hovmöller diagrams (Fig. 6). The Hovmöller diagrams are constructed by first calculating daily mean GPH and CO in the latitude band of 10–40∘ N and 0–220∘ E. Note we have extended the longitude range further east in this calculation to include a larger background. This is because the study region is dominated by three highs. Including the region outside the highs is necessary for identifying the highs as positive anomalies. The anomaly is derived for each 5∘ longitude bin by subtracting the daily mean. The mean correlation of the spatial (longitudinal) variability between the CO and GPH anomalies for the 3-month period is 0.92. Note that the Hovmöller diagram shown in Fig. 6 is constructed using the interpolated CO field. If using the retrieved CO data only, this correlation is significantly weaker due to the sparse sampling of MLS data. As a comparison, a similar analysis using a global model shows a correlation of ∼0.7 (Pan et al., 2016).
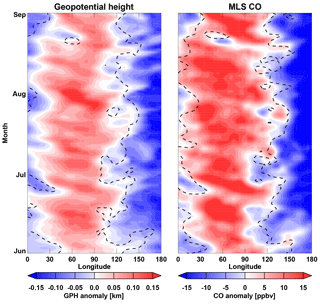
Figure 6Hovmöller diagrams of the 150 hPa GPH and 147 hPa MLS CO anomalies for JJA 2008. The anomalies are calculated with respect to daily means over the latitude band 10–40∘ N and longitude range 0–220∘ E, in 5∘ longitude bins. The dashed line in each panel indicates the location of the mean (zero anomaly) of the opposite field. The Pearson's correlation of the two fields for the 3-month period is 0.92.
Note that this analysis is very similar to a previous work of ASM dynamical and chemical variability in the context of eddy shedding. Using low-PV air (PV ≤0.3 PVU) as the dynamical tracer, the correlation analyses between daily PV and MLS CO data at 370 K during one season (May–September) resulted in a spatial correlation of ∼0.5 (Garny and Randel, 2013).
Figure 6 demonstrates that the UT CO distribution is closely linked to the UT dynamical variability in the anticyclone. The dynamics of this east–west oscillation phenomenon is the focus of a number of works (e.g., Hsu and Plumb, 2000; Popovic and Plumb, 2001; Liu et al., 2007) in which convective pumping of low-PV air to the UT followed by eddy shedding creates the transient behavior of the anticyclone. The persistent low PV at the tropopause level occurs around 90∘ E (Popovic and Plumb, 2001; Garny and Randel, 2013), which is considered the center of the Tibetan Plateau mode (Zhang et al., 2002). The low-PV air propagates both westwards and eastwards. A model analysis using CO as a tracer further concludes that the vertical transport of boundary layer air predominantly occurs near the southern flank of the Tibetan Plateau, and the enhanced CO over the entire anticyclone is a result of transient mixing and anticyclone confinement (Pan et al., 2016). In Fig. 6 both GPH and MLS CO show stronger westward propagation in 10–20 periods and relatively smaller eastward propagation.
Overall, Figs. 5 and 6 show that, despite the limited horizontal sampling, MLS data provide enough information to successfully capture the day-to-day co-variability in CO with the dynamical fields with the help of careful mapping procedures.
5.2 CO variability associated with ASM dynamics from IASI data analyses
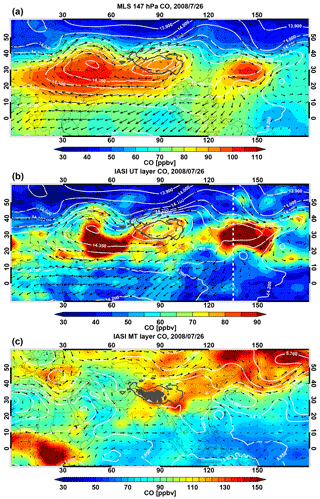
Figure 7(a) MLS 147 hPa CO, (b) IASI UT layer CO, and (c) IASI middle troposphere (MT) layer CO for a selected day (26 July 2008). Dynamical fields of GPH (white contours) and horizontal winds (black arrows) for the corresponding levels (150 hPa for a and b, 500 hPa for c) are superimposed. Elevated terrain is indicated by gray shadings for the 500 hPa map in (c). The location of the Tibetan Plateau (using 3 km elevation) is also shown in the maps (thick gray line). The dashed white line in (b) marks the location of the cross section shown in Fig. 9d.
We begin the IASI data discussion by evaluating the information content in the IASI UT CO retrieval. Although in the literature the term “retrieval information content” almost always refers to the DOFS calculated using forward and retrieval models, we propose an alternative way of demonstrating the information content in this work through the analyses of dynamical consistency. This type of evaluation may bring new insight into the retrieval since it evaluates the result of the retrieval, which may vary depending on how the sensitivity represented by the DOFS is used.
Figure 7b–c show an example of daily IASI CO maps in two layers: the UT layer and the MT layer. The MT layer is derived from interpolating the IASI layer product to 500 hPa. The two layers are chosen to examine the dependency of the retrieval between the UT and MT CO. Dynamically, these two layers are associated with distinct flow patterns, which should have clear signatures in the CO distribution. Comparing the CO fields between these two layers and with the flow patterns, shown by the 150 and 500 hPa GPH and winds, provides an effective test of whether the retrieval sensitivity is sufficient to resolve independent UT and lower troposphere to MT CO variability. This result complements the retrieval information content calculated from DOFS, as shown in Fig. 1c. As a reference, we have also included the MLS CO map for the same day using the 147 hPa product (Fig. 7a).
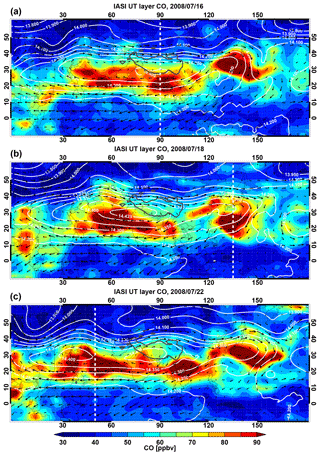
Figure 8Same as Fig. 5, but for the IASI UT layer CO mixing ratio. The maps are interpolated to longitude–latitude grids. The dashed white lines mark the location of the cross sections shown in Fig. 9.
This chosen day (26 July 2008) follows the sequence of days from Fig. 5 for MLS and Fig. 8 for IASI. Dynamically, the UT anticyclone is in a “tri-center” phase of the east–west oscillation, following the elongation shown in Fig. 5. There are three anticyclonic centers: the strongest one over the Tibetan Plateau (∼90∘ E) and the second near the border of Iran and Iraq (∼50∘ E), both indicated by the maxima of GPH; the third center is over the western Pacific near 140∘ E, with the closed circulation indicated by the wind arrows. The IASI UT CO mixing ratio map shows a high degree of consistency with the flow pattern at the 150 hPa level, and the distribution in this layer does not appear to be correlated with the MT CO mixing ratio map. This example demonstrates the capability of the IASI retrieval to produce CO distribution in the ASM UT independent from the lower to MT CO.
Figure 7a and b provide another case comparison between the maps based on MLS and IASI (note the different color scales), adding to the case in Fig. 2. Although the two maps visually show different areas of hot spots, the overall patterns of CO enhancement are very comparable if using the area greater than ∼85 ppbv in the MLS map and that of greater than ∼65 ppbv in the IASI map. Over the Tibetan Plateau, the IASI CO map shows decreased enhancement in the high GPH center, consistent with degraded signal-to-noise ratio due to the high terrain (marked by gray shading in Fig. 7c), while over the western Pacific, the IASI CO enhancement is more intense. This comparison provides a single-day example and complements the information in Fig. 4 and the associated discussions.
Figure 8 shows the IASI UT CO mixing ratio maps during the same period as MLS maps in Fig. 5. The overall CO enhancement patterns are very comparable to the MLS data if comparing the area of 65 ppbv or greater with MLS values of 85 ppbv or greater. The IASI maps, however, show additional finer-scale structures, consistent with the flow pattern. Similar to the previous example, all three maps show the weakening of CO enhancement over the region of high elevation over both the Tibetan and Iranian plateaus. In all three cases, the IASI maps show much stronger CO enhancement over or around the western Pacific high.
Note that physically there is no reason to expect a perfect correlation between the CO maximum and the GPH maximum since the dynamical field and the CO mixing ratios are controlled by different processes (Garny and Randel, 2013). A significant correlation in the UT reflects the strong influence of the anticyclone dynamics on the air mass and persistent boundary layer emission and convective pumping. The interesting differences between the MLS and IASI UT CO enhancements over the western Pacific, again, suggest that the IASI UT retrievals have a broad vertical sensitivity, as shown by the averaging kernels (Fig. 1b).
In addition to UT horizontal variability, IASI data provide opportunities to investigate vertical structure of CO in the monsoon region. One of the significant conclusions from a model study (Pan et al., 2016) is that the UT CO enhancement over the Iranian Plateau is not formed by the vertical transport from the local boundary layer. Rather, it is produced by the westward shedding from the UT over the region associated with the Tibetan mode. A similar hypothesis can be made for the western Pacific enhancement. We examine the IASI CO cross sections to search for observational evidence for verifying these hypotheses. Four examples are shown in Fig. 9. These four pressure–latitude cross sections are selected to examine the vertical structure in the centers of the Tibetan, Iranian, and western Pacific modes. The locations of the cross sections are marked on the maps in Figs. 7 and 8.
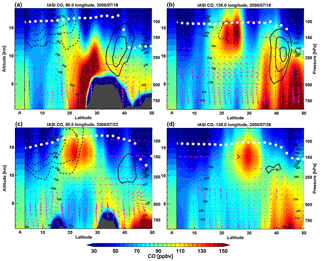
Figure 9Selected latitude–height cross sections of the IASI CO retrieval. The retrieval a priori profile is shown as the leftmost column in each panel (marked as “A” on x axis). The days and the location of the cross sections are selected to highlight the different vertical structures of the three modes of the anticyclone: (a) 90∘ E on 16 July (Tibetan mode), (b) 135∘ E on 18 July (western Pacific mode), (c) 50∘ E on 22 July (Iranian mode), and (d) 135∘ E on 27 July (western Pacific mode). The corresponding maps are given in Figs. 7 and 8. A number of dynamical fields are overlaid, including zonal winds (black contours, solid (dashed) for westerly (easterly)), meridional wind (pink arrows), potential temperatures (thin black dashed lines), and the tropopause height (white dots).
The cross section in Fig. 9a is at the center of the Tibetan mode (see Fig. 8a for map). The CO enhancement in this case extends from the surface to near 14 km, with a vertical structure consistent with the flow field; i.e., the vertical structure of the enhancement is collocated with the region of strong vertical winds over northern India and the southern flank of the Tibetan Plateau. Dynamically, this is identified as the ascending branch of the monsoon Hadley cell (Wang, 2006). For more discussion on the climatological flow structure in the meridional plane, see analyses in Zhang et al. (2002). This example also shows that in this region, the plateau is taking away approximately half of the atmosphere, consequently degrading the nadir sensor's signal-to-noise ratio for retrieval, leading to a weakened CO enhancement over the plateau at higher altitude. This factor likely contributed to the difference between MLS 147 hPa and IASI UT CO data-based maps over the plateau (see Figs. 5a and 8a).
The cross sections in Fig. 9b and d are two examples of the CO enhancement over the western Pacific high. In both cases, the enhanced layers are shown in the UT. Similarly, Fig. 9c shows an example of an enhanced UT CO layer near the southern edge of the Iranian plateau. In all three cases (Fig. 9b–d) the wind fields indicate a change of circulation from strong vertical motion in the lower troposphere to MT to the horizontal-flow-dominated UT. Overall, the cross sections support the hypothesis that the UT CO enhancement over the middle east and the western Pacific are not a result of local vertical transport but are produced by UT redistribution via westward and eastward eddy shedding.
Figure 9 not only provides observational evidence supporting the model-based hypothesis on transport structure, it also provides evidence supporting the ability of the IASI retrieval to resolve independent variability in the UT CO. Note that in each cross section, we have also included the retrieval a priori profile as the leftmost column. Since the IASI retrieval uses a single a priori profile, the leftmost columns in each of the four panels are identical. The UT variability shown in each cross section is not only dynamically consistent but also independent from the lower troposphere to MT and the a priori profile. The effective use of information content in the IASI retrieval is powerfully demonstrated in these cross sections, complementing and much more enlightening than the averaging kernels shown in Fig. 1b.
Similar to Fig. 6, we show Hovmöller diagrams of daily anomaly fields for 150 hPa GPH and IASI UT CO mixing ratio for JJA 2008 (Fig. 10) to quantify the correlation in sub-seasonal variability. As expected, the weakened retrieval signal over the plateaus produced a nonphysical structure around the 100∘ E longitude segment. On both the eastern and western edges, the CO anomaly shows a tendency of eastward shift relative to the GPH anomaly, a feature that is consistent with the discussion in Fig. 4. The overall correlation is 0.69.
We now turn our attention to the UTLS O3 from MLS and OMI. While CO is a boundary layer pollution tracer, O3 in the UTLS region is foremost a transport tracer highlighting the influence of the stratosphere, although its distribution can also be affected by photochemical production. Here, the influence of monsoon convection on the UT O3 distribution is somewhat complicated since the polluted air masses tend to have enhanced precursors for ozone production. For these reasons, we focus on analyzing ozone variability at the UTLS level using 100 hPa MLS data and the OMI layer 18 product. The large-scale O3 distribution at the 100 hPa level over the ASM region reflects the tropospheric influence on the air mass inside the anticyclone in contrast to the stratospheric influence outside. The structure of the bulging tropopause in the monsoon region (Bian et al., 2012; Pan et al., 2016) has a significant influence on the O3 distribution at the 100 hPa level. Lower O3 mixing ratios are expected inside the anticyclone in the layer near 100 hPa since the tropopause is at a lower pressure inside the anticyclone than it is outside in this region. Previous work analyzing MLS 100 hPa CO and O3 led to a similar conclusion (Park et al., 2007, Fig. 9). We aim to examine how well the data from MLS, which has relatively sparse horizontal sampling but better vertical resolution, and OMI, which has high-density coverage horizontally but with coarse vertical resolution, represent the correlation between the ozone field and the sub-seasonal-scale dynamical variability in the tropopause in the ASM region.
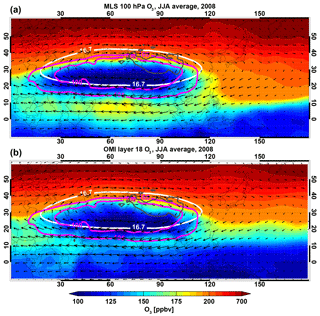
Figure 11JJA seasonal average O3 mixing ratio for the (a) MLS 100 hPa product and (b) OMI layer 18 product for 2008. Superimposed white contours are the 16.7 km GPH at 100 hPa and magenta contours are the 100 and 105 hPa tropopause pressure, i.e., the intersection of the tropopause with the 100 and 105 hPa pressure surfaces. Both MLS and OMI are longitude–latitude binned averages.
6.1 Comparison of 100 hPa MLS and OMI O3 data on seasonal-scale variability
Similar to the CO analysis, we first compare the two O3 datasets on seasonal timescales. Figure 11 shows 100 hPa MLS and OMI average O3 for JJA 2008. Also included in the figure are seasonal averages of a few selected dynamical fields for the same time period. The 100 hPa wind field is included to show the anticyclonic flow associated with the ASM. The location of the anticyclone is marked by the 16.7 km GPH contour and the contours of the tropopause intersection with the 100 and 105 hPa pressure surfaces. The contours of the tropopause pressure and the GPH show a small south–north offset. The 100 hPa O3 gradient change is well aligned with the tropopause contours, supporting the concept of ASM creating a tropospheric “bubble” in the otherwise stratospheric background at this level. Both the MLS- and OMI-based seasonal means show low O3 in the area of higher tropopause as expected. MLS O3 shows a band of high O3 near the southern edge of the anticyclone. This is a well-known dynamical structure associated with the mixing of high-latitude stratospheric air driven by the anticyclonic flow (e.g., Konopka et al., 2010). This band of high O3 appears weaker on the OMI map. The average of the finer structure with spatial variability and the limitation of the coarse vertical resolution in detecting a shallow layer may both contribute to the weaker seasonal appearance.
To evaluate the consistency in representing variability in daily data, Fig. 12 shows a scatter plot of OMI versus MLS daily grid point average O3 near the 100 hPa in the study region over the JJA 2008 period. The grid point average is calculated daily in each co-located ∘ longitude–latitude box through the study domain. This figure is similar to the CO scatter plot in Fig. 3, but the correlation between the OMI and MLS O3 is much better with both the slope (0.94) and the correlation coefficient (0.96) near unity.
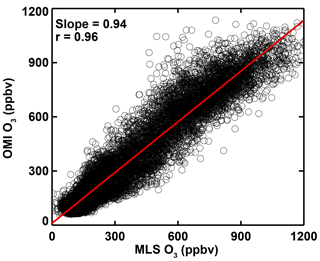
Figure 12Same as Fig. 3 but for the OMI layer 18 O3 mixing ratio versus the MLS O3 mixing ratio at 100 hPa for JJA 2008. The red line shows a linear fit. Correlation and slope for the linear fit are given in the upper left corner of the panel.
Figures 11 and 12 characterize the good overall agreement between OMI and MLS O3 on seasonal and ASM regional scales. We now proceed to examine the daily and sub-seasonal variability represented by the two datasets.
6.2 Representation of sub-seasonal-scale variability from MLS and OMI O3
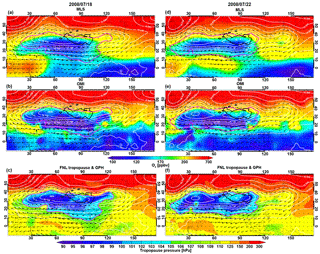
Figure 13Daily maps of MLS O3 mixing ratio at 100 hPa and OMI O3 mixing ratio in layer 18 (color shading) for 18 July (a, b) and 22 July (d, e) 2008. Tropopause pressure maps for the same selected two days are shown in (c, f). Dynamical fields of GPH (white contours), horizontal winds (gray arrows), and 105 hPa tropopause pressure contour (pink) are superimposed. MLS maps are interpolated using the natural neighbor method on longitude–latitude grids while OMI maps are interpolated on longitude–latitude grids. The tropopause pressure is from the GFS product. A Gaussian smoothing is applied to all maps. The location of the Tibetan Plateau (using 3 km elevation) is also shown in the maps.
Figure 13 shows maps of MLS 100 hPa O3, OMI layer 18 O3, and the tropopause pressure for two selected days in July 2008. Dynamical fields of the GPH and horizontal wind are superimposed on the O3 maps. The 105 hPa tropopause contour is included in all maps. Both sets of O3 maps exhibit the characteristic low O3 mixing ratios inside the anticyclone. Here the 105 hPa tropopause contour appears to correlate well with the O3 and wind field gradients. Note that the tropopause pressure here is from the GFS final analysis product, which is based on the World Meteorological Organization thermal tropopause definition. Since this quantity is derived from the vertical gradient and is not analyzed on the pressure surface, its intersection with the pressure surface can appear noisy. Gaussian smoothing is applied to the ∘ tropopause data on all maps.
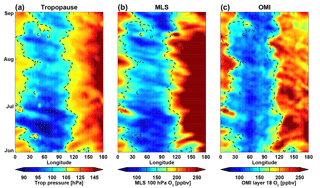
Figure 14Longitudinal-time (Hovmöller) diagrams for (a) tropopause pressure, (b) MLS 100 hPa O3 mixing ratio, and (c) OMI layer 18 O3 mixing ratio for the JJA season 2008. The Hovmöller diagram is constructed using the daily average over 15–35∘ N. MLS data have been averaged over 5∘ longitude bins, and OMI data have been averaged in 1∘ longitude bins. The 105 hPa zonal average tropopause pressure is shown by the dashed line on all three fields. Gaussian smoothing is applied to all three datasets.
For the two selected days, the dynamical structures of the anticyclone are in two different phases as discussed in relation to Figs. 5 and 8. The ASM influence at the tropopause level shows a wider longitudinal range on the 18 July (approximately 20–130∘ E), and it is westwardly migrated on the 22 July (approximately 10–110∘ E) and with a double-centered structure. The OMI O3 map on 18 July shows a close correspondence with the longitudinal range of the tropopause pressure, while the MLS map shows a westward shift of the low-O3 area. The difference in horizontal sampling density is likely a contributor. On 22 July, both MLS and OMI O3 gradients are well co-located with the anticyclone boundary as indicated by the 105 hPa tropopause contour. The MLS O3 structure shows a more well-defined double-centered structure. The OMI map shows a smaller O3 depression over the Tibetan Plateau. We speculate that surface elevation may have contributed to the structure in OMI O3, similar to the IASI CO discussion. The high ozone band on the southern side of the anticyclone shows a large difference between MLS and OMI, with MLS having a much wider structure. Both the coarser horizontal sampling of MLS and the coarser vertical resolution of OMI for resolving this shallow layer may contribute to this difference.
The Hovmöller diagrams in Fig. 14 examine sub-seasonal variations and the relationship between the tropopause pressure and 100 hPa O3 field during the JJA season of 2008. All three fields in the figure are dominated by the persistent location of the anticyclone as indicated by the lower tropopause pressure and of O3 mixing ratios between 30 and 100∘ E. All three Hovmöller diagrams exhibit westward propagation in 10–20-day timescales. The correlation in the variability along the longitudinal dimension is 0.90 between the tropopause pressure and MLS O3 and 0.76 between the tropopause pressure and OMI O3. In both cases, the interpolated fields are used to calculate the correlations. The strong correlation between the tropopause structure and O3 supports the conceptual model that the higher tropopause over the ASM forms a region of tropospheric bubble above the mean level of tropical tropopause for the season. This structure enables a unique transport pathway for air masses in the bubble to enter the LS via horizontal eddy shedding, bypassing the equatorial tropical tropopause (e.g., Garny and Randel, 2016; Ploeger et al., 2017).
While the two O3 datasets provide generally consistent large-scale ozone structure, there are visible differences between MLS and OMI in small-scale structures. Potential impacts of clouds on retrievals at 100 hPa are discussed in a recent OMI validation study (Huang et al., 2017). The weaker O3 depression near 90∘ E is likely contributed to by the impact of surface elevation on the OMI retrieval. A better understanding of the small-scale structures can benefit from validation studies using airborne measurements targeting the ASM UTLS structure.
We have examined space–time variability in chemical tracers in the UTLS associated with the ASM represented by nadir-viewing (IASI and OMI) satellite instruments in comparison with a widely used limb-viewing (MLS) dataset. Using CO (a boundary layer pollution tracer) and O3 (a stratospheric tracer), we focus on the strengths and limitations of these data for representing the distribution of and variability in UTLS chemical tracers in the region of the dynamically variable ASM anticyclone. We explore whether the much denser horizontal samplings of the nadir sensors provide information complementary to the higher vertical resolution limb data for the tracer daily distribution in response to synoptic-scale variability.
Our CO analysis shows that, despite a relatively coarse horizontal sampling on daily timescales, the interpolated MLS 147 hPa daily CO field exhibits a high degree of correlation with the dynamical variability on synoptic scales (Figs. 5 and 6). The spatial correlation between the CO anomaly and the GPH anomaly at 150 hPa for the ASM region is 0.92 for the 2008 JJA season studied. The same correlation for IASI CO is much weaker (r=0.69) (Fig. 10), largely due to the missing UT enhancement over the elevated surface of the Tibetan Plateau. There is also an eastward shift in the CO positive anomaly pattern relative to the GPH. A comparison between IASI and the MLS CO seasonal averages leads to an insight that IASI UT CO includes contributions from a broad layer, comparable to the range of the combined 147 and 215 hPa MLS product, which is consistent with the broad vertical structure shown in IASI averaging kernels.
Quantitatively, IASI UT CO shows a variability consistent with the MLS 147 hPa product over the ASM season and region, although IASI CO has a smaller range of variability and misses the enhancement over the plateaus, likely due to the regions' elevated surface, which reduces the nadir-viewing sensor's signal (Figs. 3 and 4). On daily to weekly timescales, IASI's data resolve finer structures in CO distribution owing to its higher horizontal sampling density. The most important complementary information is provided by IASI vertical cross sections (Fig. 9), which provide information identifying the region of upward transport. Selected examples provided the first observation evidence supporting the model-based hypothesis that the large-scale UT enhancement over the ASM is a combined result of vertical pumping and horizontal re-distribution at the UTLS level via eddy shedding (Pan et al., 2016).
In the O3 analysis, nadir sensor data from OMI show a good agreement with MLS O3 near the 100 hPa level when averaged seasonally and when compared using a longitude–latitude grid point daily average (Figs. 11 and 12). The dynamical consistency of OMI O3 mixing ratios in the layer 18 product (centered near 100 hPa) on seasonal and sub-seasonal timescales demonstrates the sufficient information for the nadir-viewing datasets to contribute to the ASM dynamically driven UTLS O3 variability. Both MLS and OMI O3 variability in the region exhibit good correlations with the tropopause pressure, supporting the conceptual model that the ASM creates a tropospheric bubble above the season's average tropopause in the tropics (Pan et al., 2016).
The CO maps from different layers (Fig. 7) and selected cross sections (Fig. 9) both provide strong evidence that IASI has sufficient information content to discriminate UT CO variability from that in the lower troposphere to MT. This result is consistent with and complementary to the model estimates of retrieval information content, which show that the DOFS for the interested region is approximately 2 (Fig. 1c). The overall dynamical consistency found in IASI CO maps and cross sections demonstrates the value of IASI CO data for ASM transport studies. The OMI O3 product in the layer near 100 hPa also shows a high degree of correlation with the MLS product, and dynamical consistency with the variability in the tropopause. Results of this study therefore demonstrate the approach of process-based retrieval information content evaluation. This type of evaluation is different from traditional validation studies, in which the goals are focused on retrieval accuracies and precisions and often involve quantitative comparisons with independent and better trusted data. This type of evaluation also complements the traditional information content analyses based on forward and inverse model calculations and gives additional physical meaning to information content from data application in process studies.
Overall, our analysis demonstrates the value of high horizontal sampling density from the nadir-viewing sensors in capturing the dynamical variability in UTLS tracer distributions. Although the retrieval has fewer degrees of freedom for each profile, the large number of profiles retrieved daily at finer footprints produce valuable information regarding horizontal dynamical variability. The results of this analysis not only demonstrated the significant role of ASM sub-seasonal-scale dynamics in UTLS chemical distributions but also bring new insight into the dynamics of the ASM through the differences of these two types of sensors.
NCEP FNL analyses (National Centers for Environmental Prediction/National Weather Service/NOAA/U.S. Department of Commerce, 2000) are available at the NCAR Research Data Archive as NCEP FNL Operational Model Global Tropospheric Analyses and is updated daily continuing from July 1999 by Computational and Information Systems Laboratory. The data are available at https://doi.org/10.5065/D6M043C6. The MLS data are available from the NASA archive: https://acdisc.gesdisc.eosdis.nasa.gov/data/Aura_MLS_Level2/ (last access 10 May 2018). IASI CO profile data are delivered by Eumetcast since 2016 in near real time (https://www.eumetsat.int/website/home/Data/DataDelivery/EUMETCast/index.html, last access: 27 August 2018). The JJA 2008 profile data used in this study are available from ftp://ftp.acom.ucar.edu/user/liwen/IASI (Francis, 2015). OMI O3 profile data (OMPROFOZ) (Yang et al., 2014) are available at https://avdc.gsfc.nasa.gov/index.php?site=1389025893&id=74.
LP designed the study as part of JL's PhD research. JL conducted the research analysis, made the figures, and wrote the paper. SH contributed to data analysis and writing of the paper. GF, CC, and MG contributed the IASI CO data information for the special analysis. XL provided OMI O3 data and the information content discussion. JB, WR, CC, XL, and WT discussed the results and all authors contributed to the writing of the paper.
The authors declare that they have no conflict of interest.
This work is part of Jiali Luo's PhD research, funded by the
National Science Foundation of China (41705021, 41630421, and 41575038). The
work was in part conducted at the National Center for Atmospheric Research,
operated by the University Corporation for Atmospheric Research under
sponsorship of the United States National Science Foundation. The IASI
mission is a joint mission of EUMETSAT and the Centre National d'Etudes
Spatiales (CNES, France). We thank the ULB team (Daniel Hurtmans, Pierre Coheur) for the development of the FORLI-CO retrieval algorithm and
Mijeong Park for helpful discussions. We also thank the three anonymous reviewers for
their helpful comments and suggestions.
Edited by: Federico Fierli
Reviewed by: three anonymous referees
Annamalai, H. and Slingo, J. M.: Active/break cycles: diagnosis of the intraseasonal variability of the Asian Summer Monsoon, Clim. Dynam., 18, 85–102, https://doi.org/10.1007/s003820100161, 2001.
Bak, J., Liu, X., Wei, J. C., Pan, L. L., Chance, K., and Kim, J. H.: Improvement of OMI ozone profile retrievals in the upper troposphere and lower stratosphere by the use of a tropopause-based ozone profile climatology, Atmos. Meas. Tech., 6, 2239–2254, https://doi.org/10.5194/amt-6-2239-2013, 2013.
Barret, B., Sauvage, B., Bennouna, Y., and Le Flochmoen, E.: Upper-tropospheric CO and O3 budget during the Asian summer monsoon, Atmos. Chem. Phys., 16, 9129–9147, https://doi.org/10.5194/acp-16-9129-2016, 2016.
Bian, J., Pan, L. L., Paulik, L., Vömel, H., Chen, H., and Lu, D.: In situ water vapor and ozone measurements in Lhasa and Kunming during the Asian summer monsoon, Geophys. Res. Lett., 39, L19808, https://doi.org/10.1029/2012GL052996, 2012.
Bowman, K. P.: Transport of carbon monoxide from the tropics to the extratropics, J. Geophys. Res., 111, D02107, https://doi.org/10.1029/2005JD006137, 2006.
Clerbaux, C., Boynard, A., Clarisse, L., George, M., Hadji-Lazaro, J., Herbin, H., Hurtmans, D., Pommier, M., Razavi, A., Turquety, S., Wespes, C., and Coheur, P.-F.: Monitoring of atmospheric composition using the thermal infrared IASI/MetOp sounder, Atmos. Chem. Phys., 9, 6041–6054, https://doi.org/10.5194/acp-9-6041-2009, 2009.
De Wachter, E., Barret, B., Le Flochmoën, E., Pavelin, E., Matricardi, M., Clerbaux, C., Hadji-Lazaro, J., George, M., Hurtmans, D., Coheur, P.-F., Nedelec, P., and Cammas, J. P.: Retrieval of MetOp-A/IASI CO profiles and validation with MOZAIC data, Atmos. Meas. Tech., 5, 2843–2857, https://doi.org/10.5194/amt-5-2843-2012, 2012.
Dunkerton, T. J.: Evidence of meridional motion in the summer lower stratosphere adjacent to monsoon regions, J. Geophys. Res., 100, 16675–16688, https://doi.org/10.1029/95JD01263, 1995.
Enomoto, T., Hoskins, B. J., and Matsuda, Y. : The formation mechanism of the Bonin high in August, Q. J. Roy. Meteor. Soc., 129, 157–178, https://doi.org/10.1256/qj.01.211, 2003.
Fan, Q. J., Bian, J. C., and Pan, L.L.: Stratospheric entry point for upper-tropospheric air within the Asian summer monsoon anticyclone, Sci. China Earth Sci., 60, 1685–1693, https://doi.org/10.1007/s11430-016-9073-5, 2017
Francis, G.: IASI CO profile level-2 data, available at: ftp://ftp.acom.ucar.edu/user/liwen/IASI (last access: 27 August 2018), 2015.
Garny, H. and Randel, W. J.: Dynamic variability of the Asian monsoon anticyclone observed in potential vorticity and correlations with tracer distributions, J. Geophys. Res.-Atmos., 118, 13421–13433, https://doi.org/10.1002/2013JD020908, 2013.
Garny, H. and Randel, W. J.: Transport pathways from the Asian monsoon anticyclone to the stratosphere, Atmos. Chem. Phys., 16, 2703–2718, https://doi.org/10.5194/acp-16-2703-2016, 2016.
George, M., Clerbaux, C., Hurtmans, D., Turquety, S., Coheur, P.-F., Pommier, M., Hadji–Lazaro, J., Edwards, D. P., Worden, H., Luo, M., Rinsland, C., and McMillan, W.: Carbon monoxide distributions from the IASI/METOP mission: evaluation with other space-borne remote sensors, Atmos. Chem. Phys., 9, 8317–8330, https://doi.org/10.5194/acp-9-8317-2009, 2009.
George, M., Clerbaux, C., Bouarar, I., Coheur, P.-F., Deeter, M. N., Edwards, D. P., Francis, G., Gille, J. C., Hadji-Lazaro, J., Hurtmans, D., Inness, A., Mao, D., and Worden, H. M.: An examination of the long-term CO records from MOPITT and IASI: comparison of retrieval methodology, Atmos. Meas. Tech., 8, 4313–4328, https://doi.org/10.5194/amt-8-4313-2015, 2015.
Highwood, E. and Hoskins, B.: The tropical tropopause, Q. J. Roy. Meteor. Soc., 124, 1579–1604, https://doi.org/10.1002/qj.49712454911, 1998.
Hoskins, B. J. and Rodwell, M. J.: A model of the Asian summer monsoon. Part I: The global scale, J. Atmos. Sci., 52, 1329–1340, https://doi.org/10.1175/1520-0469(1995)052<1329:AMOTAS>2.0.CO;2, 1995.
Hsu, C. J. and Plumb, R. A.: Nonaxisymmetric Thermally Driven Circulations and Upper-Tropospheric Monsoon Dynamics, J. Atmos. Sci., 57, 1255–1276, https://doi.org/10.1175/1520-0469(2000)057<1255:NTDCAU>2.0.CO;2, 2000.
Huang, G., Liu, X., Chance, K., Yang, K., Bhartia, P. K., Cai, Z., Allaart, M., Ancellet, G., Calpini, B., Coetzee, G. J. R., Cuevas-Agulló, E., Cupeiro, M., De Backer, H., Dubey, M. K., Fuelberg, H. E., Fujiwara, M., Godin-Beekmann, S., Hall, T. J., Johnson, B., Joseph, E., Kivi, R., Kois, B., Komala, N., König-Langlo, G., Laneve, G., Leblanc, T., Marchand, M., Minschwaner, K. R., Morris, G., Newchurch, M. J., Ogino, S.-Y., Ohkawara, N., Piters, A. J. M., Posny, F., Querel, R., Scheele, R., Schmidlin, F. J., Schnell, R. C., Schrems, O., Selkirk, H., Shiotani, M., Skrivánková, P., Stübi, R., Taha, G., Tarasick, D. W., Thompson, A. M., Thouret, V., Tully, M. B., Van Malderen, R., Vömel, H., von der Gathen, P., Witte, J. C., and Yela, M.: Validation of 10-year SAO OMI Ozone Profile (PROFOZ) product using ozonesonde observations, Atmos. Meas. Tech., 10, 2455–2475, https://doi.org/10.5194/amt-10-2455-2017, 2017.
Hurtmans, D., Coheur, P. F., Wespes, C., Clarisse, L., Scharf, O., Clerbaux, C., Hadji-Lazaro, J., George, M., and Turquety, S.: FORLI radiative transfer and retrieval code for IASI, J. Quant. Spectrosc. Ra., 113, 1391–1408, https://doi.org/10.1016/j.jqsrt.2012.02.036, 2012.
Konopka, P., Grooß, J.-U., Günther, G., Ploeger, F., Pommrich, R., Müller, R., and Livesey, N.: Annual cycle of ozone at and above the tropical tropopause: observations versus simulations with the Chemical Lagrangian Model of the Stratosphere (CLaMS), Atmos. Chem. Phys., 10, 121–132, https://doi.org/10.5194/acp-10-121-2010, 2010.
Krishnamurti, T. N. and Bhalme, H.: Oscillations of a monsoon system. Part I. Observational aspects, J. Atmos. Sci., 33, 1937–1954, https://doi.org/10.1175/1520-0469(1976)033<1937:OOAMSP>2.0.CO;2, 1976.
Krishnamurti, T. N. and Ardanuy, P.: The 10 to 20-day westward propagating mode and “Breaks in the Monsoons”, Tellus, 32, 15–26, https://doi.org/10.3402/tellusa.v32i1.10476, 1980.
Kroon, M., de Haan, J. F., Veefkind, J. P., Froidevaux, L., Wang, R., Kivi, R., and Hakkarainen, J. J.: Validation of operational ozone prodiles from the ozone monitoring instrument, J. Geophys. Res., 116, D18305, https://doi.org/10.1029/2010JD015100, 2011.
Levelt, P. F., van den Oord, G. H. J., Dobber, M. R., Malkki, A., Visser, H., de Vries, J., Stammes, P., Lundell, J. O. V., and Saari, H.: The ozone monitoring instrument, IEEE T. Geosci. Remote., 44, 1093–1101, https://doi.org/10.1109/TGRS.2006.872333, 2006.
Li, Q., Jiang, J. H., Wu, D. L., Read, W. G., Livesey, N. J., Waters, J. W., Zhang, Y., Wang, B., Filipiak, M. J., Davis, C. P., Turquety, S., Wu, S., Park, R. J., Yantosca, R. M., and Jacob, D. L.: Convective outflow of South Asian pollution: A global CTM simulation compared with EOS MLS observations, Geophys. Res. Lett., 32, L14826, https://doi.org/10.1029/2005GL022762, 2005.
Liu, X., Chance, K., Sioris, C., Spurr, R., Kurosu, T., Martin, R., and Newchurch, M.: Ozone profile and tropospheric ozone retrievals from the Global Ozone Monitoring Experiment: Algorithm description and validation, J. Geophys. Res., 110, D20307, https://doi.org/10.1029/2005JD006240, 2005.
Liu, X., Bhartia, P. K., Chance, K., Froidevaux, L., Spurr, R. J. D., and Kurosu, T. P.: Validation of Ozone Monitoring Instrument (OMI) ozone profiles and stratospheric ozone columns with Microwave Limb Sounder (MLS) measurements, Atmos. Chem. Phys., 10, 2539–2549, https://doi.org/10.5194/acp-10-2539-2010, 2010a.
Liu, X., Bhartia, P. K., Chance, K., Spurr, R. J. D., and Kurosu, T. P.: Ozone profile retrievals from the Ozone Monitoring Instrument, Atmos. Chem. Phys., 10, 2521–2537, https://doi.org/10.5194/acp-10-2521-2010, 2010b.
Liu, Y., Hoskins, B., and Blackburn, M.: Impact of Tibetan orography and heating on the summer flow over Asia, J. Meteor. Soc. Jpn. 85, 1–19, https://doi.org/10.2151/jmsj.85B.1, 2007.
Livesey, N. J., Filipiak, M. J., Froidevaux, L., Read,W. G., Lambert, A., Santee, M. L., Jiang, J. H., Pumphrey, H. C., Waters, J. W., Cofield, R. E., Cuddy, D. T., Daffer, W. H., Drouin, B. J., Fuller, R. A., Jarnot, R. F., Jiang, Y. B., Knosp, B. W., Li, Q. B., Perun, V. S., Schwartz, M. J., Snyder, W. V., Stek, P. C., Thurstans, R. P., Wagner, P. A., Avery, M., Browell, E. V., Cammas, J.-P., Christensen, L. E., Diskin, G. S., Gao, R.-S., Jost, H.-J., Loewenstein, M., Lopez, J. D., Nedelec, P., Osterman, G. B., Sachse, G.W., and Webster, C. R.: Validation of Aura Microwave Limb Sounder O3 and CO observations in the upper troposphere and lower stratosphere, J. Geophys. Res., 113, D15S02, https://doi.org/10.1029/2007JD008805, 2008.
Livesey, N. J., Read, W. G., Wagner, P. A., Froidevaux, L., Lambert, A., Manney, G. L., Millán Valle, L. F., Pumphrey, H. C., Santee, M. L., Schwartz, M. J., Wang, S., Fuller, R. A., Jarnot, R. F., Knosp, B. W., and Martinez, E.: Version 4.2 level 2 data quality and description document, available at: https://mls.jpl.nasa.gov/data/v4-2_data_quality_document.pdf (last access: 10 October 2017), 2017.
McPeters, R. D., Labow, G. J., and Logan, J. A.: Ozone climatological profiles for satellite retrieval algorithms, J. Geophys. Res., 112, D05308, https://doi.org/10.1029/2005jd006823, 2007.
National Centers for Environmental Prediction/National Weather Service/NOAA/U.S. Department of Commerce: NCEP FNL operational model global tropospheric analyses continuing from July 1999, Research Data Archive at the National Center for Atmospheric Research, Computational and Information Systems Laboratory, Boulder, Colo., https://doi.org/10.5065/D6M043C6, 2000.
Nützel, M., Dameris, M., and Garny, H.: Movement, drivers and bimodality of the South Asian High, Atmos. Chem. Phys., 16, 14755–14774, https://doi.org/10.5194/acp-16-14755-2016, 2016.
Pan, L. L. and Munchak, L. A.: Relationship of cloud top to the tropopause and jet structure from CALIPSO data, J. Geophys. Res.-Atmos., 116, D12201, https://doi.org/10.1029/2010JD015462, 2011.
Pan, L. L., Honomichl, S. B., Kinnison, D. E., Abalos, M., Randel, W. J., Bergman, J. W., and Bian, J.: Transport of chemical tracers from the boundary layer to stratosphere associated with the dynamics of the Asian summer monsoon, J. Geophys. Res.-Atmos., 121, 14159–14174, https://doi.org/10.1002/2016JD025616, 2016.
Park, M., Randel, W. J., Kinnison, D. E., Garcia, R. R., and Choi, W.: Seasonal variation of methane, water vapor, and nitrogen oxides near the tropopause: Satellite observations and model simulations, J. Geophys. Res., 109, D03302, https://doi.org/10.1029/2003JD003706, 2004.
Park, M., Randel, W. J., Gettelman, A., Massie, S. T., and Jiang, J. H.: Transport above the Asian summer monsoon anticyclone inferred from Aura Microwave Limb Sounder tracers, J. Geophys. Res., 112, D16309, https://doi.org/10.1029/2006JD008294, 2007.
Park, M., Randel, W. J., Emmons, L. K., Bernath, P. F., Walker, K. A., and Boone, C. D.: Chemical isolation in the Asian monsoon anticyclone observed in Atmospheric Chemistry Experiment (ACE-FTS) data, Atmos. Chem. Phys., 8, 757–764, https://doi.org/10.5194/acp-8-757-2008, 2008.
Pittman, J. V., Pan, L. L., Wei, J. C., Irion, F. W., Liu, X., Maddy, E. S., Barnet, C. D., Chance, K., and Gao, R. S.: Evaluation of AIRS, IASI, and OMI ozone profile retrievals in the extratropical tropopause region using in situ aircraft measurements, J. Geophys. Res., 114, 24109, https://doi.org/10.1029/2009JD012493, 2009.
Ploeger, F., Konopka, P., Walker, K., and Riese, M.: Quantifying pollution transport from the Asian monsoon anticyclone into the lower stratosphere, Atmos. Chem. Phys., 17, 7055–7066, https://doi.org/10.5194/acp-17-7055-2017, 2017.
Popovic, J. M. and Plumb, R. A.: Eddy shedding from the upper-tropospheric Asian monsoon anticyclone, J. Atmos. Sci., 58, 93–104, https://doi.org/10.1175/1520-0469(2001)058<0093:esftut>2.0.co;2, 2001.
Randel, W. J. and Park, M.: Deep convective influence on the Asian summer monsoon anticyclone and associated tracer variability observed with Atmospheric Infrared Sounder (AIRS), J. Geophys. Res., 111, D12314, https://doi.org/10.1029/2005JD006490, 2006.
Randel, W. J., Park, M., Emmons, L., Kinnison, D., Bernath, P., Walker, K. A., Boone, C., and Pumphrey, H.: Asian monsoon transport of pollution to the stratosphere, Science, 328, 611–613, https://doi.org/10.1126/science.1182274, 2010.
Safieddine, S., Boynard, A., Hao, N., Huang, F., Wang, L., Ji, D., Barret, B., Ghude, S. D., Coheur, P.-F., Hurtmans, D., and Clerbaux, C.: Tropospheric ozone variability during the East Asian summer monsoon as observed by satellite (IASI), aircraft (MOZAIC) and ground stations, Atmos. Chem. Phys., 16, 10489–10500, https://doi.org/10.5194/acp-16-10489-2016, 2016.
Santee, M. L., Manney, G. L., Livesey, N. J., Schwartz, M. J., Neu, J. L., and Read, W. G.: A comprehensive overview of the climatological composition of the Asian summer monsoon anticyclone based on 10 years of Aura Microwave Limb Sounder measurements, J. Geophys. Res.-Atmos., 122, 5491–5514, https://doi.org/10.1002/2016JD026408, 2017.
Shapiro, M. A.: Turbulent mixing within tropopause folds as a mechanism for the exchange of chemical constituents between the stratosphere and troposphere, J. Atmos. Sci., 37, 994–1004, 1980.
Vernier, J. P., Thomason, L., and Kar, J.: CALIPSO detection of an Asian tropopause aerosol layer, Geophys. Res. Lett., 38, L07804, https://doi.org/10.1029/2010GL046614, 2011.
Vogel, B., Günther, G., Müller, R., Grooß, J.-U., Afchine, A., Bozem, H., Hoor, P., Krämer, M., Müller, S., Riese, M., Rolf, C., Spelten, N., Stiller, G. P., Ungermann, J., and Zahn, A.: Long-range transport pathways of tropospheric source gases originating in Asia into the northern lower stratosphere during the Asian monsoon season 2012, Atmos. Chem. Phys., 16, 15301–15325, https://doi.org/10.5194/acp-16-15301-2016, 2016.
Wang, B.: The Asian monsoon, Springer Science & Business Media, 2006.
Waters, J. W., Froidevaux, L., Harwood, R. S., Jarnot, R. F., Pickett, H. M., Read, W. G., Siegel, P. H., Cofield, R. E., Filipiak, M. J., Flower, D. A., Holden, J. R., Lau, G. K., Livesey, N. J., Manney, G. L., Pumphrey, H. C., Santee, M. L., Wu, D. L., Cuddy, D. T., Lay, R. R., Loo, M. S., Perun, V. S., Schwartz, M. J., Stek, P. C., Thurstans, R. P., Boyles, M. A., Chandra, K. M., Chavez, M. C., Chen, G. S., Chudasama, B. V., Dodge, R., Fuller, R. A., Girard, M. A., Jiang, J. H., Jiang, Y., Knosp, B. W., Labelle, R. C., Lam, J. C., Lee, A. K., Miller, D., Oswald, J. E., Patel, N. C., Pukala, D. M., Quintero, O., Scaff, D. M., Vansnyder, W., Tope, M. C., Wagner, P. A., and Walch, M. J.: The earth observing system microwave limb sounder (EOS MLS) on the Aura satellite, IEEE T. Geosci. Remote., 44, 1075–1092, https://doi.org/10.1109/TGRS.2006.873771, 2006.
Watson, D. F. and Contouring: A Guide to the Analysis and Display of Spatial Data, Pergamon Press, ISBN: 008040286 0, 1992.
Wu, G., He, B., Liu, Y., Bao, Q., and Ren, R.: Location and variation of the summertime upper-troposphere temperature maximum over South Asia, Clim. Dynam., 45, 2757–2774, https://doi.org/10.1007/s00382-015-2506-4, 2015.
Xiao, Y., Jacob, D. J., and Turquety, S.: Atmospheric acetylene and its relationship with CO as an indicator of air mass age, J. Geophys. Res., 112, D12305, https://doi.org/10.1029/2006JD008268, 2007.
Yan, R., Bian, J., and Fan, Q.: The Impact of the South Asia High Bimodality on the Chemical Composition of the Upper Troposphere and Lower Stratosphere, Atmos. Ocean. Sci. Lett., 4, 229–234, 2011.
Yang, K., Liu, X., and Bhartia, P. K.: OMI O3 profile data (OMPROFOZ), available at: https://avdc.gsfc.nasa.gov/index.php?site=1389025893&id=74 (last access: June 2018), 2014.
Zhang, Q., Guoxiong, W., and Yongfu, Q.: The bimodality of the 100 hPa South Asia High and its relationship to the climate anomaly over East Asia in summer, J. Meteorol. Soc. Jpn., 80, 733–744, https://doi.org/10.2151/jmsj.80.733, 2002.
- Abstract
- Introduction
- Data description
- Processing daily maps
- Comparisons of MLS and IASI CO
- Sub-seasonal variability in ASM UT CO from MLS and IASI data
- UTLS O3 analysis using MLS and OMI data
- Conclusions and discussions
- Data availability
- Author contributions
- Competing interests
- Acknowledgements
- References


