the Creative Commons Attribution 4.0 License.
the Creative Commons Attribution 4.0 License.
 | 19 May 2026
Future volcanic eruptions may delay the recovery of lower stratospheric ozone over Antarctica and Southern Hemisphere mid-latitudes
Nathan Luke Abraham
Thomas J. Aubry
Ben Johnson
Hella Garny
Susan Solomon
Anja Schmidt
Sporadic explosive volcanic eruptions can inject large amounts of sulfur into the stratosphere, which forms volcanic sulfate aerosols with the potential to affect stratospheric ozone chemistry. Future volcanic eruptions have been represented in climate projection studies with varying degrees of realism despite their potential importance for polar ozone recovery. Climate projections typically use a constant volcanic forcing based on a historical average, which very likely underestimates the magnitude of future volcanic forcing and ignores the sporadic nature of volcanic eruptions. In this study, we use stochastic volcanic eruption scenarios and a plume-aerosol-chemistry-climate model (UKESM-VPLUME) to assess the effect of future volcanic sulfur injections on lower stratospheric ozone recovery over Antarctica and Southern Hemisphere mid-latitudes. We find that sporadic eruptions can delay Antarctic total column ozone recovery by up to five years, though this delay is relatively small when compared with the long-term ozone recovery timescale. Large-magnitude eruptions occurring before mid-century can, however, episodically cause more substantial delays in the recovery. Based on a composite analysis we show that the ozone response to volcanic sulfate aerosols over Antarctica and Southern Hemisphere mid-latitudes weakens over the 21st century due to declining chlorofluorocarbon concentrations. Overall, our findings underscore the need for fully interactive volcanic aerosol-chemistry coupling to assess the resilience of the Antarctic ozone layer in response to future volcanic eruptions and other stratospheric perturbation events. Our results also support previous calls for sustained monitoring of stratospheric composition and ozone-depleting processes to better anticipate and attribute changes in ozone recovery.
- Article
(6892 KB) - Full-text XML
-
Supplement
(17644 KB) - BibTeX
- EndNote


The stratospheric ozone layer has been slowly recovering since about the year 2000, following the implementation of the Montreal Protocol in 1987 and its subsequent amendments, which limited the production and consumption of ozone-depleting substances (ODSs), including chlorofluorocarbons (CFCs) and bromine-containing halons. These ODSs are sufficiently long-lived to reach the stratosphere where they undergo photolysis, releasing chlorine and bromine atoms that catalytically destroy ozone. According to WMO/UNEP ozone assessments, polar ozone concentrations are projected to return to their 1980 levels by 2066 (range: 2049–2077) in Antarctica and by 2045 (range: 2029–2051) in the Arctic (WMO, 2022). Although the Antarctic ozone layer has shown a robust recovery trend since 2000, as observed and simulated in chemistry-climate models (WMO, 2022), recent years have witnessed large ozone holes related to elevated stratospheric aerosol loading from volcanic eruptions and wildfires (Solomon et al., 2016; Yu et al., 2021; Solomon et al., 2022). For instance, the 2015 Calbuco eruption in Chile, with a stratospheric injection of about 0.4 Tg of sulfur dioxide (SO2), led to a record-large Antarctic ozone hole exceeding 25 million km2 in the same year (Solomon et al., 2016; Ivy et al., 2017; Zhu et al., 2018). Model simulations by Stone et al. (2021) suggest that volcanic sulfate aerosols from the 2015 Calbuco eruption reduced the total column ozone by 1 % to 5 % over the entire Southern Hemisphere (SH) mid-latitudes region (up to 32° S) from August to December. The unpredictability of volcanic eruptions and other stratospheric perturbation events, such as wildfires, continue to complicate assessments of future ozone recovery over Antarctica and SH mid-latitudes (Chipperfield and Bekki, 2024).
Stratospheric volcanic sulfate aerosols provide surfaces facilitating heterogeneous chemical reactions that catalyse the release of reactive chlorine and bromine species from their respective reservoir species (Eqs. 1–3). At present, volcanic eruptions that inject sulfur into the stratosphere result in a net decrease in Antarctic column ozone. This is because volcanic sulfate aerosols enhance ozone loss via the HOx, ClOx, and BrOx catalytic cycles, which dominate over the suppression of ozone loss driven by the NOx cycle (Eq. 4). Observational and modelling studies have provided evidence of the reduction in NOx and enhancement in halogen radicals at mid-latitudes after the 1991 Mt. Pinatubo eruption (Fahey et al., 1993). The ozone response to volcanic sulfate aerosols is greater over Antarctica than other latitudes due to the extreme cold temperatures and the presence of polar stratospheric clouds inside the Antarctic polar vortex. As anthropogenic ODSs continue to decline in this century and assuming no injection of volcanic halogen or unexpected rise in CFC emissions, future volcanic eruptions with the same stratospheric SO2 injection are expected to cause less ozone loss via the ClOx and BrOx cycles. Therefore, future enhancements in stratospheric aerosol loading are anticipated to lead to a net increase in Antarctic column ozone towards the middle or the end of this century (Klobas et al., 2017).
Volcanic eruptions may also inject water vapour and volcanic halogen species into the stratosphere in addition to volcanic SO2 and cause additional chemical ozone loss (Bobrowski et al., 2003; Pyle and Mather, 2009; Evan et al., 2023; Santee et al., 2024). Recent modelling studies demonstrate that the co-injection of volcanic sulfur and halogens into the stratosphere can lead to greater and prolonged ozone depletion compared to sulfur injections only (Klobas et al., 2017; Brenna et al., 2020; Ming et al, 2020; Staunton-Sykes et al., 2021). Large amounts of volcanic water vapour injection, as demonstrated by the 2022 Hunga Tonga-Hunga Ha'apai eruption, can also perturb stratospheric ozone for 4–7 years (Zhu et al., 2022; Fleming et al., 2024; Zhou et al., 2024; Zhuo et al., 2025). While volcanic halogen and water vapor emissions are important for ozone recovery projections, strong stratospheric water vapor and halogen injections are rare and highly variable. Volcanic SO2 is the most commonly emitted species with comprehensive ice-core and satellite emission inventories (Carn et al., 2016; Sigl et al., 2022), whereas volcanic halogen and water vapor injections lack comprehensive records, particularly prior to the satellite era. We therefore focus only on SO2 emissions in this study. Apart from volcanic halogen and water vapour emissions, very short-lived (VSL) chlorine and bromine compounds, which have lifetimes of less than 6 months, are also important sources of stratospheric bromine and chlorine (Sturges et al., 2000; Dorf et al., 2008; Laube et al., 2008; Sala et al., 2014; Wales et al., 2018), which can lead to uncertainties in future ozone changes (Klobas et al., 2017; Villamayor et al., 2023).
Despite the importance of future volcanic sulfate aerosols enhancements for ozone recovery, few studies have investigated the effects of future volcanic eruptions on stratospheric ozone over the polar and mid-latitude regions due to the unpredictability of future eruptions. The first phase of the Chemistry Climate Model Initiative (CCMI-1) included volcanic aerosols in historical simulations from 1850 to 2014 but assumed zero volcanic forcing in future projections from 2015 to 2100 (Dhomse et al., 2018; Eyring et al., 2013). In CCMI-2, the model experiments adopted the Coupled Model Intercomparison Project (CMIP6) protocol, using a prescribed constant volcanic forcing equivalent to the 1850–2014 mean volcanic forcing in future projections from 2015 to 2100 (O'Neill et al., 2016). Naik et al. (2017) adopted a similar approach, prescribing a constant volcanic forcing equivalent to the 1860–1999 mean to examine the volcanic effects on stratospheric ozone recovery. They concluded that stratospheric volcanic sulfate aerosols enhancements in two future RCP scenarios had no impact on the polar ozone return dates (Naik et al., 2017), but their model did not reproduce the chemical perturbations documented by Fahey et al. (1993) following 1991 Mt. Pinatubo. Further, the use of a prescribed and constant volcanic forcing does not represent the sporadic nature of volcanic eruptions. A recent study by Chim et al. (2023), using a stochastic volcanic forcing approach in a model with interactive sulfur chemistry and volcanic aerosols, showed that future volcanic forcing from 2015–2100 is very likely to exceed the 1850–2014 mean prescribed volcanic forcing used in CMIP6, with the median future forcing expected to be about twice that of the 1850–2014 mean. This finding raises questions about the degree to which a higher and sporadic future volcanic forcing would affect Antarctic ozone recovery.
In this study, we employ a plume-aerosol-chemistry-climate model with a stochastic volcanic forcing approach to simulate the effects of future volcanic sulfur injections on Antarctica and SH mid-latitude ozone recovery. Our stochastic future eruption scenarios resemble the statistical distribution of eruption frequency, latitude and sulfur mass in ice cores and satellite records. Based on multiple ozone recovery indicators we evaluate the effects of future volcanic eruptions on stratospheric ozone. Our model using stochastic scenarios indicates that future eruptions lead to delay in Antarctic ozone recovery assessed via changes in total column ozone, ozone mass deficit, and ozone hole area. We also conduct a composite analysis to show that the ozone response to volcanic sulfate aerosols over Antarctica and SH mid-latitudes is expected to decrease over this century. Given the inherent unpredictability of volcanic eruptions, the stochastic volcanic forcing approach offers insights into the uncertainties associated with future volcanic eruptions and their effects on the recovery of the Antarctic ozone layer.
2.1 Model Setup
We use the UKESM simulations from Chim et al. (2023) and briefly summarise their design here. We first generate 1000 stochastic future eruption scenarios from 2015 to 2100 by resampling eruptions recorded in bipolar ice cores and satellite observations over the past 11 500 years (Sigl et al., 2022; Carn, 2021). Our stochastic scenarios statistically resemble the eruption magnitude (in terms of volcanic SO2 mass), eruption frequency, and eruption latitude of past volcanic eruptions. Based on the methodology developed in previous studies (Aubry et al., 2016; Bethke et al., 2017), we resample large-magnitude eruptions (defined as > 3 Tg of SO2 mass injection) using volcanic emission datasets from both ice cores and satellite observations, and small-magnitude eruptions (defined as < 3 Tg of SO2 mass injection) using satellite volcanic emission records only. We do not resample the emissions of volcanic halogen species and water vapour due to the lack of a comprehensive record of such species in the current ice-cores and satellite datasets. Consequently, we consider only the stratospheric volcanic SO2 mass in the resampling method.
We consider four scenarios as input for our future climate simulations: the low-end scenario (VOLC2.5, with 0.64 Tg of SO2 yr−1), the two median scenarios (VOLC50-1 and VOLC50-2, with 1.44 Tg of SO2 yr−1) and the high-end scenario (VOLC98, with 5.23 Tg of SO2 yr−1), each correspond to a scenario sampled near to the 2.5th, 50th, and 97.5th percentiles, respectively, of the ranked total sulfur mass of the 1000 stochastic scenarios. We perform simulations of the two median scenarios with small-magnitude eruptions only (VOLC50-1s and VOLC50-2s, with 0.64 and 0.57 Tg of SO2 yr−1) to evaluate the effects of small-magnitude eruptions. The results of the VOLC runs are compared against control simulations with constant volcanic forcing as in CMIP6 ScenarioMIP (CONST, with 0.77 to 0.86 Tg of SO2 yr−1 according to current volcanic emission records) and without explosive volcanic emissions (NOVOLC). All runs used the SSP3-7.0 scenario for anthropogenic forcings with simulation years between 2015 and 2100, with three ensemble members each. Figure 1 shows the stratospheric sulfur burden globally, over the Antarctic, and SH mid-latitudes for the four selected stochastic scenarios (VOLC2.5, VOLC50-1, VOLC50-2, VOLC98).
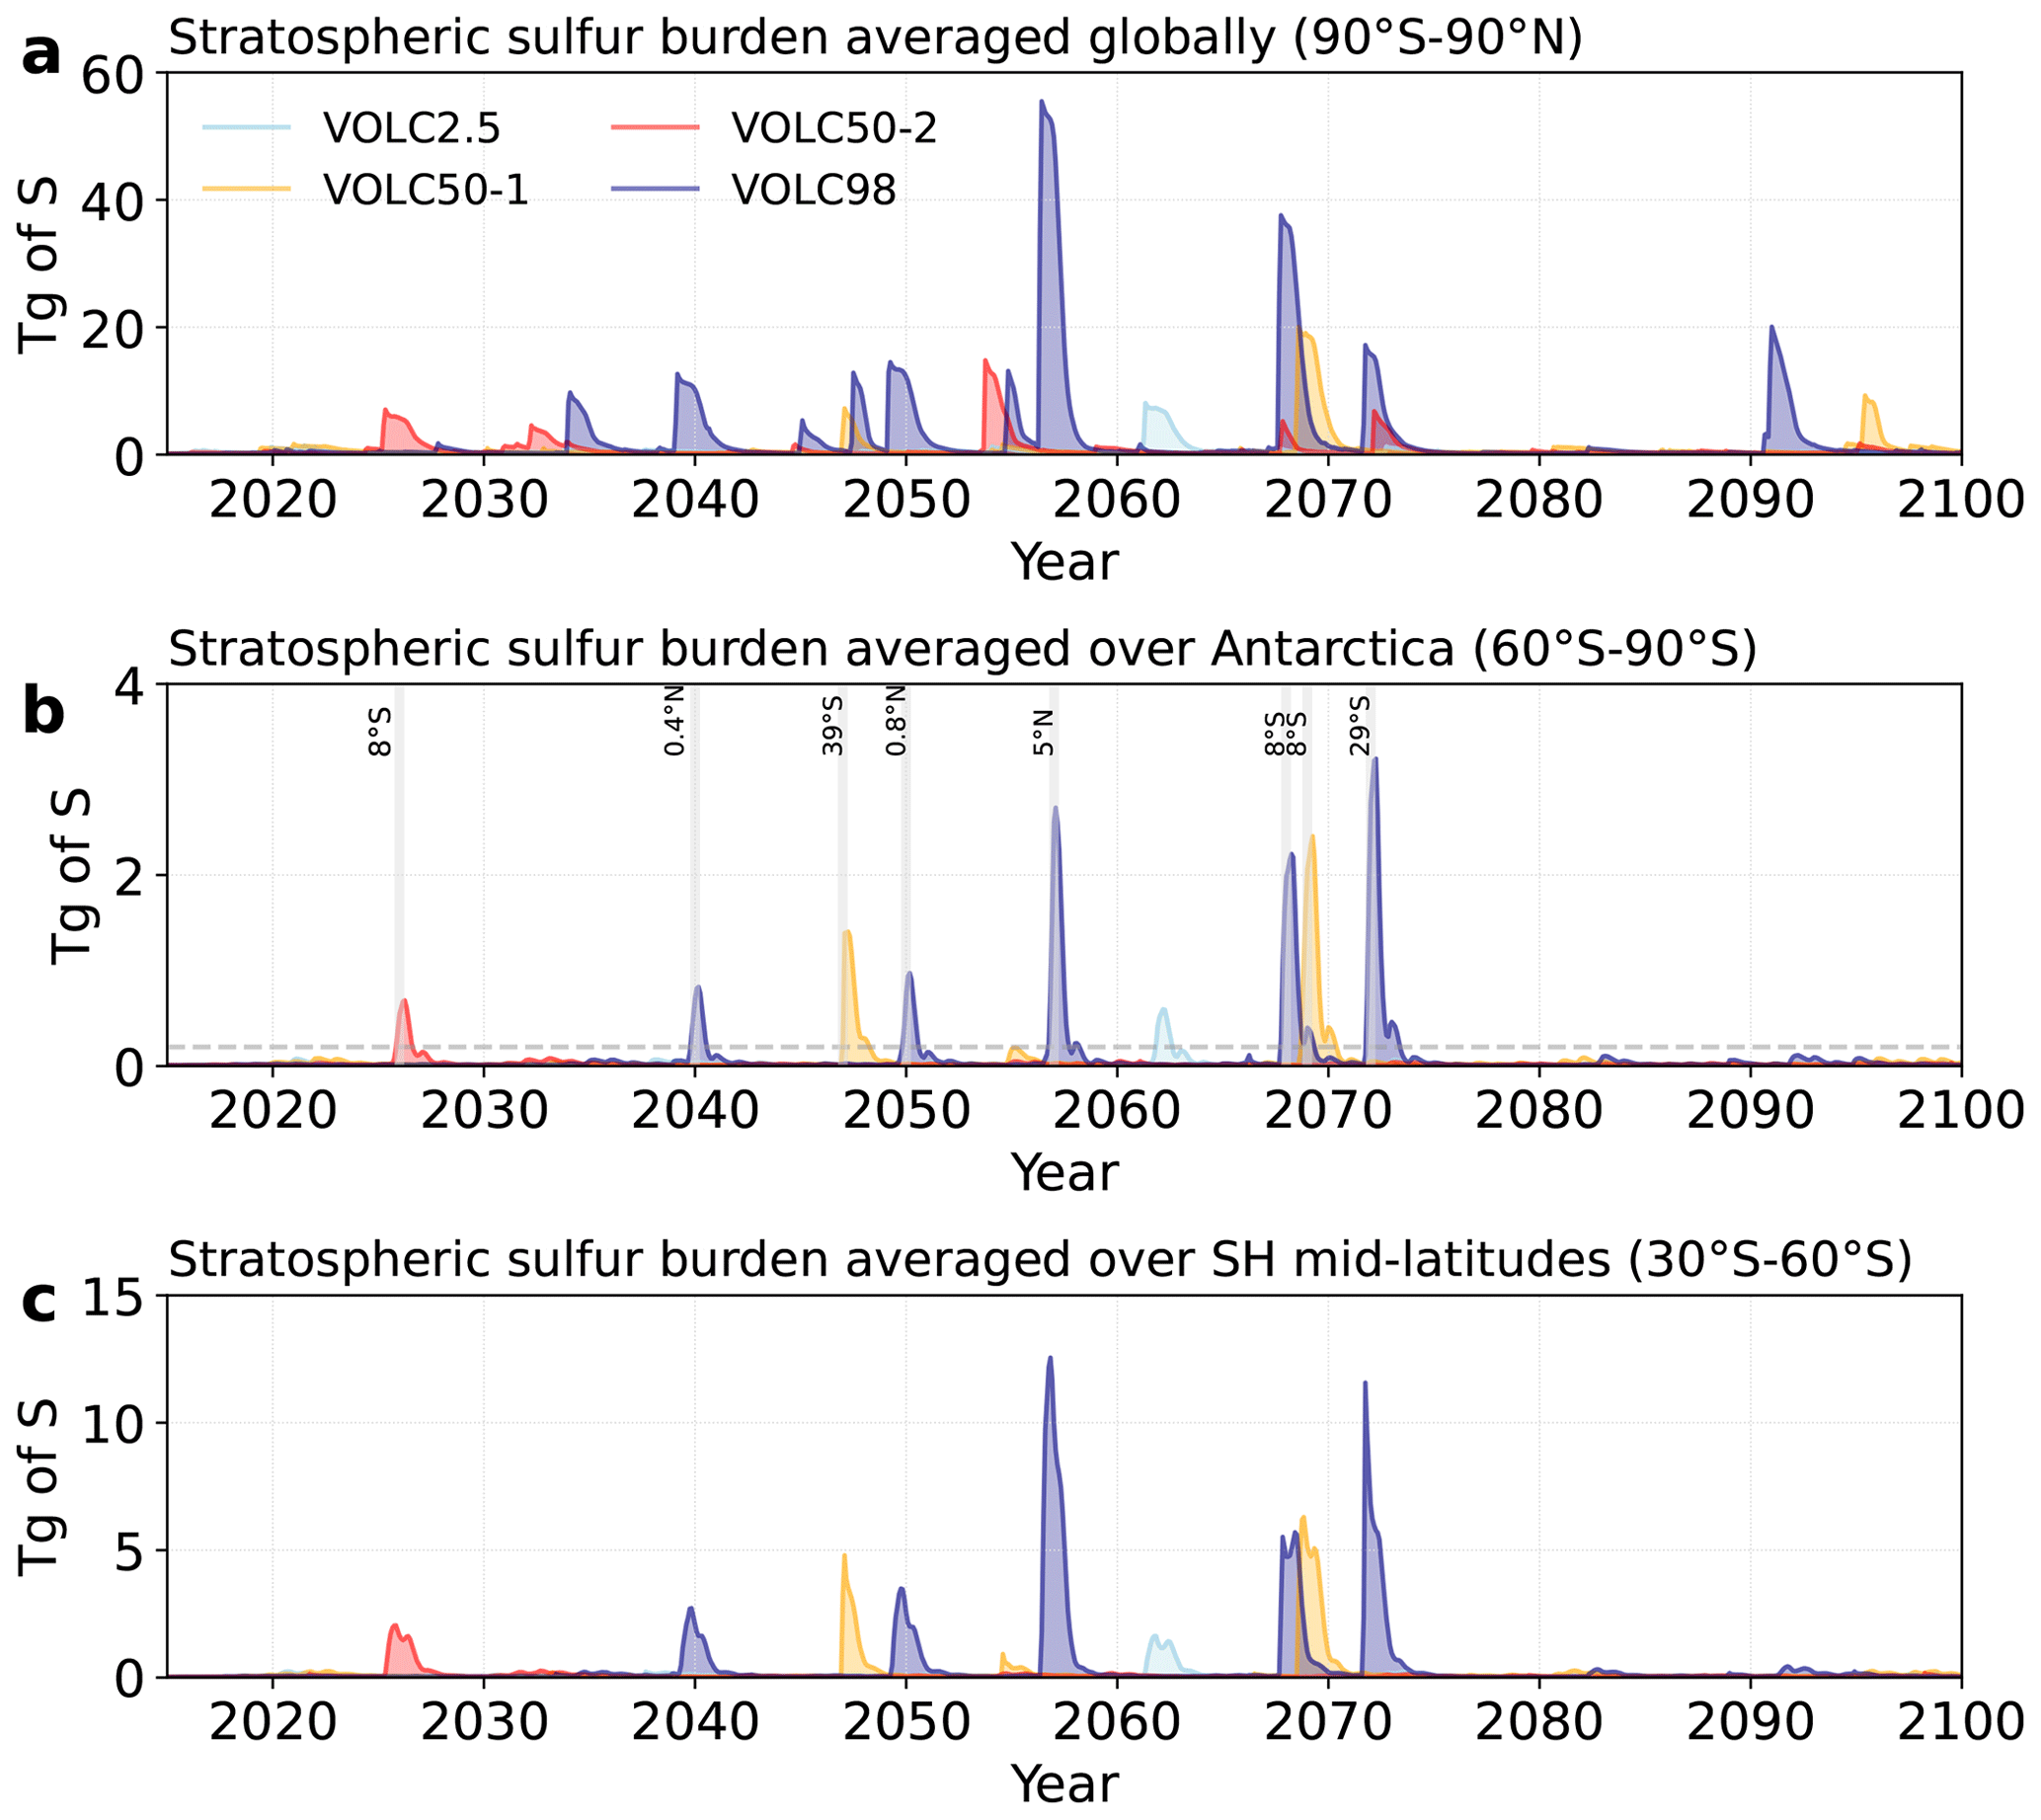
Figure 1Stratospheric sulfur burden (in Tg of S) averaged (a) globally, (b) over Antarctica, and (c) over SH mid-latitudes from 2015 to 2100 for the four stochastic scenarios. The dotted line in panel (b) shows the stratospheric sulfur burden threshold of 0.2 Tg of S, which is used to select eruptions for composite analysis. The injection latitudes of the selected eruptions are shown in panel (b).
We employ the UKESM-VPLUME framework, which integrates the fully-coupled UK Earth System Model version 1.1 that includes ocean-atmosphere interactions (UKESM1.1; Mulcahy et al., 2023) with a one-dimensional eruptive plume model (Plumeria; Mastin, 2007, 2014). This framework allows for interactive stratospheric sulfur chemistry and volcanic sulfate aerosols with plume injection heights consistent with background climate conditions, enabling the simulation of stratospheric aerosol life cycle consistent with simulated future climate conditions. We evaluate the performance of UKESM1.1 in assessing polar ozone concentrations by comparing the UKESM historical simulations with satellite observations (see Sect. 3.1). To evaluate the volcanic-induced ozone response in UKESM1.1, we perform a five-member ensemble of UKESM1.1 historical simulations from 1991 to 1993 to assess the model-simulated ozone response after the 1991 Mt. Pinatubo eruption. We inject 10 Tg of SO2 across 13 latitude bands between 0 and 15° N to allow the aerosols to be distributed in both hemispheres. This injection approach is consistent with previous modelling studies using UM-UKCA and CESM (Dhomse et al., 2014; Mills et al., 2016). We also perform a five-member ensemble without volcanic emissions as the control simulations.
We perform future climate simulations under a high-end future shared socio-economic pathway (SSP3-7.0) from 2015 to 2100, with three ensemble members for each stochastic scenario. The emission projections in our simulations follow the ScenarioMIP experiment under SSP3-7.0, which do not include the emission of VSL chlorine and bromine compounds.
2.2 Ozone recovery indicators
We assess the effects of future eruptions on Antarctic ozone recovery by evaluating three ozone recovery indicators over the Antarctica (60 to 90° S) and SH mid-latitudes (30 to 60° S), including (1) total column ozone, (2) ozone mass deficit, and (3) ozone hole area. Total column ozone and ozone mass deficit have been used as ozone recovery indicators in previous studies to assess the recovery trend of ozone in the historical and future periods (Dhomse et al., 2018; De Laat et al., 2012; Stone et al., 2021). We assess the impact of volcanic forcing on Antarctic ozone return dates by comparing results of the VOLC runs versus the NOVOLC control run.
Total column ozone quantifies the ozone mass within the entire atmospheric column, measured in Dobson units (DU). The total column ozone recovery back to historical baseline (i.e., 1980 conditions) is a metric used by the UNEP/WMO Ozone Assessment Report (WMO, 2022). We use the 1978–1982 mean October total column ozone over Antarctica from UKESM1.1 historical simulations (hereafter referred to as “1980 baseline”) to evaluate the return year of total column ozone concentrations relative to pre-industrial levels. We define the return year of the total ozone column as the last year of having an October mean total column ozone averaged over Antarctica that is lower than the 1980 baseline total column ozone value. We then assess the delay in total column ozone recovery by comparing the return dates of VOLC runs with the control simulation NOVOLC.
Ozone mass deficit represents the deviation of the observed or model-simulated ozone mass from a reference value of the total ozone column over Antarctica. The value of 220 DU serves as a reference point frequently used to identify the depletion of Antarctic stratospheric ozone, as values less than 220 DU were not observed before 1979. In this study, we define two metrics for ozone mass deficit, one with a reference value of 220 DU and the second with a reference value of 175 DU. We define the return year of ozone mass deficit as the last year of having an October mean ozone mass deficit averaged over Antarctica that is lower than the 220 and 175 DU thresholds.
To quantify the uncertainty in return dates arising from interannual variability, we apply a Monte Carlo analysis to the ensemble mean of the October total column ozone and ozone mass deficit time series. Each series is first decomposed into a smoothed long-term trend and residuals. We then generate 1000 realizations by resampling the residual variability and superimposing it on the trend. This approach yields a probabilistic distribution of return dates for crossing a specified ozone threshold, from which we report the median return year as well as the 5th to 95th percentile range.
Ozone hole area represents the spatial extent over the Antarctic where the total ozone column falls below a reference value. To define the presence or absence of an ozone hole in any given year, we use thresholds of total column ozone less than 220, 175 and 150 DU, respectively. We assess recovery trends of the October Antarctic ozone hole area by performing linear regression to evaluate the return dates, and compare against the control simulation NOVOLC.
2.3 Composite analysis of ozone chemical loss
We evaluate the chemical loss of Antarctic ozone using the stratospheric diagnostics developed by Lee et al. (2002). This method estimates the rate of odd oxygen destruction for each catalytic cycle by determining the reaction rates of the rate-limiting steps. Under the assumption that [Ox] ≈ [O3], the rate of odd oxygen loss is approximately equal to the rate of ozone loss for each catalytic cycle. We calculate the cumulative stratospheric ozone loss over Antarctica for the halogen cycles (i.e., the sum of ClOx and BrOx cycles), NOx cycle, and HOx cycle by integrating the monthly-mean ozone loss rate over time (from October to March) and altitude (up to 25 km). We calculate the cumulative stratospheric ozone loss over SH mid-latitudes by integrating the monthly-mean ozone loss rate up to 25 km for 12 months since the eruption month.
To evaluate the volcanic-induced ozone loss via catalytic cycles, we perform a composite analysis of the cumulative stratospheric ozone loss for selected eruptions. We identify 9 large-magnitude eruptions with stratospheric sulfur burden peaks greater than 0.2 Tg of S over the Antarctic (Fig. 1b) for performing composite analysis to evaluate the chemical changes via each catalytic cycle.
To assess the volcanic effects on Antarctic stratospheric ozone, we evaluate the relative differences in the chemical loss between the VOLC and NOVOLC runs. We calculate the cumulative stratospheric ozone loss anomaly relative to the control run (NOVOLC) for each catalytic cycle over Antarctica and SH mid-latitudes, using a 2-year window prior to the eruption as reference to compare with the 5-year post-eruption period. The peak ozone response (i.e., at year 0 since the eruption) for each selected eruption is normalised with the respective total sulfur mass and plotted against the eruption year for comparison.
3.1 Model Evaluation
We assess the performance of UKESM in simulating ozone concentrations by comparing the total column ozone simulated by UKESM1.1 during the historical period (1850–2014) with satellite observations (Fig. 2). UKESM1.1 is the latest version of UKESM, incorporating several improvements compared to the previous model version, which reduced the cold bias in the historical global mean surface temperature by 50 % (Mulcahy et al., 2023).
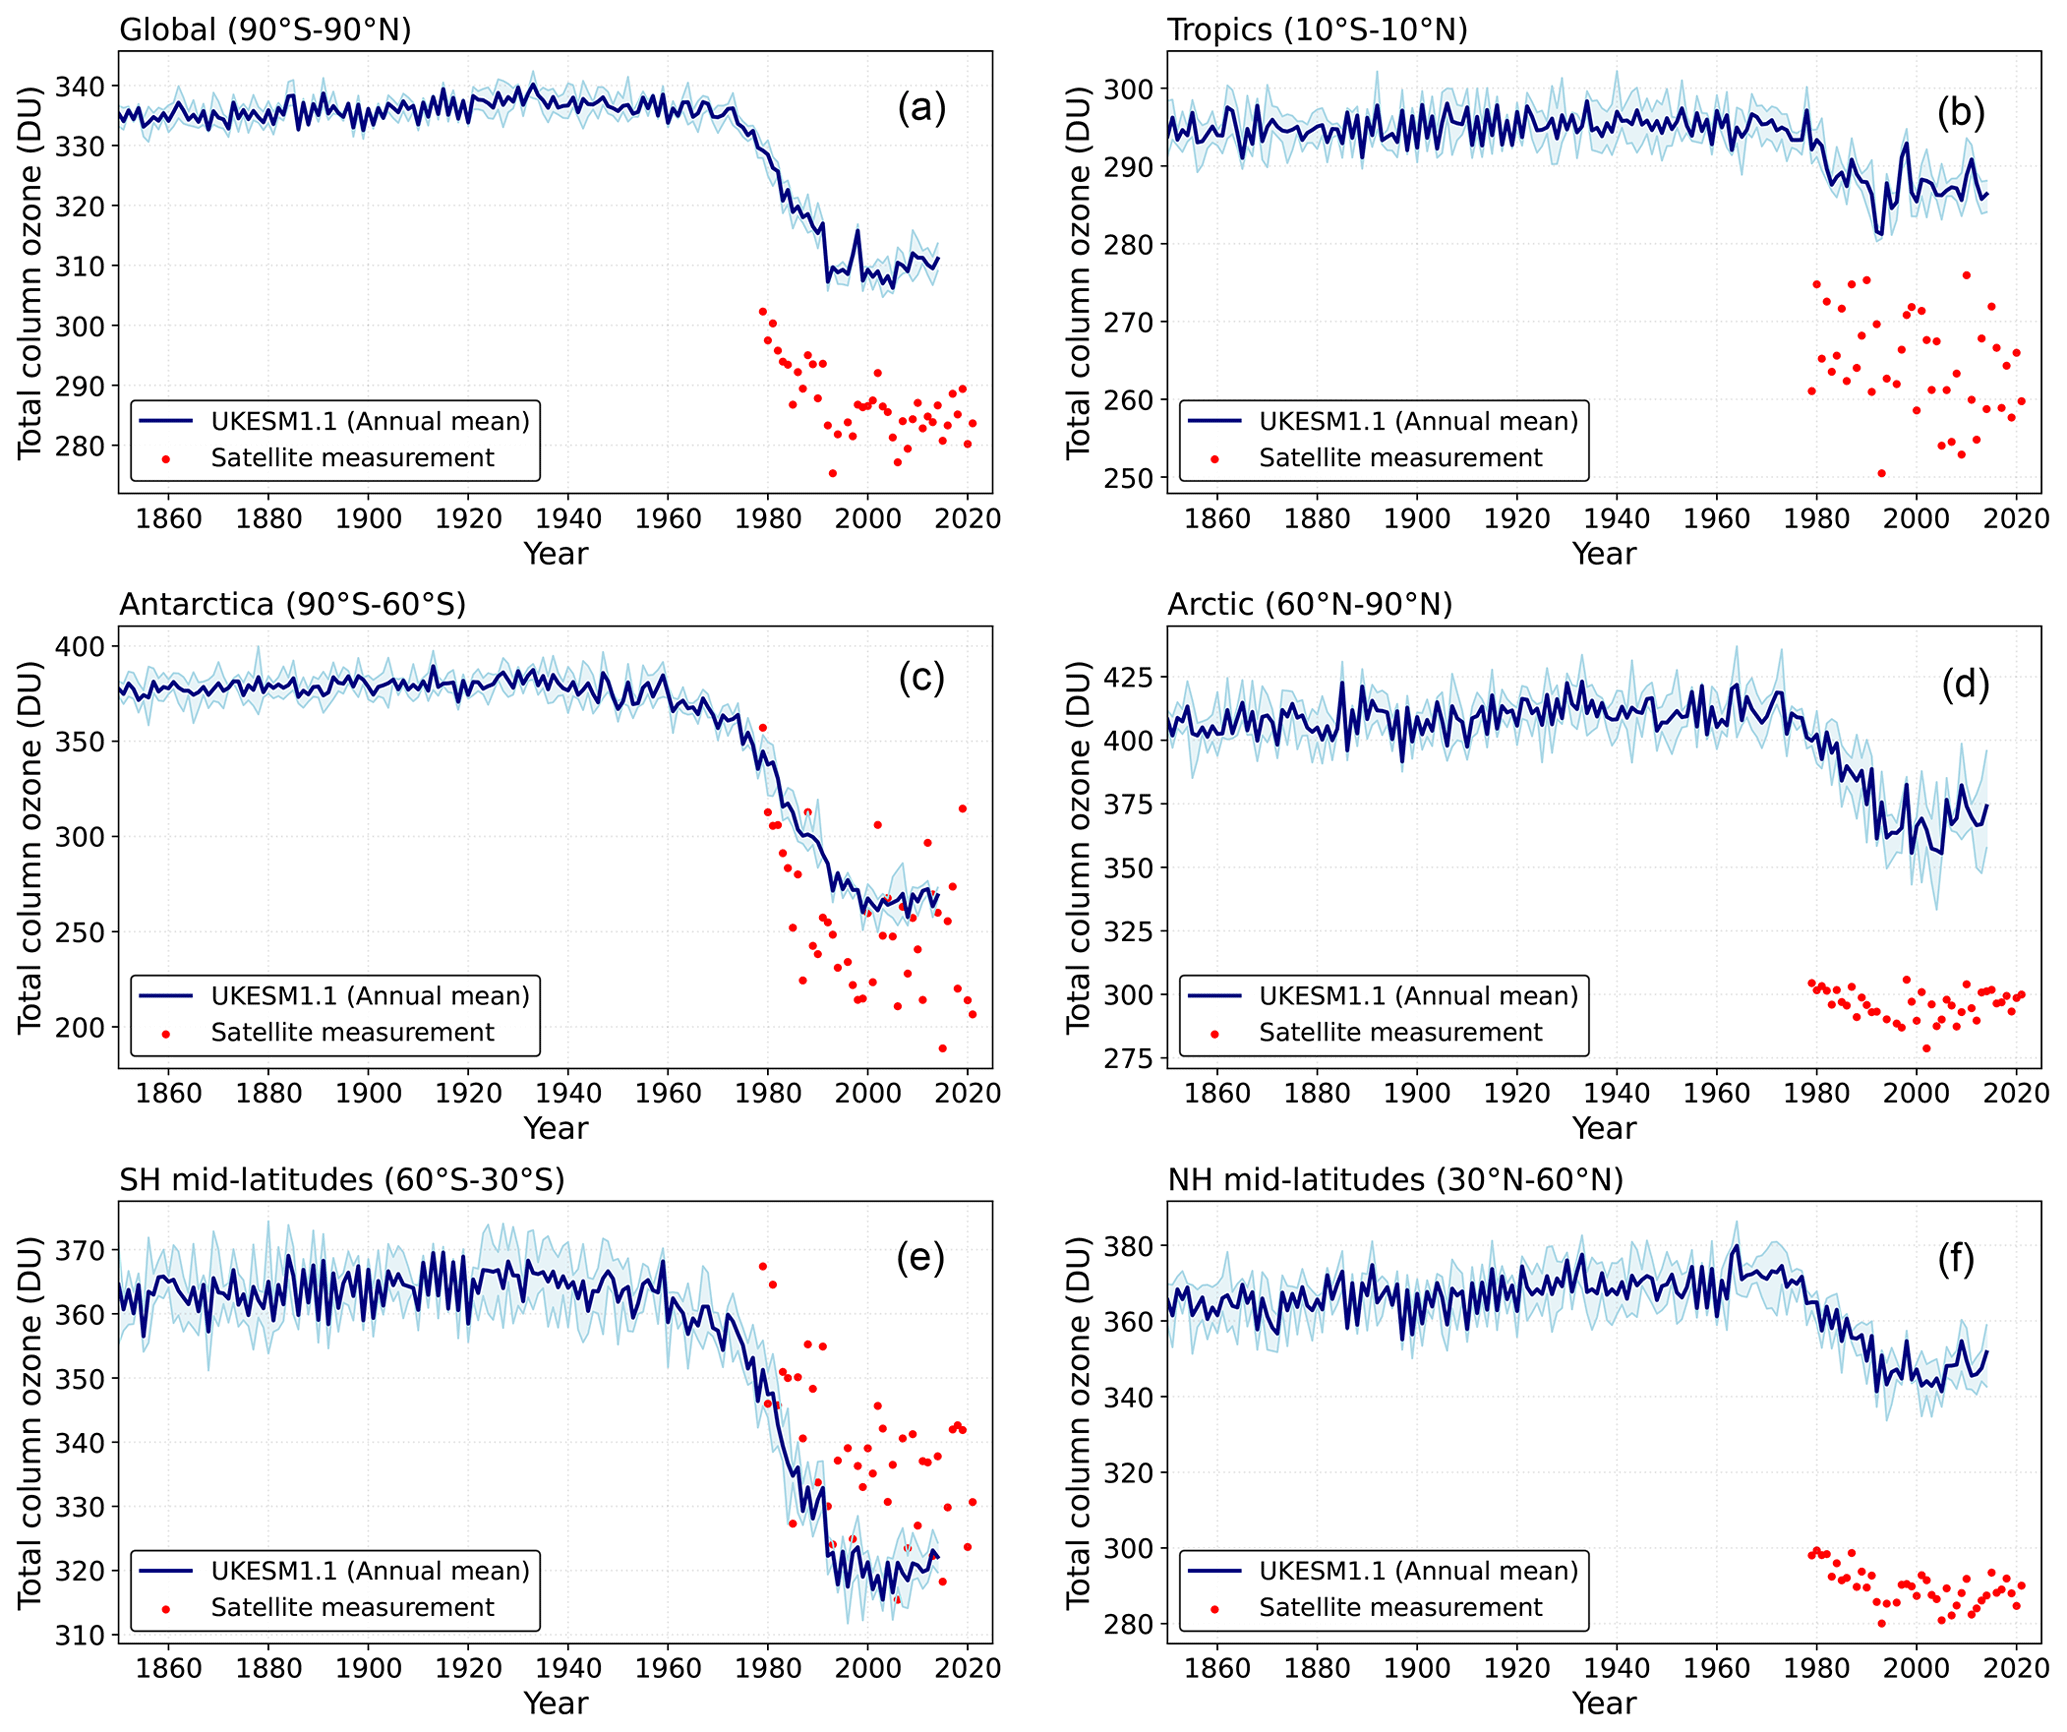
Figure 2Annual mean total column ozone (in DU) averaged (a) globally (90° S to 90° N), over the (b) tropics (20° S to 20° N), (c) Antarctica (60 to 90° S), (d) Arctic (60 to 90° N), (e) SH mid-latitudes (30 to 60° S), and (f) NH mid-latitudes (30 to 60° N). The blue lines represent the UKESM historical simulations from 1850 to 2014, and the red markers represent satellite measurements from 1978 to 2023. The blue shading shows the maximum and minimum values of the ensemble members.
Figure 2 shows the total column ozone over different latitude bands simulated by UKESM1.1 with prescribed volcanic forcing in the historical period from 1850 to 2014, along with satellite measurements from 1978 to 2023 obtained from the NASA Ozone Watch (NASA Ozone Watch, 2024). UKESM1.1 tends to overestimate the global, tropical and NH mid- and high-latitudes total column ozone as compared to satellite measurements. The total column ozone over SH mid-latitudes and Antarctica shows good correspondence with satellite measurements. Nonetheless, UKESM has a high bias (+20 %) in stratospheric ozone compared to other CMIP6 models (Keeble et al., 2021), which stems from the bias over the tropics and Northern Hemisphere (NH). Figure S1 in the Supplement shows the comparison of the zonal mean ozone mass mixing ratio averaged from 2000 to 2014 for UKESM1.1, ML-TOMCAT merged 4-D ozone dataset (Dhomse et al., 2021; Dhomse and Chipperfield, 2023), and the CMIP6 multi-model mean (Keeble et al., 2021). We find that the zonal mean ozone distribution in UKESM1.1 in general agrees well with the ML-TOMCAT dataset. UKESM1.1 simulates higher ozone mass mixing ratio over the tropics and extratropical regions, lower ozone over Antarctic stratosphere from 1–10 hPa, and higher ozone in the Antarctic lower stratosphere between 10 and 30 hPa compared to both ML-TOMCAT and the CMIP6 multi-model mean (Fig. S1d and e). This suggests that UKESM1.1 may overestimate lower stratospheric (10–30 hPa) ozone concentration over Antarctica relative to other CMIP6 models and ML-TOMCAT. UKESM1.1 also simulates higher total column ozone between 30° S and 60° N, and a deeper, more persistent Antarctic ozone hole compared to the CMIP6 multi-model mean (Fig. S2).
To assess the ozone response after volcanic eruptions in UKESM1.1, we performed a five-member ensemble of UKESM1.1 historical simulations for a case study of the 1991 Mt. Pinatubo eruption. We compared the UKESM1.1 model-simulated stratospheric aerosol optical depth (SAOD) and total column ozone with the Global Space-based Stratospheric Aerosol Climatology (GloSSAC) v2.2 dataset (Kovilakam et al., 2020) and the National Institute of Water and Atmospheric Research – Bodeker Scientific (NIWA-BS) filled total column ozone dataset v3.5.2 (Bodeker and Kremser, 2021) to evaluate the model performance (Fig. 3). Our results show that UKESM1.1 simulates a higher SAOD over the tropics and NH (Fig. 3a and b), and the peak global mean SAOD value is 22 % higher than that of GloSSAC (Fig. 3c). The ensemble-mean of the UKESM1.1-simulated total column ozone is able to capture total column ozone loss over Antarctic summer in 1991 and 1992, with a magnitude comparable to NIWA-BS total column ozone loss (Fig. 3d to f). Although our simulations capture the magnitude of the Antarctic total column ozone response, the timing of ozone loss in 1991 does not match NIWA-BS. This discrepancy likely reflects differences between our free-running ensemble climatology and the 1991 atmospheric conditions, as our Pinatubo simulations are not nudged to observations. However, UKESM1.1 simulates a prolonged Antarctic total column ozone loss until spring when compared to NIWA-BS dataset (Fig. 3f).
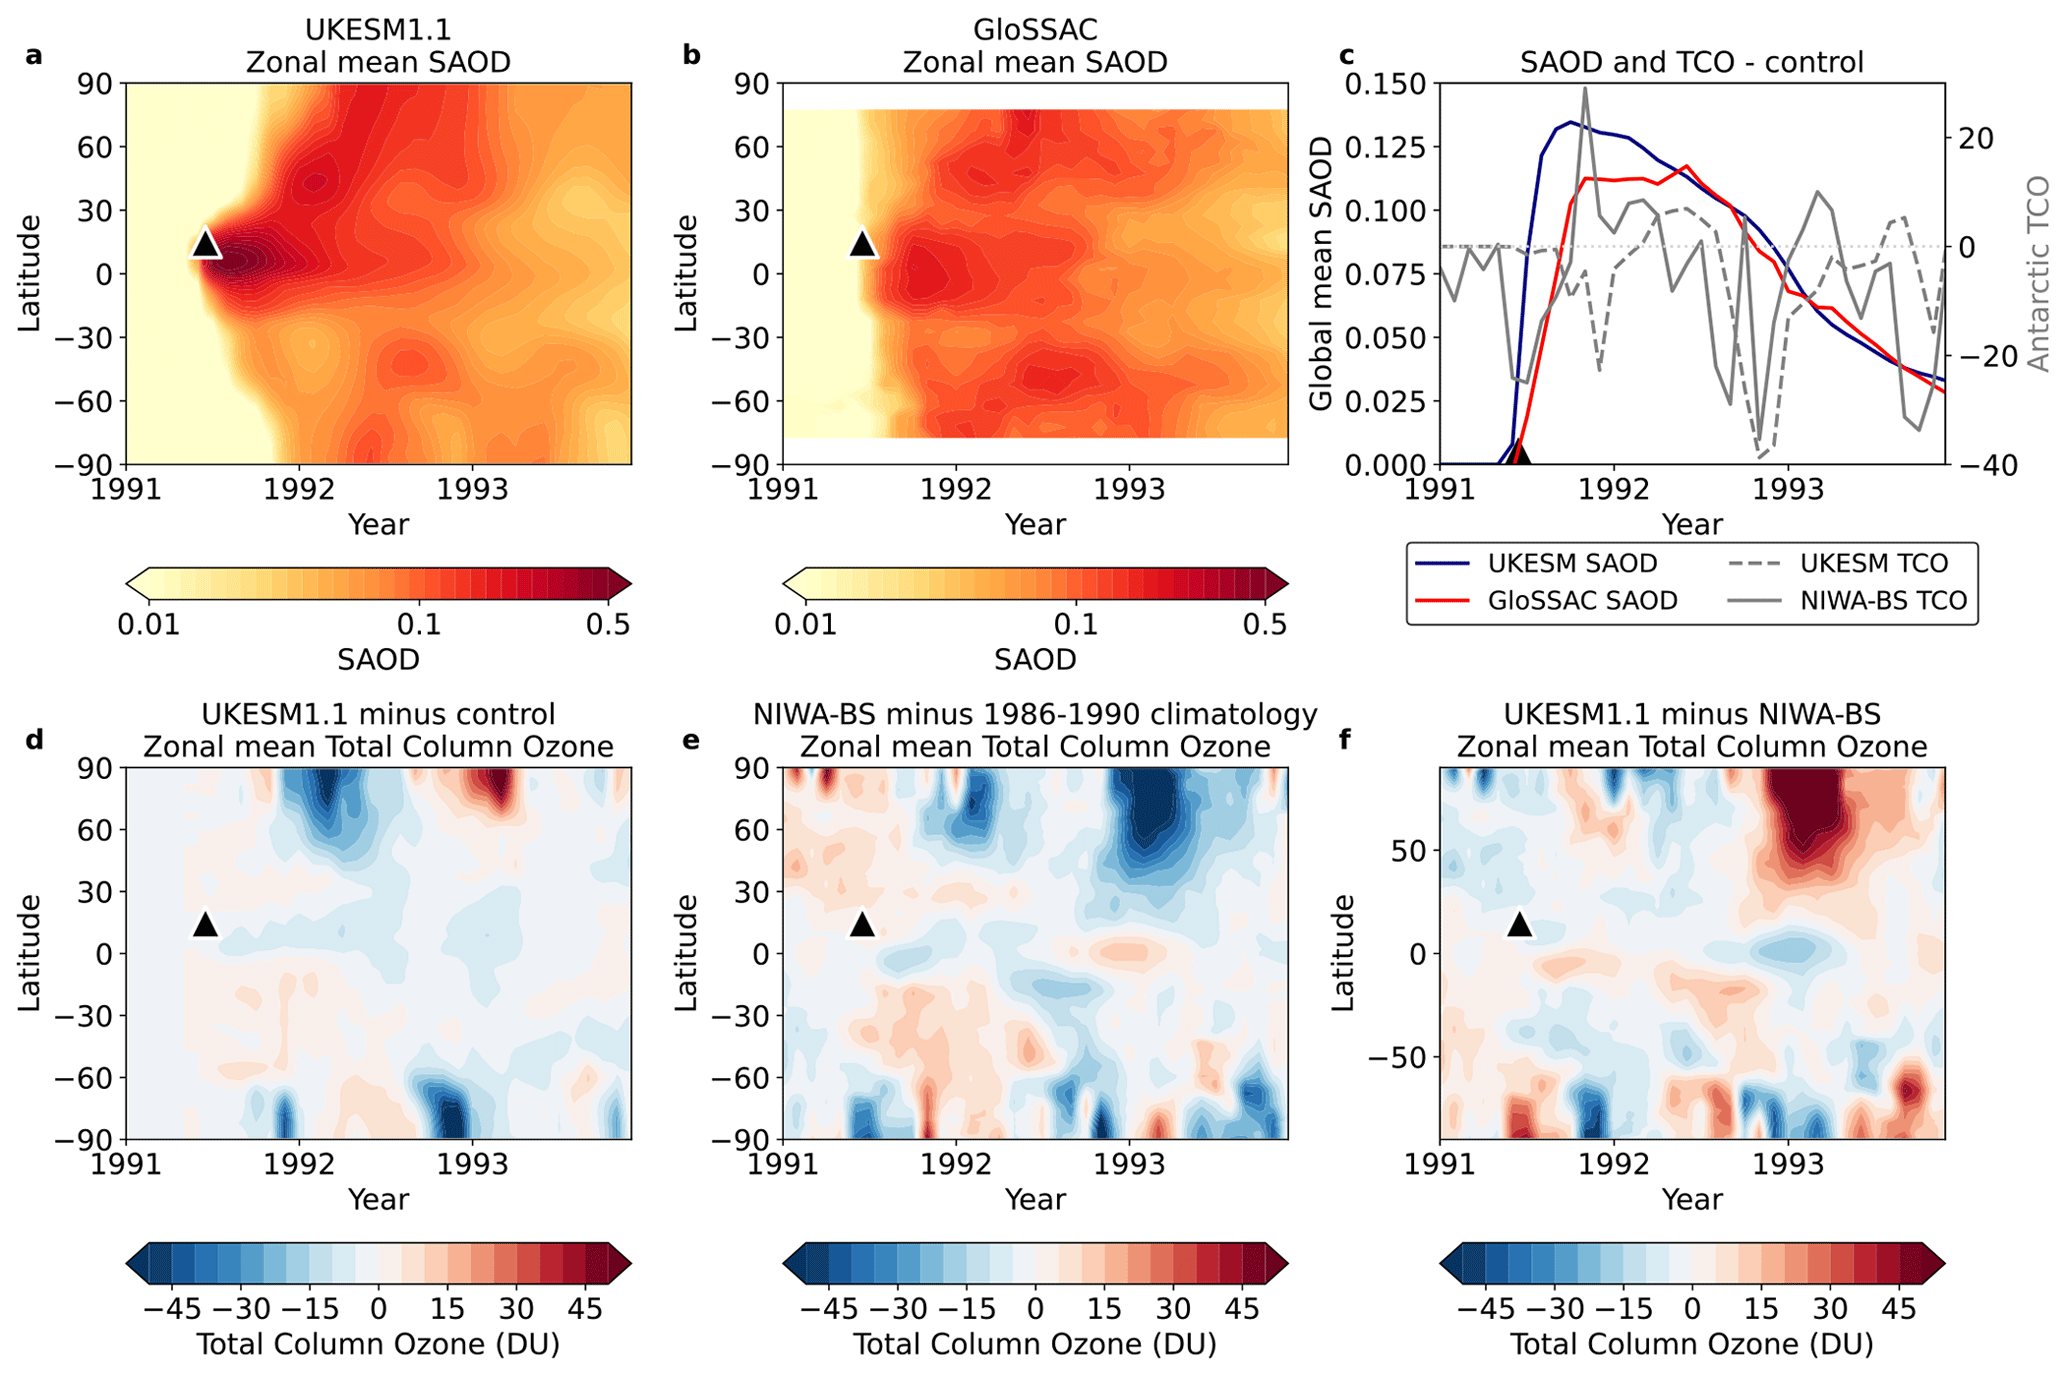
Figure 3Stratospheric aerosol optical depth (SAOD) and total column ozone responses following the 1991 Mt. Pinatubo eruption. (a, b) Zonal monthly mean SAOD from the UKESM1.1 simulation and GloSSAC. (c) Time series of global monthly mean SAOD anomalies (UKESM1.1 relative to control and GloSSAC relative to 1986–1990 climatological mean) and Antarctic monthly mean total column ozone anomalies (UKESM1.1 relative to control and NIWA-BS relative to 1986–1990 climatological mean). (d, e) Zonal monthly mean total column ozone anomalies from UKESM1.1 (relative to control) and NIWA-BS (relative to 1986–1990 climatological mean). (f) Difference in total column ozone anomalies between UKESM1.1 and NIWA-BS (d–e).
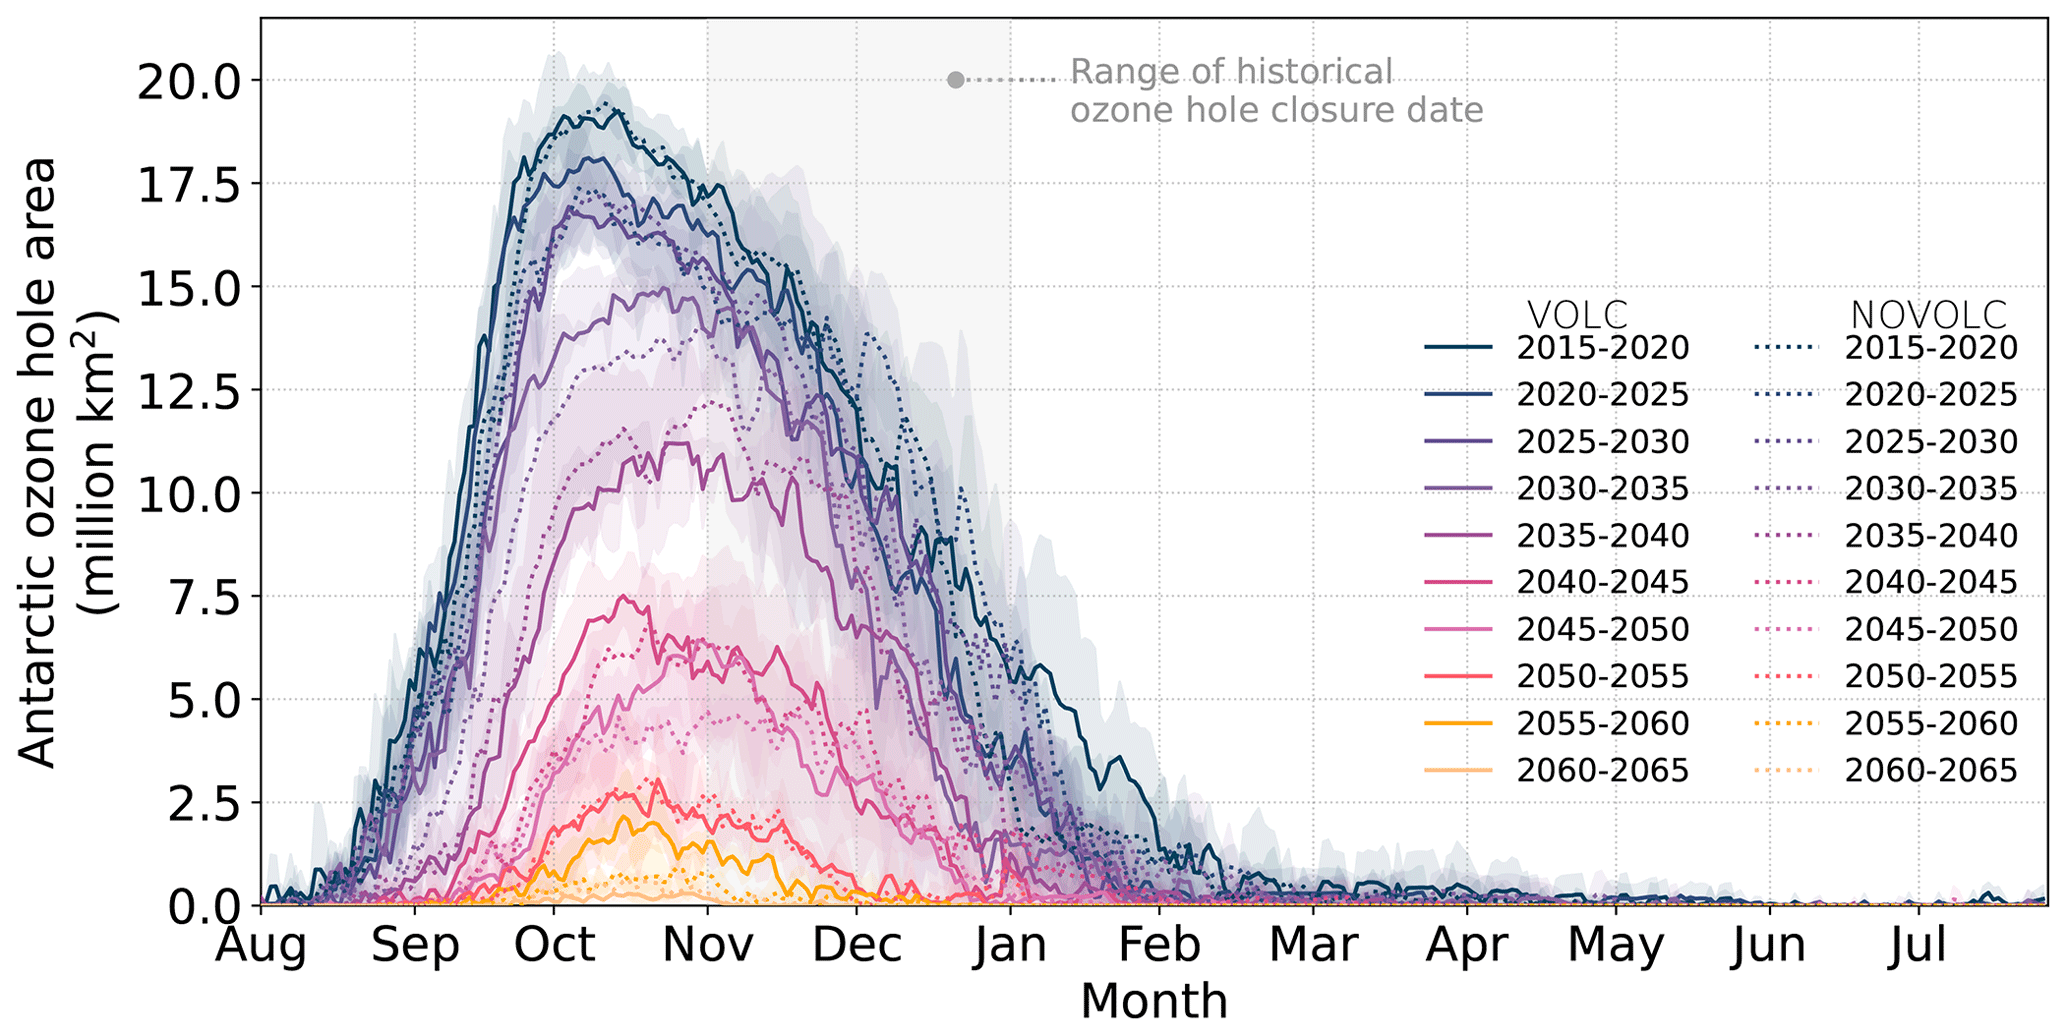
Figure 4Daily size of the ozone hole area (5-year averaged) over Antarctica (60 to 90° S, in million km2) for VOLC50-1 (solid lines) and NOVOLC (dotted lines). The colour shading shows the range of the maximum and minimum UKESM ensemble members. The grey shading shows the range of historical ozone hole (defined as area < 220 DU) closure date from satellite observations over 1979–2022 (Copernicus Atmosphere Monitoring Service (CAMS), 2023).
Figure 4 presents our model-simulated daily size of the Antarctic ozone hole averaged over a 5-year period from 2015 to 2065 for one of our stochastic scenarios (VOLC50-1). Satellite observations from 1979 to 2022 suggest that the closure date of the Antarctic ozone hole typically occurs between mid-November and late December (Copernicus Atmosphere Monitoring Service (CAMS), 2023). However, the timing of the Antarctic ozone hole in our model results deviate significantly from historical observations. Our model simulations show a considerably prolonged duration of the Antarctic ozone hole extending well into February during the earlier decades of this century (Fig. 4). This discrepancy is attributed to the stratospheric cold bias of UKESM over Antarctica, which is associated with a strong polar night jet and the strong downdraught of mesosphere air during polar winter (Sellar et al., 2019), resulting in a stronger and more persistent polar vortex over Antarctica.
Despite these limitations, we show that UKESM reproduces reasonably well the historical evolution of the Antarctic total column ozone (see Fig. 2c), when the ozone hole is at its deepest. This provides confidence in the model's ability to assess Antarctic ozone recovery by assessing the October-mean values of the ozone recovery indicators. The magnitude of Antarctic total column ozone response in our Pinatubo simulations also show a good agreement with observational datasets, suggesting that our estimates of relative impacts across different volcanic scenarios are robust. Since the stratospheric cold bias and strong winter polar vortex in UKESM (Sellar et al., 2019; Hall et al., 2021) likely hinder the transport of volcanic aerosols into the Antarctic stratosphere, we assess the ozone responses over both Antarctica and SH mid-latitudes.
3.2 Volcanic effects on Antarctic ozone recovery indicators
We use three ozone recovery indicators to assess the volcanic effects on Antarctic ozone return years, as summarised in Table 1. We find that the return year of ozone mass deficit to 220 DU threshold is delayed by 0 to 2 years for the low-end and median future scenarios (VOLC2.5 and VOLC50, Table 1), and 5 years for a high-end future eruption scenario (VOLC98, Table 1). Although some stochastic scenarios indicate a later median return year, the overlap in uncertainty ranges suggests that the delay is not distinguishable from internal variability (Table 1). On the other hand, the return year of ozone mass deficit to the 175 DU threshold ranges between 0 to 5 years across the stochastic scenarios.
Table 1Return years of the ozone recovery indicators for Antarctic October-mean values, including total column ozone (median return year relative to the model 1980 baseline), the Antarctic October-mean ozone mass deficit (median return year relative to the 220 and 175 DU thresholds), and the Antarctic October-mean ozone hole area (220 DU threshold). Numbers in brackets indicate the 5th to 95th percentile uncertainty range from the Monte Carlo uncertainty analysis. For the ozone hole area recovery trend, the uncertainty range corresponds to the spread across the three ensemble members.
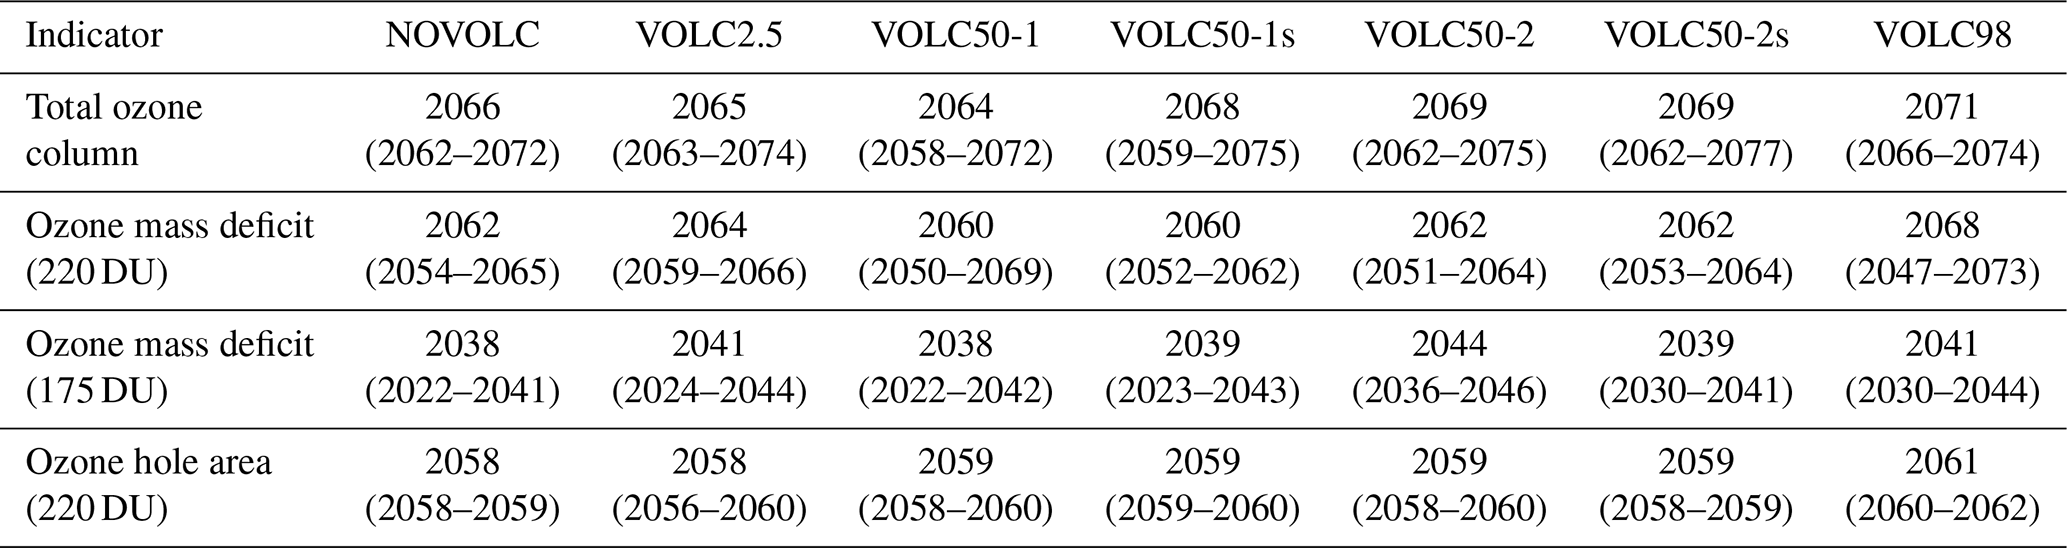
Figure 5a and b shows the October-mean ozone mass deficit over Antarctica with 220 and 175 DU thresholds respectively, shown as 30- and 3-year moving means. The 3-year moving mean reveals substantial interannual variability in ozone mass deficit across scenarios, driven by individual eruptions and internal variability. When smoothed with a 30-year moving mean to show longer-term trends, all stochastic scenarios consistently exhibit higher ozone mass deficit compared to NOVOLC prior to their respective return years (Fig. 5a and b). The relative contribution of volcanic effects to ozone mass deficit in year 2030 ranges between 5.7 % to 8.7 % (0.7 to 1.0 million t) using a 220 DU threshold, and 8.9 % to 23.0 % (0.2 to 0.5 million t) using a 175 DU threshold across the stochastic scenarios (Fig. 5a and b). The median return years for ozone mass deficit with a 220 DU threshold are the same for the VOLC50 scenarios and their respective runs with small-magnitude eruptions only (VOLC50-1s and VOLC50-2s). For the 175 DU threshold, VOLC50-2s shows an earlier return by 5 years for both the median and 5th to 95th percentile ranges as compared to VOLC50-2, while VOLC-501s shows a 1-year delay in return year as compared to VOLC50-1.
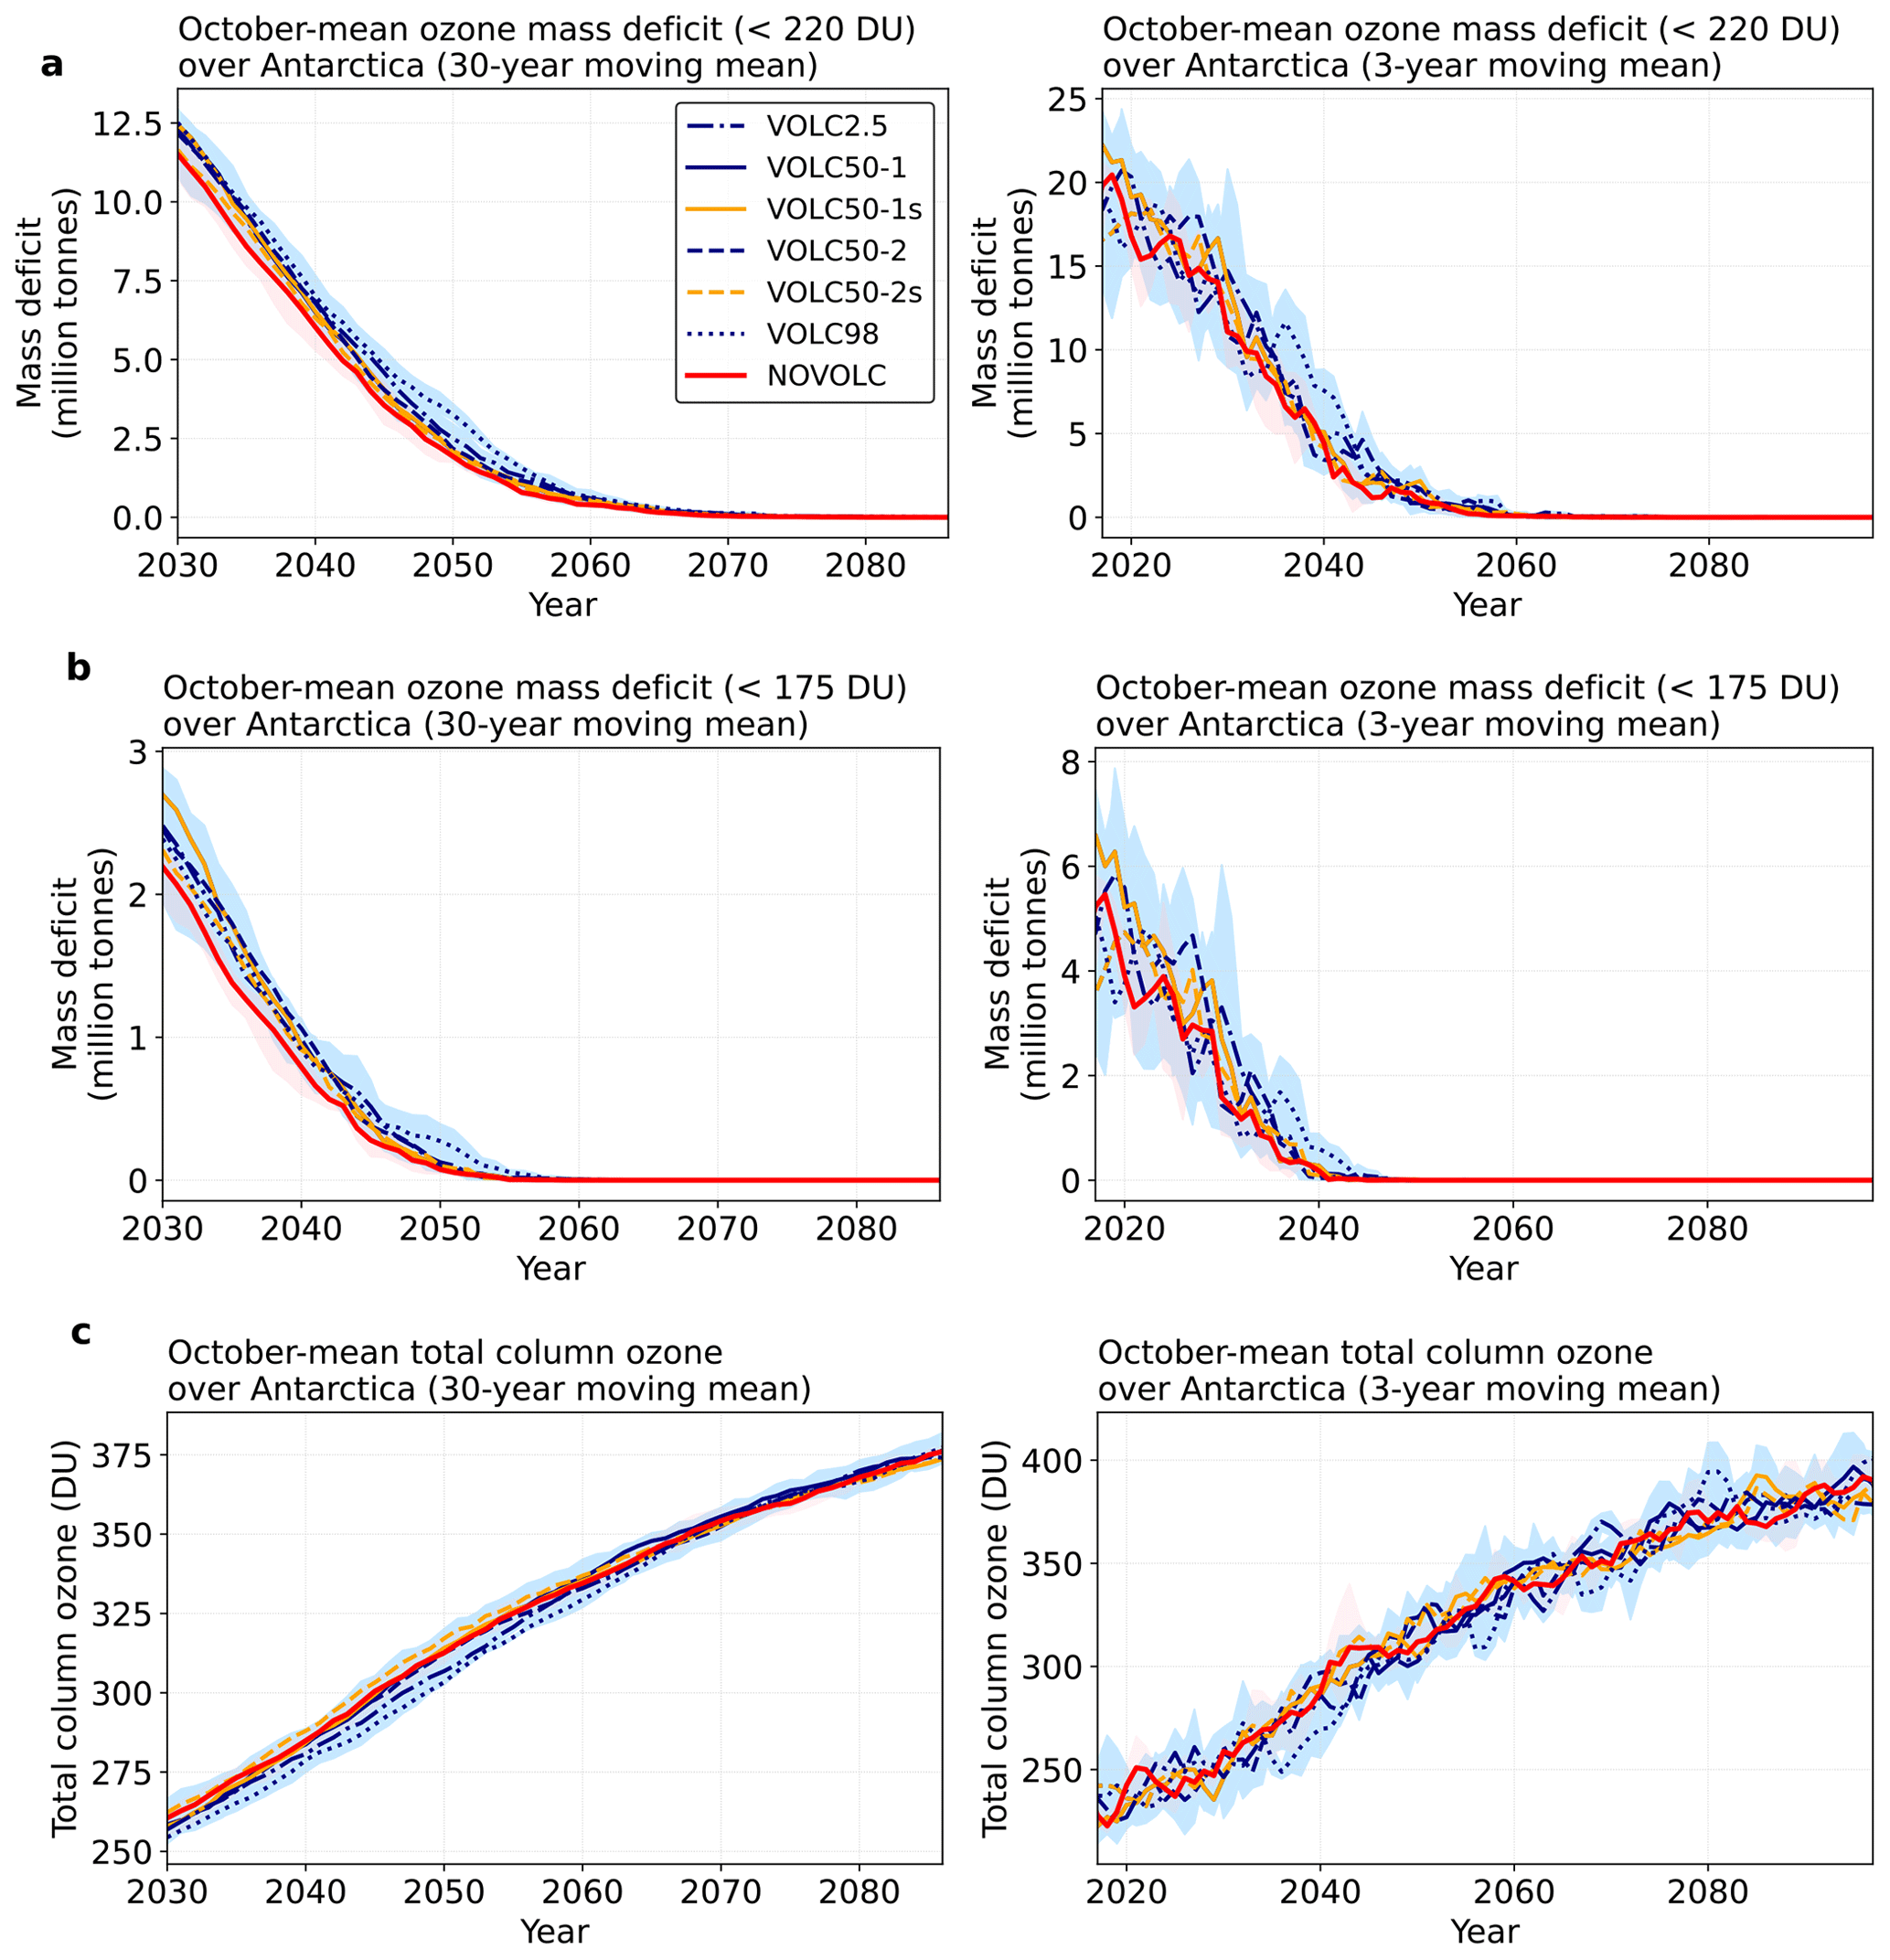
Figure 5October-mean ozone recovery indicators over Antarctica. (a) Ozone mass deficit using the 220 DU threshold (in million tonnes), (b) ozone mass deficit using the 175 DU threshold (in million tonnes), and (c) total column ozone (in DU). The left column shows the values applied with a 30-year moving mean, and the right column shows the values applied with a 3-year moving mean.
Figure 5c shows the time series of the October-mean Antarctic total column ozone. Compared to the NOVOLC run, our stochastic scenarios show a 0.5 % to 2.8 % (1.5 to 8 DU) lower Antarctic total column ozone averaged over 2030 to 2050, which lasts until around 2060s for some stochastic scenarios. The greater volcanic-induced impact on ozone loss in the near-term is likely due to the higher chlorine concentrations in the atmosphere as compared to the later decades. In our model and without considering future volcanic eruptions, Antarctic total column ozone returns to its 1980 baseline in 2066 (range: 2062–2072, NOVOLC). Among all the simulated stochastic scenarios, only the median scenario VOLC50-2 and the high-end scenario VOLC98 show delays in the Antarctic total column ozone return date, by 3 and 5 years respectively. One of the median scenarios with small-magnitude eruptions only (VOLC50-1s) has a 4-year delay in the median return date of total column ozone compared to VOLC50-1, while the other median stochastic scenario (VOLC50-2) has the same return year as the scenario with small-magnitude eruptions only (VOLC50-2s).
We also examine the responses of the annual mean total column ozone globally and over SH mid-latitudes (Fig. S3a and b). Our results show that volcanic sulfate aerosols induce a reduction of 0.4 % to 0.6 % (1.2 to 1.9 DU) in total column ozone over SH mid-latitudes, and 0.3 % to 0.5 % (0.9 to 1.6 DU) globally, relative to the NOVOLC simulation for the period 2030–2086. The magnitude of response in global and SH mid-latitude total column ozone is consistently negative throughout this century and comparable to or slightly greater than that over Antarctica (+0.1 % to −0.5 %, Fig. S3d), where the response shows greater variability.
Figure 6 shows the October-mean Antarctic ozone hole area for the VOLC and NOVOLC runs, with the zonal-mean stratospheric aerosol optical depth of the respective VOLC runs shown in each panel. To assess the return year of the Antarctic ozone hole area, we assess the recovery trend of the Antarctic ozone hole area. We find that the recovery of the Antarctic ozone hole area back to 220 DU is delayed by 1 to 3 years, except for the VOLC2.5 scenario (Table 1). Small-magnitude eruptions (VOLC50-1s and VOLC50-2s) have no impact on the median return dates of the Antarctic ozone hole area. The longer delay in the VOLC98 scenario can be attributed to the occurrence of a large-magnitude tropical eruption in 2056 emitting 114 Tg of SO2 (Fig. 1), which results in a high SAOD over Antarctica and an Antarctic October ozone hole area of 5 million km2 relative to NOVOLC (Fig. 6). Although we see a delay in the recovery of the Antarctic ozone hole area in most of the VOLC scenarios for a 220 DU threshold, our simulation results also show that the Antarctic ozone hole area is highly variable between ensemble members. We are not able to perform robust statistical tests due to the limited number of ensemble members. We also examine the Antarctic ozone hole area recovery under a lower total column ozone threshold of 175 and 150 DU. The Antarctic ozone hole area recovery is delayed by 1 year in most VOLC scenarios except for VOLC2.5 for a 175 DU threshold, and there is no delay in return date in all scenarios for a 150 DU threshold (Figs. S4 and S5).
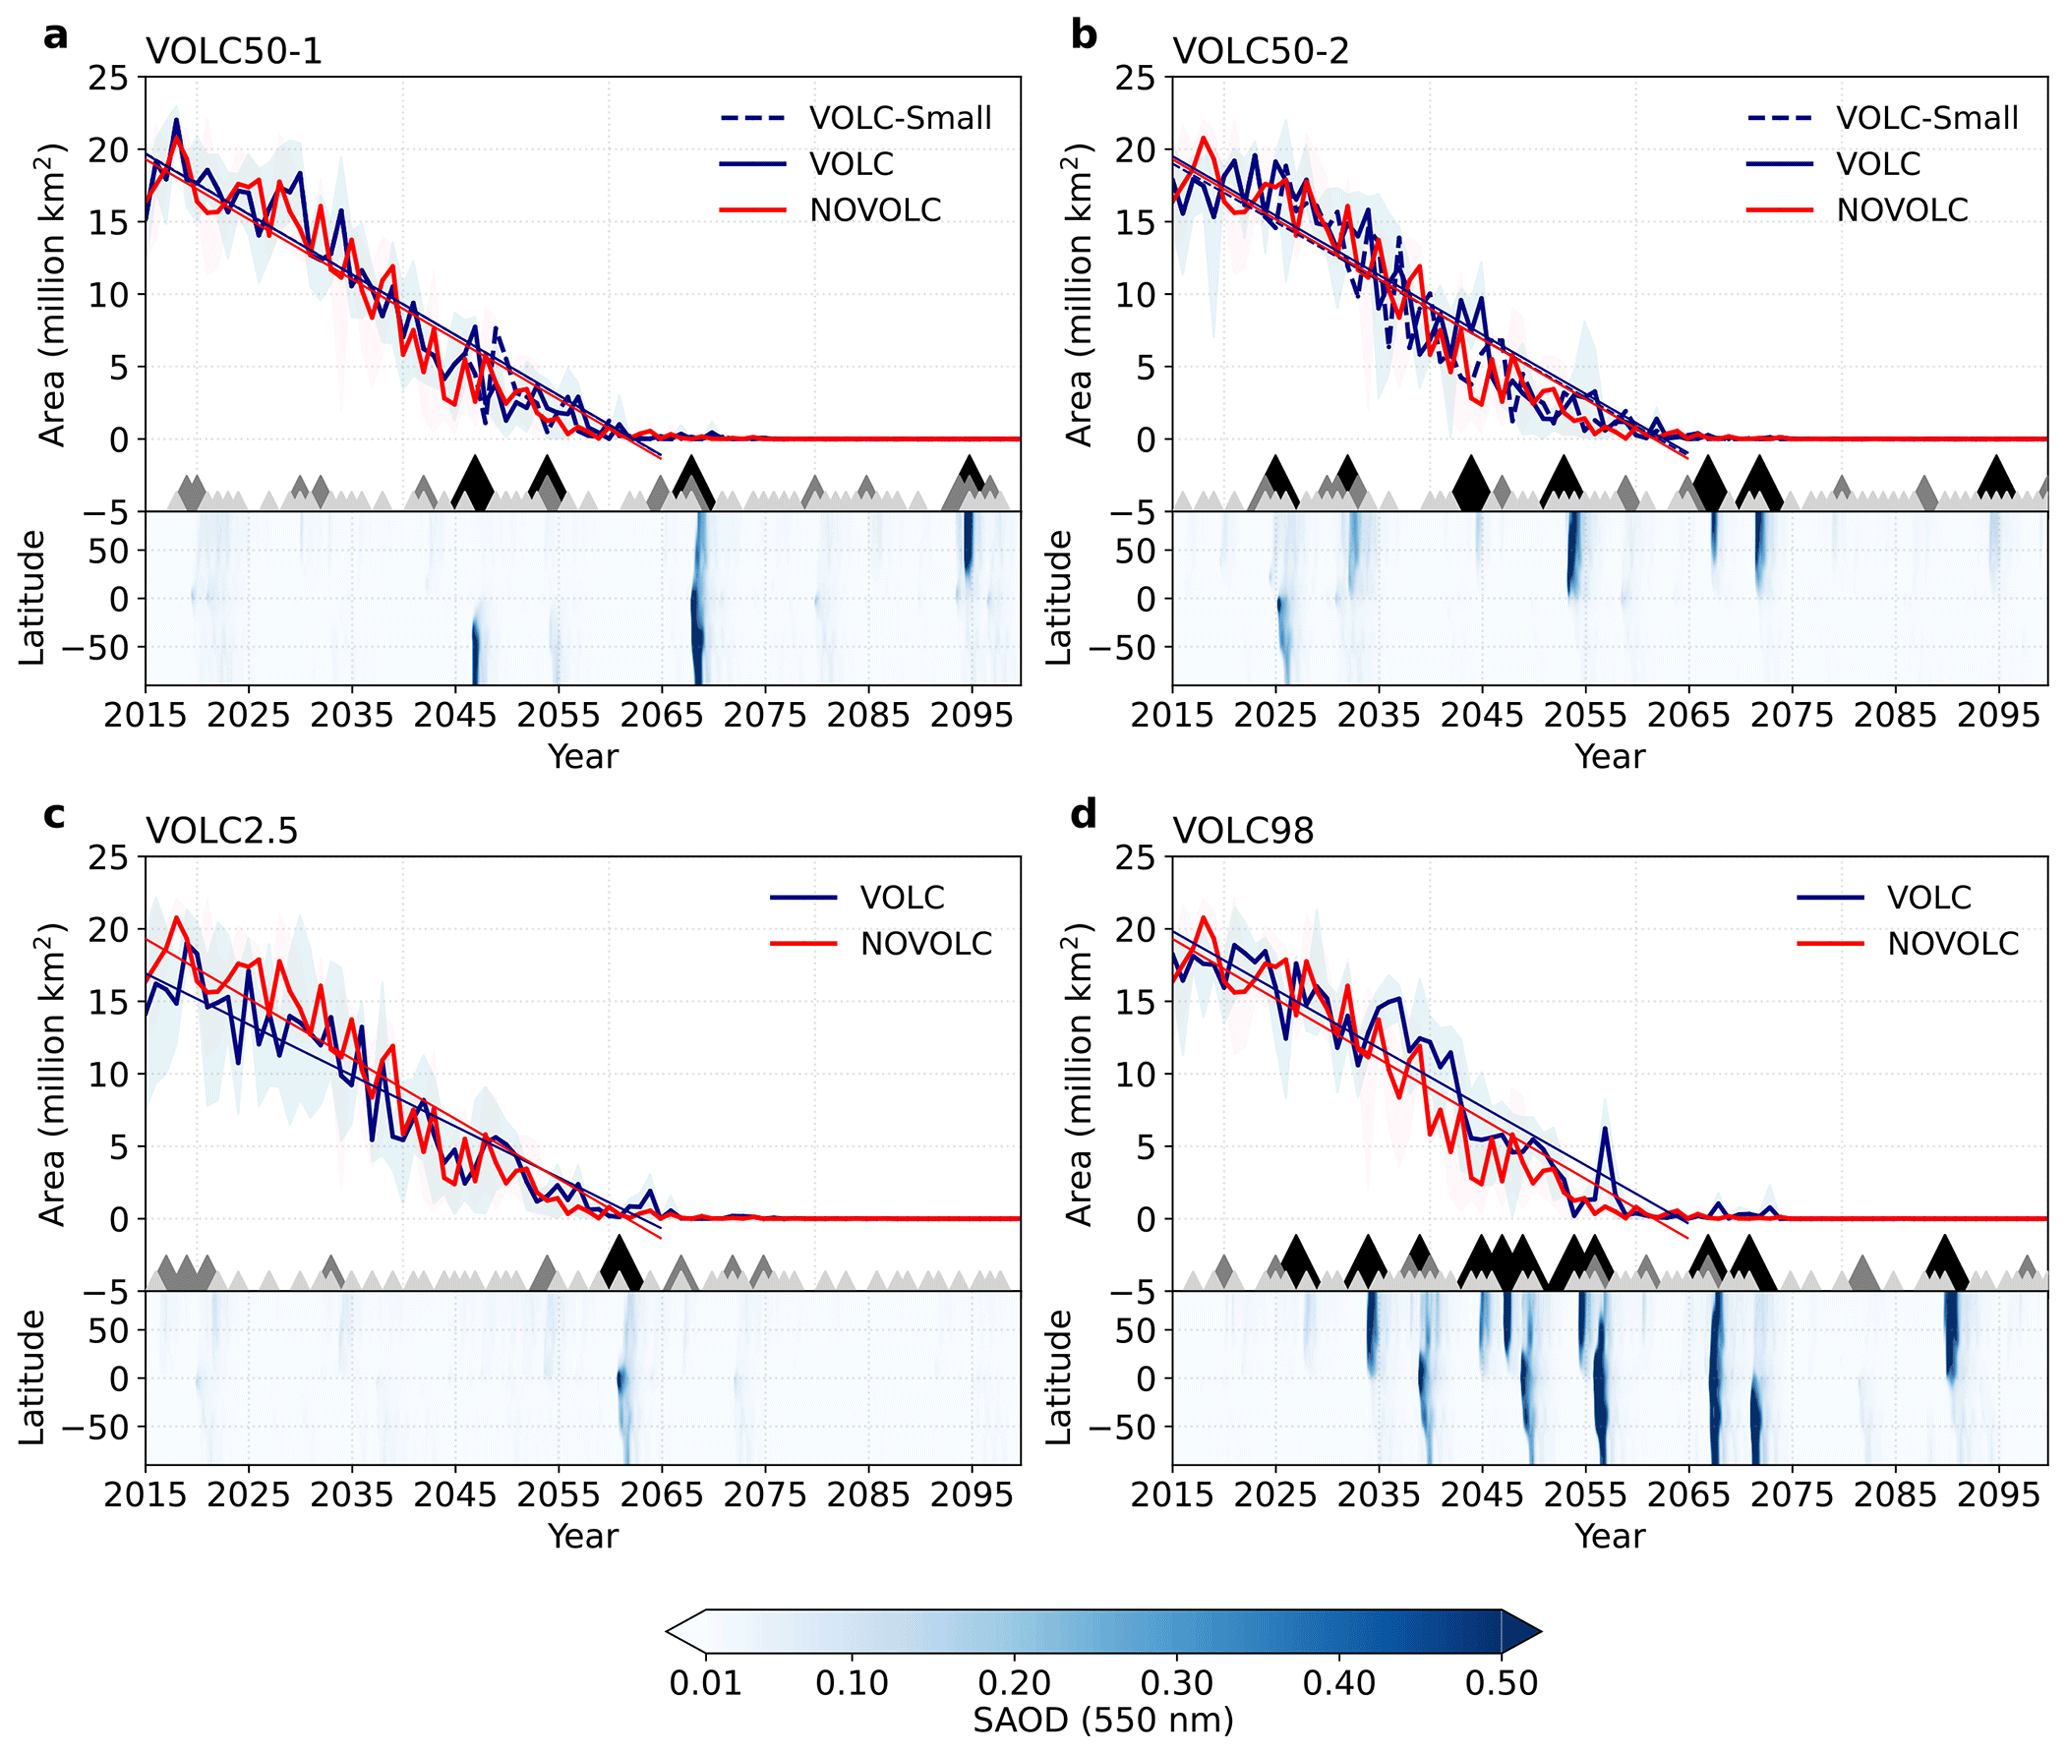
Figure 6October-mean ozone hole area (in million km2) averaged over Antarctica for (a) VOLC50-1, (b) VOLC50-2, (c) VOLC2.5, and (d) VOLC98. The blue lines show the ensemble mean values and the linear regression for each VOLC scenario, the red lines show the ensemble mean values for NOVOLC, and the shading shows the values of the maximum and minimum values across the ensemble members. The triangles refer to the occurrence of eruptions in each stochastic scenario: the black triangles refer to eruptions with > 3 Tg of SO2 injection, the grey triangles refer to eruptions with 1 to 3 Tg of SO2 injection, and the light grey triangles refer to eruptions with 0.1 to 1 Tg of SO2 injection. The lower panel shows the zonal mean stratospheric aerosol optical depth at 550 nm for the four VOLC runs.
3.3 Chemical changes in the Antarctic and SH mid-latitudes lower stratosphere
To assess the volcanic effects on the chemical loss of ozone, we select 9 large-magnitude eruptions with stratospheric sulfur burden > 0.2 Tg of S over Antarctica for composite analysis (Fig. 1b). Figure 7a shows the composite analysis results of the cumulative stratospheric ozone loss anomaly relative to NOVOLC over Antarctic and SH mid-latitudes for each catalytic cycle. A positive value indicates a net ozone loss via the catalytic cycle, while a negative value indicates a net ozone gain. Our analysis shows a net ozone loss via halogen cycles at year zero after volcanic eruptions, and a net ozone increase via NOx cycle over Antarctica and SH mid-latitudes (Fig. 7a and b). The volcanic-induced ozone response via halogen and NOx cycles is stronger over Antarctica than the SH mid-latitudes, as shown in Fig. 10a. Stratospheric volcanic sulfate aerosols catalyse the release of active chlorine from reservoir species via heterogeneous chemistry, forming ClOx (Fig. S6). This enhances stratospheric ozone loss via halogen cycles over Antarctica and SH mid-latitudes (Figs. S8 and S9). The sulfate aerosols also catalyse the hydrolysis of N2O5 (Fig. S7), suppressing the NOx-catalysed ozone loss for 1 to 2 years after the eruption (Figs. S8 and S9).
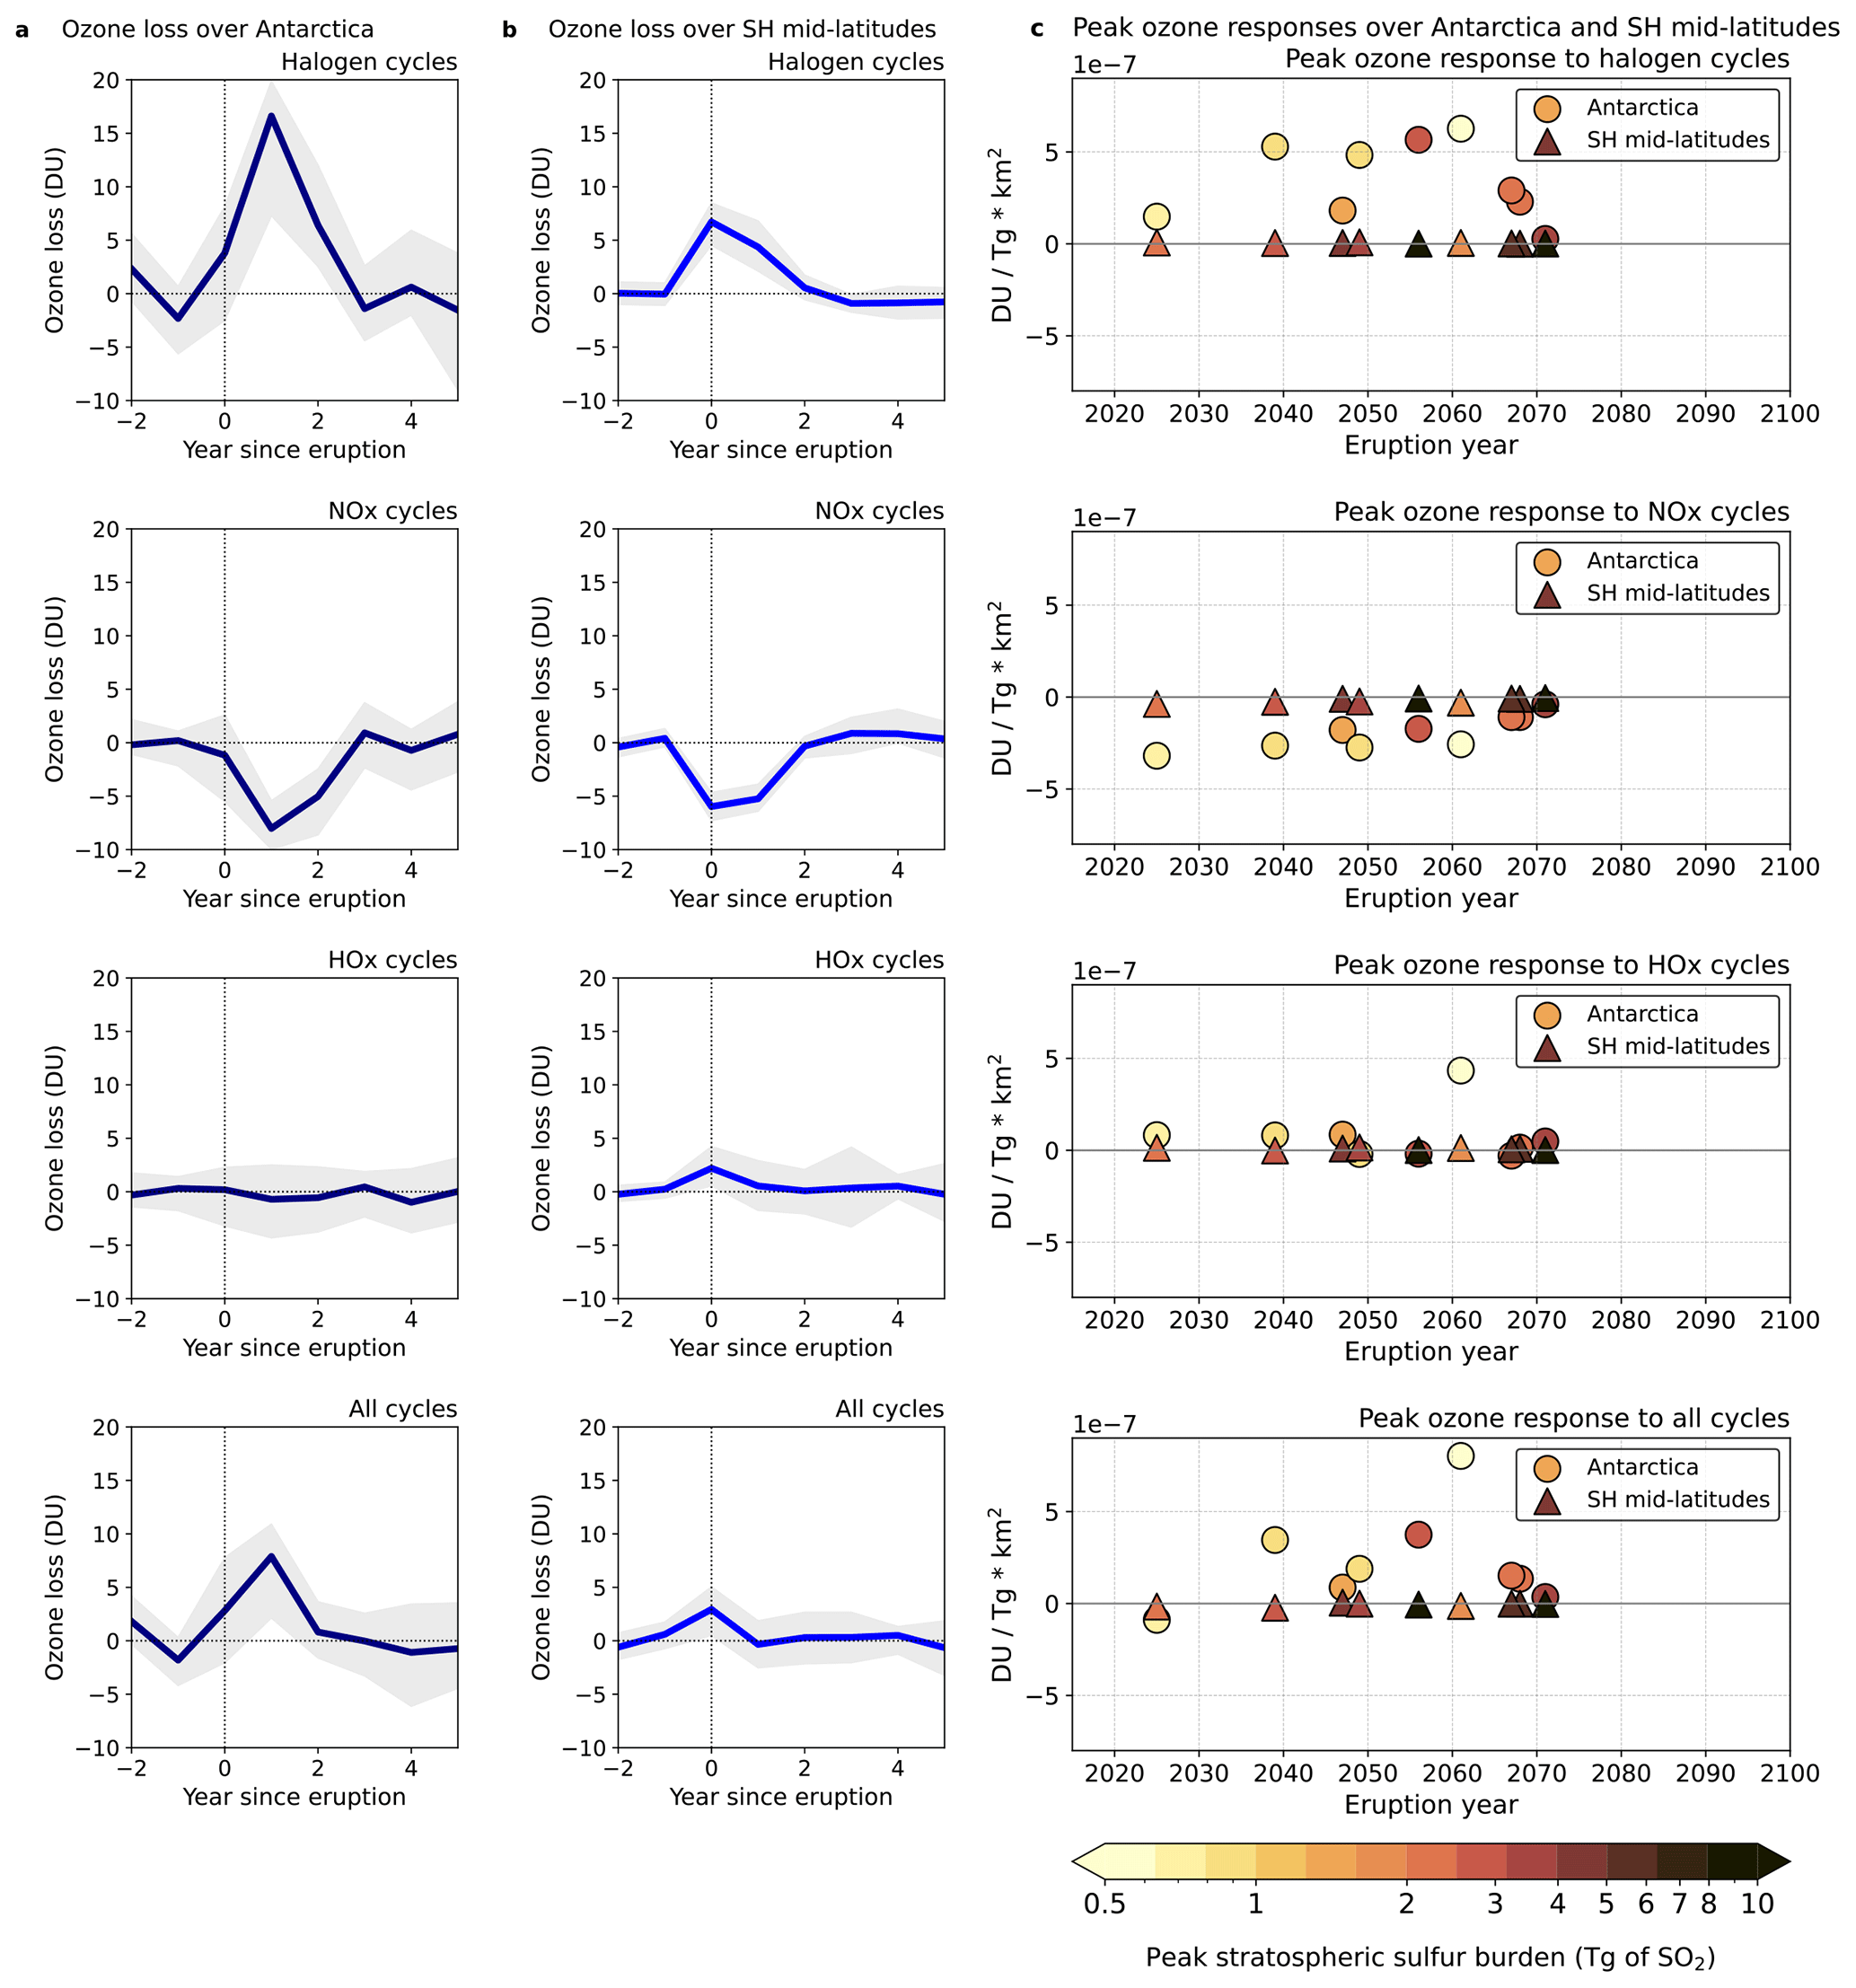
Figure 7Composite analysis of the cumulative stratospheric ozone loss (up to 25 km) relative to NOVOLC for the 9 selected eruptions (a) over Antarctica, integrated by time from August to the following July, and (b) SH mid-latitudes, cumulative loss for 12 months after the onset of each eruption. Year 0 denotes the year of eruption. The shaded region shows the range of the first and third quartiles. (c) Peak ozone response of the selected eruptions to halogen cycles, NOx cycle, HOx cycle, and all cycles (halogen + NOx + HOx) over Antarctica (circles) and SH mid-latitudes (triangles). The values are normalised with the respective peak stratospheric S burden for each eruption and total area over Antarctica and SH mid-latitudes, respectively.
Figure 7c shows the peak ozone response (i.e., the response at year 0 or 1 of the composite analysis) via the catalytic cycles, normalised by the respective peak stratospheric sulfur burden and total area over Antarctica and SH mid-latitudes. The normalised peak ozone response exhibits a decreasing trend with eruption year for both regions and is stronger over Antarctica than the SH mid-latitudes (Fig. 7a and b). However, the overall magnitude of ozone response, summing all catalytic cycles, is comparable between the Antarctica and SH mid-latitudes (Fig. 7c). Although we see clear decreasing trends in ozone response over both regions, we are unable to identify the shift in the ozone chemistry response due to a lack of large-magnitude eruptions with > 0.2 Tg of S over Antarctica after 2070 in these simulations.
Using a plume-aerosol-chemistry-climate model UKESM-VPLUME with an improved stochastic volcanic forcing, we assess the effect of future volcanic eruptions with sulfur injections on Antarctic and SH mid-latitude ozone recovery by evaluating the October-mean values of three ozone recovery indicators. We find that the extent of the delay in Antarctic ozone return dates depends on the eruption timing, latitude and aerosol distribution in the stochastic scenarios, with two scenarios showing delays in ozone mass deficit of 2 years (VOLC2.5) and up to 5 years (VOLC98) with a 220 DU ozone threshold (Table 1). If we use a lower ozone threshold of 175 DU, the relative effect of volcanic eruptions on ozone mass deficit can be up to 23 % in 2030 for a high-end future scenario (Fig. 5b). For the 175 DU threshold, VOLC50-2 shows the longest delay (6 years), while VOLC2.5 and VOLC98 both show 3-year delays, and VOLC50-1 has the same return year as NOVOLC. The apparent inconsistencies in the delays of recovery across scenarios arise from the different recovery timelines, which is due to differences in the timing of volcanic eruptions across scenarios, as well as varying sensitivities of the two ozone mass deficit thresholds. The recovery for the 175 DU threshold is much faster (median year of 2038 in NOVOLC) than the 220 DU threshold (median year of 2062 in NOVOLC), making each metric sensitive to eruptions occurring at different times. For instance, VOLC2.5 and VOLC98 both have large-magnitude eruptions with SH aerosol distribution before 2062, thus showing greater delay in return years for the 220 DU threshold. VOLC50-2 shows the longest delay for the 175 DU threshold because it has higher SH SAOD than VOLC2.5 and VOLC98 before 2038 (Fig. 6). In contrast, the first large-magnitude eruption in VOLC50-1 occurs in 2047, after the 175 DU threshold recovery year, and thus showing no delay for this metric.
We also show that future scenarios with small-magnitude eruptions only (VOLC50-1s and VOLC50-2s) have no effect on the return years of Antarctic ozone mass deficit with a 220 DU threshold, but have a mixed effect on the recovery of deeper ozone holes at the 175 DU threshold. One of the scenarios with small-magnitude eruptions only (VOLC50-2s), which has the lowest annual SO2 flux (0.57 Tg SO2 yr−1), shows earlier recovery by 5 years for the 175 DU threshold metric, while the other small-magnitude scenario (VOLC50-1s) shows a 1-year delay compared to VOLC50-1 (Table 1). This suggests that ozone recovery timing is primarily governed by large-magnitude eruptions, with small-magnitude eruptions playing a secondary role. However, the large uncertainty ranges and overlapping values in the return years between VOLC and NOVOLC scenarios reflect substantial internal variability between ensemble members; this highlights that recovery projections should be interpreted as ranges rather than median values alone. Our simulations are also limited by the number of ensemble members. Future modelling experiments with larger ensemble sizes would further quantify the uncertainty in volcanic effects on ozone recovery and distinguish between volcanic forcing effects and internal variability.
In terms of the total column ozone, we find a delay of up to 5 years in the high-end volcanic scenario (VOLC98), which includes volcanic eruptions with large stratospheric sulfur burdens and SAOD over Antarctica between the years 2055 and 2065 (Figs. 1 and 5). Our results show that an adopted large-magnitude tropical eruption in the year 2056 in the VOLC98 scenario, with an Antarctic sulfur burden of 2.7 Tg of S, leads to an Antarctic ozone hole exceeding 5 million km2 in October (Fig. 6d). This occurs despite the Antarctic ozone column being otherwise close to returning to 1980 values in the 2050s. The simulated ozone hole is comparable in size to that caused by the 2015 Calbuco eruption, which emitted around 0.4 Tg of SO2 and resulted in an October ozone hole of about 4.5 million km2 larger (Solomon et al., 2016). The comparable ozone hole size is attributable to the substantially higher stratospheric chlorine loading in 2015 compared to that projected for the mid-21st century. These findings demonstrate that future eruptions with significant volcanic sulfur injections have the potential to cause large Antarctic ozone holes in the middle of this century according to our simulations.
Our results differ from with the findings of Naik et al. (2017), another previous modelling study that assessed the effects of future volcanic eruptions on stratospheric ozone recovery in climate projections. Naik et al. (2017) use a prescribed constant future volcanic forcing equivalent to the 1860–1999 mean volcanic forcing to evaluate stratospheric ozone responses in climate projections using the GFDL-CM3 model under the RCP4.5 and RCP8.5 scenarios. Their model results suggest that an enhanced volcanic sulfate aerosol burden does not affect Antarctic ozone column return dates but leads to an earlier recovery of global stratospheric ozone. The disagreement between Naik et al. (2017) and our study potentially arises from differences in forcing magnitude, model responses and chemistry representations between GFDL-CM3 and UKESM. For instance, the ClO Cly ratio at 50° N in Naik et al. (2017) is a factor of 4 lower than observations on 22 March 1992, following the 1991 Mt. Pinatubo eruption (Fahey et al., 1993), suggesting that the GFDL model may not adequately capture the response of halogen chemistry. In addition, the UKESM model version used in our study has limited heterogeneous reactions, whereas a recent study by Ming et al. (2020) used a new heterogeneous scheme in UKESM with eight additional reactions, producing a better match with the observed total column ozone over Antarctica. Beyond differences in model chemistry responses, the contrasting results are likely stemming from the experimental design (prescribed versus interactive volcanic forcing) and different future emission scenarios used (RCP versus SSP). These differences hinder direct comparison between the two studies. Future model comparison studies using consistent future emission scenarios and volcanic forcing magnitudes are necessary to assess the projected ozone responses to volcanic eruptions across different models.
Our composite analysis of cumulative stratospheric ozone response reveals a net ozone loss for the 9 selected large-magnitude eruptions (Fig. 7c). The stratospheric ozone response to volcanic eruptions is sensitive to the amount of aerosol mass transported into the polar vortex (Fig. 1). Our results show a linear decreasing trend of peak ozone response after large-magnitude eruptions. However, due to the lack of large-magnitude eruptions after 2070 with high sulfur burden over Antarctica in our stochastic scenarios, we do not see a clear shift from net stratospheric ozone loss to production over Antarctica. We expect that eruptions occurring after year 2070 will eventually lead to a net ozone gain instead of ozone loss. Such shifting in the chemistry will affect the future ozone recovery trend. Our findings indicate that even a small-magnitude eruption in 2092, with a SO2 injection mass of less than 3 Tg of SO2 and an Antarctic sulfur burden as low as 0.08 Tg of S, can lead to a small net ozone loss over Antarctica (Fig. S8). The stratospheric ozone response to volcanic eruptions is also influenced by stratospheric dynamics. However, due to the coupled nature of our model simulations, we are unable to isolate and quantify the dynamical component of the ozone response. Furthermore, the stochastic nature of our scenarios and the limited model run length constrain our ability to identify the timing of the shift in stratospheric ozone response to volcanic eruptions, as the shift in the ozone chemistry may occur after 2100. Nonetheless, our study demonstrates that the composite analysis of the stratospheric ozone loss via catalytic cycles is a valuable tool for evaluating the chemical response of stratospheric ozone to volcanic eruptions.
Although our study primarily focuses on the ozone response over Antarctica and SH mid-latitudes, volcanic eruptions can also induce significant changes in ozone concentrations over the Arctic and NH mid-latitudes (Figs. S3c, S10 and S11). Composite analysis of 15 selected eruptions (with a stratospheric sulfur burden exceeding 0.5 Tg of S over the NH mid-latitudes) reveals substantial net ozone loss of 9 DU over the Arctic (interquartile range: 18 to −2 DU) and 2 DU loss over the NH mid-latitudes (interquartile range: 6 to −3 DU) (Fig. S12). However, the ozone response over these regions exhibits greater uncertainties and variability compared to the SH. The limited ensemble size in this study constrains our ability to draw robust conclusions regarding the NH ozone response. Furthermore, the occurrence of multiple volcanic eruptions between 2040 and 2060 in the VOLC98 scenario (Fig. 1) may introduce biases in the composite analysis, as the overlapping ozone responses from these closely timed eruptions could potentially interfere with one another (Fig. S12). Consequently, while our findings highlight the potential for volcanic eruptions to impact stratospheric ozone recovery over polar regions, additional research with larger ensemble simulations is necessary to more comprehensively characterise the ozone response over the Arctic and NH mid-latitudes.
We acknowledge that UKESM1.1 exhibits a stratospheric cold bias and excessively strong polar vortex that leads to prolonged ozone depletion over Antarctica (Fig. 4). The comparison of the UKESM1.1 simulation with ML-TOMCAT shows that the climatological mean of UKESM1.1 overestimates lower stratospheric ozone loss over Antarctica and SH mid-latitudes. Due to these model biases, our results likely overestimate the cumulative ozone loss over Antarctica and SH mid-latitudes. However, the relative volcanic effects on ozone in our simulated scenarios remain robust. In addition, our stochastic scenarios include stratospheric volcanic SO2 emissions only, but not volcanic halogen species, water vapour and VSL chlorine and bromine compounds, which affect stratospheric ozone recovery. Klobas et al. (2017) emphasised the sensitivity of future ozone changes to a Pinatubo-like eruption with VSL bromine injection between 0 to 8 pptv, which can lead to changes in total column ozone over Antarctica between −3 % and 3 % under one future representative concentration pathway (i.e., RCP6.0). Although VSL chlorine has a small contribution to total stratospheric chlorine (about 3 %) between 2010 to 2019 (Bednarz et al., 2022), the increasing emission of VSL chlorine highlights the potential importance of its impact on future ozone changes. By not accounting for VSL species in our simulations, we likely underestimate the full magnitude of volcanic impacts on ozone recovery. The lack of comprehensive historical records on volcanic halogen emissions, the variability in halogen injections across different eruptions, and the uncertainties in future VSL halogenated compounds emissions make it challenging to project future stratospheric halogen loadings using our stochastic approach. Therefore, our model-simulated effects on ozone represent a lower bound of the potential effects of future volcanic eruptions on ozone depletion. We anticipate that including volcanic halogen, water vapour, and VSL chlorine and bromine emissions in our stochastic scenarios would likely result in further delays to Antarctic and SH mid-latitude ozone recovery. It is essential to improve current volcanic halogen emission datasets and proxy records, and account for the emission of halogenated VSL compounds to better assess the impact of future volcanic eruptions on stratospheric ozone recovery.
Our model experiments use a high-end future anthropogenic emission scenario (SSP3-7.0) which has high future methane emissions (Meinshausen et al., 2020). Previous studies showed that stratospheric ozone responses to volcanic eruptions are sensitive to the background anthropogenic greenhouse gas emissions (Naik et al., 2017; Klobas et al., 2017). For instance, Klobas et al. (2017) demonstrate that ozone depletion after volcanic eruption is stronger in low-end RCP scenarios, which is attributed to a warmer stratosphere and lower methane emissions. As methane reacts with chlorine in the atmosphere, higher methane emissions in the future will lead to lower stratospheric reactive chlorine species and thus suppress the ClOx-catalysed ozone loss. For the same model simulation under a low-end SSP scenario, we expect a stronger volcanic-induced ozone response and potentially a later year of shift in ozone response (net loss versus net gain, see Sect. 3.3). Future studies can design specific model experiments with the co-injection of halogen species and water vapour to quantify the timing of the shift in Antarctic ozone chemistry under different future emission scenarios.
Using the plume-aerosol-chemistry-climate model UKESM-VPLUME with a stochastic representation of volcanic sulfur emissions, we quantified the effects of six stochastic scenarios on projected ozone recovery over Antarctica and Southern Hemisphere mid-latitudes. We showed that a high-end future eruption scenario delays the recovery of the Antarctic total column ozone and ozone mass deficit for up to 5 and 6 years respectively. These delays represented relatively small perturbations to the overall Antarctic and SH mid-latitudes ozone recovery. Our results also showed that the peak ozone loss due to large-magnitude volcanic eruptions in our stochastic scenarios weakens from 2015 to 2070 (Fig. 7c) as a result of declining CFC concentrations. Although our stochastic future eruption scenarios caused only a few years of delay in the ozone recovery metrics, large-magnitude eruptions can still potentially lead to substantial perturbations in stratospheric ozone prior to its recovery. For example, the mid-century eruption in the VOLC98 scenario led to an Antarctic ozone hole up to 5 million km2 (Figs. 5c and 6d). Our results also showed that small-magnitude eruptions have little effect on the recovery of Antarctic and SH mid-latitudes stratospheric ozone. These results highlighted the importance of accounting for volcanic variability in assessing stratospheric ozone recovery over Antarctica and SH mid-latitudes. Volcanic eruptions along with other events that perturb the stratospheric aerosol layer, such as wildfires and deliberate stratospheric aerosol injections, remain as future challenges in assessing ozone recovery (WMO, 2022; Solomon et al., 2022; Chipperfield and Bekki, 2024). Enhancing our understanding of volcano-induced ozone responses, including the effects of volcanic halogen emissions, is a crucial aspect for accurately assessing the healing of the Antarctic ozone layer. Continued improvements in models, volcanic emission datasets, and observational monitoring of the stratosphere will be critical to assess the stability and resilience of ozone layer recovery in the coming decades.
The code to reproduce the figures in the main text and supplementary information are available on Github: https://github.com/maychim/volc_ozone (last access: 27 April 2026).
The data used in this study are available here: https://doi.org/10.5281/zenodo.15838168 (Chim, 2025).
MMC conceptualised the paper with the advice from TJA and AS. MMC performed the UKESM simulations with the support from NLA. MMC performed the data analysis, visualisation, and wrote the first draft of the paper. HG, BJ, and SS provided critical feedback and helped shape the research and analysis. All authors discussed the results and commented on the manuscript.
The contact author has declared that none of the authors has any competing interests.
Publisher's note: Copernicus Publications remains neutral with regard to jurisdictional claims made in the text, published maps, institutional affiliations, or any other geographical representation in this paper. The authors bear the ultimate responsibility for providing appropriate place names. Views expressed in the text are those of the authors and do not necessarily reflect the views of the publisher.
We would like to thank Lauren Marshall, Alex Archibald and Maria Russo for their suggestions in the analysis. Special thanks to Martyn Chipperfield for his insightful feedback during the PhD viva, which contributed significantly to the improvement of this work. We would like to also thank James Keeble for providing the CMIP6 multi-model mean stratospheric ozone data, and Sandip Dhomse for providing the ML-TOMCAT ozone datasets. We would like to thank Bodeker Scientific for providing the BS-filled total column ozone database. This work used Monsoon2, a collaborative high-performance-computing facility funded by the Met Office and the Natural Environment Research Council, and JASMIN, the UK collaborative data analysis facility.
MMC is supported by the Croucher Foundation through the Croucher Fellowship. BJ was supported by the Met Office Hadley Centre Climate Programme sponsored by the United Kingdom Department of Science, Innovation, and Technology (DSIT). SS gratefully acknowledges support from NSF atmospheric chemistry grant nos. 2128617 and 2316980.
This paper was edited by Bernd Funke and reviewed by Xin Zhou and one anonymous referee.
Aubry, T. J., Jellinek, A. M., Degruyter, W., Bonadonna, C., Radić, V., Clyne, M., and Quainoo, A.: Impact of global warming on the rise of volcanic plumes and implications for future volcanic aerosol forcing, J. Geophys. Res.-Atmos., 121, https://doi.org/10.1002/2016JD025405, 2016.
Bednarz, E. M., Hossaini, R., Chipperfield, M. P., Abraham, N. L., and Braesicke, P.: Atmospheric impacts of chlorinated very short-lived substances over the recent past – Part 1: Stratospheric chlorine budget and the role of transport, Atmos. Chem. Phys., 22, 10657–10676, https://doi.org/10.5194/acp-22-10657-2022, 2022.
Bethke, I., Outten, S., Otterå, O. H., Hawkins, E., Wagner, S., Sigl, M., and Thorne, P.: Potential volcanic impacts on future climate variability, Nat. Clim. Change, 7, 799–805, https://doi.org/10.1038/nclimate3394, 2017.
Bobrowski, N., Hönninger, G., Galle, B., and Platt, U.: Detection of bromine monoxide in a volcanic plume, Nature, 423, 273–276, https://doi.org/10.1038/nature01625, 2003.
Bodeker, G. E. and Kremser, S.: Indicators of Antarctic ozone depletion: 1979 to 2019, Atmos. Chem. Phys., 21, 5289–5300, https://doi.org/10.5194/acp-21-5289-2021, 2021.
Brenna, H., Kutterolf, S., Mills, M. J., and Krüger, K.: The potential impacts of a sulfur- and halogen-rich supereruption such as Los Chocoyos on the atmosphere and climate, Atmos. Chem. Phys., 20, 6521–6539, https://doi.org/10.5194/acp-20-6521-2020, 2020.
Copernicus Atmosphere Monitoring Service (CAMS): Large and persistent 2023 ozone hole closes, https://atmosphere.copernicus.eu/large-and-persistent-2023-ozone-hole-closes#:~:text=The 2023 ozone hole completed,longest-lived observed to date. (last access: 10 April 2026), 2023.
Carn, S.: Multi-Satellite Volcanic Sulfur Dioxide L4 Long-Term Global Database V4, Goddard Earth Science Data and Information Services Center (GES DISC) [data set], Greenbelt, MD, USA, https://doi.org/10.5067/MEASURES/SO2/DATA405, 2021.
Carn, S. A., Clarisse, L., and Prata, A. J.: Multi-decadal satellite measurements of global volcanic degassing, J. Volcanol. Geoth. Res., 311, 99–134, https://doi.org/10.1016/j.jvolgeores.2016.01.002, 2016.
Chim, M. M.: Research data supporting “Future volcanic eruptions may delay the recovery of lower stratospheric ozone over Antarctica and Southern Hemisphere mid-latitudes”, Zenodo [data set], https://doi.org/10.5281/zenodo.15838168, 2025.
Chim, M. M., Aubry, T. J., Abraham, N. L., Marshall, L., Mulcahy, J., Walton, J., and Schmidt, A.: Climate Projections Very Likely Underestimate Future Volcanic Forcing and Its Climatic Effects, Geophys. Res. Lett., 50, e2023GL103743, https://doi.org/10.1029/2023GL103743, 2023.
Chipperfield, M. P. and Bekki, S.: Opinion: Stratospheric ozone – depletion, recovery and new challenges, Atmos. Chem. Phys., 24, 2783–2802, https://doi.org/10.5194/acp-24-2783-2024, 2024.
De Laat, A. T. J., Stein Zweers, D. C., Boers, R., and Tuinder, O. N. E.: A solar escalator: Observational evidence of the self‐lifting of smoke and aerosols by absorption of solar radiation in the February 2009 Australian Black Saturday plume, J. Geophys. Res., 117, 2011JD017016, https://doi.org/10.1029/2011JD017016, 2012.
Dhomse, S. S. and Chipperfield, M. P.: Using machine learning to construct TOMCAT model and occultation measurement-based stratospheric methane (TCOM-CH4) and nitrous oxide (TCOM-N2O) profile data sets, Earth Syst. Sci. Data, 15, 5105–5120, https://doi.org/10.5194/essd-15-5105-2023, 2023.
Dhomse, S. S., Emmerson, K. M., Mann, G. W., Bellouin, N., Carslaw, K. S., Chipperfield, M. P., Hommel, R., Abraham, N. L., Telford, P., Braesicke, P., Dalvi, M., Johnson, C. E., O'Connor, F., Morgenstern, O., Pyle, J. A., Deshler, T., Zawodny, J. M., and Thomason, L. W.: Aerosol microphysics simulations of the Mt. Pinatubo eruption with the UM-UKCA composition-climate model, Atmos. Chem. Phys., 14, 11221–11246, https://doi.org/10.5194/acp-14-11221-2014, 2014.
Dhomse, S. S., Arosio, C., Feng, W., Rozanov, A., Weber, M., and Chipperfield, M. P.: ML-TOMCAT: machine-learning-based satellite-corrected global stratospheric ozone profile data set from a chemical transport model, Earth Syst. Sci. Data, 13, 5711–5729, https://doi.org/10.5194/essd-13-5711-2021, 2021.
Dhomse, S. S., Kinnison, D., Chipperfield, M. P., Salawitch, R. J., Cionni, I., Hegglin, M. I., Abraham, N. L., Akiyoshi, H., Archibald, A. T., Bednarz, E. M., Bekki, S., Braesicke, P., Butchart, N., Dameris, M., Deushi, M., Frith, S., Hardiman, S. C., Hassler, B., Horowitz, L. W., Hu, R.-M., Jöckel, P., Josse, B., Kirner, O., Kremser, S., Langematz, U., Lewis, J., Marchand, M., Lin, M., Mancini, E., Marécal, V., Michou, M., Morgenstern, O., O'Connor, F. M., Oman, L., Pitari, G., Plummer, D. A., Pyle, J. A., Revell, L. E., Rozanov, E., Schofield, R., Stenke, A., Stone, K., Sudo, K., Tilmes, S., Visioni, D., Yamashita, Y., and Zeng, G.: Estimates of ozone return dates from Chemistry-Climate Model Initiative simulations, Atmos. Chem. Phys., 18, 8409–8438, https://doi.org/10.5194/acp-18-8409-2018, 2018.
Dorf, M., Butz, A., Camy-Peyret, C., Chipperfield, M. P., Kritten, L., and Pfeilsticker, K.: Bromine in the tropical troposphere and stratosphere as derived from balloon-borne BrO observations, Atmos. Chem. Phys., 8, 7265–7271, https://doi.org/10.5194/acp-8-7265-2008, 2008.
Evan, S., Brioude, J., Rosenlof, K. H., Gao, R.-S., Portmann, R. W., Zhu, Y., Volkamer, R., Lee, C. F., Metzger, J.-M., Lamy, K., Walter, P., Alvarez, S. L., Flynn, J. H., Asher, E., Todt, M., Davis, S. M., Thornberry, T., Vömel, H., Wienhold, F. G., Stauffer, R. M., Millán, L., Santee, M. L., Froidevaux, L., and Read, W. G.: Rapid ozone depletion after humidification of the stratosphere by the Hunga Tonga Eruption, Science, 382, eadg2551, https://doi.org/10.1126/science.adg2551, 2023.
Eyring, V., Arblaster, J. M., Cionni, I., Sedláček, J., Perlwitz, J., Young, P. J., Bekki, S., Bergmann, D., Cameron-Smith, P., Collins, W. J., Faluvegi, G., Gottschaldt, K. -D., Horowitz, L. W., Kinnison, D. E., Lamarque, J.-F., Marsh, D. R., Saint-Martin, D., Shindell, D. T., Sudo, K., Szopa, S., and Watanabe, S.: Long-term ozone changes and associated climate impacts in CMIP5 simulations, J. Geophys. Res.-Atmos., 118, 5029–5060, https://doi.org/10.1002/jgrd.50316, 2013.
Fahey, D. W., Kawa, S. R., Woodbridge, E. L., Tin, P., Wilson, J. C., Jonsson, H. H., Dye, J. E., Baumgardner, D., Borrmann, S., Toohey, D. W., Avallone, L. M., Proffitt, M. H., Margitan, J., Loewenstein, M., Podolske, J. R., Salawitch, R. J., Wofsy, S. C., Ko, M. K. W., Anderson, D. E., Schoeber, M. R., and Chan, K. R.: In situ measurements constraining the role of sulphate aerosols in mid-latitude ozone depletion, Nature, 363, 509–514, https://doi.org/10.1038/363509a0, 1993.
Fleming, E. L., Newman, P. A., Liang, Q., and Oman, L. D.: Stratospheric Temperature and Ozone Impacts of the Hunga Tonga-Hunga Ha'apai Water Vapor Injection, J. Geophys. Res.-Atmos., 129, e2023JD039298, https://doi.org/10.1029/2023JD039298, 2024.
Hall, R. J., Mitchell, D. M., Seviour, W. J. M., and Wright, C. J.: Persistent Model Biases in the CMIP6 Representation of Stratospheric Polar Vortex Variability, J. Geophys. Res.-Atmos., 126, e2021JD034759, https://doi.org/10.1029/2021JD034759, 2021.
Ivy, D. J., Solomon, S., Kinnison, D., Mills, M. J., Schmidt, A., and Neely, R. R.: The influence of the Calbuco eruption on the 2015 Antarctic ozone hole in a fully coupled chemistry-climate model, Geophys. Res. Lett., 44, 2556–2561, https://doi.org/10.1002/2016GL071925, 2017.
Keeble, J., Hassler, B., Banerjee, A., Checa-Garcia, R., Chiodo, G., Davis, S., Eyring, V., Griffiths, P. T., Morgenstern, O., Nowack, P., Zeng, G., Zhang, J., Bodeker, G., Burrows, S., Cameron-Smith, P., Cugnet, D., Danek, C., Deushi, M., Horowitz, L. W., Kubin, A., Li, L., Lohmann, G., Michou, M., Mills, M. J., Nabat, P., Olivié, D., Park, S., Seland, Ø., Stoll, J., Wieners, K.-H., and Wu, T.: Evaluating stratospheric ozone and water vapour changes in CMIP6 models from 1850 to 2100, Atmos. Chem. Phys., 21, 5015–5061, https://doi.org/10.5194/acp-21-5015-2021, 2021.
Klobas, E. J., Wilmouth, D. M., Weisenstein, D. K., Anderson, J. G., and Salawitch, R. J.: Ozone depletion following future volcanic eruptions, Geophys. Res. Lett., 44, 7490–7499, https://doi.org/10.1002/2017GL073972, 2017.
Kovilakam, M., Thomason, L. W., Ernest, N., Rieger, L., Bourassa, A., and Millán, L.: The Global Space-based Stratospheric Aerosol Climatology (version 2.0): 1979–2018, Earth Syst. Sci. Data, 12, 2607–2634, https://doi.org/10.5194/essd-12-2607-2020, 2020.
Laube, J. C., Engel, A., Bönisch, H., Möbius, T., Worton, D. R., Sturges, W. T., Grunow, K., and Schmidt, U.: Contribution of very short-lived organic substances to stratospheric chlorine and bromine in the tropics – a case study, Atmos. Chem. Phys., 8, 7325–7334, https://doi.org/10.5194/acp-8-7325-2008, 2008.
Lee, A. M., Jones, R. L., Kilbane-Dawe, I., and Pyle, J. A.: Diagnosing ozone loss in the extratropical lower stratosphere, J. Geophys. Res., 107, https://doi.org/10.1029/2001JD000538, 2002.
Mastin, L. G.: A user-friendly one-dimensional model for wet volcanic plumes, Geochem. Geophy. Geosy., 8, 2006GC001455, https://doi.org/10.1029/2006GC001455, 2007.
Mastin, L. G.: Testing the accuracy of a 1-D volcanic plume model in estimating mass eruption rate, J. Geophys. Res.-Atmos., 119, 2474–2495, https://doi.org/10.1002/2013JD020604, 2014.
Meinshausen, M., Nicholls, Z. R. J., Lewis, J., Gidden, M. J., Vogel, E., Freund, M., Beyerle, U., Gessner, C., Nauels, A., Bauer, N., Canadell, J. G., Daniel, J. S., John, A., Krummel, P. B., Luderer, G., Meinshausen, N., Montzka, S. A., Rayner, P. J., Reimann, S., Smith, S. J., van den Berg, M., Velders, G. J. M., Vollmer, M. K., and Wang, R. H. J.: The shared socio-economic pathway (SSP) greenhouse gas concentrations and their extensions to 2500, Geosci. Model Dev., 13, 3571–3605, https://doi.org/10.5194/gmd-13-3571-2020, 2020.
Mills, M. J., Schmidt, A., Easter, R., Solomon, S., Kinnison, D. E., Ghan, S. J., Neely, R. R., Marsh, D. R., Conley, A., Bardeen, C. G., and Gettelman, A.: Global volcanic aerosol properties derived from emissions, 1990–2014, using CESM1 (WACCM), J. Geophys. Res.-Atmos., 121, 2332–2348, https://doi.org/10.1002/2015JD024290, 2016.
Ming, A., Winton, V. H. L., Keeble, J., Abraham, N. L., Dalvi, M. C., Griffiths, P., Caillon, N., Jones, A. E., Mulvaney, R., Savarino, J., Frey, M. M., and Yang, X.: Stratospheric Ozone Changes From Explosive Tropical Volcanoes: Modeling and Ice Core Constraints, J. Geophys. Res.-Atmos., 125, e2019JD032290, https://doi.org/10.1029/2019JD032290, 2020.
Mulcahy, J. P., Jones, C. G., Rumbold, S. T., Kuhlbrodt, T., Dittus, A. J., Blockley, E. W., Yool, A., Walton, J., Hardacre, C., Andrews, T., Bodas-Salcedo, A., Stringer, M., de Mora, L., Harris, P., Hill, R., Kelley, D., Robertson, E., and Tang, Y.: UKESM1.1: development and evaluation of an updated configuration of the UK Earth System Model, Geosci. Model Dev., 16, 1569–1600, https://doi.org/10.5194/gmd-16-1569-2023, 2023.
Naik, V., Horowitz, L. W., Daniel Schwarzkopf, M., and Lin, M.: Impact of volcanic aerosols on stratospheric ozone recovery, J. Geophys. Res.-Atmos., 122, 9515–9528, https://doi.org/10.1002/2016JD025808, 2017.
NASA Ozone Watch, https://ozonewatch.gsfc.nasa.gov/meteorology/SH.html (last access: 10 April 2026), 2024.
O'Neill, B. C., Tebaldi, C., van Vuuren, D. P., Eyring, V., Friedlingstein, P., Hurtt, G., Knutti, R., Kriegler, E., Lamarque, J.-F., Lowe, J., Meehl, G. A., Moss, R., Riahi, K., and Sanderson, B. M.: The Scenario Model Intercomparison Project (ScenarioMIP) for CMIP6, Geosci. Model Dev., 9, 3461–3482, https://doi.org/10.5194/gmd-9-3461-2016, 2016.
Pyle, D. M. and Mather, T. A.: Halogens in igneous processes and their fluxes to the atmosphere and oceans from volcanic activity: A review, Chem. Geol., 263, 110–121, https://doi.org/10.1016/j.chemgeo.2008.11.013, 2009.
Sala, S., Bönisch, H., Keber, T., Oram, D. E., Mills, G., and Engel, A.: Deriving an atmospheric budget of total organic bromine using airborne in situ measurements from the western Pacific area during SHIVA, Atmos. Chem. Phys., 14, 6903–6923, https://doi.org/10.5194/acp-14-6903-2014, 2014.
Santee, M. L., Manney, G. L., Lambert, A., Millán, L. F., Livesey, N. J., Pitts, M. C., Froidevaux, L., Read, W. G., and Fuller, R. A.: The Influence of Stratospheric Hydration From the Hunga Eruption on Chemical Processing in the 2023 Antarctic Vortex, J. Geophys. Res.-Atmos., 129, e2023JD040687, https://doi.org/10.1029/2023JD040687, 2024.
Sellar, A. A., Jones, C. G., Mulcahy, J. P., Tang, Y., Yool, A., Wiltshire, A., O'Connor, F. M., Stringer, M., Hill, R., Palmieri, J., Woodward, S., De Mora, L., Kuhlbrodt, T., Rumbold, S. T., Kelley, D. I., Ellis, R., Johnson, C. E., Walton, J., Abraham, N. L., Andrews, M. B., Andrews, T., Archibald, A. T., Berthou, S., Burke, E., Blockley, E., Carslaw, K., Dalvi, M., Edwards, J., Folberth, G. A., Gedney, N., Griffiths, P. T., Harper, A. B., Hendry, M. A., Hewitt, A. J., Johnson, B., Jones, A., Jones, C. D., Keeble, J., Liddicoat, S., Morgenstern, O., Parker, R. J., Predoi, V., Robertson, E., Siahaan, A., Smith, R. S., Swaminathan, R., Woodhouse, M. T., Zeng, G., and Zerroukat, M.: UKESM1: Description and Evaluation of the U.K. Earth System Model, J. Adv. Model Earth Sy., 11, 4513–4558, https://doi.org/10.1029/2019MS001739, 2019.
Sigl, M., Toohey, M., McConnell, J. R., Cole-Dai, J., and Severi, M.: Volcanic stratospheric sulfur injections and aerosol optical depth during the Holocene (past 11 500 years) from a bipolar ice-core array, Earth Syst. Sci. Data, 14, 3167–3196, https://doi.org/10.5194/essd-14-3167-2022, 2022.
Solomon, S., Ivy, D. J., Kinnison, D., Mills, M. J., Neely, R. R., and Schmidt, A.: Emergence of healing in the Antarctic ozone layer, Science, 353, 269–274, https://doi.org/10.1126/science.aae0061, 2016.
Solomon, S., Dube, K., Stone, K., Yu, P., Kinnison, D., Toon, O. B., Strahan, S. E., Rosenlof, K. H., Portmann, R., Davis, S., Randel, W., Bernath, P., Boone, C., Bardeen, C. G., Bourassa, A., Zawada, D., and Degenstein, D.: On the stratospheric chemistry of midlatitude wildfire smoke, P. Natl. Acad. Sci. USA, 119, e2117325119, https://doi.org/10.1073/pnas.2117325119, 2022.
Staunton-Sykes, J., Aubry, T. J., Shin, Y. M., Weber, J., Marshall, L. R., Luke Abraham, N., Archibald, A., and Schmidt, A.: Co-emission of volcanic sulfur and halogens amplifies volcanic effective radiative forcing, Atmos. Chem. Phys., 21, 9009–9029, https://doi.org/10.5194/acp-21-9009-2021, 2021.
Stone, K. A., Solomon, S., Kinnison, D. E., and Mills, M. J.: On Recent Large Antarctic Ozone Holes and Ozone Recovery Metrics, Geophys. Res. Lett., 48, e2021GL095232, https://doi.org/10.1029/2021GL095232, 2021.
Sturges, W. T., Oram, D. E., Carpenter, L. J., Penkett, S. A., and Engel, A.: Bromoform as a source of stratospheric bromine, Geophys. Res. Lett., 27, 2081–2084, https://doi.org/10.1029/2000GL011444, 2000.
Villamayor, J., Iglesias-Suarez, F., Cuevas, C. A., Fernandez, R. P., Li, Q., Abalos, M., Hossaini, R., Chipperfield, M. P., Kinnison, D. E., Tilmes, S., Lamarque, J.-F., and Saiz-Lopez, A.: Very short-lived halogens amplify ozone depletion trends in the tropical lower stratosphere, Nat. Clim. Change, 13, 554–560, https://doi.org/10.1038/s41558-023-01671-y, 2023.
Wales, P. A., Salawitch, R. J., Nicely, J. M., Anderson, D. C., Canty, T. P., Baidar, S., Dix, B., Koenig, T. K., Volkamer, R., Chen, D., Huey, L. G., Tanner, D. J., Cuevas, C. A., Fernandez, R. P., Kinnison, D. E., Lamarque, J., Saiz‐Lopez, A., Atlas, E. L., Hall, S. R., Navarro, M. A., Pan, L. L., Schauffler, S. M., Stell, M., Tilmes, S., Ullmann, K., Weinheimer, A. J., Akiyoshi, H., Chipperfield, M. P., Deushi, M., Dhomse, S. S., Feng, W., Graf, P., Hossaini, R., Jöckel, P., Mancini, E., Michou, M., Morgenstern, O., Oman, L. D., Pitari, G., Plummer, D. A., Revell, L. E., Rozanov, E., Saint‐Martin, D., Schofield, R., Stenke, A., Stone, K. A., Visioni, D., Yamashita, Y., and Zeng, G.: Stratospheric Injection of Brominated Very Short‐Lived Substances: Aircraft Observations in the Western Pacific and Representation in Global Models, J. Geophys. Res.-Atmos., 123, 5690–5719, https://doi.org/10.1029/2017JD027978, 2018.
WMO: Scientific assessment of ozone depletion: Global Ozone Research and Monitoring Project – GAW Report no. 278, World Meteorological Organization, Geneva, Switzerland, ISBN: 978-9914-733-97-6, 2022.
Yu, P., Davis, S. M., Toon, O. B., Portmann, R. W., Bardeen, C. G., Barnes, J. E., Telg, H., Maloney, C., and Rosenlof, K. H.: Persistent Stratospheric Warming Due to 2019–2020 Australian Wildfire Smoke, Geophys. Res. Lett., 48, e2021GL092609, https://doi.org/10.1029/2021GL092609, 2021.
Zhou, X., Dhomse, S. S., Feng, W., Mann, G., Heddell, S., Pumphrey, H., Kerridge, B. J., Latter, B., Siddans, R., Ventress, L., Querel, R., Smale, P., Asher, E., Hall, E. G., Bekki, S., and Chipperfield, M. P.: Antarctic Vortex Dehydration in 2023 as a Substantial Removal Pathway for Hunga Tonga-Hunga Ha'apai Water Vapor, Geophys. Res. Lett., 51, e2023GL107630, https://doi.org/10.1029/2023GL107630, 2024.
Zhu, Y., Toon, O. B., Kinnison, D., Harvey, V. L., Mills, M. J., Bardeen, C. G., Pitts, M., Bègue, N., Renard, J., Berthet, G., and Jégou, F.: Stratospheric Aerosols, Polar Stratospheric Clouds, and Polar Ozone Depletion After the Mount Calbuco Eruption in 2015, J. Geophys. Res.-Atmos., 123, https://doi.org/10.1029/2018JD028974, 2018.
Zhu, Y., Bardeen, C. G., Tilmes, S., Mills, M. J., Wang, X., Harvey, V. L., Taha, G., Kinnison, D., Portmann, R. W., Yu, P., Rosenlof, K. H., Avery, M., Kloss, C., Li, C., Glanville, A. S., Millán, L., Deshler, T., Krotkov, N., and Toon, O. B.: Perturbations in stratospheric aerosol evolution due to the water-rich plume of the 2022 Hunga-Tonga eruption, Communications Earth & Environment, 3, 248, https://doi.org/10.1038/s43247-022-00580-w, 2022.
Zhuo, Z., Wang, X., Zhu, Y., Yu, W., Bednarz, E. M., Fleming, E., Colarco, P. R., Watanabe, S., Plummer, D., Stenchikov, G., Randel, W., Bourassa, A., Aquila, V., Sekiya, T., Schoeberl, M. R., Tilmes, S., Zhang, J., Kushner, P. J., and Pausata, F. S. R.: Comparing multi-model ensemble simulations with observations and decadal projections of upper atmospheric variations following the Hunga eruption, Atmos. Chem. Phys., 25, 13161–13176, https://doi.org/10.5194/acp-25-13161-2025, 2025.