
the Creative Commons Attribution 4.0 License.
the Creative Commons Attribution 4.0 License.
 | 12 Oct 2026
Cloud vertical structure across China from a national Ka-band cloud radar network: thermodynamic, dynamical, and land-surface controls
Hui Xu

Jianbo Deng
Rongfang Yang
Deli Meng
Zhen Zhang
Ning Li
Yuping Sun
Shuairu Jiang
Tianmeng Chen
Juan Chen
Liping Zeng
Yongshui Zhou
Bing Tong
Cloud vertical structure (CVS) plays a fundamental role in regulating the Earth's radiation budget and hydrological cycle, yet its representation in numerical weather prediction and climate models remains highly uncertain, largely due to limited high-resolution regional observations. Using a newly established national network of 80 Ka-band millimeter-wave cloud radars (MMCRs), here we present a high-spatiotemporal-resolution (vertical resolution of 30 m, temporal resolution of 1 min) characterization of CVS across China based on one year (2024) of observations, and quantify its thermodynamic, dynamical, and land-surface controls. Cloud boundaries are retrieved using an improved algorithm that integrates height-dependent radar sensitivity with variance-based clutter suppression. Results show that the national annual mean cloud occurrence frequency is 56.7 ± 7.2 %, dominated by single-layer clouds (34.7 ± 4.0 %), followed by two-layer (14.7 ± 3.2 %) and multi-layer clouds (7.1 ± 2.4 %). Spatially, single-layer clouds prevail over arid northwestern China, whereas multi-layer clouds are more frequent in humid southeastern region. Cloud base height (CBH) exhibits strong seasonality (summer > spring > autumn > winter), with notably low CBH over the Tibetan Plateau. Diurnally, summer clouds show a pronounced afternoon peak between 3 and 9 km, while winter clouds remain largely below 3 km and peak near sunrise. Thermodynamic conditions exert the primary control on CVS. Higher 2 m specific humidity promotes deeper cloud development and raises cloud top height (CTH), whereas enhanced lower-tropospheric stability suppresses vertical cloud growth and lowers both CBH and CTH. Dynamical forcing further modulates cloud structure: stronger vertical wind shear (VWS) generally inhibits vertical cloud development, reducing CBH, CTH and cloud thickness, while moderate VWS can enhance organization under unstable conditions. Joint dependence analyses reveal that moisture, stability, and shear act in a coupled manner, with moisture being the dominant driver and stability and shear serving as strong regulators. In addition, land-surface characteristics significantly influence CBH, especially for afternoon single-layer low clouds, which exhibit a mean CBH is 21.7 % higher than the all-hour low clouds, with the strongest enhancement over evergreen broadleaf forests (+41.7 %). These findings provide the first observationally constrained, national-scale assessment of CVS based on this radar network, offering quantitative benchmarks for evaluating and improving cloud parameterizations in weather and climate models.
- Article
(9358 KB) - Full-text XML
-
Supplement
(3962 KB) - BibTeX
- EndNote


Clouds are a crucial component of the Earth-atmosphere system and exert strong influence on both global and regional climate, as well as the hydrological cycle (Ramanathan et al., 1989; Stephens, 2005; Williams et al., 2006; Bony et al., 2015; Voigt et al., 2021). By reflecting and scattering incoming solar shortwave radiation and absorbing outgoing longwave radiation, clouds substantially modulate the radiation budget at the top of the atmosphere, within the atmosphere, and at the surface (Wielicki et al., 1995; Muhlbauer et al., 2014; Xu et al., 2021; Li et al., 2023). Cloud macrophysical characteristics – including cloud fraction, cloud base height (CBH), cloud top height (CTH), cloud thickness (CT), and the number of vertical layers – strongly influence cloud radiative forcing and precipitation processes (Weare, 2000; Wild, 2012; George et al., 2018; Zhang et al., 2019). Despite decades of research, climate models continue to exhibit substantial biases in simulating these cloud macrophysical properties, contributing significantly to considerable uncertainties in climate projections (Cesana and Waliser, 2016; IPCC, 2021; Cesana et al., 2022). For instance, many global climate models tend to overestimate high-level clouds in moist environments while underestimate low-level clouds in dry environments (Cesana and Waliser, 2016). Improving the representation of cloud vertical structure (CVS) is therefore essential for reducing model uncertainty and enhancing the reliability of weather and climate simulations.
Satellite observations provide broad spatial coverage of cloud macrophysical properties. Passive sensors such as the Moderate Resolution Imaging Spectroradiometer (MODIS) and the Multiangle Imaging Spectroradiometer (MISR) have been widely used to retrieve CTH and related properties. Based on two decades (2002–2021) of MODIS data, Richardson et al. (2022) reported an increasing trend in tropical-mean high-cloud altitude of 6.9 ± 2.7 m yr−1, which is statistically consistent with climate model projections. Using MISR-derived CTHs, Chae and Sherwood (2010) investigated the relationship between atmospheric stability and tropical deep convective cloud altitude over the western Pacific, finding altitude variations of approximately 2 km associated with higher convective available potential energy (CAPE). More recently, Mitra et al. (2023) combined MODIS and MISR data to improve CTH retrieval for thin cirrus overlying low-level clouds. However, passive sensors generally lack the capability to resolve cloud vertical structure comprehensively, particularly CBH and multi-layer configurations.
Active satellite instruments, including the Cloud Profiling Radar (CPR) aboard CloudSat and the Cloud-Aerosol Lidar with Orthogonal Polarization (CALIOP) aboard CALIPSO, have greatly advanced CVS observations (e.g., Stephens et al., 2002; Mace et al., 2007; Marchand et al., 2008; Huang et al., 2015). Using combined CloudSat and CALIPSO data, Oreopoulos et al. (2017) identified single-layer low and high clouds as the most frequent global CVS types, accounting for approximately 53 % of cloudy scenes. Over China, Chi et al. (2022) documented strong regional and seasonal variability in CBH and CTH.
Nevertheless, active satellite retrievals have limitations. Compared with surface-based observations, CloudSat–CALIPSO products underestimate low cloud occurrence, failing to detect approximately 25 % of clouds with bases below 600 m and roughly 9 % of clouds with bases between 600 and 1000 m (Liu, 2022). Moreover, their narrow swath width and 16 d revisit cycle of CloudSat and CALIPSO restrict temporal sampling and limit the ability to resolve diurnal variability.
Radiosonde observations provide high-vertical-resolution temperature and humidity profiles, allowing for the retrieval of CVS. Threshold-based methods have been widely used for CVS retrieval, including the dew-point depression technique (Poore et al., 1995), fixed relative humidity thresholds (Wang and Rossow, 1995), second-derivative methods (Chernykh and Eskridge, 1996), and dynamic altitude-dependent RH thresholds (Zhang et al., 2010). Xu et al. (2023) developed an improved retrieval method incorporating humidity and temperature gradients, revealing regional differences in low-cloud occurrence across East Asia, Europe and North America. However, these sounding measurements are typically conducted twice daily at 00:00 and 12:00 UTC (Guo et al., 2016, 2019; Zhou et al., 2019), making them insufficient to capture the full diurnal evolution of CVS.
Compared with radiosonde observations, ground-based Ka-band millimeter-wave cloud radar (MMCR) enables continuous monitoring of CVS (Shupe et al., 2008). Owing to its high spatiotemporal resolution and strong penetration capability (Moran et al., 1998; Hollars et al., 2004), MMCR has been widely applied to analyze diurnal and seasonal variations in CVS (Zhao et al., 2017; Zhou et al., 2019; Chen et al., 2022). However, most MMCR based studies on CVS have been limited to individual sites or small regions, leaving a systematic national-scale characterization of CVS largely unexplored. Previous research has highlighted that cloud vertical development is jointly influenced by atmospheric thermal conditions, dynamical processes, and land-surface characteristics (Richardson et al., 2007; Chen et al., 2015; Fu et al., 2020). Specifically, lower-tropospheric stability (LTS) and low-level humidity are key thermodynamic factors regulating boundary-layer development and CBH, while vertical wind shear (VWS) modulates CTH and CT by influencing the vertical development of clouds (Helfer et al., 2020; Wang et al., 2020; Yang et al., 2022; Xu et al., 2025). Land cover types further modulate cloud formation and CVS by altering surface energy partitioning and moisture fluxes (Wang et al., 2021). Despite these advances, most studies have focused on isolated factors or localized regions. To our knowledge, a national-scale, high-frequency characterization of CVS across China based on a coordinated ground-based radar network remains lacking, and the combined thermodynamic, dynamical, and land-surface controls have yet to be systematically quantified.
To address this gap, we present the first attempt to retrieve high-spatiotemporal-resolution vertical structures of clouds across China using one year (2024) of MMCR observations from a national network of 80 stations. The retrieved CVS metrics include cloud layer number, CBH, CTH, and CT for each detected cloud layer. An improved retrieval algorithm incorporating height-dependent radar sensitivity curves and a variance-based clutter suppression method is developed to enhance detection reliability. Unless otherwise specified, CBH refers to the base height of the lowest cloud layer, CTH denotes the top of the highest cloud layer, and CT represents the total cloud thickness, defined as the difference between the highest CTH and lowest CBH across all detected layers. For multi-layer cloud conditions, this definition includes the clear-sky gaps between individual cloud layers. The remainder of this paper is organized as follows: Sect. 2 describes the observational data and methodology used for CVS retrieval. Section 3 presents the spatial, vertical, seasonal, and diurnal characteristics of CVS and analyzes its thermodynamic, dynamical, and land-surface controls. Section 4 summarizes the main findings and discusses their implications for weather and climate modeling.
2.1 Study area
China spans a vast territory across broad latitudinal and longitudinal ranges, leading to pronounced spatial heterogeneity in both atmospheric and surface conditions. The climate is predominantly governed by the Asian monsoon systems and the topographic forcing of the Tibetan Plateau, which together result in substantial regional variations (Ye and Gao, 1979; Domroes and Peng, 1988; Ding and Murakami, 1994). In eastern China, a distinct north–south gradient is evident: southern regions are characterized by year-round warm and humid conditions, while northern areas experience colder winters and pronounced seasonal temperature variability. In contrast, western China, an area dominated by high-elevation terrain such as the Tibetan Plateau, is typified by relatively low temperatures, strong radiative cooling, and limited moisture availability (Shi and Wang, 2020). Across this diverse landscape, meteorological variables exhibit strong seasonal cycles: precipitation and air temperature peak in summer (June–July–August) and reach minima in winter (December–January–February), sunshine duration follows a similar seasonal pattern, with maximum values occurring in summer. Wind speeds are generally highest in spring (March–April–May), whereas relative humidity remains consistently elevated in southern China and shows comparatively modest seasonal variation. Autumn (September–October–November) does not display equally distinct seasonal extremes in these meteorological variables.
2.2 Data
2.2.1 Ka-band millimeter-wave cloud radar observations
The MMCRs retrieve cloud macrophysical properties by detecting the scattering signals of cloud particles at millimeter wavelengths (Hobbs et al., 1985; Kollias et al., 2007). Capable of continuously monitoring cloud vertical structure with high spatiotemporal resolution (Clothiaux et al., 2000; Mace et al., 2001; Hollars et al., 2004), the MMCRs employed in this study operates with a vertical resolution of 30 m, a temporal resolution of 1 min, and a maximum detection height of 18 km above ground level (a.g.l.). Compared to conventional weather radars, the shorter wavelength of the MMCRs enhances their sensitivity to small cloud particles, making them particularly effective for observing non-precipitating and weakly precipitating clouds, as well as for penetrating multi-layer cloud systems (Moran et al., 1998; Kollias et al., 2007). This penetrative ability enables MMCRs to obtain detailed vertical cloud profiles, especially for thick, dense, and multi-layered clouds.
MMCR data have been widely used in cloud boundary detection (e.g., Zhang et al., 2019; Zhou et al., 2019; Fang et al., 2023) and exhibit strong consistency with radiosonde observations (Wang et al., 2016; Zhao et al., 2017; Chen et al., 2022). In this study, MMCR data for 2024 were obtained from the China Meteorological Administration (CMA). Of the 120 MMCR stations operating across China in 2024, only those with at least 100 valid observation days annually (defined as calendar days with at least 8 h of valid MMCR measurements) were retained to ensure data quality. This criterion resulted in the selection of 80 stations for subsequent analysis (Fig. 1). Notably, we selected 2024 because it was the first year in which the MMCR network achieved sufficient density for national-scale analysis. Before 2024, fewer than 30 stations were operational nationwide, which was inadequate for a robust spatial characterization of CVS. The major expansion in 2024, with nearly 120 MMCRs deployed, made this pioneering investigation feasible. Even though this single-year dataset does not constitute a long-term climatology, it provides the first observationally dense and vertically resolved national snapshot of CVS across China.
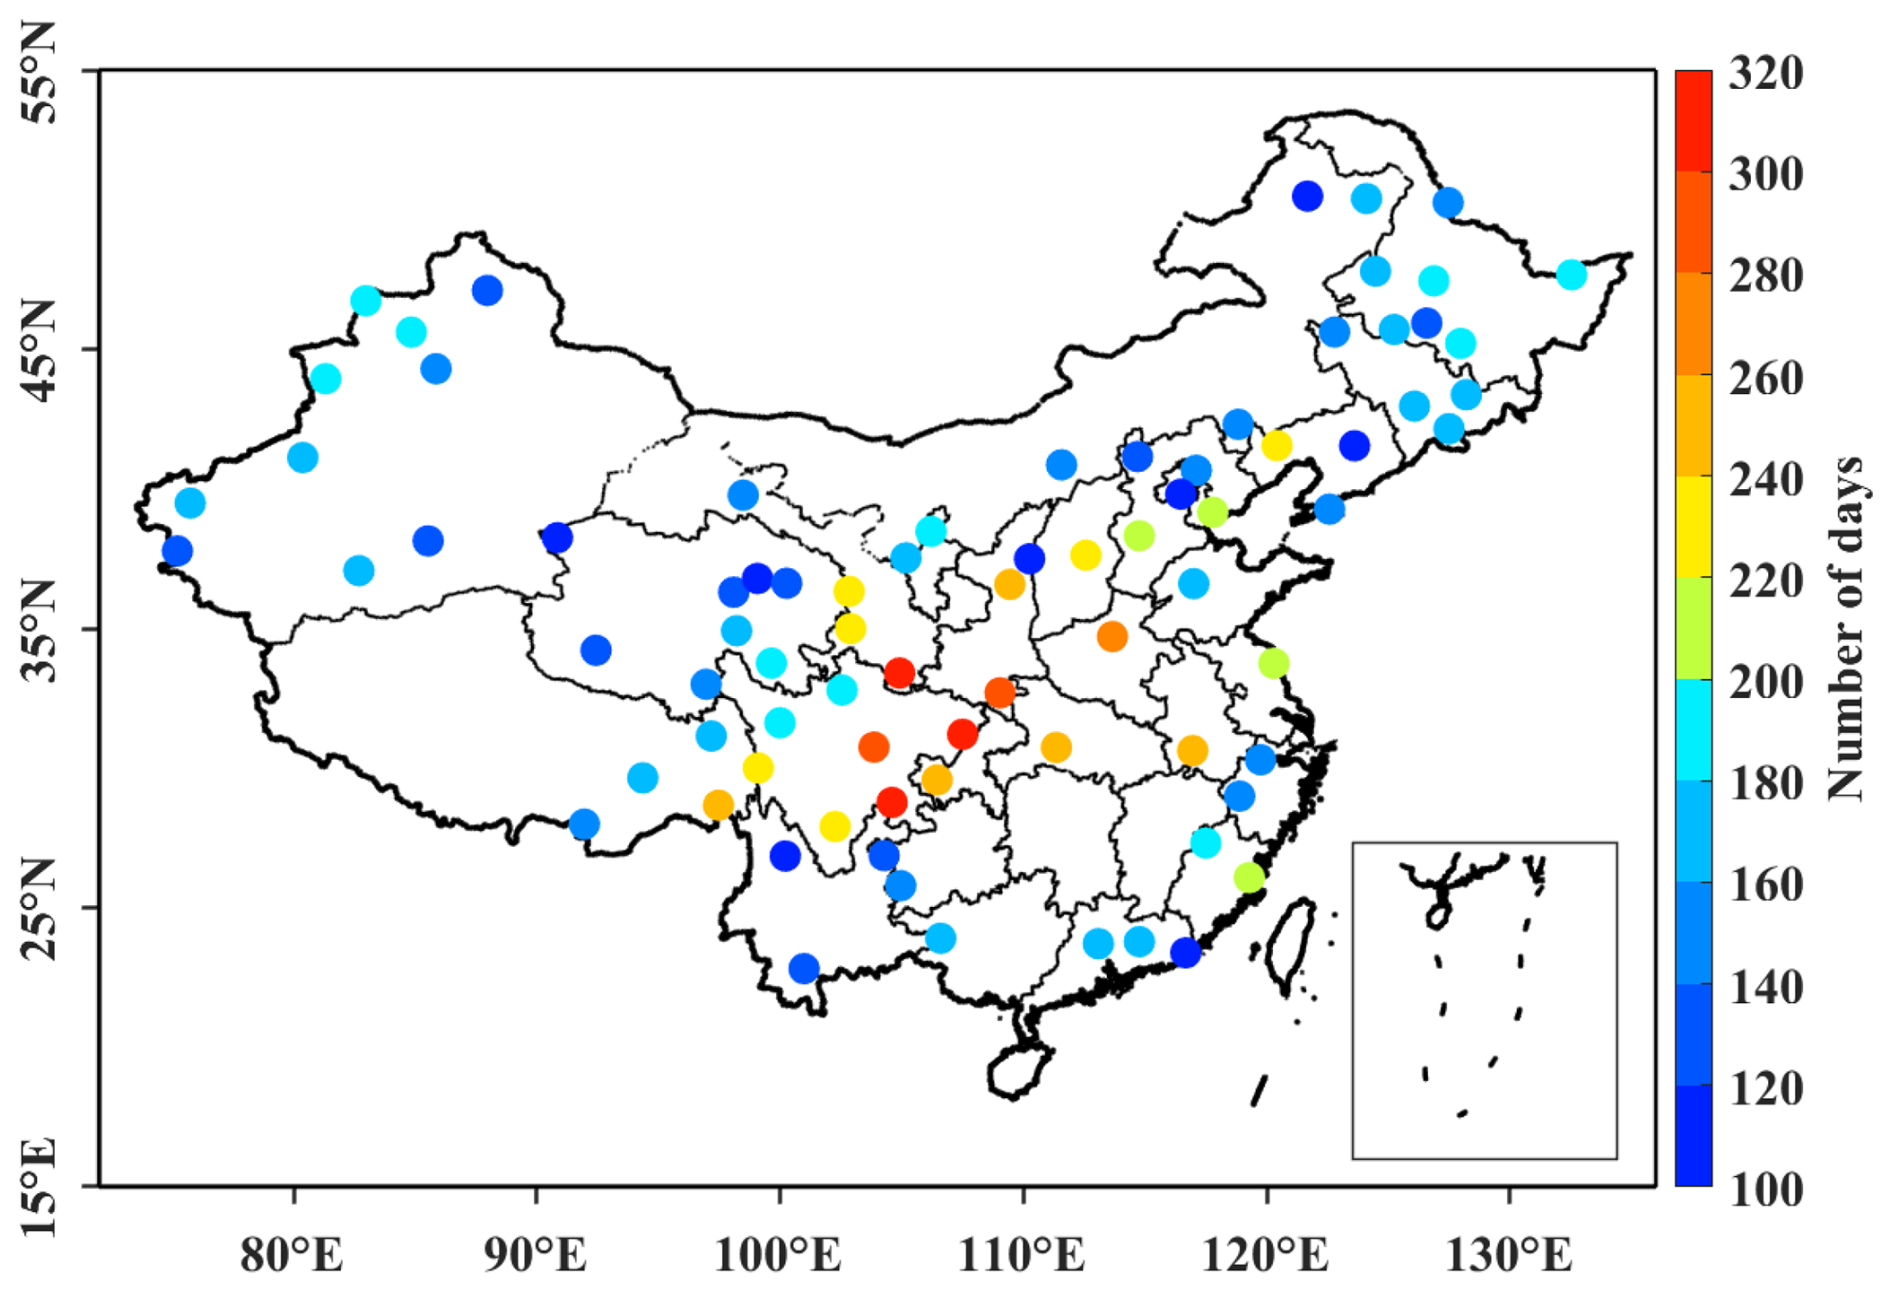
Figure 1Geographical distribution of millimeter-wave cloud radar (MMCR) stations across mainland China in 2024. A total of 120 MMCR stations were in nationwide operation during this period. For rigorous data quality control, stations with fewer than 100 valid annual observation days were excluded from the subsequent analysis. Consequently, 80 stations that met this quality criterion are displayed in the map, where the color of each station marker denotes the total number of days with valid observational records at the corresponding site.
2.2.2 Radar wind profiler measurements
The radar wind profiler (RWP) is a ground-based remote sensing instrument designed to measure vertical profiles of wind within the planetary boundary layer (PBL) and the lower free atmosphere (Liu et al., 2020). By transmitting electromagnetic beams in multiple directions and analyzing the returned signals, RWP provides a comprehensive set of atmospheric variables, including horizontal wind speed and direction, vertical velocity, radial velocity, Doppler spectral width, signal-to-noise ratio (SNR), and the refractive index structure parameter () (Liu et al., 2020). These measurements typically cover altitudes from 150 m to 5.0 km a.g.l., with a vertical resolution of 120 m and a temporal interval of 6 min (McCaffrey et al., 2017; Ruan et al., 2014). Compared to conventional radiosonde observations and reanalysis datasets, RWPs offer significantly higher temporal resolution, thereby facilitating high-resolution, continuous monitoring of temporal variations in atmospheric wind profiles. In this study, VWS was derived from the RWP-observed wind speed and direction profiles. The magnitude of VWS at a given height is calculated as:
where u and v represent the zonal and meridional components of the horizontal wind, respectively. To account for the large topographic relief across China, we adopt a terrain-following criterion for selecting the pressure level at which VWS is evaluated: for stations with surface elevation <3 km (covering most of eastern and central China), VWS is computed from the wind profile at the 700 hPa level; for stations with surface elevation ≥3 km (typical of the Tibetan Plateau), VWS is computed from the wind profile at the 500 hPa level. This ensures that the derived VWS consistently characterizes the lower-to-mid tropospheric shear relevant to cloud development under different topographic conditions.
Although RWP observations offer high temporal resolution, they are subject to notable uncertainties. Data quality is often degraded below approximately 0.5 km a.g.l. due to near-surface clutter, while significant beam attenuation limits reliable detection above about 5.0 km a.g.l. Therefore, rigorous quality control is essential before deriving dynamic variables from RWP data, and our analysis is consequently restricted to the 0.5–5.0 km height range.
Before deriving VWS from the RWP measurements, we applied a multi-step quality control procedure following Wei et al. (2014) and Miao et al. (2018). First, data during precipitation periods were excluded to avoid contamination from precipitation particles, which can introduce significant errors in Doppler-based wind retrieval. Second, within each profile over the 0.5–5.0 km height range, missing values and outliers exceeding 2.5 standard deviations from the mean were removed. Third, if more than 40 % of the data points within this height range are outliers or missing, the entire profile was discarded. Fourth, discontinuous or missing data points were estimated using linear interpolation. Fifth, only observations within the 0.5–5.0 km height range were retained to avoid near-surface clutter and beam attenuation. The resulting quality-controlled RWP data were then used to calculate VWS according to Eq. (1) at the appropriate pressure level (700 hPa for stations with elevation <3 km, and 500 hPa for stations with elevation ≥3 km).
2.2.3 ERA5 reanalysis
ERA5, the latest global atmospheric reanalysis produced by the European Centre for Medium-Range Weather Forecasts (ECMWF), was released in 2017 and provides continuous meteorological data from January 1950 to the present (Bell et al., 2021). Generated using a 4-dimensional variational data assimilation system, ERA5 offers comprehensive, high-resolution, and large-scale meteorological fields that are well suited for climatic research, with temporal and spatial resolutions of up to 1 h and 0.25°×0.25° (approximately 31 km), respectively (Hersbach et al., 2020). ERA5's fine resolution facilitates improved representation of vertical profiles and diurnal variations in key atmospheric variables, particularly over land areas (Dai, 2023). In this study, we use ERA5 data for 2024 to examine the impacts of LTS and specific humidity on CVS. For this purpose, hourly 2 m air temperature (T2 m), atmospheric temperature at the 700 hPa level (T700 hpa) and at the 500 hPa level (T500 hpa), 2 m dewpoint temperature (Td,2 m), and surface pressure (psfc) are extracted for all 80 selected MMCR stations. The 2 m specific humidity (q2 m) is calculated from Td,2 m and psfc using standard psychrometric formulas. Because q2 m is defined at 2 m above the surface, it inherently follows the topography, making it a physically consistent measure of low-level moisture across all terrain heights, including the Tibetan Plateau.
To quantify the thermal stratification of the lower troposphere, the traditional LTS definition (, Wood and Bretherton, 2006), is inapplicable over high terrain because the 1000 hPa surface lies underground, making θ1000 hpa undefined. Similar to the terrain-following criterion for calculating VWS, we propose a unified and terrain-following definition:
where θlev (θ700 hpa or θ500 hpa) is the potential temperature at 700 or 500 hPa, chosen such that the pressure level remains above the surface, calculating from the temperature and pressure at that level using the standard potential temperature equation, and θsfc denotes the surface potential temperature, which is also derived from T2 m and psfc of ERA5 reanalysis using the standard potential temperature equation. The standard potential temperature equation is as follows,
where R is the specific gas constant for dry air and Cp is the specific heat capacity at constant pressure. For low-elevation stations where plev is the 700 hPa level or 500 hPa or surface pressure. Over low terrain, this definition closely approximates the traditional LTS (θ700 hpa−θsfc). Over high terrain, adopting the 500 hPa level as the reference keeps the analysis physically meaningful and ensures consistency across all stations.
A spatial scale mismatch inevitably exists between the gridded ERA5 fields (∼ 31 km) and the point-based MMCR observations, which may introduce uncertainties over complex terrain and regions with strong surface heterogeneity. To evaluate the sensitivity of our results to this mismatch, we repeated the key correlation analyses using ERA5-Land (0.1°×0.1°, ∼ 9 km), which better resolves near-surface variability. The comparison (Fig. S5 in the Supplement) shows that the correlation signs, spatial patterns, and magnitudes are highly consistent between the two products, confirming that our conclusions are not sensitive to the specific grid resolution. While some local-scale uncertainty is inherent in any point-to-grid comparison, the consistent spatial patterns across diverse climatic and topographic settings indicate that the identified relationships reflect robust large-scale physical mechanisms. The procedure for temporally aggregating the MMCR observations and matching them with ERA5 is described in Sect. 2.3.
2.3 CVS retrieval methods based on MMCR data
MMCR identifies cloud boundaries by detecting radar backscatter from hydrometeors, including liquid droplets and ice crystals within clouds. However, due to its short operating wavelength, MMCR is also sensitive to non-meteorological echoes, such as near-surface dust, insect swarms, and atmospheric turbulence, as well as random noise arising from instrumental instabilities and signal processing artifacts (Ulaby et al., 1981). These interfering signals can degrade the reliability of cloud boundary detection and introduce biases in retrieved CVS.
In the literature, the reflectivity threshold method is a widely used approach for distinguishing cloud signals from background noise and clutter using a fixed reflectivity cutoff. Based on the operational characteristics of MMCR, Clothiaux et al. (1999) reported that radar reflectivity (Z) for cirrus, stratus, and precipitating clouds typically ranges from −50 to 20 dBZ. Consequently, many previous studies have adopted a constant minimum threshold of approximately −40 dBZ for cloud detection (e.g., Zhang et al., 2019; Chen et al., 2022; Fang et al., 2023). However, the fixed threshold neglects the height-dependent sensitivity of radar measurements. Because radar detectability decreases with range, weak high-altitude cloud signals may fall below a constant threshold, while near-surface clutter may be misclassified as clouds. Such biases can lead to inaccurate estimates of cloud occurrence and vertical structure.
To address these limitations, this study introduces an improved CVS retrieval technique that integrates (1) theoretical radar sensitivity curves accounting for height-dependent detection capability and (2) a variance-based clutter suppression method adapted from Kalapureddy et al. (2018). By combining physically constrained sensitivity thresholds with statistical filtering of reflectivity variability, this approach enhances cloud detection robustness across different altitudes and cloud regimes.
The retrieval procedure consists of the following steps:
First, a height-dependent noise-equivalent reflectivity (NER) threshold curve (denoted as Zth(j)) is established to replace the fixed threshold. This curve is tailored to typical atmospheric conditions over China and defined as:
where j represents the vertical range bin index (or corresponding height level). This formulation accounts for the progressive reduction in radar sensitivity with increasing height.
For a given time t, the measured reflectivity Z(j,t) at height level j is classified as a potential cloud signal if:
Otherwise, the signal is classified as noise. This step generates a preliminary binary indicator I(j,t) , where I=1 denotes potential cloud signals and I=0 denotes noise. The resulting non-noise layers provide the initial candidates for cloud detection while removing the majority of random noise.
To further refine the non-noise regions, contiguous segments where are identified as candidate cloud-containing layers. Although the NER threshold removes most random noise, residual non-meteorological clutter may remain. To further distinguish true cloud signals from clutter, a variance-based method is applied within the identified non-noise layers. This method exploits the physical property that cloud hydrometeors are generally more spatially homogeneous and temporally coherent than clutter sources (Kalapureddy et al., 2018). As a result, the temporal variability of reflectivity within cloud-dominated layers is typically lower than that within clutter-contaminated layers.
A 3 min sliding time window is applied at each height level within the non-noise layers. Within each window, the standard deviation of reflectivity across consecutive profiles is calculated, forming a variability sequence Ai. The mean (μ) and standard deviation (σ) of this sequence are then calculated as:
A dual-threshold criterion is applied to identify moist (cloud) layers: if μ<2.0 dBZ, and σ<1.0 dBZ. If both conditions are satisfied, the signal at that height is identified as part of a moist layer. The base and top height levels of moist (cloud) layers are determined by identifying vertically contiguous bins meeting this criterion. Otherwise, the segment is filtered out as clutter.
Finally, the cloud detection step is conducted to retrieve the CBH and CTH of each identified cloud layer by verifying the radar reflectivity within previously detected moist layers. This step yields the final CVS. Specifically, any candidate moist layer with a maximum reflectivity lower than −20 dBZ is excluded, as such weak backscatter signals are unlikely to represent physically meaningful cloud layers and may instead reflect residual noise or sub-detection-limit echoes. This reflectivity threshold is selected to balance sensitivity to thin non-precipitating clouds and robustness against noise contamination.
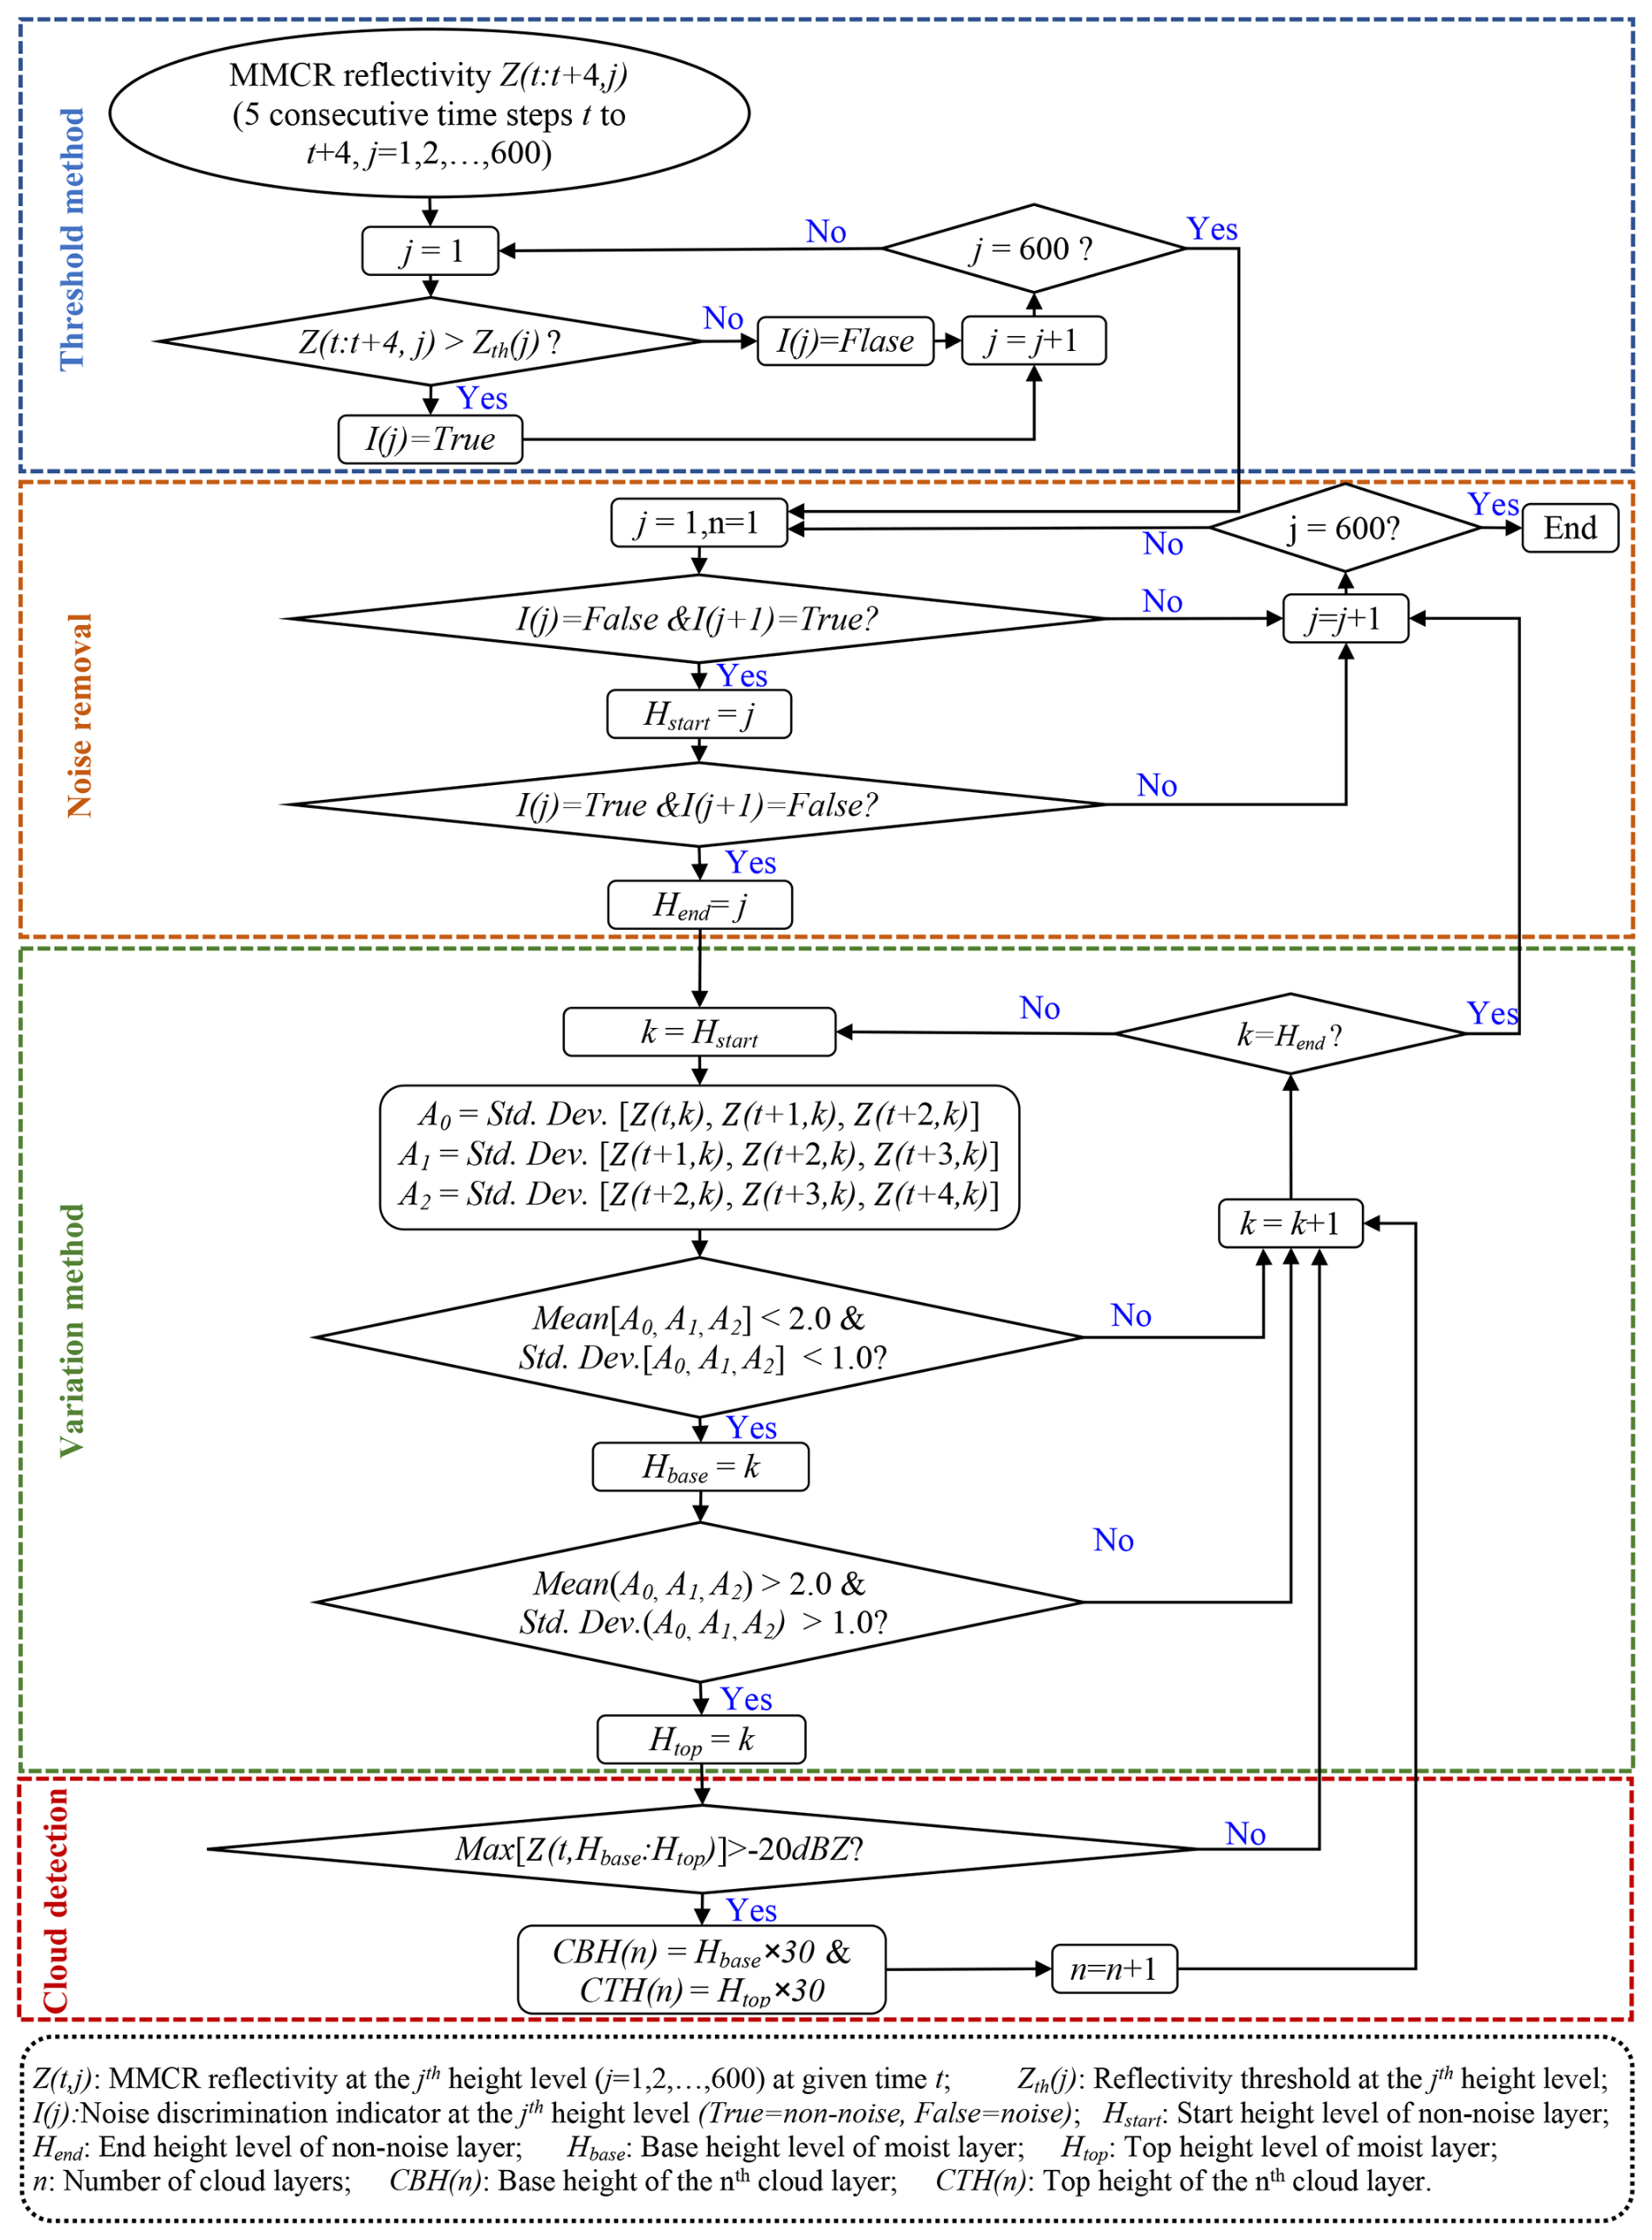
Figure 2Flowchart for identifying the cloud vertical structure (CVS) from high-temporal-resolution MMCR measurements. This flowchart comprises four sequential key steps in the CVS retrieval process: first, the threshold method involves comparing the MMCR reflectivity against the height-dependent threshold Zth(j) to generate the noise discrimination indicator I(j), which distinguishes non-noise and noise layers; subsequently, the noise removal step identifies the start (Hstart) and end (Hend) height levels of non-noise layers based on the indicator I(j); then, the variation method determines the base (Hbase) and top (Htop) height levels of moist layers by calculating the statistical variation (including standard deviation and mean) of reflectivity within the identified non-noise layers; finally, the cloud detection step retrieves the base height (CBH(n)) and top height (CTH(n)) of each cloud layer by verifying the reflectivity magnitude of the moist layers, thereby yielding the final cloud vertical structure.
Given the high temporal resolution (1 min) of the MMCR observations, loosely connected cloud elements may occasionally be misidentified as multiple discrete layers. To reduce artificial layer fragmentation, an additional quality-control procedure is applied to the initially detected cloud boundaries. For each identified cloud layer, both its geometric thickness and the vertical separation distance to adjacent layers are calculated. If a cloud layer is thinner than 7 range bins (equivalent to 210 m at the 30 m vertical resolution of the MMCR), the following criteria are applied:
-
If the separation distance to the nearest adjacent cloud layer exceeds 24 range bins (720 m), the thin layer is considered isolated and is discarded.
-
If the separation distance is less than or equal to 24 range bins, the thin layer is merged with the nearest adjacent cloud layer.
This procedure reduces spurious detections while preserving physically coherent multi-layer structures. The complete CVS retrieval workflow is illustrated in the flowchart (Fig. 2). The algorithm is capable of detecting cloud layers across a wide range of altitudes and configurations. An example case demonstrating the robustness of the retrieval under complex vertical conditions is provided in Fig. S1.
To evaluate the performance of our improved retrieval algorithm for various cloud categories (including low-level thin cloud, mid-level thin cloud, high-level thick cloud, multi-layer cloud, and deep precipitating cloud), we conducted case-based validation against collocated radiosonde observations (Fig. S2). Comparisons reveal good agreement between radar-retrieved cloud boundaries and cloud limits derived from radiosonde profiles processed following the algorithm proposed by Xu et al. (2023). Vertical discrepancies of CBH and CTH are nearly negligible for thin low-level and mid-level clouds, constrained within 0.5 km for thick high-level clouds, and limited to 1 km for precipitating cloud systems.
With validated cloud boundaries in hand, we then prepared the data for correlation analysis. To ensure spatiotemporal consistency between the MMCR retrievals and ERA5 reanalysis, the 1 min MMCR observations were first aggregated into hourly means of CBH, CTH, and CT. For each station, ERA5 meteorological variables were extracted at the corresponding UTC hour from the nearest grid point. All correlation and joint dependence analyses were subsequently conducted on these fully synchronized, spatiotemporally matched hourly paired datasets.
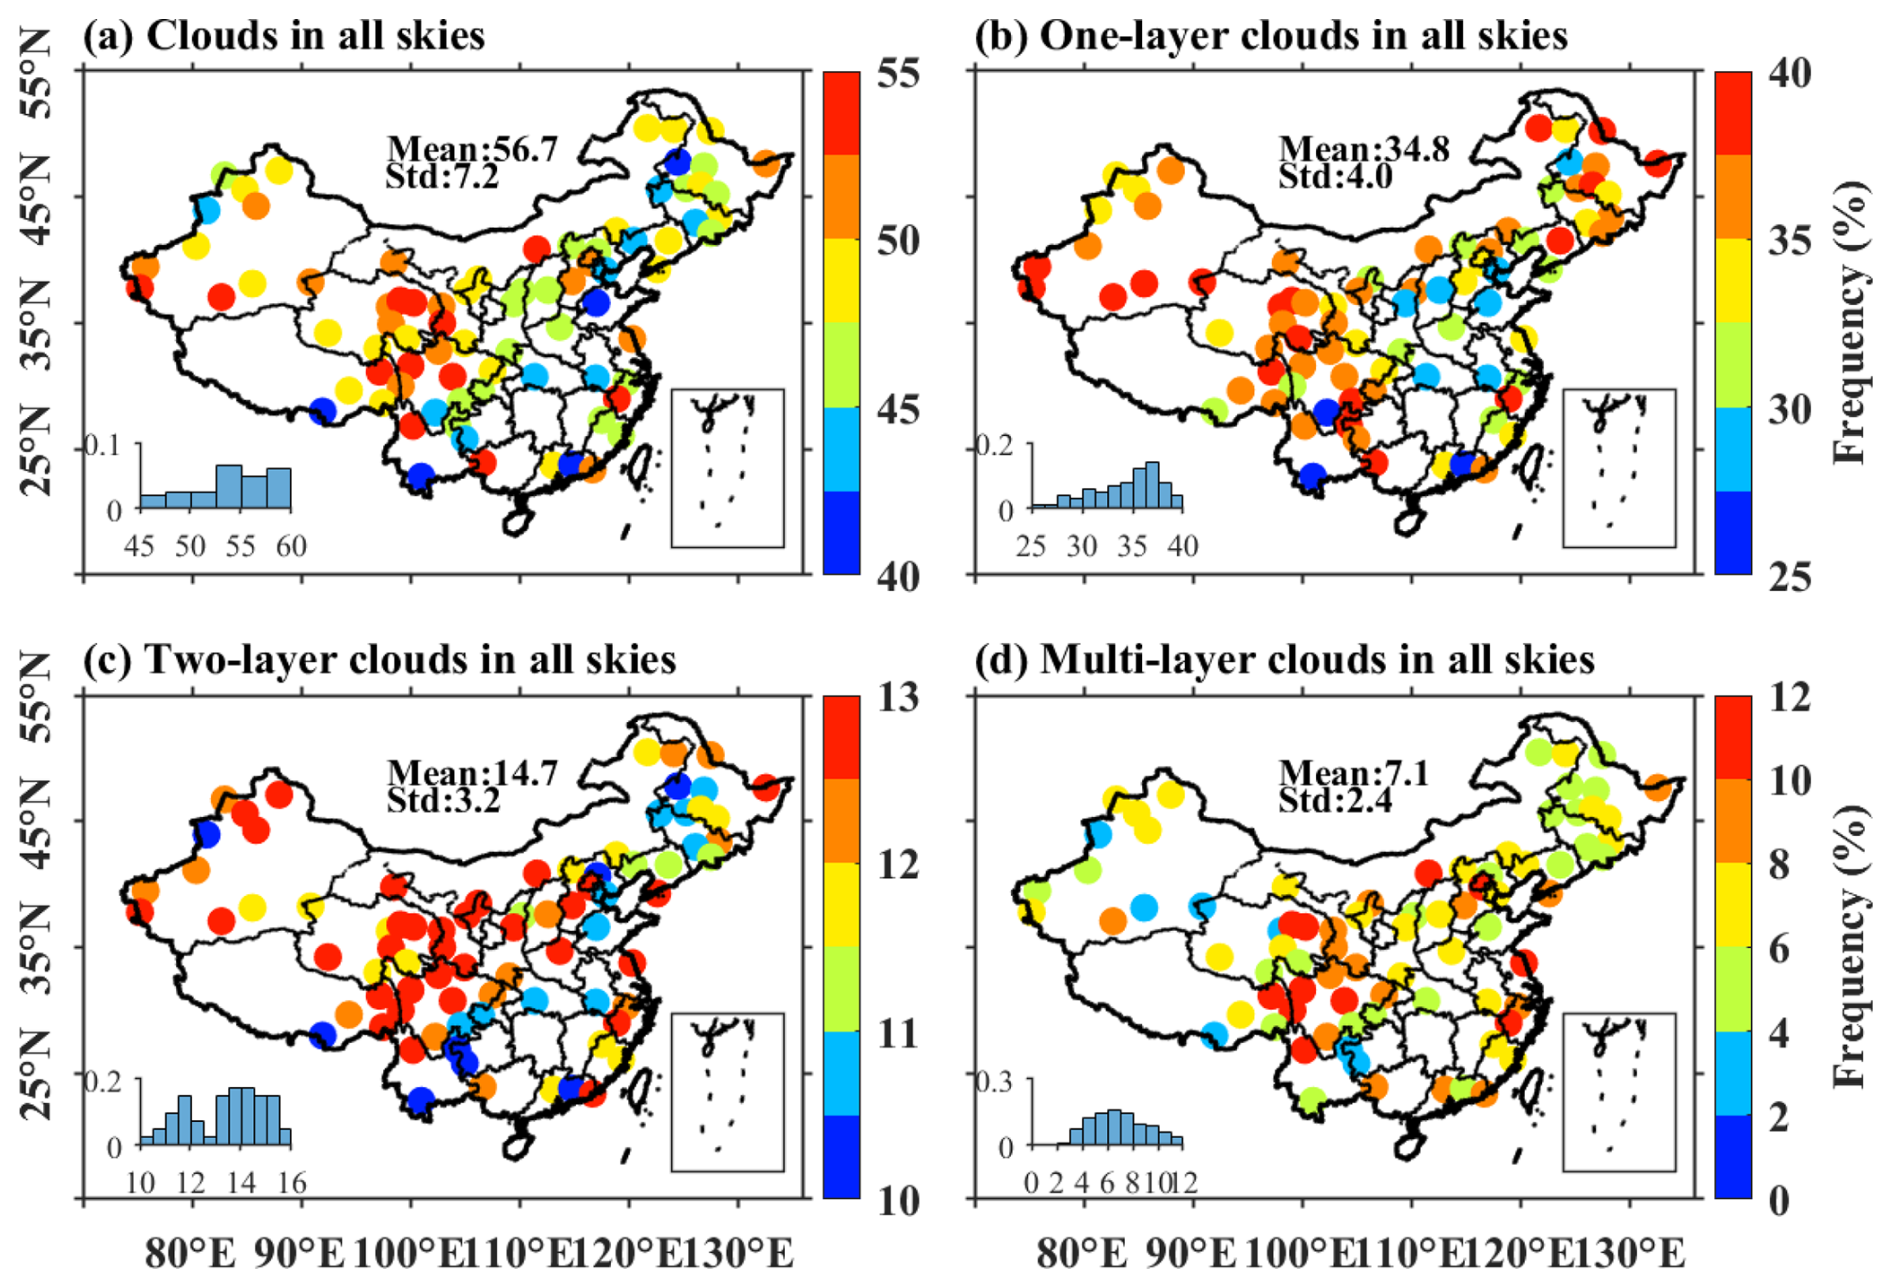
Figure 3Spatial distribution of annual mean cloud occurrence frequency for different cloud layering classifications: (a) all clouds, (b) single-layer clouds, (c) two-layer clouds, and (d) multi-layer clouds (three-, four-, and five-layer clouds) under all-sky conditions in 2024. The data is derived from the 80 MMCR stations presented in Fig. 1. Notably, the color bars are scaled independently across panels to improve visual clarity. In addition, each panel shows the histograms depicting the probability distributions of cloud occurrence frequencies, with the corresponding mean values and standard deviations also presented for each distribution.
This section presents the spatial, vertical, seasonal, and diurnal characteristics of cloud vertical structure across China, followed by an analysis of the thermodynamic, dynamical, and land-surface controls governing cloud development. Unless otherwise specified, statistics are derived from all valid MMCR observations in 2024 across the 80 selected stations.
3.1 Spatial distribution of cloud layer occurrence frequency
Figure 3 presents the spatial patterns of annual mean occurrence frequency under all-sky conditions across China in 2024, including total cloud occurrence and clouds categorized by vertical layer number (single-layer, two-layer, and multi-layer clouds; multi-layer clouds are defined as systems containing three to five cloud layers). The national mean total cloud occurrence is 56.7 ± 7.2 %, with individual station values ranging from 40 % to 70 % (Fig. 3a). This value is slightly lower than the long-term mean cloud fraction of approximately 61 % derived from MODIS observations during 2003–2018 (Zhao et al., 2019). Two factors may contribute to this disparity. First, the two quantities are not directly equivalent: MMCRs measure point-scale temporal cloud occurrence, whereas MODIS reports grid-averaged areal cloud fraction, and this fundamental difference warrants caution in quantitative comparisons. Second, the documented declining trend in cloud cover over East Asia (Zhou et al., 2022) may account for part of the offset, given that our 2024 observations represent a more recent period than the MODIS climatology. The relative contribution of this trend, however, cannot be isolated from the inherent observational differences. The probability density function (PDF) of total cloud occurrence frequency exhibits a non-uniform distribution, with high probabilities concentrated toward the upper end of the frequency range. Roughly 82 % of observed stations show total cloud frequencies above 50 %, demonstrating that cloudy conditions prevail across the majority of the MMCR network.
When classified by vertical cloud structures (Fig. 3b–d), occurrence frequencies range from 25 % to 40 % for single-layer clouds, 10 % to 16 % for two-layer clouds, and 1 % to 12 % for multi-layer clouds. The PDF of single-layer clouds displays a relatively continuous distribution with a prominent peak at higher occurrence frequencies. In contrast, the PDF for two-layer clouds exhibits a more discontinuous pattern, with probability mass concentrated within the high-frequency range. National average occurrence frequencies decrease systematically with increasing layer number, with mean values of 34.8 ± 4.0 % for single-layer clouds, 14.7 ± 3.2 % for two-layer clouds, and 7.1 ± 2.4 % for multi-layer clouds. These statistics indicate that single-layer clouds constitute the dominant vertical structure over China, accounting for approximately 62 % of all cloudy occurrences.
Spatially, the highest total occurrence frequencies are concentrated over the southeastern Tibetan Plateau and the Sichuan Basin (Fig. 3a). Notably, stations with the most prominent total cloud frequency signals are concentrated within this topographically complex region, where the peak cloud occurrence across all observation sites emerges. In contrast, stations distributed across northwest China display highly variable total cloud occurrence levels, covering a wide spectrum from low to moderately high frequencies. Multiple monitoring sites in inland northwest China exhibit cloud occurrence levels comparable to the average cloudiness found across southeastern cloud-abundant zones. This spatial pattern agrees with previous satellite-based studies (e.g., Pan et al., 2015; Yin et al., 2015) and is plausibly linked to topographic lifting and enhanced moisture convergence associated with complex terrain. However, the spatial contrast between northwestern and southeastern China observed by MMCRs differs somewhat from satellite-derived cloud fraction patterns. In particular, point-based MMCR observations indicate relatively higher total cloud occurrence frequencies at some stations in northwestern China. This apparent discrepancy likely stems from the fundamental distinction between the two observing approaches as mentioned above, and direct quantitative comparisons between the spatial patterns derived from the two platforms should be interpreted with appropriate caution.
Single-layer clouds occur more frequently in northwestern China relative to southeastern regions (Fig. 3b), with the most substantial regional disparities in single-layer cloud frequency concentrated over arid inland basins and the Inner Mongolian Plateau. Multi-layer clouds show an opposite spatial tendency: their occurrence is consistently more prevalent throughout southeastern China than across inland northwestern areas (Fig. 3d). This regional divergence likely reflects differences in moisture availability and atmospheric instability. Southeastern China, influenced by abundant water vapor transport and intense solar heating, both of which favor deep convection and the development of vertically complex, multi-layered cloud system (Chi et al., 2022). By comparison, dry, stable boundary-layer conditions in northwestern China suppress vertical motion and cloud development, leading to single-layer clouds dominant (Chen et al., 2019).
Two-layer cloud occurrence lacks a clear east-west or north-south spatial gradient nationwide (Fig. 3c), with only mild regional disparities in average occurrence separating southeastern and northwestern monitoring domains. This uniform distribution indicates two-layer clouds act as an intermediate transitional state between two dominant cloud regimes, and indicating that the transition from single-layer to multi-layer cloud systems cannot be described by a simple additive relationship. We separate two-layer from multi-layer clouds (≥ 3 layers) because they exhibit distinct spatial patterns and formation mechanisms. Two-layer clouds lack a clear regional preference in both a previous global radiosonde study (Xu et al., 2023) and the present MMCR observations (Fig. 3c, d), confirming their transitional nature. Physically, two-layer clouds often result from boundary-layer decoupling (Bretherton and Wyant, 1997), whereas multi-layer clouds are more typical of organized deep convection or frontal systems. Merging these categories would conflate dynamically distinct cloud populations.
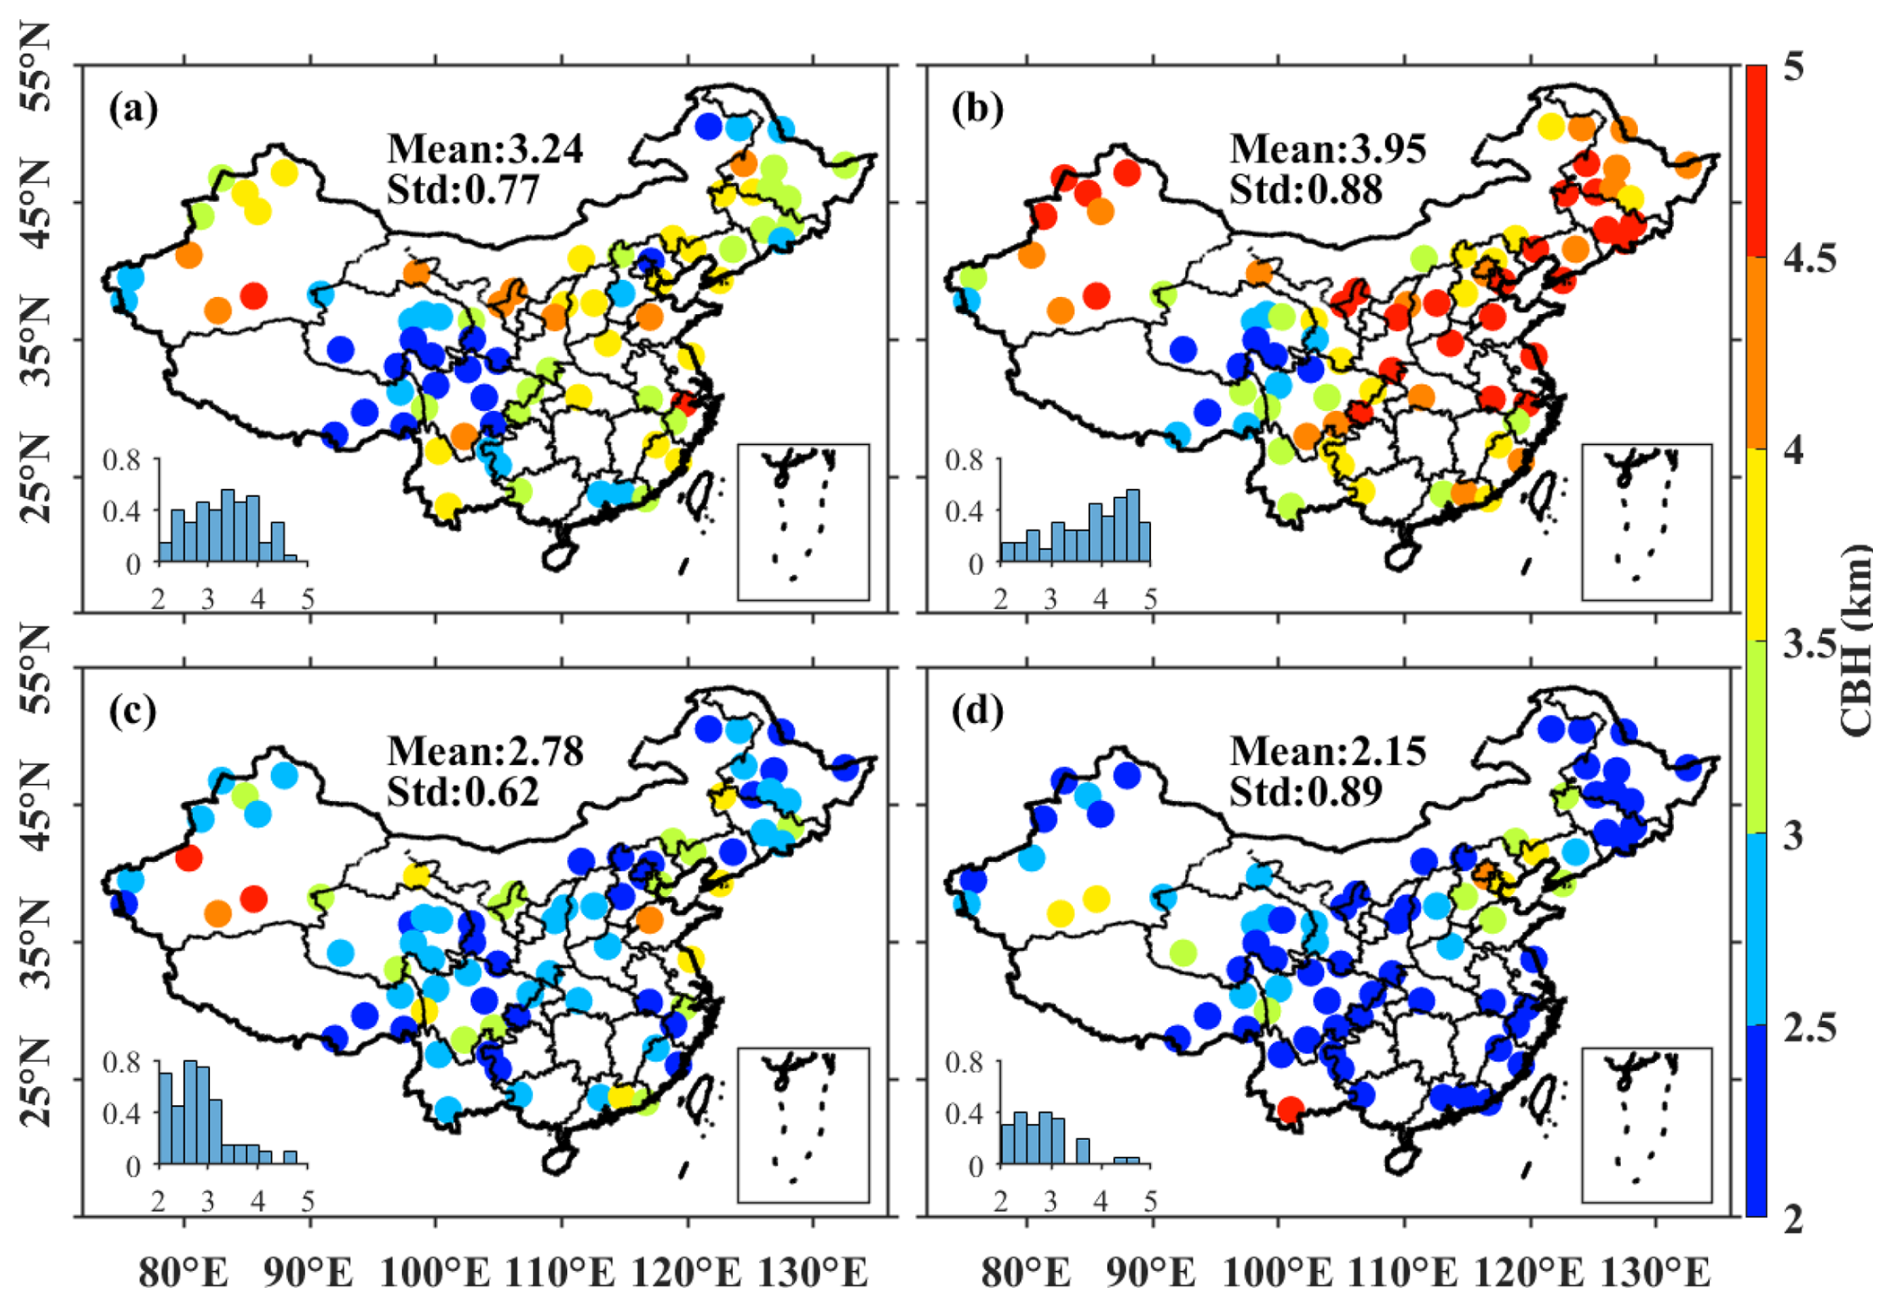
Figure 4Seasonal geographic distribution of cloud base height (CBH) over China in 2024, derived from the 80 MMCR stations of the same network referenced in Fig. 1. The four panels correspond to (a) spring (March–April–May), (b) summer (June–July–August), (c) autumn (September–October–November), and (d) winter (December–January–February). Note that each panel presents a histogram illustrating the probability distribution of cloud occurrence frequency, with the corresponding mean value and standard deviation provided for each distribution.
3.2 Horizontal distribution of cloud height
CBH, CTH, and CT are fundamental descriptors of cloud vertical structure. Among these, CBH is particularly critical because of its role in modulating surface radiation and turbulent energy exchange, and because it serves as a key link between surface–atmosphere interactions and cloud formation. Dynamically, it influences the initiation and evolution of convective precipitation in numerical weather prediction models (Haliczer et al., 2025). Radiatively, it serves as a key variable for surface energy budget assessment: the cloud radiative effect at the surface decreases with increasing CBH at a rate of approximately 4–5 W m−2 per km at mid-latitude sites (Viúdez-Mora et al., 2015). Even modest uncertainties in CBH can produce substantial radiative biases – an uncertainty of 100 hPa in mid-level cloud base pressure can cause errors of at least 10 W m−2 in surface net longwave radiation (Fung et al., 1984), and smaller variations at lower levels can yield even larger uncertainties. Accurate CBH observations are therefore essential for quantifying cloud feedbacks in a changing climate (Zelinka and Hartmann, 2010; Costa-Surós et al., 2013). Accurate characterization of CBH is therefore essential for both regional weather forecasting and climate change assessments (e.g., Stephens et al., 2012; Mülmenstädt et al., 2018; An et al., 2019).
Figure 4 presents the horizontal distribution of seasonal mean CBH across China in 2024. CBH exhibits pronounced seasonal variability. In summer, CBH is generally elevated, with 84 % of stations exceeding 3 km and approximately 10 % reaching values up to 5 km (Fig. 4b). Spring (Fig. 4a) displays a similar spatial distribution but with lower magnitudes, with most CBH values (67 %) concentrated between 2.5 and 4 km. In contrast, autumn and winter (Fig. 4c–d) are characterized by substantially lower CBH, predominantly within the 2–3 km range, and only a small fraction of stations exceeding 4 km. The seasonal mean CBH follows the order: summer (3.95 ± 0.88 km) > spring (3.24 ± 0.77 km) > autumn (2.78 ± 0.62 km) > winter (2.15 ± 0.89 km). This seasonal progression is consistent with previous studies (e.g., Zhang et al., 2018; Chi et al., 2022; Xu et al., 2023) and reflects the strong modulation of cloud formation by radiative forcing and boundary-layer dynamics. Enhanced solar heating in summer deepens the PBL and promotes stronger turbulent mixing, favoring higher cloud bases. In contrast, reduced insolation and increased static stability in winter suppress boundary-layer growth, resulting in lower CBH (Zhang et al., 2018).
Spatially, elevated summer CBHs (> 3 km) dominate much of eastern China. While the East Asian summer monsoon enhances moisture transport from the Pacific (Ding and Chan, 2005; Li et al., 2016), increased surface heating and boundary-layer development over land can elevate condensation levels despite enhanced humidity. This highlights the competing influences of moisture supply and boundary-layer dynamics on CBH.
Over the Tibetan Plateau, CBH is distinctly lower (approximately 2.5 km above ground level) during spring and summer compared with surrounding regions. This regional feature reflects unique thermodynamic conditions associated with high elevation. Although strong surface heating enhances buoyancy and deepens the PBL, lower ambient temperatures reduce the lifting condensation level (LCL) for a given near-surface relative humidity, facilitating the frequent formation of low-level clouds (Wang et al., 2020). The combined effects of terrain-induced lifting, enhanced vertical moisture transport, and lower LCL contribute to the relatively low CBH over the Plateau.
CTH exhibits similar seasonal variability (Fig. S3), with mean values of 7.51 ± 1.00 km in summer, 6.37 ± 0.93 km in spring, 5.70 ± 0.71 km in autumn, and 4.70 ± 1.33 km in winter. As shown in Fig. S3, summer CTH exceeds 8 km over much of eastern China (especially in the south) but remains below 6 km over the Tibetan Plateau. However, this east–west contrast diminishes in winter, when CTH is low (generally 3–5 km) across most of the country. The higher summer CTH reflects enhanced convective instability and stronger vertical development, whereas wintertime stability limits cloud growth largely to the lower troposphere. Regionally, CTH over the Tibetan Plateau is systematically lower than over eastern China in summer. This finding is consistent with Chen et al. (2017), who reported that deep convective clouds over the Plateau are approximately 20 %–30 % thinner than those over eastern China, and with Luo et al. (2011), who noted that convection over the Plateau is generally shallower and less frequent. The reduced vertical extent may be related to weaker large-scale dynamical forcing and frequent weak upward motion over the Plateau (Chen et al., 2017).
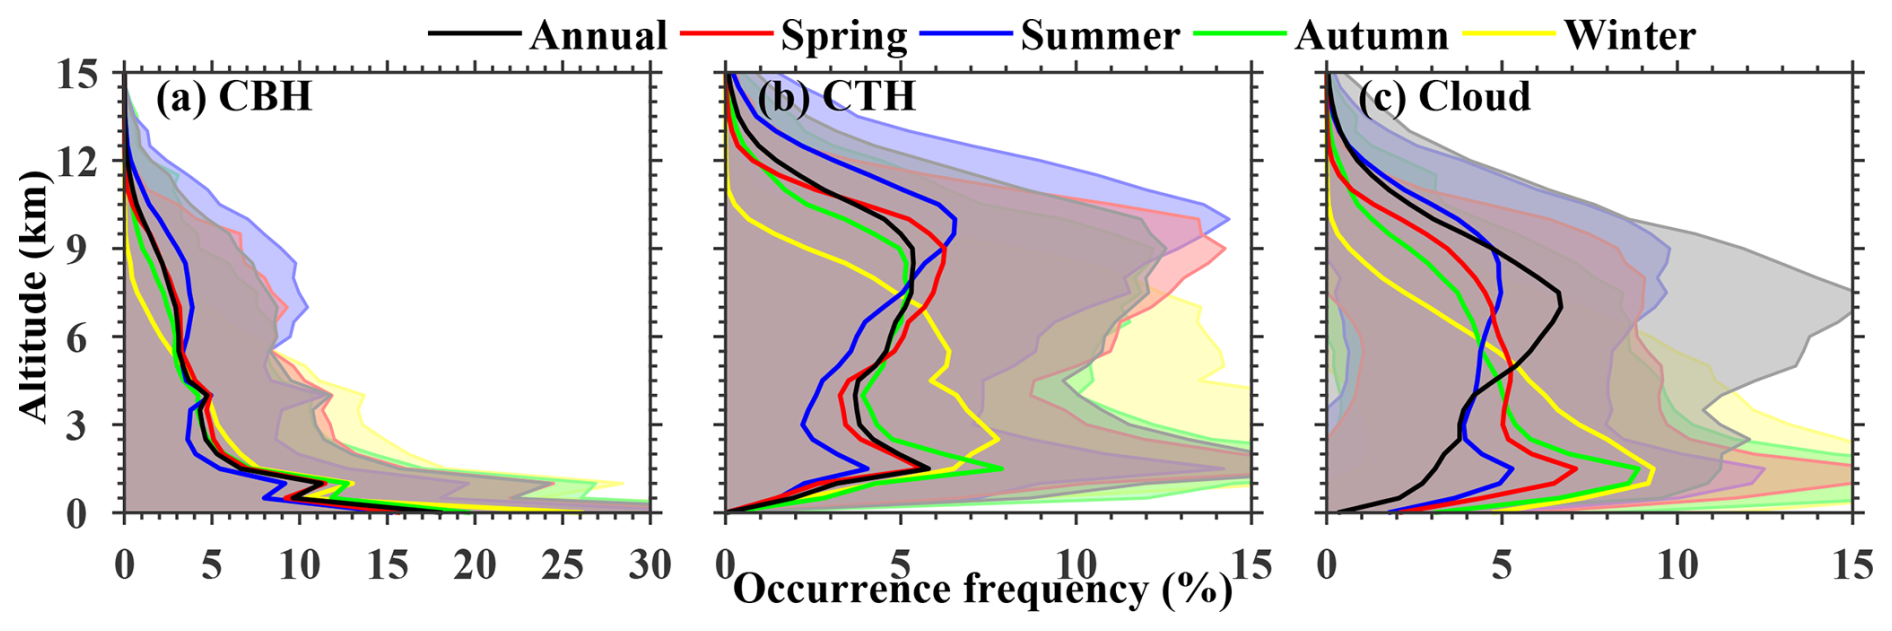
Figure 5Vertical distributions of annual and seasonal mean occurrence frequencies of (a) CBH and (b) cloud top height (CTH), and (c) overall cloud occurrence across China in 2024. The annual mean is plotted in black, while seasonal means for spring, summer, autumn, and winter are shown in red, blue, green, and yellow, respectively. Data samples are binned at a vertical resolution of 200 m. At each altitude, cloud occurrence frequency is defined as the ratio of cloudy samples at that altitude to the total number of cloudy samples across all altitudes. Solid lines denote mean values, and shaded areas represent the corresponding standard deviations.
CT follows a seasonal cycle similar to that of CTH, with mean values of 3.56 ± 0.72 km in summer, 3.13 ± 0.49 km in spring, 2.93 ± 0.47 km in autumn, and 2.56 ± 0.72 km in winter (Fig. S4). In summer, the thickest clouds (∼ 4 km) occur over southern China and the eastern Tibetan Plateau margins, whereas winter clouds are uniformly thin (∼ 2 km) across the country. The spatial pattern of CT largely follows that of CTH, indicating that thicker clouds are primarily associated with higher cloud tops rather than lower bases. The larger CT during summer reflects the combined effects of enhanced instability, deeper convective development, and increased moisture availability, while the thinner winter clouds are consistent with suppressed vertical growth under stable atmospheric stratification.
3.3 Vertical distribution of cloud
Figure 5 presents the annual and seasonal mean vertical occurrence frequencies of CBH, CTH, and the combined cloud vertical profiles across China in 2024. These profiles provide insights into the climatological structures of clouds and the mechanisms governing their seasonal variability.
3.3.1 Vertical distribution of CBH
As shown in Fig. 5a, CBH occurrence frequency exhibits a pronounced unimodal distribution, with notable seasonal modulation. Across all seasons, the highest frequencies occur below 1 km, indicating the predominance of low-level cloud bases over continental China. This result is consistent with previous ground-based radar and lidar observations in mid-latitude continental regions, which documented the frequent occurrence of low cloud bases in boundary-layer cloud regimes (e.g., Clothiaux et al., 2000; Wang and Sassen, 2001).
Distinct seasonal contrasts are evident. Above 6 km, CBH frequencies are highest in summer, whereas below 3.0 km, they peak in winter. This seasonal progression is consistent with previous studies (e.g., Zhang et al., 2018; Chi et al., 2022; Xu et al., 2023) and reflects the strong modulation of cloud formation by radiative forcing and boundary-layer dynamics. In summer, enhanced surface heating and abundant moisture supply associated with the East Asian summer monsoon promote deep boundary-layer development and vigorous convection, allowing cloud bases to form at higher altitudes, particularly for convective and high-level cloud systems (Ding and Chan, 2005; Mace et al., 2006). In winter, reduced insolation and colder temperatures lower the LCL and suppress boundary-layer mixing. Moreover, the East Asian winter monsoon advects cold, dry air southward, strengthening static stability and limiting vertical development (Zhang et al., 1997). Under these conditions, condensation frequently occurs within shallow boundary layers, favoring low-base stratiform clouds such as stratus and stratocumulus (Klein and Hartmann, 1993).
3.3.2 Vertical distribution of CTH
In contrast to CBH, the vertical occurrence frequency of CTH exhibits a prominent bimodal distribution, with one peak occurring between 1.0 and 3.0 km and a second peak between 6 and 12 km (Fig. 5b). This bimodal pattern indicates the coexistence of two dominant cloud regimes over China: shallow low-topped clouds and deep convective or high-level cloud systems. The presence of both peaks reflects the diversity of synoptic environments and climatic regimes across the region.
The two modes exhibit distinct seasonal behavior. The high-altitude peak (6–12 km) is most pronounced in summer, particularly above 9 km. This enhancement is consistent with a deeper troposphere, stronger convective instability, and more frequent deep convection during the warm season. Intense surface heating combined with monsoonal moisture transport supports strong updrafts capable of transporting cloud tops into the upper troposphere (Johnson et al., 1999; Holloway and Neelin, 2009). In contrast, the low-altitude peak (1–3 km) dominates in winter, when stable stratification restricts vertical cloud growth and favors shallow stratiform cloud types (Klein and Hartmann, 1993; Wood and Bretherton, 2006).
3.3.3 Combined vertical cloud profiles
The combined vertical distribution derived from CBH and CTH (Fig. 5c) further illustrates seasonal contrasts in overall cloud depth. During summer, clouds occupy a broad vertical range, frequently extending from near the surface to above 9 km. This structure reflects the prevalence of deep convective systems supported by strong surface heating, enhanced instability, and abundant moisture supply (Houze, 2014). In winter, by contrast, cloud occurrence is largely confined below 6 km, and the vertical extent is substantially reduced. This shallow structure is consistent with the dominance of low-level stratiform clouds under cold, dry, and stable atmospheric conditions, where limited vertical mixing suppresses deep convection (Shupe et al., 2011; Pan et al., 2023).
3.4 Diurnal variation of cloud occurrence frequency at different heights
Compared with conventional radiosonde measurements, the MMCR provides much higher temporal resolution (1 min), enabling detailed characterization of the diurnal evolution of cloud vertical structure. Based on the retrieved CVS dataset, Fig. 6 shows the annual mean diurnal variations of height-resolved cloud occurrence frequencies, along with the corresponding annual mean vertical profiles. Cloud occurrence frequencies were calculated at 1 h intervals with a vertical resolution of 30 m, and the time refers to local time (LT).
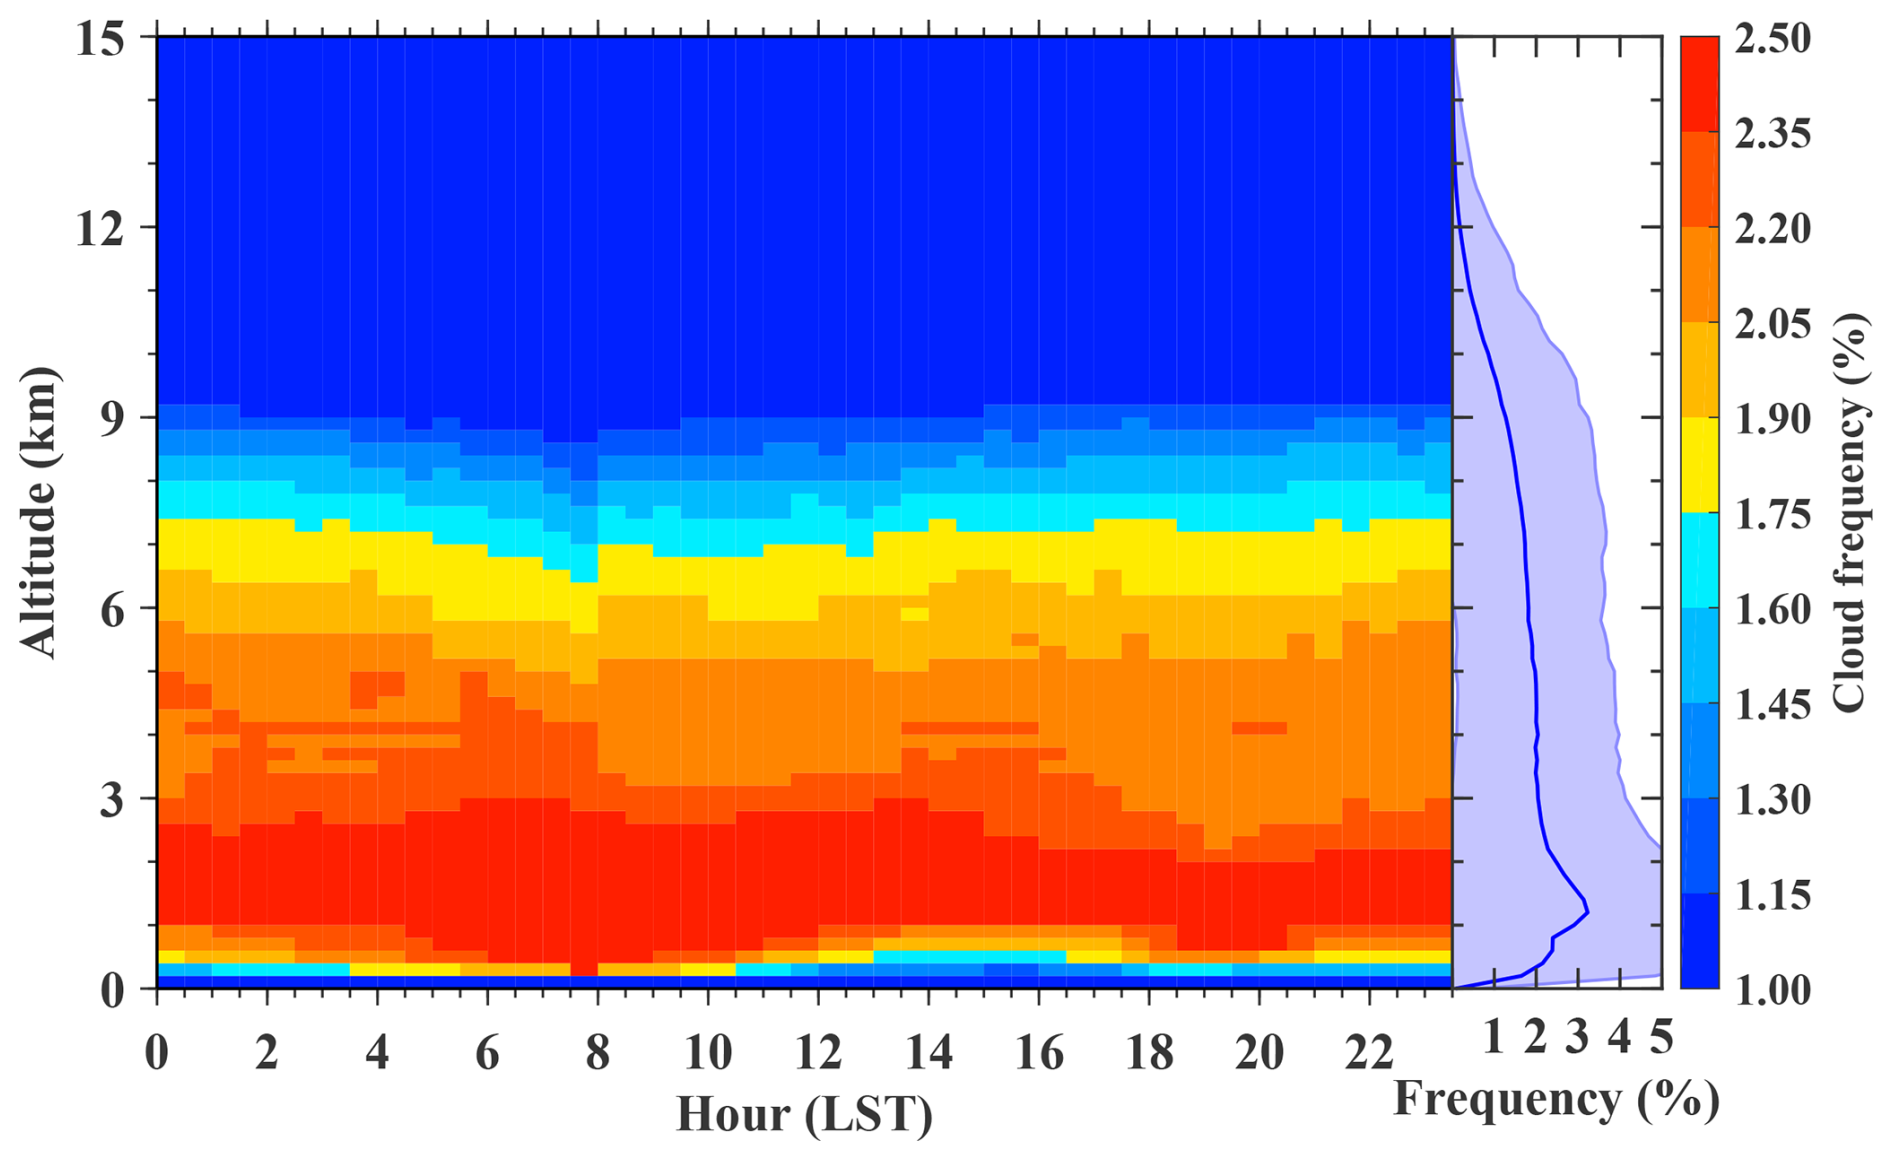
Figure 6Annual mean diurnal cycle of height-resolved cloud occurrence frequency and corresponding vertical profiles derived from measurements at all 80 MMCR stations (Fig. 1) across China in 2024. Data samples are binned at a vertical resolution of 200 m and a temporal resolution of 30 min. Cloud occurrence frequency at a given altitude is defined as the ratio of cloudy samples at that altitude to the total number of cloudy samples across all altitudes. Also presented are the corresponding vertical probability distributions of clouds.
3.4.1 Annual mean diurnal cycle
The annual mean diurnal variability extends primarily from 0.5 to 9 km, with the strongest fluctuations occurring below 3 km (Fig. 6b). Two prominent peaks in cloud occurrence frequency are identified: one in the morning (06:00–08:00 LT) and another in the afternoon (14:00–18:00 LT). These two peaks may be associated with seasonal influences. These peaks reflect the combined influence of nocturnal PBL processes and daytime convective development.
The morning peak is likely associated with nocturnal radiative cooling in the PBL, which enhances relative humidity and promotes the formation of low-level clouds under stable stratification. In contrast, the afternoon maximum corresponds to enhanced surface heating and increased boundary-layer instability, which favour convective cloud development. This diurnal pattern is broadly consistent with previous studies showing early-morning peaks in low cloud occurrence and late-afternoon maxima in convective activity (Li et al., 2008).
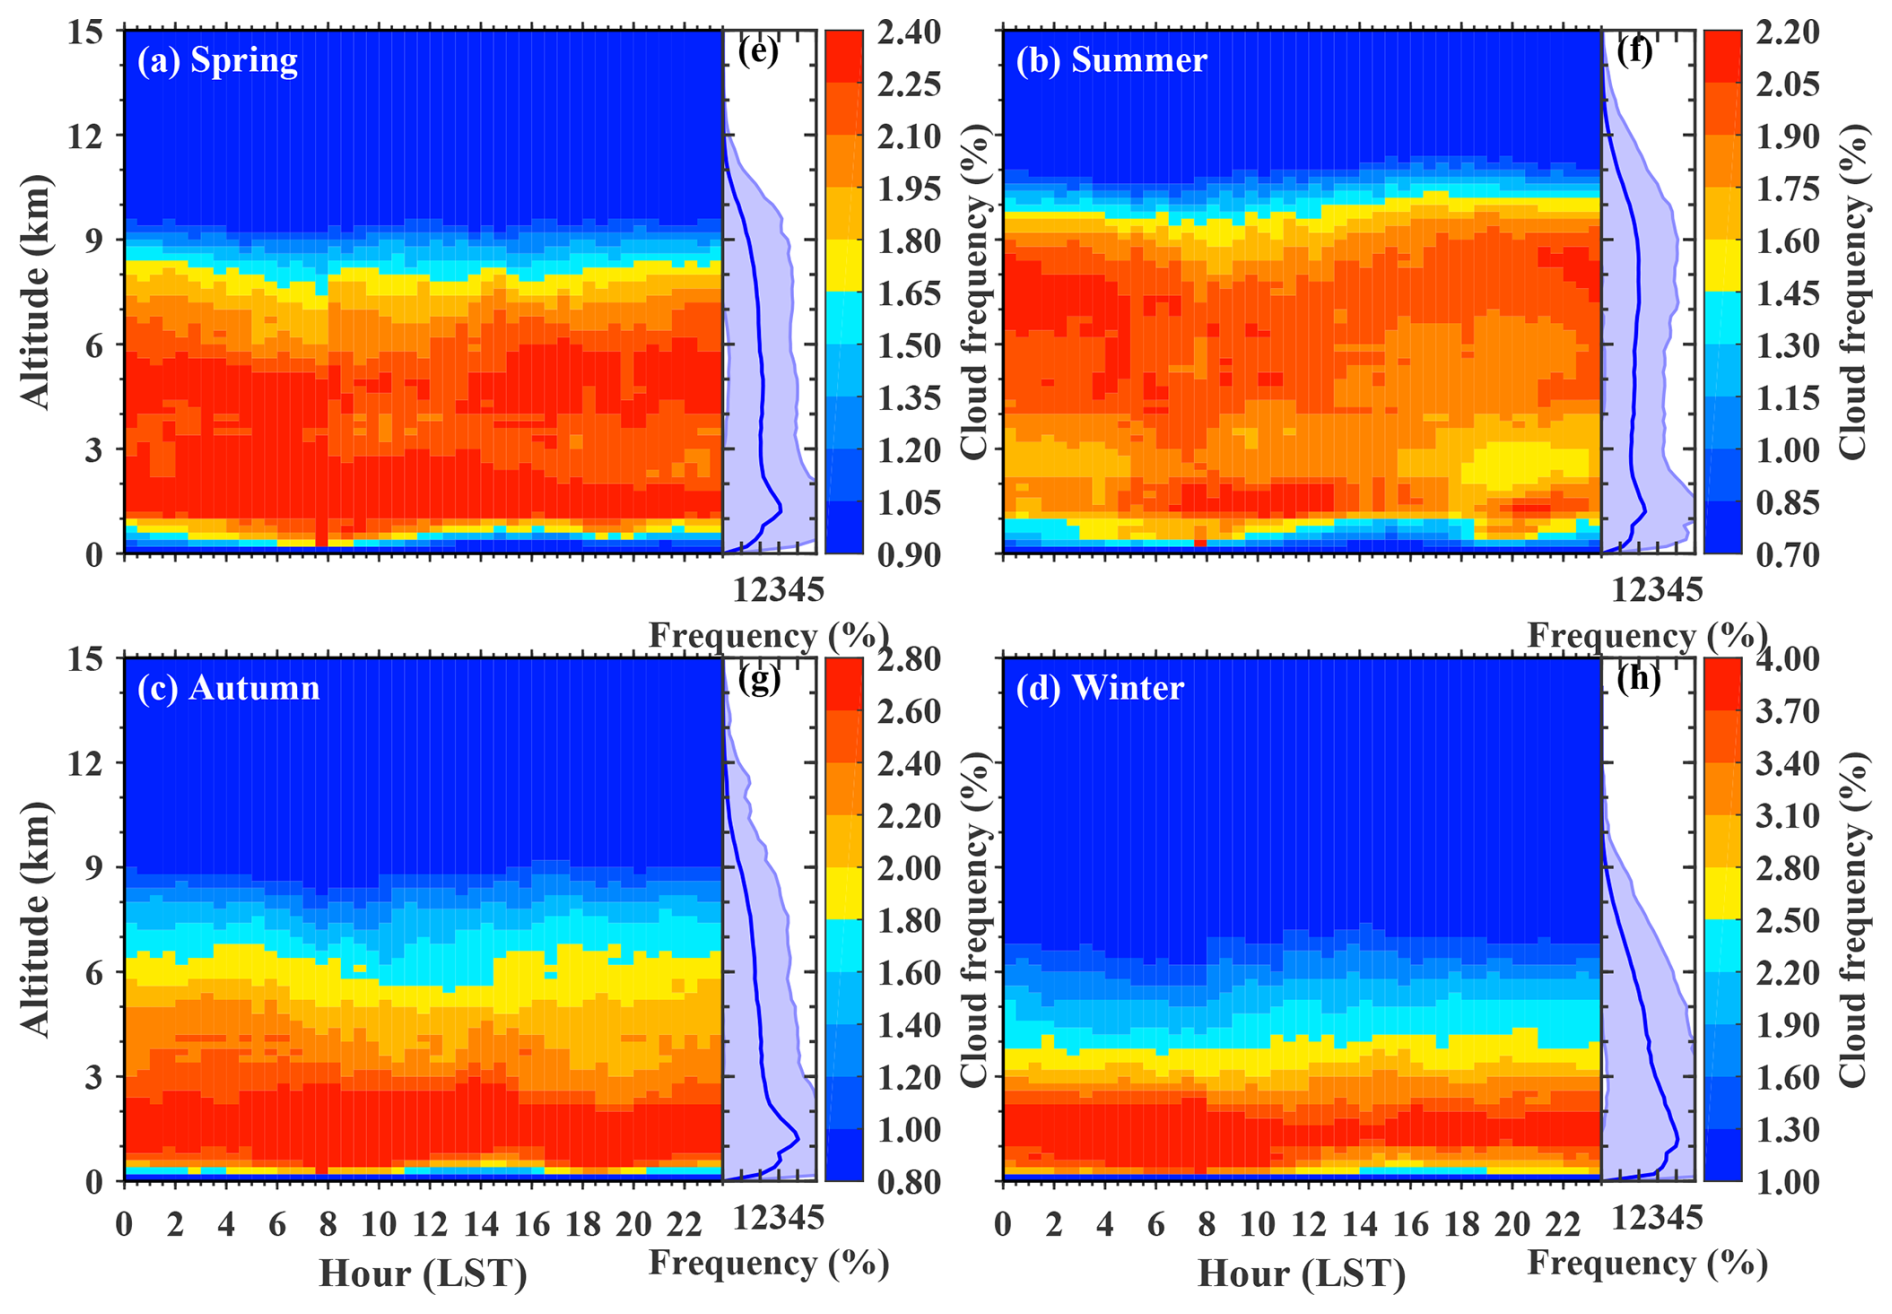
Figure 7Similar to Fig. 6, but for the seasonal mean diurnal cycle of height-resolved cloud occurrence frequency and corresponding vertical profiles over China in (a) spring, (b) summer, (c) autumn, and (d) winter.
3.4.2 Seasonal modulation of the diurnal cycle
Figure 7 further shows seasonal mean diurnal variations in height-resolved cloud occurrence frequencies, along with the corresponding seasonal mean vertical profiles. The amplitude and vertical extent of diurnal variability differ markedly by season.
In summer (Fig. 7b), cloud occurrence variability spans a broad vertical range (approximately 1–10 km), substantially larger than in winter (Fig. 7d). This enhancement likely reflects the combined effects of strong surface heating and the East Asian summer monsoon. Enhanced solar radiation increases near-surface buoyancy and promotes vigorous convection, while monsoonal moisture transport provides the thermodynamic support necessary for deep cloud development. These conditions favour the frequent formation of deep convective clouds and produce pronounced diurnal variability extending into the upper troposphere (Wood, 2012; Houze, 2014).
The summer vertical profile exhibits a distinct two-layer structure. A lower layer (1–2 km) shows relatively weak diurnal variation, while an upper layer (3–9 km) displays a pronounced cycle. Within the upper layer, cloud occurrence reaches a minimum in the early morning (06:00–08:00 LT) and peaks in the late afternoon to early evening (16:00–20:00 LT). This pattern reflects the strong control of solar heating on convective instability: daytime heating destabilizes the planetary boundary layer, initiates moist convection, and drives the formation of cumuliform and deep convective clouds, leading to enhanced cloud occurrence in the afternoon (Betts, 2009; Zhang and Klein, 2013). At night, the absence of solar heating reduces convective turbulence and suppresses vertical moisture transport, thereby weakening upper-level cloud development.
In winter, the diurnal variability of cloud vertical distribution is considerably weaker and largely confined below 3 km. Cloud occurrence is most frequent between 0.5 and 3 km, consistent with the typical altitude range of liquid-phase stratiform clouds (Xu et al., 2023). A near-sunrise maximum (0:600–08:00 LT) is evident, in agreement with previous findings (Betts and Tawfik, 2016). This wintertime enhancement likely results from minimum near-surface air temperatures around sunrise under stable boundary-layer conditions, which increase relative humidity and favour cloud formation (Dai, 2001; Eastman and Warren, 2014).
Spring and autumn exhibit transitional behavior between summer and winter. In spring (Fig. 7a), the vertical range of cloud variability expands relative to winter, with cloud tops occasionally reaching 7–8 km. An afternoon peak in mid-tropospheric cloud occurrence (3–6 km) is evident between 14:00 and 18:00 LT, reflecting strengthening solar heating and increasing convective instability. In autumn (Fig. 7c), cloud tops gradually lower and the diurnal amplitude weakens. Cloud occurrence becomes more evenly distributed throughout the day, particularly below 3 km, as solar radiation declines and atmospheric stratification strengthens. Overall, these transitional seasons illustrate the progressive adjustment of the cloud diurnal cycle to evolving surface heating and large-scale circulation, broadly consistent with the seasonal evolution documented over China (Yu et al., 2001).
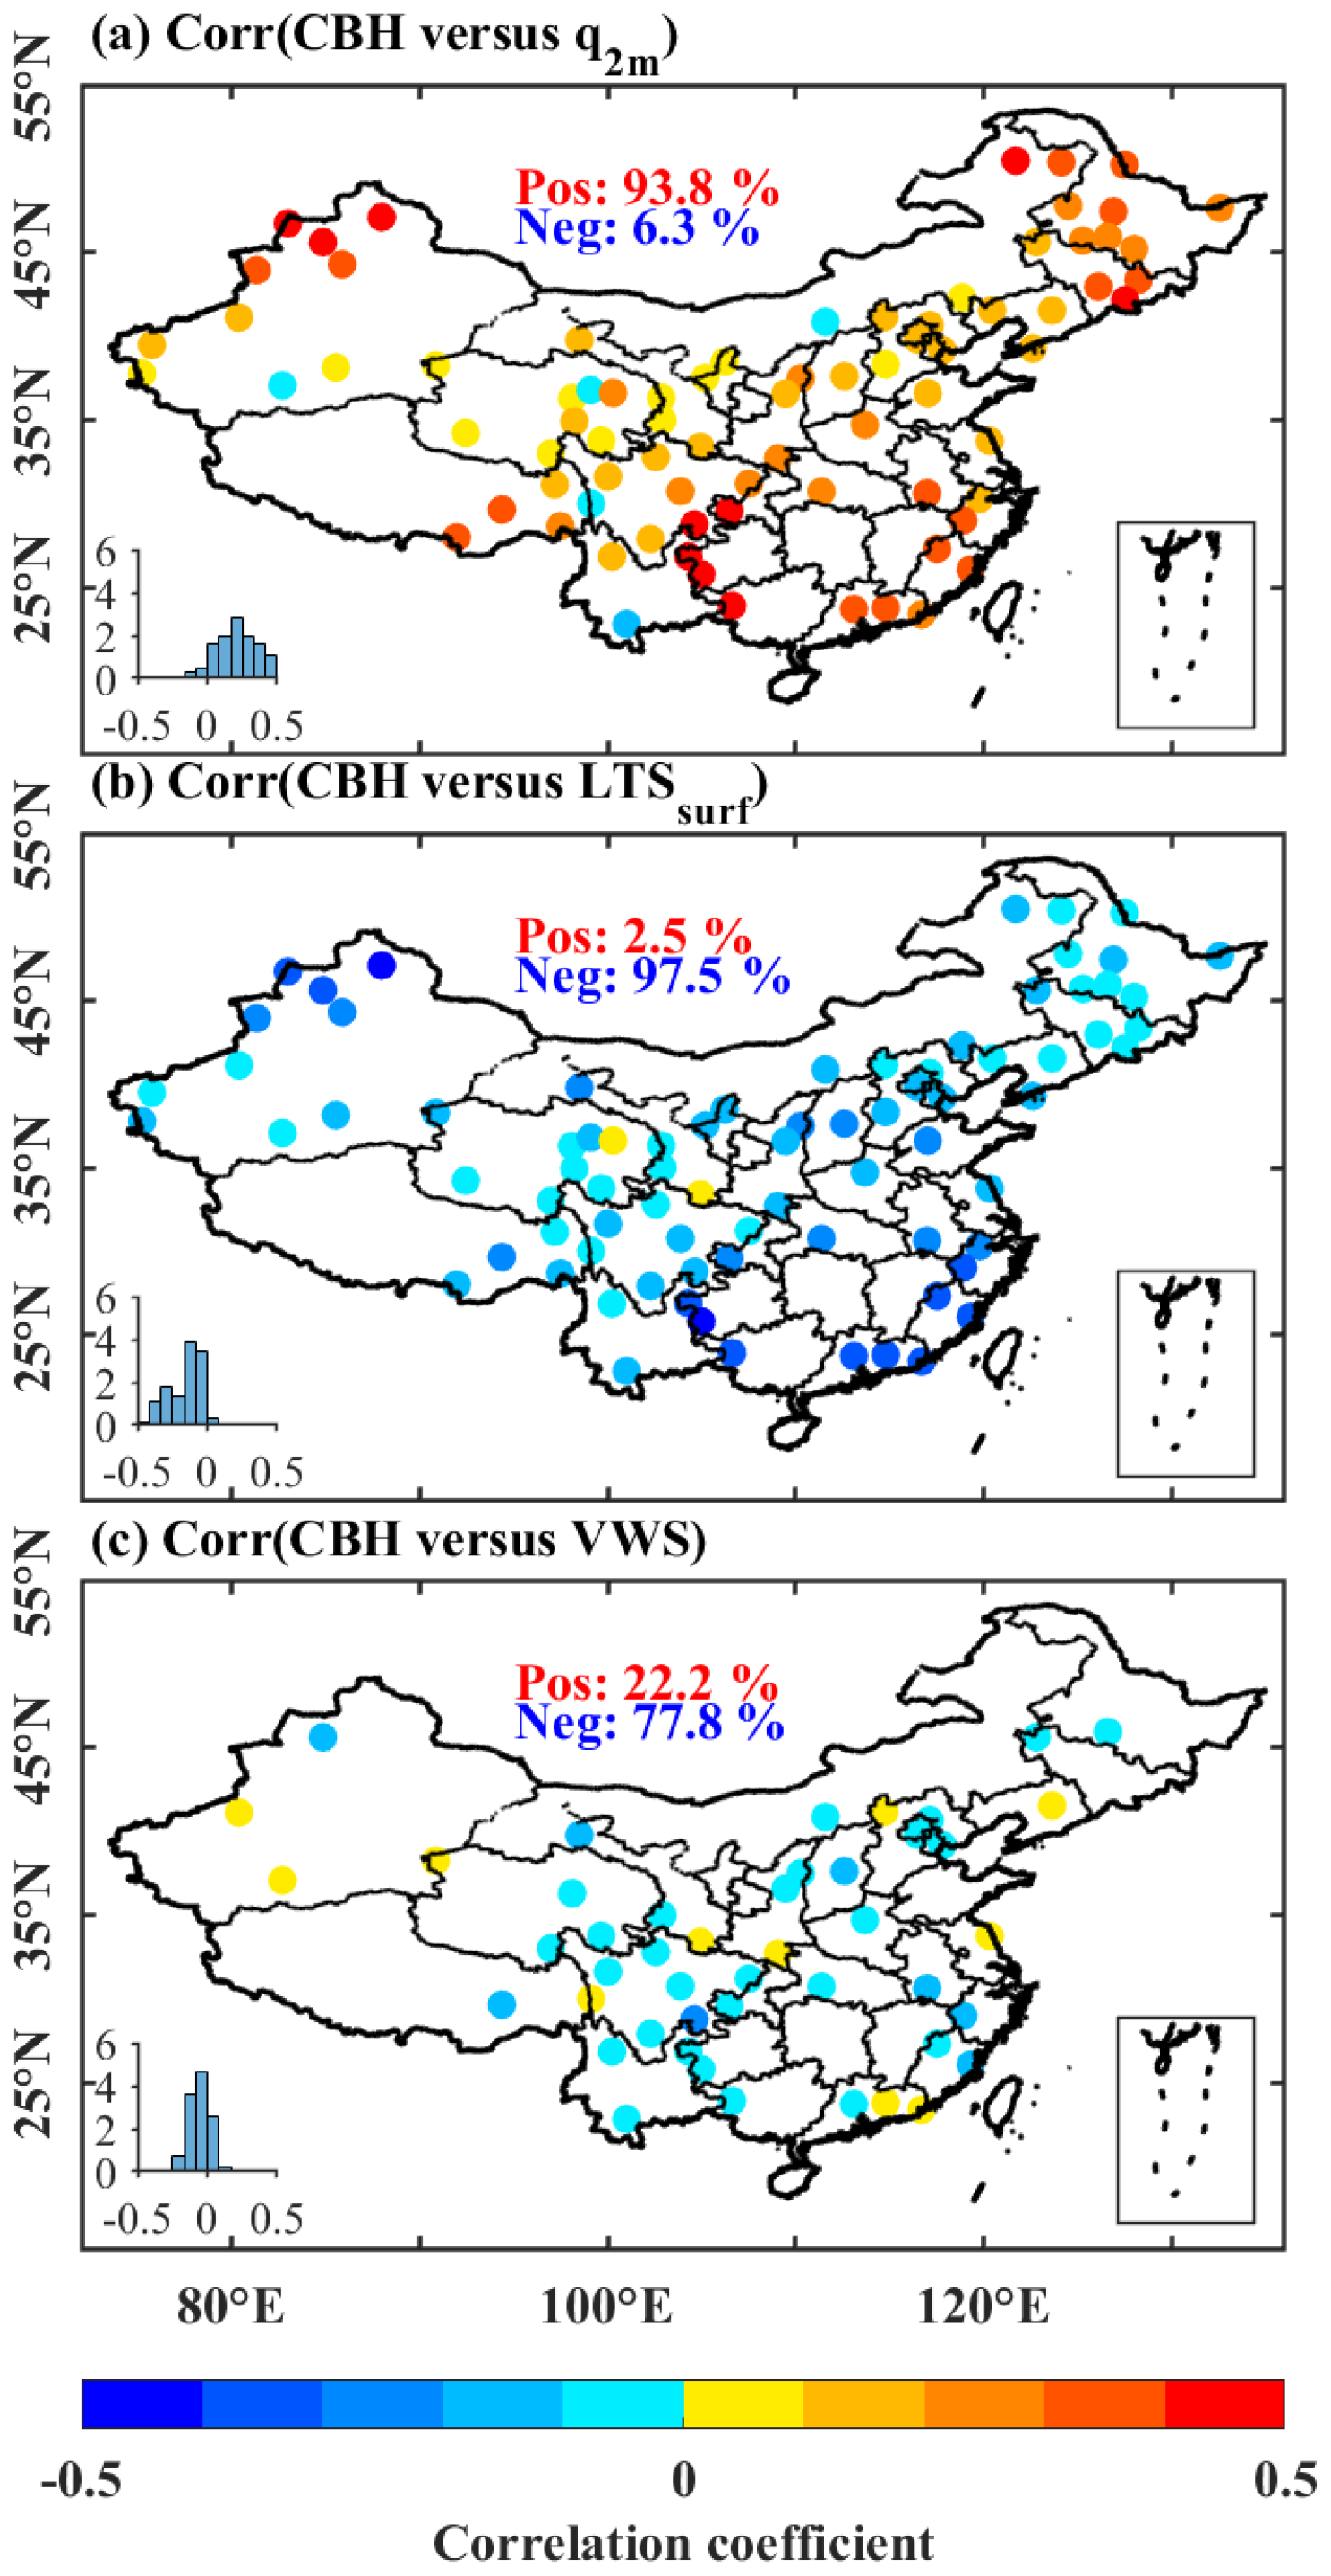
Figure 8Spatial distributions of correlation coefficients of CBH with lower-tropospheric stability (LTS), 2 m specific humidity (q2 m), and vertical wind shear (VWS) across China (2024). Here, LTSsurf is defined as the difference between potential temperature at the reference pressure level (700 hPa for low-elevation sites and 500 hPa for high-elevation sites) and surface potential temperature. The VWS is calculated at the same reference levels following the elevation-dependent scheme described in Sect. 2.2.3. All atmospheric variables were spatially and temporally matched with the MMCR CBH observational data to ensure the reliability of the correlation analysis. In each panel, the probability distribution of the correlation coefficient is illustrated by a histogram, and the abbreviations “Pos” and “Neg” denote the percentages of statistically significant positive and negative correlation coefficients across the entire study domain, respectively.
3.5 Impact of atmospheric thermodynamic and dynamical factors on CVS
CVS is modulated by the integrated effects of thermodynamic stratification, moisture availability, and dynamical forcing. To quantitatively elucidate their dominant regulatory mechanisms over China, we examine the correlations between three core CVS metrics (CBH, CTH, and CT) and key atmospheric variables, including LTSsurf and q2 m from ERA5, and VWS retrieved from RWP observations. All analyses are performed based on temporally and spatially collocated datasets. Recognizing that atmospheric controlling factors rarely operate independently, we further investigate the joint regulation of CVS by paired variables.
3.5.1 Impact of atmospheric thermodynamic and dynamical factors on CBH
Figure 8 illustrates the spatial distributions of annual mean correlation coefficients between CBH and three atmospheric variables. Positive correlations between CBH and q2 m are found at 93.8 % of all observation stations (Fig. 8a), while only 6.3 % of stations show negative correlations. This widespread positive relationship indicates that climatologically moister low-level environments are generally accompanied by higher cloud bases. Notably, this relationship does not imply that increased surface moisture directly lifts the LCL. Instead, it reflects the co-variability of low-level moisture and convective instability. Seasonal composite analyses further verify that this positive relationship between CBH and q2 m is most pronounced in summer (85 % of stations), and weakest in spring (64.6 %), with winter (74.7 %) and autumn (66.3 %) falling in between (Fig. S6a–d). Such seasonal contrast demonstrates that the CBH is governed by boundary layer depth and convective regimes, instead of a straightforward moisture-driven effect on cloud base height. Under moist and unstable conditions, more deeply developed PBL and stronger thermally driven updrafts act to elevate cloud bases, particularly for cumulus and convective cloud systems (Betts, 2004; Zhang and Klein, 2013). This relationship is statistically robust and spatially consistent across most regions, particularly over southeast China, where moist convection dominates cloud vertical development. The sparse negative correlations (6.3 %) are likely governed by persistent large-scale subsidence, which decouples local moisture fluctuations from cloud formation and evolution processes (Wood, 2012; Myers and Norris, 2013).
In contrast, CBH exhibits predominantly negative correlation with LTSsurf across 97.5 % of stations (Fig. 8b), with only 2.5 % of stations showing positive correlations. The strong negative correlations are concentrated over the southeastern coastal regions of China. A higher LTSsurf value indicates intensified stratification in the lower-troposphere, which suppresses boundary-layer growth and favours shallow stratiform clouds with lower cloud bases (Klein and Hartmann, 1993; Wood and Bretherton, 2006). Conversely, reduced LTSsurf enhances instability, facilitating intense turbulent mixing in the boundary layer, and promoting the development of convective clouds with higher cloud bases (Slingo, 1987). Seasonal composite analyses further verify that this negative relationship is most widespread in autumn (80.0 % of stations) and summer (73.8 %), and relatively less so in winter (63.3 %) and spring (62.0 %) (Fig. S6e–f). This seasonality indicates that the CBH – LTSsurf coupling is modulated by the prevailing convective and boundary-layer regimes. The more consistent negative correlations in summer and autumn align with the dominance of deep convection and stable stratiform conditions (Zhang and Klein, 2013; Guo et al., 2016), respectively, whereas the weaker connection in spring and winter suggests that synoptic transients may at times override the local stability control (Taszarek et al., 2019). This seasonal differentiation confirms that, while LTSsurf exerts a primary thermodynamic control on CBH, its influence is conditioned by the seasonal evolution of boundary layer and cloud regimes (Zhang and Klein, 2013). At the national scale, CBH exhibits a predominantly negative correlation with VWS across 77.8 % of observation stations (Fig. 8c). This widespread negative correlation indicates that stronger vertical wind shear is generally associated with lower cloud bases. Physically, enhanced VWS promotes the entrainment of drier environmental air into the cloud layer, which intensifies droplet evaporation, reduces buoyancy, and suppresses deep convective development, lowering effective cloud bases (Weisman and Rotunno, 2000). The sparse positive correlations (22.2 %) likely reflect localized regimes where moderate shear organizes convection and helps sustain updrafts, or where shear-induced low-level convergence promotes cloud formation under specific instability conditions (Houze, 2014).
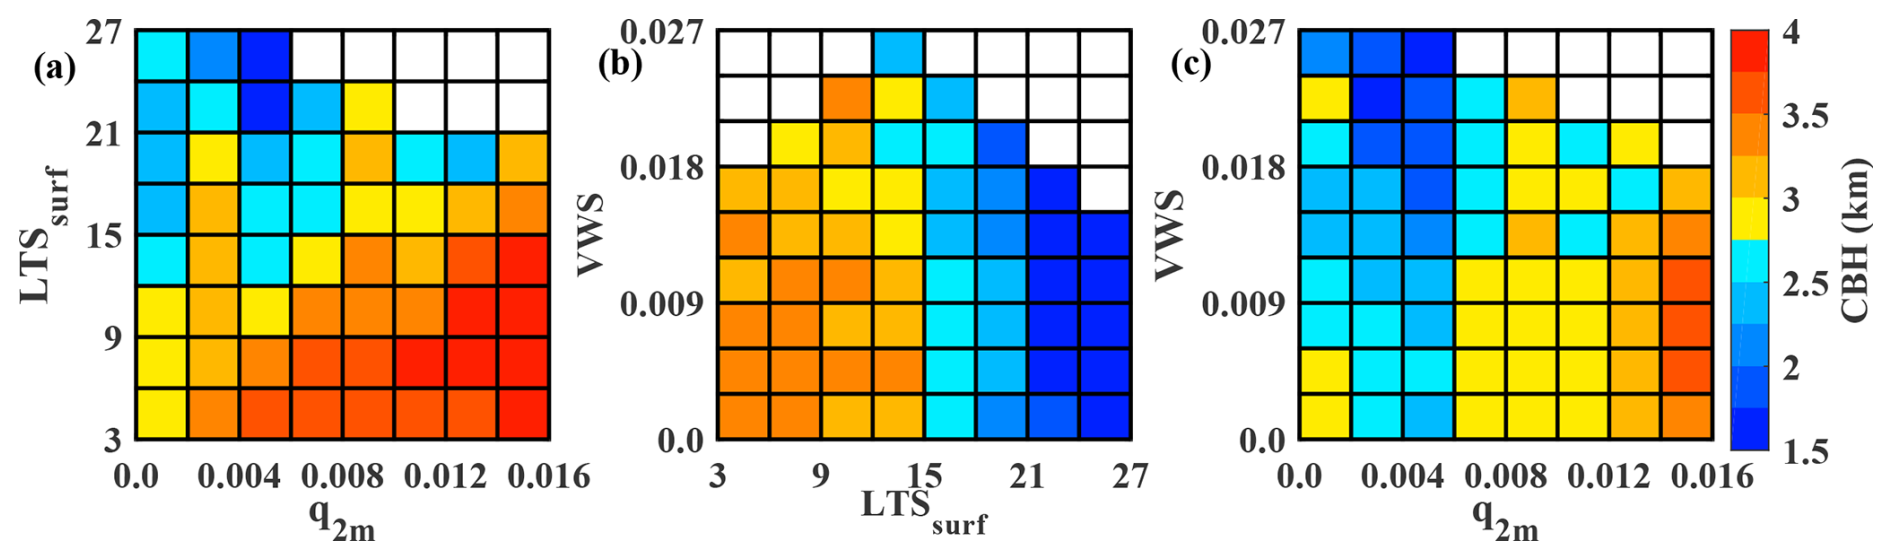
Figure 9Bivariate regulation of CBH by thermodynamic and dynamical factors across China in 2024, based on observations from 80 MMCR stations. Each panel illustrates the response of CBH to the combined modulating effects of a specific pair of key atmospheric factors: (a) LTSsurf and q2 m, (b) VWS and LTSsurf, and (c) VWS and q2 m. All ERA5 reanalysis variables were spatially and temporally matched with MMCR data to ensure the validity and reliability of this bivariate joint dependence analysis.
Seasonal composite analyses confirm the robustness of this negative relationship, with the proportion of stations showing negative correlations ranging from 56.5 % in summer to 70.0 % in winter (Fig. S6i–l). This seasonal consistency, albeit weaker than that observed for thermodynamic factors (q2 m and LTSsurf), reinforces the interpretation that VWS plays a secondary modulating role in controlling CBH, conditioned by the prevailing convective regime.
To further explore the joint constraints of atmospheric factors on CBH, we analyze the paired dependence of CBH on q2 m, LTSsurf, and VWS (Fig. 9). For the q2 m−LTSsurf combination (Fig. 9a), CBH generally increases with increasing q2 m, while the magnitude of this sensitivity is strongly modulated by atmospheric stability. Under low LTSsurf (unstable) conditions, the highest CBH values occur in moisture-abundant environments, consistent with deep boundary layers and active convective cloud development (Zhang and Klein, 2013). In contrast, under high LTSsurf (stable) conditions, CBH remains consistently low across nearly the entire moisture range, suggesting that strong lower-tropospheric stratification dominates the cloud base variation, confining cloud development to low-base stratiform clouds regardless of moisture availability (Klein and Hartmann, 1993; Wood and Bretherton, 2006).
The LTSsurf-VWS relationship (Fig. 9b) further illustrates this conditional modulation effect. In low LTSsurf environments, CBH tends to increase with increasing wind shear, consistent with the role of wind shear in organizing convection and modulating inflow structure under unstable conditions (Weisman and Rotunno, 2000). Under high LTSsurf environments, CBH remains uniformly low and shows weak sensitivity to shear, reinforcing the conclusion that stability exerts the primary constraint on cloud-base variability.
For the q2 m-VWS pairing (Fig. 9c), CBH increases primarily with q2 m, while wind shear plays a secondary modulating role. The highest CBH values occur when abundant low-level moisture coincides with weak-to-moderate wind shear, indicating that abundant low-level moisture acts as the primary driver for elevated cloud bases, while weak shear does not exert the suppressing effect typically associated with strong wind shear. This is consistent with the national-scale negative correlation between CBH and VWS shown in Fig. 8c, where strong shear environments tend to suppress cloud-base height.
3.5.2 Impact of atmospheric thermodynamic and dynamical factors on CTH
CTH exhibits broadly similar but more pronounced thermodynamic sensitivity. Single-variable correlations (Fig. 10) show that q2 m is positively correlated with CTH at 96.3 % of stations, with the strongest signals over southern China and the eastern Tibetan Plateau margins, where abundant low-level moisture sustains buoyant ascent and deeper cloud development (Johnson et al., 1999; Holloway and Neelin, 2009). The few negative correlations (3.7 %), scattered over arid northwestern China, likely reflect the dominance of large-scale subsidence that suppresses deep convective development regardless of local moisture availability (Riemann-Campe et al., 2011).
CTH is predominantly negatively correlated with LTSsurf (93.8 % of stations; Fig. 10b), particularly over coastal southeastern China, the Sichuan Basin, and the Yangtze River valley. Higher LTSsurf suppresses vertical cloud growth, favoring shallow cloud formations with lower cloud tops (Klein and Hartmann, 1993; Wood and Bretherton, 2006), while reduced LTSsurf enables vigorous deeper convection (Slingo, 1987). The small fraction of positive correlations (6.2 %), mainly over the Tibetan Plateau and parts of northern China, may reflect situations where LTSsurf variations are coupled with large-scale dynamical lifting or orographic forcing (Medeiros et al., 2010). Seasonally, the proportion of negative correlations is highest in autumn (67.5 %) and lowest in summer (55.0 %), consistent with the seasonal prevalence of stable stratiform conditions versus deep convection. This seasonal modulation reinforces the interpretation that stability control on cloud top height is conditioned by the dominant cloud type and boundary-layer regime (Klein and Hartmann, 1993; Wood and Bretherton, 2006; Zhang and Klein, 2013).
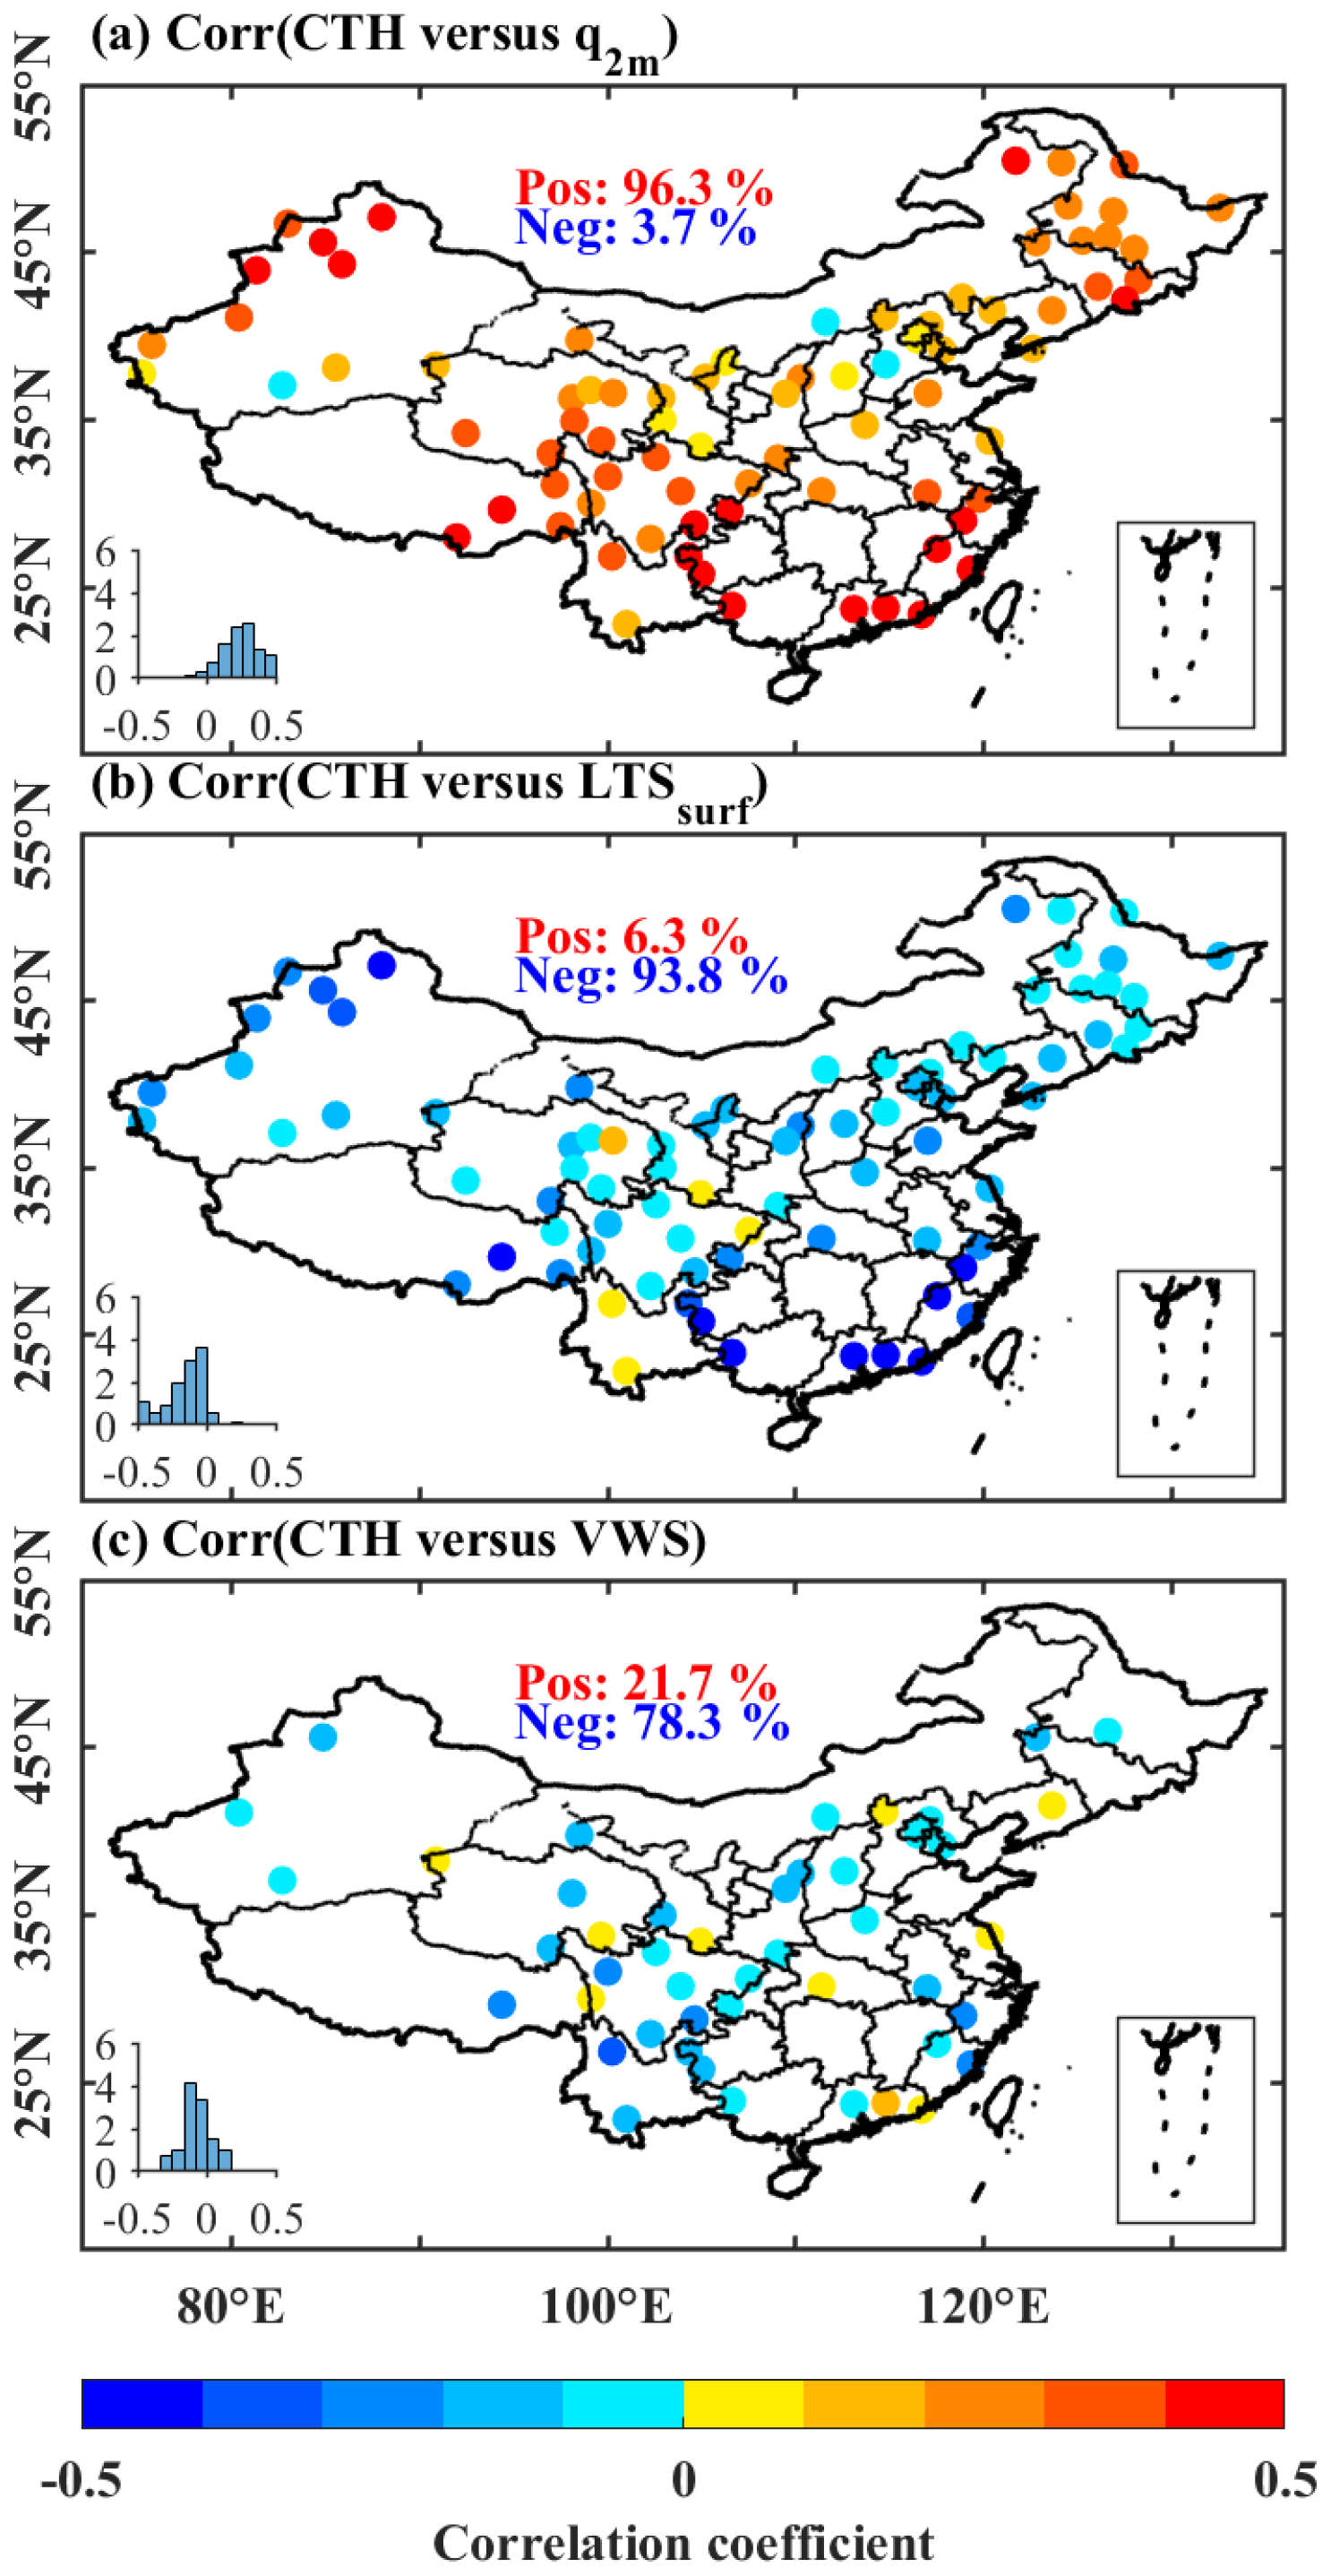
Figure 10Similar as Fig. 8, but for the CTH.
By comparison, CTH shows a predominantly negative correlation with VWS (78.3 % of stations; Fig. 10c), concentrated over southern China, the Tibetan Plateau margins, and northeastern China. This pattern indicates that stronger vertical wind shear tends to suppress CTH through enhanced entrainment mixing, disruption of coherent updrafts, and increased upper-level turbulence that spreads anvils horizontally (Sathiyamoorthy et al., 2004; Yang et al., 2022). However, 21.7 % of stations (mainly over northwestern China) show positive correlations, consistent with the “optimal shear” framework (Weisman and Rotunno, 2000).
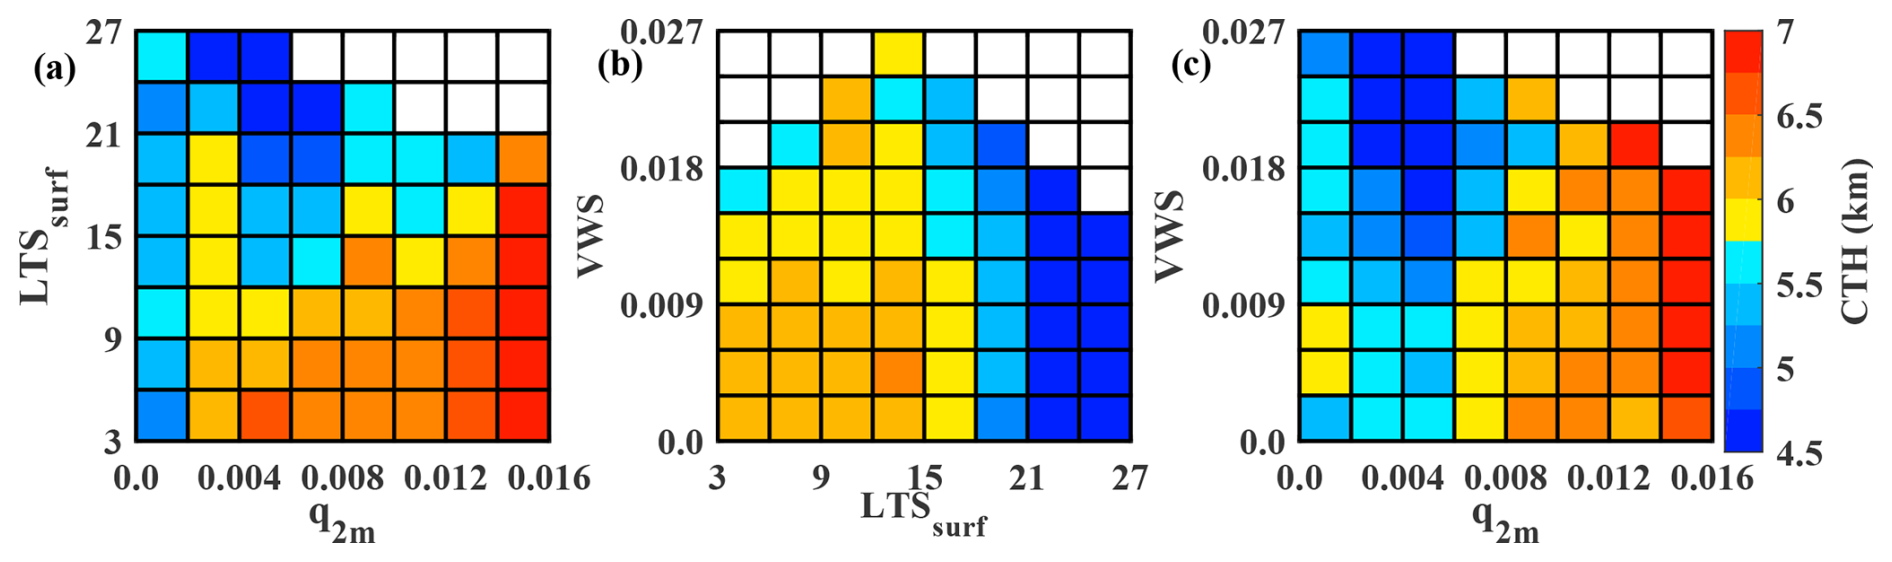
The joint dependence of CTH on paired variables (Fig. 11) further clarifies this conditional behavior. Under low LTSsurf (unstable) and high q2 m (moist) conditions (Fig. 11a), CTH reaches its maximum values, confirming that both instability and moisture are necessary for deep convection. Compared with CBH, the sensitivity of CTH to moisture under unstable conditions is more gradual, suggesting that processes aloft – such as entrainment, detrainment, and upper-level thermodynamic structure – exert additional modulation on maximum CTH (Holloway and Neelin, 2009).
The LTSsurf – VWS pairing (Fig. 11b) shows that CTH is greatest under low LTSsurf with weak-to-moderate wind shear, directly illustrating the “optimal shear” effect, whereby moderate shear organizes rather than suppresses deep convection (Weisman and Rotunno, 2000). Under high LTSsurf, CTH remains low regardless of wind shear magnitude, reaffirming that stable stratification acts as the primary constraint on cloud top development.
For the q2 m-VWS combination (Fig. 11c), the joint patterns reinforce that CTH is more tightly coupled to q2 mthan to VWS: the largest CTH occurs when abundant moisture coincides with weak wind shear. Conversely, reducing wind shear under low-humidity conditions is insufficient to significantly elevate cloud tops, confirming that moisture availability, rather than wind shear, is the fundamental driver for deep convective cloud development. Wind shear thus primarily serves as a constraining, rather than an elevating factor.
3.5.3 Impact of atmospheric thermodynamic and dynamical factors on CT
Cloud thickness exhibits distinct correlation patterns that differ from those of CBH and CTH (Fig. 12). For q2 m (Fig. 12a), positive correlations dominate across 71.3 % of stations, indicating that abundant low-level moisture favors vertically extended clouds. This relationship is pronounced over southern China and the eastern Tibetan Plateau margins, where active moist convection prevails. Higher specific humidity sustains positive buoyancy over deeper layers, promoting thicker clouds (Johnson et al., 1999; Holloway and Neelin, 2009). Negative correlations (28.7 % of stations), scattered over arid northwestern China and parts of Inner Mongolia, may reflect environments where moisture is insufficient to support deep convective development. Seasonal composite analyses (Fig. S8a–d) show that this positive coupling is most widespread in summer (71.3 %) and weakest in autumn (40.0 %), confirming the strong but seasonally modulated link between moisture and cloud vertical extent.
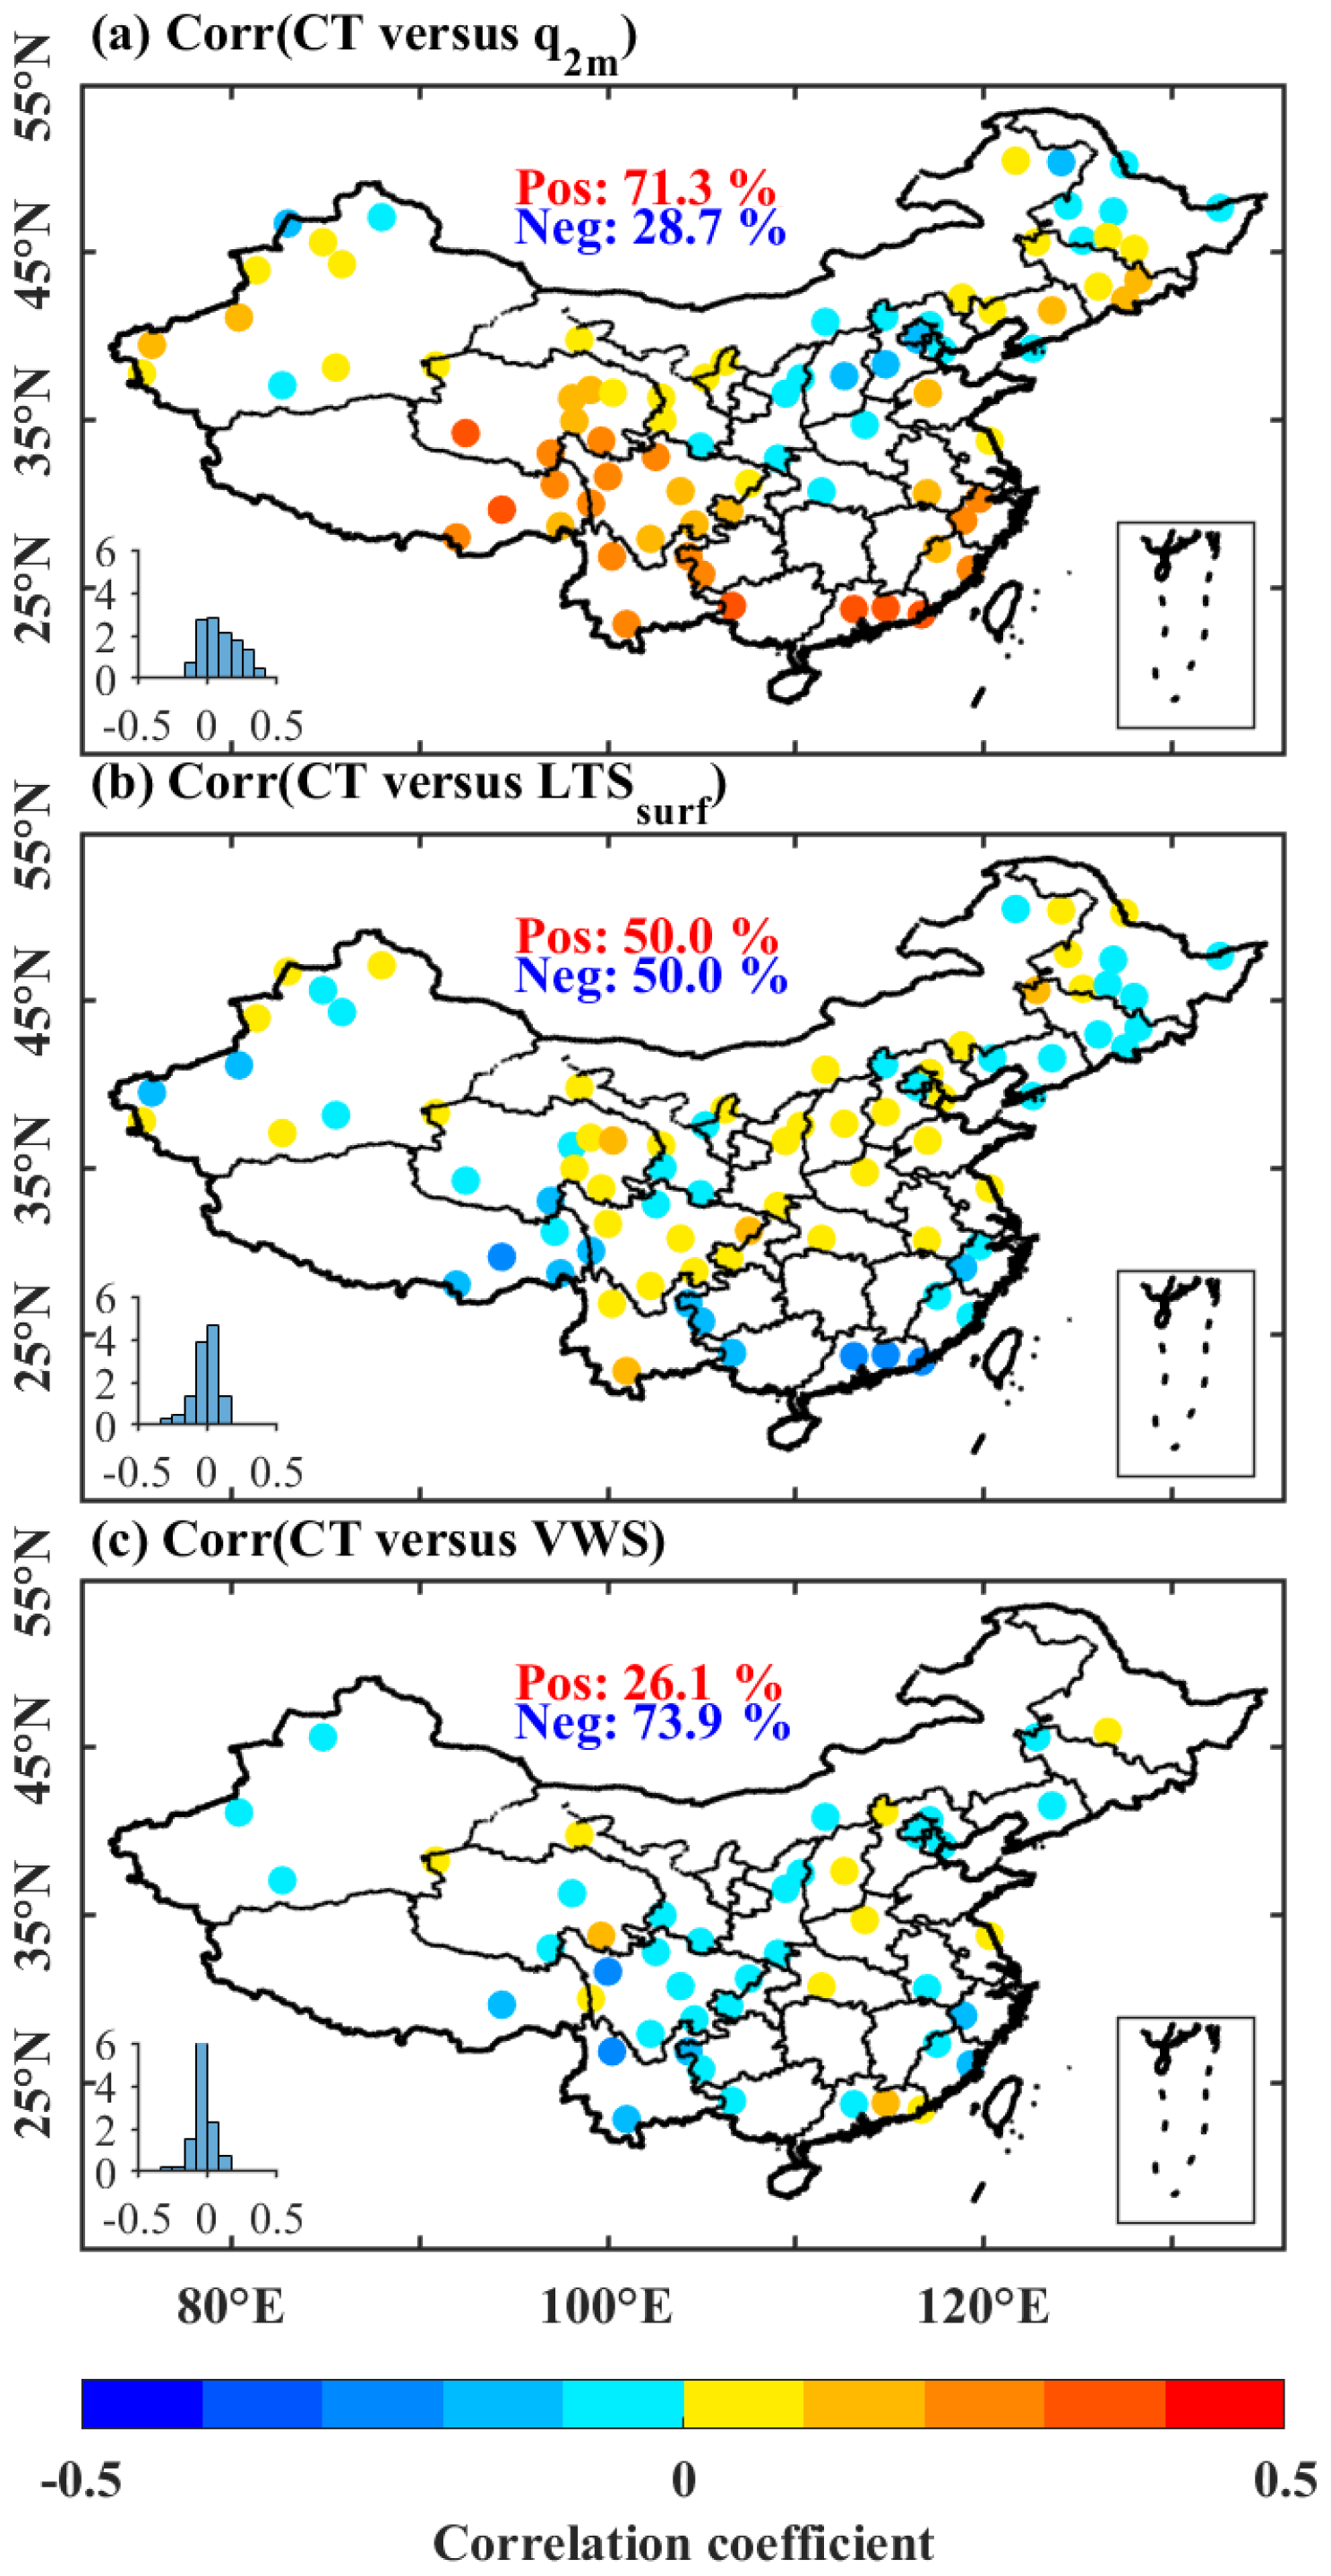
Figure 12Similar as Fig. 8, but for CT.
For LTSsurf (Fig. 12b), cloud thickness shows a nearly equal split between positive and negative correlations (50 % of each), with a spatially heterogeneous, intermingled pattern across China rather than any dominant geographic signature. This mixed pattern reflects the dual role of thermodynamic stability in cloud development. On one hand, enhanced stability (e.g., strong temperature inversions) typically suppresses convective development, leading to negative correlations. On the other hand, stable stratification can favor the maintenance and thickening of stratiform clouds trapped beneath the inversion layer, especially under sustained moisture supply, thereby yielding positive correlations (Klein and Hartmann, 1993; Wood and Bretherton, 2006). Critically, seasonal composite analyses (Fig. S8e–h) reveal that positive correlations dominate in summer (76.3 %), when extensive stratiform cloud decks associated with the East Asian summer monsoon are prevalent, while the other seasons remain near parity. This seasonal contrast directly supports the interpretation that the sign of the CT–relationship is governed by the prevailing cloud type and moisture regime, rather than by stability alone.
Cloud thickness shows a predominantly negative correlation with VWS (73.9 % of stations; Fig. 12c), indicating that stronger vertical wind shear generally suppresses vertical cloud development. Negative correlations are widespread across southern China, the Tibetan Plateau margins, northeastern China, and the North China Plain. Positive correlations (26.1 % of stations), scattered across limited areas of northwestern China, may reflect environments where moderate shear organizes convection into longer-lived systems capable of greater vertical development consistent with the “optimal shear” concept (Weisman and Rotunno, 2000). Seasonally (Fig. S8i–l), negative correlations are most widespread in winter (65.0 %) and spring (61.4 %), and least so in summer (41.3 %), suggesting that the suppressing effect of shear on cloud thickness is more pronounced when deep convection is less frequent, while in summer, organized convective regimes may partially offset this suppression (Weisman and Rotunno, 2000; Houze, 2014).
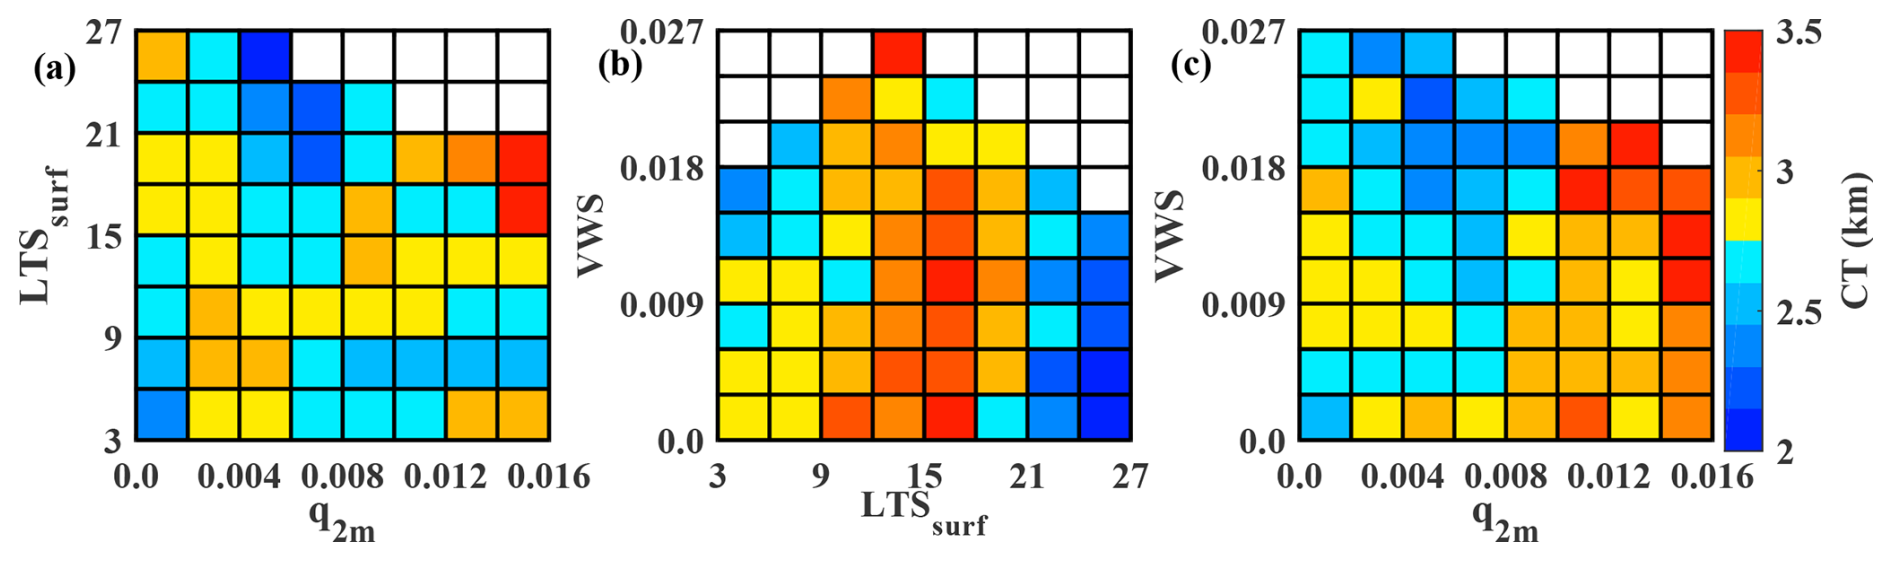
CT exhibits distinct joint-dependence characteristics that integrate the controls on both cloud-base and cloud-top environmental processes. For the q2 m−LTSsurf combination (Fig. 13a), the thickest clouds occur under high specific humidity combined with high lower-tropospheric stability. This indicates that under high-humidity conditions, stronger stable stratification does not necessarily suppress cloud thickness; rather, it can support the accumulation of thick stratiform cloud layers beneath the inversion by trapping moisture within a confined boundary layer, thereby yielding considerable geometric thickness (Klein and Hartmann, 1993; Wood and Bretherton, 2006).
For the LTSsurf-VWS combination (Fig. 13b), the maximum CT occurs under moderate LTSsurf and moderate vertical wind shear. Both excessively high LTSsurf and intense shear markedly reduce cloud thickness. High LTSsurf strongly suppresses deep convection, whereas intense shear enhances turbulent entrainment at the cloud top and disrupts organized updraft structures, thereby limiting vertical growth. In contrast, the combination of moderate stability and moderate shear provides conditions that are favorable for organizing cloud systems and allowing greater vertical development, without being overly constrained by either extreme stability or excessive turbulence (Weisman and Rotunno, 2000).
For the q2 m-VWS combination (Fig. 13c), CT increases primarily with humidity. Under low-humidity conditions, CT remains uniformly small regardless of shear intensity. Under high-humidity conditions, however, CT tends to increase with wind shear up to moderate–strong values. This indicates that moisture availability is the fundamental precondition for thick clouds, while moderate to strong shear can further enhances the vertical extent of moisture-rich air masses by modulating cloud organization and dynamic mixing. Collectively, these joint results confirm that moisture acts as the dominant driver for deep cloud systems, while stability and shear functions as strong regulators that either suppress or facilitate vertical development depending on their specific magnitudes.
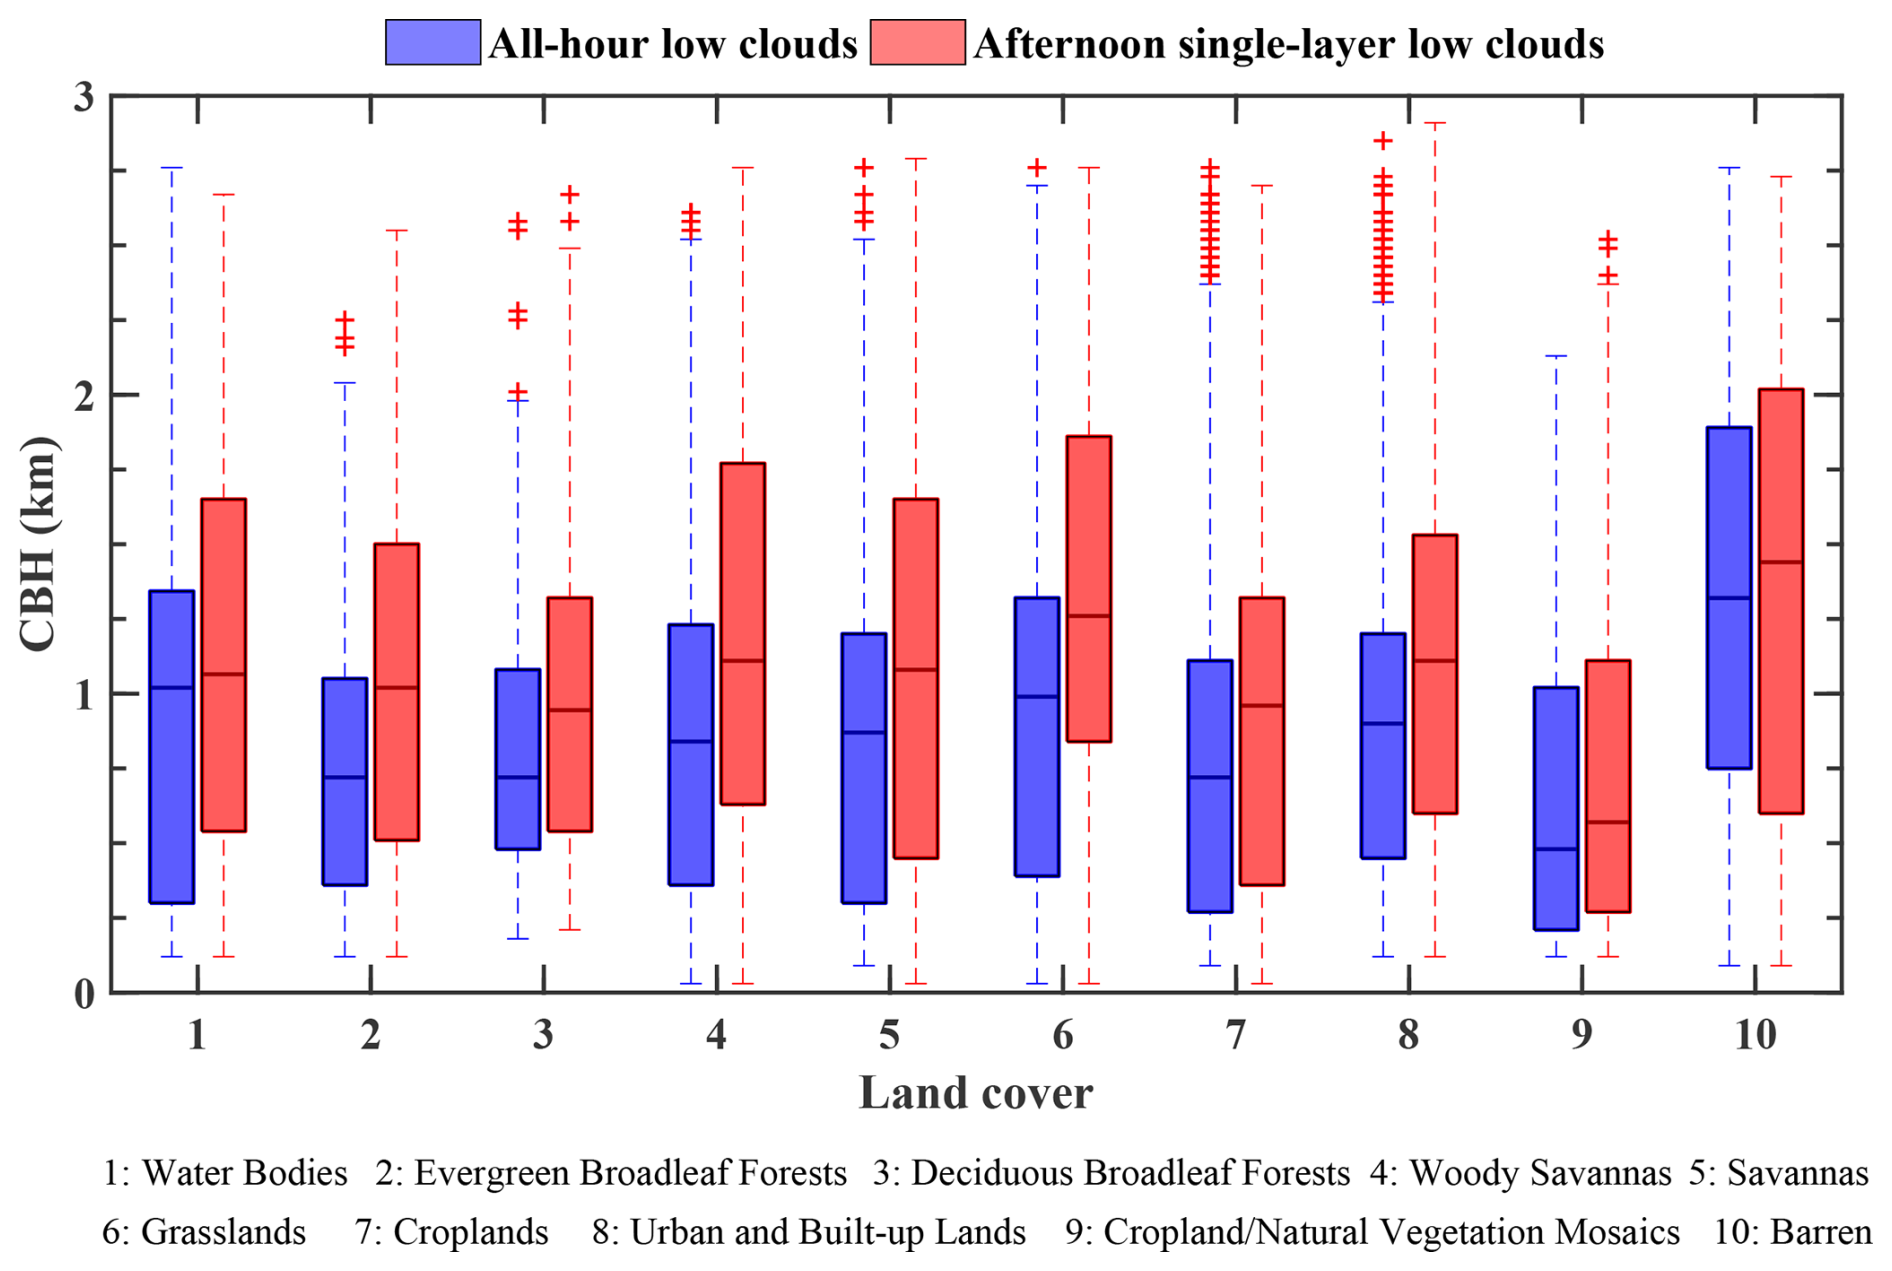
Figure 14Land-surface influence on CBH across China in 2024, based on 80 MMCR stations. Blue bars indicate all-hour low clouds, and red bars represent afternoon single-layer low clouds. Land cover types are derived from the MODIS Land Cover Type Yearly Climate Modeling Grid product (MCD12C1; https://lpdaac.usgs.gov/products/mcd12c1v061/, last access: 12 September 2026).
3.6 The land surface modulation of cloud vertical structure
Beyond atmospheric thermal and dynamical factors, land-surface characteristics also influence cloud vertical structure through their effects on PBL moisture, surface energy partitioning, and turbulence (e.g., Bonan, 2008; Fu et al., 2020; Wang et al., 2021). Since CBH is tightly coupled to PBL thermodynamics, it serves as a useful metric for assessing surface–cloud coupling. This coupling is only meaningful for boundary-layer clouds; high-level single-layer clouds are dominated by large-scale upper-tropospheric processes and, as confirmed in our analysis, are insensitive to surface type. We therefore focus on single-layer low clouds (CTH <3 km), which are largely confined within the boundary layer. To quantify the land-surface influence, we compare CBH across land-cover types for (i) all-hour low clouds and (ii) afternoon (14:00–18:00 LT) single-layer low clouds (Fig. 14). The afternoon subset captures the period of strongest coupling, when the boundary layer is fully developed and land-atmosphere fluxes are maximized.
3.6.1 All-hour low clouds
Under all-hour conditions, CBH of low clouds depends systematically on underlying land cover type (Fig. 14, left panels). Barren land (type 10) shows the highest median CBH (1.32 km), consistent with limited surface moisture availability and elevated LCLs. Densely vegetated surfaces yield markedly lower medians: cropland/natural vegetation mosaics (type 9) record the lowest value (0.48 km), followed by evergreen broadleaf forests (type 2, 0.72 km), deciduous broadleaf forests (type 3, 0.72 km), and croplands (type 7, 0.72 km). Water bodies (type 1, 1.02 km) and urban and built-up lands (type 8, 0.90 km) fall in the intermediate range.
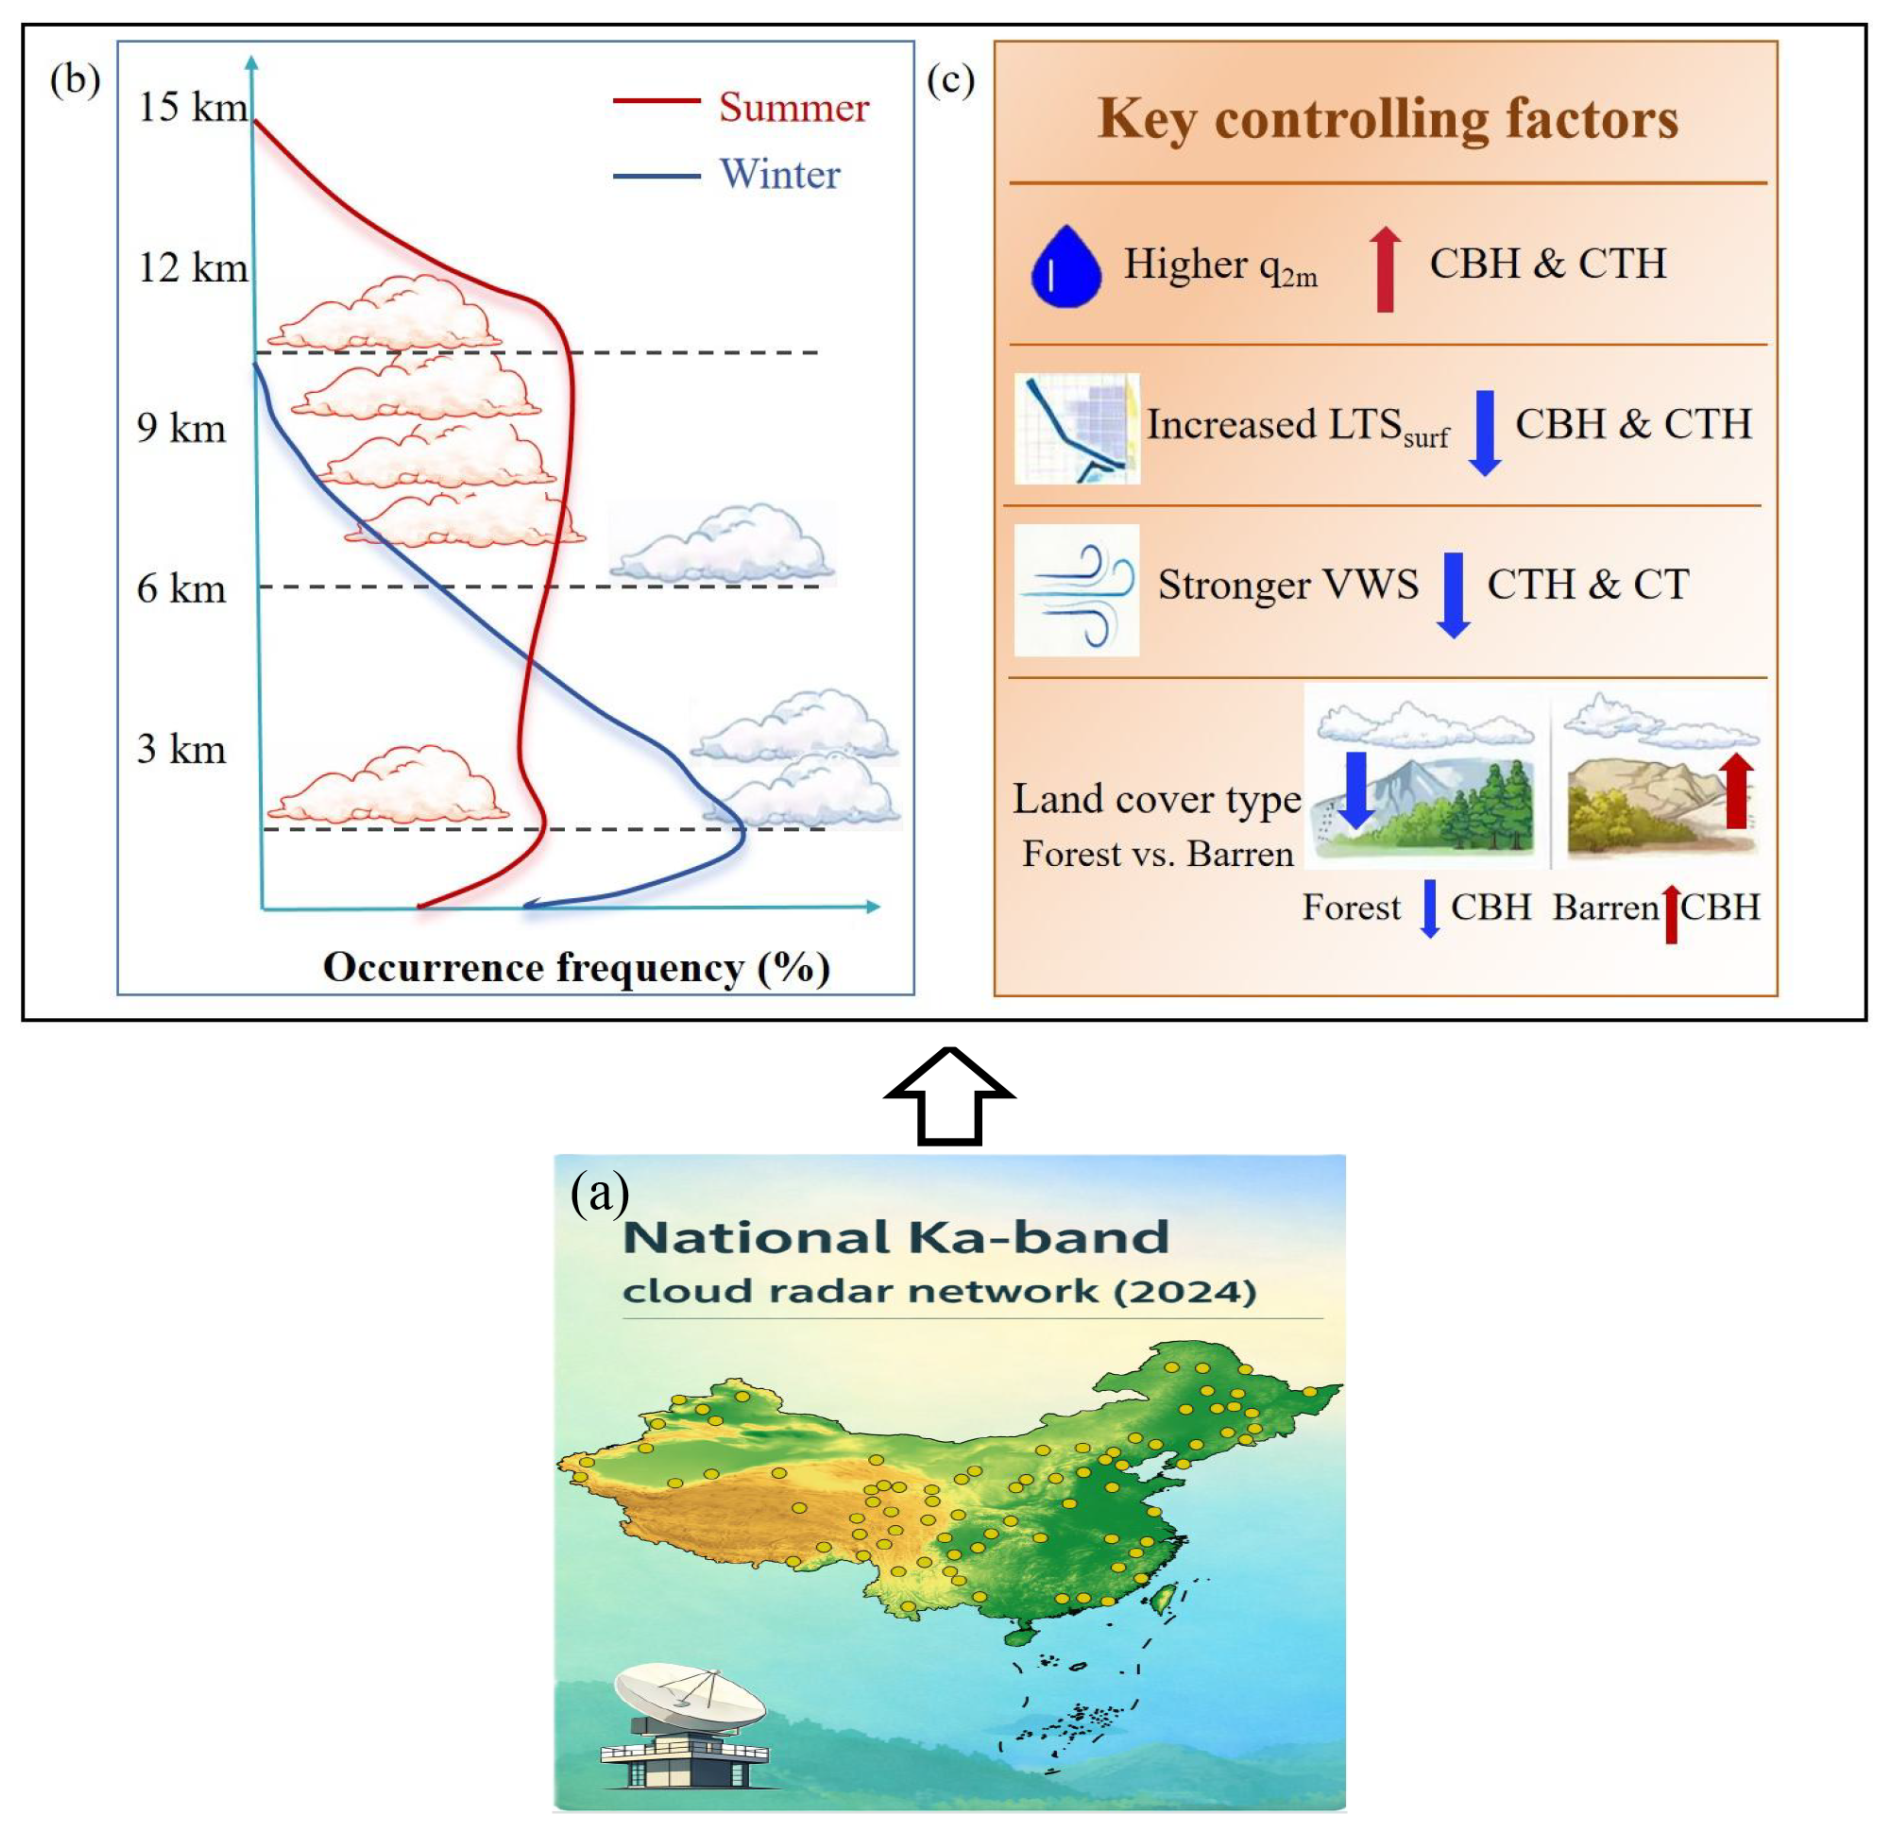
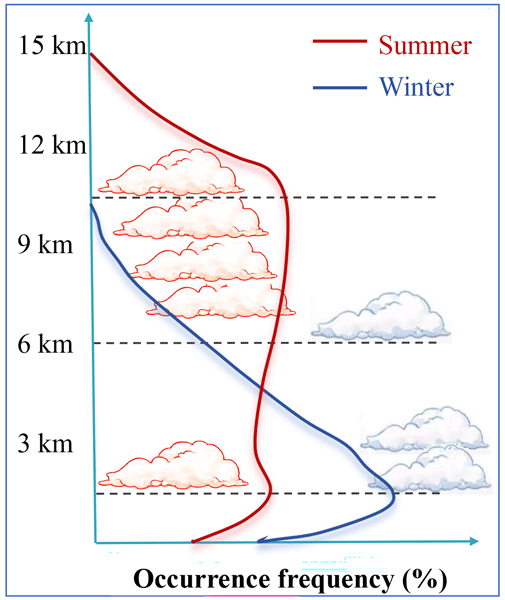
Figure 15Schematic diagram showing (a) the national MMCR network across China in 2024, (b) the vertical distribution of cloud occurrence frequency in summer (red) and winter (blue), and (c) the key controlling factors (thermodynamic, dynamical, and land-surface) of the CVS. Upward and downward arrows indicate increases and decreases, respectively, in panel (c).
These contrasts can be explained by the biophysical properties of the land cover. Forests sustain high evapotranspiration, which moistens the boundary layer and lowers the lifting condensation level, favoring lower cloud bases (Spracklen et al., 2012; Zhang et al., 2024). In addition, the greater surface roughness and lower albedo of forests enhance turbulent exchange and boundary-layer growth, promoting cloud formation, although the net effect of deeper mixing may partially offset the moisture-driven lowering. Overall, the moisture supply over vegetated surfaces appears to dominate, yielding lower CBH relative to barren land. This interpretation aligns with studies showing that land-use and land-cover change can modify CBH by altering surface energy partitioning and boundary-layer thermodynamics (Syktus and McAlpine, 2016; Xu et al., 2022; Duveiller et al., 2021).
3.6.2 Afternoon single-layer low clouds
Land cover type exerts a stronger modulating effect on the CBH of afternoon single-layer low clouds (Fig. 14, right panels). The overall ranking of median CBH is consistent with the all-hour pattern: barren land remains highest (1.44 km), while cropland/natural vegetation mosaics remain lowest (0.57 km). Notably, afternoon CBH is systematically higher than the all-hour climatology across all land-cover types, with a mean increase of approximately 21.7 %. The diurnal increase is most pronounced over densely vegetated surfaces – evergreen broadleaf forests (+41.7 %), croplands (+33.3 %), and woody savannas (+32.1 %) – and smallest over barren land (+9.1 %) and water bodies (+3.9 %). The systematically higher afternoon CBH primarily reflects the deepening of the boundary layer and the associated rise in the lifting condensation level due to strong surface heating. Additionally, restricting the sample to single-layer clouds may exclude very low cloud bases typical of multi-layer or decoupled stratiform decks, further contributing to the elevated median values. The amplified land-cover contrasts during afternoon indicate that boundary-layer evolution under strong insolation is highly sensitive to surface heterogeneity. Heterogeneous landscapes can generate mesoscale circulations and spatial gradients in moisture and heat fluxes that modulate cloud initiation and CBH (Rieck et al., 2014).
The small increase over barren land is expected, as its cloud base is already elevated under all-hour conditions due to persistent moisture limitation. The modest rise over cropland/natural vegetation mosaics (+18.8 %) – despite having the lowest absolute CBH – is consistent with strong evapotranspiration partially counteracting the boundary-layer deepening. Water bodies show minimal diurnal change (+4.4 %), reflecting the large thermal inertia that suppresses the amplitude of boundary-layer development.
Overall, Fig. 14 demonstrates a measurable influence on CBH, with the strongest contrasts emerging for afternoon single-layer low clouds. These results highlight the importance of surface-driven moisture supply, energy partitioning, and boundary-layer dynamics in shaping cloud-base variability. Similar forest–open land contrasts in CBH have been reported in other regions (e.g., tropical montane environments; Trivedi et al., 2025), suggesting that land-surface modulation of low cloud vertical structure is a robust feature across diverse geographic settings.
This study presents the first national-scale, high-spatiotemporal-resolution analysis of CVS across China based on observations from a coordinated network of 80 Ka-band cloud radars during 2024, providing an unprecedentedly detailed snapshot (30 m vertical, 1 min temporal resolution) of cloud vertical structures and their governing factors.
The annual mean cloud occurrence frequency is 56.7 ± 7.2 %, with single-layer clouds dominating (34.7 ± 4.0 %), followed by two-layer (14.7 ± 3.2 %) and multi-layer clouds (7.1 ± 2.4 %). Spatially, single-layer clouds are more prevalent over arid northwestern China, whereas multi-layer clouds occur more frequently in humid southeastern regions, highlighting the role of moisture availability in shaping cloud vertical complexity.
Cloud height exhibits clear seasonal modulation. CBH follows the order of summer > spring > autumn > winter, with systematically lower values over the Tibetan Plateau in spring and summer. Vertically, CBH displays a unimodal distribution dominated by low-level clouds, while CTH exhibits a bimodal structure, reflecting the coexistence of shallow stratiform and deep convective cloud regimes.
Diurnal variations in CVS are strongly seasonally dependent. In summer, upper-level cloud occurrence (3–9 km) peaks during the late afternoon (16:00–20:00 LT), driven by enhanced surface heating and convective instability. In winter, clouds are largely confined below 3 km and exhibit a near-sunrise maximum (06:00–08:00 LT), consistent with nocturnal radiative cooling and stable boundary-layer conditions. Spring and autumn display transitional behavior between these two regimes.
Thermodynamic conditions exert the dominant control on CVS. Both CBH and CTH are positively correlated with q2 m and negatively correlated with LTSsurf, indicating that abundant moisture and reduced stability favor deeper vertical development. VWS plays a secondary but systematic role, with strong shear generally suppressing vertical cloud growth through enhanced entrainment. Joint analyses further reveal that high humidity combined with low LTSsurf maximizes cloud vertical development, whereas high LTSsurf constrains CVS regardless of moisture or shear conditions. Wind shear exhibits nonlinear behavior: moderate shear occasionally supports organized convection under unstable conditions, whereas strong shear generally limits vertical extent.
Land cover type exerts a measurable influence on cloud base height, particularly for afternoon single-layer low clouds, whose median CBH is approximately 21.7 % higher than that under all-hour low cloud conditions. Among land cover types, barren lands exhibit the highest CBH, while forested regions display the lowest CBH. The largest relative enhancement in afternoon CBH occurs over deciduous broadleaf forests (+41.7 %), underscoring the amplification of land–atmosphere feedback under strong solar forcing. Overall, this study provides a high-resolution, observationally constrained snapshot of cloud vertical structure across China and establishes a quantitative framework linking CVS metrics to thermodynamic, dynamical, and land-surface controls (Fig. 15). These statistically derived linkages can directly inform model improvement in two ways. First, the observed sensitivities of CBH and CTH to LTSsurf and q2 m offer quantitative benchmarks for calibrating boundary-layer and convective parameterizations – the dominant sources of cloud-related uncertainty in weather and climate models (Bony et al., 2015; Cesana and Waliser, 2016). Second, the land-cover contrasts in CBH provide constraints for evaluating surface–atmosphere coupling in land surface models. Although this one-year record does not support long-term trend analysis, it establishes a robust baseline against which model-simulated CVS can be evaluated across timescales, especially when combined with multi-year satellite or reanalysis products, thereby supporting iterative improvement of cloud schemes and enhancing prediction skill from weather to climate scales. Future work should extend this analysis to multi-year datasets to assess interannual variability and explore the role of CVS in extreme weather events and regional climate feedbacks. Additionally, while the seasonal stratification in this study captures the dominant large-scale regime shifts (e.g., monsoon), a dedicated analysis using objective weather-typing techniques would further isolate the effects of synoptic weather regimes on CVS, which is beyond the scope of the current study.
The authors would like to acknowledge the National Meteorological Information Centre (NMIC) of CMA (http://data.cma.cn/en, CMA, 2024) for providing the Ka-band millimeter-wave cloud radar (MMCR) data and radar wind profiler (RWP) data, and the ECMWF for providing ERA5 reanalysis data (Hersbach et al., 2020).
The supplement related to this article is available online at https://doi.org/10.5194/acp-26-14303-2026-supplement.
JG conceptualized this study. HX, JG, and JD carried out the analysis with comments from other co-authors. HX wrote the paper with contribution from JG, RY, DM, JZ, JC, NL, LZ, YZ, and TC provided useful suggestions for the study. BT contributed to the big data analysis. All authors contributed to the improvement of paper.
The contact author has declared that none of the authors has any competing interests.
Publisher's note: Copernicus Publications remains neutral with regard to jurisdictional claims made in the text, published maps, institutional affiliations, or any other geographical representation in this paper. The authors bear the ultimate responsibility for providing appropriate place names. Views expressed in the text are those of the authors and do not necessarily reflect the views of the publisher.
The authors would like to acknowledge the National Meteorological Information Centre (NMIC) of CMA for providing Ka-band millimeter-wave cloud radar (MMCR) data. We would also like to thank the CMA for radar wind profiler (RWP) data, and the ECMWF for ERA5 data.
This research has been supported by the National Natural Science Foundation of China (grant nos. 42325501, 42561160141, and 42505135), the Department of Science and Technology of Guizhou (grant no. KXJZ [2024] 033), the Science and Technology Supporting Project of Guizhou Province (grant no. [2023]236), the Chinese Academy of Meteorological Sciences (grant no. 2024Z003), the Science and Technology Development Fund of the Chinese Academy of Meteorological Sciences (grant no. 2023KJ046), and the State Key Laboratory of Severe Weather Meteorological Science and Technology (grant no. 2025QZA11).
This paper was edited by Thijs Heus and reviewed by three anonymous referees.
An, N., Pinker, R. T., Wang, K., Rogers, E., and Zuo, Z.: Evaluation of cloud base height in the North American regional reanalysis using ceilometer observations, Int. J. Climatol., 40, 3161–3178, https://doi.org/10.1002/joc.6389, 2019.
Bell, B., Hersbach, H., Simmons, A., Berrisford, P., Dahlgren, P., Horányi, A., Muñoz-Sabater, J., Nicolas, J., Radu, R., Schepers, D., Soci, C., Villaume, S., and Thépaut, J.-N.: The ERA5 global reanalysis: Preliminary extension to 1950, Q. J. Roy. Meteor. Soc., 147, 4186–4227, https://doi.org/10.1002/qj.4174, 2021.
Betts, A. K.: Understanding hydrometeorology using global models, B. Am. Meteor. Soc., 85, 1673–1688, https://doi.org/10.1175/BAMS-85-11-1673, 2004.
Betts, A. K.: Land-surface-atmosphere coupling in observations and models, J. Adv. Model Earth Sy., 1, https://doi.org/10.3894/JAMES.2009.1.4, 2009.
Betts, A. K. and Tawfik, A. B.: Annual climatology of the diurnal cycle on the Canadian Prairies, Front. Earth Sci., 4, https://doi.org/10.3389/feart.2016.00001, 2016.
Bonan, G. B.: Forests and climate change: Forcings, feedbacks, and the climate benefits of forests, Science, 320, 1444–1449, https://doi.org/10.1126/science.1155121, 2008.
Bony, S., Stevens, B., Frierson, D. M. W., Jakob, C., Kageyama, M., Pincus, R., Shepherd, T. G., Sherwood, S. C., Siebesma, A. P., and Sobel, A. H.: Clouds, circulation and climate sensitivity, Nat. Geosci, 8, 261–268, https://doi.org/10.1038/NGEO2398, 2015.
Bretherton, C. S. and Wyant, M. C.: Moisture transport, lower-tropospheric stability, and decoupling of cloud-topped boundary layers, J. Atmos. Sci., 54, 148–167, https://doi.org/10.1175/1520-0469(1997)054<0148:MTLTSA>2.0.CO;2, 1997.
Cesana, G. and Waliser, D. E.: Characterizing and understanding systematic biases in the vertical structure of clouds in CMIP5/CFMIP2 models, Geophys. Res. Lett., 43, 10538–10546, https://doi.org/10.1002/2016GL070515, 2016.
Cesana, G. V., Khadir, T., Chepfer, H., and Chiriaco, M.: Southern ocean solar reflection biases in CMIP6 models linked to cloud phase and vertical structure representations, Geophys. Res. Lett., 49, e2022GL099777, https://doi.org/10.1029/2022GL099777, 2022.
Chae, J. H. and Sherwood, S. C.: Insights into cloud-top height and dynamics from the seasonal cycle of cloud-top heights observed by MISR in the West Pacific region, J. Atmos. Sci., 67, 248–261, https://doi.org/10.1175/2009JAS3099.1, 2010.
Chen, D., Guo, J., Yao, D., Lin, Y., Zhao, C., Min, M., Xu, H., Liu, L., Huang, X., Chen, T., and Zhai, P.: Mesoscale convective systems in East Asia from Advanced Himawari Imager: Algorithms and preliminary results, J. Geophys. Res.-Atmos., 124, 2210–2234, https://doi.org/10.1029/2018JD029707, 2019.
Chen, J. H., Wu, X. Q., Yin, Y., Huang, Q., and Xiao, H.: Characteristics of cloud systems over the Tibetan Plateau and East China during boreal summer, J. Climate, 30, 3117–3137, https://doi.org/10.1175/JCLI-D-16-0169.1, 2017.
Chen, P., Yang, L. M., Zeng, Y., Tong, Z. P., and Jiang, Y. F.: Fine vertical structures of cloud from a ground-based cloud radar over the western Tianshan mountains, Meteorol. Appl., 29, e2105, https://doi.org/10.1002/met.2105, 2022.
Chen, Q., Fan, J., Hagos, S., Gustafson Jr., W. I., and Berg, L. K.: Roles of wind shear at different vertical levels: Cloud system organization and properties, J. Geophys. Res.-Atmos., 120, 6551–6574, https://doi.org/10.1002/2015JD023253, 2015.
Chernykh, I. and Eskridge, R.: Determination of cloud amount and level from radiosonde soundings, J. Appl. Meteorol. Clim., 35, 1362–1369, https://doi.org/10.1175/15200450(1996)035<1362:DOCAAL>2.0.CO;2, 1996.
Chi, Y. L., Zhao, C. F., Yang, Y. K., Ma, Z. S., and Yang, J.: Cloud macrophysical characteristics in China mainland and east coast from 2006 to 2017 using satellite active remote sensing observations, Int. J. Climatol., 42, 8984–9002, https://doi.org/10.1002/joc.7790, 2022.
Clothiaux, E. E., Moran, K. P., Martner, B. E., Ackerman, T. P., Mace, G. G., Uttal, T., Mather, J. H., Widener, K. B., Miller, M. A., and Rodriguez, D. J.: The atmospheric radiation measurement program cloud radars: Operational modes, J. Atmos. Ocean. Tech., 16, 819–827, https://doi.org/10.1175/15200426(1999)016<0819:TARMPC>2.0.CO;2, 1999.
Clothiaux, E. E., Ackerman, T. P., Mace, G. G., Moran, K. P., Marchand, R. T., Miller, M. A., and Martner, B. E.: Objective determination of cloud heights and radar reflectivities using a combination of active remote sensors at the ARM CART sites, J. Appl. Meteorol., 39, 645–665, https://doi.org/10.1175/1520-0450(2000)039<0645:ODOCHA>2.0.CO;2, 2000.
Costa-Surós, M., Calbó, J., González, J. A., and Martin-Vide, J.: Behavior of cloud base height from ceilometer measurements, Atmos. Res., 127, 64–76, https://doi.org/10.1016/j.atmosres.2013.02.005, 2013.
Dai, A.: Global precipitation and thunderstorm frequencies. Part II: Diurnal variation, J. Climate, 14, 1112–1128, https://doi.org/10.1175/1520-0422(2001)014<1112:GPATFP>2.0.CO;2, 2001.
Dai, A. G.: The diurnal cycle from observations and ERA5 in surface pressure, temperature, humidity, and winds, Clim. Dynam., 61, 2965–2990, https://doi.org/10.1007/s00382-023-06721-x, 2023.
Ding, Y. and Murakami, M.: Asian Monsoon, China Meteorological Press, Beijing, 1–263, 1994 (in Chinese).
Ding, Y. and Chan, J. C. L.: The East Asian summer monsoon: An overview, Meteor. Atmos. Phys., 89, 117–142, https://doi.org/10.1007/s00703-005-0125-z, 2005.
Domrös, M. and Peng, G.: The Climate of China, Springer-Verlag, Berlin, Heidelberg, New York, xiii, 360 pp., https://doi.org/10.1007/978-3-642-73576-9, 1988.
Duveiller, G., Filipponi, F., Ceglar, A., Bojanowski, J., Alkama, R., and Cescatti, A.: Revealing the widespread potential of forests to increase low level cloud cover, Nat. Commun., 12, 4337, https://doi.org/10.1038/s41467-021-24551-5, 2021.
Eastman, R. and Warren, S. G.: Diurnal cycles of cumulus, cumulonimbus, stratus, stratocumulus, and fog from surface observations over land and ocean, J. Climate, 27, 2386–2404, https://doi.org/10.1175/JCLI-D-13-00352.1, 2014.
Fang, J. J., Huang, K. M., Du, M. K., Zhang, Z. R., Cao, R., and Yi, F.: Investigation on cloud vertical structures based on Ka-band cloud radar observations at Wuhan in Central China, Atmos. Res., 281, 106492, https://doi.org/10.1016/j.atmosres.2022.106492, 2023.
Fu, Y. F., Ma, Y. M., Zhong, L., Yang, Y. J., Guo, X. L., and Wang, C. H., Xu, X. F., Yang, K., Xu, X. D., Liu, L. P., Fan, G. Z., Li, Y. Q., and Wang, D. H.: Land-surface processes and summer-cloud-precipitation characteristics in the Tibetan Plateau and their effects on downstream weather: A review and perspective, Natl. Sci. Rev., 7, 500–515, https://doi.org/10.1093/nsr/nwz226, 2020.
Fung, I. Y., Harrison, D. E., and Lacis, A. A.: On the variability of the net longwave radiation at the ocean surface, Rev. Geophys., 22, 177–193, https://doi.org/10.1029/RG022i002p00177, 1984.
George, G., Sarangi, C., Tripathi, S. N., Chakraborty, T., and Turner, A.: Vertical structure and radiative forcing of monsoon clouds over Kanpur during the 2016 INCOMPASS field campaign, J. Geophys. Res.-Atmos., 123, 2152–2174, https://doi.org/10.1002/2017JD027759, 2018.
Guo, J., Miao, Y., Zhang, Y., Liu, H., Li, Z., Zhang, W., He, J., Lou, M., Yan, Y., Bian, L., and Zhai, P.: The climatology of planetary boundary layer height in China derived from radiosonde and reanalysis data, Atmos. Chem. Phys., 16, 13309–13319, https://doi.org/10.5194/acp-16-13309-2016, 2016.
Guo, J. P., Li, Y., Cohen, J. B., Li, J., Chen, D. D., Xu, H., Liu, L., Yin, J. F., Hu, K. X., and Zhai, P. M.: Shift in the temporal trend of boundary layer height in China using long-term (1979–2016) radiosonde data, Geophys. Res. Lett., 46, 6080–6089, https://doi.org/10.1029/2019GL082666, 2019.
Haliczer, D. T., Mecikalski, J. R., and Kollias, P.: Use of satellite, surface observations and numerical weather prediction model data to improve cloud base height and cloud base vertical velocity estimation, J. Geophys. Res.-Atmos., 130, e2024JD041853, https://doi.org/10.1029/2024JD041853, 2025.
Helfer, K. C., Nuijens, L., de Roode, S. R., and Siebesma, A. P.: How wind shear affects trade-wind cumulus convection, J. Adv. Model. Earth Sy., 12, e2020MS002183, https://doi.org/10.1029/2020MS002183, 2020.
Hersbach, H., Bell, B., Berrisford, P., Hirahara, S., Horányi, A., Muñoz-Sabater, J., Nicolas, J., Peubey, C., Radu, R., Schepers, D., Simmons, A., Soci, C., Abdalla, S., Abellan, X., Balsamo, G., Bechtold, P., Biavati, G., Bidlot, J., Bonavita, M., Chiara, G., Dahlgren, P., Dee, D., Diamantakis, M., Dragani, R., Flemming, J., Forbes, R., Fuentes, M., Geer, A., Haimberger, L., Healy, S., Hogan, R.J., Hólm, E., Janisková, M., Keeley, S., Laloyaux, P., Lopez, P., Lupu, C., Radnoti, G., Rosnay, P., Rozum, I., Vamborg, F., Villaume, S., and Thépaut, J-N.: The ERA5 global reanalysis, Q. J. Roy. Meteor. Soc., 146, 1999–2049, https://doi.org/10.1002/qj.3803, 2020.
Hobbs, P. V., Funk, N. T., Weiss, R. R., Locatelli, J. D., and Biswas, K. R.: Evaluation of a 35 GHz radar for cloud physics research, J. Atmos. Ocean. Tech., 2, 35–48, https://doi.org/10.1175/1520-0426(1985)002<0035:EOAGRF>2.0.CO;2, 1985.
Hollars, S., Fu, Q., Comstock, J., and Ackerman, T.: Comparison of cloud-top height retrievals from ground-based 35 GHz MMCR and GMS-5 satellite observations at ARM TWP Manus site, Atmos. Res., 72, 169–186, https://doi.org/10.1016/j.atmosres.2004.03.015, 2004.
Holloway, C. E. and Neelin, J. D.: Moisture vertical structure, column water vapor, and tropical deep convection, J. Atmos. Sci., 66, 1665–1683, https://doi.org/10.1175/2008JAS2806.1, 2009.
Houze Jr., R. A.: Cloud Dynamics, 2nd ed., International Geophysics Series, Vol. 104, Academic Press, Oxford, 432 pp., ISBN 9780123742667, 2014.
Huang, J., Guo, J., Wang, F., Liu, Z., Jeong, M.-J., Yu, H., and Zhang, Z.: CALIPSO inferred most probable heights of global dust and smoke layers, J. Geophys. Res.-Atmos., 120, 5085–5100, https://doi.org/10.1002/2014JD022898, 2015.
IPCC: Summary for Policymakers, in: Climate Change 2021: The Physical Science Basis. Contribution of Working Group I to the Sixth Assessment Report of the Intergovernmental Panel on Climate Change, edited by: Masson-Delmotte, V., Zhai, P., Pirani, A., Connors, S. L., Péan, C., Berger, S., Caud, N., Chen, Y., Goldfarb, L., Gomis, M. I., Huang, M., Leitzell, K., Lonnoy, E., Matthews, J. B. R., Maycock, T. K., Waterfield, T., Yelekçi, O., Yu, R., and Zhou, B., Cambridge University Press, https://doi.org/10.1017/9781009157896.001, 2021.
Johnson, R. H., Rickenbach, T. M., Rutledge, S. A., Ciesielski, P. E., and Schubert, W. H.: Trimodal characteristics of tropical convection, J. Climate, 12, 2397–2418, https://doi.org/10.1175/1520-0442(1999)012<2397:TCOTC>2.0.CO;2, 1999.
Kalapureddy, M. C. R., Sukanya, P., Das, S. K., Deshpande, S. M., Pandithurai, G., Pazamany, A. L., Ambuj K., J., Chakravarty, K., Kalekar, P., Devisetty, H. K., and Annam, S.: A simple biota removal algorithm for 35 GHz cloud radar measurements, Atmos. Meas. Tech., 11, 1417–1436, https://doi.org/10.5194/amt-11-1417-2018, 2018.
Klein, S. A. and Hartmann, D. L.: The seasonal cycle of low stratiform clouds, J. Climate, 6, 1587–1606, https://doi.org/10.1175/1520-0442(1993)006<1587:TSCOLS>2.0.CO;2, 1993.
Kollias, E., Clothiaux, E., Miller, M. A., Albrecht, B. A., Stephens, G. L., and Ackerman, T. P.: Millimeter-wavelength radars– New frontier in atmospheric cloud and precipitation research, B. Am. Meteor. Soc., 88, 1608–1624, https://doi.org/10.1175/BAMS-88-10-1608, 2007.
Li, J., Yu, R. C., and Zhou, T. J.: Seasonal variation of the diurnal cycle of rainfall in southern contiguous China, J. Climate, 21, 6036–6043, https://doi.org/10.1175/2008JCLI2188.1, 2008.
Li, J. D., Geen, R., Mao, J. Y., Song, Y. J., Vallis, G. K., and Wu, G. X.: Mechanical and thermal forcings of Asian large-scale orography on spring cloud amount and atmospheric radiation budget over East Asia, J. Climate, 36, 5215–5232, https://doi.org/10.1175/JCLI-D-22-0797.1, 2023.
Li, Z., Lau, W.K.-M., Ramanathan, V., Wu, G., Ding, Y., Manoj, M.G., Liu, J., Qian, Y., Li, J., Zhou, T., Fan, J., Rosenfeld, D., Ming, Y., Wang, Y., Huang, J., Wang, B., Xu, X., Lee, S.-S., Cribb, M., Zhang, F., Yang, X., Zhao, C., Takemura, T., Wang, K., Xia, X., Yin, Y., Zhang, H., Guo, J., Zhai, P.M., Sugimoto, N., Babu, S.S., and Brasseur, G.P.: Aerosol and monsoon climate interactions over Asia, Rev. Geophys., 54, 866–929, https://doi.org/10.1002/2015RG000500, 2016.
Luo, Y., Zhang, R., Qian, W., Luo, Z., and Hu, X.: Intercomparison of deep convection over the Tibetan Plateau–Asian monsoon region and subtropical North America in boreal summer using CloudSat/CALIPSO data, J. Climate, 24, 2164–2177, https://doi.org/10.1175/2010JCLI4032.1, 2011.
Liu, B., Guo, J., Gong, W., Shi, L., Zhang, Y., and Ma, Y.: Characteristics and performance of wind profiles as observed by the radar wind profiler network of China, Atmos. Meas. Tech., 13, 4589–4600, https://doi.org/10.5194/amt-13-4589-2020, 2020.
Liu, Y.: Impacts of active satellite sensors' low-level cloud detection limitations on cloud radiative forcing in the Arctic, Atmos. Chem. Phys., 22, 8151–8173, https://doi.org/10.5194/acp-22-8151-2022, 2022.
Mace, G. G., Clothiaux, E. E., and Ackerman, T. P.: The composite characteristics of cirrus clouds: Bulk properties revealed by one year of continuous cloud radar data, J. Climate, 14, 2185–2203, https://doi.org/10.1175/1520-0442(2001)014<2185:TCCOCC>2.0.CO;2, 2001.
Mace, G. G., Benson, S., and Vernon, E.: Cirrus clouds and the large-scale atmospheric state: Relationships revealed by six years of ground-based data, J. Climate, 19, 3257–3278, https://doi.org/10.1175/JCLI3786.1, 2006.
Mace, G. G., Marchand, R., Zhang, Q., and Stephens, G.: Global hydrometeor occurrence as observed by CloudSat: Initial observations from summer 2006, Geophys. Res. Lett., 34, L09808, https://doi.org/10.1029/2006GL029017, 2007.
Marchand, R., Mace, G. G., Ackerman, T., and Stephens, G.: Hydrometeor detection using Cloudsat – An earth-orbiting 94-GHz cloud radar, J. Geophys. Res., 25, 519–533, https://doi.org/10.1175/2007JTECHA1006.1, 2008.
McCaffrey, K., Bianco, L., and Wilczak, J. M.: Improved observations of turbulence dissipation rates from wind profiling radars, Atmos. Meas. Tech., 10, 2595–2611, https://doi.org/10.5194/amt-10-2595-2017, 2017.
Medeiros, B., Nuijens, L., Antoniazzi, C., and Stevens, B.: Low-latitude boundary layer clouds as seen by CALIPSO, J. Climate, 115, D23207, https://doi.org/10.1029/2010JD014437, 2010.
Miao, Y., Guo, J., Liu, S., Wei, W., Zhang, G., Lin, Y., and Zhai, P.: The Climatology of Low-Level Jet in Beijing and Guangzhou, China, J. Geophys. Res.-Atmos., 123, 2816–2830, https://doi.org/10.1002/2017jd027321, 2018.
Mitra, A., Loveridge, J. R., and Di Girolamo, L.: Fusion of MISR stereo cloud heights and Terra-MODIS thermal infrared radiances to estimate two-layered cloud properties, J. Geophys. Res.-Atmos., 128, e2022JD038135, https://doi.org/10.1029/2022JD038135, 2023.
Moran, K. P., Martner, B. E., Post, M. J., Kropfli, R. A., Welsh, D. C., and Widener, K. B.: An unattended cloud-profiling radar for use in climate research, B. Am. Meteor. Soc., 79, 443–455, https://doi.org/10.1175/1520-0477(1998)079<0443:AUCPRF>2.0.CO;2, 1998.
Muhlbauer, A., McCoy, I. L., and Wood, R.: Climatology of stratocumulus cloud morphologies: microphysical properties and radiative effects, Atmos. Chem. Phys., 14, 6695–6716, https://doi.org/10.5194/acp-14-6695-2014, 2014.
Mülmenstädt, J., Sourdeval, O., Henderson, D. S., L'Ecuyer, T. S., Unglaub, C., Jungandreas, L., Böhm, C., Russell, L. M., and Quaas, J.: Using CALIOP to estimate cloud-field base height and its uncertainty: the Cloud Base Altitude Spatial Extrapolator (CBASE) algorithm and dataset, Earth Syst. Sci. Data, 10, 2279–2293, https://doi.org/10.5194/essd-10-2279-2018, 2018.
Myers, T. A. and Norris, J. R.: Observational Evidence That Enhanced Subsidence Reduces Subtropical Marine Boundary Layer Cloudiness, J. Climate, 26, 7507–7524, https://doi.org/10.1175/JCLI-D-12-00736.1, 2013
Oreopoulos, L., Cho, N., and Lee, D.: New insights about cloud vertical structure from CloudSat and CALIPSO observations, J. Geophys. Res.-Atmos., 122, 9280–9300, https://doi.org/10.1002/2017JD026629, 2017.
Pan, Z., Gong, W., Mao, F., Li, J., Wang, W., Li, C., and Min, Q.: Macrophysical and optical properties of clouds over East Asia measured by CALIPSO, J. Geophys. Res.-Atmos., 120, 11–653, https://doi.org/10.1002/2015JD023735, 2015.
Pan, B. W., Liu, D. T., Du, Y. M., Zhao, D. L., Hu, K., Ding, S., Yu, C. J., Tian, P., Wu, Y. Z., Li, S. Y., and Kumar, K. R.: Intercomparisons on the vertical profiles of cloud microphysical properties from CloudSat retrievals over the North China Plain, J. Geophys. Res.-Atmos., 128, e2023JD039093, https://doi.org/10.1029/2023JD039093, 2023.
Poore, K., Wang, J., and Rossow, W.: Cloud layer thick nesses from a combination of surface and upper-air obser vations, J. Climate, 8, 550–568, https://doi.org/10.1175/15200442(1995)008<0550:CLTFAC>2.0.CO;2, 1995.
Ramanathan, V., Cess, R. D., Harrison, E. F., Minnis, P., Barkstrom, B. R., Ahmad, E., and Hartmann, D.: Cloud-radiative forcing and climate: Results from the earth radiation budget experiment, Science, 243, 57–63, https://doi.org/10.1126/science.243.4887.57, 1989.
Richardson, M. T., Roy, R. J., and Lebsock, M. D.: Satellites Suggest Rising Tropical High Cloud Altitude: 2002–2021, Geophys. Res. Lett., 49, e2022GL098160, https://doi.org/10.1029/2022GL098160, 2022.
Richardson, Y. P., Droegemeier, K. K., and Davies-Jones, R. P.: The influence of horizontal environmental variability on numerically simulated convective storms. Part I: Variations in vertical shear, Mon. Weather Rev., 135, 3429–3455, https://doi.org/10.1175/MWR3463.1, 2007.
Rieck, M., Hohenegger, C., and van Heerwaarden, C. C.: The influence of land surface heterogeneities on cloud size development, Mon. Weather Rev., 142, 3830–3846, https://doi.org/10.1175/MWR-D-13-00354.1, 2014.
Riemann-Campe, K., Blender, R., and Fraedrich, K.: Global memory analysis in observed and simulated CAPE and CIN, Int. J. Climatol., 31, 1099–1107, https://doi.org/10.1002/joc.2148, 2011.
Ruan, Z., Mu, R., Wei, M., and Ge, R.: Spectrum analysis of wind profiling radar measurements, J. Meteor. Res., 28, 656–667, https://doi.org/10.1007/s13351-014-3171-y, 2014.
Sathiyamoorthy, V., Pal, P. K., and Joshi, P. C.: Influence of the upper-tropospheric wind shear upon cloud radiative forcing in the Asian monsoon region, J. Climate, 17, 2725–2735, https://doi.org/10.1175/1520-0442(2004)017<2725:IOTUWS>2.0.CO;2, 2004.
Slingo, J. M.: The development and verification of a cloud prediction scheme for the ECMWF model, Q. J. Roy. Meteor. Soc., 113, 899–927, https://doi.org/10.1002/qj.49711347710, 1987.
Stephens, G. L.: Cloud feedbacks in the climate system: A critical review, J. Climate, 18, 237–273, https://doi.org/10.1175/JCLI-3243.1, 2005.
Stephens, G. L., Vane, D. G., Boain, R. J., Mace, G. G., Sassen, K., Wang, Z., Illingworth, A. J., O'Connor, E. J., Rossow, W. B., Durden, S. L., Miller, S. D., Austin, R. T., Benedetti, A., Mitrescu, C., and CloudSat Science Team: The CloudSat mission and the A-Train: A new dimension of space-based observations of clouds and precipitation, B. Am. Meteor. Soc., 83, 1771–1790, https://doi.org/10.1175/BAMS-83-12-1771, 2002.
Shi, Y. and Wang, G. L.: Changes in building climate zones over China based on high-resolution regional climate projections, Environ. Res. Lett., 15, 114045, https://doi.org/10.1088/1748-9326/abbde8, 2020.
Shupe, M. D., Daniel, J. S., De Boer, G., Eloranta, E. W., Kollias, P., Luke, E. P., Long, C. N., Turner, D. D., and Verlinde, J.: A focus on mixed-phase clouds: The status of ground-based observational methods, B. Am. Meteor. Soc., 89, 1549–1562, https://doi.org/10.1175/2008BAMS2378.1, 2008.
Shupe, M. D., Walden, V. P., Eloranta, E., Uttal, T., Campbell, J. R., Starkweather, S. M., and Shiobara, M.: Clouds at Arctic Atmospheric Observatories. Part I: Occurrence and Macrophysical Properties, J. Appl. Meteorol. Clim., 50, 626–644, https://doi.org/10.1175/2010JAMC2467.1, 2011.
Spracklen, D. V., Arnold, S. R., and Taylor, C. M.: Observations of increased tropical rainfall preceded by air passage over forests, Nature, 489, 282–285, https://doi.org/10.1038/nature11390, 2012.
Stephens, G. L., Wild, M., Stackhouse, P. W., L'Ecuyer, T., Kato, S., and Henderson, D. S.: The global character of the flux of downward Longwave radiation., J. Climate, 25, 2329–2340, https://doi.org/10.1175/jcli-d-11-00262.1, 2012.
Syktus, J. I. and McAlpine, C. A.: More than carbon sequestration: Biophysical climate benefits of restored savanna woodlands, Nature Sci. Rep., 6, 29194, https://doi.org/10.1038/srep29194, 2016.
Trivedi, P. K., van Hooff, J. T., Sierra Delgado, A., Laan, K. C. A., Smook, A. C., and van Daal, B. T.: Cloud-base heights over different land-use classes: Learnings of a distributed LogTag network in and around the Guatemalan Cloud Forest, TU Delft Student Rep., 2025, https://repository.tudelft.nl/record/uuid:4fb0dff2-6dfa-41b9-bca1-fc61af140f1c (last access: 16 February 2026), 2025.
Taszarek, M., Allen, J., Púčik, T., Groenemeijer, P., Czernecki, B., Kolendowicz, L., Lagouvardos, K., Kotroni, V., and Schulz, W.: A climatology of thunderstorms across Europe from a synthesis of multiple data sources, J. Climate, 32, 1813–1837, https://doi.org/10.1175/JCLI-D-18-0372.1, 2019.
Ulaby, F. T., Moore, R. K., and Fung, A. K.: Microwave Remote Sensing: Active and Passive, Vol. I: Microwave Remote Sensing Fundamentals and Radiometry, Artech House, Norwood, MA, 1981.
Viúdez-Mora, A., Costa-Surós, M., Calbó, J., and González, J.A.: Modeling atmospheric longwave radiation at the surface during overcast skies: The role of cloud base height, J. Geophys. Res.-Atmos., 120, 199–214, https://doi.org/10.1002/2014JD022310, 2015.
Voigt, A., Albern, N., Ceppi, P., Grise, K., Li, Y., and Medeiros, B.: Clouds, radiation, and atmospheric circulation in the present-day climate and under climate change, Wires Clim. Change, 12, e694, https://doi.org/10.1002/wcc.694, 2021.
Wang, J. and Rossow, W.: Determination of cloud vertical structure from upper-Air observations, J. Appl. Meteorol., 34, 2243–2258, https://doi.org/10.1175/15200450(1995)034<2243:DOCVSF>2.0.CO;2, 1995.
Wang, D., Guo, J. P., Xu, H., Li, J., Lv, Y. M., Solanki, R., Guo, X. R., Han, Y., Chen, T. M., Ding, M. H., Chen, A. J., Bian, L. G., and Rinke, A.: Vertical structures of temperature inversions and clouds derived from high-resolution radiosonde measurements at Ny-Ålesund, Svalbard, Atmos. Res., 254, 105530, https://doi.org/10.1016/j.atmosres.2021.105530, 2021.
Wang, Y., Zeng, X., Xu, X., Welty, J., Lenschow, D. H., Zhou, M., and Zhao, Y.: Why are there more summer afternoon low clouds over the Tibetan Plateau compared to eastern China?, Geophys. Res. Lett., 47, e2020GL089665, https://doi.org/10.1029/2020GL089665, 2020.
Wang, Z. and Sassen, K.: Cloud type and macrophysical property retrieval using multiple remote sensors, J. Appl. Meteorol., 40, 1665–1682, https://doi.org/10.1175/1520-0450(2001)040<1665:CTAMPR>2.0.CO;2, 2001.
Wang, Z., Wang, Z. H., and Cao, X. Z.: Consistency analysis for cloud vertical structure derived from millimeter cloud radar and radiosonde profiles, Acta Meteorol. Sin., 74, 815–826, https://doi.org/10.11676/qxxb2016.057, 2016.
Wei, W., Zhang, H. S., and Ye, X. X.: Comparison of low-level jets along the north coast of China in summer, J. Geophys. Res.-Atmos., 119, 9692–9706, https://doi.org/10.1002/2014jd021476, 2014.
Weisman, M. L. and Rotunno, R.: The use of vertical wind shear versus helicity in interpreting supercell dynamics, J. Atmos. Sci., 57, 1452–1472, https://doi.org/10.1175/1520-0469(2000)057<1452:TUOVWS>2.0.CO;2, 2000.
Weare, B. C.: Insights into the importance of cloud vertical structure in climate, Geophys. Res. Lett., 27, 907–910, https://doi.org/10.1029/1999GL011214, 2000.
Williams, K. D., Ringer, M. A., Senior, C. A., Webb, M. J., McAvaney, B. J., Andronova, N., Bony, S., Dufresne, J. L., Emori, S., and Gudgel, R.: Evaluation of a component of the cloud response to climate change in an intercomparison of climate models, Clim. Dynam., 26, 145–165, https://doi.org/10.1007/s00382-005-0067-7, 2006.
Wielicki, B. A., Cess, R. D., King, M. D., Randall, D. A., and Harrison, E. F.: Mission to planet Earth: Role of clouds and radiation in climate, B. Am. Meteor. Soc., 76, 2125–2154, https://doi.org/10.1175/1520-0477(1995)076<2125:MTPERO>2.0.CO;2, 1995.
Wild, M.: New Directions: A facelift for the picture of the global energy balance, Atmos. Environ., 55, 366–367, https://doi.org/10.1016/j.atmosenv.2012.03.022, 2012.
Wood, R.: Stratocumulus Clouds, Mon. Weather Rev., 140, 2373–2423, https://doi.org/10.1175/MWR-D-11-00121.1, 2012.
Wood, R. and Bretherton, C. S.: On the relationship between stratiform low cloud cover and lower-tropospheric stability, J. Climate, 19, 6425–6432, https://doi.org/10.1175/JCLI3988.1, 2006.
Xu, H., Guo, J., Li, J., Liu, L., Chen, T., Guo, X., Lv, Y., Wang, D., Han, Y., Chen, Q., and Zhang, Y.: Significant Role of Radiosonde-measured Cloud-base Height in Estimating Cloud Radiative Forcing, Adv. Atmos. Sci., 38, 1552–1565, https://doi.org/10.1007/s00376-021-0431-5, 2021.
Xu, H., Guo, J., Tong, B., Zhang, J., Chen, T., Guo, X., Zhang, J., and Chen, W.: Characterizing the near-global cloud vertical structures over land using high-resolution radiosonde measurements, Atmos. Chem. Phys., 23, 15011–15038, https://doi.org/10.5194/acp-23-15011-2023, 2023.
Xu, H., Guo, J., Chen, T., Wang, Y., Deng, J., and Tong, B.: Do aerosols induce the differences in low cloud frequency between eastern China and eastern United States?, Atmos. Res., 318, 107994, https://doi.org/10.1016/j.atmosres.2025.107994, 2025.
Xu, R. Li, Y., Teuling, A. J., Spracklen, D. V., Garcia-Carreras, L., Meier, R., Chen, L., Zheng, Y. T., Lin, H. Q., and Fu, B. J.: Contrasting impacts of forests on cloud cover based on satellite observations, Nat. Commun., 13, 670, https://doi.org/10.1038/s41467-022-28161-7, 2022.
Yang, J., Liu, E. H., Liu, Y. B., Lin, Y. J., Yin, Y., and Jing, X. Q.: Impact of vertical wind shear on summer orographic clouds over Tian Shan Mountains: A case study based on radar observation and numerical simulation, Remote Sens., 14, 1583, https://doi.org/10.3390/rs14071583, 2022.
Ye, D. Z. and Gao, Y. X.: Meteorology of the Tibetan Plateau, Science Press, Beijing, 278 pp., 1979 (in Chinese).
Yin, J., Wang, D., Xu, H., and Zhai, G.: An investigation into the three-dimensional cloud structure over East Asia from the CALIPSO-GOCCP Data, Sci. China Earth Sci., 58, 2236–2248, https://doi.org/10.1007/s11430-015-5175-9, 2015.
Yu, R., Yu, Y., and Zhang, M.: Comparing cloud radiative properties between the eastern China and the Indian monsoon region, Adv. Atmos. Sci., 18, 1090–1101, https://doi.org/10.1007/s00376-001-0025-1, 2001.
Zelinka, M. D. and Hartmann, D. L.: Why is longwave cloud feedback positive?, J. Geophys. Res., 115, 1–16, https://doi.org/10.1029/2010JD013817, 2010.
Zhang, C., Zhao, D. F., Gao, Y. H., Song, Z., Zhao, B., and Wang, G. Y.: Increasing summertime low-level cloud cover associated with increasing vegetation in China from 2003 to 2022, Environ. Res. Lett., 19, 124061, https://doi.org/10.1088/1748-9326/ad8cee, 2024.
Zhang, Y., Sperber, K. R., and Boyle, J. S.: Climatology and interannual variation of the East Asian winter monsoon: Results from the 1979–95 NCEP/NCAR reanalysis, Mon. Weather Rev., 125, 2605–2619, https://doi.org/10.1175/1520-0493(1997)125<2605:CAIVOT>2.0.CO;2, 1997.
Zhao, C. F., Chen, Y. Y., Li, J. M., Letu, H., Su, Y. F., Chen, T. M., and Wu, X. L.: Fifteen-year statistical analysis of cloud characteristics over China using Terra and Aqua Moderate Resolution Imaging Spectroradiometer observations, Int. J. Climatol., 39, 2612–2629, https://doi.org/10.1002/joc.5975, 2019.
Zhao, W., Marchand, R., and Fu, Q.: The diurnal cycle of clouds and precipitation at the ARM SGP site: Cloud radar observations and simulations from the multiscale modeling framework, J. Geophys. Res.-Atmos., 122, 7519–7536, https://doi.org/10.1002/2016JD026353, 2017.
Zhou, Q., Zhang, Y., Li, B., Li, L. X., Feng, J. M., Jia, S. Z., Lv, S. S., Tao, F., and Guo, J.: Cloud-base and cloud-top heights determined from a ground-based cloud radar in Beijing, China, Atmos. Enviorn., 201, 381–390, https://doi.org/10.1016/j.atmosenv.2019.01.012, 2019.
Zhou, X. X., Xie, B., Zhang, H., He, J. Y., and Chen, Q.: Decomposition of fast and slow cloud responses to quadrupled CO2 forcing in BCC-AGCM2.0 over East Asia, Adv. Atmos. Sci., 39, 2188–2202, https://doi.org/10.1007/s00376-022-1441-7, 2022.
Zhang, J. Q, Chen, H. B., Li, Z. Q., Fan, X. H., Peng, L. A., Yu, Y., and Cribb, M.: Analysis of cloud layer structure in Shouxian, China using RS92 radiosonde aided by 95 GHz cloud radar, J. Geophys. Res.-Atmos., 115, D00K30, https://doi.org/10.1029/2010JD014030, 2010.
Zhang, Y. and Klein, S. A.: Factors controlling the vertical extent of fair-weather shallow cumulus clouds over land: Investigation of diurnal-cycle observations collected at the ARM Southern Great Plains site, J. Atmos. Sci., 70, 1297–1315, https://doi.org/10.1175/JAS-D-12-0131.1, 2013.
Zhang, Y., Zhang, L. J., Guo, J. P., Feng, J. M., Cao, L. J., Wang, Y., Zhou, Q., Li, L. X., Li, B., Xu, H., Liu, L., An, N., and Liu. H.: Climatology of cloud-base height from long-term radiosonde measurements in China, Adv. Atmos. Sci., 35, 158–168, https://doi.org/10.1007/s00376-017-7096-0, 2018.
Zhang, Y., Zhou, Q., Lv, S. S., Jia, S. Z., Tao, F., Chen, D. D., and Guo, J. P.: Elucidating cloud vertical structures based on three-year Ka-band cloud radar observations from Beijing, China, Atmos. Res., 222, 88–99, https://doi.org/10.1016/j.atmosres.2019.02.007, 2019.