
the Creative Commons Attribution 4.0 License.
the Creative Commons Attribution 4.0 License.
 | 01 Oct 2026
Tropospheric OH and its trends: new insight into atmospheric processes and implications for methane lifetime

Oliver Wild
Andrea Mazzeo
Richard J. Pope
Siyuan Wang
Yuanhong Zhao
James Lee
Bin Zhu
Tianliang Zhao
Alok K. Pandey
The hydroxyl radical (OH) is a critical determinant of global oxidative capacity and trace gas lifetimes, but its variation remains poorly constrained. This study investigates the sensitivity of modelled tropospheric OH concentration changes to new understanding of physical and chemical processes using the FRSGC/UCI chemistry transport model. We show that simulated tropospheric O3 and NO2 agree well with satellite observations, but that annual variations in CO do not, likely due to uncertainties in biomass burning emissions in the southern hemisphere and overestimated CO trends over Asia. This discrepancy, along with the background increase in CO, may lead to an underestimation of OH increase or overestimation of OH decrease from 2000 to 2017. Changes in tropospheric OH column show substantial spatial heterogeneity, with increases in OH in high-emission regions and decreases in the tropics. Global mean OH trends are dependent on the assumed trend in emissions: with time-varying emissions there is little change in OH, while under annually invariant emissions, OH increases in response to changes in meteorological conditions. Inclusion of water vapor UV absorption, heterogeneous reactions, and updates to the OH+NO2 reaction rate have a smaller impact, but decrease OH levels by 3.6 %, 5.8 %, and 7.0 %, respectively, increasing CH4 lifetimes by 4.2 %, 5.2 %, and 8.4 %. Incorporating oceanic CH3CHO emissions reduces global mean OH by up to 1.5 %, increasing the CH4 lifetime by up to 1.6 %. These results provide a quantitative basis for understanding the drivers of tropospheric OH variability and their implications for global methane chemistry.
- Article
(14554 KB) - Full-text XML
-
Supplement
(2158 KB) - BibTeX
- EndNote


The hydroxyl radical (OH) is one of the most critical reactive species in the troposphere, regarded as the atmosphere's primary cleansing agent due to its role in initiating the oxidation of a wide array of trace gases, including nitrogen oxides (NOx), methane (CH4), carbon monoxide (CO), and most volatile organic compounds (VOCs) (Holmes et al., 2013; Turner et al., 2019). The abundance and distribution of OH strongly influences the overall oxidative capacity of the atmosphere, thus affecting the lifetime of species relevant to both air quality and climate (Crutzen, 1979; Lawrence et al., 2001; Naik et al., 2013; Zhao et al., 2019). Understanding the variability in OH and exploring the underpinning drivers is thus of major importance for predicting future atmospheric composition, including the interactions between natural and anthropogenic emissions and climate change (Voulgarakis et al., 2013; Lelieveld et al., 2016; Stevenson et al., 2020; Anderson et al., 2021; Chua et al., 2023, 2026; Liu et al., 2024).
Changes in OH concentrations are driven by a multitude of factors, including variations in precursor emissions, meteorological conditions, and the availability of sunlight and water vapor, all of which affect photochemical reaction rates (Logan et al., 1981; Brasseur and Solomon, 2005). The balance between OH production and loss is governed by a set of interconnected processes, notably ozone (O3) photolysis, reactions with CH4 and CO, and regeneration cycles involving NOx and organic peroxy radicals (RO2) (Fiore et al., 2024). These complex photochemical processes collectively result in a highly heterogeneous spatial and temporal distribution of OH, with concentrations typically peaking in tropical regions where both solar radiation and water vapor are most abundant (Spivakovsky et al., 2000; Anderson et al., 2024).
An important finding from model intercomparisons is that most chemical transport models (CTMs) and chemistry-climate models (CCMs) underestimate the CH4 lifetime against OH oxidation in the troposphere (τCH4) compared to estimates based on observations. Multi-model mean values of τCH4 from the Hemispheric Transport of Air Pollution (HTAP), Atmospheric Composition Change: the European Network of Excellence (ACCENT), and Atmospheric Chemistry and Climate Model Intercomparison Project (ACCMIP) model intercomparisons were 10.2 (±1.7), 9.7 (±1.7) and 9.7 (±1.5) years, respectively (Shindell et al., 2006; Fiore et al., 2009; Naik et al., 2013), whereas observationally-constrained estimates, such as those of Prather et al. (2012), suggest a longer τCH4 of 11.2 (±1.3) years. This bias in τCH4 implies that most models overestimate OH concentrations. However, a multitude of processes influence OH concentration, including uncertainties in precursor emissions and in the representation of physical and chemical processes, many of which are relatively poorly understood and/or offer limited observational constraint (e.g. Fiore et al., 2024). Detailed sensitivity analysis also reveals that the drivers of OH concentration and its variability can differ substantially across models (Wild et al., 2020), making it challenging to attribute the causes of OH biases. Several previously neglected or uncertain physical and chemical processes may contribute to uncertainties in simulated OH, but the magnitude of their impacts remains insufficiently quantified. Better constraining these process-level effects is therefore important for understanding the high-OH bias commonly found in global models and, more broadly, for improving simulations of atmospheric oxidative capacity.
Among the processes that have recently received increased attention is the absorption of ultraviolet radiation (UV) by water vapour (H2O), which was previously thought to be minor. Prather and Zhu (2024) showed that inclusion of this process in a global CTM reduced OH primary production and increased τCH4 by ∼4 %. The study highlighted that water vapour UV absorption may partly resolve some of the apparent low τCH4 bias present in other models.
Second, while the potential importance of heterogeneous chemistry for tropospheric oxidants is well established from lab studies (e.g. Thornton et al., 2003; Stewart et al., 2004), observations (e.g. Cantrell et al., 1996; Tabazadeh et al., 2004) and modelling work (e.g. Jacob, 2000; Tie et al., 2003; Macintyre and Evans, 2010), recent findings have reaffirmed and extended current understanding. Using the GEOS-Chem CTM with revised uptake coefficients, Holmes et al. (2019) showed that inclusion of heterogeneous NOx chemistry increased the simulated τCH4 by 6.9 % relative to a model run without heterogeneous chemistry. Contrary to some previous findings, they showed that heterogeneous chemistry on clouds exerts an effect of similar magnitude to that occurring on aerosols. Holmes et al. (2019) also emphasized the importance of accounting for entrainment limitations when parameterizing cloud heterogeneous processes, an approach that has yet to be adopted in most models. The effects of heterogeneous chemistry on tropospheric composition have also been examined by Ha et al. (2021) who reported an increase in τCH4 of 5.9 % due to its inclusion in the CHASER MIROC Earth System Model.
Third, more detailed measurements of the rate coefficient for the termolecular OH+NO2 reaction (kOH+NO2) have been reported by Amedro et al. (2019, 2020) and Rolletter et al. (2025). The rate of this reaction exerts a strong influence on the tropospheric abundance of NOx and OH and is therefore of fundamental importance (e.g. Newsome and Evans, 2017; Christian et al., 2018). The two new studies report that kOH+NO2 shows only a weak dependence on water vapor over the tested range of partial pressures. They recommend a rate coefficient of (1.23 ± 0.04) × 10−11 cm3 s−1 at 295 K and 1 atm. We compare this with the value of cm3 s−1 at 298 K and 1 atm for the pathway recommended by the most recent NASA–Jet Propulsion Laboratory (JPL) report (Burkholder et al., 2020), neglecting the role of the alternative HOONO formation pathway which is assumed to reform OH and NO2.
Fourth, positive sea-to-air fluxes of a range of oxygenated VOCs have been observed in field studies (e.g. Yang et al., 2014; Phillips et al., 2021). While the magnitude and variability of these VOC emissions remain uncertain, in the remote marine boundary layer these species may provide a substantial local OH sink, with oceanic emissions of acetaldehyde (CH3CHO) postulated as being particularly important (e.g. Read et al., 2012). To date, there have been very few global model assessments of the significance of this effect, but a growing number of studies highlight oceanic CH3CHO emissions as a contributor to missing OH reactivity and hence a cause of bias in estimates of CH4 lifetime (e.g. Wang et al., 2019; Travis et al., 2020). Taken together, these recent findings motivate a systematic assessment of their impacts within a common modelling framework, allowing their effects on OH and methane lifetime to be quantified consistently and their potential implications for improving global OH simulations to be evaluated. Alongside constraining the processes that lead to OH production and loss, over the past few decades numerous observational and modeling studies have sought to quantify interannual variability and possible trends in OH concentration, both regionally and globally. While direct measurements of OH concentration are challenging due to its short atmospheric lifetime (on the order of seconds), indirect methods such as inverse modeling based on the observed atmospheric burdens of CH4 and methyl chloroform (MCF) have provided valuable insights (Montzka et al., 2011; Naik et al., 2013; Patra et al., 2021; Prinn et al., 2000; Thompson et al., 2024). In addition, satellite observations combined with steady-state chemical approaches have recently been used to infer mid-tropospheric OH variability, suggesting relatively stable OH over time with O3 as a primary driver and CO playing a larger role during intense biomass burning years (Pimlott et al., 2022). Although these studies suggest that global mean OH concentration has remained relatively stable, with fluctuations driven by interannual variability in the emissions of OH precursors and sinks such as CO, VOCs, and NOx, as well as by meteorological factors (Prinn et al., 2000; Turner et al., 2017), substantial uncertainties persist regarding the temporal trends in regional OH concentration, particularly in the tropics and mid-latitudes (Patra et al., 2014; Anderson et al., 2024). Some studies indicate a decrease in OH from about 2005 (Rigby et al., 2017; McNorton et al., 2016). Other studies have found evidence of increasing OH during 1980–2010 dominated by elevated primary production and reduced loss of OH due to decreasing CO after 2005 (Chua et al., 2023; Stevenson et al., 2020; Zhao et al., 2020). Attributing OH variability remains challenging, with different models showing widely differing responses in OH concentrations to changes in these drivers, particularly to NOx and humidity (Wild et al., 2020; Nicely et al., 2020). These discrepancies highlight the importance of improving both observational coverage and model representation of OH-related processes in the troposphere.
In this study, we employ a global CTM to (1) quantify the effects of several recently identified or updated processes, including UV absorption by water vapour, heterogeneous chemistry, the kOH+NO2 rate coefficient, and oceanic CH3CHO emissions, on global and regional OH concentrations and methane lifetime, and assess whether their improved representation could help reduce the high-OH (low-τCH4) bias commonly found in global models; and (2) analyze the interannual variability and trends of global and regional OH since 2000 and quantify the contributions of changes in emissions and meteorology to these trends. The paper is structured as follows. Section 2 describes the CTM and recent updates, including the addition of heterogeneous chemistry on cloud and aerosol surfaces. It also describes the model sensitivity experiments that were performed and the observational datasets used to evaluate the model. Section 3 provides an evaluation of the CTM, focusing on its ability to reproduce measurements of key gases relevant to the OH budget (e.g. tropospheric O3, NOx, CO). Our main results are presented in Sect. 4, including our model sensitivity analysis of global and regional OH concentrations, OH budgets, impacts of oceanic CH3CHO emissions, and regional and global OH trends. A summary with concluding remarks is given in Sect. 5.
2.1 Chemistry Transport Model
The global chemistry transport model (CTM) used here is the Frontier Research System for Global Change version of the University of California, Irvine (FRSGC/UCI CTM) described in Wild and Prather (2000). The model has been widely used to study the chemistry and transport of tropospheric trace gases, including O3 and OH (Wild et al., 2020), and the results have contributed to model intercomparison studies such as the Hemispheric Transport of Air Pollution (HTAP) project (Fiore et al., 2009). The offline CTM uses meteorological data generated with the European Centre for Medium-Range Weather Forecasts (ECMWF) Integrated Forecasting System (IFS) version Cy38r1. In this work, the model was run at a T42 horizontal resolution (2.8°×2.8°) with 57 vertical levels extending from the surface to 0.1 hPa.
2.2 Gas phase chemistry
The model includes an explicit treatment of chemistry, CH4 oxidation, and lumped non-methane hydrocarbon (NMHC) chemistry for the representative species butane, propene, xylene and isoprene (Wild, 2007). The updated version of the CTM used here contains 75 bimolecular reactions, 15 termolecular reactions and 21 photolysis reactions, summarized in Tables S1–S3 in the Supplement. Rate constants are principally taken from the most recent JPL evaluation (Burkholder et al., 2020). A notable exception is for the reaction of OH+NO2 for which we use the expressions given by Amedro et al. (2019). Recent updates to the model also include a treatment of H2O ultraviolet absorption following Prather and Zhu (2024).
2.3 Heterogeneous chemistry
For this study we have added a treatment of heterogeneous chemistry to the model. This uses a standard reaction probability formulation (e.g. Jacob, 2000) based on prescribed uptake coefficients (γ) for different cloud particles and aerosol surfaces. The first order rate coefficient, k (s−1), for the heterogeneous removal of a species to cloud or aerosol is expressed as:
where c is the mean square molecular speed (cm s−1) and SAD (cm2 cm−3) is the available cloud particle or aerosol surface area density. The molecular speed is given by:
where R is the ideal gas constant (8.315 ), T is temperature (K) and M is the molar mass of the gas (kg mol−1).
A summary of the heterogeneous reactions included in the CTM is given in Table S4. These include the hydrolysisof N2O5 to form nitric acid on cloud ice and liquid water droplets and on five aerosol types: sea-salt, dust, sulphate, black carbon and organic carbon. We also include heterogeneous reactions of NO2, NO3 and HO2 on the same sets of surfaces. The adopted γ values for each surface, some of which depend on temperature and relative humidity, are taken from the literature and summarized in Table S4.
For cloud ice and liquid water droplets, tropospheric surface area density is calculated online using the ice water content (IWC) and liquid water content (LWC) fields from the ECMWF IFS meteorological data and following the expressions outlined by Holmes et al. (2019).
In Eqs. (3) and (4) above, ρ denotes the density of ice (916.7 kg m−3) and liquid water (1000 kg m−3), respectively. The effective radius (r(T)) for ice particles is calculated as a function of temperature (T) using the empirically-based parameterization of Heymsfield et al. (2014). For liquid water droplets, r is assumed to be 10 µm for marine clouds and 7 µm for continental clouds. When considering the impacts of heterogeneous processes on cloud or ice surfaces, we account for the limitation on uptake due to entrainment of air into clouds under partially cloudy conditions following Holmes et al. (2019), applying the cloud volume fraction from the meteorological fields and assuming a characteristic time scale of one hour.
For aerosols, tropospheric surface area density was calculated from the aerosol climatology described by Bozzo et al. (2020). This climatology provides monthly mean aerosol mass for five components (sea-salt, dust, sulphate, black carbon and organic carbon) and is based on a reanalysis of atmospheric composition from the Copernicus Atmosphere Monitoring Service (CAMS) over the period 2003–2013. We derived the surface area density for each aerosol type using the particle density, modal radius and size distribution given by Bozzo et al. (2020), accounting for hygroscopic growth governed by the ambient humidity. The resulting annual mean surface area density fields at the surface and in the troposphere are shown in Figs. S1 and S2 in the Supplement. Note that the aerosol distributions are prescribed and are used only to represent their effects on chemistry and photolysis; aerosol formation and transport are not interactively simulated. The monthly climatology captures seasonal variations but does not account for interannual variability, and this may limit our assessment of the effects of aerosol heterogeneous chemistry on OH trends.
2.4 Emissions
In the base run of the model, monthly emissions of CO, NOx and non-methane volatile organic compounds (NMVOCs) are prescribed largely from CAMS datasets. Anthropogenic emissions are from version 6.2 of the CAMS-GLOB-ANT inventory (Soulie et al., 2024), aircraft emissions from version 2.1 of CAMS-GLOB-AIR (Granier et al., 2019), biogenic emissions from version 3.1 of CAMS-GLOB-BIO (Sindelarova et al., 2022) and soil NOx emissions from version 2.4 of CAMS-GLOB-SOI (Simpson and Darras, 2021). Fire emissions are taken from the Global Fire Emissions Database, Version 4.1 (GFED4s) inventory (van der Werf et al., 2017). All emissions vary annually over our full simulation period. Ocean emissions of CO and selected hydrocarbons are taken from the POET emission inventory and are assumed to be climatological (Granier et al., 2005). Lightning NOx emissions are calculated interactively in the model as a function of convective air mass flux at 440 hPa following Allen and Pickering (2002) and Pickering et al. (1998), and vary annually, providing a source of ∼5 Tg [N] yr−1.
For each emitted tracer, annual global total emissions over our study period (2000 to 2017) are shown in Fig. S3. For CH4, an annual and latitudinally varying mixing ratio is prescribed using the historical forcing data prepared for CMIP6 from 2000 until 2014 (Meinshausen et al., 2017). After 2014, to match the observed record, the fields are scaled by a globally uniform factor derived from CH4 measurements from the National Oceanic and Atmospheric Administration (NOAA) global monitoring network.
2.5 Model runs
A total of nine model hindcast runs were conducted. Seven of these were long-term runs spanning the period 2000–2017, and two were shorter sensitivity runs covering 2016–2017 only. All runs included a spin-up over the preceding 20-month period. The control run (CTL) included the updated physical and chemical processes detailed above, including UV water vapor absorption and heterogeneous chemistry, but did not include oceanic emissions of CH3CHO. Sensitivity runs were then performed to quantify the OH response to different processes. These include a run with fixed emissions from the year 2000 (fixEmis), a run without UV water vapor absorption (noWVA), a run without heterogeneous chemistry on cloud surfaces (noCloud), a run without heterogeneous chemistry on aerosol surfaces (noAero), a run without heterogeneous chemistry on both cloud and aerosol surfaces (noHete), a run with kOH+NO2 taken from the most recent JPL evaluation (JPL) and two shorter runs (ALD-cesm and ALD-geoc) that included oceanic emissions of CH3CHO. A summary of model runs is provided in Table 1.
Table 1Summary of model experiments and settings. Bold text indicates settings in each sensitivity experiment that differ from those in the CTL simulation.
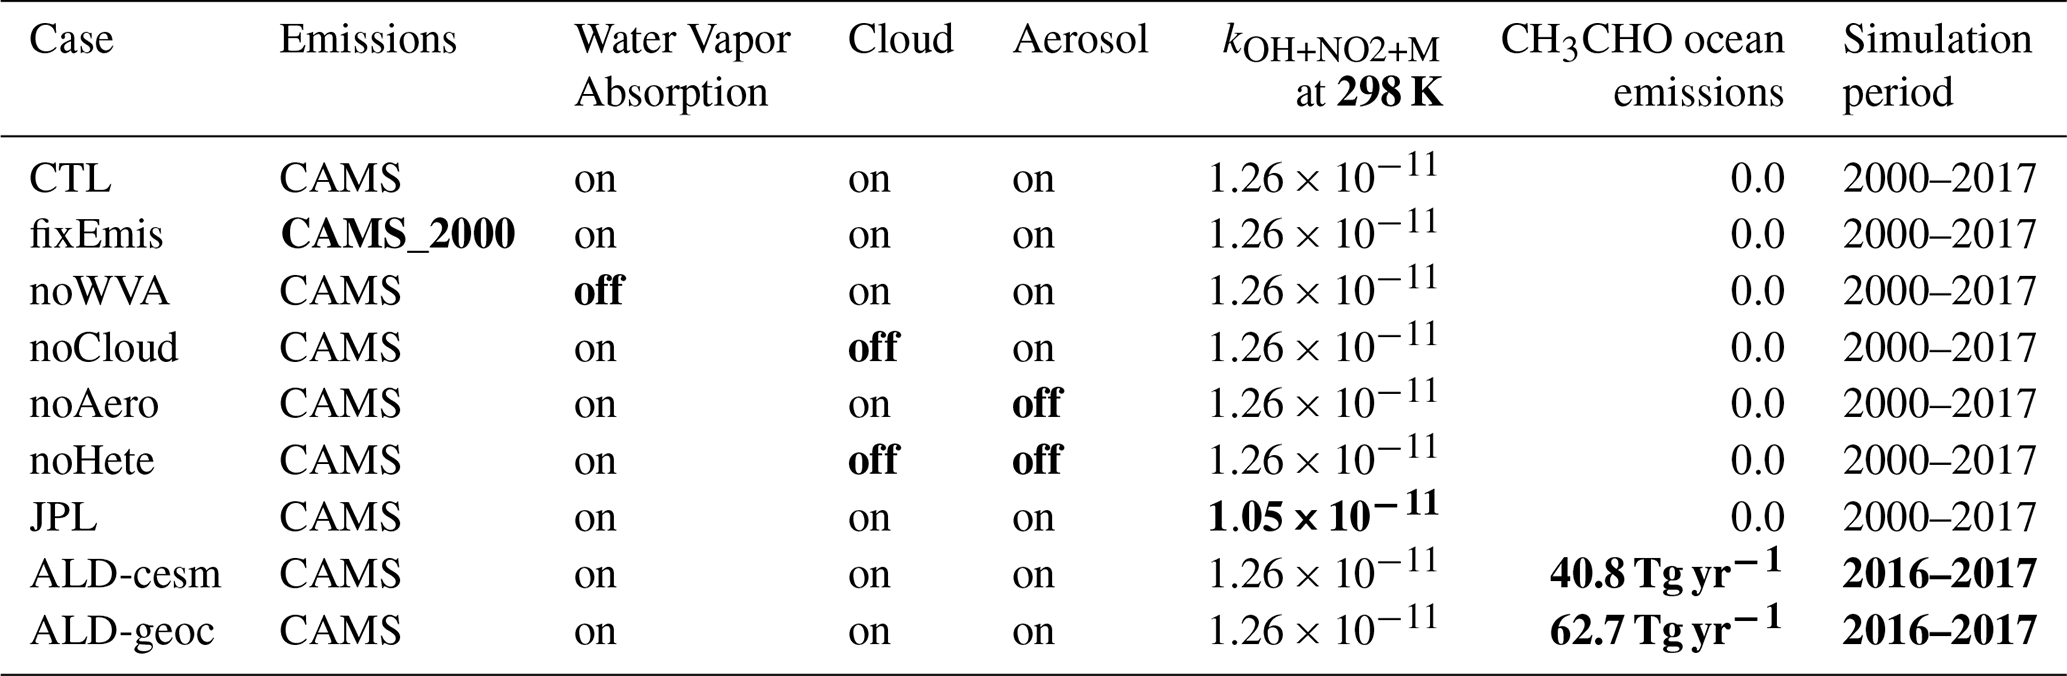
Notes: CAMS_2000 indicates that all emissions and prescribed CH4 are fixed to year 2000 levels, but meteorology varies annually. Cloud refers to the heterogeneous chemistry of N2O5, NO2, NO3, and HO2 on cloud surfaces (cloud water droplet, cloud ice). Aerosol refers to the heterogeneous chemistry of N2O5, NO2, NO3, and HO2 on five aerosol surfaces (sea salt, dust, black carbon, organic carbon, and sulfate). The reaction coefficient of OH+NO2 at 298 K (kOH+NO2+M, ) is calculated based on the equations in Table S2. Run JPL used the rate constant from Burkholder et al. (2020).
In the subsequent sections, differences between each sensitivity run and the control are used to quantify the response of global mean OH concentration and τCH4 to the respective process. We also examine how these factors influence the temporal trends in OH. Run fixEmis is designed to isolate the effect of meteorological variability on OH. Heterogeneous reactions occurring on cloud and aerosol surfaces may compete for the same species (Holmes et al., 2019), and therefore sensitivity runs were designed to isolate the effects of clouds and aerosols separately, and also to examine their combined impact. Run JPL is used for quantifying the impacts of the updated rate constant for the key OH+NO2 reaction (Amedro et al., 2019, 2020) on OH and to compare with previous studies (Burkholder et al., 2020). The impact of processes already represented in the control run, such as water vapor UV absorption and heterogeneous chemistry, are quantified by removing them in the corresponding sensitivity runs. Oceanic CH3CHO emissions remain highly uncertain, as reflected in the substantial difference between the two emission estimates considered here, and are therefore not included in the control run. We therefore consider two separate sensitivity runs, ALD-cesm and ALD-geoc, to assess the potential impact of oceanic CH3CHO emissions and the sensitivity of this impact to the prescribed oceanic source.In the control run, CH3CHO emissions are prescribed from biogenic (15.5 Tg yr−1), biomass burning (2.9 Tg yr−1), and anthropogenic (9.3 Tg yr−1) sources only. Runs ALD-cesm and ALD-geoc are identical to the control run except that they additionally include a prescribed monthly oceanic CH3CHO source. The two oceanic emission estimates were obtained from models incorporating online parameterizations of the sea-air flux of CH3CHO. Run ALD-cesm uses CH3CHO emissions for the year 2015 obtained from the Community Earth System Model, version 2.2.0 (CESM2, Emmons et al., 2020), while run ALD-geoc uses CH3CHO emissions from a GEOS-Chem simulation (version 13.4), run with settings similar to Millet et al. (2010) and Wang et al. (2019), respectively. The global annual CH3CHO ocean sources are 40.8 Tg yr−1 in CESM2 and 62.7 Tg yr−1 in GEOS-Chem, illustrating the substantial uncertainty in the magnitude of this source. The distributions of oceanic CH3CHO emission are shown in Fig. S4.
2.6 Satellite data
As part of our model evaluation, we consider tropospheric column O3 data from the Aura Ozone Monitoring Instrument/Microwave Limb Sounder (OMI/MLS) dataset over the period 2005–2017. The resolution of the dataset is 1°×1.25° with a latitude range of 59.5° S to 59.5° N and longitude range of 180° W to 180° E. Further details of the OMI/MLS product are discussed by Ziemke et al. (2006).
We use tropospheric NO2 column from OMI QA4ECV version 1.1 for 2005–2017 released by the Tropospheric Emission Monitoring Internet Service. The OMI QA4ECV NO2 data set is based on revised spectral fitting features accounting for improved absorption cross sections, instrument calibration, and surface effects (Boersma et al., 2018; Zara et al., 2018). The data are processed according to the data quality recommendations and were validated against ground measurements (Compernolle et al., 2020). This product includes averaging kernel information which has been used for model-satellite comparison to account for the satellite vertical sensitivity (i.e. like-for-like comparisons). To reduce comparison representation errors, each satellite retrieval is spatiotemporally co-located (within 1 h temporally and the neighboring grid box spatially) with the model and the simulated profile interpolated onto the satellite pressure grid. The model sub-columns are calculated and the averaging kernel applied (as discussed by Archibald et al., 2020), which are totaled between the surface and tropopause to derive the averaging kernel-modified model tropospheric column. Here, each satellite retrieval has been filtered for a cloud radiance fraction <0.5, a quality flag=1.0, solar zenith angle<80.0°, snow-ice flag<10.0, tropospheric column and a AMFtrop/AMFgeo (geometric air mass factor) ratio>0.2.
MOPITT derived CO (Near and Thermal Infrared Radiances) V9 from the NASA Earth data archive are used for 2001–2017. The V9 product provides substantially improved retrieval coverage over land (30 %–40 % higher than V8) owing to an enhanced cloud detection algorithm and improved calibration of the near-infrared channels, while maintaining retrieval biases generally within ±5 % (Deeter et al., 2022). Individual MOPITT CO retrievals are filtered for a degree of freedom of signal>1.0. MOPITT CO data has already been pre-filtered for cloud cover in the data product. For the model-satellite comparisons, like for tropospheric column NO2, the model is spatiotemporally co-located with the retrievals and the model CO profile interpolated onto the satellite pressure grid. The averaging kernel are applied following the approach documented in Archibald et al. (2020) yielding a modified model profile (in vmr). The model sub-columns are then derived and totaled up from the surface to the top-of-atmosphere to calculate the total column.
2.7 Site and vertical profile data
Surface O3 observations used for model evaluation were obtained from the gridded Tropospheric Ozone Assessment Report (TOAR) global database (Schultz et al., 2017b). The TOAR database compiles surface O3 measurements from thousands of monitoring stations worldwide and provides harmonized metrics derived from quality-controlled observations. We use gridded ozone metrics generated by aggregating station observations within 5°×5° grid cells for the period 1990–2014. The dataset provides monthly statistical metrics, including daytime mean, nighttime mean, median, and mean rural O3 concentrations. In this study, the monthly mean O3 dataset was used for the period 2000–2014 to evaluate the simulated surface O3 concentrations.
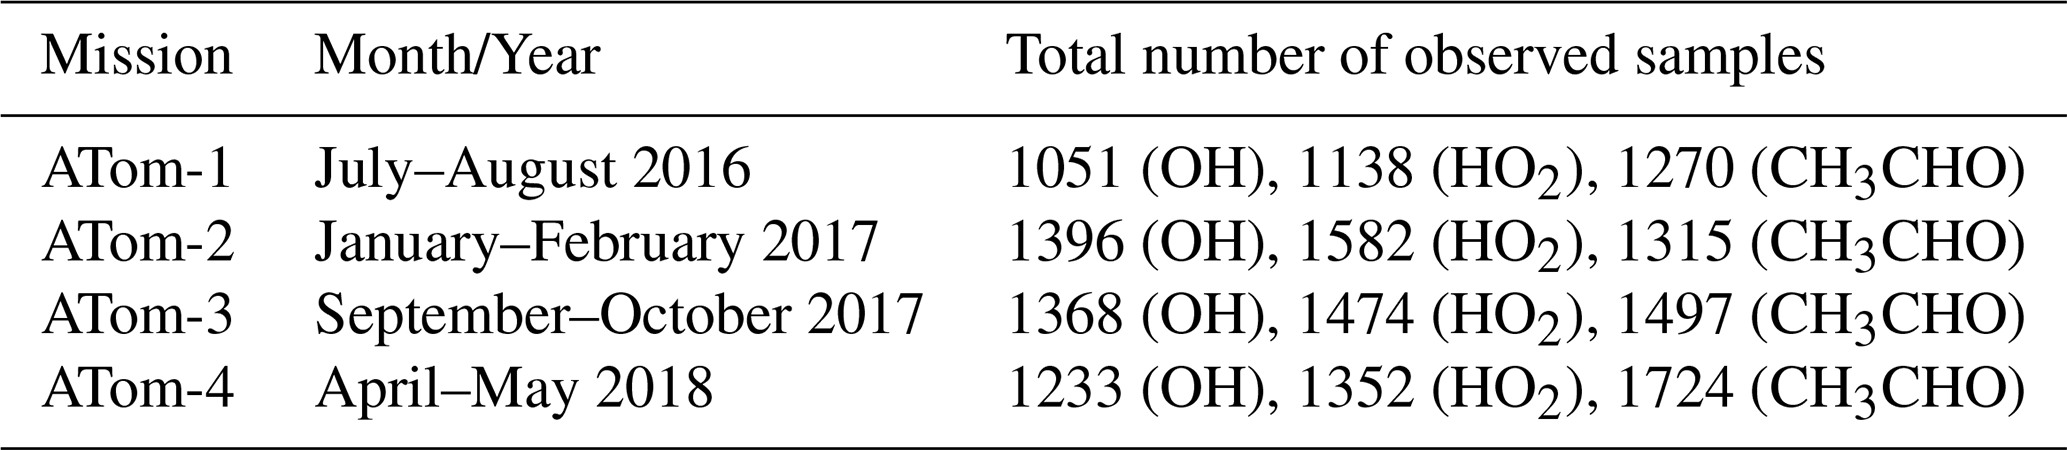
Observed vertical profiles of OH and HO2 obtained during the Atmospheric Tomography Mission (ATom) have been used to help evaluate the model. The ATom mission consisted of four aircraft campaigns (Table 2) with an overarching goal of advancing scientific understanding of the impact of human activities on the tropospheric budget of a wide range of trace gases related to air quality and climate (e.g. Thompson et al., 2022). Measurements were made onboard the NASA DC-8 aircraft in each of the four seasons over a 3-year period (2016–2018), across a large latitude range (∼80° N to ∼80° S), and up to an altitude of ∼12 km (Wofsy et al., 2021). For OH and HO2, measurements were made using the Airborne Tropospheric Hydrogen Oxides Sensor instrument. For CH3CHO, measurements were made using the Trace Organic Gas Analyzer instrument. These observational datasets underwent careful calibration and quality assurance prior to public release and have been widely used for atmospheric chemistry research and model evaluation (Wang et al., 2019). The time resolution of these data is 10 s for OH and HO2, and 20 s for CH3CHO. The number of valid measurements is listed in Table 2. For comparison to this measurement data, hourly output from the model was sampled along the aircraft flight tracks.
Table 2Summary of ATom measurements used to evaluate the model simulation.
2.8 Trend analysis
Trends in atmospheric trace gas columns, including tropospheric O3, tropospheric NO2, total CO column, and tropospheric OH, were estimated using the Theil–Sen slope estimator, a robust non-parametric method that calculates the median of all pairwise slopes (Theil, 1950; Sen, 1968). The statistical significance of trends was assessed with the Mann–Kendall test, a non-parametric method for detecting monotonic trends in time series without assuming a specific data distribution (Mann, 1945; Kendall, 1975). Trend analyses were performed at each grid point for all species. In addition, the global tropospheric mean OH concentration, weighted by airmass, was analyzed for seasonal trends to assess temporal variations throughout the year. These methods are particularly suitable for atmospheric chemistry observations and model outputs, which often contain noise, outliers, and non-normally distributed values. Trends in this study were considered significant at the 95 % confidence level (p<0.05).
3.1 Surface data
Simulated monthly mean surface O3 concentrations for 2000–2014 were evaluated against gridded observations from the TOAR dataset in the northern hemisphere (Fig. 1). The model reproduces the large-scale spatial distribution and seasonal cycle of surface O3 well, with enhanced concentrations over major mid-latitude regions such as North America, Europe, and East Asia. However, surface O3 is generally overestimated in most regions. As an annual global mean, the model simulates 36.7 ppbv compared with 30.2 ppbv from TOAR, corresponding to a positive bias of about 6.5 ppbv. The bias is smaller in January (4.8 ppbv) but greater in July (9.9 ppbv), indicating stronger overestimation during summer when photochemical production is more active. One contribution to this bias is from the relatively coarse vertical resolution of the model, where the 90 m depth of the lowest layer does not fully represent O3 at the surface, where there may be substantial removal by dry deposition. Despite this bias, the model captures the main spatial patterns and seasonal variability of surface O3. Regional scatter plots (Fig. S5) further show that the model captures the observed variability of surface O3 reasonably well, with correlation coefficients of 0.6–0.8 across North America, Europe, and East Asia, with the strongest agreement over Europe. Comparisons of the sensitivity simulations with TOAR show only small differences in surface O3 relative to the control run over these three regions (Fig. S6), indicating that the processes examined here have a relatively limited influence on surface O3 at northern mid-latitudes. Evaluation shows comparable performance to the MOZART-4 simulation by Fei et al. (2021) and the CESM FCSD simulation in Hou et al. (2023a).
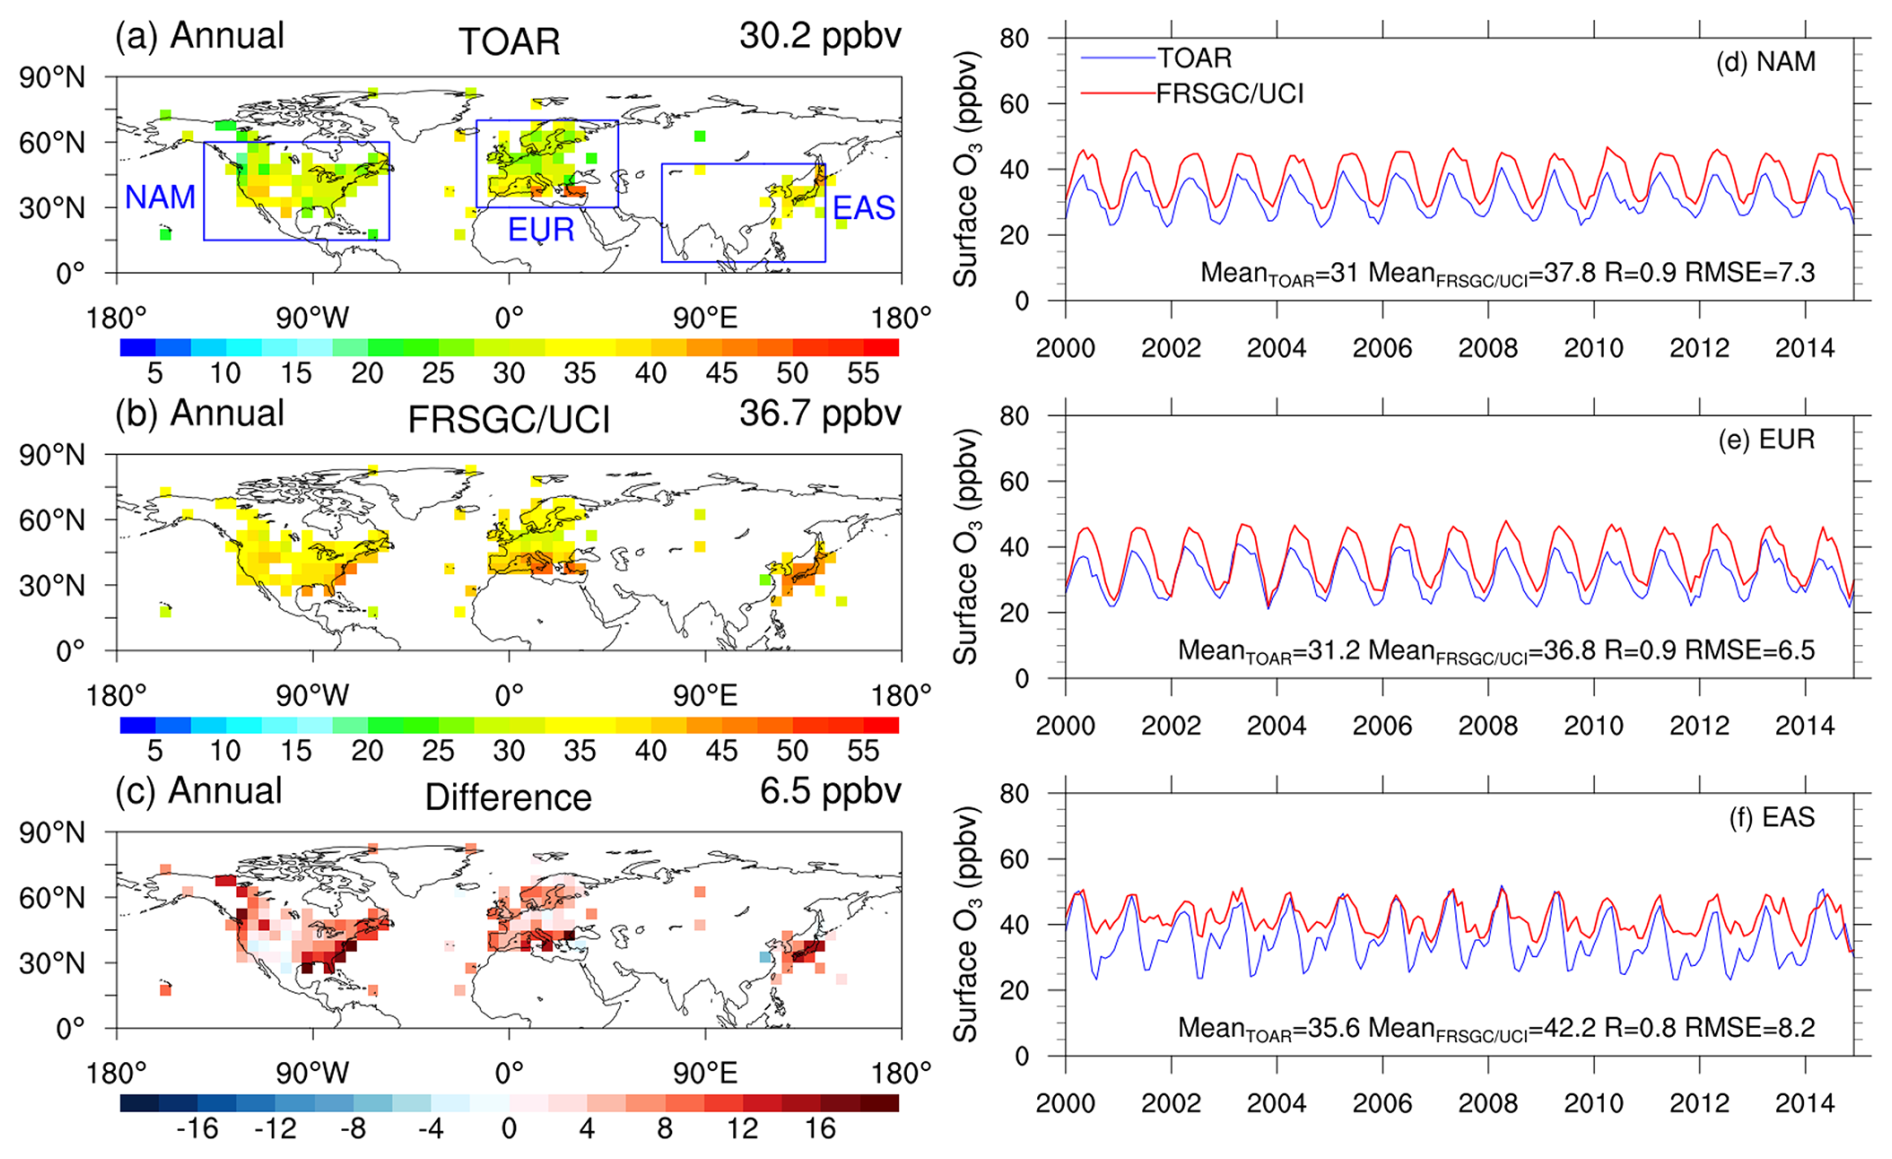
Figure 1Observed monthly mean surface O3 (ppbv) from TOAR and corresponding simulated O3 from the model control run for the period January 2000 to December 2014. Panels (a) and (b) show the distributions of annual mean observed and simulated O3, respectively, while panel (c) shows the model–observation difference. Panels (d)–(f) show the corresponding regional mean time series over North America, Europe, and East Asia, respectively, with line colours indicating observations and model simulations. All modelled means are calculated only for grid squares with available observations. Global mean values are shown in the upper right corner of panels (a)–(c). The regional mean values, correlation coefficient (R) between observed and simulated regional means, and root mean square error (RMSE) are shown in the lower right corner of panels (d)–(f).
3.2 Satellite data
Primary production of tropospheric OH occurs via the photodissociation of tropospheric O3 by UV radiation (λ<310 nm) to produce excited singlet oxygen atoms (O(1D)) (Talukdar et al., 1998) which may then react with water vapor. Therefore, the ability of models to simulate tropospheric O3 is of direct importance to accurate simulation of OH.
As shown in Fig. 2a–c, the model captures the salient features of the spatial distribution of tropospheric O3 column from OMI/MLS satellite observation well. There is high bias in low latitude regions which may be attributed to the low vertical resolution, uncertainty in diagnosing the tropopause and overestimation of the effects of lightning NOx in the model (Griffiths et al., 2021), and the uncertainties in vertical sensitivity of the observation instrument. This positive O3 bias may contribute to enhanced primary OH production in these regions. The correlation coefficient of the annual mean tropospheric O3 column between model and observation exceeds 0.6 in most regions and is significant at the 95 % level (Fig. 2d), suggesting that the year-to-year variations in the simulated and observed tropospheric O3 column are largely consistent. Low or negative correlations at high latitudes may partly arise from differences in the representation of the tropopause between the model and the OMI/MLS observations.
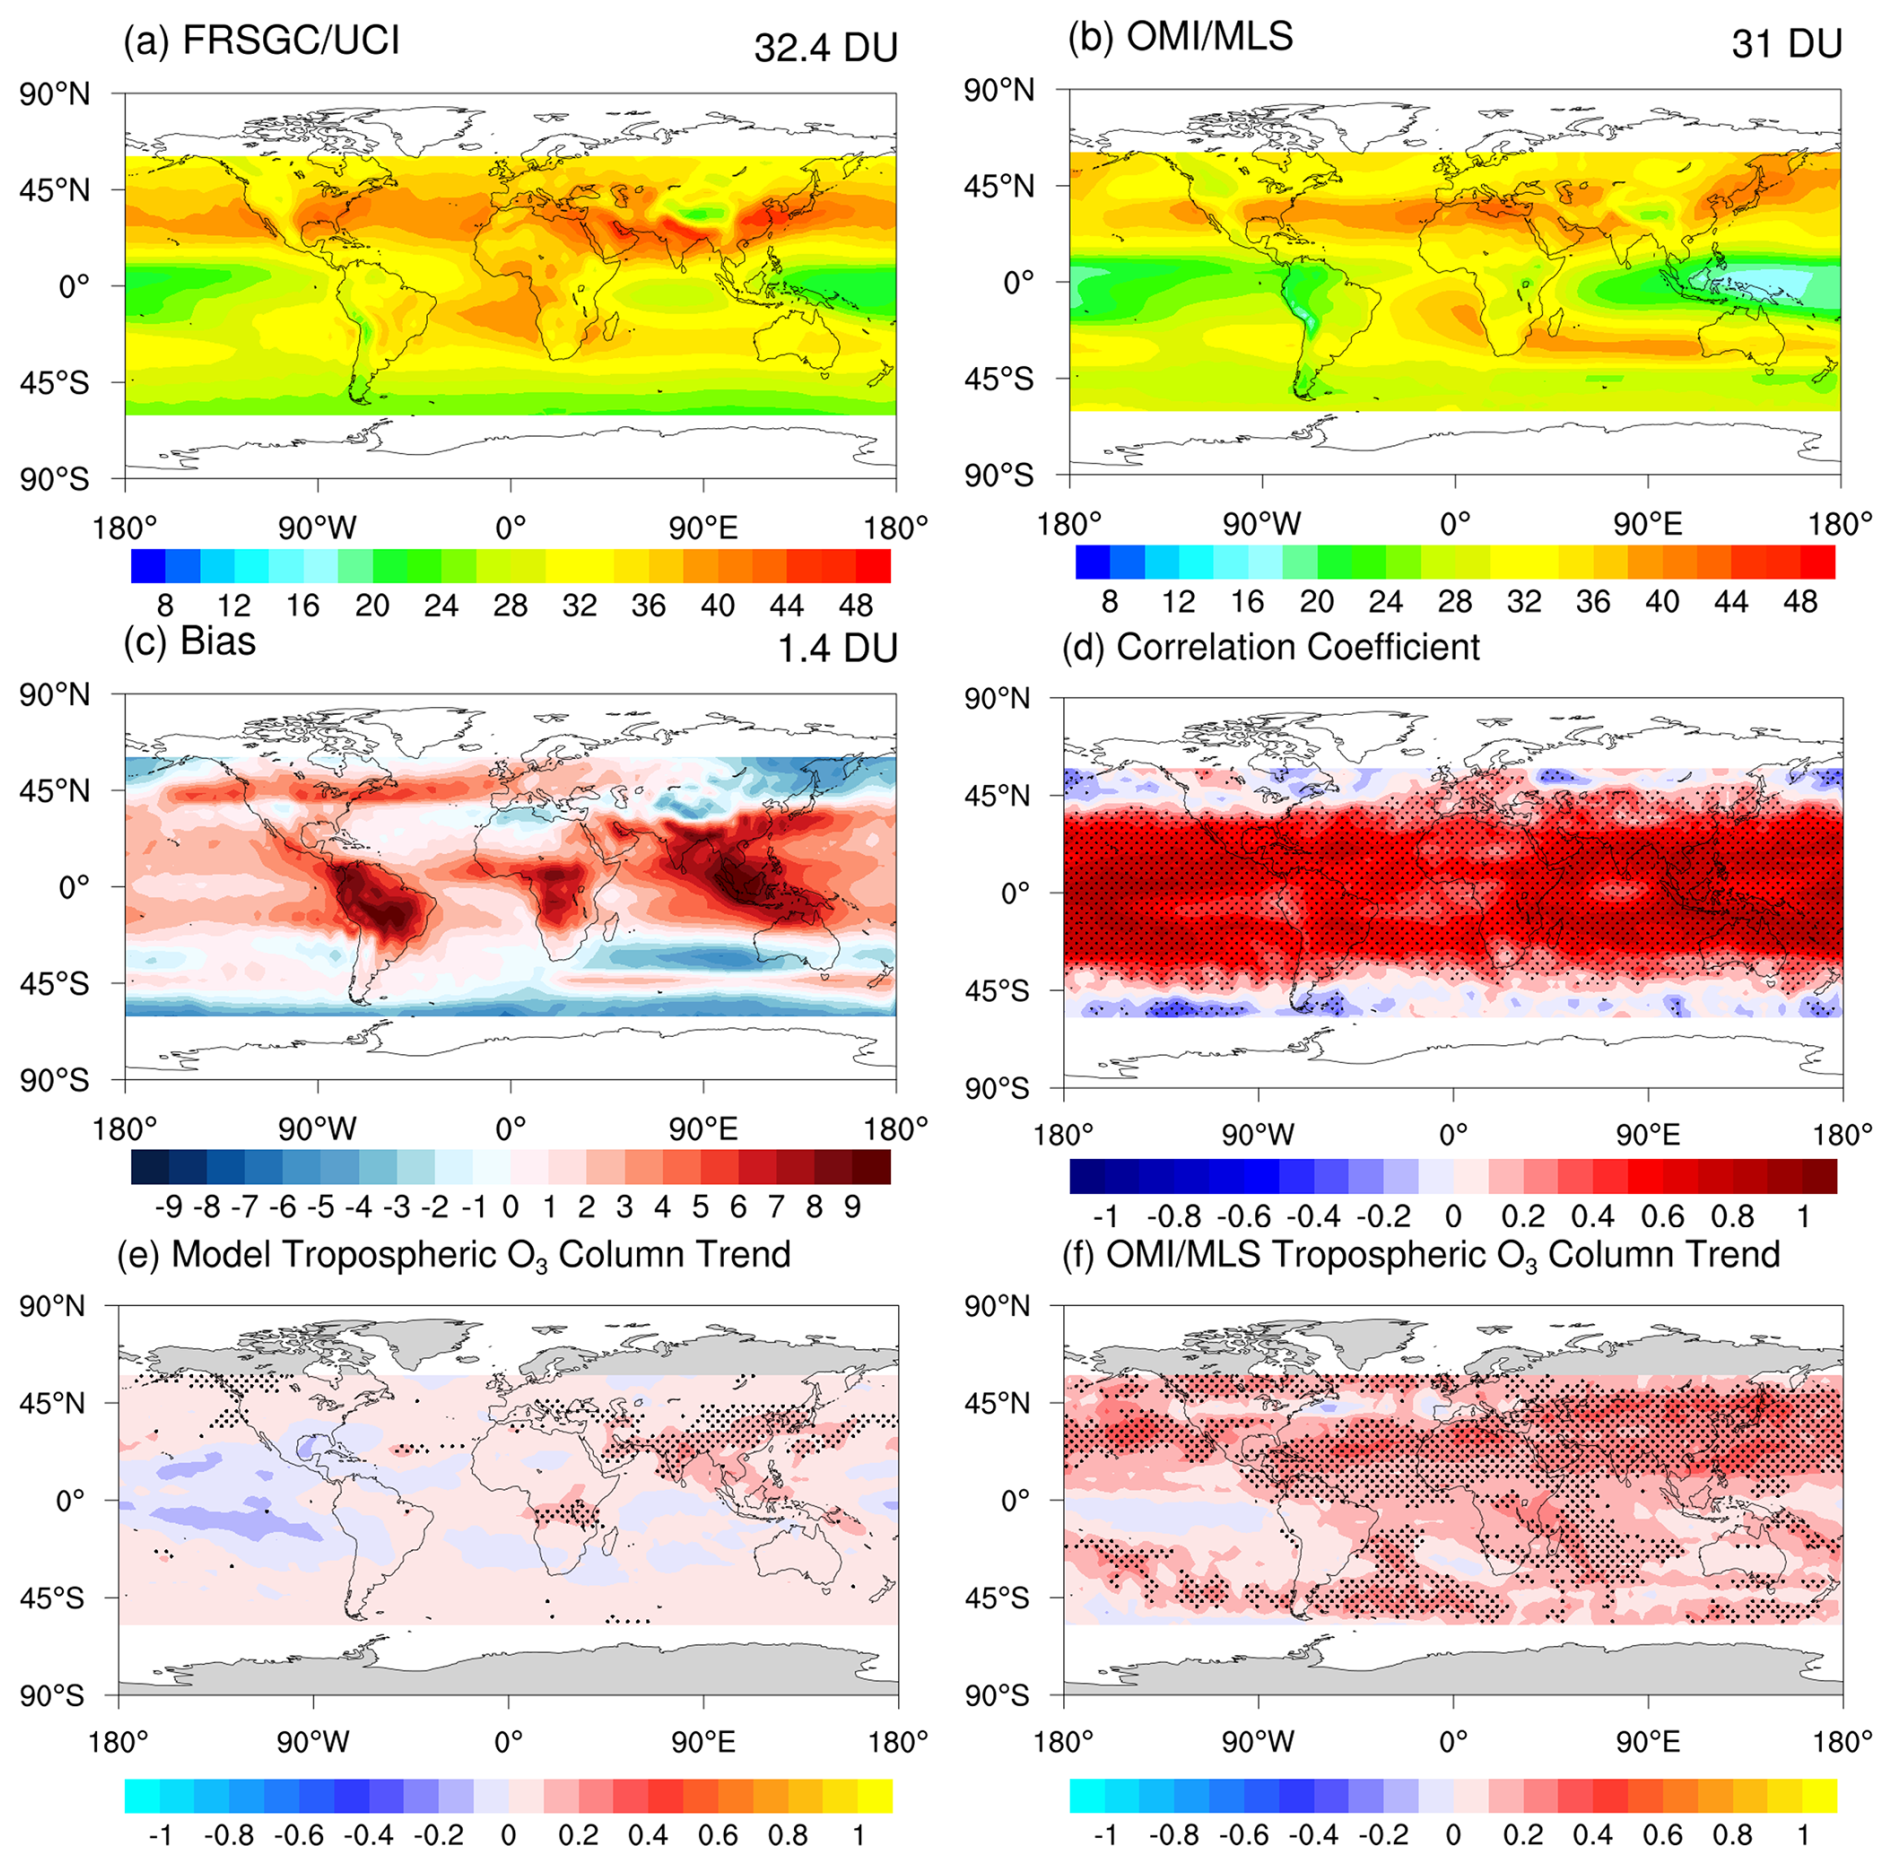
Figure 2Multiyear average (2005–2017) tropospheric O3 column (DU) from (a) the model control run and (b) OMI/MLS satellite observations. Panel (c) shows the corresponding mean bias of the tropospheric O3 column (model minus observation), and (d) shows the correlation coefficient between annual mean modelled and OMI/MLS tropospheric O3 column time series at each grid box. Annual mean tropospheric O3 column trends (DU yr−1) are shown in (e) for the model and (f) for satellite observations over the 2005–2017 period. Global mean columns between 60° S–60° N are indicated in the upper right corner of panels (a)–(c). Shaded areas in (d) indicate regions where the correlation is statistically significant at the 95 % confidence level (p<0.05). Trends in panels (e) and (f) were calculated using the Theil–Sen method, and stippling indicates areas with significant trends at the 95 % confidence level according to the Mann–Kendall test.
Both the model and observations show a significant increase in tropospheric O3 column from 2000 to 2017, especially over northern hemisphere mid-latitude regions, although the observed trends are generally stronger and more significant (Fig. 2e and f). The weaker simulated O3 increase in these regions may lead to an underestimation of its contribution to increasing OH. As discussed in previous research, the increase of tropospheric O3 column is mainly attributed to changes in emissions of O3 precursors, especially over high pollution regions (Hou et al., 2023b; Wang et al., 2022; Ziemke et al., 2019; Young et al., 2018). Over the tropical Pacific Ocean, both the model and observations show decreases in O3 column. Over southern North America and Mexico, in contrast to the observed +0.2 DU yr−1 increase, the model shows a weak decrease (Fig. 2e), which is likely driven by decreases in anthropogenic emissions in the model (Liu et al., 2022). The simulated tropospheric O3 burden and budget are also broadly consistent with previous studies and fall within the reported uncertainty ranges (Table S5). The sensitivity experiments show that the processes examined here can affect the tropospheric O3 budget, particularly through changes in O3 production and loss (Table S5). Comparison with OMI/MLS observations further shows that removing heterogeneous chemistry increases the positive TCO bias, particularly in the tropics, indicating that its inclusion in the control run improves the simulated TCO. In contrast, the JPL simulation, which uses the slower OH+NO2 reaction rate coefficient, produces a larger positive TCO bias (Fig. S7). Overall, the model captures the major spatial characteristics and interannual variability of the tropospheric O3 column reasonably well, although regional differences are evident in the trends. These differences may contribute to uncertainty in simulated OH trends.
As a key precursor of tropospheric O3 and regulator of HOx recycling, NOx has a substantial impact on OH abundance and its temporal evolution. Trends in NOx may drive the modelled increase in OH (Chua et al., 2023), so it is important to explore how well the modelled NOx trends match observations. As shown in Fig. 3a–d, the spatial distribution of tropospheric NO2 column is simulated well by the model. There is a relatively high model bias in NH mid latitude regions around 45° N, although the satellite data has a relatively large uncertainty here. This positive bias is comparable to that reported in previous model studies over (e.g. Archibald et al., 2020, in the Northern Hemisphere and Monks et al., 2017, over Europe), suggesting that the magnitude of the bias is broadly consistent with current-generation chemistry-climate and chemistry-transport models. The simulated interannual variations over our study period match the satellite observations well (R>0.6, p value < 0.05), over most of the world, including East Asia, Europe, North America and South Africa. While the model performance is weaker in remote regions, the key result is over urban regions with high NO2 loading which will have more influence on OH. The modelled trend in tropospheric NO2 column is broadly consistent with previous studies (Elshorbany et al., 2024; Jiang et al., 2022) showing a significant increase over South Asia and most parts of East Asia, and a significant decrease over Europe and North America from 2000 to 2017 (Fig. 3e and f). These changes are primarily attributed to variations in emissions (Miyazaki et al., 2017) and match the spatial distribution observed in OMI NO2 data. The generally good agreement in the spatial patterns and temporal evolution of NO2 provides support for the simulated influence of changing NOx emissions on OH trends, particularly over polluted regions.
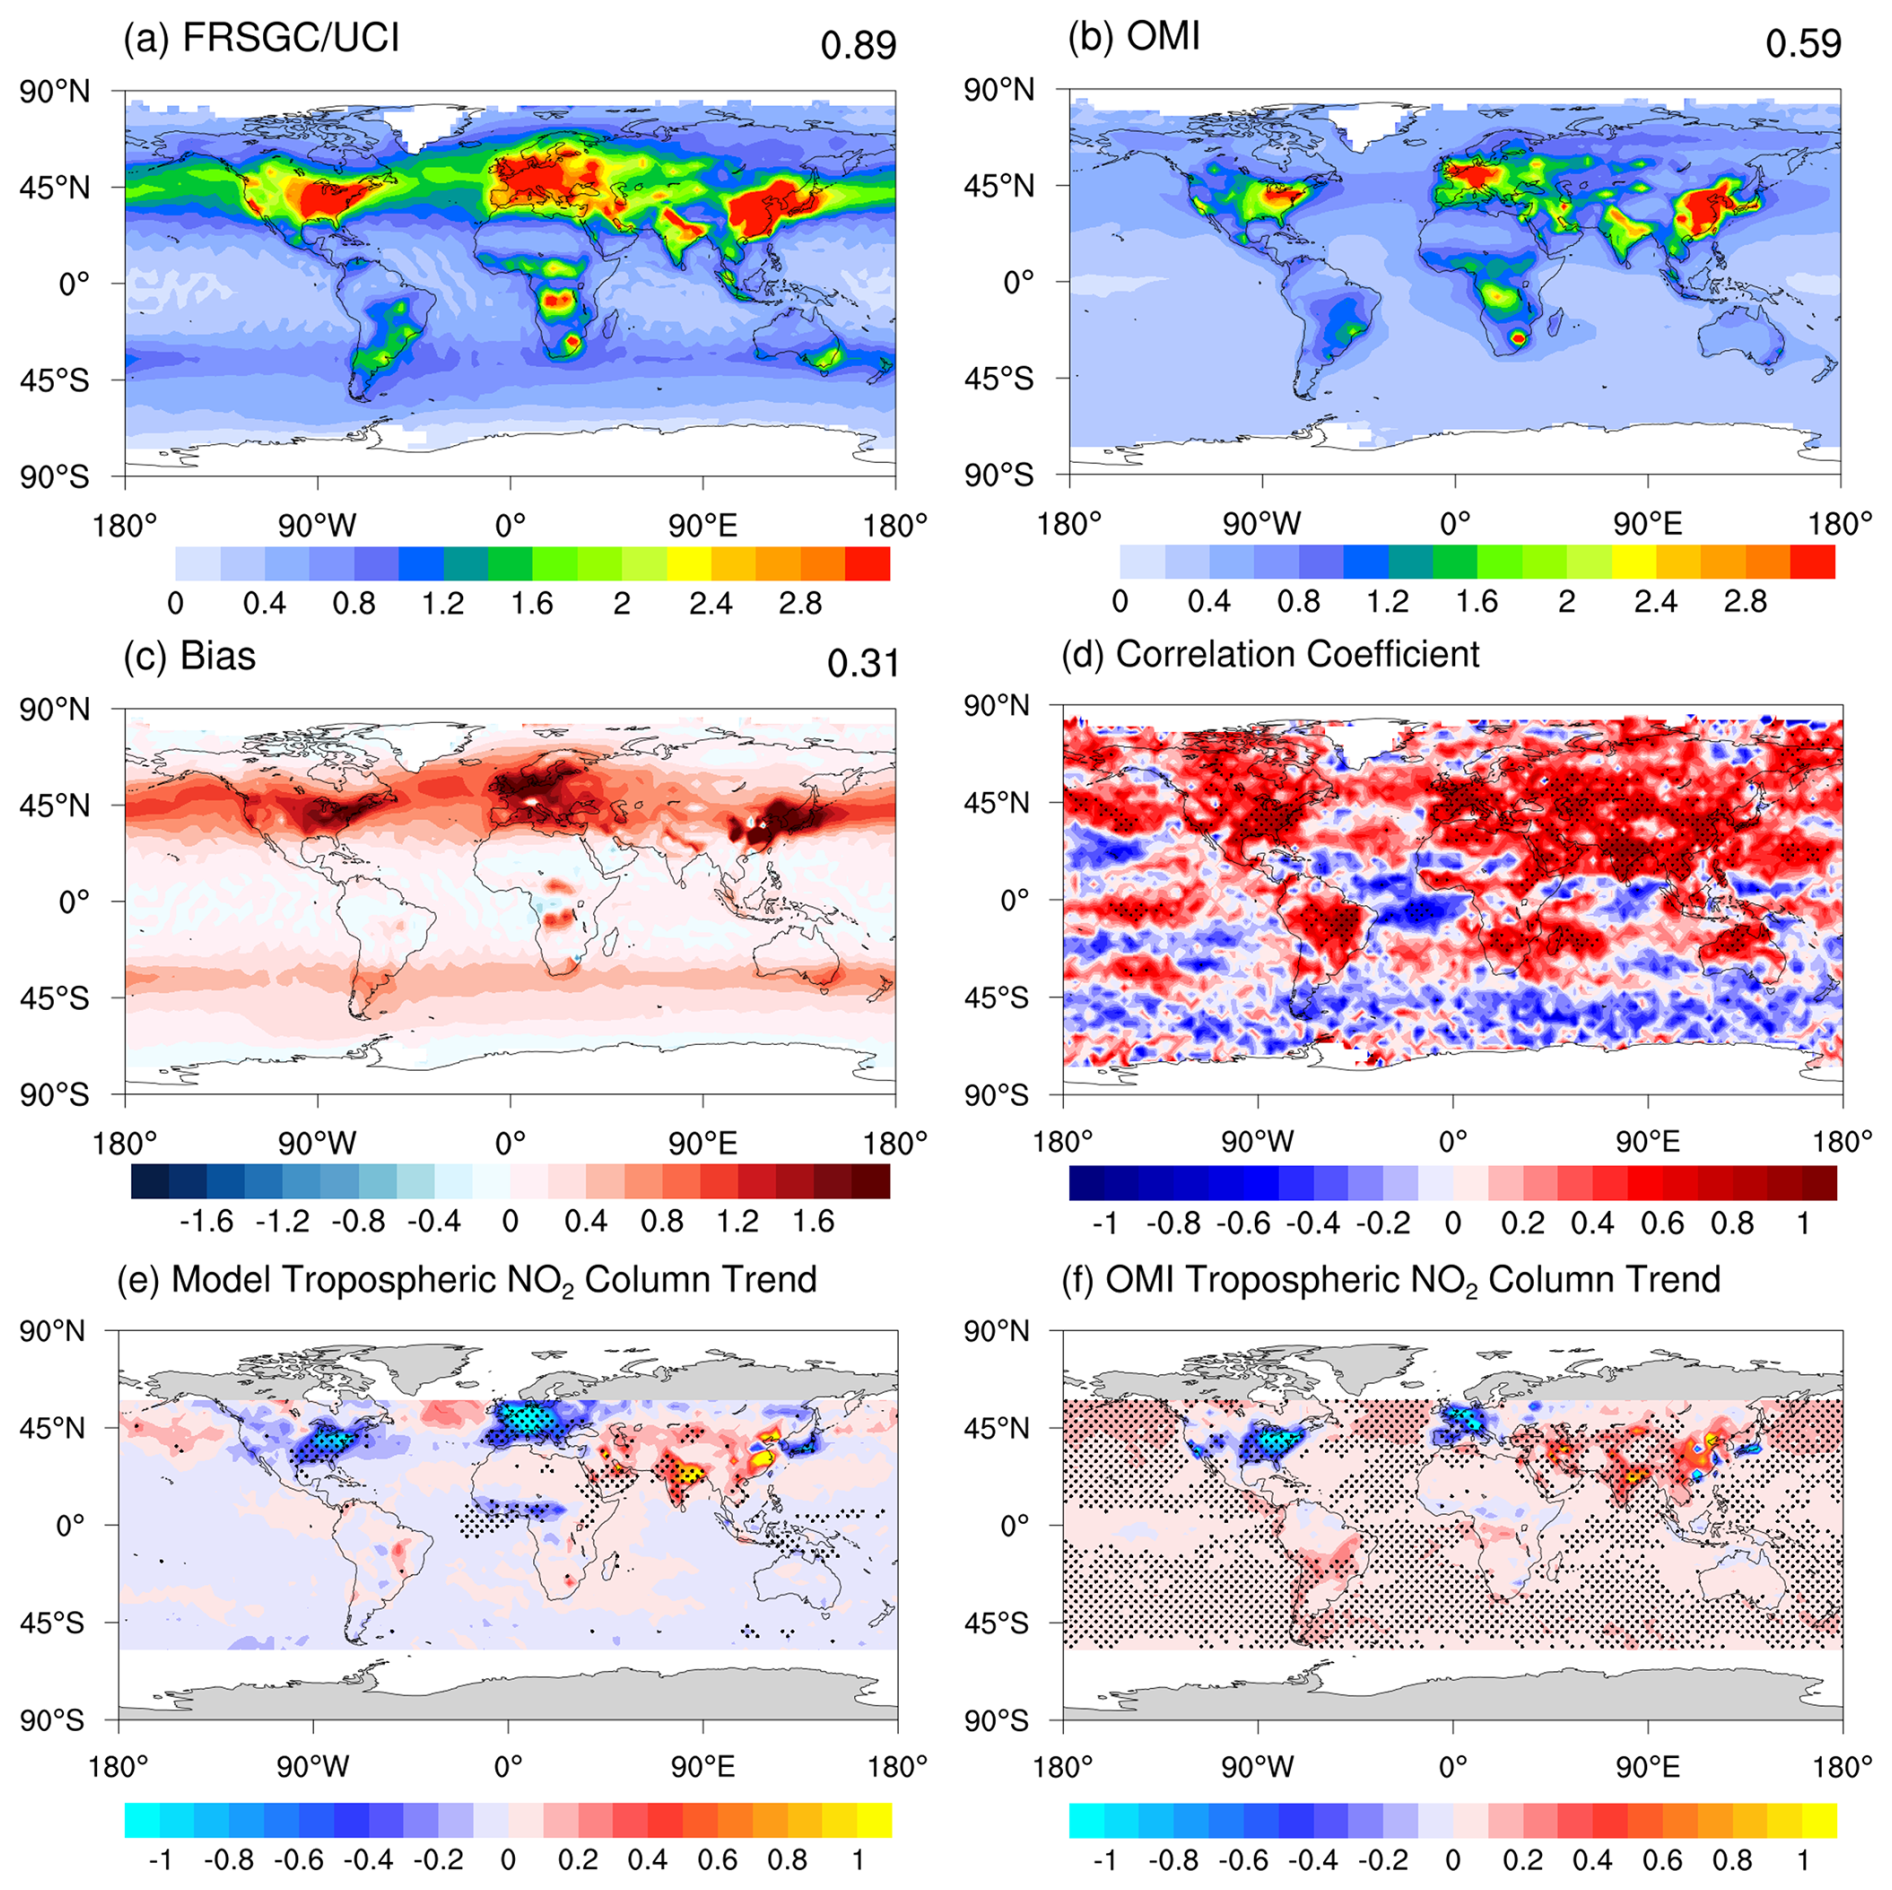
Figure 3Same as Fig. 2, but for tropospheric NO2 column (1015 ) and annual mean tropospheric NO2 column trends (1014 ).
Figure 4a and b compares the modelled CO column distribution to that observed from MOPITT. The agreement between the two datasets is generally strong, although the model underestimates CO in most regions (Fig. 4c). As seen in Fig. 4d, the model captures the interannual variations well over most parts of the world (R>0.6). The MOPITT CO column generally shows significant decreases across much of the globe, consistent with earlier results from, for example, Yin et al. (2015) and Chua et al. (2023). However, in contrast the modelled CO columns show significant increases over China, India, and Africa with weaker decreases in parts of Europe, North America, and the Middle East (Fig. 4e). The MOPITT and modelled changes in the CO column show poor agreement, with the model failing to capture the observed decrease reported by MOPITT, particularly over China, India and much of the Southern Hemisphere (SH). A similar mismatch was identified in the modelling study of Chua et al. (2023) which used the Geophysical Fluid Dynamics Laboratory (GFDL) CCM driven by the CMIP6 emission inventory. Chua et al. (2023) note that the mismatch could point towards deficiencies in the emissions that drive the high bias in CO column trends over China and South Asia and in turn lead to the general high bias globally due to transport from these regions, especially via the prevailing westerlies (Zheng et al., 2018). Consistent with this, Gaubert et al. (2020) showed that correcting anthropogenic CO emission in East Asia reduces model bias by 29 % for CO, 11 % for HO2, and 27 % for OH. In the Southern Hemisphere, the mismatch may partly arise from uncertainties in the biomass burning emission inventory used in the model (Chua et al., 2023). As the main sink of OH in the troposphere, the mismatch and positive trend in CO may lead to underestimation of any OH increase or overestimation of any OH decrease over the 2000–2017 period. Discrepancies in the CO changes may thus have a substantial impact on the modelled interannual variation in OH.
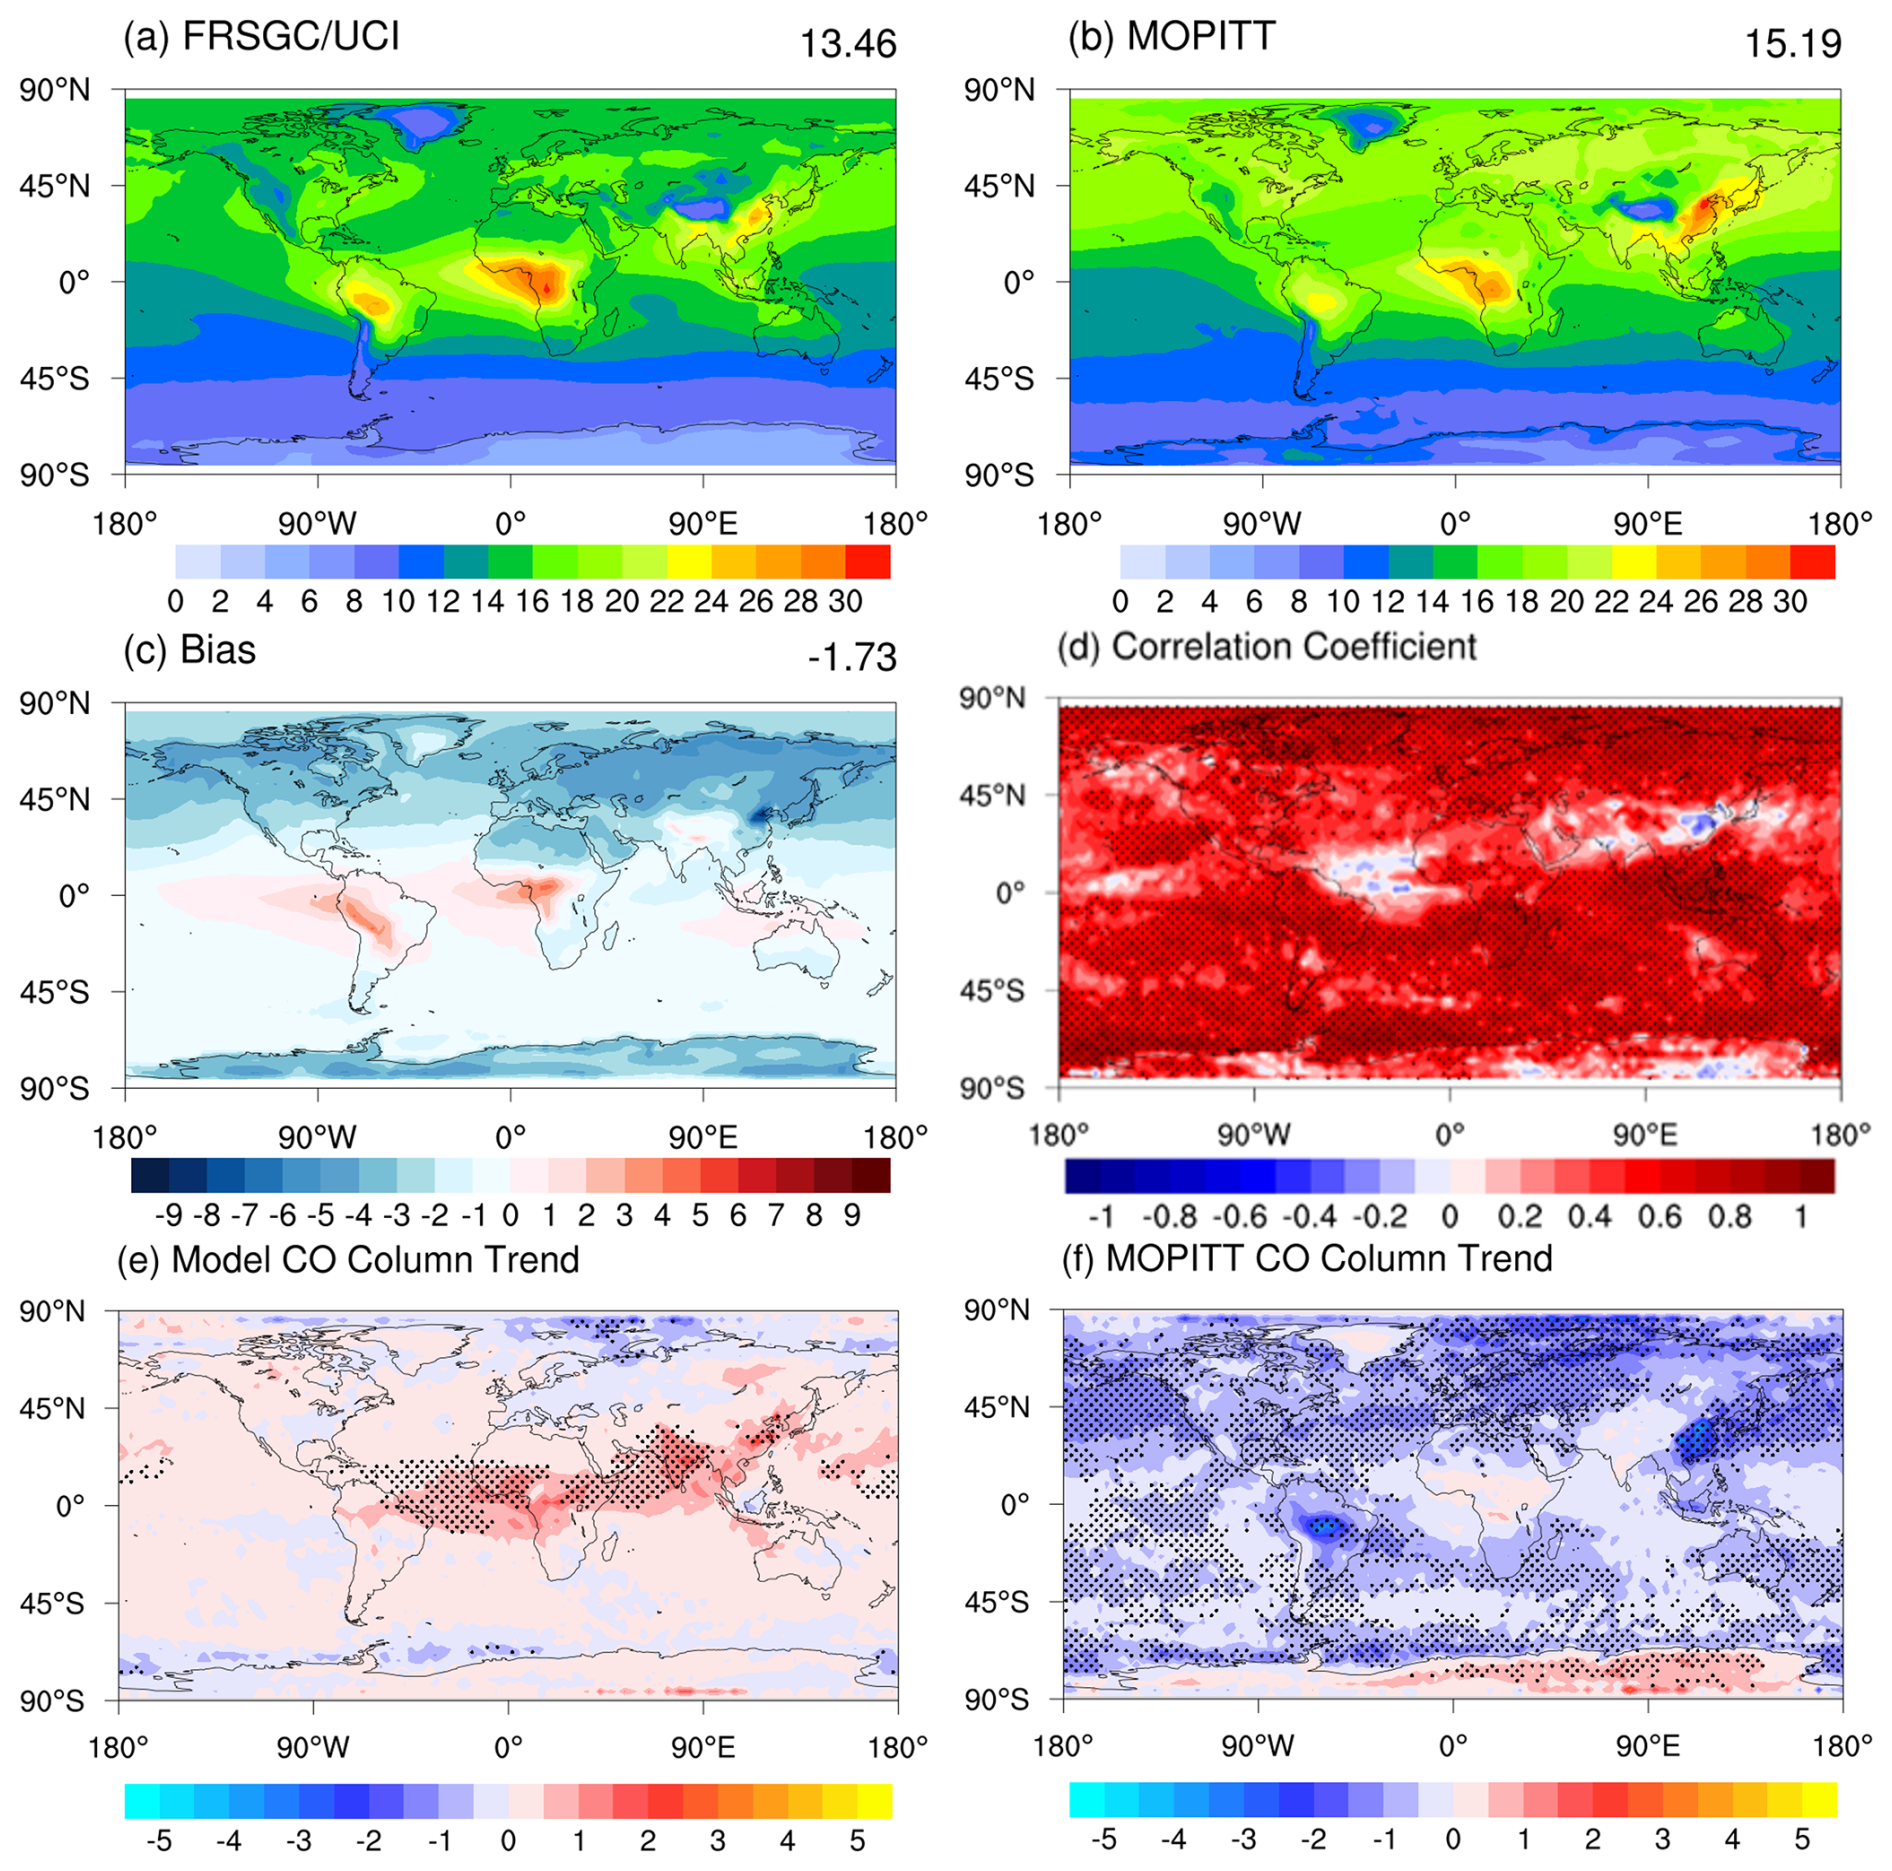
Figure 4Same as Fig. 1, but for total CO column (1017 ) and annual mean total CO column trends (1016 ).
3.3 Vertical profiles of OH and HO2
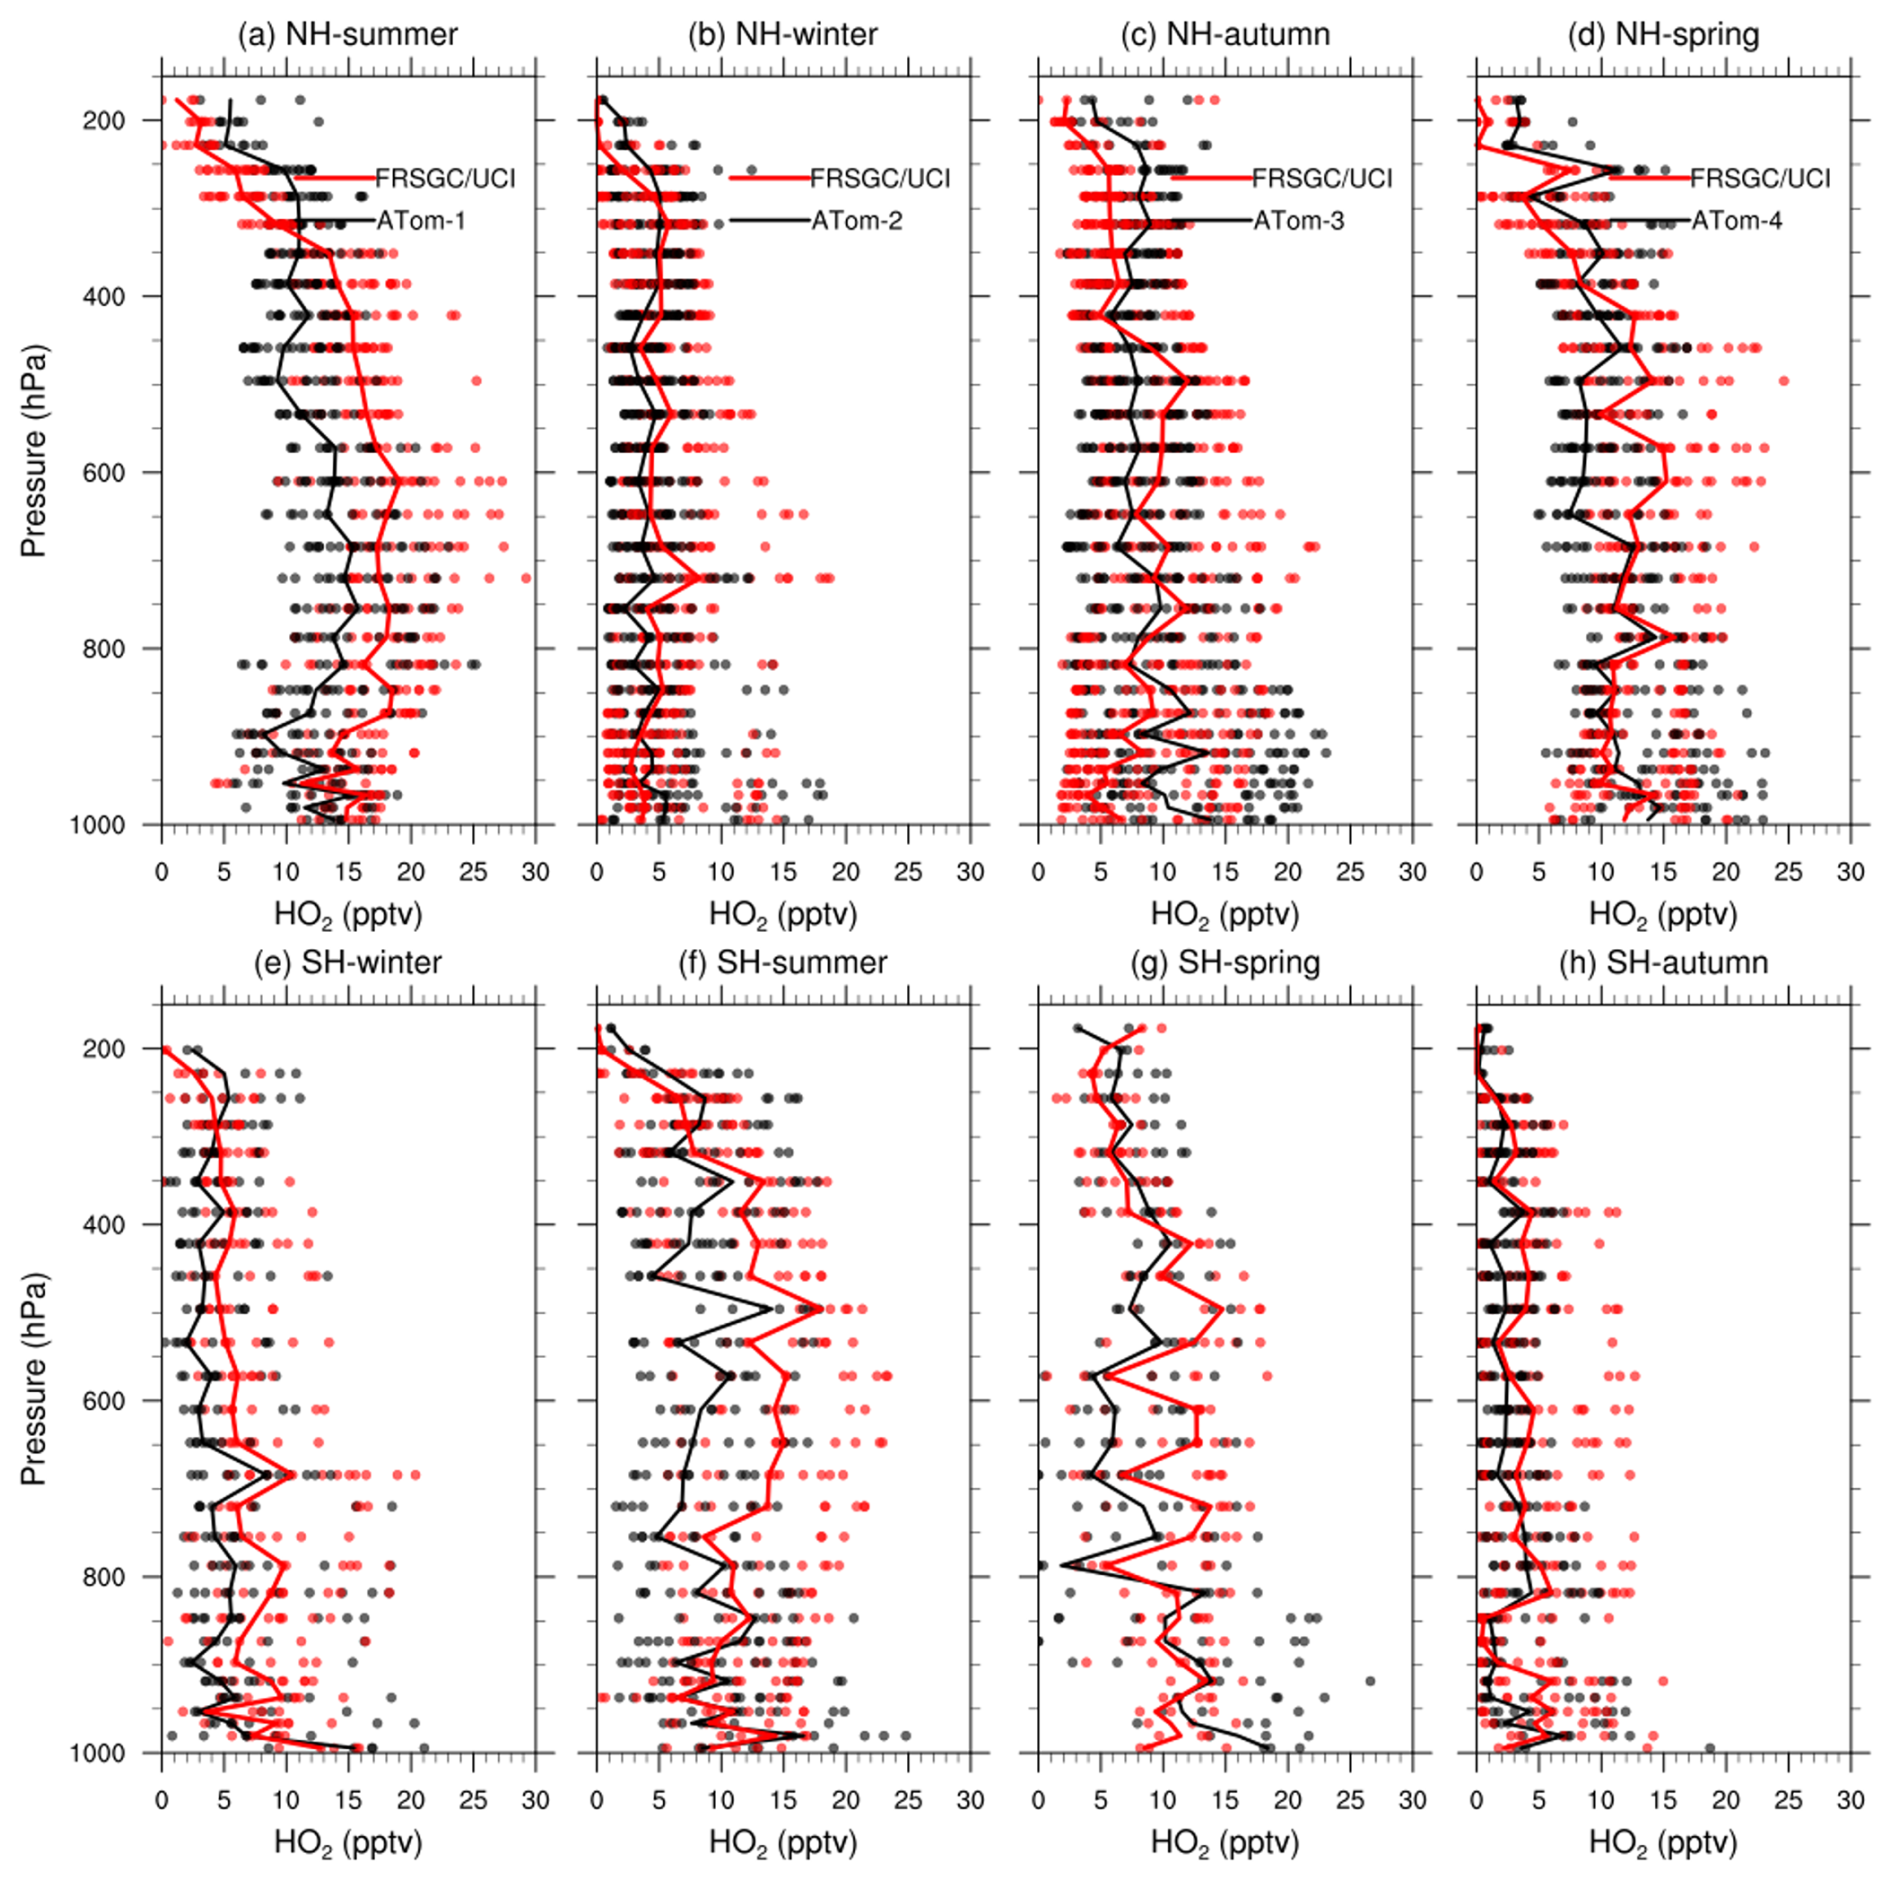
The ATom campaign (Wofsy et al., 2021) provides an unprecedented opportunity to test model performance in the remote atmosphere with a detailed suite of chemical observations. Figure 5 shows modeled OH sampled along the flight tracks and compared to observed OH for ATom-1 (boreal summer 2016), ATom-2 (boreal winter 2017), ATom-3 (boreal autumn 2017), and Atom-4 (boreal spring 2018) in each hemisphere from the lowest sampled altitude (∼1000 hPa) to 150 hPa.
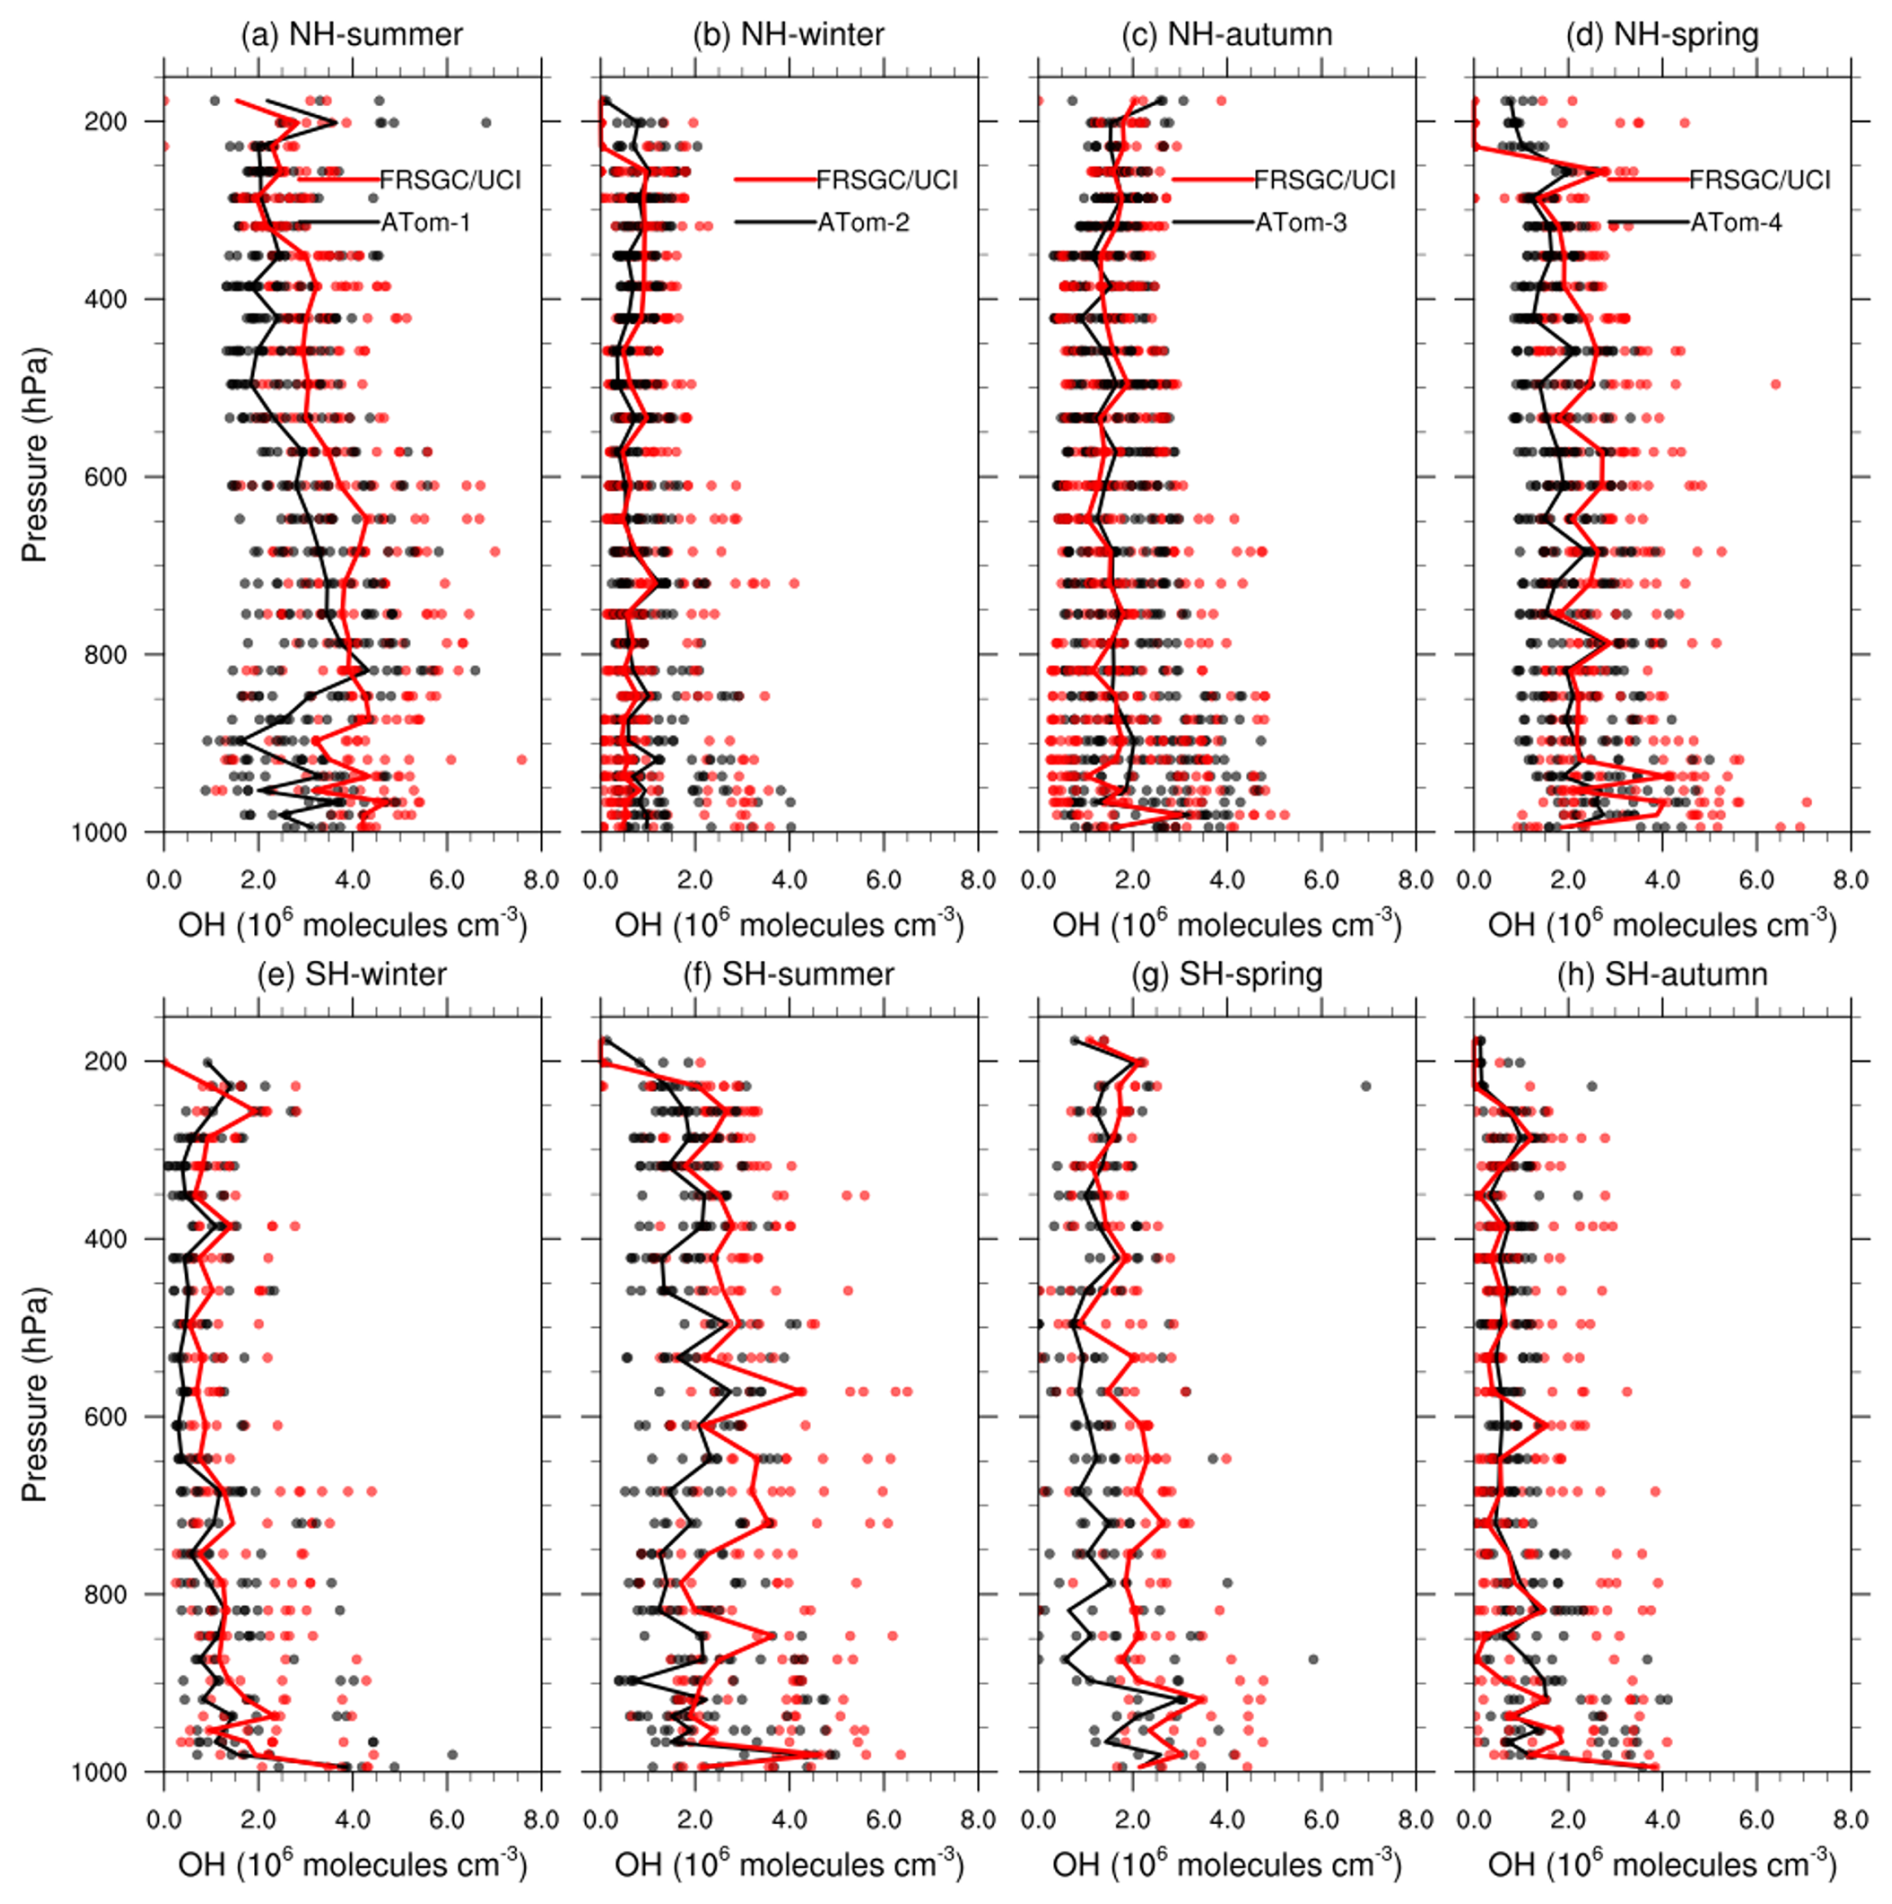
Figure 5Median OH concentrations (106 ) for the Northern Hemisphere (NH, top row) and Southern Hemisphere (SH, bottom) measured during the ATom aircraft missions (black) along with the corresponding results from the model control run (FRSGC/UCI, red). Dashed lines show the observed 25th–75th percentiles.
The model generally reproduces tropospheric OH well, with simulated concentrations falling within observational uncertainty across the environments considered here and no clear systematic bias throughout the troposphere. The model overestimates OH in the northern hemisphere in summer and this may reflect excessive OH production (see previous discussion of O3 biases and Fig. 2c) or an underestimated sink from CO (Fig. 4c). Models tend to overestimate OH on a global scale against constraints from methane and methyl chloroform observations (Shindell et al., 2006; Naik et al., 2013; Nicely et al., 2017), but we find that tropospheric OH is simulated relatively well, within observational uncertainty, in the environments considered here. This good agreement is consistent with box model studies comparing OH with measurements during NASA's Pacific Exploratory Mission–Tropics (PEM-Tropic B) campaign in the clean remote Pacific (Tan et al., 2001) and a similar analysis by Travis et al. (2020) for Atom 1–2 and Brune et al. (2020) for ATom 1–4.
Modelled HO2 is overestimated in the mid-troposphere, except in northern hemisphere winter (Fig. 6). One possible reason is the influence of biomass-burning emissions. Observations from ATom indicate that air masses influenced by biomass burning, identified using tracers such as HCN and enhanced CO, are frequently encountered in the tropical and subtropical troposphere and can be transported over remote oceans at altitudes of ∼1–4 km (e.g. Wofsy et al., 2021; Strode et al., 2018). These air masses contain elevated CO and VOCs that can enhance HOx cycling and promote HO2 formation (e.g. Tan et al., 2001; Brune et al., 2020; Fiore et al., 2024), especially in spring and summer. An overestimate in biomass-burning emissions could lead to excessive HO2 production. However, uncertainties in long-range transport and radical recycling may also contribute to the simulated bias. Overall, the general spatial and temporal variations in HO2 are represented relatively well, although there is an overestimation remaining in the mid troposphere. For both the OH and HO2 model-measurement comparisons, the measurement uncertainty of ±35 % for each species should be borne in mind (Brune et al., 2020).
4.1 Global tropospheric OH
Global tropospheric mean airmass-weighted OH concentration ([OH]gm) was calculated for each model run for the year 2000 and as an average for the period 2000–2017 (Table 3). For 2000, [OH]gm from the control run (10.9×10⁵ ) is very similar to the ACCMIP multi-model mean (±1 s.d.) estimate of 11.1 (±1.6) ×105 for the same year (Naik et al., 2013), about 1.8 % lower but well within the full spread of ACCMIP models. The corresponding CH4 lifetime against tropospheric OH oxidation (τCH4) is 10.0 years. For comparison, the multi-model mean estimate from ACCMIP for the same year is 9.7 (±1.5) years. Our τCH4 estimate is close to, and within the uncertainty range, of observationally derived estimates, including the 10.2 (9.5–11.1) years estimated by Prinn et al. (2005) and 11.2 (±1.3) years estimated by Prather et al. (2012). As OH is the principal tropospheric sink of CH4, these comparisons suggest that our CTM produces a reasonable simulation of [OH]gm.
Table 3Modelled global tropospheric airmass-weighted OH concentration ([OH]gm) and CH4 lifetime against tropospheric OH (τCH4). Results are shown for the year 2000 and the mean of the period 2000 to 2017.
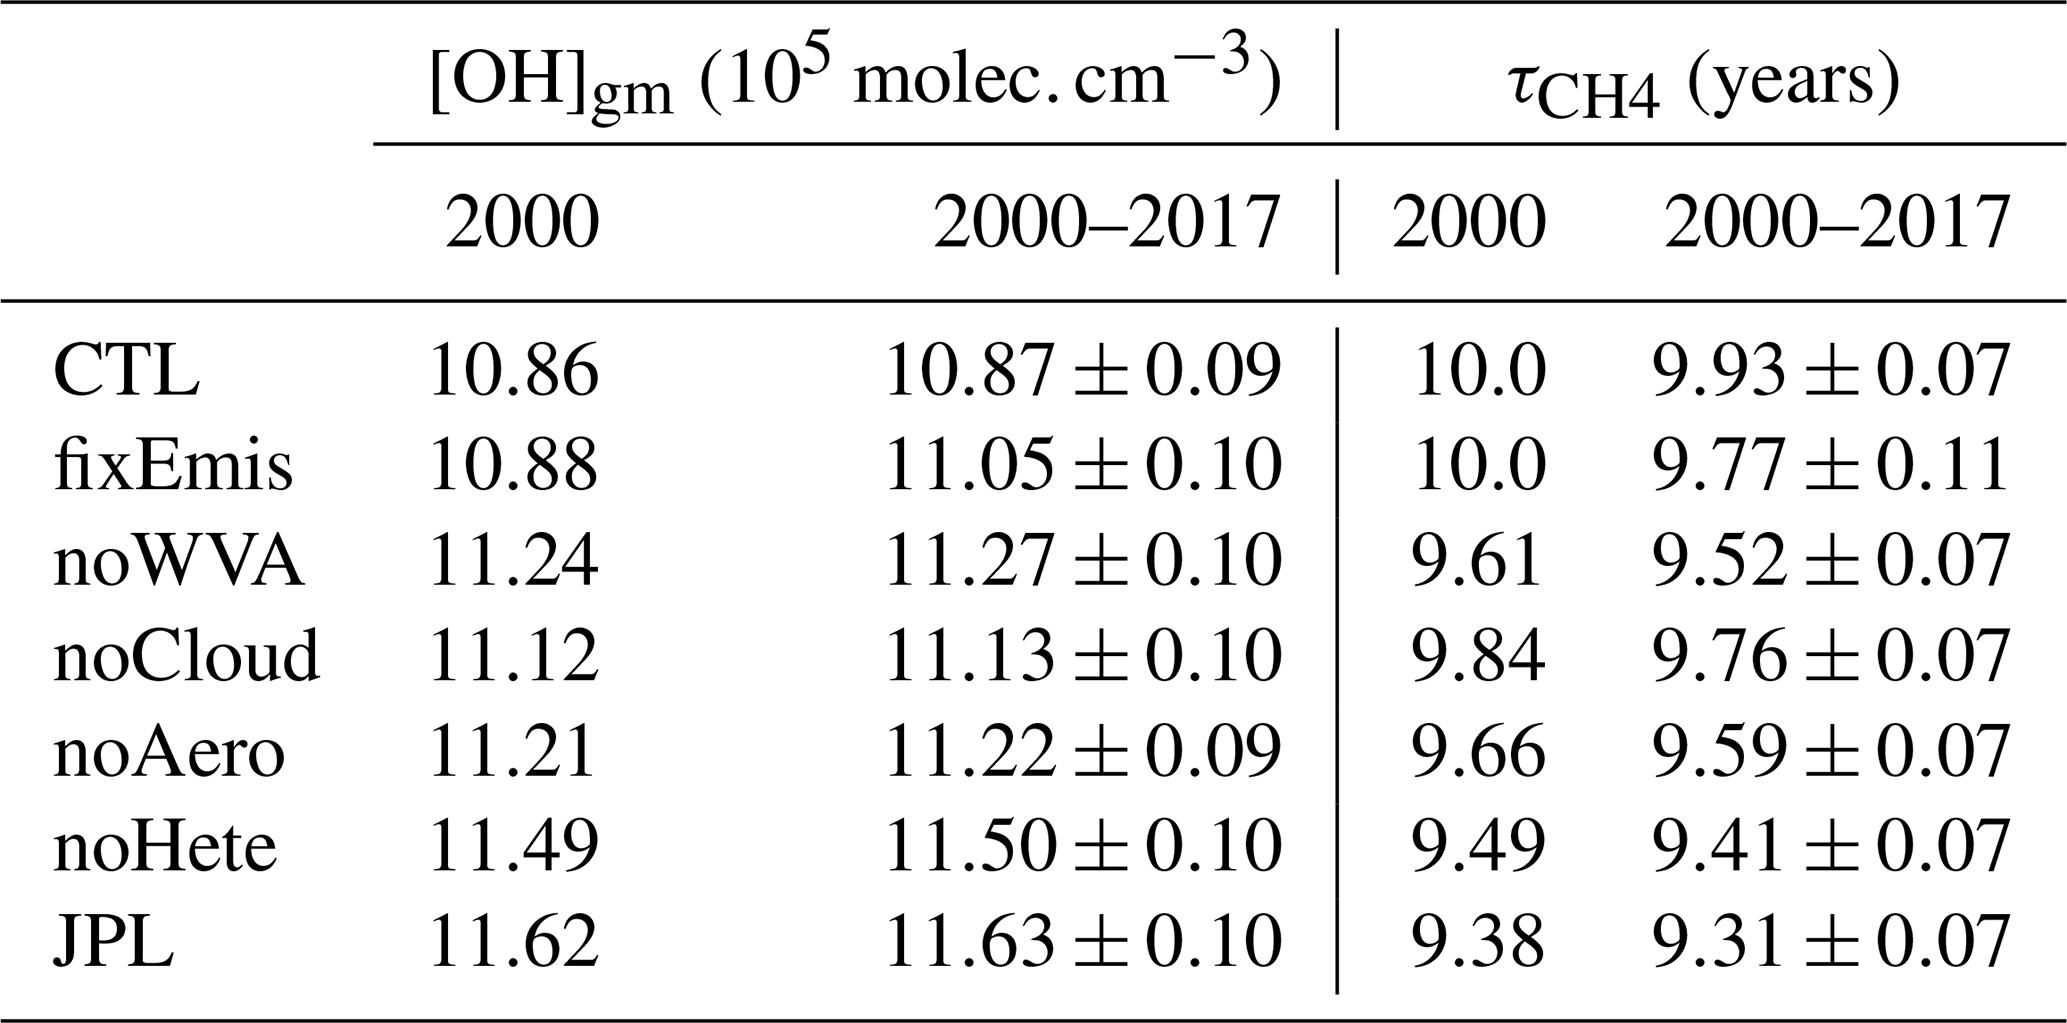
Note: Values following “±” represent 1 standard deviation over the period 2000–2017.
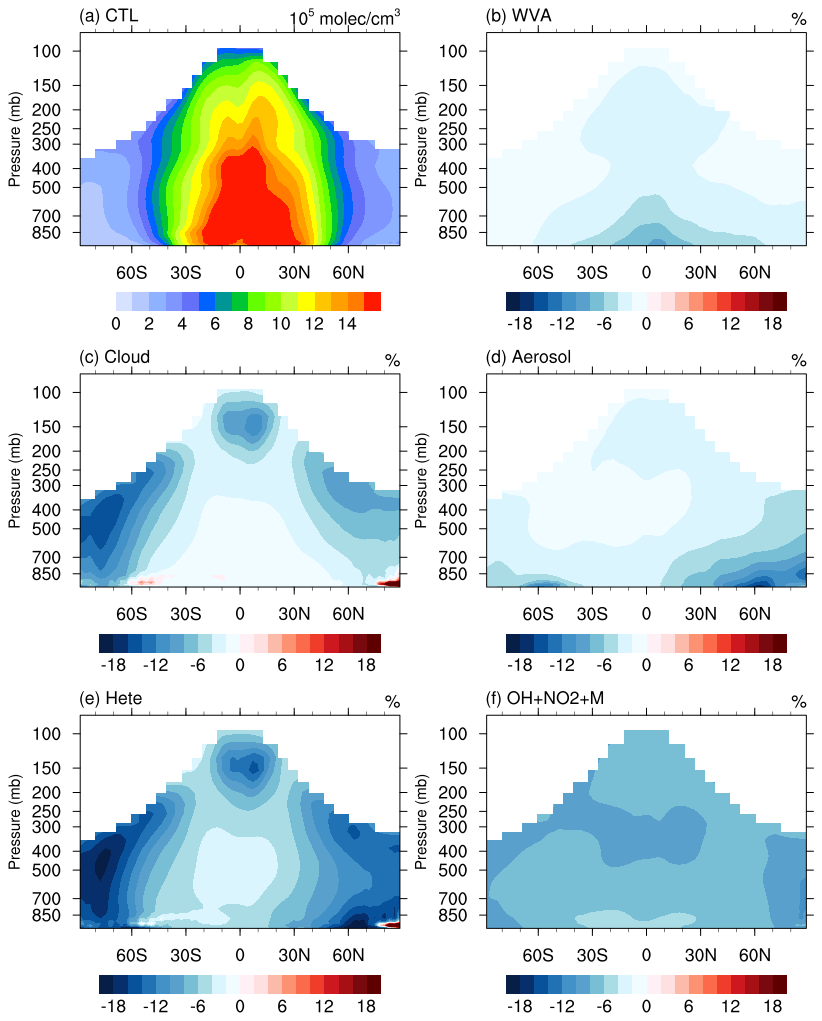
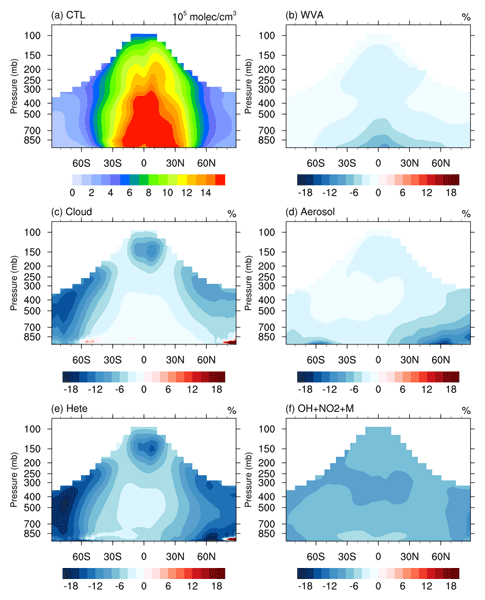
Figure 7(a) Zonal mean (latitude-pressure) cross sections of annual mean OH concentration (105 ) in the CTL run and the effects on tropospheric OH (in %) of (b) water vapor UV absorption (WVA), (c) cloud heterogeneous reactions (Cloud), (d) aerosol heterogeneous reactions (Aerosol), (e) all heterogeneous reactions (Hete), and (f) the updated OH+NO2 reaction rate. Percentage differences are calculated as . The troposphere was defined as the region below a climatological tropopause () following Lawrence et al. (2001).
Figure 7a shows zonal mean OH concentration from the control run averaged over the period 2000–2017. The other panels show percentage differences associated with the selected sensitivity experiments. The control run shows high OH concentrations between 30° S and 30° N in the lower to middle troposphere, with larger values in the northern hemisphere, that reflect the sources of OH, matching the results of previous assessments (Stevenson et al., 2020). Excluding the effects of water vapour UV absorption leads to higher OH throughout the troposphere, especially in the tropical lower troposphere where humidity is relatively high. Water vapor absorption reduces photolysis rates in the troposphere leading to decreases in OH of 6 %–10 % at the surface in the tropics (Fig. 7b). On a global basis, [OH]gm is reduced by 3.6 % compared to the control run and τCH4 is lengthened by ∼4.2 % (Table 3). The magnitude of these responses is in close agreement with that reported by Prather and Zhu (2024).
The effects of heterogeneous chemistry on cloud surfaces (liquid water and ice) and aerosol are shown in Fig. 7c–e. The cloud impact peaks at high latitudes in the free troposphere (>10 %), while the aerosol impact peaks at mid-latitudes close to the surface. Their combined effect on OH is spatially extensive. The spatial pattern is primarily driven by the vertical distribution of clouds and the near-surface high concentration of aerosol. The differences in their impact stems from differences in where NOx is removed: aerosols primarily scavenge NOx in the lower troposphere over industrial regions where NOx concentrations are high, whereas clouds exert a stronger influence in remote, high-altitude regions where NOx levels are low (Holmes et al., 2019). As a result, heterogeneous chemistry on cloud surfaces has a disproportionately large effect on global OH despite occurring in areas with lower NOx. As shown in Table 3, if cloud heterogeneous reactions are neglected, [OH]gm increases 2.4 %, which results in a 1.7 % decrease in the CH4 lifetime. Neglecting heterogeneous aerosol reactions yields larger changes: a 3.2 % increase in [OH]gm, and 3.6 % decrease in CH4 lifetime. The impact of cloud heterogeneous reactions matches the results of Holmes et al. (2019), but the impact of aerosol heterogeneous reactions is a bit larger, which may reflect differences in surface area density fields and the uptake coefficients of N2O5 on organic carbon, sea salt and sulfate surface. Neglecting the full impact of heterogeneous reactions results in a 5.8 % increase in [OH]gm and 5.2 % decrease in CH4 lifetime.
The radical terminating, termolecular reaction between OH and NO2 exerts substantial influence on the lifetime of NOx and on tropospheric OH. However, there is uncertainty over the reaction pathways involved, and recent kinetic recommendations have distinguished the dominant pathway forming nitric acid and a secondary pathway forming HOONO (e.g., Burkholder et al., 2020). Models not representing HOONO may consider this species to behave as nitric acid or to decompose rapidly to OH and NO2. In our control run we have assumed the former, using the recent assessments of the rate coefficients of Amedro et al. (2019, 2020), supported by the study of Rolletter et al. (2025). In our JPL run we have assumed the latter, using rate coefficients for the pathway forming nitric acid only (Burkholder et al., 2020). As Fig. 7f shows, the faster rate coefficient in the control run than in the JPL run leads to an 8 % decrease in tropospheric OH concentration, especially in the upper troposphere and at high latitudes. The control simulation, which uses this faster rate coefficient, already slightly overestimates observed OH shown in Fig. 5; therefore, use of the slower JPL rate coefficient would further increase simulated OH levels and would increase this positive bias. Global mean [OH]gm decreases by 7 %, leading to an 8.4 % increase in CH4 lifetime.
4.2 Tropospheric OH budgets
In this section, we quantify the factors affecting the major sources and sinks of OH. The primary source of OH is the photolysis of ozone (O3) at wavelengths less than 330 nm, which produces electronically excited oxygen atoms (O(1D)). Some of these atoms subsequently react with water vapor to form OH. In the control run (CTL, Table 4), this pathway accounts for 92 Tmol yr−1, or 44 % of total OH production – closely matching estimates from Lelieveld et al. (2016) and Bossolasco et al. (2025). Other significant production pathways include the reaction of HO2 with NO (33 %), HO2 with O3 (13 %), and photolysis of hydrogen peroxide (H2O2, 8 %). Minor contributions arise from photolysis of VOCs and organic hydroperoxides (ROOH), as well as other trace pathways. On the loss side, the dominant sink is the reaction of OH with carbon monoxide (CO), contributing to 41 % of total OH removal in the control run. This is consistent with the contribution of ∼40 % reported by Fiore et al. (2024). Additional important sinks include reactions with CH4 (15 %), non-methane VOCs and ROOH (15 %), and aldehydes (RCHO, 8 %). Reactions with O3 and NOx account for 7 %, while minor reactions contribute the remaining 14 %.
Table 4Main reactions leading to tropospheric production and loss of OH (Tmol yr−1) and their relative contribution (%) in seven experiments.
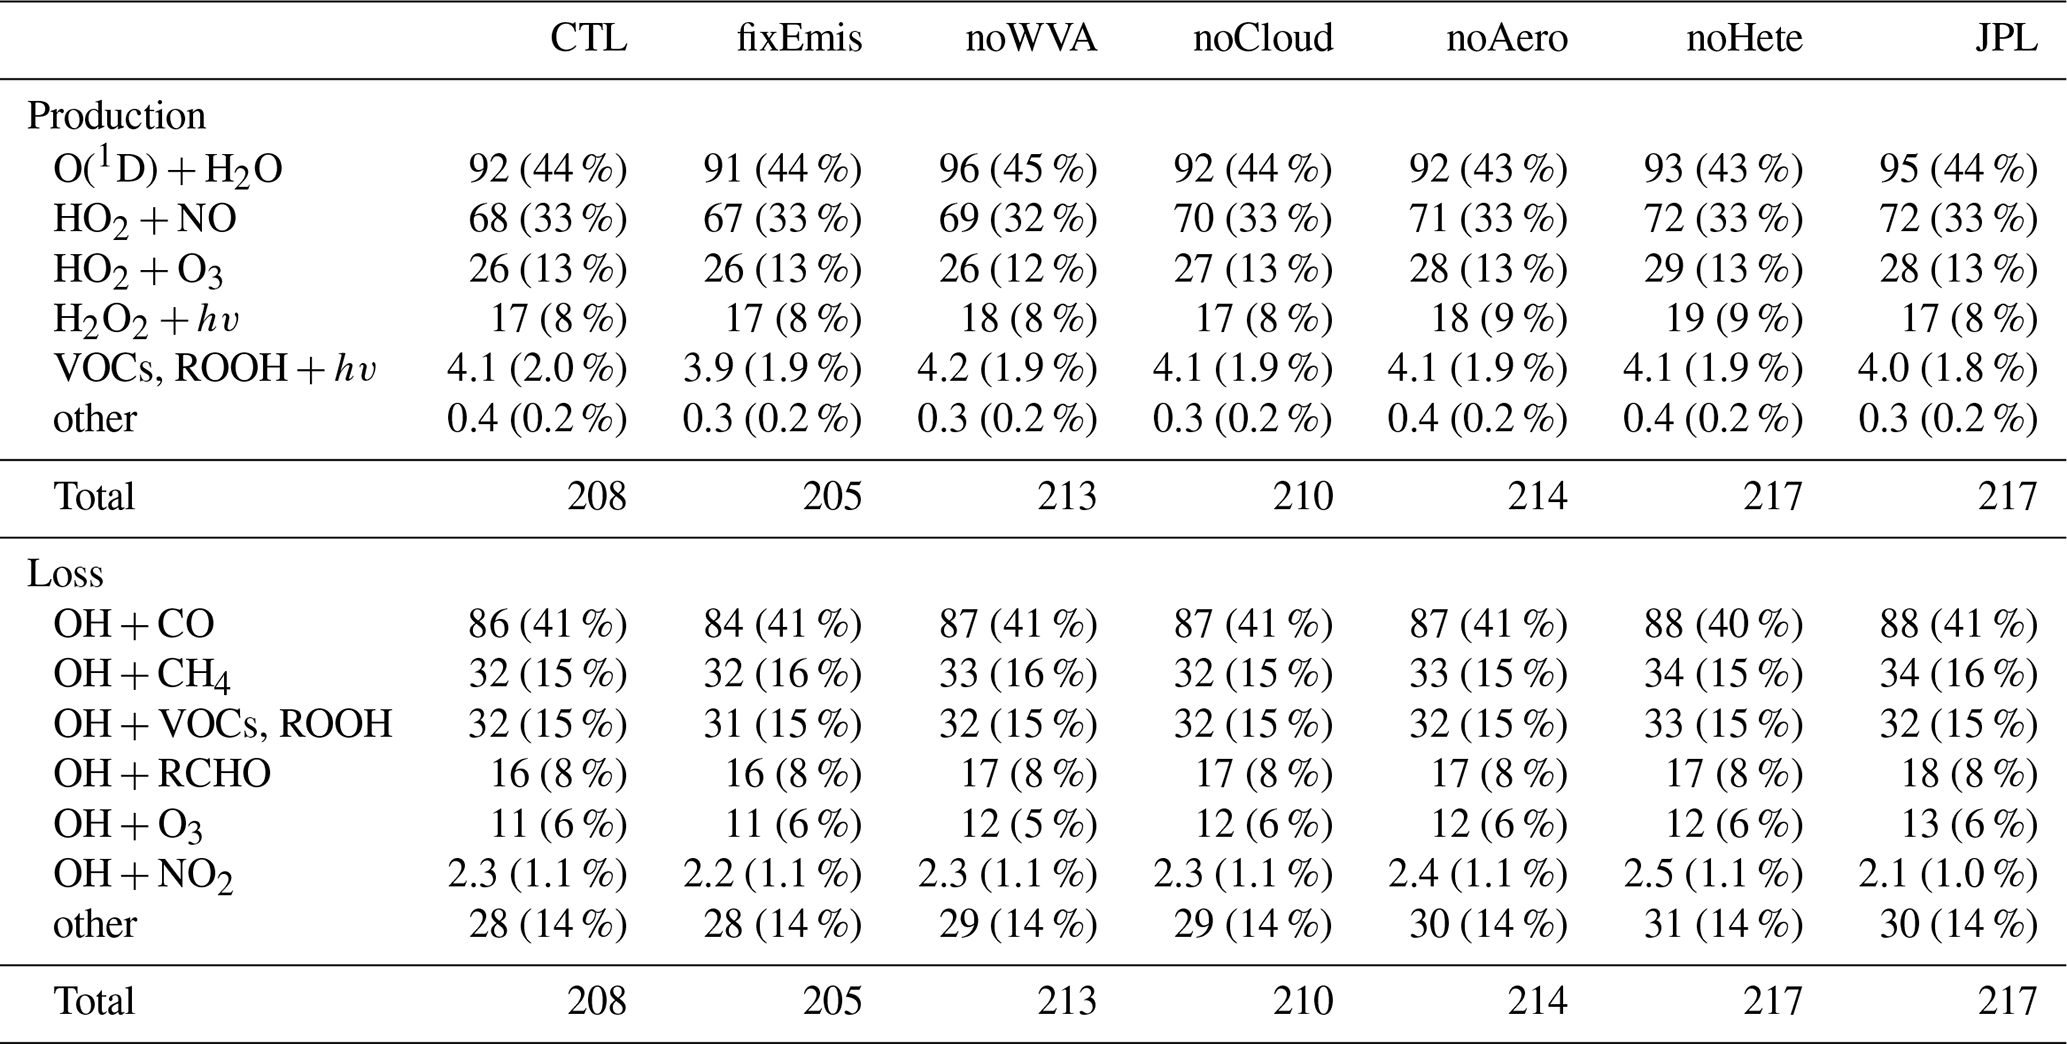
Comparison of the fixEmis run with the control run indicates that the variation in emissions from year to year has a relatively minor impact on OH production and loss. Neglecting UV absorption by water vapor (noWVA) results in 5 Tmol yr−1 greater OH production via the primary pathway (O(1D)+H2O) because more UV radiation is available for O3 photolysis and subsequent O(1D) production. Heterogeneous reactions significantly influence the HO2+NO and HO2+O3 pathways, increasing production by approximately 4 and 3 Tmol yr−1, respectively. However, their relative contributions to total OH production remain largely unchanged. Neglecting the HOONO channel associated with the OH+NO2 reaction results in a modest decrease in OH loss, from 2.3 to 2.1 Tmol yr−1. Despite its small contribution to the global OH loss budget, this change perturbs the coupled HOx–NOx chemistry and enhances radical recycling, leading to a larger response in the steady-state OH abundance. This reduction contributes to net OH accumulation, increasing total OH production from 208 to 217 Tmol yr−1, primarily through the O(1D)+H2O, HO2+NO, and HO2+O3 pathways. Overall, the sensitivity experiments highlight the key atmospheric processes influencing OH levels and allow quantification of their respective impacts, while the OH budget analysis reveals the chemical pathways through which these processes affect OH production and loss.
4.3 Impact of oceanic CH3CHO emissions
Previous studies have indicated that oceanic emissions of CH3CHO represent a missing sink of OH in current chemistry-climate models (Wang et al., 2019). Due to the limited measurement data and large uncertainty in these emissions, we conducted two additional short simulation experiments to assess their impacts on [OH]gm. Figure 8 shows the vertical distribution of CH3CHO measured over the remote Pacific during the ATom campaigns, as well as model mixing ratios sampled along the flight tracks. Without oceanic emissions (CTL run), the model underestimated CH3CHO by up to an order of magnitude in the boundary layer and free troposphere (see Fig. 8). By including oceanic emissions, simulated CH3CHO in the marine boundary layer is greatly improved, with the mean bias reduced from ∼100 to ∼20 pptv, especially in spring and summer. However, the subsequent impact in the free troposphere is relatively limited, indicating that an additional missing chemical source likely exists there, as suggested by Wang et al. (2019).
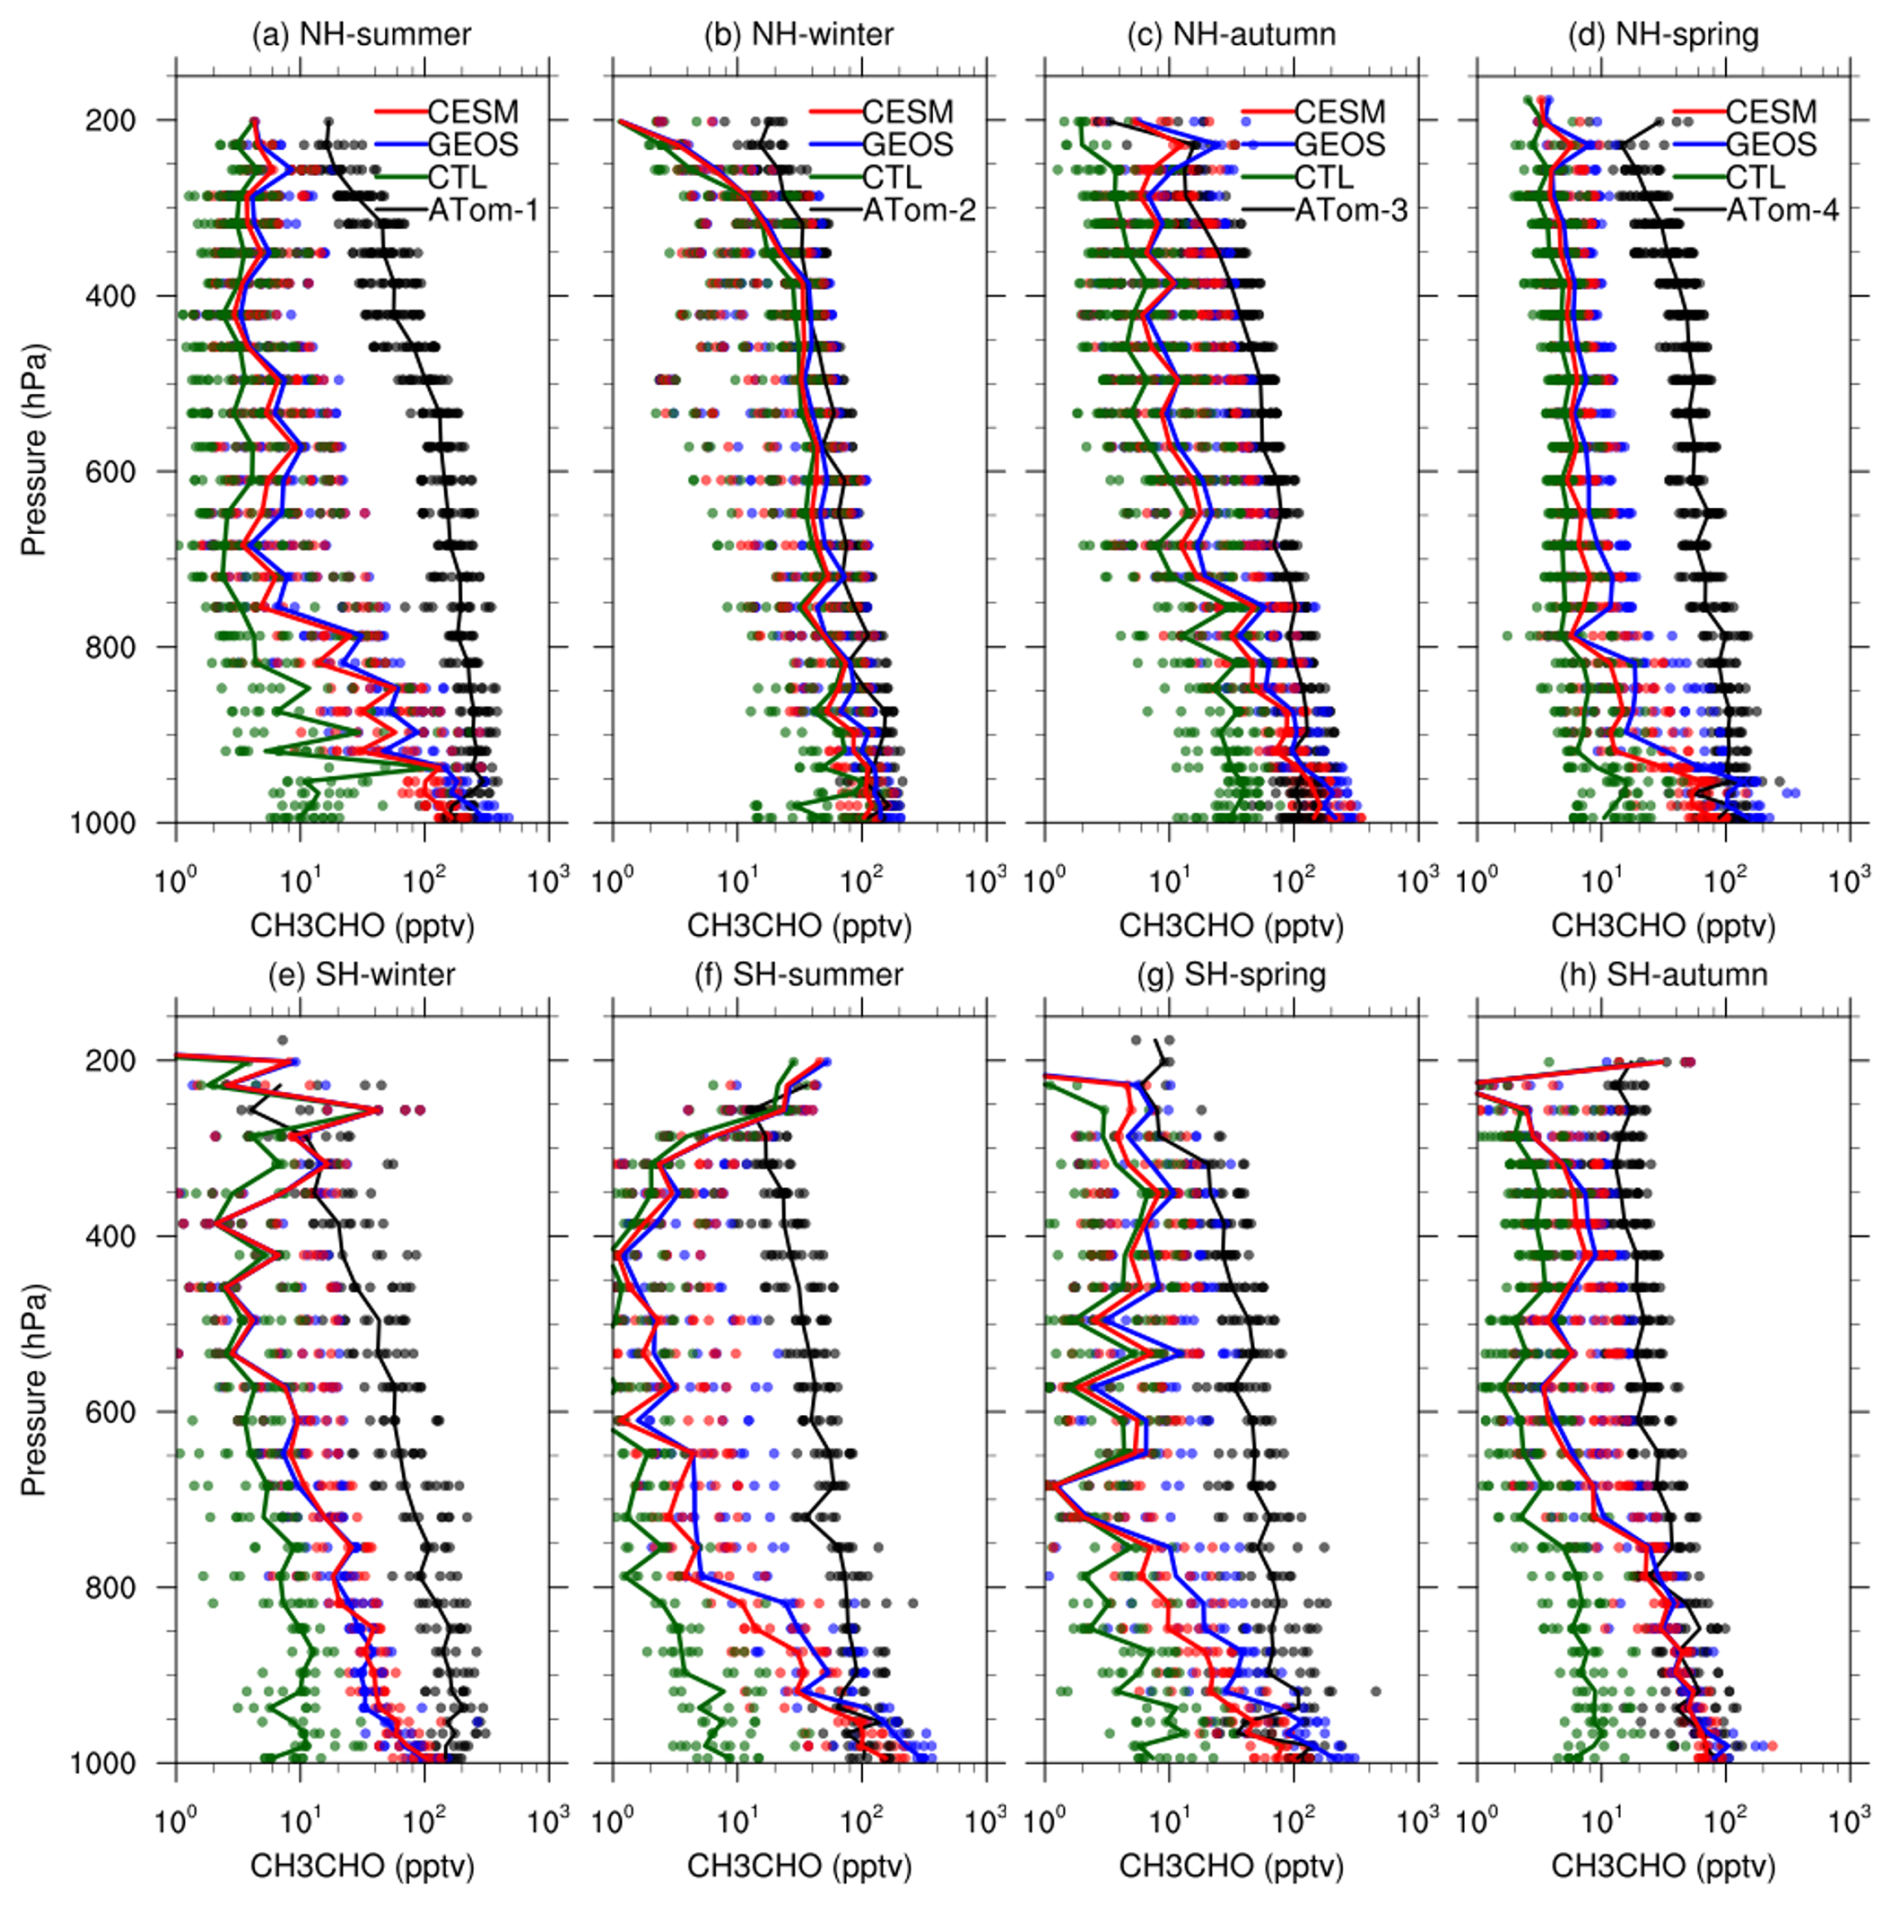
Figure 8As Fig. 5, but for CH3CHO (pptv). The model control run (CTL) is shown in green, with results from model runs using emissions from CESM and GEOS-Chem shown in red and blue respectively.
Table 5The annual mean global emissions and burdens of CH3CHO, [OH]gm and τCH4 during 2016–2017 from ALD-cesm and ALD-geoc runs.
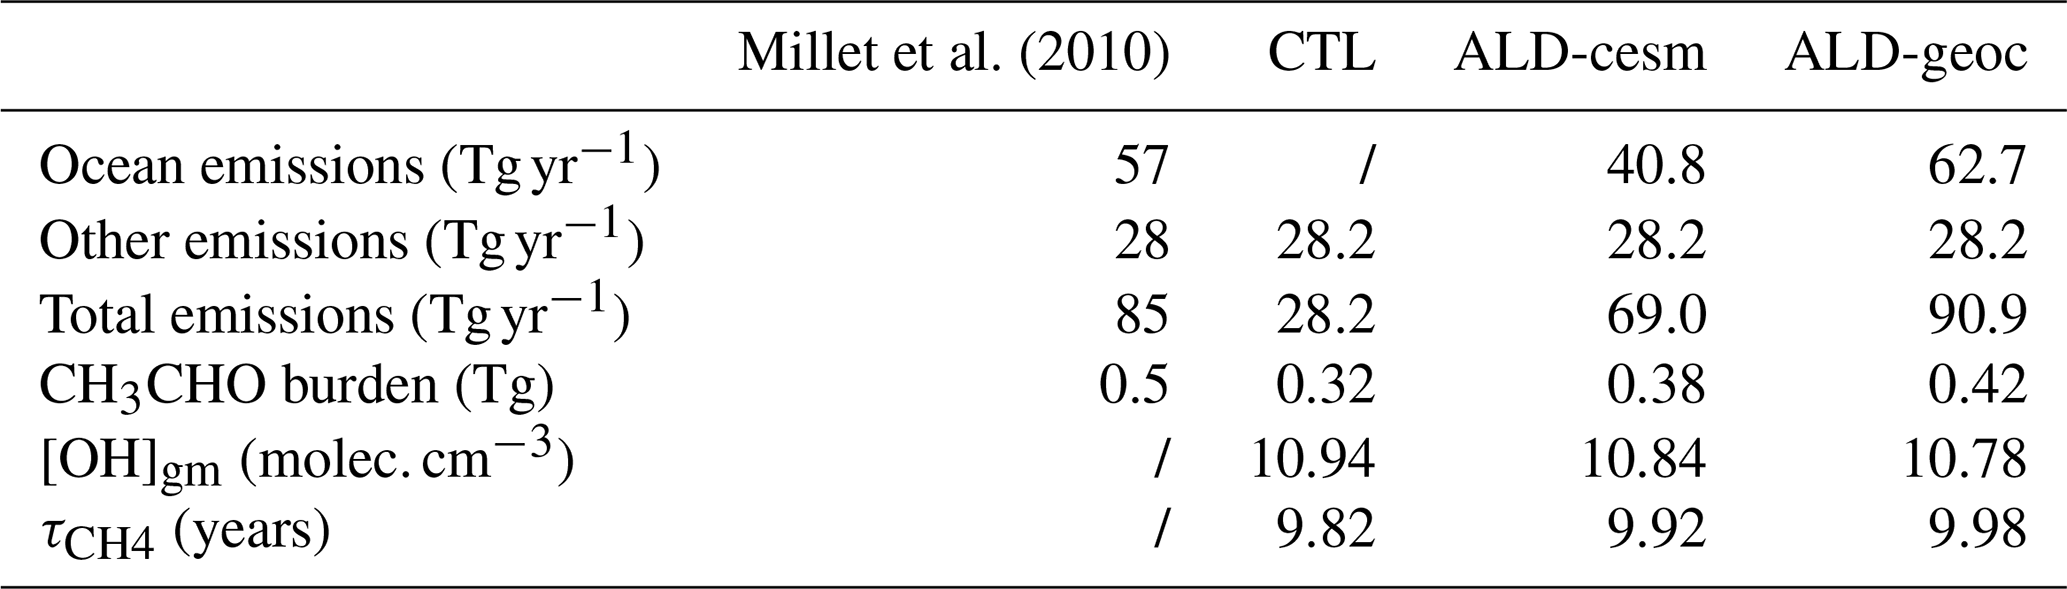
As shown in Table 5, including oceanic emissions of CH3CHO increases its global burden from 0.32 to 0.38 Tg (+19 %) in the ALD-cesm run, and to 0.42 Tg (+31 %) in the ALD-geoc run – bringing the simulated values into much closer agreement with previous estimates (e.g. Millet et al., 2010), and thereby improving confidence in the representation of CH3CHO sources in the model. This increase in CH3CHO leads to a decrease in the global mean OH concentration of up to 1.5 % and an increase in the CH4 lifetime up to 9.98 years (+1.6 %). Overall, while current estimates of oceanic CH3CHO emissions slightly decrease global mean OH concentration and marginally increase CH4 lifetime, their impact appears limited. Nonetheless, incorporating more reliable oceanic CH3CHO emission estimates and improving the representation of its sources in the free troposphere may lead to a stronger impact of CH3CHO on [OH]gm and τCH4.
4.4 Tropospheric OH column trends
The annual and seasonal distribution of tropospheric column OH exhibits substantial spatial and seasonal heterogeneity (Fig. 9). In summer, the highest columns are located at low and mid latitudes in the northern hemisphere, while in winter they shift to the southern hemisphere. Maxima are primarily located in the Northern Hemisphere in regions where anthropogenic emissions dominate the high OH production (e.g., India, China, Southeast Asia, and Central America). Regions of high tropospheric OH column are primarily associated with elevated levels of OH precursors, particularly NO2, together with favorable photochemical conditions, and the short lifetime of OH further confines its distribution and limits long-range transport (Duncan et al., 2016; Chua et al., 2023). Over tropical oceans, there are relatively high columns which may be attributed to high primary production and NOx shipping emissions, as evidenced by column maxima along shipping lanes between Sri Lanka and Malaysia (Richter et al., 2004). Another broad column maximum extends across the Atlantic Ocean, a likely result of influence from African and South American biomass burning.
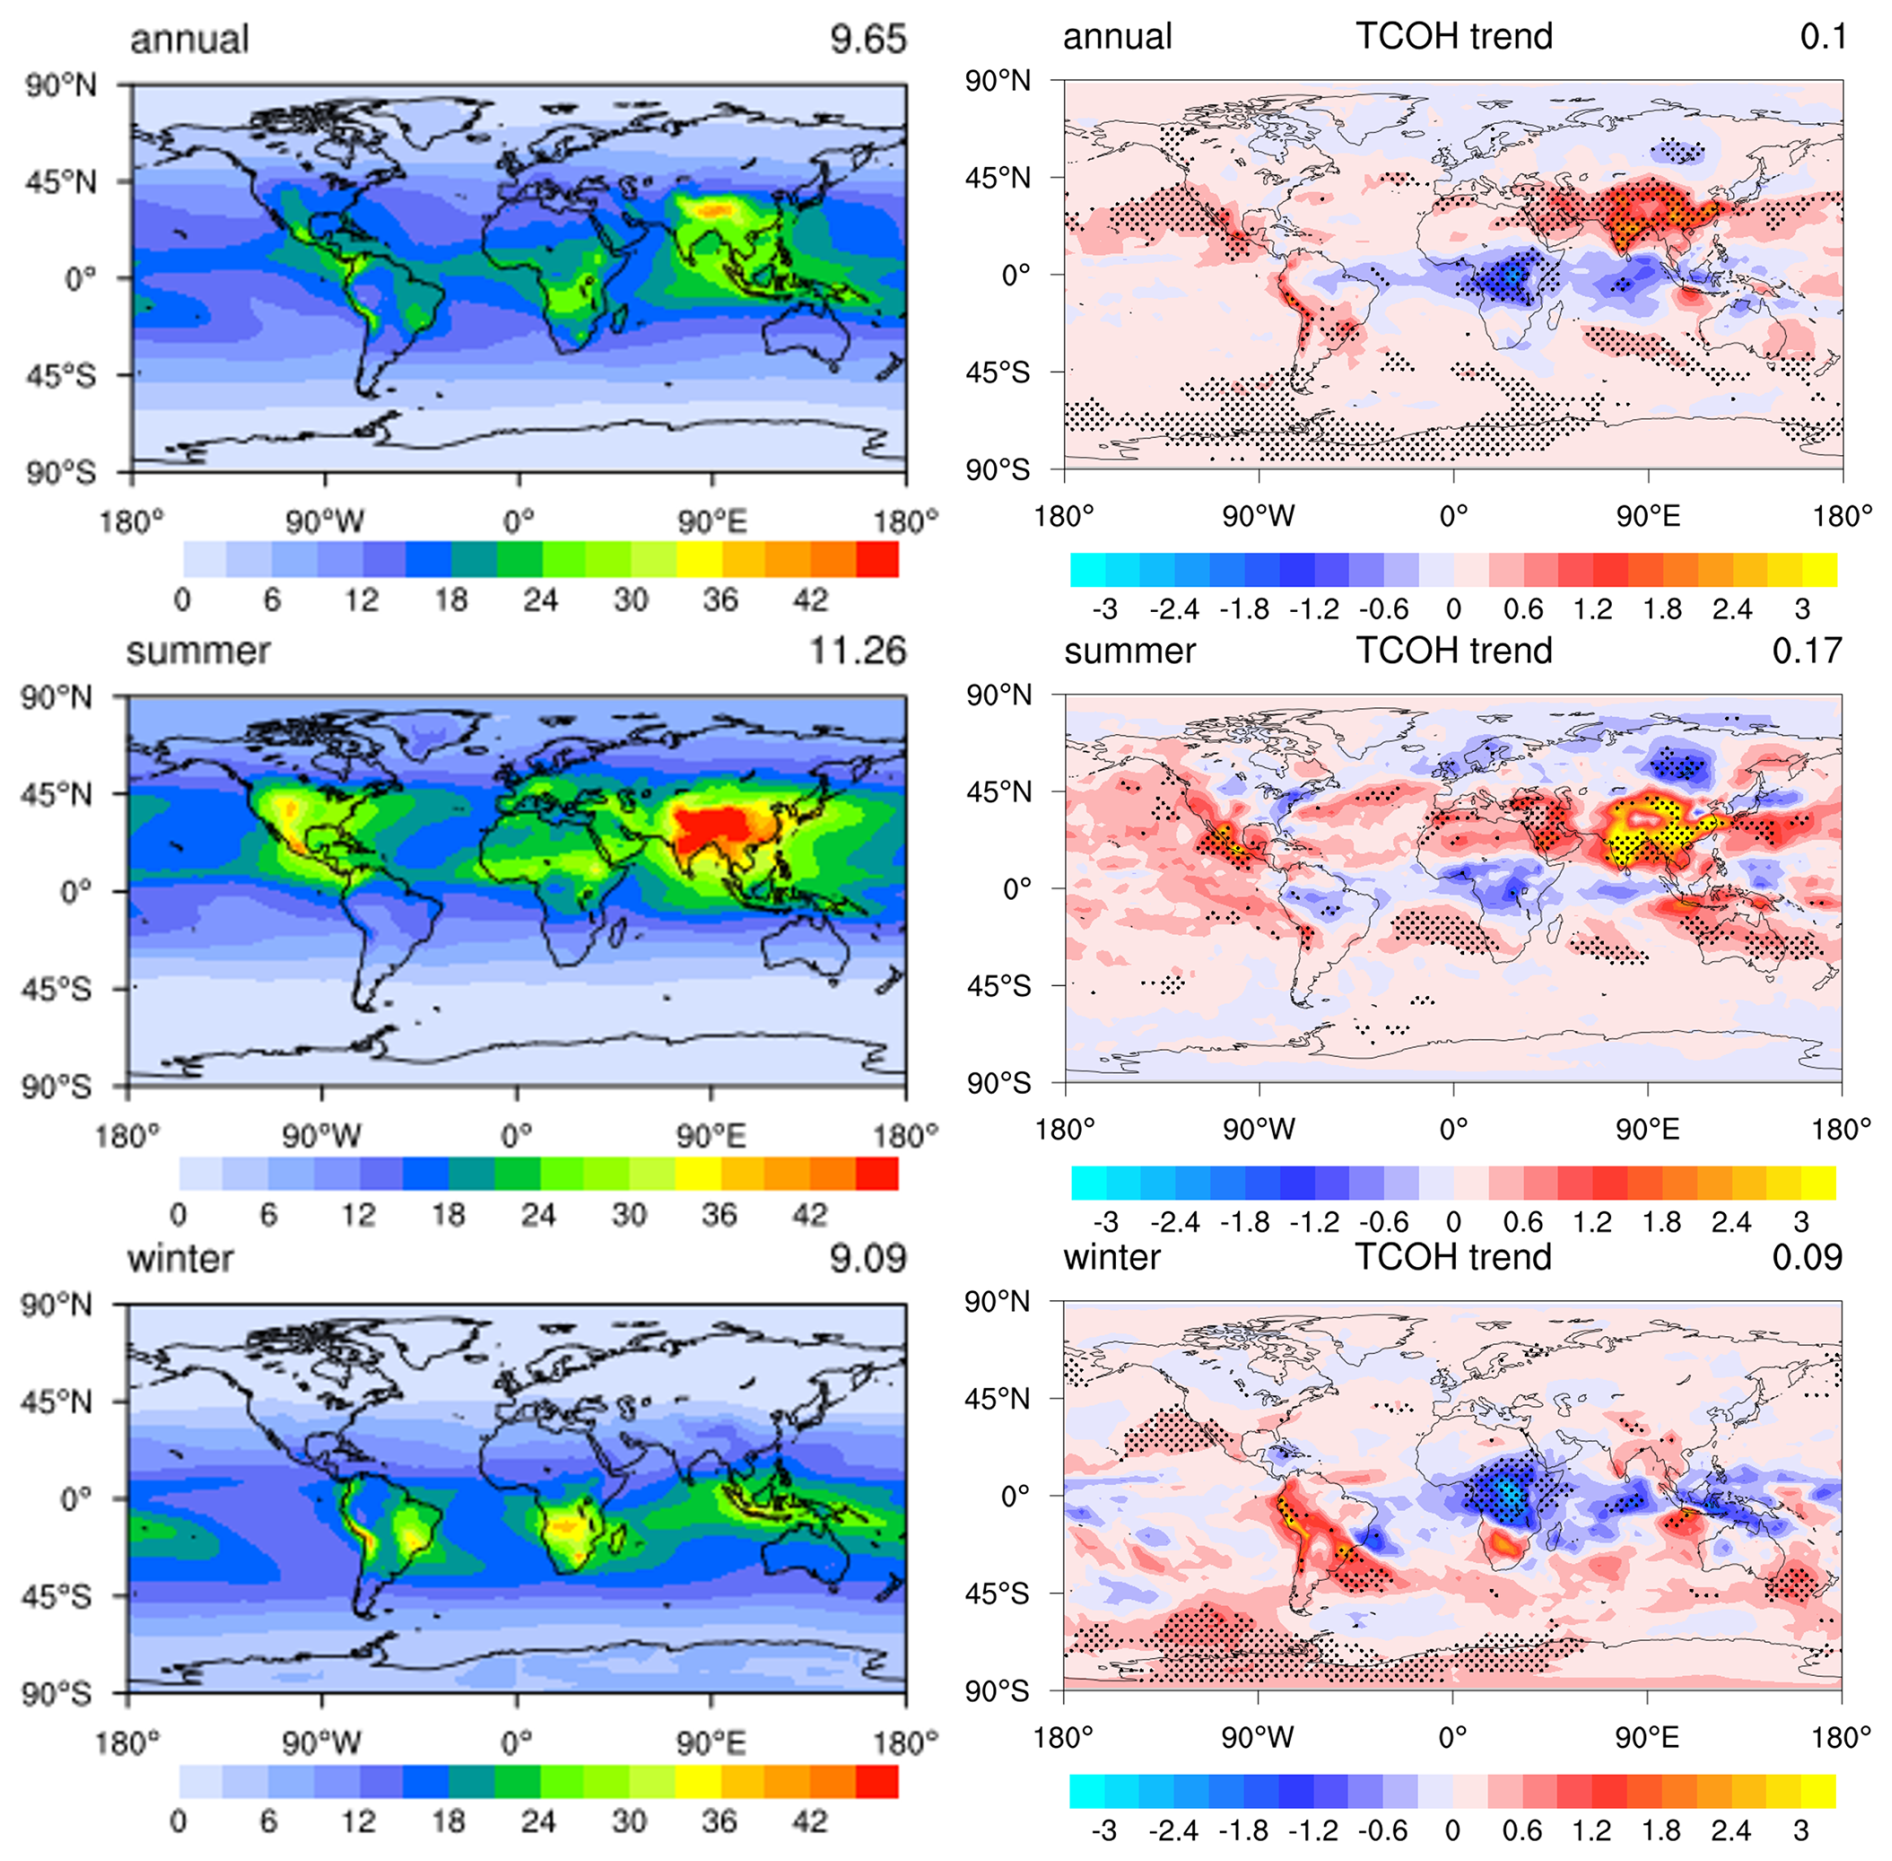
Figure 9The tropospheric column of OH (TCOH, 1012 , left panels) and the trend (1011 , right panels) in annual, winter and summer from 2000 to 2017. The troposphere was defined as the region below a climatological tropopause () following Lawrence et al. (2001). Trends are calculated as in Fig. 2. The value in the right corner is the global average.
The trends in the annual tropospheric OH column also exhibit large spatial heterogeneity (Fig. 9, right panels). Increases in OH of up to 0.3×10¹¹ dominate over most of the world, particularly over India and China where they exceed 1.5×10¹¹ (1.6 % yr−1), although there are spatially extensive regions with decreasing OH, typically of 0.3×10¹¹ , particularly over central Africa, the tropical Atlantic and Indian Oceans where the decrease exceeds 1 % yr−1. The strong positive trend over India is consistent with Souri et al. (2024), who also identified India as a major region of increasing tropospheric OH associated with rising NO2. However, Souri et al. (2024) found decreasing OH over the North China Plain after 2011 in response to recent NOx emission reductions, in contrast to the broader positive trend over China simulated here. This difference likely reflects, in part, the different analysis periods and treatment of recent emission changes. When averaged globally, these regional distinctions are lost, and there is a net increase of 0.1×10¹¹ . Over India and China, the increases are significant and are closely linked to the increased emissions of NOx and other O3 precursors (Hou et al., 2023b), although small increases are still seen in the fixed-emission experiment (Fig. S8). Over tropical Africa there are decreases in OH whether or not emission changes are considered (Figs. 9 and S8), suggesting that they arise from changes in meteorology rather than emissions. However, we note that the modelled positive trend in CO column and the underestimated positive trend in tropospheric O3 column in this region may lead to an overestimation of the decreases in OH over Africa and the tropical oceans.
4.5 Contributions of Selected Atmospheric Processes to Tropospheric OH Variability and Trends
We quantify the relative contributions of key factors to changes in annual global mean OH over time by comparing sensitivity simulations with the control run. Meteorological effects are estimated using simulations with fixed emissions, which isolate variability driven by meteorology. The control simulation is used as a reference to represent the combined influence of all processes.
Most observational estimates based on methyl chloroform (MCF) indicate a decrease in global mean OH from about 2005 (Rigby et al., 2017) but estimates from several model-based studies suggest an increase over this period (Stevenson et al., 2020; Zhao et al., 2020). Our simulated OH shows relatively little change from 2000 to 2017, with a small net increase of 0.74×10³ (6.8 % yr−1 of the multiyear global mean OH, see Table 6 and Fig. 10c). In summer, the increases are largest at 1.36×10³ and are significant. With emissions fixed at 2000 levels, OH increases more strongly, by 1.69×10³ , indicating an important contribution from interannual changes in meteorology. These may affect OH through changes in temperature, water vapour, clouds and photolysis, although their individual contributions are not isolated in the present experiments. In autumn and winter, the OH increase by 0.52×10³ and 0.32×10³ , respectively, but these increases are not statistically significant.
Table 6Annual and seasonal [OH]gm trends (103 ) in seven simulation experiments.
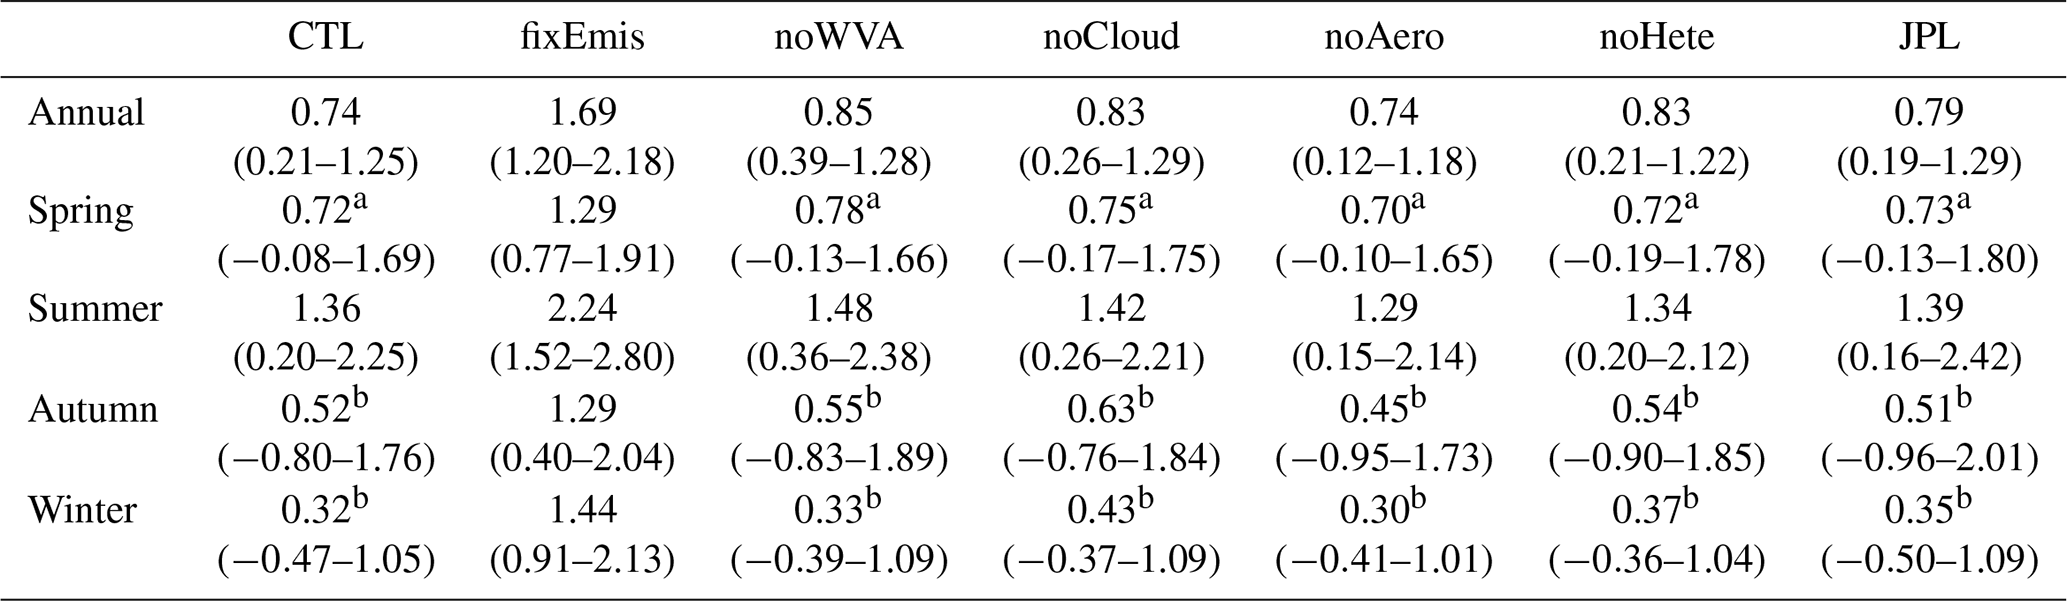
Note: Trends are calculated using the Theil–Sen method, with 90 % confidence intervals shown in parentheses. Trends with a are not significant at a 90 % level using the Mann–Kendall test, but are at an 80 % level. b Trends that are not significant at an 80 % level.
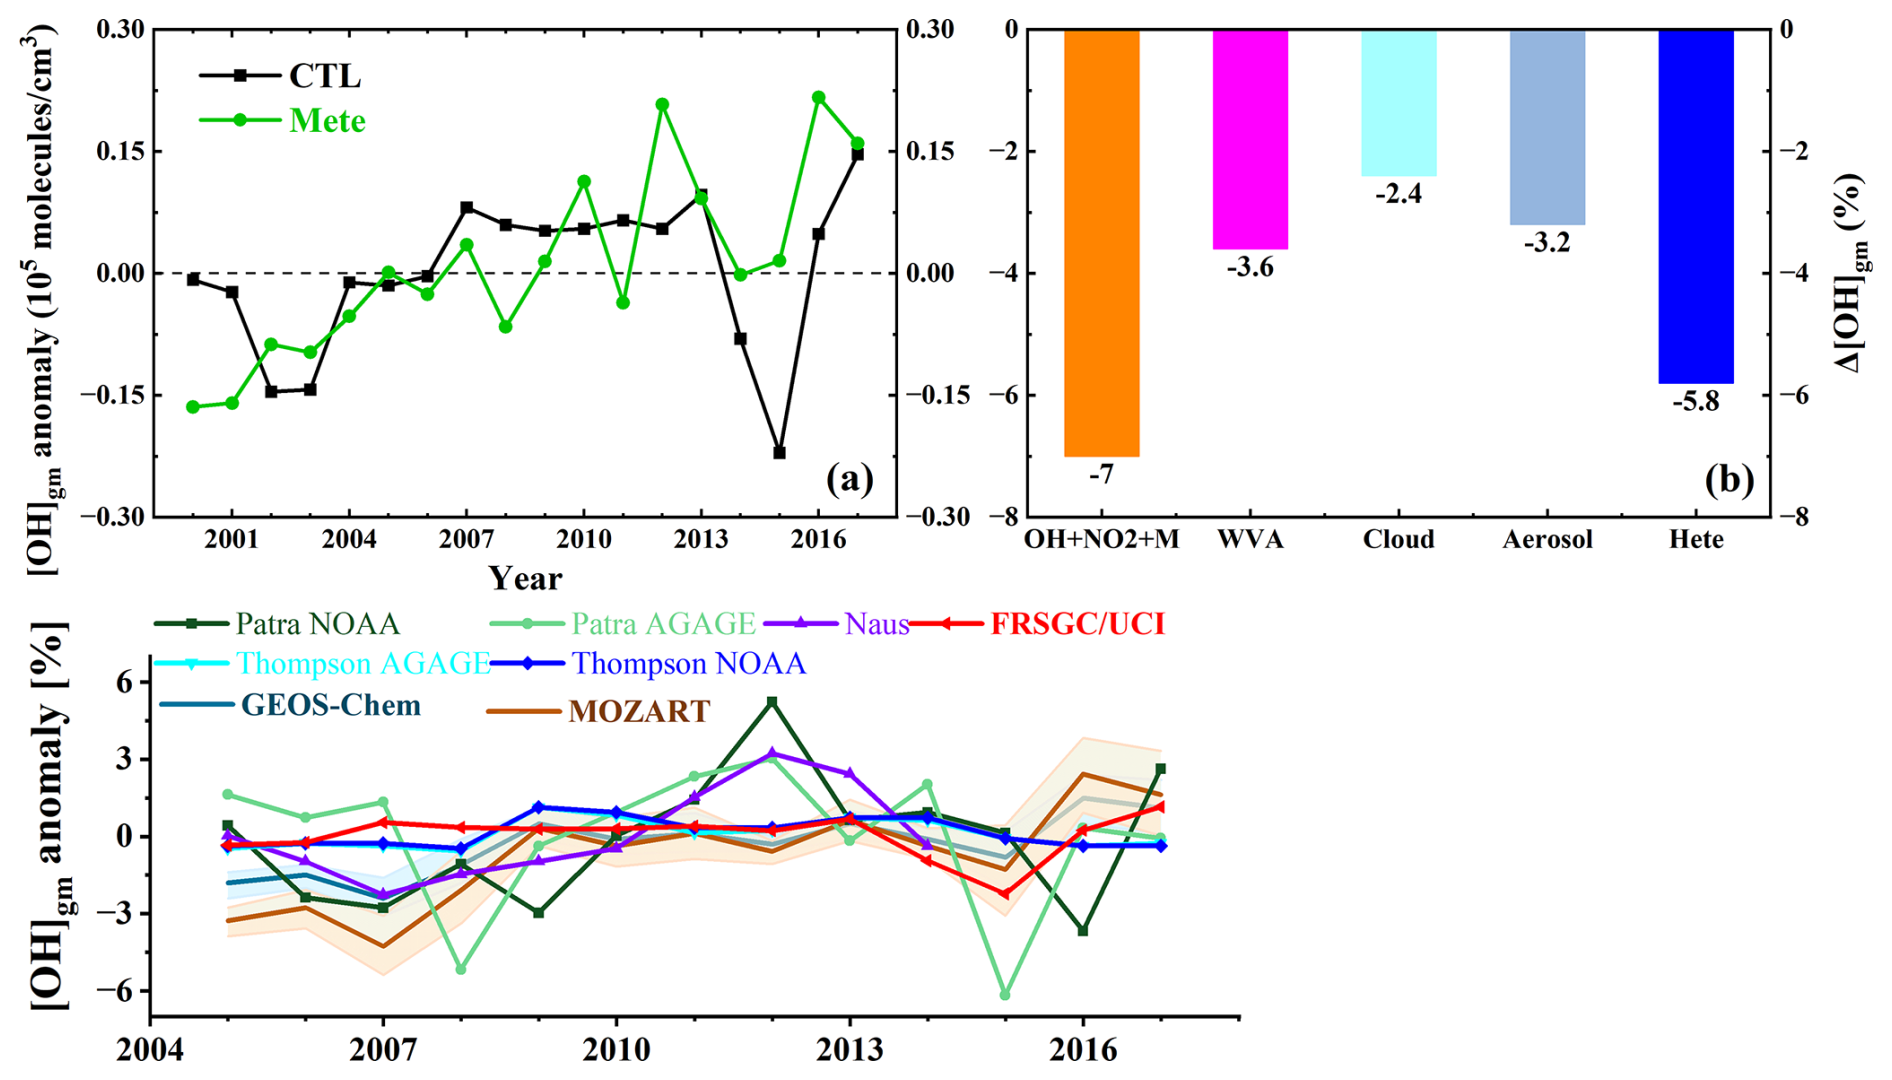
Figure 10(a) The anomaly of [OH]gm (105 ) in the control run (CTL) and fixed emission run (labelled “Mete”), (b) the relative differences in annual mean [OH]gm (%) between CTL and the respective sensitivity runs, averaged over 2000–2017, and (c) the relative [OH]gm anomalies (%) from this work (FRSGC/UCI) and other studies. The labels in panel (b) match those in Fig. 7. Results based on the MOZART and GEOS-Chem chemical mechanisms in panel (c) are from Zhao et al. (2025), the MCF-based inversion estimates are from Patra et al. (2021) and Naus et al. (2019), and the HFC-based inversion estimates are from Thompson et al. (2024).
As shown in Fig. 10a, global mean OH in the control run exhibits clear interannual variability, with particularly pronounced decreases in 2002 and 2015 and increases in 2007 and 2016, alongside other year-to-year variations over the study period. Interannual variability is also evident in the fixed-emission simulation, further indicating a role for meteorological variability in year-to-year changes in OH. The 2007 increase can be attributed to a decrease in fire-related CO emissions from 2006 to 2007 associated with the La Niña event (Fig. S3; Zhao et al., 2025). This reduction in CO emissions led to lower global CO concentrations, thereby decreasing OH consumption via the OH+CO reaction pathway. In contrast, both 2002 and 2015 experienced elevated fire emissions – particularly in 2015 – driven by intensified tropical wildfires linked to El Niño events, resulting in increased atmospheric CO and enhanced OH loss. Consistent with this relationship, annual anomalies in global mean OH are negatively correlated with anomalies in fire-related CO emissions over 2000–2017 (), although uncertainties remain in the CO emission inventory used here. These fire-emission-related features are not evident in the fixed-emission run, further supporting the influence of interannual variability in fire-related CO emissions on OH.
The processes examined in this study primarily affect the absolute global abundance of OH, while their effects on the simulated OH trend over 2000–2017 are relatively small. Several of these processes reduce global mean OH and therefore reduce the high-OH tendency commonly reported in global models (Shindell et al., 2006; Fiore et al., 2009; Naik et al., 2013), although the accuracy of the modelled OH trend remains uncertain. As shown in Table 6 and Fig. 10, water vapor UV absorption reduces global mean OH by 3.6 % and slightly weakens its increase. Heterogeneous chemistry on clouds decreases OH by 2.4 %. Because cloud ice surface area density varies with meteorological conditions and shows a small increase during 2000–2017, cloud heterogeneous chemistry may also suppress the positive OH trend slightly. Aerosol heterogeneous chemistry has a somewhat larger effect on mean OH, reducing it by 3.2 %, but has little influence on the OH trend here because the prescribed aerosol surface area density does not capture interannual changes in aerosol abundance. The combined heterogeneous effect reduces global mean OH by 5.8 %, with the change in the OH trend arising primarily from cloud heterogeneous chemistry. The updated OH+NO2 reaction rate used in the control run also reduces global mean OH by about 7 %, while having only a small effect on the simulated trend. Although the OH+NO2 reaction contributes only ∼1 % to total OH loss, this sensitivity reflects nonlinear adjustments in HOx–NOx chemistry and radical recycling.
Tropospheric OH variations in Fig. 10c calculated using the FRSGC/UCI control run from 2005 to 2017 are compared with those derived from the MOZART and GEOS-Chem models as reported by Zhao et al. (2025) who estimated OH variations using an observation- and model-driven approach with chemical mechanisms based on MOZART and GEOS-Chem. Also shown in Fig. 10c are MCF-based inversions from the 3D model outlined by Patra et al. (2021) and Naus et al. (2019), as well as the HFC-based inversions from the box model described by Thompson et al. (2024). Despite substantial differences in the magnitude of year-to-year variability, these independent approaches show several common temporal features, including enhanced OH around 2012–2013 and lower values during 2014–2015. Our model control simulation exhibits relatively smooth OH variations, with smaller year-to-year fluctuations than most of the inversion estimates, while still capturing some of these common temporal features. In contrast, the MCF-based inversions generally exhibit larger fluctuations than the chemistry transport models and HFC-based inversions, highlighting the sensitivity of inferred OH variability to observational constraints and inversion frameworks. Taken together, the comparison suggests that global tropospheric OH over this period is characterized primarily by interannual variability rather than a persistent long-term change. The agreement in the timing of OH anomalies, despite differences in their amplitudes, provides some confidence that these variations reflect real large-scale changes, while the spread among estimates remains an important measure of uncertainty.
This study has analyzed the distribution and evolution of tropospheric OH and of its sensitivity to key factors from 2000 to 2017 using an updated version of the FRSGC/UCI global chemistry transport model. The model reproduces the observed distribution and interannual changes in the tropospheric O3 column and tropospheric NO2 column well but does not capture the observed decrease in the CO column. This mismatch in the CO trend may lead to an underestimation of any increase or overestimation of any decrease in OH concentrations over the 2000–2017 period. The model captures the vertical profile of OH relatively well in oceanic regions, although HO2 is overestimated in the mid troposphere, highlighting potential chemical biases or weaknesses in emissions estimates.
Airmass-weighted OH concentrations and methane lifetimes in this study are within the range of observationally constrained and multi-model estimates. There are relatively high OH concentrations between 30° S and 30° N in the lower to middle troposphere, with largest values in the northern hemisphere. The contributions of water vapor absorption and heterogeneous reactions on aerosol decrease with altitude, while the effect of heterogeneous reactions on cloud droplets peaks in the upper troposphere. The faster rate coefficient for the termolecular reaction between OH and NO2 used in the control run leads to a 7 % decrease in global tropospheric OH, with the largest effects in the upper troposphere and at high latitudes. UV absorption by water vapor results in a 4.3 % decrease in OH production via the primary pathway (O(1D)+H2O). Heterogeneous reactions reduce OH concentrations by suppressing the HO2+NO and HO2+O3 pathways, primarily through the depletion of HO2 and the alteration of NOx partitioning, both of which are closely linked to ambient NOx and HO2 levels.
The tropospheric OH column exhibits substantial spatial and seasonal variability and shows a significant positive trend over most regions of the globe. The largest increases are found over India and China, exceeding 1.5×10¹¹ (>1.6 % yr−1) which can principally be attributed to the increase in anthropogenic emissions. In contrast, decreases in the OH column are evident over tropical regions, approximately 0.3×10¹¹ , particularly in tropical Africa, the tropical Atlantic and the Indian Ocean where decreases exceed 1 % yr−1. These decreases are influenced by changes in meteorological conditions, while the mismatch in the simulated CO trend introduces additional uncertainty into the simulated OH trend. The annual trend in global mean OH exhibits a weak but statistically significant positive trend, particularly in summer, averaging 1.36×10³ . This is likely associated with changes in NOx emissions. Meteorological variability contributes to a more significant annual increase in global mean OH of 1.69×10³ .
While water vapor UV absorption and heterogeneous reactions have a limited influence on the interannual variability of global mean OH, they substantially affect its absolute level. Specifically, water vapor UV absorption reduces global mean OH by 3.6 %, increasing the methane lifetime by 4.2 %. The combined influence of cloud- and aerosol-related heterogeneous processes leads to an overall 5.8 % decrease in global mean OH. Incorporating these processes reduces the simulated OH levels and alters methane lifetime, while having little effect on the OH trend. The 7 % decrease of OH by faster OH+NO2 reaction induces an 8.4 % change in methane lifetime, underscoring the importance of accurately representing termolecular reaction kinetics. Oceanic acetaldehyde emissions (40–63 Tg yr−1) lead to modest reductions in OH (0.9 %–1.5 %) and increases in methane lifetime (1.0 %–1.6 %), highlighting the role of biogenic source uncertainties. Together, these results suggest that improved representation of the processes examined here can help reduce the tendency of global models to overestimate OH and underestimate methane lifetimes, although these processes alone cannot fully account for this bias. The model configuration used here does not include halogen chemistry, which can influence tropospheric OH and may provide an additional pathway for reducing this bias. In this study, the large sensitivity to the OH+NO2 reaction rate highlights the need to better constrain its kinetics, while the effects of oceanic acetaldehyde emphasize the need for improved constraints on marine emissions. For H2O UV absorption and heterogeneous chemistry, more consistent implementation of current process understanding across global models would help reduce structural differences in simulated OH. Overall, improving OH representation requires both tighter constraints on uncertain kinetics and emissions and broader incorporation of currently understood processes into global models.
The monthly mean model outputs used in this study are publicly available at https://doi.org/10.5281/zenodo.19112214 (Hou, 2026). The Aura Ozone Monitoring Instrument/Microwave Limb Sounder (OMI/MLS) tropospheric ozone dataset was obtained from https://acd-ext.gsfc.nasa.gov/Data_services/cloud_slice/new_data.html (last access: 20 August 2026). Tropospheric NO2 column data from OMI QA4ECV version 1.1 for the period 2005–2017 were provided by the Tropospheric Emission Monitoring Internet Service (TEMIS; https://www.temis.nl/, last access: 20 August 2026). MOPITT-derived CO (Near- and Thermal-Infrared Radiances), version 9 (V009), for 2001–2017 were obtained from the NASA Earthdata archive (https://asdc.larc.nasa.gov/project/MOPITT, last access: 20 August 2026). The gridded Tropospheric Ozone Assessment Report (TOAR) global database is available at https://doi.org/10.1594/PANGAEA.880506 (Schultz et al., 2017a). Vertical profiles of OH, HO2, and CH3CHO from the Atmospheric Tomography Mission (ATom) were obtained from the NASA Earthdata archive (https://www.earthdata.nasa.gov/data/catalog/ornl-cloud-atom-merge-v2-1925-2.0, last access: 20 August 2026).
The supplement related to this article is available online at https://doi.org/10.5194/acp-26-13767-2026-supplement.
XH, RH and OW designed the study. RH processed the emission inventories. XH, RH, OW and AM updated model code. RJP and XH created codes to compare model outputs with satellite data using averaging kernels. XH ran model simulations and performed the analysis. XH and RH prepared the paper with contributions from all co-authors. SW provided seawater acetaldehyde concentrations and guidance for configuring the CESM2 simulations. XH and YW conducted CESM2 and GEOS-Chem model runs to generate oceanic acetaldehyde emissions. YZ contributed OH anomaly data derived from MOZART and the GEOS-Chem chemical mechanisms. OW, JL, BZ, TZ and AKP discussed the results and offered valuable comments.
At least one of the (co-)authors is a member of the editorial board of Atmospheric Chemistry and Physics. The peer-review process was guided by an independent editor, and the authors also have no other competing interests to declare.
Publisher's note: Copernicus Publications remains neutral with regard to jurisdictional claims made in the text, published maps, institutional affiliations, or any other geographical representation in this paper. The authors bear the ultimate responsibility for providing appropriate place names. Views expressed in the text are those of the authors and do not necessarily reflect the views of the publisher.
We acknowledge the use of the High-End Computing (HEC) high performance and high throughput computing resources at Lancaster University, UK, as well as additional computational support from High-Performance Computing Center at Nanjing University of Information Science & Technology, China. We gratefully acknowledge the use of satellite observations of O3 from OMI/MLS, NO2 from OMI QA4ECV, and CO from MOPITT, surface O3 observations from the TOAR database, and aircraft observations of OH, HO2, and CH3CHO from the ATom missions. We thank the teams and investigators involved in producing, maintaining, and making these observational datasets available. We also thank Louisa Emmons from the NSF National Center for Atmospheric Research for valuable advice on the implementation and operation of the CESM2-OASISS module (https://wiki.ucar.edu/spaces/camchem/pages/358319521/Online Air-Sea Interface for Soluble Species OASISS, last access: 19 September 2026).
XH is supported by the National Key Research and Development Program of China (grant no. 2022YFC3701204). RH and XH are supported by the NERC grant LSO3 (NE/V011863/1). RH and AM are supported by the NERC InHALE grant (NE/X003582/). RP was funded by the UK Natural Environment Research Council (NERC) by providing funding for the National Centre for Earth Observation (NCEO, award reference NE/R016518/1).
This paper was edited by Bryan N. Duncan and reviewed by two anonymous referees.
Allen, D. J. and Pickering, K. E.: Evaluation of lightning flash rate parameterizations for use in a global chemical transport model, J. Geophys. Res., 107, 4711, https://doi.org/10.1029/2002JD002066, 2002.
Amedro, D., Bunkan, A. J. C., Berasategui, M., and Crowley, J. N.: Kinetics of the OH+NO2 reaction: rate coefficients (217–333 K, 16–1200 mbar) and fall-off parameters for N2 and O2 bath gases, Atmos. Chem. Phys., 19, 10643–10657, https://doi.org/10.5194/acp-19-10643-2019, 2019.
Amedro, D., Berasategui, M., Bunkan, A. J. C., Pozzer, A., Lelieveld, J., and Crowley, J. N.: Kinetics of the OH+NO2 reaction: effect of water vapour and new parameterization for global modelling, Atmos. Chem. Phys., 20, 3091–3105, https://doi.org/10.5194/acp-20-3091-2020, 2020.
Anderson, D. C., Duncan, B. N., Fiore, A. M., Baublitz, C. B., Follette-Cook, M. B., Nicely, J. M., and Wolfe, G. M.: Spatial and temporal variability in the hydroxyl (OH) radical: understanding the role of large-scale climate features and their influence on OH through its dynamical and photochemical drivers, Atmos. Chem. Phys., 21, 6481–6508, https://doi.org/10.5194/acp-21-6481-2021, 2021.
Anderson, D. C., Duncan, B. N., Liu, J., Nicely, J. M., Strode, S. A., Follette-Cook, M. B., Souri, A. H., Ziemke, J. R., González-Abad, G., and Ayazpour, Z.: Trends and interannual variability of the hydroxyl radical in the remote tropics during boreal autumn inferred from satellite proxy data, Geophys. Res. Lett., 51, e2024GL108531, https://doi.org/10.1029/2024GL108531, 2024.
Archibald, A. T., O'Connor, F. M., Abraham, N. L., Archer-Nicholls, S., Chipperfield, M. P., Dalvi, M., Folberth, G. A., Dennison, F., Dhomse, S. S., Griffiths, P. T., Hardacre, C., Hewitt, A. J., Hill, R. S., Johnson, C. E., Keeble, J., Köhler, M. O., Morgenstern, O., Mulcahy, J. P., Ordóñez, C., Pope, R. J., Rumbold, S. T., Russo, M. R., Savage, N. H., Sellar, A., Stringer, M., Turnock, S. T., Wild, O., and Zeng, G.: Description and evaluation of the UKCA stratosphere–troposphere chemistry scheme (StratTrop vn 1.0) implemented in UKESM1, Geosci. Model Dev., 13, 1223–1266, https://doi.org/10.5194/gmd-13-1223-2020, 2020.
Boersma, K. F., Eskes, H. J., Richter, A., De Smedt, I., Lorente, A., Beirle, S., van Geffen, J. H. G. M., Zara, M., Peters, E., Van Roozendael, M., Wagner, T., Maasakkers, J. D., van der A, R. J., Nightingale, J., De Rudder, A., Irie, H., Pinardi, G., Lambert, J.-C., and Compernolle, S. C.: Improving algorithms and uncertainty estimates for satellite NO2 retrievals: results from the quality assurance for the essential climate variables (QA4ECV) project, Atmos. Meas. Tech., 11, 6651–6678, https://doi.org/10.5194/amt-11-6651-2018, 2018.
Bossolasco, A., Fernandez, R. P., Li, Q., Mahajan, A. S., Villamayor, J., Barrera, J. A., Heard, D. E., Cuevas, C. A., Caram, C., Szopaj, S., and Saiz-Lopez, A.: Key role of short-lived halogens on global atmospheric oxidation during historical periods, Environ. Sci.: Atmos., 5, 547, https://doi.org/10.1039/d4ea00141a, 2025.
Bozzo, A., Benedetti, A., Flemming, J., Kipling, Z., and Rémy, S.: An aerosol climatology for global models based on the tropospheric aerosol scheme in the Integrated Forecasting System of ECMWF, Geosci. Model Dev., 13, 1007–1034, https://doi.org/10.5194/gmd-13-1007-2020, 2020.
Brasseur, G. P. and Solomon, S.: Aeronomy of the Middle Atmosphere, Springer Netherlands, https://doi.org/10.1007/1-4020-3824-0, 2005.
Brune, W. H., Miller, D. O., Thames, A. B., Allen, H. M., Apel, E. C., Blake, D. R., Bui, T. P., Commane, R., Crounse, J. D., Daube, B. C., Diskin, G. S., DiGangi, J. P., Elkins, J. W., Hall, S. R., Hanisco, T. F., Hannun, R. A., Hintsa, E. J., Hornbrook, R. S., Kim, M. J., McKain, K., Moore, F. L., Neuman, J. A., Nicely, J. M., Peischl, J., Ryerson, T. B., St. Clair, J. M., Sweeney, C., Teng, A. P., Thompson, C., Ullmann, K., Veres, P. R., Wennberg, P. O., and Wolfe, G. M.: Exploring Oxidation in the Remote Free Troposphere: Insights From Atmospheric Tomography (ATom), J. Geophys. Res.-Atmos., 125, e2019JD031685, https://doi.org/10.1029/2019JD031685, 2020.
Burkholder, J. B., Sander, S. P., Abbatt, J., Barker, J. R., Cappa, C., Crounse, J. D., Dibble, T. S., Huie, R. E., Kolb, C. E., Kurylo, M. J., Orkin, V. L., Percival, C. J., Wilmouth, D. M., and Wine, P. H.: Chemical Kinetics and Photochemical Data for Use in Atmospheric Studies, Evaluation No. 19, JPL Publication 19-5, Jet Propulsion Laboratory, Pasadena, https://dataverse.jpl.nasa.gov/dataset.xhtml?persistentId=hdl:2014/49199&version=2.1 (last access: 25 September 2026), 1 May 2020.
Cantrell, C. A., Shetter, R. E., Gilpin, T. M., Calvert, J. G., Eisele, F. L., and Tanner, D. J.: Peroxy radical concentrations measured and calculated from trace gas measurements in the Mauna Loa observatory photochemistry experiment 2, J. Geophys. Res.-Atmos., 101, 14653–14664, https://doi.org/10.1029/95JD03613, 1996.
Christian, K. E., Brune, W. H., Mao, J., and Ren, X.: Global sensitivity analysis of GEOS-Chem modeled ozone and hydrogen oxides during the INTEX campaigns, Atmos. Chem. Phys., 18, 2443–2460, https://doi.org/10.5194/acp-18-2443-2018, 2018.
Chua, G., Naik, V., and Horowitz, L. W.: Exploring the drivers of tropospheric hydroxyl radical trends in the Geophysical Fluid Dynamics Laboratory AM4.1 atmospheric chemistry–climate model, Atmos. Chem. Phys., 23, 4955–4975, https://doi.org/10.5194/acp-23-4955-2023, 2023.
Chua, G., Naik, V., and Horowitz, L. W.: Role of future climate change, air pollution control and methane mitigation in driving hydroxyl radical (OH) and methane lifetime, Geophys. Res. Lett., 53, e2025GL120136, 2026.
Compernolle, S., Verhoelst, T., Pinardi, G., Granville, J., Hubert, D., Keppens, A., Niemeijer, S., Rino, B., Bais, A., Beirle, S., Boersma, F., Burrows, J. P., De Smedt, I., Eskes, H., Goutail, F., Hendrick, F., Lorente, A., Pazmino, A., Piters, A., Peters, E., Pommereau, J.-P., Remmers, J., Richter, A., van Geffen, J., Van Roozendael, M., Wagner, T., and Lambert, J.-C.: Validation of Aura-OMI QA4ECV NO2 climate data records with ground-based DOAS networks: the role of measurement and comparison uncertainties, Atmos. Chem. Phys., 20, 8017–8045, https://doi.org/10.5194/acp-20-8017-2020, 2020.
Crutzen, P. J.: The Role of NO and NO2 in the Chemistry of the Troposphere and Stratosphere, Annu. Rev. Earth Pl. Sc., 7, 443–472, 1979.
Deeter, M., Francis, G., Gille, J., Mao, D., Martínez-Alonso, S., Worden, H., Ziskin, D., Drummond, J., Commane, R., Diskin, G., and McKain, K.: The MOPITT Version 9 CO product: sampling enhancements and validation, Atmos. Meas. Tech., 15, 2325–2344, https://doi.org/10.5194/amt-15-2325-2022, 2022.
Duncan, B. N., Lamsal, L. N., Thompson, A. M., Yoshida, Y., Lu, Z. F., Streets, D. G., Hurwitz, M. M., and Pickering, K. E.: A space-based, high-resolution view of notable changes in urban NOx pollution around the world (2005–2014), J. Geophys. Res., 121, 976–996, https://doi.org/10.1002/2015jd024121, 2016.
Elshorbany, Y., Ziemke, J. R., Strode, S., Petetin, H., Miyazaki, K., De Smedt, I., Pickering, K., Seguel, R. J., Worden, H., Emmerichs, T., Taraborrelli, D., Cazorla, M., Fadnavis, S., Buchholz, R. R., Gaubert, B., Rojas, N. Y., Nogueira, T., Salameh, T., and Huang, M.: Tropospheric ozone precursors: global and regional distributions, trends, and variability, Atmos. Chem. Phys., 24, 12225–12257, https://doi.org/10.5194/acp-24-12225-2024, 2024.
Emmons, L. K., Schwantes, R. H., Orlando, J. J., Tyndall, G., Kinnison, D., Lamarque, J., Marsh, D., Mills, M. J., Tilmes, S., Bardeen, C., Buchholz, R. R., Conley, A., Gettelman, A., Garcia, R., Simpson, I., Blake, D. R., Meinardi, S., and Pétron, G.: The Chemistry Mechanism in the Community Earth System Model Version 2 (CESM2), J. Adv. Model. Earth Sy., 12, e2019MS001882, https://doi.org/10.1029/2019MS001882, 2020.
Fei, D. D., Hou, X. W., and Wei, L.: Quantitative sources of global surface ozone and spatial and temporal distribution characteristics, China Environmental Science, 41, 3004–3016, https://link.oversea.cnki.net/doi/10.19674/j.cnki.issn1000-6923.2021.0302 (last access: 25 September 2026), 2021.
Fiore, A. M., Dentener, F. J., Wild, O., Cuvelier, C., Schultz, M. G., Hess, P., Textor, C., Schulz, M., Doherty, R. M., Horowitz, L. W., MacKenzie, A., Sanderson, M. G., Shindell, D. T., Stevenson, D. S., Szopa, S., Van Dingenen, R., Zeng, G., Atherton, C., Bergmann, D., Bey, I., Carmichael, G., Collins, W. J., Duncan, B. N., Faluvegi, G., Folberth, G., Gauss, M., Gong, S., Hauglustaine, D., Holloway, T., Isaksen, I. S. A., Jacob, D. J., Jonson, J. E., Kaminski, J. W., Keating, T. J., Lupu, A., Marmer, E., Montanaro, V., Park, R. J., Pitari, G., Pringle, K. J., Pyle, J. A., Schroeder, S., Vivanco, M. G., Wind, P., Wojcik, G., Wu, S., and Zuber, A.: Multimodel estimates of intercontinental source-receptor relationships for ozone pollution, J. Geophys. Res.-Atmos., 114, D04301, https://doi.org/10.1029/2008JD010816, 2009.
Fiore, A. M., Mickley, L. J., Zhu, Q., and Baublitz, C. B.: Climate and Tropospheric Oxidizing Capacity, Annu. Rev. Earth Pl. Sc., 52, 11.1–11.29, https://doi.org/10.1146/annurev-earth-032320-090307, 2024.
Gaubert, B., Emmons, L. K., Raeder, K., Tilmes, S., Miyazaki, K., Arellano Jr., A. F., Elguindi, N., Granier, C., Tang, W., Barré, J., Worden, H. M., Buchholz, R. R., Edwards, D. P., Franke, P., Anderson, J. L., Saunois, M., Schroeder, J., Woo, J.-H., Simpson, I. J., Blake, D. R., Meinardi, S., Wennberg, P. O., Crounse, J., Teng, A., Kim, M., Dickerson, R. R., He, H., Ren, X., Pusede, S. E., and Diskin, G. S.: Correcting model biases of CO in East Asia: impact on oxidant distributions during KORUS-AQ, Atmos. Chem. Phys., 20, 14617–14647, https://doi.org/10.5194/acp-20-14617-2020, 2020.
Granier, C., Guether, A., Lamarque, J. F., Mieville, A., Muller, J. F., Olivier, J., Orlando, J., Peters, J., Petron, G., Tyndall, G., and Wallens, S.: POET, a database of surface emissions of ozone precursors, https://eccad.aeris-data.fr (last access: 19 September 2026), 2005.
Granier, C., Darras, S., Denier van der Gon, H., Doubalova, J., Elguindi, N., Galle, B., Gauss, M., Guevara, M., Jalkanen, J.-P., Kuenen, J., Liousse, C., Quack, B., Simpson, D., and Sindelarova, K.: The Copernicus Atmosphere Monitoring Service global and regional emissions (April 2019 version), Report April 2019 version, https://doi.org/10.24380/d0bn-kx16, 2019.
Griffiths, P. T., Murray, L. T., Zeng, G., Shin, Y. M., Abraham, N. L., Archibald, A. T., Deushi, M., Emmons, L. K., Galbally, I. E., Hassler, B., Horowitz, L. W., Keeble, J., Liu, J., Moeini, O., Naik, V., O'Connor, F. M., Oshima, N., Tarasick, D., Tilmes, S., Turnock, S. T., Wild, O., Young, P. J., and Zanis, P.: Tropospheric ozone in CMIP6 simulations, Atmos. Chem. Phys., 21, 4187–4218, https://doi.org/10.5194/acp-21-4187-2021, 2021.
Ha, P. T. M., Matsuda, R., Kanaya, Y., Taketani, F., and Sudo, K.: Effects of heterogeneous reactions on tropospheric chemistry: a global simulation with the chemistry–climate model CHASER V4.0, Geosci. Model Dev., 14, 3813–3841, https://doi.org/10.5194/gmd-14-3813-2021, 2021.
Heymsfield, A., Winker D., Avery, M., Vaughan, M., Diskin, G., Deng, M., Mitev, V., and Matthey R.: Relationships between Ice Water Content and Volume Extinction Coefficient from In Situ Observations for Temperatures from 0° to −86 °C: Implications for Spaceborne Lidar Retrievals, J. Appl. Meteorol. Clim., 53, 479–505, https://doi.org/10.1175/JAMC-D-13-087.1, 2014.
Holmes, C. D., Prather, M. J., Søvde, O. A., and Myhre, G.: Future methane, hydroxyl, and their uncertainties: key climate and emission parameters for future predictions, Atmos. Chem. Phys., 13, 285–302, https://doi.org/10.5194/acp-13-285-2013, 2013.
Holmes, C. D., Bertram, T. H., Confer, K. L., Graham, K. A., Ronan, A. C., Wirks, C. K., and Shah, V.: The role of clouds in the tropospheric NOx cycle: A new modelling approach for cloud chemistry and its global implications, Geophys. Res. Lett., 46, 4980–4990, https://doi.org/10.1029/2019GL081990, 2019.
Hou, X., Wild, O., Zhu, B., and Lee, J.: Future tropospheric ozone budget and distribution over east Asia under a net-zero scenario, Atmos. Chem. Phys., 23, 15395–15411, https://doi.org/10.5194/acp-23-15395-2023, 2023a.
Hou, X., Zhang, Y., Lv, X., and Lee, J.: The Impact of Meteorological Conditions and Emissions on Tropospheric Column Ozone Trends in Recent Years, Remote Sens.-Basel, 15, 5293, https://doi.org/10.3390/rs15225293, 2023b.
Hou, X.: Model outputs for “Tropospheric OH and Its Trends: New Insight into Atmospheric Processes and Implications for Methane Lifetime”, Version v1, Zenodo [data set], https://doi.org/10.5281/zenodo.19112214, 2026.
Jacob, D. J.: Heterogeneous chemistry and tropospheric ozone, Atmos. Environ., 34, 2131–2159, 2000.
Jiang, Z., Zhu, R., Miyazaki, K., McDonald, B. C., Klimont, Z., Zheng, B., Boersma, K. F., Zhang, Q., Worden, H., Worden, J. R., Henze, D. K., Jones, D. B. A., van der Gon, H. A. C. D., and Eskes, H.: Decadal variabilities in tropospheric nitrogen oxides over United States, Europe, and China, J. Geophys. Res.-Atmos., 127, e2021JD035872, https://doi.org/10.1029/2021JD035872, 2022.
Kendall, M. G.: Rank Correlation Methods, 4th edn., Charles Griffin, London, ISBN 9780852641996, 1975.
Lawrence, M. G., Jöckel, P., and von Kuhlmann, R.: What does the global mean OH concentration tell us?, Atmos. Chem. Phys., 1, 37–49, https://doi.org/10.5194/acp-1-37-2001, 2001.
Lelieveld, J., Gromov, S., Pozzer, A., and Taraborrelli, D.: Global tropospheric hydroxyl distribution, budget and reactivity, Atmos. Chem. Phys., 16, 12477–12493, https://doi.org/10.5194/acp-16-12477-2016, 2016.
Liu, J., Strode, S. A., Liang, Q., Oman, L. D., Colarco, P. R., Fleming, E. L., Manyin, M. E., Douglass, A. R., Ziemke, J. R., Lamsal, L. N., and Li, C.: Change in tropospheric ozone in the recent decades and its contribution to global total ozone, J. Geophys. Res., 127, e2022JD037170, https://doi.org/10.1029/2022JD037170, 2022.
Liu, M., Song, Y., Matsui, H., Shang, F., Kang, L., Cai, X., Zhang, H., and Zhu, T.: Enhanced atmospheric oxidation toward carbon neutrality reduces methane's climate forcing, Nat. Commun., 15, 3148, https://doi.org/10.1038/s41467-024-47436-9, 2024.
Logan, J. A., Prather, M. J., Wofsy, S. C., and McElroy, M. B.: Tropospheric chemistry: A global perspective, J. Geophys. Res., 86, 7210–7254, https://doi.org/10.1029/JC086iC08p07210, 1981.
Macintyre, H. L. and Evans, M. J.: Sensitivity of a global model to the uptake of N2O5 by tropospheric aerosol, Atmos. Chem. Phys., 10, 7409–7414, https://doi.org/10.5194/acp-10-7409-2010, 2010.
McNorton, J., Chipperfield, M. P., Gloor, M., Wilson, C., Feng, W., Hayman, G. D., Rigby, M., Krummel, P. B., O'Doherty, S., Prinn, R. G., Weiss, R. F., Young, D., Dlugokencky, E., and Montzka, S. A.: Role of OH variability in the stalling of the global atmospheric CH4 growth rate from 1999 to 2006, Atmos. Chem. Phys., 16, 7943–7956, https://doi.org/10.5194/acp-16-7943-2016, 2016.
Mann, H. B.: Nonparametric tests against trend, Econometrica, 13, 245–259, https://doi.org/10.2307/1907187, 1945.
Meinshausen, M., Vogel, E., Nauels, A., Lorbacher, K., Meinshausen, N., Etheridge, D. M., Fraser, P. J., Montzka, S. A., Rayner, P. J., Trudinger, C. M., Krummel, P. B., Beyerle, U., Canadell, J. G., Daniel, J. S., Enting, I. G., Law, R. M., Lunder, C. R., O'Doherty, S., Prinn, R. G., Reimann, S., Rubino, M., Velders, G. J. M., Vollmer, M. K., Wang, R. H. J., and Weiss, R.: Historical greenhouse gas concentrations for climate modelling (CMIP6), Geosci. Model Dev., 10, 2057–2116, https://doi.org/10.5194/gmd-10-2057-2017, 2017.
Millet, D. B., Guenther, A., Siegel, D. A., Nelson, N. B., Singh, H. B., de Gouw, J. A., Warneke, C., Williams, J., Eerdekens, G., Sinha, V., Karl, T., Flocke, F., Apel, E., Riemer, D. D., Palmer, P. I., and Barkley, M.: Global atmospheric budget of acetaldehyde: 3-D model analysis and constraints from in-situ and satellite observations, Atmos. Chem. Phys., 10, 3405–3425, https://doi.org/10.5194/acp-10-3405-2010, 2010.
Miyazaki, K., Eskes, H., Sudo, K., Boersma, K. F., Bowman, K., and Kanaya, Y.: Decadal changes in global surface NOx emissions from multi-constituent satellite data assimilation, Atmos. Chem. Phys., 17, 807–837, https://doi.org/10.5194/acp-17-807-2017, 2017.
Monks, S. A., Arnold, S. R., Hollaway, M. J., Pope, R. J., Wilson, C., Feng, W., Emmerson, K. M., Kerridge, B. J., Latter, B. L., Miles, G. M., Siddans, R., and Chipperfield, M. P.: The TOMCAT global chemical transport model v1.6: description of chemical mechanism and model evaluation, Geosci. Model Dev., 10, 3025–3057, https://doi.org/10.5194/gmd-10-3025-2017, 2017.
Montzka, S. A., Krol, M., Dlugokencky, E., Hall, B., Jöckel, P., and Lelieveld, J.: Small interannual variability of global atmospheric hydroxyl, Science, 331, 67–69, https://doi.org/10.1126/science.1197640, 2011.
Naik, V., Voulgarakis, A., Fiore, A. M., Horowitz, L. W., Lamarque, J.-F., Lin, M., Prather, M. J., Young, P. J., Bergmann, D., Cameron-Smith, P. J., Cionni, I., Collins, W. J., Dalsøren, S. B., Doherty, R., Eyring, V., Faluvegi, G., Folberth, G. A., Josse, B., Lee, Y. H., MacKenzie, I. A., Nagashima, T., van Noije, T. P. C., Plummer, D. A., Righi, M., Rumbold, S. T., Skeie, R., Shindell, D. T., Stevenson, D. S., Strode, S., Sudo, K., Szopa, S., and Zeng, G.: Preindustrial to present-day changes in tropospheric hydroxyl radical and methane lifetime from the Atmospheric Chemistry and Climate Model Intercomparison Project (ACCMIP), Atmos. Chem. Phys., 13, 5277–5298, https://doi.org/10.5194/acp-13-5277-2013, 2013.
Naus, S., Montzka, S. A., Pandey, S., Basu, S., Dlugokencky, E. J., and Krol, M.: Constraints and biases in a tropospheric two-box model of OH, Atmos. Chem. Phys., 19, 407–424, https://doi.org/10.5194/acp-19-407-2019, 2019.
Newsome, B. and Evans, M.: Impact of uncertainties in inorganic chemical rate constants on tropospheric composition and ozone radiative forcing, Atmos. Chem. Phys., 17, 14333–14352, https://doi.org/10.5194/acp-17-14333-2017, 2017.
Nicely, J. M., Salawitch, R. J., Canty, T., Anderson, D. C., Arnold, S. R., Chipperfield, M. P., Emmons, L. K., Flemming, J., Huijnen, V., Kinnison, D. E., Lamarque, J.-F., Mao, J., Monks, S. A., Steenrod, S. D., Tilmes, S., and Turquety, S.: Quantifying the causes of differences in tropospheric OH within global models, J. Geophys. Res.-Atmos., 122, 1983–2007, https://doi.org/10.1002/2016JD026239, 2017.
Nicely, J. M., Duncan, B. N., Hanisco, T. F., Wolfe, G. M., Salawitch, R. J., Deushi, M., Haslerud, A. S., Jöckel, P., Josse, B., Kinnison, D. E., Klekociuk, A., Manyin, M. E., Marécal, V., Morgenstern, O., Murray, L. T., Myhre, G., Oman, L. D., Pitari, G., Pozzer, A., Quaglia, I., Revell, L. E., Rozanov, E., Stenke, A., Stone, K., Strahan, S., Tilmes, S., Tost, H., Westervelt, D. M., and Zeng, G.: A machine learning examination of hydroxyl radical differences among model simulations for CCMI-1, Atmos. Chem. Phys., 20, 1341–1361, https://doi.org/10.5194/acp-20-1341-2020, 2020.
Patra, P. K., Krol, M. C., Montzka, S. A., Arnold, T., Atlas, E. L., Lintner, B. R., Stephens, B. B., Xiang, B., Elkins, J. W., Fraser, P. J., Ghosh, A., Hintsa, E. J., Hurst, D. F., Ishijima, K., Krummel, P. B., Miller, B. R., Miyazaki, K., Moore, F. L., Mühle, J., O'Doherty, S., Prinn, R. G., Steele, L. P., Takigawa, M., Wang, H. J., Weiss, R. F., Wofsy, S. C., and Young, D.: Observational evidence for interhemispheric hydroxyl-radical parity, Nature, 513, 219–223, https://doi.org/10.1038/nature13721, 2014.
Patra, P. K., Krol, M. C., Prinn, R. G., Takigawa, M., Mühle, J., Montzka, S. A., Lal, S., Yamashita, Y., Naus, S., Chandra, N., Weiss, R. F., Krummel, P. B., Fraser, P. J., O'Doherty, S., and Elkins, J. W.: Methyl Chloroform Continues to Constrain the Hydroxyl (OH) Variability in the Troposphere, J. Geophys. Res.-Atmos., 126, e2020JD033862, https://doi.org/10.1029/2020JD033862, 2021.
Phillips, D. P., Hopkins, F. E., Bell, T. G., Liss, P. S., Nightingale, P. D., Reeves, C. E., Wohl, C., and Yang, M.: Air–sea exchange of acetone, acetaldehyde, DMS and isoprene at a UK coastal site, Atmos. Chem. Phys., 21, 10111–10132, https://doi.org/10.5194/acp-21-10111-2021, 2021.
Pickering, K. E., Wang, Y., Tao, W.-K., Price, C., and Müller, J.-F.: Vertical distributions of lightning NOx for use in regional and global chemical transport models, J. Geophys. Res., 103, 31203–31216, https://doi.org/10.1029/98JD02651, 1998.
Pimlott, M. A., Pope, R. J., Kerridge, B. J., Latter, B. G., Knappett, D. S., Heard, D. E., Ventress, L. J., Siddans, R., Feng, W., and Chipperfield, M. P.: Investigating the global OH radical distribution using steady-state approximations and satellite data, Atmos. Chem. Phys., 22, 10467–10488, https://doi.org/10.5194/acp-22-10467-2022, 2022.
Prather, M. J. and Zhu, L.: Resetting tropospheric OH and CH4 lifetime with ultraviolet H2O absorption, Science, 385, 201–204, https://doi.org/10.1126/science.adn0415, 2024.
Prather, M. J., Holmes, C. D., and Hsu, J.: Reactive greenhouse gas scenarios: Systematic exploration of uncertainties and the role of atmospheric chemistry, Geophys. Res. Lett., 39, L09803, https://doi.org/10.1029/2012GL051440, 2012.
Prinn, R. G., Weiss, R. F., Fraser, P. J., Simmonds, P. G., Cunnold, D. M., Alyea, F. N., O'Doherty, S., Salameh, P., Miller, B. R., Huang, J., Wang, R. H. J., Hartley, D. E., Harth, C., Steele, L. P., Sturrock, G., Midgley, P. M., and McCulloch, A.: A history of chemically and radiatively important gases in air deduced from ALE/GAGE/AGAGE, J. Geophys. Res., 105, 17751–17792, https://doi.org/10.1029/2000JD900141, 2000.
Prinn, R. G., Huang, J., Weiss, R. F., Cunnold, D. M., Fraser, P. J., Simmonds, P. G., McCulloch, A., Harth, C., Reimann, S., Salameh, P., O'Doherty, S., Wang, R. H. J., Porter, L. W., Miller, B. R., and Krummel, P. B.: Evidence for variability of atmospheric hydroxyl radicals over the past quarter century, Geophys. Res. Lett., 07809, https://doi.org/10.1029/2004GL022228, 2005.
Read, K. A., Carpenter, L. J., Arnold, S. R., Beale, R., Nightingale, P. D., Hopkins, J. R., Lewis, A. C., Lee, J. D., Mendes, L., and Pickering, S. J.: Multiannual observations of acetone, methanol, and acetaldehyde in remote Tropical Atlantic air: Implications for atmospheric OVOC budgets and oxidative capacity, Environ. Sci. Technol., 46, 11028–11039, https://doi.org/10.1021/es302082p, 2012.
Richter, A., Eyring, V., Burrows, J. P., Bovensmann, H., Lauer, A., Sierk, B., and Crutzen, P. J.: Satellite measurements of NO2 from international shipping emissions, Geophys. Res. Lett., 31, L23110, https://doi.org/10.1029/2004gl020822, 2004.
Rigby, M., Montzka, S. A., Prinn, R. G., White, J. W. C., Young, D., O'Doherty, S., Lunt, M. F., Ganesan, A. L., Manning, A. J., Simmonds, P. G., Salameh, P. K., Harth, C. M., Mühle, J., Weiss, R. F., Fraser, P. J., Steele, L. P., Krummel, P. B., McCulloch, A., and Park, S.: Role of atmospheric oxidation in recent methane growth, Proc. Natl. Acad. Sci. USA, 114, 5373–5377, https://doi.org/10.1073/pnas.1616426114, 2017.
Rolletter, M., Hofzumahaus, A., Novelli, A., Wahner, A., and Fuchs, H.: Kinetics of the reactions of OH with CO, NO, and NO2 and of HO2 with NO2 in air at 1 atm pressure, room temperature, and tropospheric water vapour concentrations, Atmos. Chem. Phys., 25, 3481–3502, https://doi.org/10.5194/acp-25-3481-2025, 2025.
Schultz, M. G., Schröder, S., Lyapina, O., and Cooper, O. R.: Pre-compiled metrics data sets, links to gridded files in NetCDF format, PANGAEA [data set], https://doi.org/10.1594/PANGAEA.880506, 2017a.
Schultz, M. G., Schröder, S., Lyapina, O., Cooper, O. R., Galbally, I., Petropavlovskikh, I., von Schneidemesser, E., Tanimoto, H., Elshorbany, Y., Naja, M., Seguel, R. J., Dauert, U., Eckhardt, P., Feigenspahn, S., Fiebig, M., Hjellbrekke, A.-G., Hong, Y.-D., Kjeld, P. C., Koide, H., Lear, G., Tarasick, D., Ueno, M., Wallasch, M., Baumgardner, D., Chuang, M.-T., Gillett, R., Lee, M., Molloy, S., Moolla, R., Wang, T., Sharps, K., Adame, J. A., Ancellet, G., Apadula, F., Artaxo, P., Barlasina, M. E., Bogucka, M., Bonasoni, P., Chang, L., Colomb, A., Cuevas-Agulló, E., Cupeiro, M., Degórska, A., Ding, A., Fröhlich, M., Frolova, M., Gadhavi, H., Gheusi, F., Gilge, S., Gonzalez, M. Y., Gros, V., Hamad, S. H., Helmig, D., Henriques, D., Hermansen, O., Holla, R., Huber, J., Im, U., Jaffe, D. A., Komala, N., Kubistin, D., Lam, K.-S., Laurila, T., Lee, H., Levy, I., Mazzoleni, C., Mazzoleni, L. R., McClure-Begley, A., Mohamad, M., Murovec, M., Navarro-Comas, M., Nicodim, F., Parrish, D., Read, K. A., Reid, N., Ries, L., Saxena, P., Schwab, J. J., Scorgie, Y., Senik, I., Simmonds, P., Sinha, V., Skorokhod, A. I., Spain, G., Spangl, W., Spoor, R., Springston, S. R., Steer, K., Steinbacher, M., Suharguniyawan, E., Torre, P., Trickl, T., Weili, L., Weller, R., Xu, X., Xue, L., and Ma, Z.: The Tropospheric Ozone Assessment Report: database and metrics data of global surface ozone observations, Elem. Sci. Anthr., 5, 58, https://doi.org/10.1525/elementa.244, 2017b.
Sen, P. K.: Estimates of the regression coefficient based on Kendall's tau, J. Am. Stat. Assoc., 63, 1379–1389, https://doi.org/10.1080/01621459.1968.10480934, 1968.
Shindell, D. T., Faluvegi, G., Stevenson, D. S., Krol, M. C., Emmons, L. K., Lamarque, J.-F., Pétron, G., Dentener, F. J., Ellingsen, K., Schultz, M. G., Wild, O., Amann, M., Atherton, C. S., Bergmann, D. J., Bey, I., Butler, T., Cofala, J., Collins, W. J., Derwent, R. G., Doherty, R. M., Drevet, J., Eskes, H. J., Fiore, A. M., Gauss, M., Hauglustaine, D. A., Horowitz, L. W., Isaksen, I. S. A., Lawrence, M. G., Montanaro, V., Müller, J.-F., Pitari, G., Prather, M. J., Pyle, J. A., Rast, S., Rodriguez, J. M., Sanderson, M. G., Savage, N. H., Strahan, S. E., Sudo, K., Szopa, S., Unger, N., van Noije, T. P. C., and Zeng, G.: Multimodel simulations of carbon monoxide: Comparison with observations and projected near-future changes, J. Geophys. Res., 111, D19306, https://doi.org/10.1029/2006JD007100, 2006.
Simpson, D. and Darras, S.: Global soil NO emissions for Atmospheric Chemical Transport Modelling: CAMS-GLOB-SOIL v2.2, Earth Syst. Sci. Data Discuss. [preprint], https://doi.org/10.5194/essd-2021-221, 2021.
Sindelarova, K., Markova, J., Simpson, D., Huszar, P., Karlicky, J., Darras, S., and Granier, C.: High-resolution biogenic global emission inventory for the time period 2000–2019 for air quality modelling, Earth Syst. Sci. Data, 14, 251–270, https://doi.org/10.5194/essd-14-251-2022, 2022.
Soulie, A., Granier, C., Darras, S., Zilbermann, N., Doumbia, T., Guevara, M., Jalkanen, J.-P., Keita, S., Liousse, C., Crippa, M., Guizzardi, D., Hoesly, R., and Smith, S. J.: Global anthropogenic emissions (CAMS-GLOB-ANT) for the Copernicus Atmosphere Monitoring Service simulations of air quality forecasts and reanalyses, Earth Syst. Sci. Data, 16, 2261–2279, https://doi.org/10.5194/essd-16-2261-2024, 2024.
Souri, A. H., Duncan, B. N., Strode, S. A., Anderson, D. C., Manyin, M. E., Liu, J., Oman, L. D., Zhang, Z., and Weir, B.: Enhancing long-term trend simulation of the global tropospheric hydroxyl (TOH) and its drivers from 2005 to 2019: a synergistic integration of model simulations and satellite observations, Atmos. Chem. Phys., 24, 8677–8701, https://doi.org/10.5194/acp-24-8677-2024, 2024.
Spivakovsky, C. M., Logan, J. A., Montzka, S. A., Balkanski, Y., Foreman-Fowler, M. S., Jones, D. B., Horowitz, L. W., Fusco, A. C., Brenninkmeijer, C. A., Prather, M. J., Wofsy, S. C., and McElroy, M. B.: Three-dimensional climatological distribution of tropospheric OH: Update and evaluation, J. Geophys. Res., 105, 8931–8980, 2000.
Stevenson, D. S., Zhao, A., Naik, V., O'Connor, F. M., Tilmes, S., Zeng, G., Murray, L. T., Collins, W. J., Griffiths, P. T., Shim, S., Horowitz, L. W., Sentman, L. T., and Emmons, L.: Trends in global tropospheric hydroxyl radical and methane lifetime since 1850 from AerChemMIP, Atmos. Chem. Phys., 20, 12905–12920, https://doi.org/10.5194/acp-20-12905-2020, 2020.
Stewart, D. J., Griffiths, P. T., and Cox, R. A.: Reactive uptake coefficients for heterogeneous reaction of N2O5 with submicron aerosols of NaCl and natural sea salt, Atmos. Chem. Phys., 4, 1381–1388, https://doi.org/10.5194/acp-4-1381-2004, 2004.
Strode, S. A., Liu, J., Lait, L., Commane, R., Daube, B., Wofsy, S., Conaty, A., Newman, P., and Prather, M.: Forecasting carbon monoxide on a global scale for the ATom-1 aircraft mission: insights from airborne and satellite observations and modeling, Atmos. Chem. Phys., 18, 10955–10971, https://doi.org/10.5194/acp-18-10955-2018, 2018.
Tabazadeh, A., Yokelson, R. J., Singh, H. B., Hobbs, P. V., Crawford, J. H., and Iraci, L. T.: Heterogeneous chemistry involving methanol in tropospheric clouds, Geophys. Res. Lett., 31, L06114, https://doi.org/10.1029/2003GL018775, 2004.
Talukdar, R. K., Longfellow, C. A., Gilles, M. K., and Ravishankara, A. R.: Quantum yields of O(1D) in the photolysis of ozone between 289 and 329 nm as a function of temperature, Geophys. Res. Lett., 25, 143–146, https://doi.org/10.1029/97GL03354, 1998.
Tan, D., Faloona, I., Simpas, J. B., Brune, W., Olson, J., Crawford, J., Avery, M., Sachse, G., Vay, S., Sandholm, S., Guan, H.-W., Vaughn, T., Mastromarino, J., Heikes, B., Snow, J., Podolske, J., and Singh, H.: OH and HO2 in the tropical Pacific: Results from PEM-Tropics B, J. Geophys. Res.-Atmos., 106, 32667–32681, https://doi.org/10.1029/2001JD900002, 2001.
Theil, H.: A rank-invariant method of linear and polynomial regression analysis, P. K. Ned. Akad. Wetensc., 53, 386–392, https://doi.org/10.1007/978-94-011-2546-8_20, 1950.
Thompson, C. R., Wofsy, S. C., Prather, M. J., Newman, P. A., Hanisco, T. F., Ryerson, T. B., Fahey, D. W., Apel, E. C., Brock, C. A., Brune, W. H., Froyd, K., Katich, J. M., Nicely, J. M., Peischl, J., Ray, E., Veres, P. R., Wang, S., Allen, H. M., Asher, E., Bian, H., Blake, D., Bourgeois, I., Budney, J., Bui, T. P., Butler, A., Campuzano-Jost, P., Chang, C., Chin, M., Commane, R., Correa, G., Crounse, J. D., Daube, B., Dibb, J. E., DiGangi, J. P., Diskin, G. S., Döllner, M., Elkins, J. W., Fiore, A. M., Flynn, C. M., Guo, H., Hall, S. R., Hannun, R. A., Hills, A., Hintsa, E. J., Hodzic, A., Hornbrook, R. S., Huey, L. G., Jiménez-Palacios, J. L., Keeling, R. F., Kim, M. J., Kupc, A., Lacey, F., Lait, L. R., Lamarque, J.-F., Liu, J., McKain, K., Meinardi, S., Miller, D. O., Montzka, S. A., Moore, F. L., Morgan, E. J., Murphy, D. M., Murray, L. T., Nault, B. A., Neuman, J. A., Nguyen, L., Gonzalez, Y., Rollins, A., Rosenlof, K., Sargent, M., Schill, G., Schwarz, J. P., St. Clair, J. M., Steenrod, S. D., Stephens, B. B., Strahan, S. E., Strode, S. A., Sweeney, C., Thames, A. B., Ullmann, K., Wagner, N., Weber, R., Weinzierl, B., Wennberg, P. O., Williamson, C. J., Wolfe, G. M., and Zeng, L.: The NASA Atmospheric Tomography (ATom) Mission: Imaging the Chemistry of the Global Atmosphere, B. Am. Meteorol. Soc., 103, E761–E790, https://doi.org/10.1175/BAMS-D-20-0315.1, 2022.
Thompson, R. L., Montzka, S. A., Vollmer, M. K., Arduini, J., Crotwell, M., Krummel, P. B., Lunder, C., Mühle, J., O'Doherty, S., Prinn, R. G., Reimann, S., Vimont, I., Wang, H., Weiss, R. F., and Young, D.: Estimation of the atmospheric hydroxyl radical oxidative capacity using multiple hydrofluorocarbons (HFCs), Atmos. Chem. Phys., 24, 1415–1427, https://doi.org/10.5194/acp-24-1415-2024, 2024.
Thornton, J. A., Braban, C. F., and Abbatt, J. P. D.: N2O5 hydrolysis on sub-micron organic aerosols: The effect of relative humidity, particle phase, and particle size, Phys. Chem. Chem. Phys., 5, 4593–4603, https://doi.org/10.1039/B307498F, 2003.
Tie, X., Emmons, L., Horowitz, L., Brasseur, G., Ridley, B., Atlas, E., Hess, P., Klonecki, A., Madronich, S., Talbot, R., Dibb, J., Marbouty, D., and Hennessy, J.: Effect of sulfate aerosol on tropospheric NOx and ozone budgets model simulations and TOPSE evidence, J. Geophys. Res., 108, 8364, https://doi.org/10.1029/2001JD001508, 2003.
Travis, K. R., Heald, C. L., Allen, H. M., Apel, E. C., Arnold, S. R., Blake, D. R., Brune, W. H., Chen, X., Commane, R., Crounse, J. D., Daube, B. C., Diskin, G. S., Elkins, J. W., Evans, M. J., Hall, S. R., Hintsa, E. J., Hornbrook, R. S., Kasibhatla, P. S., Kim, M. J., Luo, G., McKain, K., Millet, D. B., Moore, F. L., Peischl, J., Ryerson, T. B., Sherwen, T., Thames, A. B., Ullmann, K., Wang, X., Wennberg, P. O., Wolfe, G. M., and Yu, F.: Constraining remote oxidation capacity with ATom observations, Atmos. Chem. Phys., 20, 7753–7781, https://doi.org/10.5194/acp-20-7753-2020, 2020.
Turner, A. J., Frankenberg, C., Wennberg, P. O., and Jacob, D. J.: Ambiguity in the causes for decadal trends in atmospheric methane and hydroxyl, P. Natl. Acad. Sci. USA, 114, 5367–5372, https://doi.org/10.1073/pnas.1616020114, 2017.
Turner, A. J., Frankenberg, C., and Kort, E. A.: Interpreting contemporary trends in atmospheric methane, P. Natl. Acad. Sci. USA, 116, 2805–2813, https://doi.org/10.1073/pnas.1814297116, 2019.
van der Werf, G. R., Randerson, J. T., Giglio, L., van Leeuwen, T. T., Chen, Y., Rogers, B. M., Mu, M., van Marle, M. J. E., Morton, D. C., Collatz, G. J., Yokelson, R. J., and Kasibhatla, P. S.: Global fire emissions estimates during 1997–2016, Earth Syst. Sci. Data, 9, 697–720, https://doi.org/10.5194/essd-9-697-2017, 2017.
Voulgarakis, A., Naik, V., Lamarque, J.-F., Shindell, D. T., Young, P. J., Prather, M. J., Wild, O., Field, R. D., Bergmann, D., Cameron-Smith, P., Cionni, I., Collins, W. J., Dalsøren, S. B., Doherty, R. M., Eyring, V., Faluvegi, G., Folberth, G. A., Horowitz, L. W., Josse, B., MacKenzie, I. A., Nagashima, T., Plummer, D. A., Righi, M., Rumbold, S. T., Stevenson, D. S., Strode, S. A., Sudo, K., Szopa, S., and Zeng, G.: Analysis of present day and future OH and methane lifetime in the ACCMIP simulations, Atmos. Chem. Phys., 13, 2563–2587, https://doi.org/10.5194/acp-13-2563-2013, 2013.
Wang, H., Lu, X., Jacob, D. J., Cooper, O. R., Chang, K.-L., Li, K., Gao, M., Liu, Y., Sheng, B., Wu, K., Wu, T., Zhang, J., Sauvage, B., Nédélec, P., Blot, R., and Fan, S.: Global tropospheric ozone trends, attributions, and radiative impacts in 1995–2017: an integrated analysis using aircraft (IAGOS) observations, ozonesonde, and multi-decadal chemical model simulations, Atmos. Chem. Phys., 22, 13753–13782, https://doi.org/10.5194/acp-22-13753-2022, 2022.
Wang, S., Hornbrook, R. S., Hills, A., Emmons, L. K., Tilmes, S., Lamarque, J.-F., Jimenez, J. L., Campuzano-Jost, P., Nault, B. A., Crounse, J. D., Wennberg, P. O., Kim, M., Allen, H., Ryerson, T. B., Thompson, C. R., Peischl, J., Moore, F., Nance, D., Hall, B., Elkins, J., Tanner, D., Huey, L. G., Hall, S. R., Ullmann, K., Orlando, J. J., Tyndall, G. S., Flocke, F. M., Ray, E., Hanisco, T. F., Wolfe, G. M., St. Clair, J., Commane, R., Daube, B., Barletta, B., Blake, D. R., Weinzierl, B., Dollner, M., Conley, A., Vitt, F., Wofsy, S. C., Riemer, D. D., and Apel, E. C.: Atmospheric acetaldehyde: Importance of air-sea exchange and a missing source in the remote troposphere, Geophys. Res. Lett., 46, 5601–5613, https://doi.org/10.1029/2019GL082034, 2019.
Wild, O.: Modelling the global tropospheric ozone budget: exploring the variability in current models, Atmos. Chem. Phys., 7, 2643–2660, https://doi.org/10.5194/acp-7-2643-2007, 2007.
Wild, O. and Prather, M. J.: Excitation of the primary tropospheric chemical mode in a global 3-D model, J. Geophys. Res., 105, 24647–24660, 2000.
Wild, O., Voulgarakis, A., O'Connor, F., Lamarque, J.-F., Ryan, E. M., and Lee, L.: Global sensitivity analysis of chemistry–climate model budgets of tropospheric ozone and OH: exploring model diversity, Atmos. Chem. Phys., 20, 4047–4058, https://doi.org/10.5194/acp-20-4047-2020, 2020.
Wofsy, S., Afshar, S., Allen, H., Apel, E., Asher, E., Barletta, B., Bent, J., Bian, H., Biggs, B., Blake, D., Blake, N., Bourgeois, I., Brock, C., Brune, W., Budney, J., Bui, T., Butler, A., Campuzano-Jost, P., Chang, C., Chin, M., Commane, R., Correa, G., Crounse, J., Cullis, P., Daube, B., Day, D., Dean-Day, J., Dibb, J., DiGangi, J., Diskin, G., Dollner, M., Elkins, J., Erdesz, F., Fiore, A., Flynn, C., Froyd, K., Gesler, D., Hall, S., Hanisco, T., Hannun, R., Hills, A., Hintsa, E., Hoffman, A., Hornbrook, R., Huey, L., Hughes, S., Jimenez, J., Johnson, B., Katich, J., Keeling, R., Kim, M., Kupc, A., Lait, L., McKain, K., Mclaughlin, R., Meinardi, S., Miller, D., Montzka, S., Moore, F., Morgan, E., Murphy, D., Murray, L., Nault, B., Neuman, J., Newman, P., Nicely, J., Pan, X., Paplawsky, W., Peischl, J., Prather, M., Price, D., Ray, E., Reeves, J., Richardson, M., Rollins, A., Rosenlof, K., Ryerson, T., Scheuer, E., Schill, G., Schroder, J., Schwarz, J., St.Clair, J., Steenrod, S., Stephens, B., Strode, S., Sweeney, C., Tanner, D., Teng, A., Thames, A., Thompson, C., Ullmann, K., Veres, P., Wagner, N., Watt, A., Weber, R., Weinzierl, B., Wennberg, P., Williamson, C., Wilson, J., Wolfe, G., Woods, C., Zeng, L., and Vieznor, N.: ATom: Merged Atmospheric Chemistry, Trace Gases, and Aerosols, Version 2 (Version 2.0), ORNL Distributed Active Archive Center [data set], https://doi.org/10.3334/ORNLDAAC/1925, 2021.
Yang, M., Beale, R., Liss, P., Johnson, M., Blomquist, B., and Nightingale, P.: Air–sea fluxes of oxygenated volatile organic compounds across the Atlantic Ocean, Atmos. Chem. Phys., 14, 7499–7517, https://doi.org/10.5194/acp-14-7499-2014, 2014.
Yin, Y., Chevallier, F., Ciais, P., Broquet, G., Fortems-Cheiney, A., Pison, I., and Saunois, M.: Decadal trends in global CO emissions as seen by MOPITT, Atmos. Chem. Phys., 15, 13433–13451, https://doi.org/10.5194/acp-15-13433-2015, 2015.
Young, P. J., Naik, V., Fiore, A. M., Gaudel, A., Guo, J., Lin, M. Y., Neu, J. L., Parrish, D. D., Rieder, H. E., Schnell, J. L., Tilmes, S., Wild, O., Zhang, L., Ziemke, J., Brandt, J., Delcloo, A., Doherty, R. M., Geels, C., Hegglin, M. I., Hu, L., Im, U., Kumar, R., Luhar, A., Murray, L., Plummer, D., Rodriguez, J., Saiz-Lopez, A., Schultz, M. G., Woodhouse, M. T., and Zeng, G.: Tropospheric Ozone Assessment Report: Assessment of global-scale model performance for global and regional ozone distributions, variability, and trends, Elem. Sci. Anthr., 6, 10, https://doi.org/10.1525/elementa.265, 2018.
Zara, M., Boersma, K. F., De Smedt, I., Richter, A., Peters, E., van Geffen, J. H. G. M., Beirle, S., Wagner, T., Van Roozendael, M., Marchenko, S., Lamsal, L. N., and Eskes, H. J.: Improved slant column density retrieval of nitrogen dioxide and formaldehyde for OMI and GOME-2A from QA4ECV: intercomparison, uncertainty characterisation, and trends, Atmos. Meas. Tech., 11, 4033–4058, https://doi.org/10.5194/amt-11-4033-2018, 2018.
Zhao, Y., Saunois, M., Bousquet, P., Lin, X., Berchet, A., Hegglin, M. I., Canadell, J. G., Jackson, R. B., Hauglustaine, D. A., Szopa, S., Stavert, A. R., Abraham, N. L., Archibald, A. T., Bekki, S., Deushi, M., Jöckel, P., Josse, B., Kinnison, D., Kirner, O., Marécal, V., O'Connor, F. M., Plummer, D. A., Revell, L. E., Rozanov, E., Stenke, A., Strode, S., Tilmes, S., Dlugokencky, E. J., and Zheng, B.: Inter-model comparison of global hydroxyl radical (OH) distributions and their impact on atmospheric methane over the 2000–2016 period, Atmos. Chem. Phys., 19, 13701–13723, https://doi.org/10.5194/acp-19-13701-2019, 2019.
Zhao, Y., Saunois, M., Bousquet, P., Lin, X., Berchet, A., Hegglin, M. I., Canadell, J. G., Jackson, R. B., Deushi, M., Jöckel, P., Kinnison, D., Kirner, O., Strode, S., Tilmes, S., Dlugokencky, E. J., and Zheng, B.: On the role of trend and variability in the hydroxyl radical (OH) in the global methane budget, Atmos. Chem. Phys., 20, 13011–13022, https://doi.org/10.5194/acp-20-13011-2020, 2020.
Zhao, Y. H., Zheng, B., Saunois, M., Ciais, P., Michaela I. Hegglin, M. I., Lu, S. M., Li, Y. F., and Bousquet, P.: Air pollution modulates trends and variability of the global methane budget, Nature, 642, 369–375, https://doi.org/10.1038/s41586-025-09004-z, 2025.
Zheng, B., Chevallier, F., Ciais, P., Yin, Y., Deeter, M. N., Worden, H. M., Wang, Y., Zhang, Q., and He, K.: Rapid decline in carbon monoxide emissions and export from East Asia between years 2005 and 2016, Environ. Res. Lett., 13, 044007, https://doi.org/10.1088/1748-9326/aab2b3, 2018.
Ziemke, J. R., Chandra, S., Duncan, B. N., Froidevaux, L., Bhartia, P. K., Levelt, P. F., and Waters, J. W.: Tropospheric ozone determined from Aura OMI and MLS: Evaluation of measurements and comparison with the Global Modeling Initiative's Chemical Transport Model, J. Geophys. Res., 111, D19303, https://doi.org/10.1029/2006JD007089, 2006.
Ziemke, J. R., Oman, L. D., Strode, S. A., Douglass, A. R., Olsen, M. A., McPeters, R. D., Bhartia, P. K., Froidevaux, L., Labow, G. J., Witte, J. C., Thompson, A. M., Haffner, D. P., Kramarova, N. A., Frith, S. M., Huang, L.-K., Jaross, G. R., Seftor, C. J., Deland, M. T., and Taylor, S. L.: Trends in global tropospheric ozone inferred from a composite record of TOMS/OMI/MLS/OMPS satellite measurements and the MERRA-2 GMI simulation, Atmos. Chem. Phys., 19, 3257–3269, https://doi.org/10.5194/acp-19-3257-2019, 2019.