
the Creative Commons Attribution 4.0 License.
the Creative Commons Attribution 4.0 License.
 | 24 Aug 2026
Importance of hydrated aerosol particles for aerosol–fog relationships in the Italian Po Valley
Almuth Neuberger
Rahul Ranjan
Hao Ding
Fredrik Mattsson
Lea Haberstock
Darrel Baumgardner
Stefano Decesari
Annica M. L. Ekman
Dagen D. Hughes
Claudia Mohr
Marco Paglione
Ilona Riipinen
Matteo Rinaldi
Air pollution and fog are closely connected, influencing both visibility and human health. As relative humidity rises, aerosol particles absorb water and grow hygroscopically, potentially activating into fog droplets when supersaturation is reached. Distinguishing between hydrated (non-activated) aerosols and activated particles is critical, as their differing thermodynamic states influence fog chemistry and dissipation. This study quantifies the impact of hydrated aerosol particles on fog microphysical properties and visibility in the Po Valley, one of Europe’s most polluted regions. We analyzed detailed aerosol–fog observations from the FAIRARI 2021/2022 campaign at San Pietro Capofiume, Italy, using κ–Köhler theory and the Large Eddy Simulation (LES) model MIMICA. The median hygroscopicity parameter (κ) of fog residuals (0.45) exceeded that of interstitial particles (0.40) and out-of-fog aerosols (0.34), reflecting enhanced inorganic content in fog droplets. Hygroscopic growth calculations show that hydrated particles can reach several micrometers in diameter, significantly influencing inferred fog microphysical properties. Excluding hydrated aerosols led to an 81 % increase in effective diameter (from 11.6 to 21.0 µm) and an 87 % decrease in cloud droplet number concentration (from 97.4 to 12.4 cm−3). Hydrated particles contributed, on average, 21 % to liquid water content and accounted for 36 % of sub-kilometer visibility events without droplet activation. LES results emphasize that fog prediction depends strongly on the largest dry aerosol particles. Our findings demonstrate the need to distinguish between hydrated and activated particles when interpreting fog observations and modeling fog development in polluted environments.
- Article
(4889 KB) - Full-text XML
-
Supplement
(6644 KB) - BibTeX
- EndNote


Fog plays an important role in the Earth system. It influences the surface radiation budget (causing daytime cooling and nighttime warming; see Oliphant et al., 2021 and references therein), modulates soil moisture (Baguskas et al., 2016), and serves as an important source of water for ecosystems (Hamilton and Seely, 1976; Seely and Hamilton, 1976; Mitchell et al., 2020). In addition, fog can pose risks to transportation (Leigh et al., 1998; Pagowski et al., 2004) and human health (Balmes et al., 1989; Decesari et al., 2017; Patel and Rastogi, 2018). Fog formation is controlled by a combination of meteorological conditions and aerosol characteristics (Gultepe et al., 2007; Lakra and Avishek, 2022). The meteorological factors include atmospheric and surface cooling rates, available water vapor, and wind speed, while the aerosol properties include particle number concentration, size, and chemical composition. Even though many field studies have been conducted during the last years aiming to better understand the processes involved in fog development and its life cycle (e.g., Haeffelin et al., 2010; Gultepe et al., 2014; Liu et al., 2017; Price et al., 2018; Fernando et al., 2021; Ghude et al., 2023), fog forecasting is still challenging (Boutle et al., 2022).
Fog formation is a complex process typically triggered by nocturnal radiative cooling of the surface, leading to an increase in relative humidity that allows aerosol particles to grow hygroscopically, thereby enhancing light scattering and reducing visibility (Kasten, 1969). As relative humidity continues to rise and the air becomes supersaturated with respect to water, a fraction of these aerosol particles activates into fog (or cloud) droplets, which then grow through condensation until limited by the available water vapor. Particles that have acted as seeds for fog (or cloud) droplets are called activated particles. The remaining particles persist as hydrated but non-activated aerosols (Pinnick et al., 1978; Hudson, 1980; Gerber, 1981), which are termed interstitial particles. This activation process and the relative distribution of particles between activated and hydrated particles can be described by Köhler theory (Köhler, 1936), which relates particle size and chemical composition to the critical supersaturation required for activation. Larger or more hygroscopic particles require lower supersaturations to activate into droplets. Therefore, beyond reducing visibility through light scattering, the physicochemical properties of aerosol particles also influence their ability to activate into fog droplets. Moreover, the aerosol number concentration impacts the supersaturation that can be reached (Mazoyer et al., 2019) as well as the droplet number concentration and size: for a constant liquid water content (LWC), more aerosol particles are expected to lead to more but smaller droplets, thus decreasing visibility compared with fewer and larger droplets (Twomey, 1974). Higher aerosol number concentrations have further been shown to prolong the fog duration (e.g., Stolaki et al., 2015; Maalick et al., 2016; Yan et al., 2020, 2021). Unlike clouds that form in turbulent conditions with high supersaturation, radiative fogs develop in calm and stable air through radiative cooling, where supersaturation remains very low. Thus, only a small subset of aerosol particles activates into fog droplets (e.g. Hudson, 1980), while the remaining hydrated particles stay in equilibrium with the surrounding relative humidity (RH). Determining the ambient water vapor supersaturation experimentally remains a challenge (Shen et al., 2018). Nevertheless, considering the concurrent but independent changes in air pollution levels and air temperature, it is important to improve our understanding of aerosol–fog interactions to understand the drivers of the long-term trends of fog properties and occurrence.
Generally, fog occurrence should be defined based on the purpose of the study (Spänkuch et al., 2022). It is typically defined as horizontal visibility below 1 km (e.g., Tardif and Rasmussen, 2007; Vautard et al., 2009; Haeffelin et al., 2010; Maier et al., 2013; Hammer et al., 2014; Mazoyer et al., 2019, 2022). However, in polluted regions with high particle number concentrations, not only droplets but also the hydrated aerosol particles contribute to the visibility reduction (e.g., Elias et al., 2009; Haeffelin et al., 2013; Hammer et al., 2014; Shen et al., 2018; Klemm et al., 2025). Fogs with the same visibility can, therefore, consist of very different droplet size distributions and result from different supersaturations. This complicates the interpretation and intercomparison of field observations in terms of the microphysical conditions within the fog, and has consequences for fog forecasting as well as understanding and projecting long-term trends in fog occurrence and properties. For the aviation sector, for example, accurate prediction of fog onset and clearance are particularly important (Shankar and Sahana, 2023). The mechanisms leading to fog dissipation can vary depending on the microphysics of the fog (Steeneveld et al., 2015). On the one hand, activated particles can exist in environments with lower relative humidity than hydrated aerosol particles, thus generally requiring a larger temperature increase to evaporate. On the other hand, large activated particles exhibit significantly higher sedimentation rates than small hydrated particles. Activated and unactivated fogs, as classified by Haeffelin et al. (2013), with unactivated fogs often referred to as haze, are therefore expected to have different microphysics, lifetime, and occurrence – hence responding differently to e.g. trends in air pollution and climate change. To accommodate this variation, earlier studies (e.g., Elias et al., 2015) have utilized LWC as an additional metric alongside visibility thresholds, as the LWC is proportional to the volume of the particles and thereby controlled by the large, activated particles. However, the relationships between fog microphysics, the fraction of activated particles, and their controlling factors still need to be better understood through detailed observations and modeling. Selecting an appropriate study region is equally crucial to capture these interactions effectively.
Plains around the world, such as the Sichuan basin (China), the Indo-Gangetic Plain, the California central valley, and the Po Valley are among the most prone to frequent, long-lasting, and dense fog events. Their proximity to mountain foothills provides ideal conditions for fog formation, including high humidity, stable air, and low temperatures. These regions are also densely populated and highly polluted due to intensive industrial, agricultural, and economic activities. Our study focuses on the Po Valley, a densely populated and industrialized region in northern Italy, bordered by the Alps to the north, the Apennines to the southwest, and the Adriatic Sea to the east. Although pollution levels have declined in recent decades, with clear reductions in PM2.5 (e.g. reduction of 2 %–5 % per year depending on location, see Bigi and Ghermandi, 2016) and elemental carbon (around 4 % per year, see Gilardoni et al., 2020), the Po Valley remains one of Europe’s most polluted areas (Daellenbach et al., 2020; EEA, 2020), influenced by traffic, industry, agriculture, and residential biomass burning (Paglione et al., 2020; Scotto et al., 2021). This unique combination of geography and emissions favors the frequent formation of radiation fog, particularly under anticyclonic conditions and weak southerly winds that supply moisture (Egli et al., 2019). Calm nocturnal winds promote a stable stratification, and together with radiative cooling, lead to prolonged low-visibility periods. Between 1984 and 2012, fog frequency in the Po Valley decreased when defined by visibility thresholds, but remained steady when defined by LWC (Giulianelli et al., 2014). The general decline in fog and low-visibility days across Europe (Vautard et al., 2009) likely reflects both improved air quality and rising temperatures (Klemm and Lin, 2016; Manara et al., 2019; Glantz et al., 2022). While long-term measurements of parameters such as the LWC and detailed aerosol chemistry in the Po Valley are available, detailed microphysical fog properties, such as droplet number size distributions, which are crucial for fog modeling (Boutle et al., 2022), are only available for shorter periods from field campaigns.
To bridge this gap, we combined comprehensive aerosol and fog observations from the FAIRARI 2021/2022 field campaign in the Po Valley (Neuberger et al., 2025; Mattsson et al., 2025a) with κ–Köhler theory and large-eddy simulation (LES) modeling. This integrated approach allows us to investigate the key processes governing fog microphysics and to address the following research questions:
-
What are the hygroscopic growth and activation characteristics of aerosols that govern fog formation?
-
How do aerosol size, chemical composition, and ambient supersaturation respectively influence the prediction of fog microphysical properties?
-
How do hydrated aerosol particles affect fog microphysics and the interpretation of observed aerosol–fog interactions?
2.1 Site description
The Fog and Aerosol InteRAction Research Italy (FAIRARI) campaign was carried out between November 2021 and May 2022 at the San Pietro Capofiume (SPC) research site located in the Po Valley, Italy, to cover the intense fog period and the transition to spring with more fog-free periods (see campaign overview by Neuberger et al., 2025). SPC is a rural background station surrounded by agricultural fields and smaller villages, the closest city being Bologna, about 30 km southwest of the station. At SPC, continuous measurements of the atmosphere, especially the chemical composition of the aerosol and fog, have been conducted since the 1980s (Fuzzi et al., 1983), complemented by dedicated measurement campaigns (Fuzzi et al., 1992; Noone et al., 1992; Frank et al., 1998; Ricci et al., 1998; Facchini et al., 1999; Hamed et al., 2007; Facchini et al., 2008; Gilardoni et al., 2014, 2016; Decesari et al., 2017; Bhandari et al., 2019; Paglione et al., 2020; Lampilahti et al., 2021; Costabile et al., 2022). The first microphysical measurements are from 1989 (Fuzzi et al., 1992), revealing high aerosol number concentrations (about 25 000 cm−3, Noone et al., 1992) and a bi-modal wet size distribution (Ogren et al., 1992).
2.2 Experimental setup
During the FAIRARI campaign, main aerosol and fog properties such as aerosol and fog droplet size distributions, aerosol chemical composition, and droplet activation parameters were measured within and on top of a mobile aerosol-cloud laboratory, in parallel to routine meteorological parameters (Fig. S1 in the Supplement). A detailed overview of all instrumentation is given by Neuberger et al. (2025) and only a brief summary of the experimental setup used in this study will be provided in the following.
2.2.1 Whole-air inlet
The whole-air inlet was built according to the guideline of the World Calibration Centre for Aerosol Physics (WCCAP) and can sample particles up to 40 µm in diameter (at wind speeds below 20 m s−1, Weingartner et al., 1999). The ambient air at 5.6 m (above ground) was sampled and an isokinetic flow splitter behind the inlet divided the flow into three sub-flows and the make-up flow. In the beginning of the campaign, the inlet was heated to 20 °C, after midday on 19 February to 30 °C. Nafion driers (model MD-700, Perma Pure LLC, NJ, USA) were used to dry the flow before the size distribution, activation, and chemical composition measurements (Fig. S1). Throughout the campaign, the relative humidity in the sampling lines after the Nafion driers was on average (25±9) % (mean ± SD) which follows the recommendation by WMO/GAW (2016) to keep the sampling RH below 30 %–40 %.
2.2.2 Meteorological data
Meteorological parameters (e.g., RH, temperature, atmospheric pressure, precipitation, wind direction, and wind speed) were measured by a VAISALA meteo station (model WXT536, Vaisala, Finland) at about 3.5 m above the ground (anchored over the CNR-container roof to avoid horizontal obstacles and have a free horizon of 360°) with a time resolution of 1 minute. The visibility was measured with a visibility sensor at about 3.35 m above the ground (at λ=880 nm, model 6400, Belfort Instrument, USA) with a time resolution of 1 second.
2.2.3 Ground-based Fog and Aerosol Spectrometer (GFAS)
The GFAS (GFAS-002, after 16:00 UTC on 18 March GFAS-003, Droplet Measurement Tech., USA) measured the ambient particle size distribution in the range between around 0.05 and 72 µm (optical diameter) at approx. 3.7 m above ground with a time resolution of 1 s. It is a single-particle light scattering device and, apart from size distribution, also measures the polarization ratio of the backscattering signal. It samples horizontally at an air speed of (18.3±0.3) m s−1 (GFAS-003 at (17.4±0.2) m s−1) and turns (motor-driven) into the main wind direction to reduce particle sampling losses. During FAIRARI, the threshold for changing the sampling direction was set to a wind direction change of at least 3° at a wind speed above 5 m s−1 for at least 5 s. The size calibration was checked at the end of the campaign using glass beads (Duke standard dry borosilicate glass bead microspheres (20.0±0.1) µm, Thermo Scientific, USA). The ambient particle size distributions were corrected for sampling and impaction losses within the GFAS using the geometries of the instrument and the equations given by Spiegel et al. (2012) based on 1 min time averages. As the wind speeds were generally low, these loss corrections led only to minor changes (4.1 % increase in campaign median effective diameter (ED) and 1.9 % increase in cloud droplet number concentration (CDNC), for Dwet>2 µm). The data were filtered to include only flow velocities between 16.4 and 19.7 m s−1 and laser currents between 87 and 100 mA; however, this filtering did not reduce the size of the measured dataset.
2.2.4 Particle Volume Monitor (PVM)
The LWC of the air has been routinely monitored since the early 1990s at the site (Giulianelli et al., 2014). During FAIRARI, the LWC was measured by a PVM (model PVM-100, Gerber Scientific, USA), installed on a pole fixed to the ground to measure the LWC at a height of approximately 2 m (above ground) with a time resolution of 1 min. The PVM is based on a forward-scattering laser spectrometer (light source: laser diode, 780 nm; detector: silicon diode) measuring the scattering within a 3 cm−3 volume, and LWC is inferred from the calculated scattering flux of the volume. Droplets in between around 3–50 µm diameter range can be detected with the instrument. The PVM was calibrated using a specific light-diffusing calibration disk following the instrument operator's manual.
2.2.5 Cloud Condensation Nuclei Counter (CCNC)
With the CCNC 1 (model CCNC-100, Droplet Measurement Tech., USA), the aerosol particle activation was measured at the five supersaturation (SS) values that are recommended as standard settings by the Aerosol, Clouds and Trace Gases Research Infrastructure (ACTRIS), 0.1 %, 0.2 %, 0.3 %, 0.5 %, 1.0 % (Gysel and Stratmann, 2024). Measurements of 15 min were conducted at each SS apart from the lowest, where the measurements were conducted for 20 min in a 1 Hz time resolution. This scan time of 80 min was chosen to allow for a stabilization of the temperature after the change in SS and a long enough valid measurement time afterwards. The flow and SS of CCNC 1 were calibrated nine months before the campaign, following the ACTRIS recommendations (Gysel and Stratmann, 2024; Rose et al., 2008) and checked during the campaign. A sampling flow of about 0.515 L min−1 was measured, which is within the interval of (0.500±0.025) L min−1 as recommended by the manufacturer. To ensure that the temperature had stabilized after a change in set SS, the following 4 min of data were excluded; after a change from the highest to the lowest SS, an additional 5 min were excluded.
2.2.6 Differential Mobility Particle Sizer (DMPS)
A DMPS (DMPS 1, 13.3–792 nm, electrical mobility diameter Karlsson et al., 2022) was measuring the dried aerosol size distribution behind the whole air inlet (sample flow 1.2 L min−1, sheath flow 4.55 L min−1, using a custom built medium Vienna type Differential Mobility Analyzer – DMA). It took 12 min to get one full size scan. The size distributions were corrected for multiple charging. A size calibration check of DMPS 1, using (203±5) nm polystyrene latex (PSL) spheres, at the beginning of the campaign showed a good performance of the sizing of the DMPS. We applied loss corrections to the size distribution measurements using the particle loss calculator by von der Weiden et al. (2009), which accounts for particle losses due to diffusion, impaction, and sedimentation. A particle density of 1000 g m−3 was assumed. In total, around 3.4 % of the particles got lost in the sampling line until the DMPS 1, while around 10.0 % of the particles got lost until they were counted by the Condensation Particle Counter (CPC) behind the DMA. Regular flow checks and filter tests ensured that no leaks in the sampling lines or pump failures occurred throughout the campaign.
2.2.7 Soot Particle Aerosol Mass Spectrometer (SP-AMS) and Aerosol Mass Spectrometer (AMS)
The SP-AMS (Aerodyne Research Inc., USA Onasch et al., 2012), measured the bulk submicron aerosol composition of the main chemical species, including organic aerosol (OA), nitrates, sulfates, ammonium, chloride, and refractory black carbon (rBC). In addition to the standard tungsten vaporizer, heated to ∼600 °C, it is equipped with an intra-cavity Nd:YAG laser (1064 nm), which provides quantification of rBC. The SP-AMS was operating in different acquisition modes, switching between V-ion mode (laser on), V-ion mode (laser off), and W-ion mode. The data were recorded with a temporal resolution of 1 min and a mass resolution of about 2400 in V-ion mode. The SP-AMS was sampling fog residuals, behind a Counterflow Virtual Impactor (CVI) inlet during fog, and total aerosol, behind the whole-air inlet during non-fog periods.
The chemical composition data from a second high-resolution time-of-flight aerosol mass spectrometer (HR-ToF-AMS, DeCarlo et al., 2006, or interstitial AMS) and MAAP were used to estimate the hygroscopicity of the interstitial aerosol.
The data from both AMS were processed and analyzed using the software packages SQUIRREL 1.66 and PIKA 1.26 (Sueper, 2024). More details on the calibrations, corrections, and analysis using this instrument can be found in Mattsson et al. (2025a).
2.2.8 Multi-Angle Absorption Photometer (MAAP)
The MAAP (Model 5012, Thermo Fisher Scientific, USA) estimated the equivalent black carbon (eBC) mass loadings from the optical absorption of aerosol particles collected on a filter, with a time resolution of 1 min. The MAAP also considers multiple scattering effects and absorption enhancement due to reflections from the deposited particles and the filter itself. A mass absorption cross-section (MACBC) value of 6.6 m2 g−1 was used to determine the eBC mass concentration. Further technical details are given by Petzold et al. (2002) and Petzold and Schönlinner (2004).
2.3 Derived aerosol and fog related parameters
2.3.1 Hygroscopic growth and droplet activation
The κ–Köhler theory is widely used to calculate hygroscopic growth in the sub-saturated regime and aerosol activation based on the particle size and hygroscopicity, with the supersaturation SS defined as (Petters and Kreidenweis, 2007):
Ddry represents the dry diameter of the particle with hygroscopicity κ. ρw is the density of water (997 kg m−3), Mw its molecular weight (0.018 kg mol−1), and σw its surface tension (0.0728 N m−1). R is the universal gas constant (8.314 J mol−1 K−1), T the temperature, and Dwet the diameter of the droplet. To estimate κ, we used two approaches.
κ-calculation via bulk chemical composition
In the first method to calculate κ, the bulk particle chemical composition, measured by the SP-AMS, was used (see e.g., Ranjan et al., 2025; Jurányi et al., 2010). For this calculation, several assumptions were needed, including that sulfates came from ammonium sulfate ((NH4)2SO4) and nitrates from ammonium nitrate (NH4NO3). These assumptions were justified given the good correlation between the estimated ammonium concentration necessary to achieve an ion balance within the particles and the observed ammonium ion concentrations. With these assumptions and the assumption that the aerosol is internally mixed, the κbulk values were calculated based on the mass concentrations of organic matter, ammonium sulfate, ammonium nitrate, and black carbon (BC). Chloride was not included in this calculation due to its low contribution. The overall hygroscopicity κbulk for a mixture of n different chemical species is expressed as a linear combination of the individual species' κi values (Table S1 and Fig. S2), weighted by their respective volume fractions fi in the dry particle (Stokes and Robinson, 1966):
The volume fractions fi of the individual components were calculated from the measured mass concentrations, mi, and their respective densities, ρi (Table S1 in the Supplement). The same method is employed to obtain the hygroscopicity parameter of the interstitial (κinterstitial) and fog residual (κresidual) aerosol particles.
κ-calculation via an inverse cloud condensation nucleus (CCN) closure
In the second approach, the bimodal (Aitken and accumulation mode) hygroscopicity parameters were optimized by minimizing the normalized root mean square error (NRMSE) between observed and predicted CCN spectra (i.e., CCN concentration at various supersaturations) measured by the CCNC. The optimization was performed using the Nelder-Mead method implemented in the Python scipy library (version 1.15.1, Gao and Han, 2012).
To begin, the measured dry aerosol number size distribution was decomposed into two log-normal modes representing smaller Aitken and larger accumulation particles (Fig. S3). Various combinations of organic, inorganic, and BC mass fractions in two modes were then systematically explored to predict CCN concentrations, while conserving the total mass of each chemical species. To simplify the process, the masses of ammonium nitrate and ammonium sulfate were combined and treated as total inorganic mass, while BC was assumed to have the same mass fraction in all aerosol particle sizes. Predicted CCN concentrations were then computed using the κ–Köhler theory (Petters and Kreidenweis, 2007). Among all generated combinations of chemical compositions (organic, inorganic, and BC mass fractions) and the associated mode-specific hygroscopicity parameter, the one yielding the lowest NRMSE between observed and predicted CCN spectra was selected as the optimized bimodal composition, described by and . We considered a constant ambient temperature of 20 °C for all calculations, which corresponds to the average temperature in the sampling line before the CCNC in our mobile laboratory (see Sect. 2.2).
Hygroscopic growth
To estimate the particle number size distribution at a certain relative humidity, and thereby the hygroscopic growth, we applied Eq. (1), using : every Ddry of the measured dry particle number size distribution was calculated to its corresponding Dwet(Ddry,RH), following Hammer et al. (2014). Using Dwet(Ddry,RH) and the measured dry number size distribution, the hydrated number size distribution was calculated:
The hygroscopic growth factor g(RH) is defined as:
2.3.2 Fog parameters
Fog events were defined by an RH≥90 % and visibility ≤1 km, and are numbered chronologically, consistent with Neuberger et al. (2025), where the full list can be found. The criteria had to be constantly met for at least 36 min (allowing for at least 3 size distribution scans of the DMPS) to be counted as an event. Due to the continuity criteria, a night can be split into several fog events if the visibility was above 1 km for short periods. Similar to Haeffelin et al. (2013), we divided the fog events into activated and unactivated fog. When the visibility was below 1 km due to hydrated particles only, i.e. when there was no droplet activation (i.e. absence of a distinct droplet mode observed by the GFAS), we use the term unactivated fog. Once there is droplet activation, we refer to it as activated fog.
Another variable that is often used in the literature to define fog, and especially clouds, is the LWC (see Sect. 1). It can be measured directly, e.g. with a PVM or calculated from the measured wet number size distribution, e.g. using a GFAS:
using the density of water ρw=997 kg m−3. To describe the particle sizes in fog, ED is typically used. It is calculated for diameters of a given size range [Dwet,min; Dwet,max] by:
Equivalent to ED, the CDNC is calculated by summing the wet number size distribution from Dwet,min to Dwet,max. During fog, the ED typically reflects the size distribution mode, which is dominated by activated particles or fog droplets. However, in practice, it is usually calculated for the entire size range measured by the instrument used in the respective study. With the Fog Monitor (FM) as one of the most commonly used instruments in the literature to measure fog droplet size distributions, this leads to a typically chosen lower diameter of about 2 µm. To explore the impact of varying the lower integration diameter on the resulting ED (using Eq. 6) and CDNC, we tested different values for this lower limit. We chose 2 µm as the lower diameter, consistent with the most commonly selected diameter and as a more realistic value for the FAIRARI campaign the calculated activation diameter (Dwet,act_S). In the following, we refer to those variables with ED>2, CDNC>2, and EDact, CDNCact, respectively. The maximum diameter Dwet,max in this study is given by the detection limit of the GFAS and is therefore 72 µm. Following Hammer et al. (2014), the ambient activation diameter, Dact_S, was calculated using the ambient surface size distribution measured by the GFAS and taking its first local minimum from the right. As an illustration, an example number and resulting surface size distribution from DMPS and GFAS is shown in Fig. 1. The reason behind the significantly lower values shown by the GFAS for the ambient aerosol number size distribution measurements for diameters below about 5 µm (Fig. 1) is not fully understood yet and could be due to instrumental issues of the prototype GFAS. A more detailed discussion and comparison to the PVM will follow in the next section.
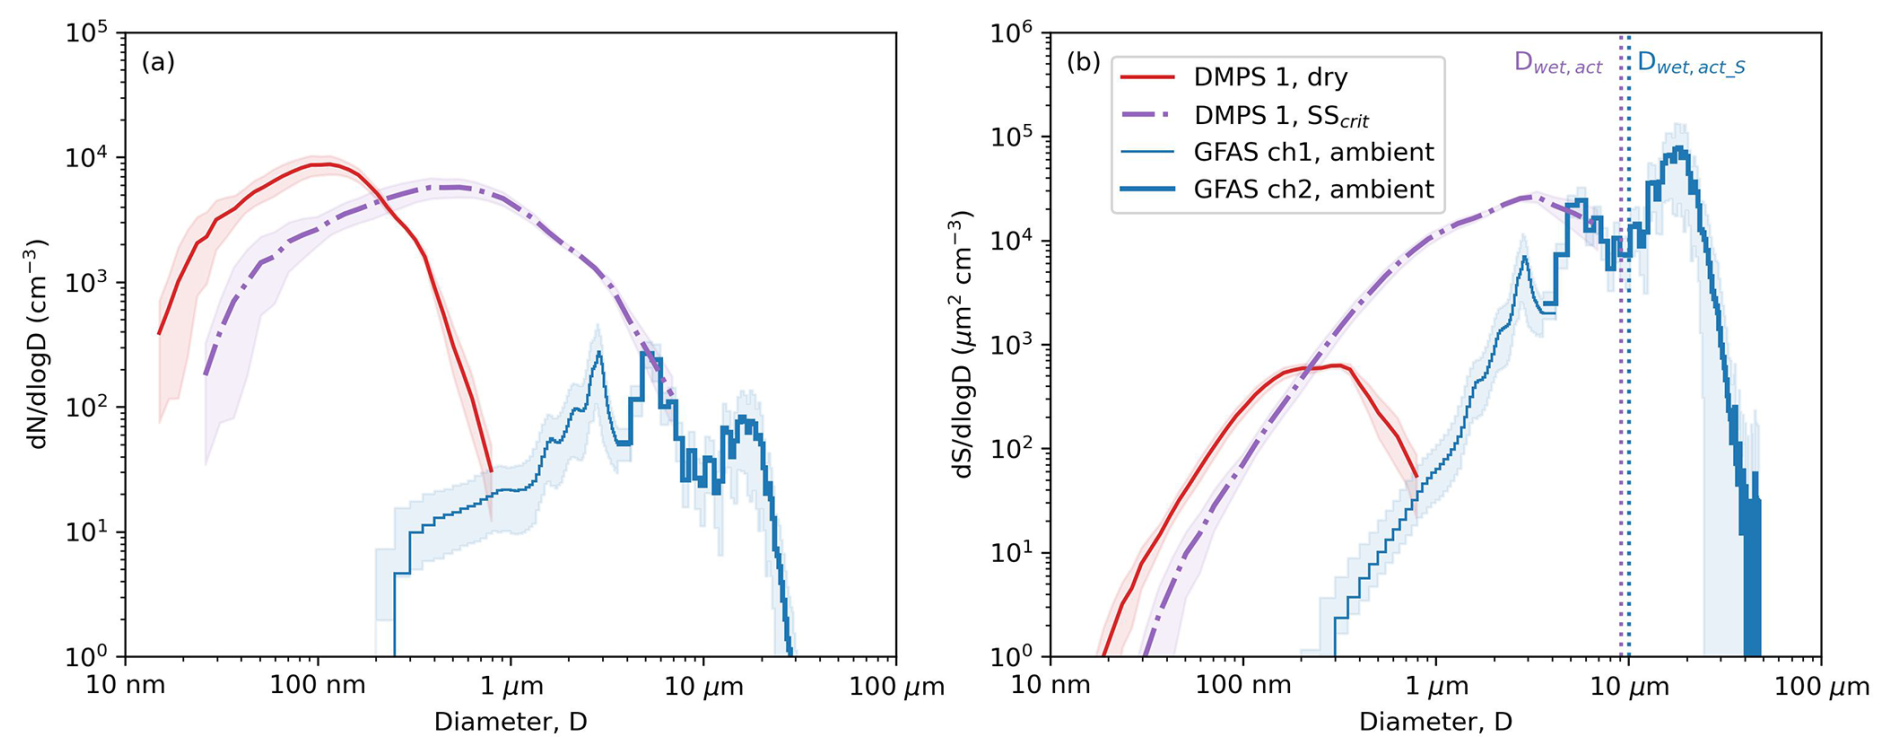
Figure 1Number and surface size distributions for one example fog event (event 7, 18 February 18:49 LST–19 February 00:14 LST). The dry number size distribution was transformed according to κ–Köhler theory by growing the particles to the size they would reach at the critical supersaturation (SScrit). The data were averaged over the last 4 h of the fog events to exclude the evolution phase of the droplet number size distribution. The standard deviation is given as shaded area. The GFAS size distributions are split into the two channels that are recorded by the instrument.
The ambient peak supersaturation SScrit was calculated using the wet (measured by the GFAS) and dry (measured by the DMPS) number size distribution and κ–Köhler theory (Eq. 1). Assuming that the dry particles activate starting from the largest ones, we used the wet number concentration of activated particles, , and summed over the dry number size distribution until the diameter Ddry,act at which a closure was reached with the ambient number concentration:
To calculate these number concentrations, we only summed over the measured size range of the instruments and did not fit a curve to the data, thereby potentially missing some of the particles in the coarse mode.
In Sect. 3.3, we tested the impact of different fog definitions on the visibility, the LWC, and the ED. For that comparison, we used two different definitions of fog: the visibility-only definition (as used in Neuberger et al., 2025) and an additionally added LWC threshold of 0.05 g m−3. This threshold was chosen as it corresponds to the previously used threshold of 0.08 g m−3, which was originally applied to liquid water content measurements by the PVM that were multiplied by a factor of 1.72 (Giulianelli et al., 2014). We also compared the visibility sensor measurements, χm, with the calculated visibility, based on the LWC measurements, χLWC. For that, the Koschmieder equation (Koschmieder, 1924) was combined with the finding by Kunkel (1984) that the light extinction coefficient be can be estimated as . However, the coefficients in this power law vary widely, depending on the physicochemical characteristics of the aerosol and the meteorological conditions in the respective environments (e.g., Kunkel, 1984). We therefore calculated the coefficients a and b most appropriate for the winter months in the Po Valley by performing a linear regression on the logarithm of the measured visibility, χm:
2.3.3 Observational limitations
The aerosol and fog parameters were measured with various instruments, which all cover different particle size ranges, have different temporal resolutions, and were measured at slightly different locations around the site.
While our ambient measurements have a temporal resolution of 1 s to 1 min, the dry aerosol number size distributions have a temporal resolution of 12 min. A linear interpolation to a 1 min time resolution, as done for the calculation of N>503 (number concentration of particles with a dry diameter larger than 503 nm), will be small as the variations in the measured dry aerosol number size distributions were small. Moreover, we measured the dry size distribution up to diameters of 792 nm, thereby missing the very largest particles, the coarse mode which can have a profound impact on the aerosol light extinction and thus visibility (Zieger et al., 2013, 2014). In our analysis, a missing coarse mode would decrease the dry activation diameter and thereby decrease the wet activation diameter and increase the critical supersaturation. A comparison between the measurements of the total CPC and the integrated CPC ( cm−3, determined from a weighted bivariate fit, Fig. S4), as well as the method-independent results for κ (see Sect. 3.2), however, suggest that the effect of an undetermined coarse mode is rather small. In addition, the size distribution measurements were binned with rather large bin sizes (up to 85 nm) for large diameters, leading to uncertainties in the determination of the dry activation diameters since the nearest bin diameters were used.
Cloud and fog microphysical parameters are notoriously difficult to measure (Baumgardner et al., 2012; Spiegel et al., 2012) and thus it is crucial to evaluate the different instruments. We compared the LWC measurements from the GFAS (calculated with Eq. 5) with those of the PVM and found that they correlate well (Spearman correlation of 0.82, p≪0.01, Fig. S5a). However, the PVM measures on average (determined from a weighted bivariate fit) about 3 times higher values for the LWC than the GFAS: LWC g m−3. In some fog events (e.g. fog event 15), the LWC measurements demonstrated strong agreement, closely following the 1:1 line (Fig. S5a). These events were characterized by the presence of large fog droplets as can also be seen when comparing the visibility measurements, using the Ground-based Counterflow Virtual Impactor (GCVI), with the calculated visibility, using the GFAS data and Mie theory (Fig. S5b). Moreover, the comparison of the measured and calculated visibility also shows that the GFAS is underestimating the total surface (Fig. S5b): m. Therefore, most likely, the PVM measurements are more accurate, while the GFAS measurements are too low for most of the cases (except when effective droplet diameters were large, see colorcode in Fig. S5b). Potential reasons behind this discrepancy are wrong diameter assignment (Mie wiggles) for smaller particles (Spiegel et al., 2012), underestimation of particle losses for larger particles, and undercounting due to coincidence. Although wind speeds were very low and we corrected for droplet losses in the GFAS using the measured wind speed and direction, we cannot exclude additional minor losses due to misalignment between GFAS and the main wind direction. Further, an underestimation of the droplet concentration could also have been caused by fluctuations in the measured true air speed by the GFAS, although we believe this to be an unlikely cause. As shown in Fig. 1, the GFAS clearly underestimated particles below 3 µm (in the high gain channel of the GFAS). This could have been caused by a too high rejection rate of the high gain channel (determined from qualifier and sizer) of the GFAS, which would have a more prominent effect when the LWC is less dominated by very large droplets. Moreover, the instruments were measuring about 40 m apart and at different heights (GFAS: 3.7 m, PVM: 1.5 m), which can cause differences in the measurements if the fog is not homogeneous. Furthermore, the instruments were measuring at slightly different wavelengths (780 nm vs. 660 nm, PVM vs. GFAS, respectively), however, if any impact, this should lead to slightly higher values measured by the GFAS than the PVM. Also, the size ranges measured by the two instruments are slightly different; however, even after calculating the LWC for the same size range, the discrepancy remains. The large disagreement in LWC is not unusual, Guyot et al. (2015), for example, found that the LWC can differ by up to a factor of 5 between different instruments (before loss corrections).
2.4 Large-eddy simulation of fog-related parameters
We used the large-eddy simulation code MISU-MIT Cloud and Aerosol (MIMICA, Savre et al., 2014) to examine the sensitivity of the fog properties to the aerosol number size distribution and chemical composition. MIMICA is a non-hydrostatic model that solves equations describing an anelastic atmospheric system. The sub-grid scale turbulence is parameterized as a function of the calculated turbulent kinetic energy (Deardorff, 1974). MIMICA employs a two-moment bulk microphysics scheme to predict the mass and number concentrations of cloud droplets and raindrops (Seifert and Beheng, 2006). As a default, a prescribed gamma function is used to parameterize the mass size distribution. Supersaturation is calculated with a pseudo-analytic method following Morrison and Grabowski (2008). Both cloud droplets and raindrops are subjected to sedimentation. As in Savre et al. (2014), a simple power law is used to calculate the terminal fall speed for raindrops. Cloud droplet sedimentation, on the other hand, is described by calculating the bulk terminal velocity in the Stokes regime of droplets following a generalized gamma distribution, and is expressed in the governing equations for both droplet number concentration and liquid water content. Aerosols are described using a two-moment module with a specified number of lognormal aerosol models (Ekman et al., 2006). Aerosol swelling and activation of aerosol particles into cloud droplets is calculated using κ–Köhler theory (see Section 2.3.1). Dry particles take up water according to a prognostic growth factor, and those with wet diameters exceeding 2 µm are classified as hydrated aerosols. The hydrometeors affect the atmospheric radiation budget following a four-stream radiative transfer solver (Fu and Liou, 1993) that includes 6 bands for solar radiation and 12 bands for the infrared part of the spectrum. Moreover, given a specified surface temperature and relative humidity, surface fluxes can be calculated using Monin-Obukhov similarity theory and turbulence flux relationships, representing the exchange of moisture, heat, and momentum between the surface and atmosphere.
We will focus on a particular fog event for the simulations (the consecutive fog events 7–9), as will be discussed later (see also Sect. 3.2 and Fig. 5 below). The simulations began at 18:00 LST (local standard time, UTC+1) on 18 February 2022, and continued until 14:00 LST on the following day, with an approximate time step of 1 s. The domain size was set to 0.16 km × 0.16 km × 2 km, with grid cells in 10 m × 10 m × 5 m. Initial vertical profiles of moisture and temperature were estimated using the 00:00 LST sounding at SPC as well as the vertical temperature and humidity profiles from ECMWF Reanalysis version 5 (ERA5) pressure-level data (Hersbach et al., 2023) in the evening of 18 February. The initial horizontal wind field was set to zero in agreement with observations that indicated weak near-surface winds and minimal wind shear. The fog was primarily driven by radiative cooling, and vertical motions were very weak; therefore, the updraft velocity within the domain was initialized as zero. Surface forcing was applied using the observed near-surface temperature, while the surface moisture content was assumed to be saturated during the night when surface evaporation is weak. At sunrise, the surface relative humidity was set to decrease as a function of the temperature, assuming that the surface dew point temperature was equal to the lowest surface temperature observed during the night.
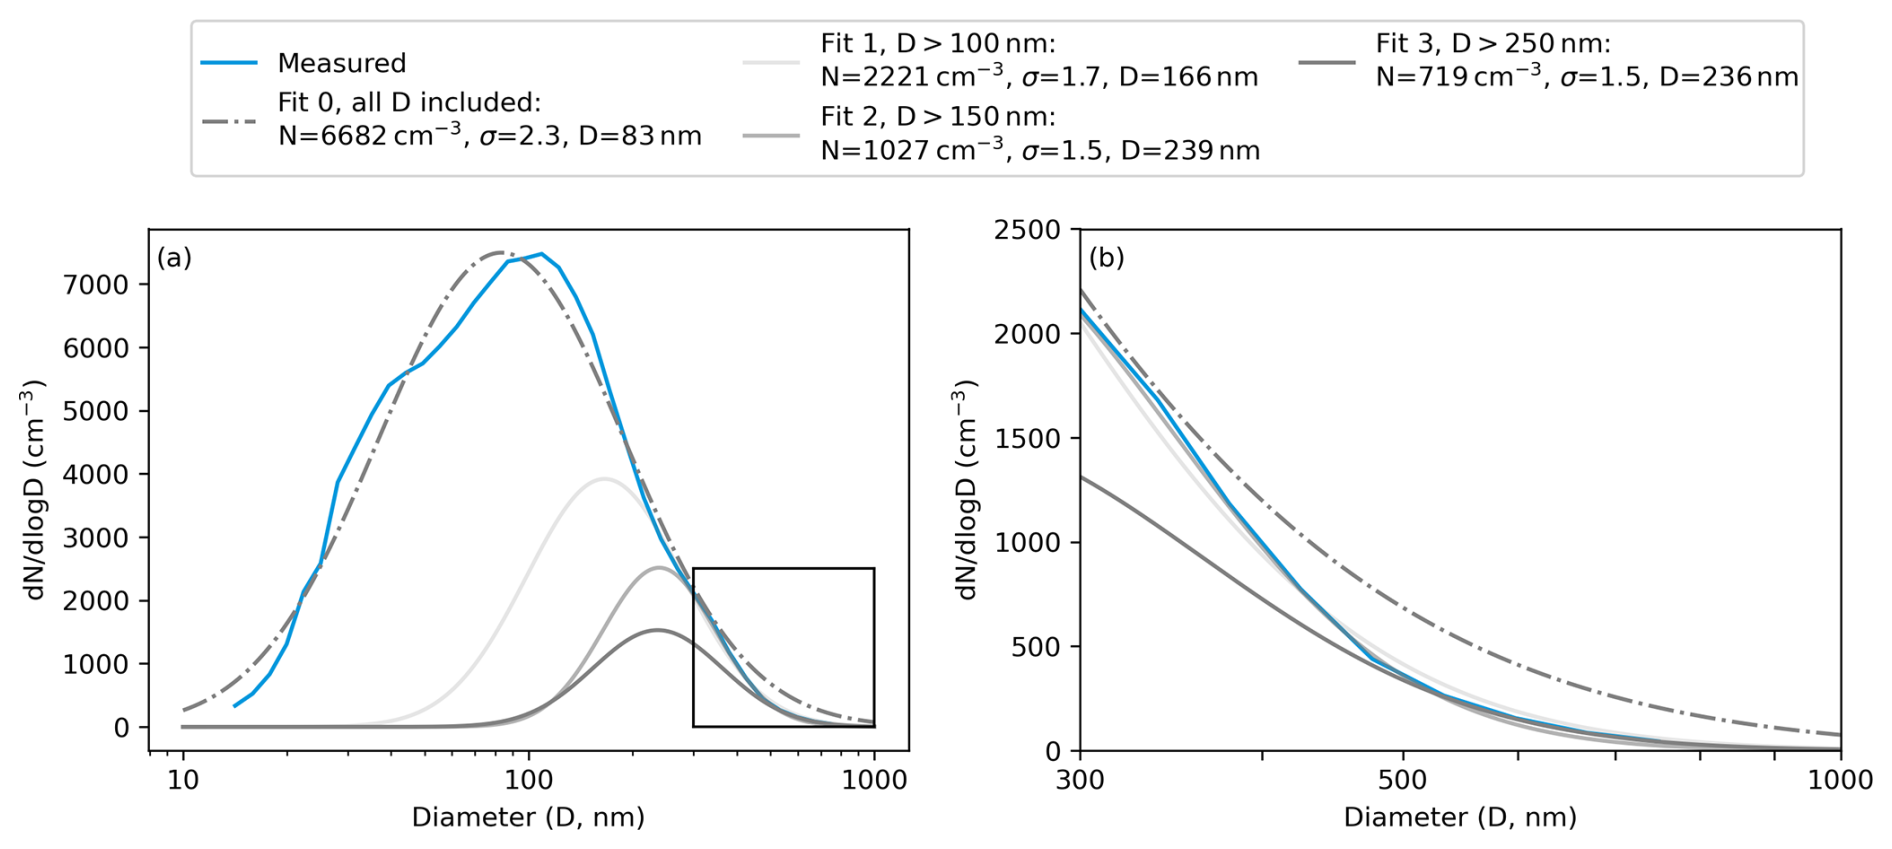
Figure 2Input parameters of dry particle size distributions for LES. (a) The fitting method of the dry aerosol number size distribution at the example of the consecutive fog events 7–9, using either the full size distribution (dashed dotted), the size distribution above 100 nm (light gray), above 150 nm (gray) or above 250 nm (dark gray). (b) Detail of box indicated in panel a. Results of the single log-normal fits are shown in the legend above.
The results of model evaluation can be found in the Supplement (see Model evaluation, more details are given in Ding et al., 2026). We studied the sensitivity of the simulated CDNC to the dry aerosol number size distribution and sub-micron chemical composition. First, several different representations of the observed aerosol size distribution during the fog event were tested, focusing either on the entire dry aerosol size distribution or progressively optimizing the characterization of large particles by fitting only subsets of the distribution with diameters exceeding 100, 150, and 250 nm, respectively (Fig. 2). Additionally, we compared the physical and chemical properties of aerosols from two fog events (Fig. S10): one representing an average dry number size distribution (event 7), and the other characterized by the lowest number of large particles (event 15). In the simulations of events 7 and 15, the aerosol size distributions were assumed to be unimodal and log-normal. For event 7 [15], the aerosol concentration was set to 5000 [5850] cm−3, the geometric mean diameter to 96.4 [92.0] nm, and the standard deviation to 1.90 [1.66]. Regarding chemistry input, the hygroscopicity parameter κ was 0.45 [0.42], the molar weight 49.35 [52.43] g mol−1, and the density 1618.62 [1599.23] kg m−3. Note that fog evolution and microphysical properties are also highly sensitive to meteorological conditions such as surface cooling rates and humidity. However, this study focuses on the relative importance of aerosol size distribution and aerosol chemistry on fog microphysics. Therefore, in the sensitivity experiments, meteorological conditions were constrained to those of event 7, and only the initial aerosol size distribution parameters and chemical properties were varied. The comparative simulation results of these two events are presented in the Supplement (Fig. S11), indicating that the aerosol size distribution predominantly controls droplet activation, with CDNC and LWC showing substantially greater sensitivity to aerosol size distribution than to chemical composition.
In this study, we explore the impact of hydrated aerosol particles on aerosol–fog interaction measurements. After a brief description of the aerosol and fog properties, we begin by examining the growth and activation behavior of aerosol particles using in-situ observations and Large Eddy Simulation (LES) modeling. We then assess the influence of hydrated aerosol particles on ambient fog parameters such as ED, CDNC, and LWC. Next, we investigate their impact on the temporal evolution of fog by quantifying their contribution to visibility reduction. Finally, we examine how hydrated aerosol particles influence established aerosol–fog relationships.
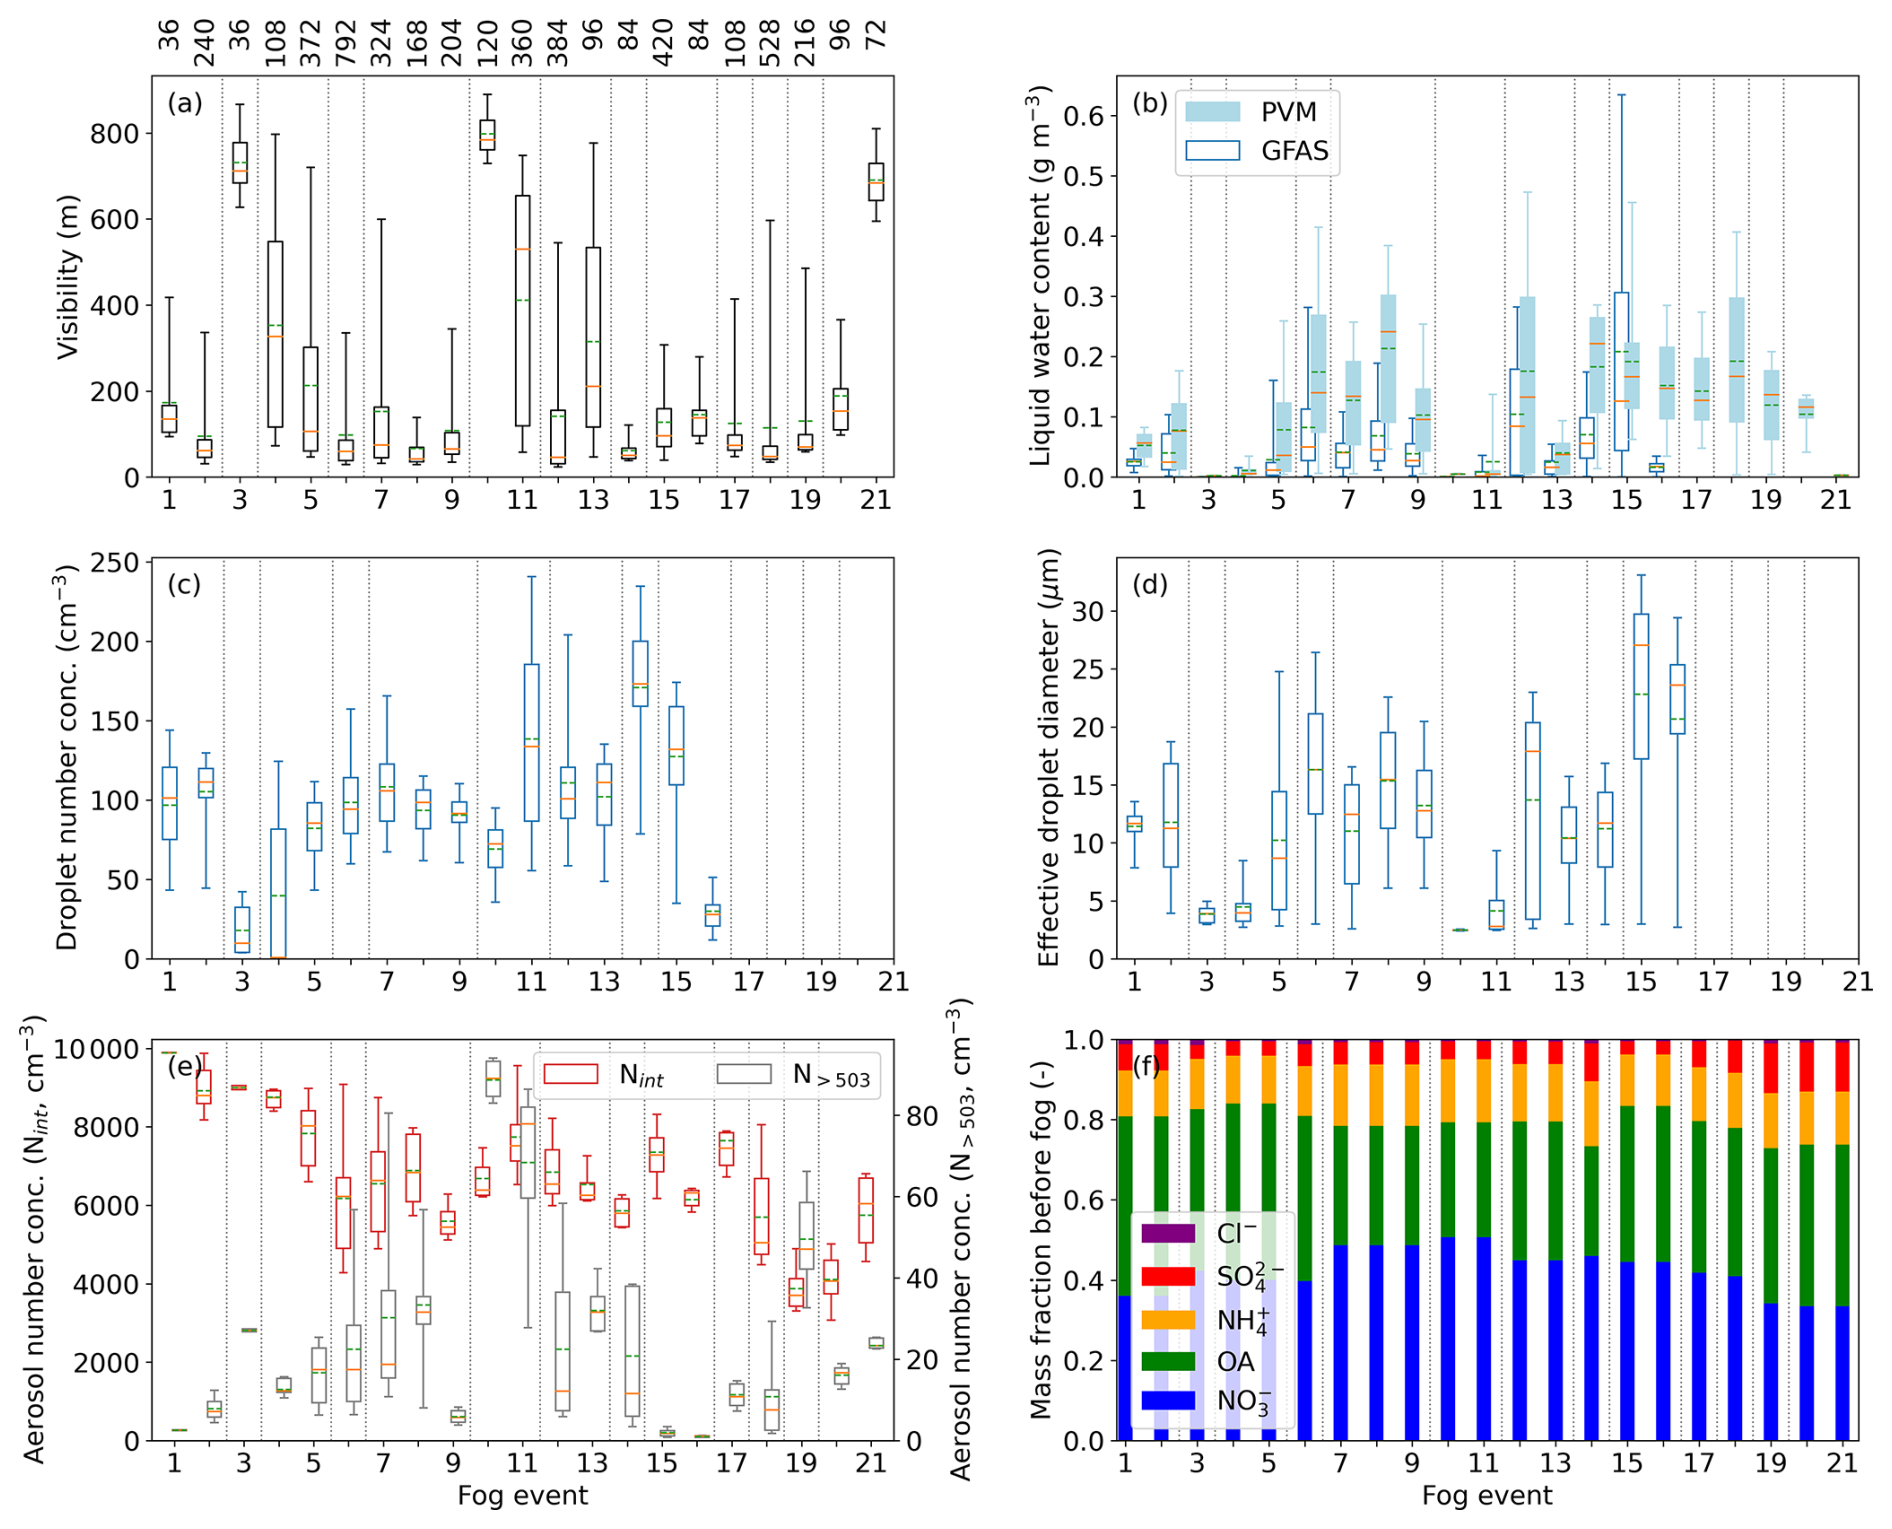
Figure 3Main physical and chemical parameters during the 21 fog events observed during FAIRARI. The duration of each event is given above panel (a) in minutes. (a) Measured visibility, (b) liquid water content, measured with the Particle Volume Monitor (PVM) and the Ground-based Fog and Aerosol Spectrometer (GFAS), (c) droplet number concentration (Dwet>2 µm), (d) effective diameter (Dwet>2 µm), (e) total aerosol number concentration (Nint, Ddry: 13.3–792 nm) and total number concentration of large particles (N>503, Ddry: 503–792nm), and (f) mass fraction of chemical compounds 1 h before the fog onset. The boxes in (a)–(e) represent the 25th and 75th percentiles and the whiskers the 5th and 95th percentiles. The median is given as a solid orange line, the mean as a dashed green line. Fog events occurring in the same night are grouped with vertical dotted lines.
3.1 Variability of aerosol and fog physicochemical characteristics
During FAIRARI, we recorded 21 fog events, some occurring during the same night, separated by a period of visibility over 1 km. The analyzed fog events lasted from around 36 min up to 13 h and we found a great variability in the measured microphysical parameters, both throughout the whole campaign and during each of the events (see overview in Fig. 3). The median visibility during fog varied from 41 to 785 m (Fig. 3a, Neuberger et al., 2025). The median LWC, measured by the PVM, ranged between 0.002 and 0.241 g m−3, being on average about 3 times higher than the values measured by the GFAS (Fig. 3b). The median CDNC was between 1 and 173 cm−3, and the median ED between 2.5 and 27 µm (Dwet>2 µm, Fig. 3c and d). The median dry aerosol number concentration (Ddry: 13.3 – 792 nm) varied between 3700 and 9900 cm−3, with a decreasing trend towards the last fog events (Figs. 3e and S6). Interestingly, this trend is, however, only visible when comparing times associated with the fog events, and not in the continuous time series throughout the whole campaign (Neuberger et al., 2025). During some events, the dry number size distribution had a clear minimum at Ddry<100 nm (Fig. S6). The shape of the upper tail of the distribution, which is the important one for particle activation, varied, with event 15 being the event with the least number of large particles. The sub-micron mass of the dry aerosol before the fog onset was dominated by nitrate and organics (Fig. 3f), which together contributed between 73 % and 84 %, and the composition stayed relatively stable throughout the campaign. Details on the chemistry during FAIRARI, including the in-fog times, are given by Mattsson et al. (2025a).
3.2 Hygroscopic growth and droplet activation
In the following sections, we describe and discuss the observed hygroscopic growth and droplet activation. The first subsection presents results based on in-situ observations, while the second subsection utilizes the LES code MIMICA to explore the sensitivity of microphysical fog parameters, such as CDNC and LWC, to the underlying dry aerosol number size distribution on the example of one fog event during FAIRARI.
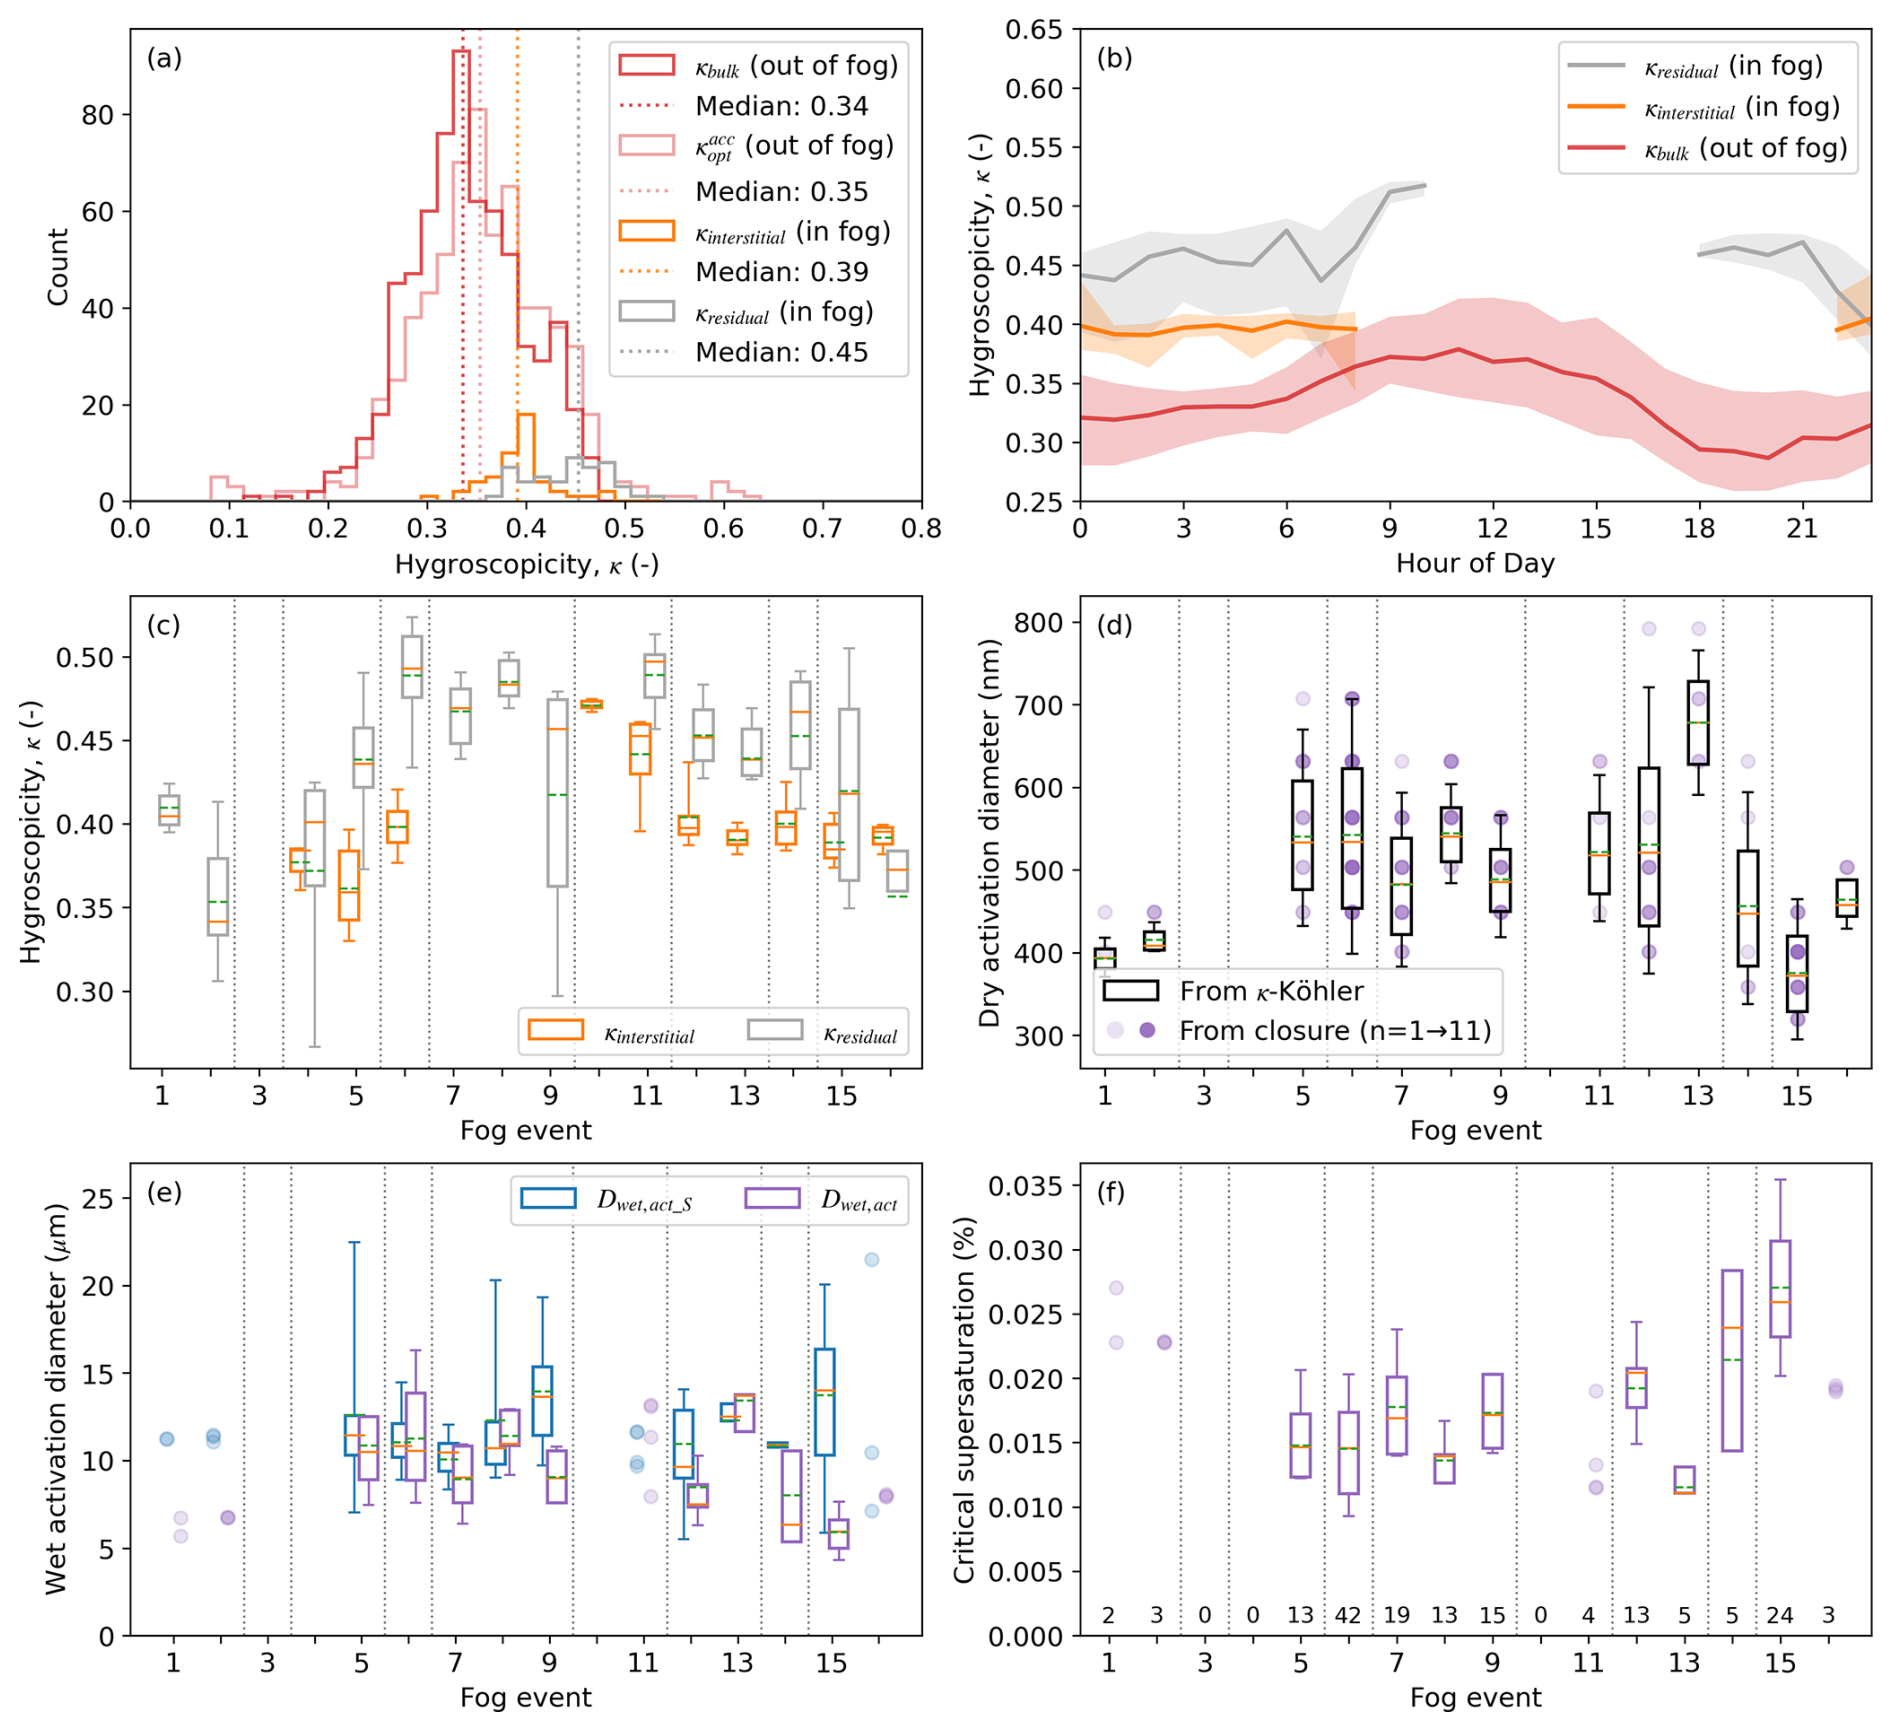
Figure 4Retrieved parameters related to droplet activation. (a) Hygroscopicity parameter κ under non-fog conditions (calculated using two methods, κbulk and ) and κ of interstitial and residual aerosol particles during fog; (b) diurnal cycle of κ for residual (κresidual), interstitial (κinterstitial), and out-of-fog aerosol particles (κbulk) as median values (shaded areas indicate quartiles); (c) κ of interstitial and residual aerosol particles during individual fog events; (d) dry activation diameters derived from GFAS and DMPS closure (dots) and calculated from κ–Köhler theory (boxes); (e) wet activation diameters obtained from two approaches (Dwet,act_S and Dwet,act); (f) critical supersaturation during the fog events. The boxes in panels (c)–(f) represent the 25th and 75th percentiles, while the whiskers indicate the 5th and 95th percentiles. Boxes in panels (e) and (f) are plotted only if at least five data points are available; otherwise, individual points are shown. The color intensity indicates the number of coinciding data points (ranging from 1 to 11). The solid orange and dashed green lines denote the median and mean values, respectively. Fog events occurring on the same night are grouped by vertical dotted lines. The number of data points per fog event for panels (d)–(f) is shown below panel (f).
3.2.1 Observed droplet activation during FAIRARI
From the physical and chemical properties of the aerosol described above, we calculated the hygroscopicity parameter (κ) of the particles and parameters related to the droplet activation, namely, wet and dry activation diameter as well as critical supersaturation (Fig. 4) using the Köhler theory (Eqs. 1, 2, and 7). The κ-value is calculated with two different approaches (see Sect. 2.3.1). κbulk and optimized κ in accumulation mode, thus obtained, show very similar distributions, with campaign medians out of fog equal to 0.34 and 0.35, respectively (Fig. 4a). This implies that particles larger than 1 µm, which are included in the calculation of but not in κbulk, are either sparse in number or have a similar hygroscopicity to the smaller particles. The agreement between both methods for calculating κ suggests that the hygroscopicity of accumulation mode particles during winter at SPC can be estimated using the bulk chemical composition measured by the SP-AMS, and hence is also comparable to the inferred hygroscopicities of the residual and interstitial particles (see Fig. 4a). As expected, the fog residuals represent the most hygroscopic fraction of the aerosol population, while the hygroscopicity of the interstitial particles falls between that of the total aerosol and the residuals. This is explained by the diurnal variability of the hygroscopicity values (see Fig. 4b), which generally shows higher hygroscopicity values during the day. The increase in the night-time hygroscopicity is due to the enrichment of nitrate (Mattsson et al., 2025a). Furthermore, the relatively higher nocturnal increase of the hygroscopicity observed in the residuals as compared with the total aerosol suggests an enhanced uptake of nitrate into the fog droplets in the presence of water. All in all, the hygroscopicity values indicate a highly soluble aerosol, and the difference between the residuals and the interstitial aerosol might suggest some degree of external mixing (Fig. 4c).
Using the calculated time series of , we quantified the hygroscopic growth of dry aerosol particles across all fog events during the campaign (Eq. 3). Interestingly, the campaign median of the optimized Aitken-mode hygroscopicity, , was comparable to . This similarity suggests a rather uniform chemical composition across particle sizes. Consequently, was adopted as a representative value for all size ranges. As a result, only minor variations in the growth factor at RH=100 % (Eq. 4) were observed between events, consistent with the near-constant behavior of throughout the campaign.
Particles with a dry diameter of around 13 nm grow by a factor of about 1.60 (IQR: 1.59–1.63), while particles larger than 500 nm grow by more than a factor of 10 (Fig. S7). Under supersaturated conditions, which are needed for droplet activation, these growth factors will be even higher. Using an example fog event, we illustrate the hygroscopic growth of the aerosol particles and their co-existence with activated particles (Fig. 1). Already at 100 % RH, some aerosol particles can grow sufficiently to enter the size range typically associated with activated particles or droplets (as also shown by e.g. Shen et al., 2018). As a result, the commonly used ambient diameter threshold for fog residual sampling (usually around 6–8 µm, see e.g. Mattsson et al., 2025a; Liu et al., 2025) may be too low, leading to an unintentional sampling of a mixture of unactivated aerosol particles and fog droplets when, for example, using CVI inlets. At the same time, the ambient diameter threshold typically used to analyze interstitial, unactivated aerosol particles (e.g., PM2.5 or PM1 inlets) can also be too low in conditions resembling those of the Po Valley, leading to a potential undersampling of interstitial aerosol during periods with high RH.
Analyzing particle activation using the κ-Köhler theory, we find that the median dry activation diameter ranges from approximately ∼370 to ∼710 nm across all fog events (Fig. 4d). These values, derived from time-resolved κbulk, reflect the temporal variability in aerosol hygroscopicity. In contrast, the DMPS-GFAS closure based on the nearest-neighbour approach gives a comparable range of ∼400–710 nm.
The resulting median wet activation diameter, Dwet,act, and critical supersaturation, SScrit, range between 5.9 and 13.7 µm and 0.011 % and 0.026 %, respectively (Fig. 4e and f). The agreement between the wet activation diameter based on the method described in Hammer et al. (2014), Dwet,act_S, and the wet activation diameter based on the κ-Köhler theory calculations, Dwet,act, varies (Fig. 4e). The latter method represents a theoretically accurate definition of the activation diameter but is sensitive to correct number size distribution measurements of both the wet and dry aerosol as input (Eq. 7). The former method, on the other hand, relies on the assumption that activation is the main process determining the minimum in the wet aerosol number size distribution and that other size-dependent processes, that simultaneously modify the size distribution, are negligible in this regard.
3.2.2 Modeled sensitivity of fog parameters on aerosol size distribution
The LES code MIMICA was used to examine the impact of the dry aerosol number size distribution on the CDNC and LWC during the consecutive fog events 7–9 (Fig. 5). In agreement with the high dry activation diameters observed during FAIRARI, we find that the CDNC and LWC are mostly affected by the representation of the largest particles in the dry aerosol number size distribution, while the total aerosol number concentration is of less importance. Optimizing the dry aerosol number size distribution fit to the entire measured distribution results in 55 % and 28 % higher values for the CDNC and LWC, respectively, compared to optimizing the fit to the measured size distribution above a certain diameter threshold larger than 100 nm. This was expected as the calculated dry activation diameter during fog events 7–9 was about 500 nm (Fig. 4d) and stresses the importance of detailed measurements in this size range.
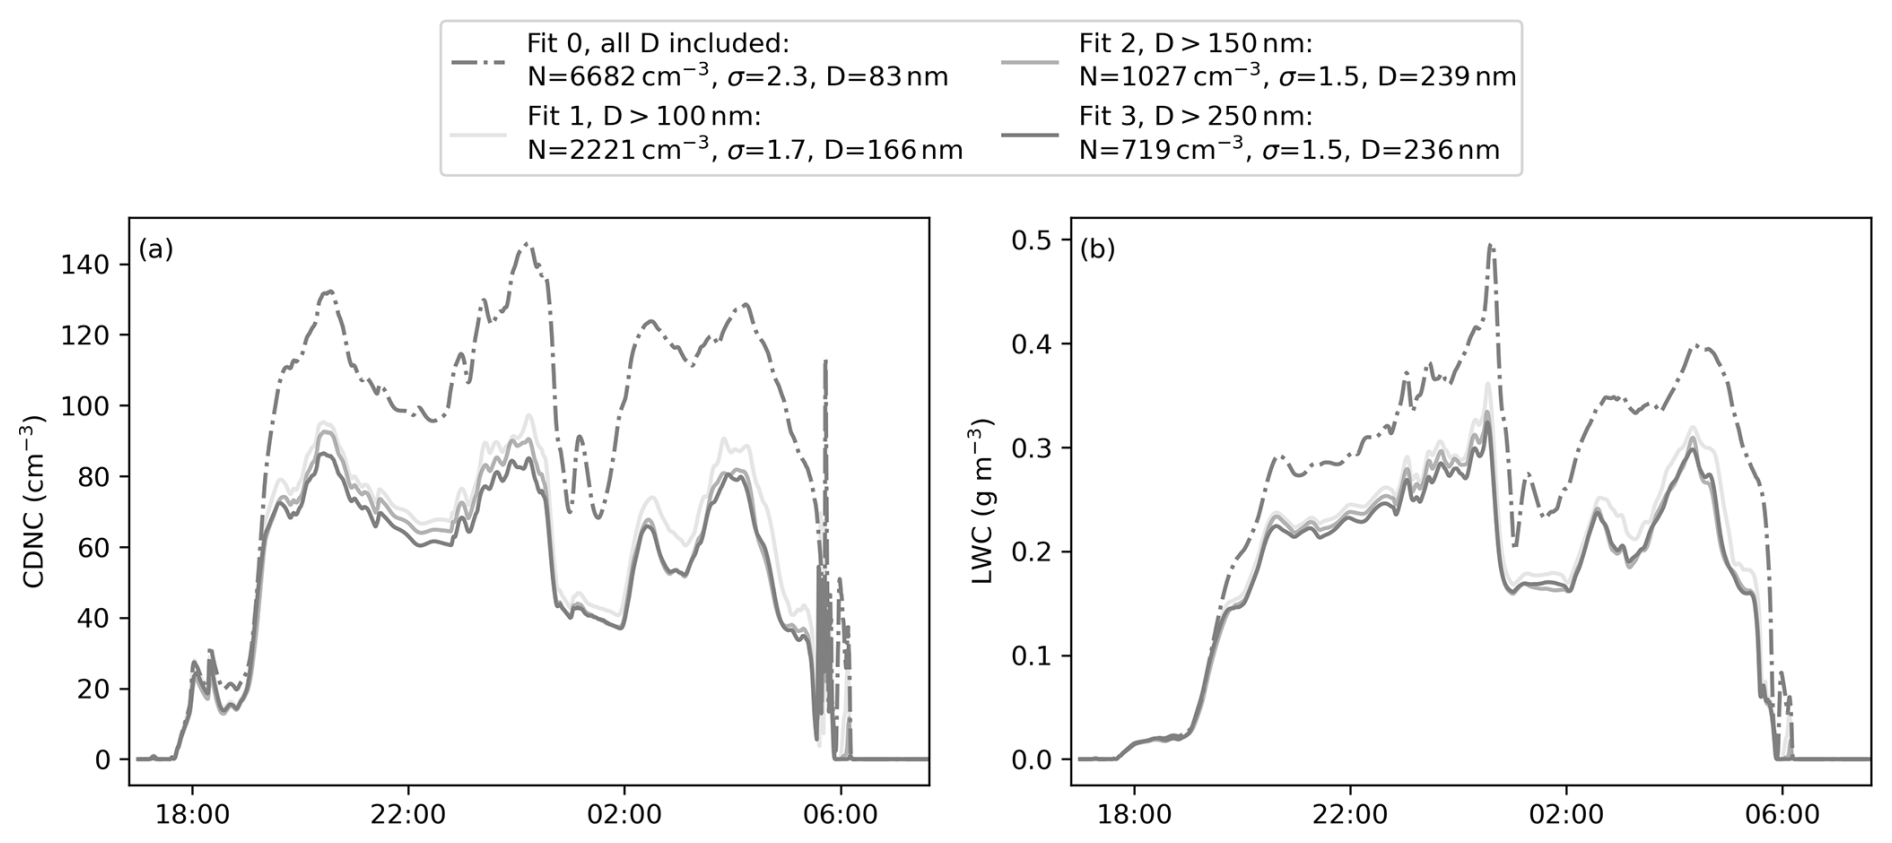
Figure 5Sensitivity of the LES output of CDNC and LWC to aerosol number size distribution during the consecutive fog events 7–9.
Furthermore, we analyzed the relative impact of the dry aerosol number size distribution and hygroscopicity on the simulated CDNC and LWC, using parameters of the two fog events that are shown in Fig. S12 (see SI, incl. Figs. S10 and S11). As expected in a polluted region like the Po Valley, where CCNs are abundant, a lower number concentration of large accumulation mode particles (such as in fog events 15–16 compared to fog events 7–9, Figs. S10 and S6), results in fewer activated particles (Fig. S11a). Keeping the hygroscopicity constant but changing the aerosol size distribution, CDNC decreases from 52 cm−3 (IQR: 33–66 cm−3, m7s7c7) to 22 cm−3 (IQR: 18–33 cm−3, m7s15c7). Contrary, keeping the size distribution constant but changing the hygroscopicity, CDNC stays almost constant – decrease from 52 cm−3 (IQR: 33–66 cm−3, m7s7c7) to 51 cm−3 (IQR: 33–63 cm−3, m7s7c15). Moreover, the slightly higher hygroscopicity of the aerosol particles during events 7–9 compared to 15–16 (0.48 vs. 0.42), led to slightly higher number concentrations of activated particles (using the size distribution of events 7–9 and 15–16, respectively). Changing the dry aerosol number size distribution from a campaign average size distribution to an extreme distribution with respect to the upper tail changed the CDNC by a factor of about 2.5, while exchanging the hygroscopicity of the dry aerosol during those two fog events changed the CDNC only by about 4 %. This is expected, based on the κ–Köhler theory: increasing the hygroscopicity of the particles is related to a lower critical supersaturation needed for the particles to get activated, therefore, decreasing the dry activation diameter for a given ambient supersaturation. The same behavior was observed for the LWC (Fig. S11b). Our results indicate that the microphysical differences between fog events 7–9 and 15–16 are primarily driven by variations in the dry aerosol size distribution, with hygroscopicity playing a comparatively smaller role. These results suggest that while aerosol chemical properties play an important role in determining hygroscopicity and influencing the water vapor budget in fog, the physical characteristics, particularly the size distribution, exert a more primary impact on aerosol activation, thereby shaping fog microphysical development.
3.2.3 Comparison with other studies
The dry and wet activation diameters are expected to be highly variable for different environments and fog types, depending on the dry particle number size distribution, the aerosol hygroscopicity, and the supersaturation. For example, during the ParisFog 2012/2013 campaign, Hammer et al. (2014) found a mode diameter in the dry particle number size distribution at about 100 nm, similar to us, a much lower κ=0.14 compared to here, and higher peak supersaturations between 0.031 % and 0.046 %, leading to lower wet activation diameters of about 2.6 µm. During WiFEx in the Indo-gangetic Plain region, on the other hand, activation diameters larger than 10 µm were measured (Ghude et al., 2023). Shen et al. (2018), measuring in the North China Plain, found activation diameters in between (around 4 µm). During the Po Valley experiment in 1989, the supersaturation was about 0.03 % (Svenningsson et al., 1992), and two populations of particles with respect to their hygroscopicity were found, using a different method than ours (Noone et al., 1992; Svenningsson et al., 1992). The dry activation diameter of the more hygroscopic ones was around 425 nm (Noone et al., 1992), while the less hygroscopic ones activated at around 775 nm (Svenningsson et al., 1992). These past results from the Po Valley are generally in line with our observations, although particularly the supersaturations seem to have decreased over the years. Even though there is a large uncertainty associated with the methods for determining supersaturations, this result could contribute to understanding the factors driving the decrease in the fog occurrence in the Po Valley. Secondly, our results seem to suggest a lower degree of external mixing than reported by the earlier studies - which could be explained by the decrease in local aerosol sources and increase in the contribution of more aged aerosol. Furthermore, the comparison with other environments with abundant fog suggests that the contribution of hygroscopically grown but unactivated particles to visibility reduction and recorded fog properties is likely to be particularly high in the Po Valley environment, which we therefore analyze and discuss in the next subsection.
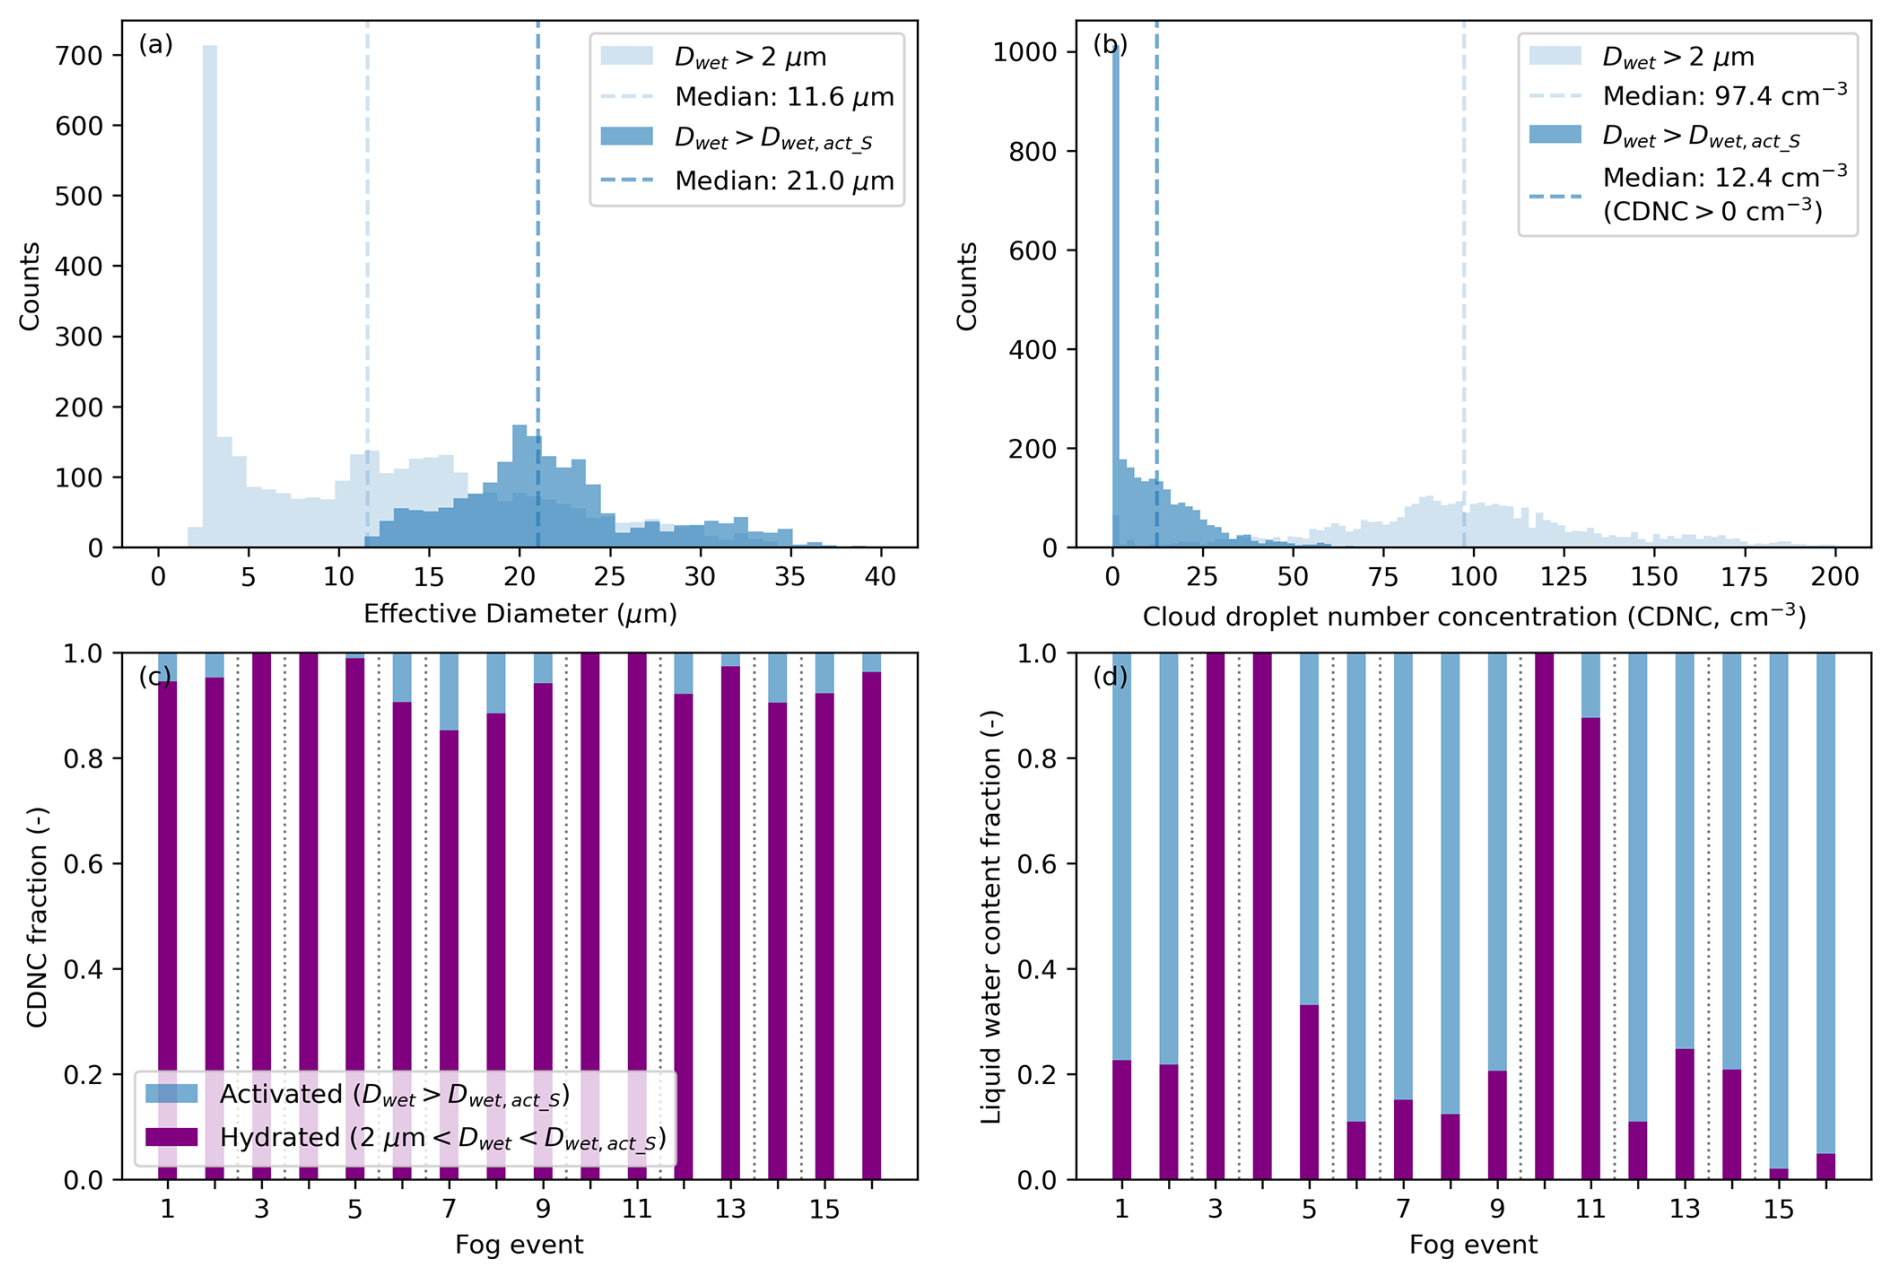
Figure 6Contribution of hydrated aerosol particles to fog microphysical parameters. (a) Effective diameter and (b) cloud droplet number concentration (CDNC) recorded during the entire campaign during fog events. Median (c) CDNC and (d) liquid water content of the fog events. In (b), the peak at CDNC = 0 cm−3 is excluded in the calculation of the median. All data is based on the measurements by the GFAS.
3.3 Influence of hydrated aerosol particles on fog parameters
3.3.1 Impact on size range
Comparing the ED and CDNC for minimum diameter thresholds of 2 µm with minimum thresholds of Dwet,act_S (campaign median Dwet,act_S: 10.1 µm, IQR: 9.1–12.1 µm), we find that the ED increases by 81 % (from 11.6 to 21.0 µm, Fig. 6a), while the CDNC decreases by 87 % (from 97.4 to 12.4 cm−3, Fig. 6b) if only activated particles are considered. These numbers will vary depending on the dry and ambient particle number size distributions, the ratio between unactivated and activated fog times, as well as the droplet growth rate. The mode in the CDNC>2 histogram around 100 cm−3 in Fig. 6b is caused by a close to constant contribution of hydrated aerosol particles. As the hydrated aerosol particles are small but numerous compared to the activated particles (or fog droplets), they contribute on average with 95.0 % to CDNC2 (median, IQR: 91.8 %–99.2 %, Fig. 6c), while their contribution to the LWC2 is only about 21.3 % (median, IQR: 12.1 %–46.8 %, Fig. 6d). A key conclusion from these results therefore is that in polluted environments it is likely that, unless the activation is specifically accounted for, a large fraction of the measured CDNC values are actually contributions from the hydrated haze particles. The contribution of these particles to the liquid water path (LWP) can vary substantially.
To illustrate these non-linear relationships and provide clues into factors driving the contribution of hydrated particles to fog microphysics, we analyzed the sensitivity of the LWC of the hydrated aerosol particles to accumulation mode aerosol number concentration and supersaturation in the range of the values observed during FAIRARI. For this, we used κ–Köhler theory (Eq. 1) with the median chemical composition and size distribution as inputs (Fig. 7). The individual fog events observed during the campaign are also shown, color-coded by the relative difference between water vapor saturation pressure at day-time maximum temperature and night-time minimum temperature as a proxy for local supersaturation. Higher accumulation mode number concentrations lead to a higher LWC, for a constant SS. For a constant accumulation mode number concentration, an increase in the SS first leads to an increase in the corresponding LWC, LWChydr., due to the growth of the hydrated aerosol particles. At an SS of about 0.009 %, however, using κ=0.45, the LWChydr. starts decreasing for increasing SS. This can be explained by the fact that the largest hydrated aerosol particles get activated and, therefore, do not contribute to LWChydr. anymore. Additionally, the sensitivity of LWChydr. to accumulation mode number concentration increases notably as SS decreases. At SS ≈ 0.020 %, increasing the concentration from 1000 to 8000 cm−3 raises LWChydr. by about 400 %. This increase grows to roughly 700 % at SS ≈ 0.015 %, and reaches nearly 1000 % at SS ≈ 0.010 %. Using the measured accumulation mode number concentration and the calculated SScrit (see Eq. 7 and Fig. 4f), we see that during FAIRARI, the LWChydr. was varying between about 0.006 and 0.027 g m−3, the higher values also generally corresponding to the higher accumulation mode number concentrations. Calculated from the GFAS measurements, the quartiles of the event-based LWChydr. vary between 0.001 and 0.021 g m−3. However, it should be noted that SScrit, calculated for the fog events, is highly sensitive to the measurements of the GFAS and the DMPS. Given the comparison between the GFAS and the PVM data, the experimental values of LWChydr. probably represent a lower limit – hence we deem the agreement between the prediction based on the dry particle size distribution and the GFAS-based values satisfactory. The observations also show that for a given accumulation mode number concentration supersaturation increases with the relative difference between water vapor saturation pressure at day-time maximum temperature and night-time minimum temperature, as expected – also giving confidence in the methodology for determining SS. For a given SS, on the other hand, the observations show how the number concentration of particles compensates for changes in the relative vapor pressure difference. This also makes sense as for a given amount of condensable water one would expect lower median saturation ratios for higher particle number concentrations.
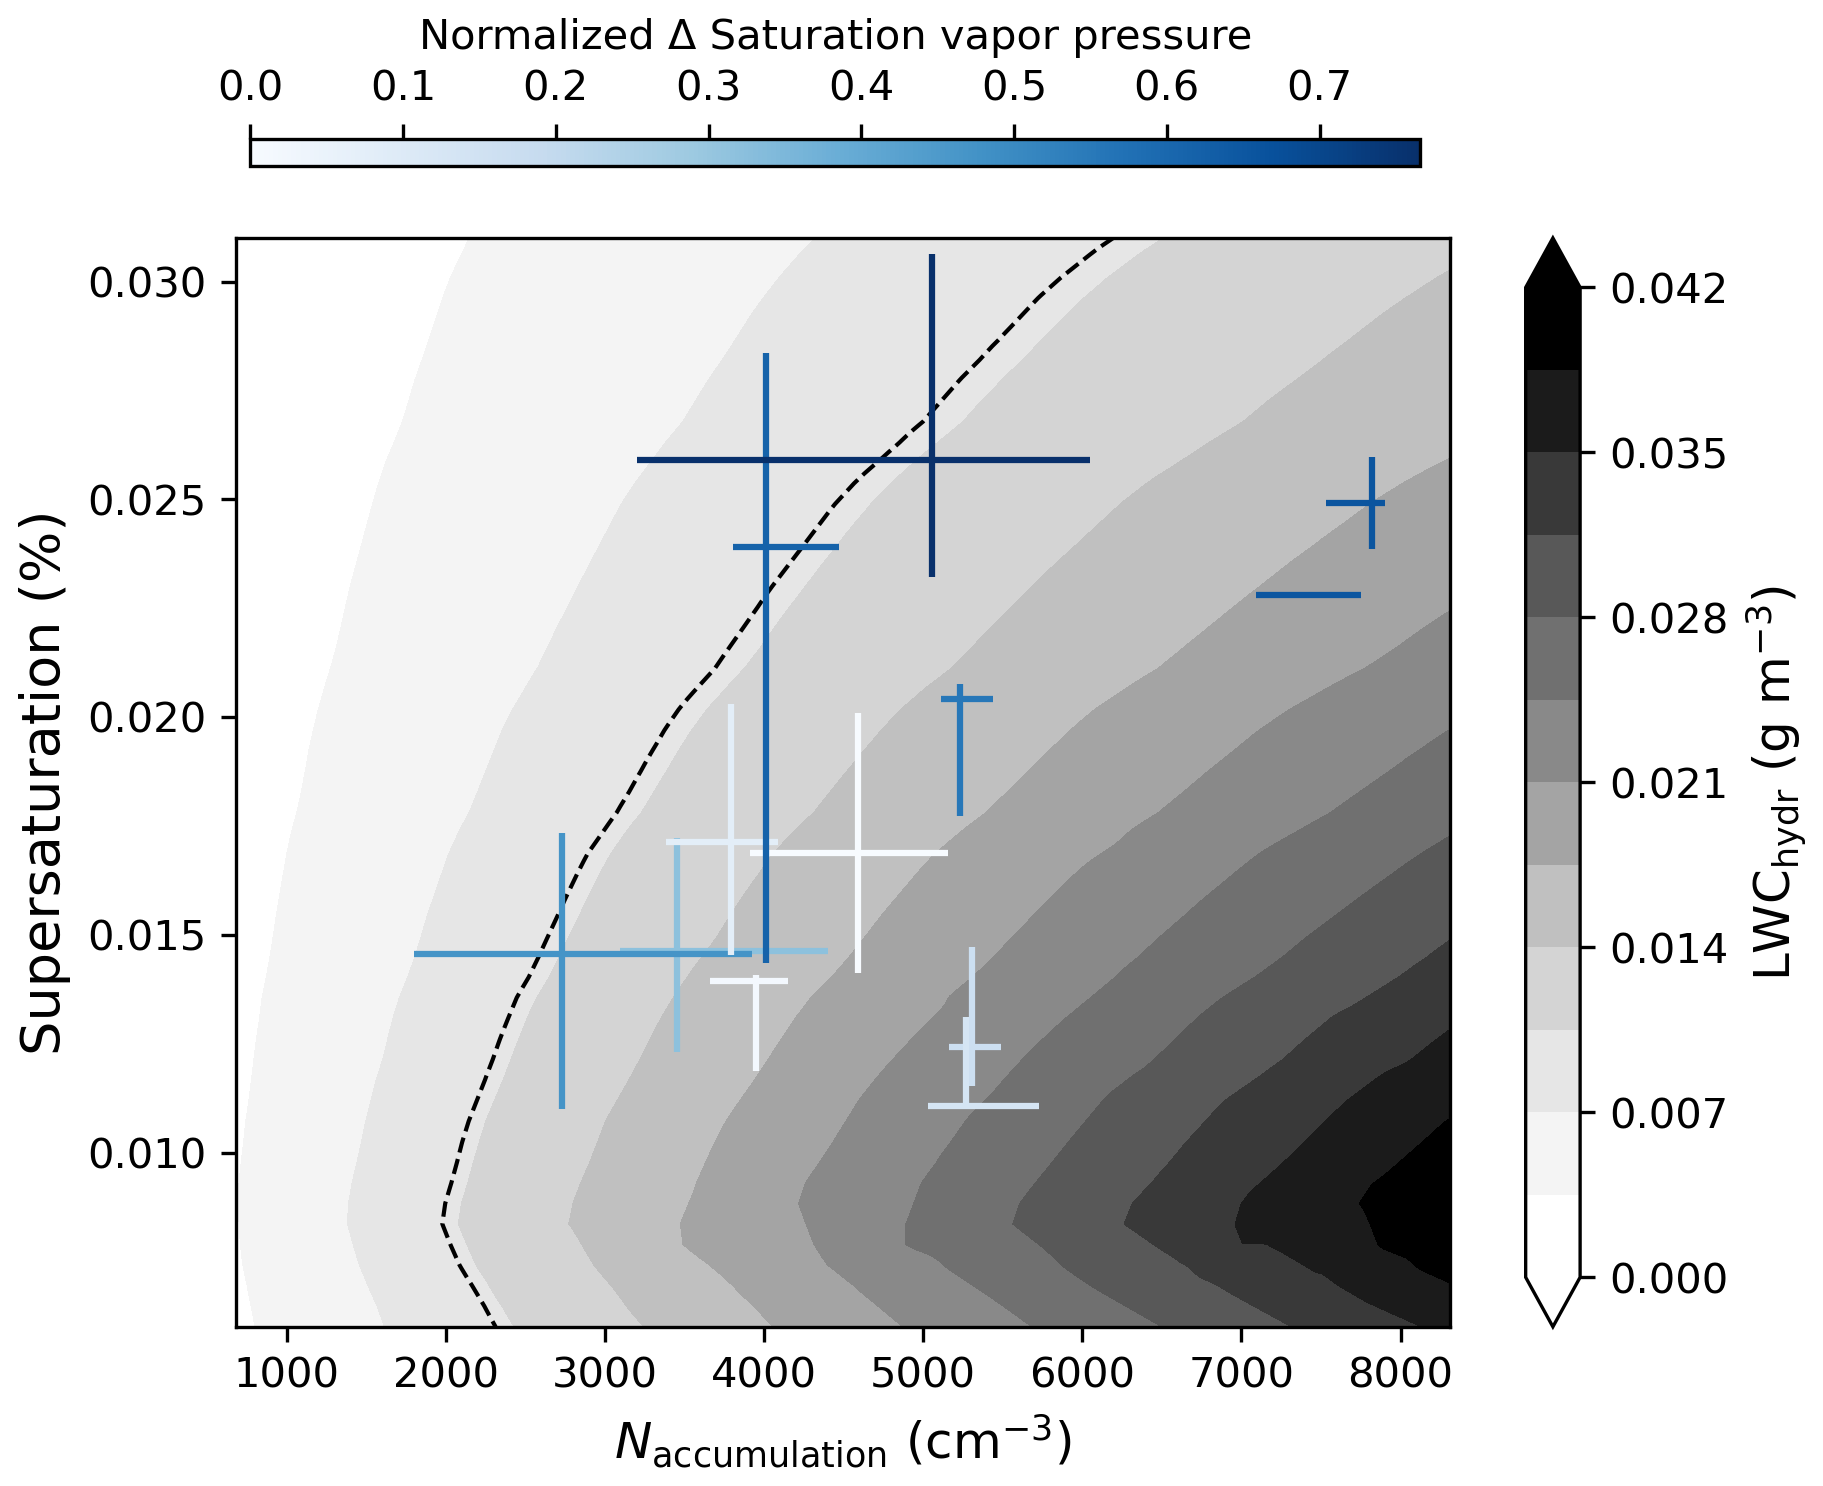
Figure 7Sensitivity of the liquid water content (LWC) of hydrated aerosol particles to the dry particle number concentration in the accumulation mode and the supersaturation derived from κ–Köhler theory, assuming κ=0.45. The measured fog events are shown with 25th and 75th percentiles, color-coded by the normalized difference in saturation vapor pressure between the daytime maximum and the fog-period minimum. The dashed line indicates the transition of LWChydr from 10−3 to 10−2 g m−3, corresponding to a tenfold increase.
The relationships between CDNC, LWC, and ED carry fundamental information about fog microphysics, and are useful for e.g. model evaluation and process parameterization purposes. Given the impact of the hydrated vs. activated particles on CDNC and LWC, these relationships are likely to be affected by the way hydrated aerosols are considered in any respective analysis. A clear positive correlation between CDNC and LWC, with the slope depending on the ED, is expected only when the wet number size distribution is monomodal and ED a useful parameter to describe the size distribution (compare Eqs. 5 and 6). Indeed, excluding the hydrated aerosol particles from our data set and focusing solely on the activated particles () clearly demonstrates such a correlation (Fig. 8). This approach could be applied to any ambient number size distribution dataset to obtain an initial assessment of the impact of hydrated aerosol particles on measured data. The assessment could be particularly useful when in-situ aerosol observations are lacking and a bottom-up calculation of the potential hygroscopic growth of the aerosol particles cannot be performed.
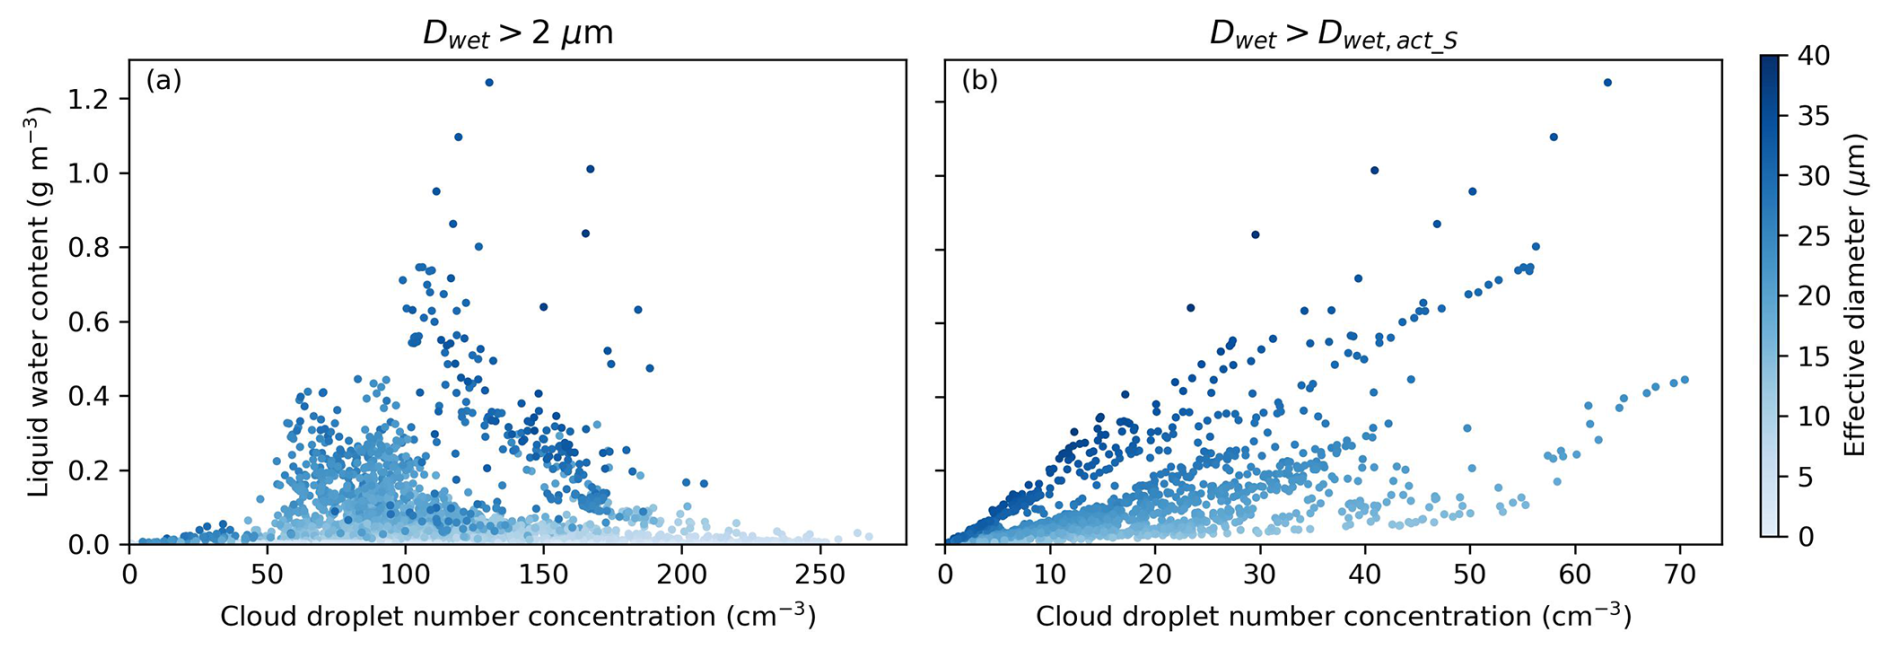
Figure 8Effect of hydrated aerosol particles on relationship between effective diameter (ED), cloud droplet number concentration (CDNC), and liquid water content (LWC). (a) Values are calculated for Dwet>2 µm. (b) Values are calculated for . All data is based on the measurements by the GFAS.
3.3.2 Impact on fog starting time
Hydrated aerosols can also impact the actual onset of fog development as, for example, seen in the comparison of the temporal evolution of ED and CDNC (see Fig. S12 for two example fog events). As expected, the ED is mostly affected in the beginning of the fog events (Fig. S12e and f), when activated particles or droplets are still small and few. The CDNC, on the other hand, is affected throughout the whole event, with an approximately constant offset (Fig. S12g and h), caused by the constant contribution of hydrated aerosol particles (as also seen in Figs. 6 and S13). We therefore analyzed the effect of hydrated aerosol particles on the visibility reduction and thereby the time period defined as fog (unactivated + activated fog). In a first step, we compared the measured visibility with the visibility calculated using the PVM measurements (Eq. 8, Fig. S14). Including all fog times, both unactivated and activated fog, the visibility can be calculated with , using the relationship as proposed by Kunkel (1984). Restricting the fog to periods with LWC > 0.05 g m−3, the visibility can be calculated with . The LWC threshold (>0.05 g m−3), therefore, corresponds to a visibility threshold of about 150 m, while the 1 km visibility threshold corresponds to an LWC threshold of about 0.003 g m−3.
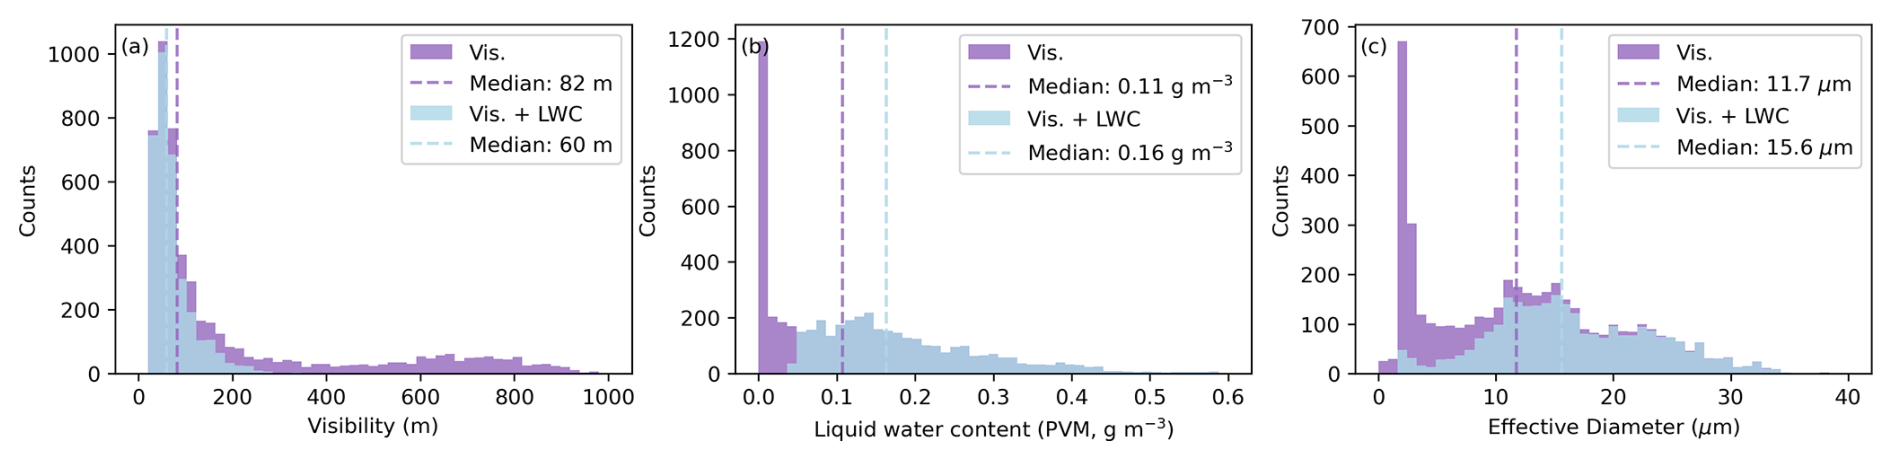
Figure 9Effect of two different fog definitions applied on fog statistics. The commonly used fog definition (vis. <1 km, purple) is compared to the combined definition (vis. <1 km + LWC > 0.05 g m−3, light blue). The LWC is based on the PVM measurements.
Next, we compared the effect of a visibility-based vs. an LWC-based fog definition on different fog parameters, such as visibility, LWC, and ED (Fig. 9). During FAIRARI, analyzing periods with visibility below 1 km, compared to additionally restricting those periods to an LWC > 0.05 g m−3, the median visibility was reduced by 28 %, from about 82 m to about 60 m. The LWC was increased by 52 %, from about 0.11 g m−3 to about 0.16 g m−3, while the ED was increased by 33 %, from about 11.7 µm to about 15.6 µm. The mode at around 700 m in the histogram of the visibility (Fig. 9a, similar to the results by Heintzenberg et al., 1998), the peak at LWC = 0 g m−3 (Fig. 9b), and the low values of ED (Fig. 9c) for the visibility-based fog definition all suggest the influence of hydrated aerosol particles. Adding an LWC threshold seems to exclude those periods of unactivated fog, decreasing the total in-fog time during FAIRARI by about 36 %.
Choosing an LWC-based fog definition instead of a visibility-based one to exclude periods of unactivated fog raises two additional questions: (1) what LWC threshold should be used? and (2) to what extent are the results affected by the choice of instrument used for the LWC measurements? To answer the first question, we compared the three parameters analyzed in Fig. 9 with 20 different thresholds for the LWC. We found that the biggest change in resulting campaign average values of visibility, LWC, and ED happens when applying an LWC threshold of around 0.005 g m−3 to define fog occurrence (Fig. S15). Most likely, this marks the regime in which droplet activation happens, which leads to a large change in the contribution of hydrated vs. activated particles. To answer the second question, we compared the GFAS with the PVM. As the GFAS most likely underestimates the LWC (Fig. S5), a GFAS-based LWC threshold impacts the analyzed parameters even more (Fig. S16). The visibility decreases by 39 % and the LWC and ED increase by 111 % and 73 %, respectively. The observed decline in fog frequency between 1984 and 2012 in the Po Valley when defining fog occurrence using a visibility threshold versus the approximately constant fog frequency when defining fog occurrence using an LWC-threshold (Giulianelli et al., 2014) is most likely an indicator of a reduction in the concentration of hydrated aerosol particles as those contribute to the visibility reduction but not so much to the LWC.
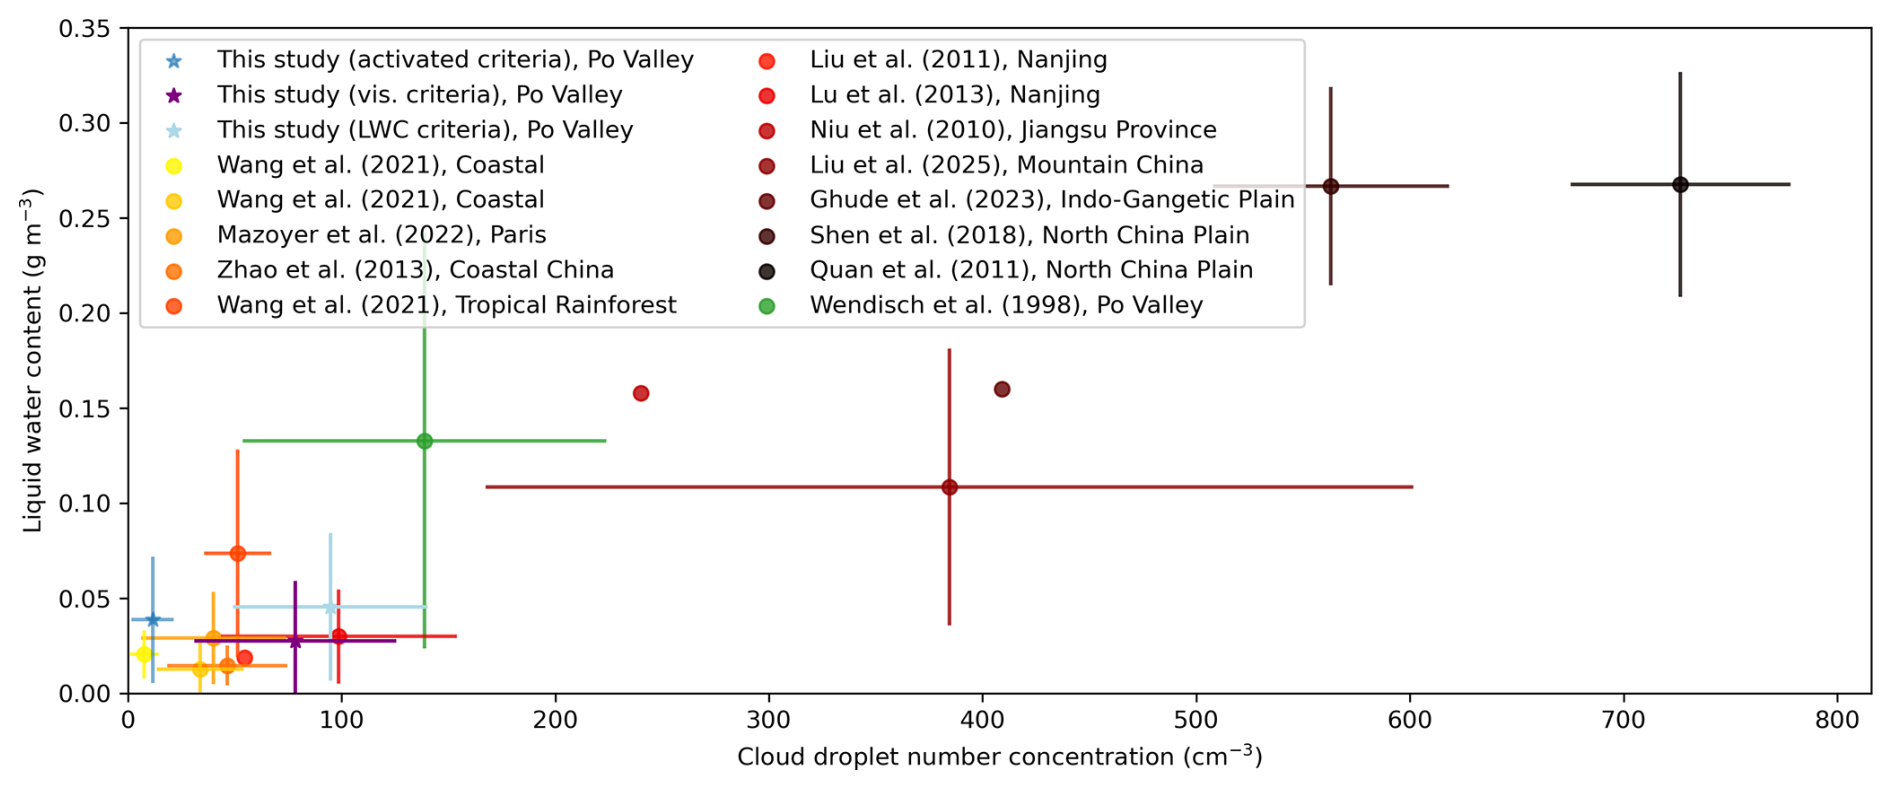
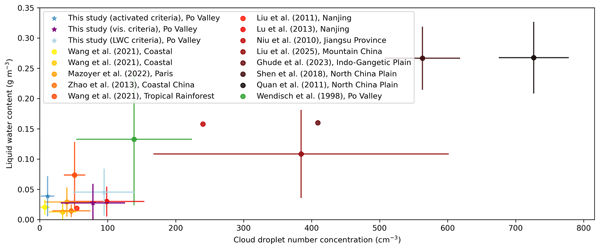
Figure 10Variability of cloud droplet number concentration (CDNC) and liquid water content (LWC) of fog observations in different environments obtained with single-particle cloud probes. This work used a GFAS for assessing the CDNC, whereas Wang et al. (2021a) utilized a CDP 2. All other studies used a FM or FSSP to evaluate the CDNC. The mean of the fog event medians is given as dot, the standard deviation as whiskers.
3.3.3 Importance of hydrated aerosol particles for observational fog data interpretation and fog model evaluation
In the literature, there is a large spread in defining the presence of fog, combining thresholds for visibility, LWC, and/or CDNC (typically calculated for Dwet>2 µm). A visibility-only fog definition was used by Liu et al. (2011), Lu et al. (2013) and Mazoyer et al. (2022), with the difference that Liu et al. (2011) chose 2 km as a threshold, instead of 1 km. A CDNC ≥ 1 cm−3 definition, measured with a CDP 2, was used by Wang et al. (2021a). A combined definition, using CDNC and LWC, was used by Wang et al. (2021b) and Zhao et al. (2013). In their studies, the LWC had to be ≥0.001 g m−3 and the CDNC ≥ 10 cm−3 and ≥1 cm−3, respectively. Niu et al. (2010) define fog by a sharp increase in CDNC, but no quantitative criterion for fog occurrence is provided. Ghude et al. (2023) report the average of a dense fog event with visibility < 200 m. As can be seen in Fig. 10, the observed key microphysical parameters, LWC and CDNC, cover a large range between the different investigated sites but also show a large temporal variation within each study, ranging from a few tens to several hundreds of fog droplets with LWC-values from around 0.01 g m−3 to over 0.3 g m−3.
Compared to other fog studies, our CDNC and LWC values align well with those of Lu et al. (2013), who investigated fog in Nanjing, China. This might be due to a similar contribution of hydrated aerosol particles as the wet size distribution and the CDNC vs. LWC relationship suggest. Interestingly, Wendisch et al. (1998) measured more than 25 years earlier at the same site in autumn much higher CDNC and LWC but with higher variability (throughout one month). Studies at more remote locations, such as coastal sites or within rainforests (Zhao et al., 2013; Wang et al., 2021a, b), generally report lower values for CDNC and LWC. Some studies in China (Niu et al., 2010; Shen et al., 2018), in turn, have observed approximately five times higher values for CDNC and LWC than those found in the current work. This is most likely due to a similar hygroscopicity of the aerosol but larger aerosol number concentrations (about 16 000 cm−3 for Ddry: 10–700 nm, Shen et al., 2018). Part of the differences in the fog microphysical parameters can be explained by differences in the encountered fog (i.e. temporal, spatial, and seasonal differences among the various studies), as well as e.g. technical reasons and differences within the used fog or cloud probes (incl. data processing and applying or non-applying of loss corrections) (Spiegel et al., 2012; Guyot et al., 2015). Another important reason is the varying practice in reporting the contribution of hydrated but not activated aerosol particles to LWC and CDNC. During FAIRARI, we saw a contribution of about 85 cm−3 hydrated aerosol particles to an average CDNC2 of about 100 cm−3, shifting the values from being close to measurements in Nanjing to being close to values measured at a coastal cite (Fig. 10). For comparison, Shen et al. (2018) report a contribution of hydrated aerosol particles to CDNC of about 200 cm−3, but their total CDNC is much higher (around 600 cm−3). In contrast, Mazoyer et al. (2019) find a much smaller contribution of about 8 cm−3, with a total CDNC of around 61 cm−3. Together, these inconsistencies make the comparison of the different studies challenging, impacting the development of numerical models for fog forecasting (e.g. Boutle et al., 2018).
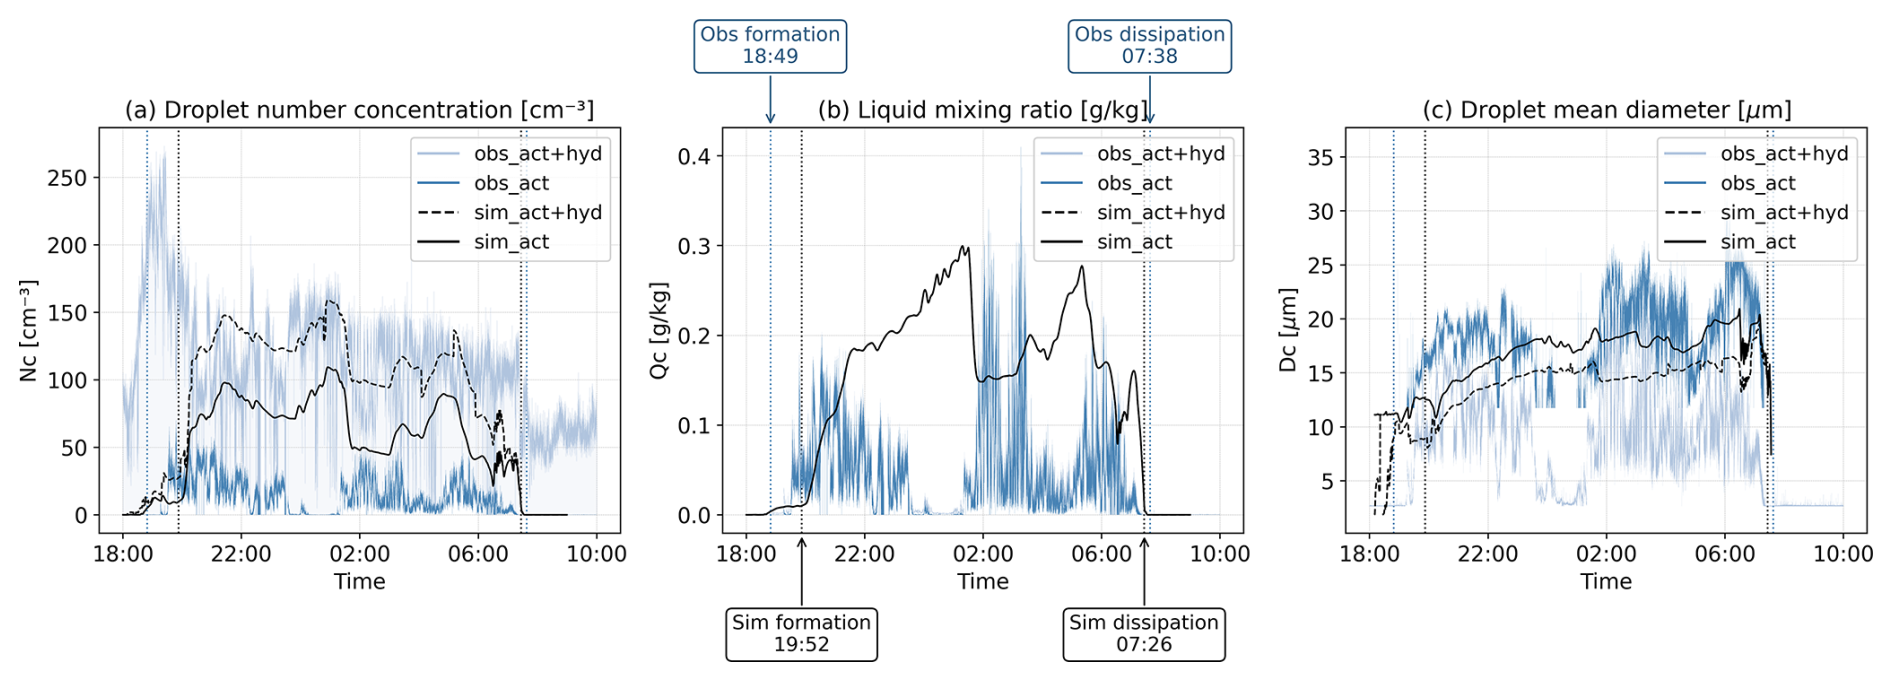
Figure 11Time series of (a) droplet number concentration, (b) liquid water mixing ratio, and (c) droplet mean diameter from observations (obs) and simulations (sim) for the fog event on 18–19 February 2022, where “act” refers to activated particles (droplets) only and “act + hyd” includes both activated particles and hydrated aerosols. Vertical dashed lines indicate fog formation and dissipation times, which are determined based on a threshold of 0.01 g kg−1 in the liquid water mixing ratio.
Hydrated aerosol particles also should be accounted for when comparing in situ observations with simulation results (Fig. 11). Regarding microphysical properties, MIMICA overestimated both the number concentration of activated particles (droplets) and LWC, as is common in models adopting bulk microphysics schemes. However, the simulated mean droplet diameter aligned well with observations. Accounting for hydrated aerosols formed through hygroscopic growth in the microphysical analysis improved the agreement between simulated and observed droplet number concentrations and droplet diameters.
3.4 Influence of hydrated aerosol particles on aerosol–fog relationships
We have shown that the aerosol particles during FAIRARI grew into the size range of particles typically considered to be activated, impacting fog microphysical parameters. In the following, we therefore analyze the extent to which aerosol–fog relationships are impacted by hydrated aerosol particles.
When analyzing the variability of the aerosol and fog properties during the whole campaign, the ED shows the clearest correlation to both the dry aerosol number concentration above the average dry activation diameter, N>503 (Fig. 12), and the proxy for condensable water vapor increase with respect to the maximum air temperature before fog onset (Fig. S17). N>503 and ED are negatively correlated with a weaker correlation when the hydrated aerosol particles are excluded (Spearman correlation of −0.56 and −0.37, respectively, Fig. 12a and b). This implies that more large dry aerosol particles lead to smaller wet particles, which, however, is strongly influenced by the large number of small hydrated but unactivated particles. For the CDNC, it is the opposite: N>503 is not significantly correlated with CDNC2 and becomes weakly positive correlated if the hydrated aerosol particles are excluded (Spearman correlation with CDNCact: 0.11, Fig. 12c and d). It is expected that the number concentration of particles above the dry activation diameter is strongly correlated with the number concentration of activated particles. That this is not the case for our observations (Fig. 12d) could be e.g. due to variations in the dry activation diameter, which is not accounted for when using N>503 and a stronger temporal variability of CDNC compared to ED (see also Fig. S12e–h). The proxy for the available condensable vapor es,max−es is also mostly correlated with the ED, also here weaker when the hydrated particles are excluded (Spearman correlation of 0.47 and 0.40, respectively, Fig. S17a and b). The correlation of the proxy and the LWC is consistent with the correlation with ED (Fig. S17a, b, e, and f). Also here, the CDNC shows only weak correlation (Fig. S17c and d), indicating that other factors (e.g. loss processes and other cloud microphysics, or advection and turbulence) drive the CDNC variability in the observed time scales – however, also bearing in mind the measurement uncertainties.
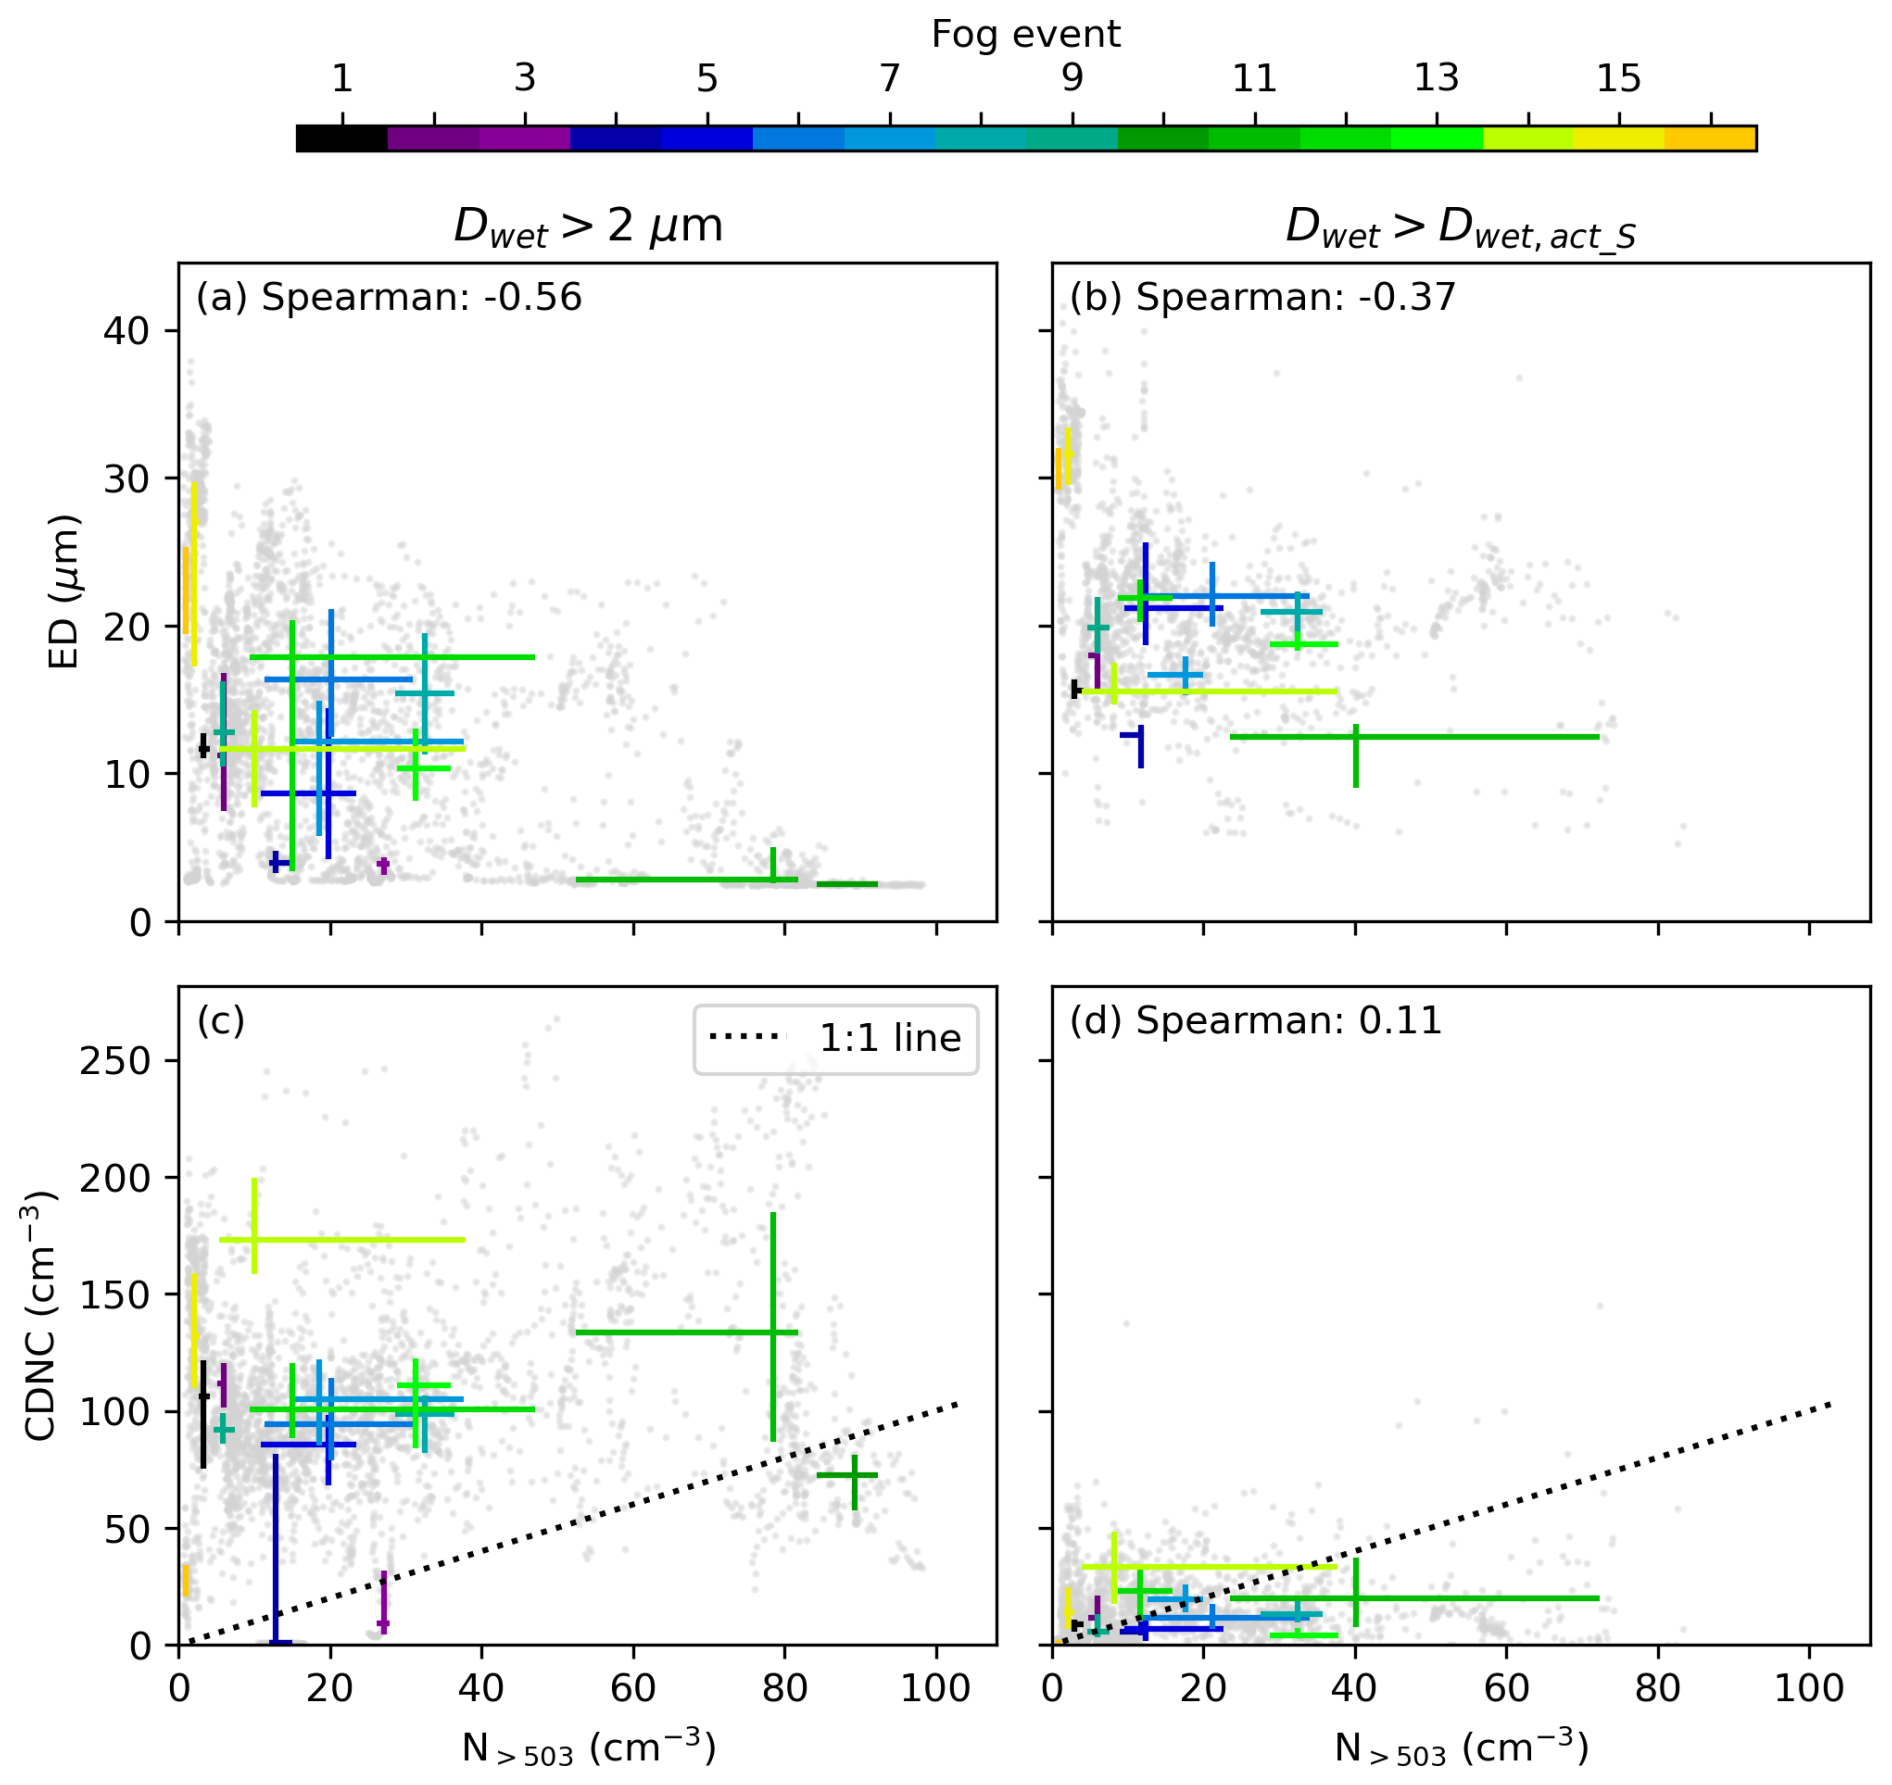
Figure 12Relationships between dry aerosol and fog properties. (a, b) effective diameter (ED), (c, d) cloud droplet number concentration (CDNC) versus aerosol number concentration above 503 nm. The left panels denote values when ED or CDNC are calculated from Dwet>2 µm, while the right panels denote the same but for values above the wet activation diameter Dwet,act_S. The interquartile ranges of the fog events are shown, color-coded by the number of the fog events. The Spearman correlation is based on all underlying data points (grey dots) and given if p<0.01. The data is based on 1-min averages.
Looking at the activated particles or droplets, we find that our results compare well with those by Mazoyer et al. (2019), who also found no clear correlation between and CDNCact but are in contrast to Ramanathan et al. (2001) who found a positive correlation between and CDNCact based on aircraft measurements of clouds. One reason for the contrasting results to Ramanathan et al. (2001) could be the much lower aerosol number concentrations and most likely higher supersaturations that are measured in clouds compared to fog – as well as the vicinity of the ground surface which is an additional source and sink for particles, droplets, water, and other trace species. The effect of the hydrated aerosol particles on those aerosol–fog relationships, on the other hand, has to our knowledge not been analyzed yet and can therefore not be compared with other studies.
This study analyzed the interactions between aerosol particle populations and measured fog microphysics. In particular, we demonstrated the significant influence of hydrated aerosol particles on fog microphysical parameters in the Italian Po Valley observed during the FAIRARI campaign in spring 2022.
We showed that the dry particle number size distribution, especially the upper tail of the distribution, drives the variability of CCN for the fog droplets, given the dry activation diameters between about 400 and 700 nm. This was also confirmed by LES modeling investigating the sensitivity of predicted cloud droplet number concentration (CDNC) to the aerosol number size distribution and composition. The variability in the size distribution had a large impact on simulated CDNC and liquid water content (LWC), emphasizing the critical role of size-resolved measurements of aerosol size and concentration for accurate fog modeling. Both the number concentrations of aerosol particles and the estimated supersaturations were lower during the FAIRARI campaign as compared with a previous campaign conducted in the late 1980s, offering therefore some explanation to the declining trends in fog occurrence in this area. The chemical composition of the aerosol particles was, on the other hand, relatively constant throughout the measurement period and therefore of smaller importance in driving any variability in CDNC. The chemical composition is, however, what drives the aerosol hygroscopicity. In the nitrate-rich environment of the Po Valley, the measured hygroscopicity parameters were relatively high, the medians ranging from about 0.35 for the bulk aerosol composition to the 0.45 for the fog residuals. The difference in these hygroscopicity values indicates some degree of external mixing, but also demonstrates the importance of hygroscopicity for activation. The wet activation diameters varied around 10 µm.
We quantified the aerosol hygroscopic growth and fog droplet activation using in-situ measurements, κ–Köhler theory, and large-eddy simulations. We found, with an average hygroscopicity of κ=0.34, that particles grow substantially with increasing relative humidity, with large particles reaching sizes typically associated with activation even under subsaturated conditions, highlighting the blurry boundary between hydrated particles and activated particles. We furthermore demonstrated that hydrated aerosol particles can significantly influence fog microphysical parameters such as effective diameter (ED), CDNC, and LWC, which contributed up to 81 % to the ED, 87 % to the CDNC, and 21 % to the LWC, when using a 2 µm threshold as lower particle diameter. Thus, misclassifying hydrated particles as activated fog droplets can lead to a significant under- or overprediction of ED, CDNC, and LWC – in studies where the thermodynamic state of the droplets is of relevance. The presence of hydrated particles affects also the definition of fog occurrence and the interpretation of fog observations using the visibility-based threshold only, especially in polluted regions with low supersaturations. These results provide important background against which interactions between e.g. aerosol particle number concentrations, CDNC, and the drivers of supersaturation and liquid water path should be evaluated. In our case, the interlinkages between the droplet effective radius, liquid water content, and aerosol concentrations could be established, once the distinction between hydrated haze and activated particles (or fog droplets) was established. The variability in the CDNC was, however, primarily driven by other factors – most likely a mixture of various microphysical processes in addition to the availability of cloud condensation nuclei. These findings also highlight the importance of understanding the interactions between fog and the land surface – which generally complicates the interpretation of observational data in comparison with airborne observations of clouds. Overall, our findings emphasize the importance of distinguishing between hydrated and activated aerosol particles in both field observations and model evaluations. The distinction is crucial for improving fog prediction, interpreting long-term fog and visibility trends, and refining aerosol–fog interaction frameworks in regions impacted by high air pollution.
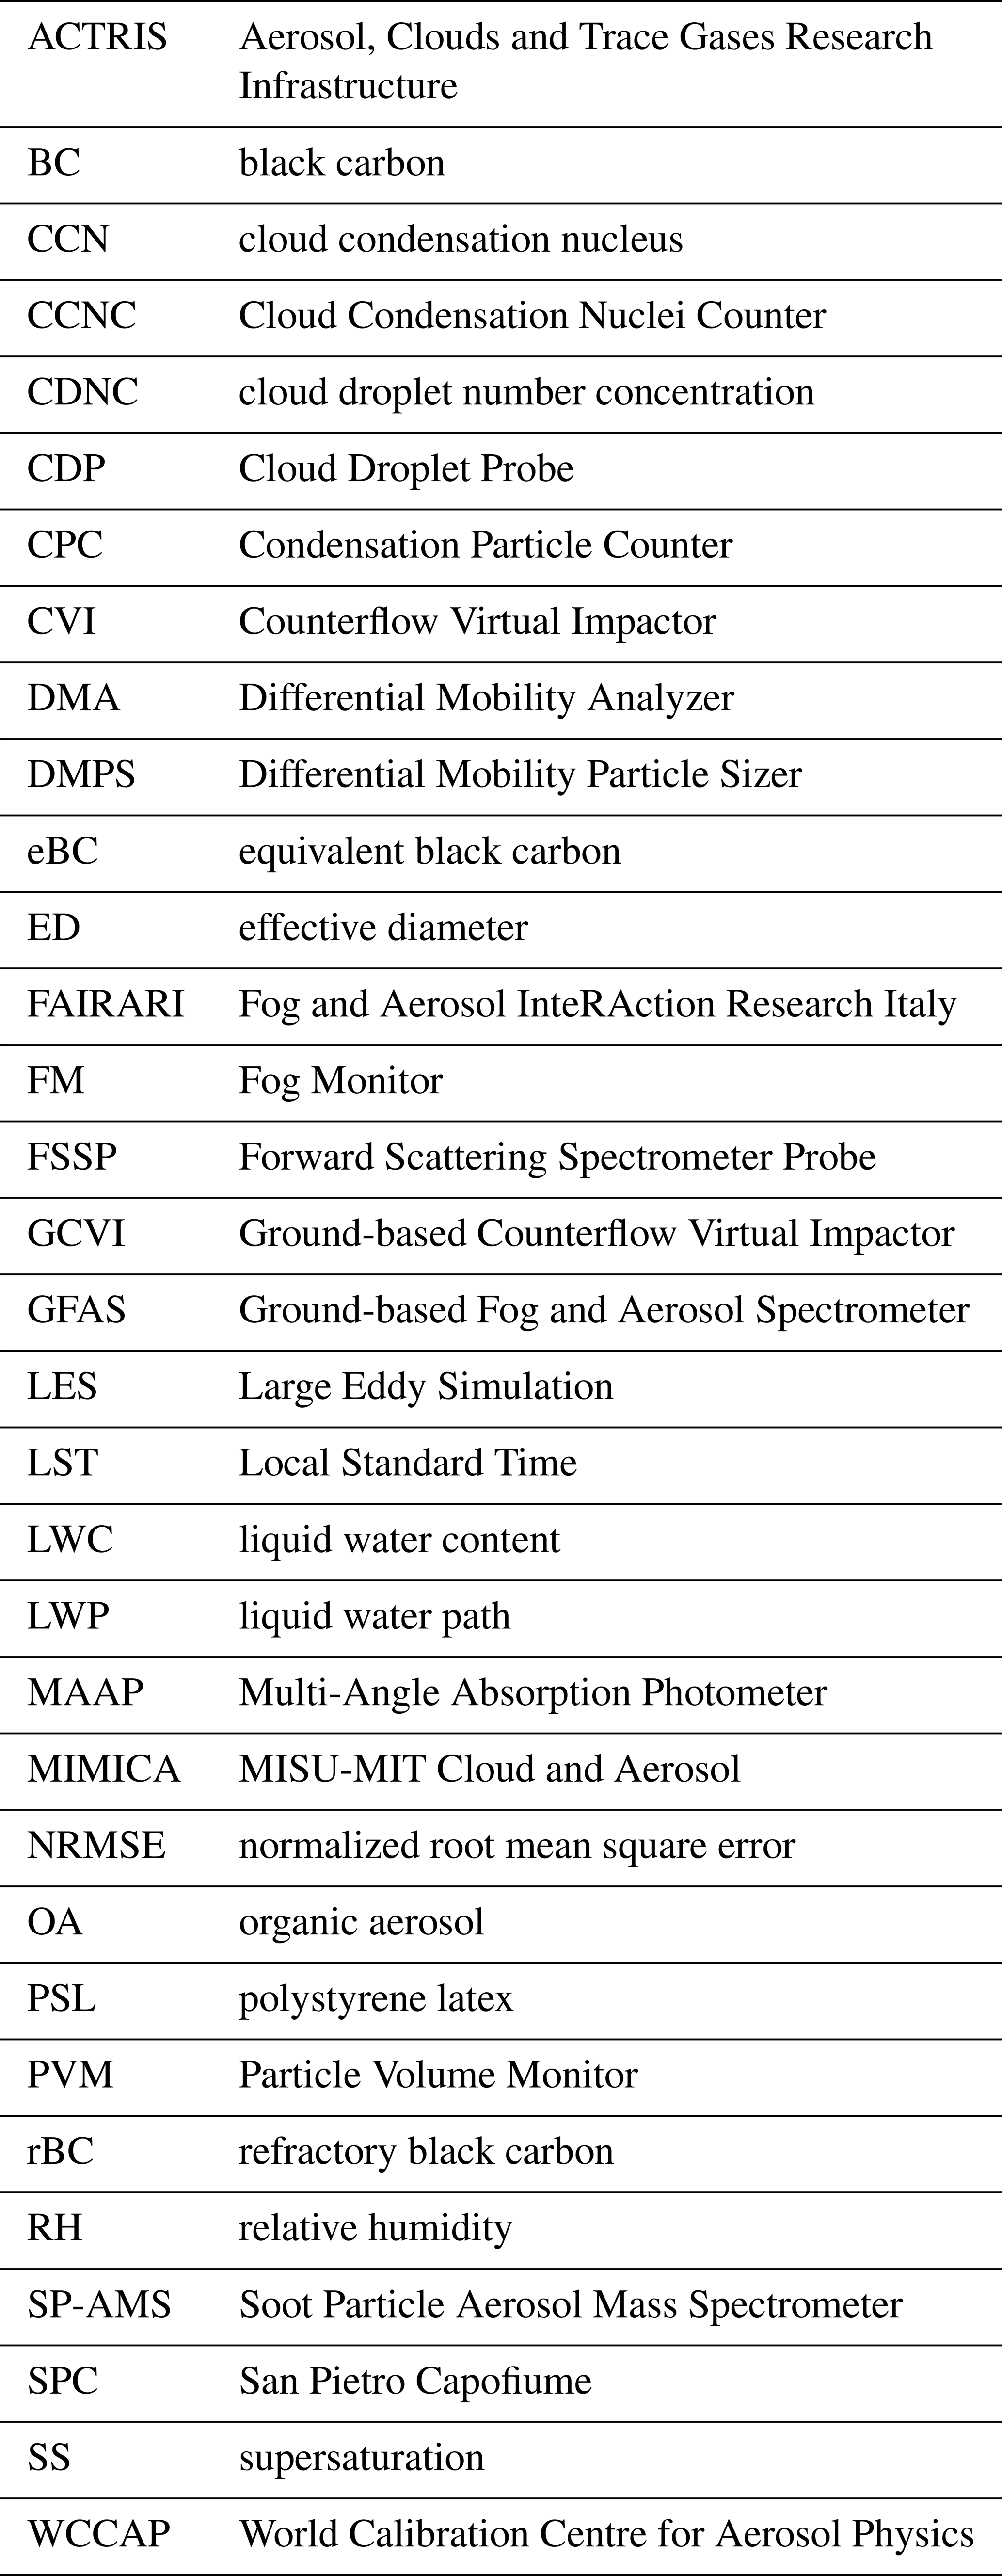
The data are available on the Data Centre of the Bolin Centre for Climate Research (see https://bolin.su.se/data/fairari-2021-2022-3 (last access: 23 June 2026) for an overview of all FAIRARI data). The individual datasets used here are:
-
SP-AMS: https://doi.org/10.17043/fairari-2021-2022-aerosol-spams-1 (Mattsson et al., 2025b)
-
AMS: https://doi.org/10.17043/fairari-2021-2022-aerosol-chemical-pm25-1 (Rinaldi et al., 2026)
-
DMPS: https://doi.org/10.17043/fairari-2021-2022-aerosol-dmps1-1 (Neuberger et al., 2024a)
-
MAAP1: https://doi.org/10.17043/fairari-2021-2022-aerosol-ebc-pm25-1 (Paglione et al., 2026a)
-
MAAP2: https://doi.org/10.17043/fairari-2021-2022-aerosol-maap2-1 (Neuberger et al., 2024b)
-
Meteorological and visibility data: https://doi.org/10.17043/fairari-2021-2022-meteorological-1 (Paglione et al., 2026b)
-
GFAS: https://doi.org/10.17043/fairari-2021-2022-droplet-size-1 (Neuberger et al., 2026a)
-
PVM: https://doi.org/10.17043/fairari-2021-2022-lwc-1 (Paglione et al., 2026c)
-
CCNC: https://doi.org/10.17043/fairari-2021-2022-ccn-concentrations-1 (Neuberger et al., 2026b)
-
LES model outputs: https://doi.org/10.17043/fairari-2021-2022-les1-1 (Ding et al., 2025).
The MIMICA model code is available via https://bitbucket.org/matthiasbrakebusch/mimicav5/src/master (last access: 23 June 2026). The codes used to process data and generate most of the figures can be accessed at https://doi.org/10.5281/zenodo.21967941 (Zieger, 2026).
The supplement related to this article is available online at https://doi.org/10.5194/acp-26-11991-2026-supplement.
Conceptualization: AN, SD, CM, IR and PZ; Data curation: AN, RR, HD, FM, LH, SD, CM, MP, MR and PZ; Formal analysis: AN, RR, HD, FM, LH, MP and MR; Funding acquisition: SD, AE and IR; Investigation: AN, RR, HD, FM, LH, SD, AE, CM, MP, IR, MR and PZ; Methodology: AN, RR, HD, FM, LH, SD, AE, CM, MP, IR, MR and PZ; Project administration: AN, SD, AE, CM, IR and PZ; Resources: DB, SD, AE, DH, IR and PZ; Software: AN, RR, HD, FM, LH, DB, AE, MP and MR; Supervision: AE, CM, IR and PZ; Validation: DB and DH; Visualization: AN, RR and HD; Writing – Original Draft: AN, RR, HD, AE, IR and PZ; Writing – Review & Editing: AN, RR, HD, FM, LH, DB, SD, AE, DH, CM, MP, IR, MR and PZ.
At least one of the (co-)authors is a member of the editorial board of Atmospheric Chemistry and Physics. The peer-review process was guided by an independent editor, and the authors also have no other competing interests to declare.
Publisher's note: Copernicus Publications remains neutral with regard to jurisdictional claims made in the text, published maps, institutional affiliations, or any other geographical representation in this paper. The authors bear the ultimate responsibility for providing appropriate place names. Views expressed in the text are those of the authors and do not necessarily reflect the views of the publisher.
We thank Tabea Hennig, Kai Rosman, Birgitta Noone, and Zhara Hamzavi for their technical and logistical support in the preparation of the campaign. Acknowledgments are given to Luca Di Liberto and David Hadden for their excellent technical support in the field. AI has been used to assist in coding and for minor language improvements.
Financial support from the European Union's Horizon 2020 research and innovation programme (Project FORCeS under Grant Agreement 821205), European Research Council (Consolidator Grant INTEGRATE 865799), the Knut and Alice Wallenberg Foundation (grants 2021.0169 and 2021.0298), and the Swedish Research Council (2020-04158) is gratefully acknowledged. The computations and data handling in MIMICA were enabled by resources provided by the National Academic Infrastructure for Supercomputing in Sweden (NAISS), partially funded by the Swedish Research Council (2022-06725). This article is part of a project supported by the European Commission under the Horizon 2020 – Research and Innovation Framework Programme, H2020-INFRAIA-2020-1, Grant Agreement 101008004, which supported transnational access to the San Pietro Capofiume measurement site.
This paper was edited by Birgit Wehner and reviewed by Iva Hunova and one anonymous referee.
Baguskas, S. A., Still, C. J., Fischer, D. T., D'Antonio, C. M., and King, J. Y.: Coastal fog during summer drought improves the water status of sapling trees more than adult trees in a California pine forest, Oecologia, 181, 137–148, https://doi.org/10.1007/s00442-016-3556-y, 2016. a
Balmes, J. R., Fine, J. M., Gordon, T., and Sheppard, D.: Potential bronchoconstrictor stimuli in acid fog, Environ. Health Perspect., 79, 163–166, https://doi.org/10.1289/ehp.8979163, 1989. a
Baumgardner, D., Avallone, L., Bansemer, A., Borrmann, S., Brown, P., Bundke, U., Chuang, P. Y., Cziczo, D., Field, P., Gallagher, M., Gayet, J.-F., Heymsfield, A., Korolev, A., Krämer, M., McFarquhar, G., Mertes, S., Möhler, O., Lance, S., Lawson, P., Petters, M. D., Pratt, K., Roberts, G., Rogers, D., Stetzer, O., Stith, J., Strapp, W., Twohy, C., and Wendisch, M.: IN SITU, AIRBORNE INSTRUMENTATION: Addressing and Solving Measurement Problems in Ice Clouds, B. Am. Meteorol. Soc., 93, ES29–ES34, 2012. a
Bhandari, J., China, S., Chandrakar, K. K., Kinney, G., Cantrell, W., Shaw, R. A., Mazzoleni, L. R., Girotto, G., Sharma, N., Gorkowski, K., Gilardoni S., Decesari S., Facchini M. C., Zanca N., Pavese G., Esposito F., Dubey M. K., Aiken A. C., Chakrabarty R. K., Moosmüller H., Onasch T. B., Zaveri R. A., Scarnato B. V., Fialho P., and Mazzoleni C.: Extensive soot compaction by cloud processing from laboratory and field observations, Sci. Rep., 9, 11824, https://doi.org/10.1038/s41598-019-48143-y, 2019. a
Bigi, A. and Ghermandi, G.: Trends and variability of atmospheric PM2.5 and PM10–2.5 concentration in the Po Valley, Italy, Atmos. Chemi. Phys., 16, 15777–15788, https://doi.org/10.5194/acp-16-15777-2016, 2016. a
Boutle, I., Price, J., Kudzotsa, I., Kokkola, H., and Romakkaniemi, S.: Aerosol–fog interaction and the transition to well-mixed radiation fog, Atmos. Chem. Phys. 18, 7827–7840, https://doi.org/10.5194/acp-18-7827-2018, 2018. a
Boutle, I., Angevine, W., Bao, J.-W., Bergot, T., Bhattacharya, R., Bott, A., Ducongé, L., Forbes, R., Goecke, T., Grell, E., Hill, A., Igel, A. L., Kudzotsa, I., Lac, C., Maronga, B., Romakkaniemi, S., Schmidli, J., Schwenkel, J., Steeneveld, G.-J., and Vié, B.: Demistify: a large-eddy simulation (LES) and single-column model (SCM) intercomparison of radiation fog, Atmos. Chem. Phys., 22, 319–333, https://doi.org/10.5194/acp-22-319-2022, 2022. a, b
Costabile, F., Decesari, S., Vecchi, R., Lucarelli, F., Curci, G., Massabò, D., Rinaldi, M., Gualtieri, M., Corsini, E., Menegola, E., Canepari, S., Massimi, L., Argentini, S., Busetto, M., Di Iulio, G., Di Liberto, L., Paglione, M., Petenko, I., Russo, M., Marinoni, A., Casasanta, G., Valentini, S., Bernardoni, V., Crova, F., Valli, G., Forello, A. C., Giardi, F., Nava, S., Pazzi, G., Prati, P., Vernocchi, V., La Torretta, T., Petralia, E., Stracquadanio, M., Zanini, G., Melzi, G., Nozza, E., Iulini, M., Caruso, D., Cioffi, L., Imperato, G., Giavarini, F., Battistoni, M., Di Renzo, F., Frezzini, M. A., Perrino, C., and Facchini, M. C.: On the Redox-Activity and Health-Effects of Atmospheric Primary and Secondary Aerosol: Phenomenology, Atmosphere, 13, https://doi.org/10.3390/atmos13050704, 2022. a
Daellenbach, K. R., Uzu, G., Jiang, J., Cassagnes, L.-E., Leni, Z., Vlachou, A., Stefenelli, G., Canonaco, F., Weber, S., Segers, A., Kuenen J. J. P., Schaap M., Favez O., Albinet A., Aksoyoglu S., Dommen J., Baltensperger U., Geiser M., El Haddad I., Jaffrezo J.-L., and Prévôt A. S. H.: Sources of particulate-matter air pollution and its oxidative potential in Europe, Nature, 587, 414–419, 2020. a
Deardorff, J. W.: Three-dimensional numerical study of turbulence in an entraining mixed layer, Bound.-Lay. Meteorol., 7, 199–226, 1974. a
DeCarlo, P. F., Kimmel, J. R., Trimborn, A., Northway, M. J., Jayne, J. T., Aiken, A. C., Gonin, M., Fuhrer, K., Horvath, T., Docherty, K. S., Worsnop, D. R., and Jimenez, J. L.: Field-Deployable, High-Resolution, Time-of-Flight Aerosol Mass Spectrometer, Anal. Chem., 78, 8281–8289, https://doi.org/10.1021/ac061249n, 2006. a
Decesari, S., Sowlat, M. H., Hasheminassab, S., Sandrini, S., Gilardoni, S., Facchini, M. C., Fuzzi, S., and Sioutas, C.: Enhanced toxicity of aerosol in fog conditions in the Po Valley, Italy, Atmos. Chem. Phys., 17, 7721–7731, https://doi.org/10.5194/acp-17-7721-2017, 2017. a, b
Ding, H., Neuberger, A., Ranjan, R., Mattsson, F., Haberstock, L., Baumgardner, D., Decesari, S., Ekman, A. M. L., Hughes, D., Mohr, C., Paglione, M., Riipinen, I., Rinaldi, M., and Zieger, P.: Large-eddy simulation outputs of radiation fog events during the FAIRARI campaign, Po Valley, Italy, February 2022, Dataset version 1, Bolin Centre Database [data set], https://doi.org/10.17043/fairari-2021-2022-les1-1, 2025. a
Ding, H., Neuberger, A., Ranjan, R., Mattsson, F., Heikkinen, L., Mansour, K., Decesari, S., Mohr, C., Pérez, A. B., Mastroianni, N., Zieger, P., Riipinen, I., and Ekman, A. M. L.: The Importance of Aerosol and Droplet Microphysics for the Properties and Life Cycle of Radiation Fog in the Po Valley, EGUsphere [preprint], https://doi.org/10.5194/egusphere-2025-6435, 2026. a
EEA: Air Quality in Europe 2020 – Report No 09/20, Tech. rep., European Environment Agency, https://www.eea.europa.eu//publications/air-quality-in-europe-2020-report (last access: 23 June 2026), 2020. a
Egli, S., Thies, B., and Bendix, J.: A spatially explicit and temporally highly resolved analysis of variations in fog occurrence over Europe, Q. J. Roy. Meteorol. Soc., 145, 1721–1740, https://doi.org/10.1002/qj.3522, 2019. a
Ekman, A. M. L., Wang, C., Stróm, J., and Krejci, R.: Explicit Simulation of Aerosol Physics in a Cloud-Resolving Model: Aerosol Transport and Processing in the Free Troposphere, J. Atmos. Sci., 63, 682–696, https://doi.org/10.1175/JAS3645.1, 2006. a
Elias, T., Haeffelin, M., Drobinski, P., Gomes, L., Rangognio, J., Bergot, T., Chazette, P., Raut, J.-C., and Colomb, M.: Particulate contribution to extinction of visible radiation: Pollution, haze, and fog, Atmos. Res., 92, 443–454, https://doi.org/10.1016/j.atmosres.2009.01.006, 2009. a
Elias, T., Dupont, J.-C., Hammer, E., Hoyle, C. R., Haeffelin, M., Burnet, F., and Jolivet, D.: Enhanced extinction of visible radiation due to hydrated aerosols in mist and fog, Atmos. Chem. Phys., 15, 6605–6623, https://doi.org/10.5194/acp-15-6605-2015, 2015. a
Facchini, M. C., Fuzzi, S., Zappoli, S., Andracchio, A., Gelencsér, A., Kiss, G., Krivácsy, Z., Mészáros, E., Hansson, H.-C., Alsberg, T., and Zebühr, Y.: Partitioning of the organic aerosol component between fog droplets and interstitial air, J. Geophys. Res.-Atmos., 104, 26821–26832, https://doi.org/10.1029/1999JD900349, 1999. a
Facchini, M. C., Decesari, S., Rinaldi, M., Carbone, C., Finessi, E., Mircea, M., Fuzzi, S., Moretti, F., Tagliavini, E., Ceburnis, D., and O'Dowd, C. D.: Important Source of Marine Secondary Organic Aerosol from Biogenic Amines, Environ. Sci. Technol., 42, 9116–9121, https://doi.org/10.1021/es8018385, 2008. a
Fernando, H. J. S., Gultepe, I., Dorman, C., Pardyjak, E., Wang, Q., Hoch, S. W., Richter, D., Creegan, E., Gaberšek, S., Bullock, T., Hocut, C., Chang, R., Alappattu, D., Dimitrova, R., Flagg, D., Grachev, A., Krishnamurthy, R., Singh, D. K., Lozovatsky, I., Nagare, B., Sharma, A., Wagh, S., Wainwright, C., Wroblewski, M., Yamaguchi, R., Bardoel, S., Coppersmith, R. S., Chisholm, N., Gonzalez, E., Gunawardena, N., Hyde, O., Morrison, T., Olson, A., Perelet, A., Perrie, W., Wang, S., and Wauer, B.: C-FOG: Life of Coastal Fog, B. Am. Meteorol. Soc., 102, E244–E272, https://doi.org/10.1175/BAMS-D-19-0070.1, 2021. a
Frank, G., Martinsson, B. G., Cederfelt, S.-I., Berg, O. H., Swietlicki, E., Wendisch, M., Yuskiewicz, B., Heintzenberg, J., Wiedensohler, A., Orsini, D., Stratmann F., Laj P., and Ricci L.: Droplet formation and growth in polluted fogs, Contrib. Atmos. Phys., 71, 65–85, 1998. a
Fu, Q. and Liou, K. N.: Parameterization of the Radiative Properties of Cirrus Clouds, J. Atmos. Sci., 50, 2008–2025, https://doi.org/10.1175/1520-0469(1993)050<2008:POTRPO>2.0.CO;2, 1993. a
Fuzzi, S., Orsi, G., and Mariotti, M.: Radiation fog liquid water acidity at a field station in the Po Valley, J. Aerosol Sci., 14, 135–138, https://doi.org/10.1016/0021-8502(83)90037-X, 1983. a
Fuzzi, S., Facchini, M. C., Orsi, G., Lind, J. A., Wobrock, W., Kessel, M., Maser, R., Jaeschke, W., Enderle, K. H., Arends, B. G., Berner, A., Solly, I., Kruisz, C., Reischl, G., Pahl, S., Kaminski, U., Winkler, P., Ogren, J. A., Noone, K. J., Hallberg, A., Fierlinger-Oberlinninger, H., Puxbaum, H., Marzorati, A., Hansson, H.-C., Wiedensohler, A., Svenningsson, I. B., Martinsson, B. G., Schell, D., and Georgii, H. W.: The Po Valley Fog Experiment 1989, Tellus B, 44, 448–468, https://doi.org/10.1034/j.1600-0889.1992.t01-4-00002.x, 1992. a, b
Gao, F. and Han, L.: Implementing the Nelder-Mead simplex algorithm with adaptive parameters, Comput. Optimiz. Appl., 51, 259–277, 2012. a
Gerber, H. E.: Microstructure of a Radiation Fog, J. Atmos. Sci., 38, 454–458, https://doi.org/10.1175/1520-0469(1981)038<0454:MOARF>2.0.CO;2, 1981. a
Ghude, S. D., Jenamani, R. K., Kulkarni, R., Wagh, S., Dhangar, N. G., Parde, A. N., Acharja, P., Lonkar, P., Govardhan, G., Yadav, P., Vispute, A., Debnath, S., Lal, D. M., Bisht, D. S., Jena, C., Pawar, P. V., Dhankhar, S. S., Sinha, V., Chate, D. M., Safai, P. D., Nigam, N., Konwar, M., Hazra, A., Dharmaraj, T., Gopalkrishnan, V., Padmakumari, B., Gultepe, I., Biswas, M., Karipot, A. K., Prabhakaran, T., Nanjundiah, R. S., and Rajeevan, M.: WiFEX: Walk into the Warm Fog over Indo-Gangetic Plain Region, B. Am. Meteorol. Soc., 104, E980–E1005, https://doi.org/10.1175/BAMS-D-21-0197.1, 2023. a, b, c
Gilardoni, S., Massoli, P., Giulianelli, L., Rinaldi, M., Paglione, M., Pollini, F., Lanconelli, C., Poluzzi, V., Carbone, S., Hillamo, R., Russell, L. M., Facchini, M. C., and Fuzzi, S.: Fog scavenging of organic and inorganic aerosol in the Po Valley, Atmos. Chem. Phys., 14, 6967–6981, https://doi.org/10.5194/acp-14-6967-2014, 2014. a
Gilardoni, S., Massoli, P., Paglione, M., Giulianelli, L., Carbone, C., Rinaldi, M., Decesari, S., Sandrini, S., Costabile, F., Gobbi, G. P., Pietrogrande, M. C., Visentin, M., Scotto, F., Fuzzi, S., and Facchini, M. C.: Direct observation of aqueous secondary organic aerosol from biomass-burning emissions, P. Natl. Acad. Sci. USA, 113, 10013–10018, https://doi.org/10.1073/pnas.1602212113, 2016. a
Gilardoni, S., Tarozzi, L., Sandrini, S., Ielpo, P., Contini, D., Putaud, J.-P., Cavalli, F., Poluzzi, V., Bacco, D., Leonardi, C., Genga, A., Langone, L., and Fuzzi, S.: Reconstructing elemental carbon long-term trend in the Po Valley (Italy) from fog water samples, Atmosphere, 11, 580, https://doi.org/10.3390/atmos11060580, 2020. a
Giulianelli, L., Gilardoni, S., Tarozzi, L., Rinaldi, M., Decesari, S., Carbone, C., Facchini, M., and Fuzzi, S.: Fog occurrence and chemical composition in the Po Valley over the last twenty years, Atmos. Environ., 98, 394–401, https://doi.org/10.1016/j.atmosenv.2014.08.080, 2014. a, b, c, d
Glantz, P., Fawole, O. G., Ström, J., Wild, M., and Noone, K. J.: Unmasking the Effects of Aerosols on Greenhouse Warming Over Europe, J.f Geophys. Res.-Atmos., 127, e2021JD035889, https://doi.org/10.1029/2021JD035889, 2022. a
Gultepe, I., Tardif, R., Michaelides, S. C., Cermak, J., Bott, A., Bendix, J., Müller, M. D., Pagowski, M., Hansen, B., Ellrod, G., Jacobs, W., Toth G., and Cober S. G.: Fog research: A review of past achievements and future perspectives, Pure Appl. Geophys., 164, 1121–1159, https://doi.org/10.1007/s00024-007-0211-x, 2007. a
Gultepe, I., Kuhn, T., Pavolonis, M., Calvert, C., Gurka, J., Heymsfield, A. J., Liu, P. S. K., Zhou, B., Ware, R., Ferrier, B., Milbrandt, J., and Bernstein, B.: Ice Fog in Arctic During FRAM–Ice Fog Project: Aviation and Nowcasting Applications, B. Am. Meteorol. Soc., 95, 211–226, https://doi.org/10.1175/BAMS-D-11-00071.1, 2014. a
Guyot, G., Gourbeyre, C., Febvre, G., Shcherbakov, V., Burnet, F., Dupont, J.-C., Sellegri, K., and Jourdan, O.: Quantitative evaluation of seven optical sensors for cloud microphysical measurements at the Puy-de-Dôme Observatory, France, Atmos. Meas. Tech., 8, 4347–4367, https://doi.org/10.5194/amt-8-4347-2015, 2015. a, b
Gysel, M. and Stratmann, F.: Homepage, https://actris-ecac.eu/ccn-nc.html (last access: 20 December 2024), 2024. a, b
Haeffelin, M., Bergot, T., Elias, T., Tardif, R., Carrer, D., Chazette, P., Colomb, M., Drobinski, P., Dupont, E., Dupont, J.-C., Gomes, L., Musson-Genon, L., Pietras, C., Plana-Fattori, A., Protat, A., Rangognio, J., Raut, J.-C., Rémy, S., Richard, D., Sciare, J., and Zhang, X.: Parisfog: Shedding new Light on Fog Physical Processes, B. Am. Meteorol. Soc., 91, 767–783, https://doi.org/10.1175/2009BAMS2671.1, 2010. a, b
Haeffelin, M., Dupont, J.-C., Boyouk, N., Baumgardner, D., Gomes, L., Roberts, G., and Elias, T.: A comparative study of radiation fog and quasi-fog formation processes during the ParisFog field experiment 2007, Pure Appl. Geophys., 170, 2283–2303, 2013. a, b, c
Hamed, A., Joutsensaari, J., Mikkonen, S., Sogacheva, L., Dal Maso, M., Kulmala, M., Cavalli, F., Fuzzi, S., Facchini, M. C., Decesari, S., Mircea, M., Lehtinen, K. E. J., and Laaksonen, A.: Nucleation and growth of new particles in Po Valley, Italy, Atmos. Chem. Phys., 7, 355–376, https://doi.org/10.5194/acp-7-355-2007, 2007. a
Hamilton, W. J. and Seely, M. K.: Fog basking by the Namib Desert beetle, Onymacris unguicularis, Nature, 262, 284–285, 1976. a
Hammer, E., Gysel, M., Roberts, G. C., Elias, T., Hofer, J., Hoyle, C. R., Bukowiecki, N., Dupont, J.-C., Burnet, F., Baltensperger, U., and Weingartner, E.: Size-dependent particle activation properties in fog during the ParisFog 2012/13 field campaign, Atmos. Chem. Phys., 14, 10517–10533, https://doi.org/10.5194/acp-14-10517-2014, 2014. a, b, c, d, e, f
Heintzenberg, J., Wendisch, M., Yuskiewicz, B., Orsini, D., Wiedensohler, A., Stratmann, F., Frank, G., Martinsson, B. G., Schell, D., Fuzzi, S., and Orsi G.: Characteristics of haze, mist and fog, Contrib. Atmos. Phys., 71, 21–31, 1998. a
Hersbach, H., Bell, B., Berrisford, P., Biavati, G., Horányi, A., Muñoz Sabater, J., Nicolas, J., Peubey, C., Radu, R., Rozum, I., Schepers, D., Simmons, A., Soci, C., Dee, D., and Thépaut, J.-N.: ERA5 hourly data on pressure levels from 1940 to present, CDS [data set], https://doi.org/10.24381/cds.bd0915c6, 2023. a
Hudson, J. G.: Relationship Between Fog Condensation Nuclei and Fog Microstructure, Journal of Atmospheric Sciences, 37, 1854 – 1867, https://doi.org/10.1175/1520-0469(1980)037<1854:RBFCNA>2.0.CO;2, 1980. a, b
Jurányi, Z., Gysel, M., Weingartner, E., DeCarlo, P. F., Kammermann, L., and Baltensperger, U.: Measured and modelled cloud condensation nuclei number concentration at the high alpine site Jungfraujoch, Atmos. Chem. Phys., 10, 7891–7906, https://doi.org/10.5194/acp-10-7891-2010, 2010. a
Karlsson, L., Baccarini, A., Duplessis, P., Baumgardner, D., Brooks, I. M., Chang, R. Y.-W., Dada, L., Dällenbach, K. R., Heikkinen, L., Krejci, R., Leaitch, W. R., Leck, C., Partridge, D. G., Salter, M. E., Wernli, H., Wheeler, M. J., Schmale, J., and Zieger, P.: Physical and Chemical Properties of Cloud Droplet Residuals and Aerosol Particles During the Arctic Ocean 2018 Expedition, J. Geophys. Res.-Atmos., 127, e2021JD036383, https://doi.org/10.1029/2021JD036383, 2022. a
Kasten, F.: Visibility forecast in the phase of pre-condensation, Tellus, 21, 631–635, https://doi.org/10.1111/j.2153-3490.1969.tb00469.x, 1969. a
Klemm, O. and Lin, N.-H.: What Causes Observed Fog Trends: Air Quality or Climate Change?, Aerosol Air Qual. Res., 16, 1131–1142, https://doi.org/10.4209/aaqr.2015.05.0353, 2016. a
Klemm, O., Wang, S.-H., Lin, P.-H., and Lin, N.-H.: Visibility Reduction in Fog: The Role of Activation, Aerosol Air Qual. Res., 25, 54, https://doi.org/10.1007/s44408-025-00055-5, 2025. a
Köhler, H.: The nucleus in and the growth of hygroscopic droplets, Trans. Faraday Soc., 32, 1152–1161, https://doi.org/10.1039/TF9363201152, 1936. a
Koschmieder, H.: Theorie der horizontalen sichtweite, Beitrage zur Physik der Freien Atmosphare, Meteorol. Z., 12, 3353–3353, 1924. a
Kunkel, B. A.: Parameterization of Droplet Terminal Velocity and Extinction Coefficient in Fog Models, J. Appl. Meteorol. Clim., 23, 34–41, https://doi.org/10.1175/1520-0450(1984)023<0034:PODTVA>2.0.CO;2, 1984. a, b, c
Lakra, K. and Avishek, K.: A review on factors influencing fog formation, classification, forecasting, detection and impacts, Rendiconti Lincei. Scienze Fisiche e Naturali, 33, 319–353, 2022. a
Lampilahti, J., Manninen, H E., Nieminen, T., Mirme, S., Ehn, M., Pullinen, I., Leino, K., Schobesberger, S., Kangasluoma, J., Kontkanen, J., Järvinen, E., Väänänen, R., Yli-Juuti, T., Krejci, R., Lehtipalo, K., Levula, J., Mirme, A., Decesari, S., Tillmann, R., Worsnop, D. R., Rohrer, F., Kiendler-Scharr, A., Petäjä, T., Kerminen, V.-M., Mentel, T. F., and Kulmala, M.: Zeppelin-led study on the onset of new particle formation in the planetary boundary layer, Atmos. Chem. Phys., 21, 12649–12663, https://doi.org/10.5194/acp-21-12649-2021, 2021. a
Leigh, R. J., Drake, L., and Thampapillai, D. J.: An Economic Analysis of Terminal Aerodrome Forecasts with Special Reference to Sydney Airport, J. Trans. Econ. Policy, 32, 377–392, 1998. a
Liu, D., Yang, J., Niu, S., and Li, Z.: On the evolution and structure of a radiation fog event in Nanjing, Adv. Atmos. Sci., 28, 223–237, 2011. a, b
Liu, D., Li, Z., Yan, W., and Li, Y.: Advances in fog microphysics research in China, Asia-Pacif. J. Atmos. Sci., 53, 131–148, 2017. a
Liu, Q., Shen, X., Sun, J., Zhang, Y., Qi, B., Ma, Q., Han, L., Xu, H., Hu, X., Lu, J., Liu, S., Yu, A., Liang, L., Gao, Q., Wang, H., Che, H., and Zhang, X.: Characterization of fog microphysics and their relationships with visibility at a mountain site in China, Atmos. Chem. Phys., 25, 3253–3267, https://doi.org/10.5194/acp-25-3253-2025, 2025. a
Lu, C., Liu, Y., Niu, S., Zhao, L., Yu, H., and Cheng, M.: Examination of microphysical relationships and corresponding microphysical processes in warm fogs, Acta Meteorol. Sin., 27, 832–848, 2013. a, b
Maalick, Z., Kühn, T., Korhonen, H., Kokkola, H., Laaksonen, A., and Romakkaniemi, S.: Effect of aerosol concentration and absorbing aerosol on the radiation fog life cycle, Atmos. Environ. 133, 26–33, https://doi.org/10.1016/j.atmosenv.2016.03.018, 2016. a
Maier, F., Bendix, J., and Thies, B.: Development and application of a method for the objective differentiation of fog life cycle phases, Tellus B, 65, 19971, https://doi.org/10.3402/tellusb.v65i0.19971, 2013. a
Manara, V., Brunetti, M., Gilardoni, S., Landi, T. C., and Maugeri, M.: 1951–2017 changes in the frequency of days with visibility higher than 10 km and 20 km in Italy, Atmos. Environ., 214, 116861, https://doi.org/10.1016/j.atmosenv.2019.116861, 2019. a
Mattsson, F., Neuberger, A., Heikkinen, L., Gramlich, Y., Paglione, M., Rinaldi, M., Decesari, S., Zieger, P., Riipinen, I., and Mohr, C.: Enrichment of organic nitrogen in fog residuals observed in the Italian Po Valley, Atmos. Chem. Phys., 25, 7973–7989, https://doi.org/10.5194/acp-25-7973-2025, 2025a. a, b, c, d, e
Mattsson, F., Neuberger, A., Heikkinen, L., Zieger, P., and Mohr, C.: Aerosol chemical composition measured during the FAIRARI campaign, Po Valley, Italy, February–April 2022, Dataset version 1, Bolin Centre Database [data set], https://doi.org/10.17043/fairari-2021-2022-aerosol-spams-1, 2025b. a
Mazoyer, M., Burnet, F., Denjean, C., Roberts, G. C., Haeffelin, M., Dupont, J.-C., and Elias, T.: Experimental study of the aerosol impact on fog microphysics, Atmos.Chem. Phys., 19, 4323–4344, https://doi.org/10.5194/acp-19-4323-2019, 2019. a, b, c, d
Mazoyer, M., Burnet, F., and Denjean, C.: Experimental study on the evolution of droplet size distribution during the fog life cycle, Atmos. Chem. Phys., 22, 11305–11321, https://doi.org/10.5194/acp-22-11305-2022, 2022. a, b
Mitchell, D., Henschel, J. R., Hetem, R. S., Wassenaar, T. D., Strauss, W. M., Hanrahan, S. A., and Seely, M. K.: Fog and fauna of the Namib Desert: past and future, Ecosphere, 11, e02996, https://doi.org/10.1002/ecs2.2996, 2020. a
Morrison, H. and Grabowski, W. W.: Modeling Supersaturation and Subgrid-Scale Mixing with Two-Moment Bulk Warm Microphysics, J. Atmos. Sci., 65, 792–812, https://doi.org/10.1175/2007JAS2374.1, 2008. a
Neuberger, A., Mattsson, F., and Zieger, P.: Aerosol particle number size distribution measured during the FAIRARI campaign, Po valley, Italy, February–April 2022, Dataset version 1, Bolin Centre Database [data set], https://doi.org/10.17043/fairari-2021-2022-aerosol-dmps1-1, 2024a. a
Neuberger, A., Mattsson, F., and Zieger, P.: Equivalent black carbon concentration measured during the FAIRARI campaign, Po valley, Italy, February–April 2022, Dataset version 1, Bolin Centre Database [data set], https://doi.org/10.17043/fairari-2021-2022-aerosol-maap2-1, 2024b. a
Neuberger, A., Decesari, S., Aktypis, A., Andersen, H., Baumgardner, D., Bianchi, F., Busetto, M., Cai, J., Cermak, J., Dipu, S., Ekman, A., Fuzzi, S., Gramlich, Y., Haslett, S. L., Heikkinen, L., Joutsensaari, J., Kaltsonoudis, C., Kangasluoma, J., Krejci, R., Lupi, A., Marinoni, A., Matrali, A., Mattsson, F., Mohr, C., Nenes, A., Paglione, M., Pandis, S. N., Patel, A., Riipinen, I., Rinaldi, M., Steimer, S. S., Stolzenburg, D., Sulo, J., Vasilakopoulou, C. N., and Zieger, P.: From Molecules to Droplets: The Fog and Aerosol Interaction Research Italy (FAIRARI) 2021/22 Campaign, B. Am. Meteorol. Soc., 106, E23–E50, https://doi.org/10.1175/BAMS-D-23-0166.1, 2025. a, b, c, d, e, f, g
Neuberger, A., Haberstock, L., Ranjan, R., Riipinen, I., and Zieger, P.: The fog and aerosol size distribution measured during the FAIRARI campaign, Po valley, Italy, February–April 2022, Dataset version 1, Bolin Centre Database [data set], https://doi.org/10.17043/fairari-2021-2022-droplet-size-1, 2026a. a
Neuberger, A., Ranjan, R., Riipinen, I., and Zieger, P.: Cloud condensation nuclei concentrations measured during the FAIRARI campaign, Po valley, Italy, February–April 2022, Dataset version 1, Bolin Centre Database [data set], https://doi.org/10.17043/fairari-2021-2022-ccn-concentrations-1, 2026b. a
Niu, S., Lu, C., Liu, Y., Zhao, L., Lü, J., and Yang, J.: Analysis of the microphysical structure of heavy fog using a droplet spectrometer: A case study, Adv. Atmos. Sci., 27, 1259–1275, 2010. a, b
Noone, K. J., Ogren, J. A., Hallberg, A., Heintzenberg, J., Strom, J., Hansson, H.-C., Svenningsson, B., Wiedensohler, A., Fuzzi, S., Facchini, M. C., Arends, B. G., and Berner A.: Changes in aerosol size- and phase distributions due to physical and chemical processes in fog, Tellus B, 44, 489–504, https://doi.org/10.3402/tellusb.v44i5.15563, 1992. a, b, c, d
Ogren, J., Noone, K., Hallberg, A., Heintzenberg, J., Schell, D., Berner, A., Solly, I., Kruisz, C., Reischl, G., Arends, B. G., and Wobrock, W.: Measurements of the size dependence of the concentration of nonvolatile material in fog droplets, Tellus B, 44, 570–580, https://doi.org/10.3402/tellusb.v44i5.15569, 1992. a
Oliphant, A. J., Baguskas, S. A., and Fernandez, D. M.: Impacts of low cloud and fog on surface radiation fluxes for ecosystems in coastal California, Theor. Appl. Climatol., 144, 239–252, https://doi.org/10.1007/s00704-021-03518-y, 2021. a
Onasch, T., Trimborn, A., Fortner, E., Jayne, J., Kok, G., Williams, L., Davidovits, P., and Worsnop, D.: Soot Particle Aerosol Mass Spectrometer: Development, Validation, and Initial Application, Aerosol Sci. Tech., 46, 804–817, https://doi.org/10.1080/02786826.2012.663948, 2012. a
Paglione, M., Gilardoni, S., Rinaldi, M., Decesari, S., Zanca, N., Sandrini, S., Giulianelli, L., Bacco, D., Ferrari, S., Poluzzi, V., Scotto, F., Trentini, A., Poulain, L., Herrmann, H., Wiedensohler, A., Canonaco, F., Prévôt, A. S. H., Massoli, P., Carbone, C., Facchini, M. C., and Fuzzi, S.: The impact of biomass burning and aqueous-phase processing on air quality: a multi-year source apportionment study in the Po Valley, Italy, Atmos. Chem. Phys., 20, 1233–1254, https://doi.org/10.5194/acp-20-1233-2020, 2020. a, b
Paglione, M., Rinaldi, M., Busetto, M., Decesari, S., and Marinoni, A.: Interstitial equivalent black carbon concentration measured during the FAIRARI campaign, Po valley, Italy, February–May 2022, Dataset version 1, Bolin Centre Database [data set], https://doi.org/10.17043/fairari-2021-2022-aerosol-ebc-pm25-1, 2026a. a
Paglione, M., Decesari, S., Neuberger, A., Ranjan, R., Riipinen, I., and Zieger, P.: Meteorological parameters measured during the FAIRARI campaign, Po Valley, Italy, February–April 2022. Dataset version 1, Bolin Centre Database [data set], https://doi.org/10.17043/fairari-2021-2022-meteorological-1, 2026b. a
Paglione, M., Rinaldi, M., Decesari, S., and Mansour, K.: Air liquid water Content (LWC) during the FAIRARI campaign, Po valley, Italy, February–April 2022, Dataset version 1, Bolin Centre Database [data set], https://doi.org/10.17043/fairari-2021-2022-lwc-1, 2026c. a
Pagowski, M., Gultepe, I., and King, P.: Analysis and Modeling of an Extremely Dense Fog Event in Southern Ontario, J. Appl. Meteorol., 43, 3–16, https://doi.org/10.1175/1520-0450(2004)043<0003:AAMOAE>2.0.CO;2, 2004. a
Patel, A. and Rastogi, N.: Oxidative potential of ambient fine aerosol over a semi-urban site in the Indo-Gangetic Plain, Atmos. Environ., 175, 127–134, https://doi.org/10.1016/j.atmosenv.2017.12.004, 2018. a
Petters, M. D. and Kreidenweis, S. M.: A single parameter representation of hygroscopic growth and cloud condensation nucleus activity, Atmos. Chem. Phys., 7, 1961–1971, https://doi.org/10.5194/acp-7-1961-2007, 2007. a, b
Petzold, A. and Schönlinner, M.: Multi-angle absorption photometry – a new method for the measurement of aerosol light absorption and atmospheric black carbon, J. Aerosol Sci., 35, 421–441, https://doi.org/10.1016/j.jaerosci.2003.09.005, 2004. a
Petzold, A., Kramer, H., and Schönlinner, M.: Continuous Measurement of Atmospheric Black Carbon Using a Multi-angle Absorption Photometer, Environ. Sci. Pollut. Res., 4, 78–82, 2002. a
Pinnick, R. G., Hoihjelle, D. L., Fernandez, G., Stenmark, E. B., Lindberg, J. D., Hoidale, G. B., and Jennings, S. G.: Vertical Structure in Atmospheric Fog and Haze and Its Effects on Visible and Infrared Extinction, J. Atmos. Sci., 35, 2020–2032, https://doi.org/10.1175/1520-0469(1978)035<2020:VSIAFA>2.0.CO;2, 1978. a
Price, J. D., Lane, S., Boutle, I. A., Smith, D. K. E., Bergot, T., Lac, C., Duconge, L., McGregor, J., Kerr-Munslow, A., Pickering, M., and Clark, R.: LANFEX: A Field and Modeling Study to Improve Our Understanding and Forecasting of Radiation Fog, B. Am. Meteorol. Soc., 99, 2061–2077, https://doi.org/10.1175/BAMS-D-16-0299.1, 2018. a
Quan, J., Zhang, Q., He, H., Liu, J., Huang, M., and Jin, H.: Analysis of the formation of fog and haze in North China Plain (NCP), Atmos. Chem. Phys., 11, 8205–8214, https://doi.org/10.5194/acp-11-8205-2011, 2011.
Ramanathan, V., Crutzen, P., Kiehl, J., and Rosenfeld, D.: Aerosols, climate and the hydrological cycle, Science, 294, 2119–2124, 2001. a, b
Ranjan, R., Dewey, M., Heikkinen, L., Ahonen, L. R., Luoma, K., Bowen, P., Petäjä, T., Ekman, A. M. L., Partridge, D. G., and Riipinen, I.: Optimizing CCN predictions through inferred modal aerosol composition – a boreal forest case study, Atmos. Chem. Phys., 25, 17275–17300, https://doi.org/10.5194/acp-25-17275-2025, 2025. a
Ricci, L., Fuzzi, S., Laj, P., Lazzari, A., Orsi, G., Berner, A., Günther, A., Jaeschke, W., Wendisch, M., and Arends, B.: Gas-liquid equilibria in polluted fog, Contrib. Atmos. Phys., 71, 159–170, 1998. a
Rinaldi, M., Paglione, M., and Decesari, S.: Interstitial aerosol chemical composition measured by HR-TOF-AMS during the FAIRARI campaign, Po Valley, Italy, Feb.–May 2022, Dataset version 1m Bolin Centre Database [data set], https://doi.org/10.17043/fairari-2021-2022-aerosol-chemical-pm25-1, 2026. a
Rose, D., Gunthe, S. S., Mikhailov, E., Frank, G. P., Dusek, U., Andreae, M. O., and Pöschl, U.: Calibration and measurement uncertainties of a continuous-flow cloud condensation nuclei counter (DMT-CCNC): CCN activation of ammonium sulfate and sodium chloride aerosol particles in theory and experiment, Atmos. Chem. Phys., 8, 1153–1179, https://doi.org/10.5194/acp-8-1153-2008, 2008. a
Savre, J., Ekman, A. M. L., and Svensson, G.: Technical note: Introduction to MIMICA, a large-eddy simulation solver for cloudy planetary boundary layers, J. Adv. Model. Earth Syst., 6, 630–649, https://doi.org/10.1002/2013MS000292, 2014. a, b
Scotto, F., Bacco, D., Lasagni, S., Trentini, A., Poluzzi, V., and Vecchi, R.: A multi-year source apportionment of PM2.5 at multiple sites in the southern Po Valley (Italy), Atmos. Pollut. Res., 12, 101192, https://doi.org/10.1016/j.apr.2021.101192, 2021. a
Seely, M. K. and Hamilton, W. J.: Fog catchment sand trenches constructed by tenebrionid beetles, Lepidochora, from the Namib Desert, Science, 193, 484–486, 1976. a
Seifert, A. and Beheng, K. D.: A two-moment cloud microphysics parameterization for mixed-phase clouds. Part 1: Model description, Meteorol. Atmos. Phys., 92, 45–66, 2006. a
Shankar, A. and Sahana, B. C.: Early warning of low visibility using the ensembling of machine learning approaches for aviation services at Jay Prakash Narayan International (JPNI) Airport Patna, SN Appl. Sci., 5, 132, https://doi.org/10.1007/s42452-023-05350-7, 2023. a
Shen, C., Zhao, C., Ma, N., Tao, J., Zhao, G., Yu, Y., and Kuang, Y.: Method to Estimate Water Vapor Supersaturation in the Ambient Activation Process Using Aerosol and Droplet Measurement Data, J. Geophys. Res.-Atmos., 123, 10606–10619, https://doi.org/10.1029/2018JD028315, 2018. a, b, c, d, e, f, g
Spänkuch, D., Hellmuth, O., and Görsdorf, U.: What Is a Cloud? Toward a More Precise Definition, B. Am. Meteorol. Soc., 103, E1894–E1929, https://doi.org/10.1175/BAMS-D-21-0032.1, 2022. a
Spiegel, J., Zieger, P., Bukowiecki, N., Hammer, E., Weingartner, E., and Eugster, W.: Evaluating the capabilities and uncertainties of droplet measurements for the fog droplet spectrometer (FM-100), Atmos. Meas. Tech., 5, 2237–2260, https://doi.org/10.5194/amt-5-2237-2012, 2012. a, b, c, d
Steeneveld, G. J., Ronda, R. J., and Holtslag, A. A. M.: The Challenge of Forecasting the Onset and Development of Radiation Fog Using Mesoscale Atmospheric Models, Bound.-Lay. Meteorol., 154, 265–289, https://doi.org/10.1007/s10546-014-9973-8, 2015. a
Stokes, R. H. and Robinson, R. A.: Interactions in Aqueous Nonelectrolyte Solutions. I. Solute-Solvent Equilibria, J. Phys. Chem., 70, 2126–2131, https://doi.org/10.1021/j100879a010, 1966. a
Stolaki, S., Haeffelin, M., Lac, C., Dupont, J.-C., Elias, T., and Masson, V.: Influence of aerosols on the life cycle of a radiation fog event. A numerical and observational study, Atmos. Res., 151, 146–161, https://doi.org/10.1016/j.atmosres.2014.04.013, 2015. a
Sueper, D.: ToF-AMS Data Analysis Software Webpage, http://cires1.colorado.edu/jimenez-group/wiki/index.php/ToF-AMS_Analysis_Software (last access: 8 February 2024), 2024. a
Svenningsson, I. B., Hansson, H.-C., Wiedensohler, A., Ogren, J. A., Noone, K. J., and Hallberg, A.: Hygroscopic growth of aerosol particles in the Po Valley, Tellus B, 44, 556–569, https://doi.org/10.1034/j.1600-0889.1992.t01-1-00009.x, 1992. a, b, c
Tardif, R. and Rasmussen, R. M.: Event-Based Climatology and Typology of Fog in the New York City Region, J. Appl. Meteorol. Clim., 46, 1141–1168, https://doi.org/10.1175/JAM2516.1, 2007. a
Twomey, S.: Pollution and the planetary albedo, Atmos. Environ., 8, 1251–1256, https://doi.org/10.1016/0004-6981(74)90004-3, 1974. a
Vautard, R., Yiou, P., and van Oldenborgh, G. J.: Decline of fog, mist and haze in Europe over the past 30 years, Nat. Geosci., 2, 115–119, https://doi.org/10.1038/ngeo414, 2009. a, b
von der Weiden, S.-L., Drewnick, F., and Borrmann, S.: Particle Loss Calculator – a new software tool for the assessment of the performance of aerosol inlet systems, Atmos.Meas. Tech., 2, 479–494, https://doi.org/10.5194/amt-2-479-2009, 2009. a
Wang, Q., Yamaguchi, R. T., Kalogiros, J. A., Daniels, Z., Alappattu, D. P., Jonsson, H., Alvarenga, O., Olson, A., Wauer, B. J., Ortiz-Suslow, D. G., and Fernando, H. J.: Microphysics and optical attenuation in fog: observations from two coastal sites, Bound.-Lay. Meteorol., 181, 267–292, https://doi.org/10.1007/s10546-021-00675-5, 2021a. a, b, c
Wang, Y., Niu, S., Lu, C., Lv, J., Zhang, J., Zhang, H., Zhang, S., Shao, N., Sun, W., Jin, Y., and Song, Q.: Observational study of the physical and chemical characteristics of the winter radiation fog in the tropical rainforest in Xishuangbanna, China, Sci. China Earth Sci., 64, 1982–1995, https://doi.org/10.1007/s11430-020-9766-4, 2021b. a, b
Weingartner, E., Nyeki, S., and Baltensperger, U.: Seasonal and diurnal variation of aerosol size distributions ( nm) at a high-alpine site (Jungfraujoch 3580 m asl), J. Geophys. Res.-Atmos., 104, 26809–26820, https://doi.org/10.1029/1999JD900170, 1999. a
Wendisch, M., Mertes, S., Heintzenberg, J., Wiedensohler, A., Schell, D., Wobrock, W., Frank, G., Martinsson, B. G., Fuzzi, S., Orsi, G., Kos, G., and Berner, A.: Drop size distribution and LWC in Po Valley fog, Atmos. Phys., 71, 87–100, , 1998. a
WMO/GAW: WMO/GAW Aerosol Measurement Procedures, Guidelines and Recommendations, Report No. 227, 2nd Edn., World Meteorological Organization, Geneva, Switzerland, ISBN 978-92-63-11177-7, https://www.wmo-gaw-sag-aerosol.org/files/FINAL_GAW_227.pdf (last access 23 June 2026), 2016. a
Yan, S., Zhu, B., Huang, Y., Zhu, J., Kang, H., Lu, C., and Zhu, T.: To what extents do urbanization and air pollution affect fog?, Atmos. Chem. Phys., 20, 5559–5572, https://doi.org/10.5194/acp-20-5559-2020, 2020. a
Yan, S., Zhu, B., Zhu, T., Shi, C., Liu, D., Kang, H., Lu, W., and Lu, C.: The Effect of Aerosols on Fog Lifetime: Observational Evidence and Model Simulations, Geophys. Res. Lett., 48, e2020GL61803, https://doi.org/10.1029/2020GL091156, 2021. a
Zhao, L., Niu, S., Zhang, Y., and Xu, F.: Microphysical characteristics of sea fog over the east coast of Leizhou Peninsula, China, Adv. Atmos. Sci., 30, 1154–1172, 2013. a, b
Zieger, P.: SU-air/publication-FAIRARI-Neuberger2026: Routines used in Neuberger et al. (2026) (Version Version_1.1), Zenodo [software], https://doi.org/10.5281/zenodo.21967941, 2026. a
Zieger, P., Fierz-Schmidhauser, R., Weingartner, E., and Baltensperger, U.: Effects of relative humidity on aerosol light scattering: results from different European sites, Atmos. Chem. Phys., 13, 10609–10631, https://doi.org/10.5194/acp-13-10609-2013, 2013. a
Zieger, P., Fierz-Schmidhauser, R., Poulain, L., Müller, T., Birmili, W., Spindler, G., Wiedensohler, A., Baltensperger, U., and Weingartner, E.: Influence of water uptake on the aerosol particle light scattering coefficients of the Central European aerosol, Tellus B, 66, 22716, https://doi.org/10.3402/tellusb.v66.22716, 2014. a