the Creative Commons Attribution 4.0 License.
the Creative Commons Attribution 4.0 License.
 | 01 Aug 2025
Explainable ensemble machine learning revealing spatiotemporal heterogeneity in driving factors of particulate nitro-aromatic compounds in eastern China
Tianshuai Li
Yujia Wang
Yueru Jiang
Yujiao Zhu
Rui Li
Jian Gao
Likun Xue
Qingzhu Zhang
Wenxing Wang
Nitro-aromatic compounds (NACs) are important atmospheric pollutants that impact air quality, atmospheric chemistry, and human health. Understanding the relationship between NAC formation and key environmental driving factors is crucial for mitigating their environmental and health impacts. In this work, we combined an ensemble machine learning (EML) model with the SHapley Additive exPlanation (SHAP) and positive matrix factorization (PMF) model to identify the key driving factors for ambient particulate NACs, covering primary emissions, secondary formation, and meteorological conditions based on field observations at urban, rural, and mountain sites in eastern China. The EML model effectively reproduced ambient NACs and recognized that anthropogenic emissions (i.e., coal combustion, traffic emission, and biomass burning) were the most important driving factors, with a total contribution of 49.3 %, while significant influences from meteorology (27.4 %) and secondary formation (23.3 %) were also confirmed. Seasonal variation analysis showed that direct emissions presented positive responses to NAC concentrations in spring, summer, and autumn, while lower temperatures had the largest positive impact in winter. By evaluating NAC formation and loss under various locations in winter, we found that anthropogenic sources played a dominant role in increasing NAC levels in urban and rural sites, while reduced ambient temperature, along with secondary formation from gas-phase oxidation, was the main reason for relatively high particulate NAC levels at the mountain site. This work provides a reliable modeling method for understanding the dominant sources and influencing factors for atmospheric NACs and highlights the necessity of strengthening emission source controls to mitigate organic aerosol pollution.
- Article
(6930 KB) - Full-text XML
-
Supplement
(2494 KB) - BibTeX
- EndNote


Nitro-aromatic compounds (NACs) exist as one of the key components of atmospheric organic aerosols that consist of one or more nitro (-NO2) and hydroxyl functional groups (-OH) attached to a benzene ring. They can be classified into four categories based on the chemical structures and quantities of functional groups, including nitrophenol and its derivatives (NPs), nitrocatechol and its derivatives (NCs), nitrosalicylic acids (NSAs), and dinitrophenol and its derivatives (DNPs). As semi-volatile compounds, NACs are widely distributed in the air, cloud, surface water, fog, rain, and snow in the Earth environment (Leuenberger et al., 1988; Lüttke et al., 1999, 1997; Vanni et al., 2001). They are recognized as the major constituents of brown carbon (BrC) that affect radiative forcing and regional climate through strong absorption of visible and near-ultraviolet light (Xie et al., 2017; Mohr et al., 2013). In addition, the photolysis of NACs can release OH radicals and produce HONO, increasing the atmospheric oxidative capacity and altering the nitrogen cycle (Bejan et al., 2006, 2007; Cheng et al., 2009; Yang et al., 2024). Recent toxicology studies have also shown that NACs can react with hemoglobin and further affect cell metabolism, which poses risks to human health (Fernandez et al., 1992; Purohit and Basu, 2000). Therefore, elucidating the sources and sinks of NACs is of particular importance for comprehensively assessing their environmental, climate, and health effects.
The abundances of NACs in ambient air largely depend on primary emissions of anthropogenic activities, including coal combustion (Lu et al., 2019b), biomass burning (Chow et al., 2016), traffic emissions (Delhomme et al., 2010), and industrial productions (Lu et al., 2021), with emission rates influenced by fuel types, combustion processes, and burning conditions. They can also be produced through nitration of anthropogenic aromatic volatile organic compounds (VOCs) initiated by OH and NO3 radicals in either the gas or aqueous phases (Harrison et al., 2005; Atkinson et al., 1989, 1992; Xie et al., 2017; Xia et al., 2023). In addition to phase partitioning, heterogeneous reaction of gas-phase NACs has been recently proposed as a formation pathway for the condensed-phase NACs (Wang et al., 2019). The secondary formation, phase partitioning, diffusion and transport, and wet and dry deposition of NACs strongly rely on meteorological conditions. Particularly, previous studies established a temperature (T)-dependent equilibrium for NACs between the gas and particle phases (Cai et al., 2022; Yuan et al., 2016). Higher relative humidity (RH) significantly facilitated the uptake of gas-phase NACs into aerosols (Vidović et al., 2018; Frka et al., 2016), while surface solar radiation (SSR) exerted a dual effect by enhancing both the photochemical production and photolytic degradation of NACs (Peng et al., 2023b). The complex and synergetic effects of primary emissions, secondary formation, and meteorological conditions on the abundances of NACs make the quantification of the individual contributions of each factor a challenge.
Traditionally, receptor models such as positive matrix factorization (PMF) and principal component analysis (PCA) are applied to apportion the major sources of NACs and their contributions. For example, Ren et al. (2022) and Yuan et al. (2021) have applied the PMF model to reveal that the particulate NACs in China are closely associated with anthropogenic activities, particularly with the direct emissions from combustion sources. Li et al. (2016) combined PMF and PCA models and recognized that NACs from biomass burning are mainly responsible for urban haze events. Furthermore, statistical methods based on linear or multilinear regressions were also used to quantify the contributions of sources, meteorological conditions, and other factors to the variations of particulate NACs (Cai et al., 2022; Wang et al., 2019; Chow et al., 2016). However, these methods are typically based on linear algorithms that may overlook the multivariate nature and nonlinear relationships between NACs and the potential sources, as well as the complex influences from meteorological conditions, potentially resulting in biased interpretations of NACs under complex atmospheric conditions. Therefore, a complementary data-analysis approach is warranted to uncover the hidden, complicated relationships more efficiently. Currently, machine learning (ML) methods, which are capable of simulating intricate and concealed nonlinear relationships and interactions among complex variables, have been widely used in predictions and evaluations of air pollutants (Chen et al., 2024; Wang et al., 2022a). Lundberg and Lee (2017) proposed a SHapley Additive exPlanation (SHAP) algorithm based on game theory to improve the model's interpretability, thereby providing a tool to explain and quantify the impacts of input variable values on model predictions. The interpretable ML methods, in combination with the interpretable SHAP algorithm, have been recently applied to investigate the formation mechanism and influencing factors of atmospheric pollutants. For example, Qin et al. (2022) quantified the drivers of gaseous elemental mercury by using an ML model in combination with SHAP. Peng et al. (2023a) utilized an ML model coupled with SHAP to evaluate the effects of PM2.5 sources and RH on atmospheric visibility. Given the complex nonlinear links between primary emissions, secondary formation, and meteorological conditions and the ambient particulate NACs, a clear understanding of the separate role of each factor is challenging. Therefore, it is necessary to establish an effective and reliable evaluation method to comprehensively understand and assess the importance and contribution of each factor to the abundances of NACs under complicated atmospheric conditions.
In this study, particulate NACs at various sampling sites in eastern China in different seasons were compared and characterized. By integrating observational datasets of NACs, meteorological data, particle loading (i.e., aerosol surface area data), and source apportionment results derived from the PMF model, an ensemble machine learning (EML) model combined with the SHAP approach was applied to reveal the key variables regulating the ambient NACs and the complex interrelationships. This study makes a methodological contribution by employing a novel approach to quantify the seasonal shifts in drivers and spatial variations across urban, rural, and mountain regions in a nuanced manner.
The purpose of this study is to (1) interpret the concentrations, compositions, and sources of particulate NACs at different sampling sites and seasons; (2) provide methods to identify the key driving factors for ambient NACs and quantify their relative contributions at various NACs concentration levels; and (3) elucidate the response of NACs to key driving factors under different pollution environments based on various sampling locations. This is the first attempt to combine the PMF model results with the explainable EML method to build nonlinear relationships and identify the key driving factors of NACs. The findings highlight the critical roles of emission sources as well as the large impacts of temperature and secondary formation on ambient NACs and provide a scientific basis for atmospheric pollution mitigation measures.
2.1 Field observations
The field sampling and measurements were conducted at 11 sites in eastern China from 2014 to 2021 (Fig. 1), including four urban sites in Jinan (36.67° N, 117.05° E), Guangzhou (23.14° N, 113.36° E), Nanjing (32.20° N, 119.62° E), and Beijing (40.03° N, 116.42° E); five rural sites in Dongying (37.75° N, 118.97° E), Wangdu (38.70° N, 116.57° E), Yucheng (36.87° N, 116.57° E), and Qingdao (including two sampling sites: Qingdao Campus of Shandong University (36.36° N, 120.69° E) and Entrepreneurship Center of Blue Silicon Valley (36.35° N, 120.67° E); see Fig. 1b)); and two mountain sites: Mount Tai (36.27° N, 117.10° E, 1,534 m a.s.l.), a typical high-elevation background site, and Mount Lao (36.15° N, 120.68° E, 166 m a.s.l.), a lower-elevation site situated in a coastal mountainous region. More detailed descriptions about the sampling sites are provided in Sect. S1 in the Supplement. It should be noted that the basic data in Jinan (except for autumn), Wangdu, Yucheng, Qingdao, and Mount Tai (winter in 2019 and summer) have been reported in our previous studies (Li et al., 2020a; Wang et al., 2018; Jiang et al., 2024; Li et al., 2024), which mainly demonstrate the pollution characteristics of particulate NACs and determine the major origins with the traditional PMF model. In contrast, the NAC data collected during the campaigns in spring at Mount Tai and Mount Lao, the campaigns in summer in Guangzhou and Dongying, the campaigns in autumn in Jinan and Nanjing, and the campaigns in winter in Beijing, Dongying, and Mount Tai (2017) are newly reported in this study. More importantly, the novelty of this work lies in the integration of a multi-season, multi-site dataset with an ensemble machine learning algorithm to comprehensively assess the key driving factors of particulate NACs across different sampling locations and seasons.
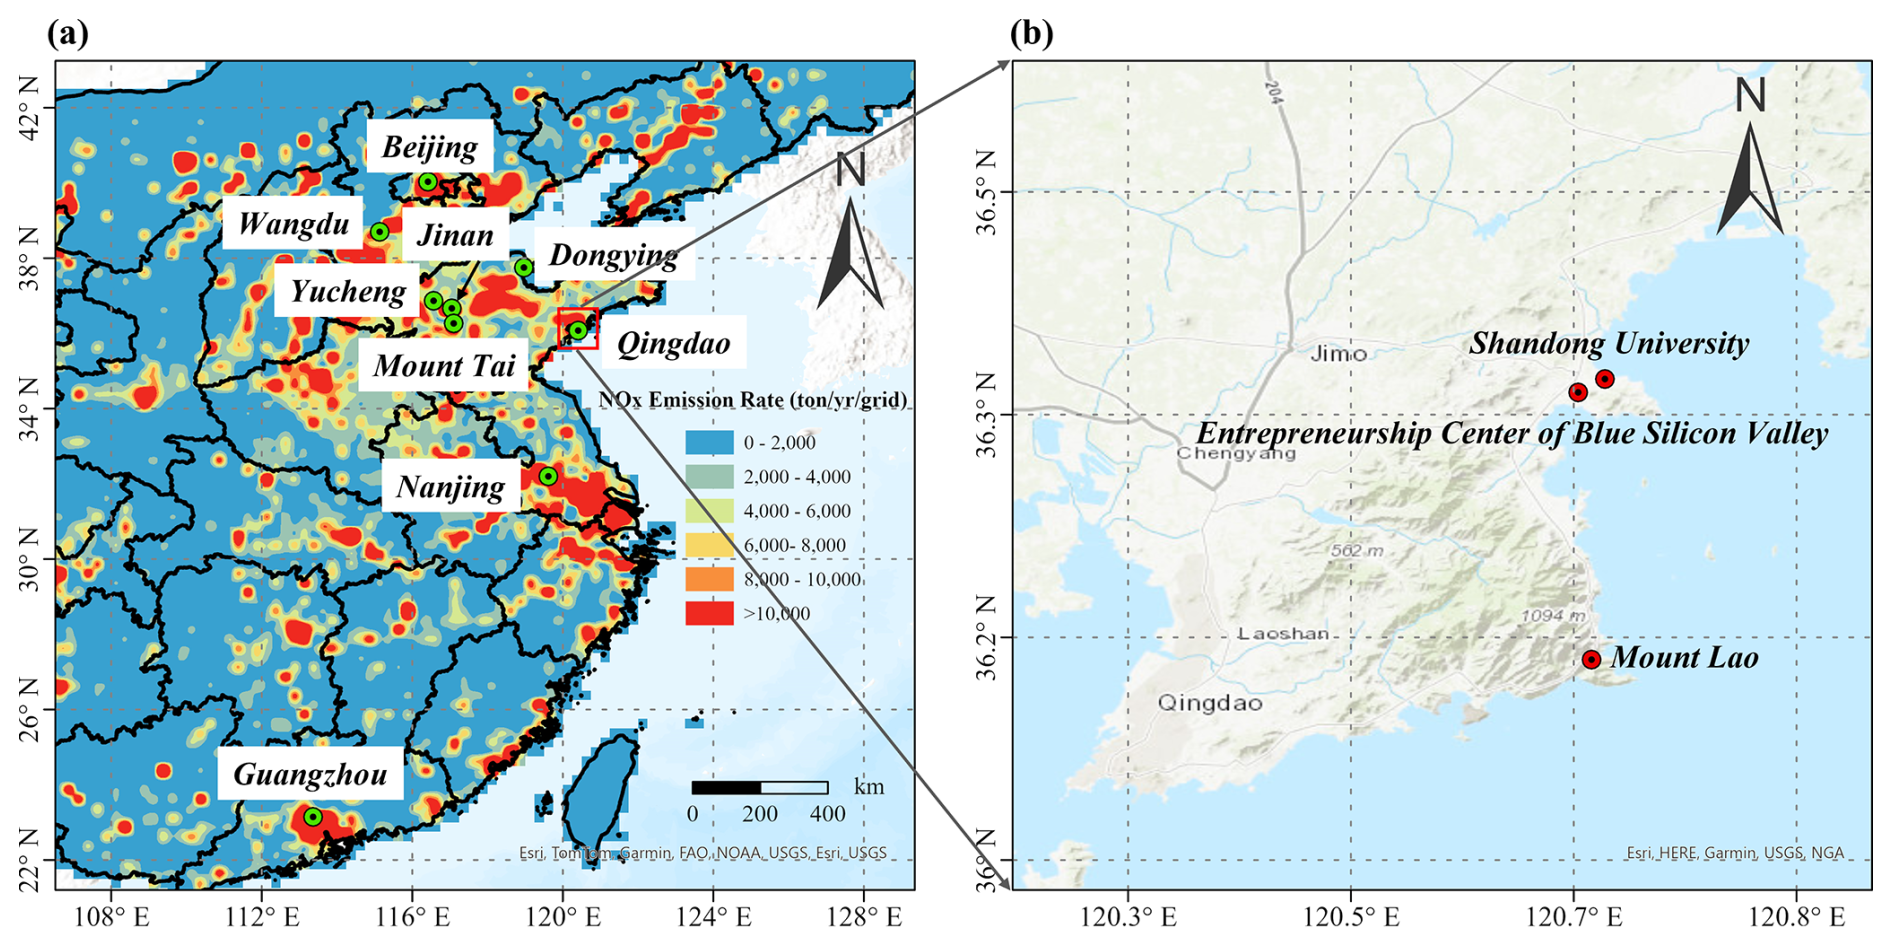
Figure 1(a) Map showing the sampling locations and (b) the different sampling sites located in Qingdao. The NOx emission data in 2019 were downloaded from the Multi-resolution Emission Inventory for China (MEIC) website (available at: http://meicmodel.org.cn, last access: 19 September 2024) (Li et al., 2017; Zheng et al., 2018).
In urban and rural sites, PM2.5 samples were collected with a medium-volume sampler (TH-150A, Wuhan Tianhong, China) at a flow rate of 100 L min−1, with daytime samples (08:00–19:30 LT) and nighttime samples (20:00–07:30) obtained daily. Two high-volume air samplers (TE-6070, Tisch, USA; TE-5170, Tisch, USA) at flow rates of 994 and 1000 L min−1 were used to collect PM2.5 samples at Mount Tai (only in 2019) and Mount Lao, separately, with temporal resolutions of 3 h during the daytime (07:00–22:00) and 9 h during the nighttime (22:00–07:00 the next day). Fine particulate matter was collected on pre-baked quartz-fiber filters (Pallflex, USA), and 613 aerosol samples were obtained in total. Blank samples were acquired before and after the field campaigns without sucking air, and the filter samples were immediately placed in clean plastic boxes or wrapped with pre-baked aluminum foil and stored at −20 °C in darkness for subsequent chemical analysis.
Several major tracer gases (SO2, NO, NO2, and O3) were simultaneously monitored by online analyzers at most sampling sites. For the Nanjing and Guangzhou sites, where on-site gas measurements were not available, the corresponding data were downloaded from the China National Environmental Monitoring Centre (available at: https://air.cnemc.cn:18007/, last access: 10 August 2024). NO concentrations were unavailable at these two sites due to data limitations and were therefore excluded from this study. Meteorological parameters, such as temperature and relative humidity, were recorded by automated meteorological stations or obtained from Weather Underground (available at: https://www.wunderground.com, last access: 15 August 2024). Detailed information on the trace gas analyzers and meteorological stations is provided in Sect. S1. Other hourly meteorological data for all sampling sites, including SSR, boundary layer height (BLH), horizontal wind speed (WS_H), and vertical wind speed (WS_V) at a height of 10 m (a.g.l.), were taken from the European Centre for Medium-Range Weather Forecasts (ECMWF, ERA5 data). Particle number size distributions at Mount Tai in 2019 were measured by a scanning mobility particle sizer (SMPS, Grimm, Germany), which was used to derive the aerosol surface area (Sa) data. Additionally, Sa data for the remaining sites were estimated by using predictive-capability machine learning algorithms based on the input variables of PM2.5 and meteorological parameters. Detailed descriptions on the estimation method of Sa can be found in Sect. S2 and Fig. S1, and the predicted Sa results are shown in Fig. S2.
2.2 Chemical analysis
The analytical protocol of particulate NACs in PM2.5 samples used in this study was adapted from those developed by Kitanovski et al. (2012) and Wang et al. (2018). Briefly, the filter samples were extracted ultrasonically or with a thermostatic orbital shaker with methanol (containing 30 µL saturated ethylenediaminetetraacetic acid, EDTA) for 30 min and repeated three times. The extracts were filtered through 0.20 µm polytetrafluoroethylene syringe filters (PTFE, Millex-FG, Millipore) to remove insoluble matters. They were then evaporated and concentrated using ultrahigh-purity nitrogen to dryness, and the concentrates were re-dissolved in 300 µL methanol containing the internal standard. All the sample solutions were analyzed by ultrahigh-performance liquid chromatography coupled with a mass spectrometer (UHPLC-MS, Thermo Scientific, USA) detector operating in negative mode under selected ion monitoring (SIM) mode. Finally, the following 12 target compounds were identified based on retention time and spectra of the standards, including NPs – 4-nitrophenol (4NP), 3-methyl-4-nitrophenol (3M4NP), 2-methyl-4-nitrophenol (2M4NP), and 2,6-dimethyl-4-nitrophenol (2,6DM4NP); NCs – 4-nitrocatechol (4NC), 4-methyl-5-nitrocatechol (4M5NC), 3-methyl-6-nitrocatechol (3M6NC), and 3-methyl-5-nitrocatechol (3M5NC); NSAs – 5-nitrosalicylic acid (5NSA) and 3-nitrosalicylic acid (3NSA); and DNPs – 2,4-dinitrophenol (2,4DNP) and 4-methyl-2,6-dinitrophenol (4M2,6DNP). Standard curves, derived from the gradient concentrations of the authentic standard mixtures, were utilized to quantify the contents of the above 12 NACs. More detailed analytical methods are provided in Sect. S3 of the Supplement. It should also be noted that due to methodological differences, the species of measured NACs varied across various locations and seasons, as specified in Table S1. Additionally, the average recovery rates for the filter samples were determined to be within the range of 81.5 % to 106.5 %, and the field blank signals of most species accounted for less than 3 % of NACs in the ambient NACs, while NSAs and DNPs in the blanks contributed approximately 10 % to the determined NACs, which were considered in the subsequent calculations. Moreover, the instrumental precision was determined by repeated analysis of standard solutions (n=5) under the same operating conditions, yielding relative standard deviations of ±3.8 % for the target NACs, which indicates high analytical reproducibility. Taking into account errors from extraction recovery rates, instrumental precision, and blank subtraction, the total measurement uncertainty for NACs was estimated to be approximately ± 19.1 %.
2.3 Positive matrix factorization model
The PMF model (EPA 5.0) is a useful tool for qualitatively identifying the NAC sources and quantitatively assigning their contributions to the total NACs, and it is employed in our study. The fundamental principles of the PMF model can be described as follows in Eq. (1) (Paatero and Tapper, 1994):
where Xi×j represents the observed data matrix, with i samples and j chemical species. Gi×p and Fp×j are the source contribution matrix and source profile matrix, respectively. p is the number of sources contributing to the NACs. Ei×j represents the residual error matrix capturing the difference between the measured and simulated data, which was calculated by minimizing the function Q based on Eq. (2):
where ui×j is the uncertainty, which was determined through the comparison with the detection limit. Detailed information can be seen in the previous study by Zhang et al. (2018).
In this study, the PMF input matrix consisted of 613 daily aerosol samples and 10 components (including 4NP, 3M4NP, 2M4NP, 4NC, 4M5NC, 3M6NC, 5NSA, 3NSA, NO2, and O3). For the input data, the treatment and calculation of the concentrations and associated uncertainties for each species followed the methodology described in our previous study (Li et al., 2020a). Here, by comparing the Q value results with two to six factor numbers, the optimal number of source factors was determined to be four. Specific details of the PMF model configuration and evaluation can be found in Sect. S4 and Fig. S3. Based on the outputs from the PMF model, four major sources of NACs – including coal combustion (CC), traffic emission (TE), secondary formation associated with gas-phase reaction (GR), and biomass burning (BB) – were identified from samples collected at the 11 sampling sites (Sect. S4), and the corresponding source profiles are presented in Fig. S4.
2.4 Ensemble machine learning model
Four widely employed ML algorithms, including random forest (RF), extreme gradient boosting (XGBoost), light gradient boosting machine (LightGBM), and multilayer perceptron (MLP), were selected in this study for model development. RF is an ensemble learning method that constructs multiple decision trees, with the strength in its interpretability (Wang et al., 2022b; Petkovic et al., 2017). XGBoost, a gradient boosting learner that optimizes performance and efficiency, has strengths in stability and precision (Si and Du, 2020; Gui et al., 2020). LightGBM is a gradient boosting framework designed for high efficiency and scalability (Ju et al., 2019; Ma et al., 2022). MLP, as a class of feedforward artificial neural network, has advantages in flexibility and the ability to handle nonlinear relationships (Reifman and Feldman, 2002). Detailed information about these four ML algorithms is provided in Sect. S5.1.
The dataset (613 rows) used for the four ML algorithms consisted of 11 parameters as inputs, including PMF-derived source contributions, meteorological conditions (T, BLH, RH, SSR, WS_H, and WS_V), and heterogeneous reaction represented by the aerosol surface area (Sa), all of which influence the sources and sinks of NACs. To avoid circular reasoning, the ML model was constructed to predict the total concentration of NACs as the target variable. The four PMF-derived source contribution factors, which serve as independent explanatory variables capturing source-type influences, were used as input features instead of individual NAC species. This approach ensures a clear separation between PMF inputs and the ML target, effectively preventing data leakage or double counting. The whole dataset was randomly divided, with 80 % allocated to the training set and the remaining 20 % to the testing set. Then, grid search and 10-fold cross-validation were employed to prevent overfitting and tune the optimal hyperparameters. The performances of model outcomes were evaluated using the coefficient of determination (R2), mean absolute error (MAE), and root mean squared error (RMSE), and the optimal hyperparameters are listed in Table S2. As shown in Fig. S5, XGBoost and LightGBM models exhibited better performances, with lower MAE (6.82 and 7.38 ng m−3, respectively) and RMSE values (11.05 and 12.07 ng m−3, respectively) than the other two ML models. Meanwhile, the modeled NACs by the XGBoost and LightGBM algorithms were highly consistent with the observed data, with R2 values of 0.88 and 0.86, respectively. The RF model also performed well, with an R2 value of 0.85, while the MLP model demonstrated inadequate forecasting performance (R2=0.60).
Due to the unique strengths and limitations of different ML algorithms, the integrated EML model enhanced the predictive performance by leveraging the strengths of each ML algorithm, while mitigating their weaknesses (Opitz and Maclin, 1999). Therefore, the base learners (RF, XGBoost, and LightGBM) were selected and integrated into the EML model framework based on a ridge regression model (Carneiro et al., 2022), and 10-fold cross-validation was applied to prevent overfitting. The evaluation results showed that the EML model exhibited higher accuracy and precision, with the R2 of 0.91 with MAE and RMSE of 6.11 and 9.94 ng m−3, respectively (Fig. S6), making it the preferred option for the subsequent analysis. To further evaluate the generalizability of the EML model, a leave-one-site-out cross-validation approach was implemented. The data from each site were iteratively excluded from model training and used exclusively for testing, ensuring complete independence between training and testing sets. The results show that this model exhibits robustness and transferability rather than being limited to specific scenarios (see Fig. S7). Additionally, multi-target predictions were conducted by using the EML model with different functional groups of compounds, including NPs, NCs, and NSAs, simultaneously set as target variables. Different types of NACs also exhibited very good predictive performances with R2 of 0.90, 0.85, and 0.93 for NPs, NCs, and NSAs, respectively, confirming the computational accuracy and the strong ability to solve nonlinear relationships (shown in Table S3). Furthermore, to quantify the contributions of input features to the target variable, the SHAP algorithm was employed in this study, which evaluated the specific impacts of different driving factors based on the marginal contribution of individuals within the framework of cooperative game theory. This approach enables a robust and interpretable explanation of the relationship between each predictor and the average model prediction. Detailed information about the EML assessment method and the SHAP algorithm is introduced in Sect. S5.2 and S5.3 in the Supplement, respectively.
The latest scikit-learn packages (https://scikit-learn.org/stable/, last access: 25 April 2025) are used for running the ensemble machine learning model, and the SHAP algorithm (https://shap.readthedocs.io/en/latest/, last access: 27 April 2025) is applied for quantifying each feature's contribution to NAC concentrations, which are performed in a Python (v 3.11) environment.
3.1 Seasonal and spatial variations of NACs
The particulate NACs measured in this study exhibited relatively high levels, with an average total concentration of 28.5±32.7 ng m−3 across four seasons at 11 sampling sites. As shown in Fig. 2, the concentrations of fine particulate NACs exhibited distinct seasonal variations, with the highest total concentrations appearing in winter (42.0±38.3 ng m−3, mean ± standard deviation), followed by autumn (18.3±22.8 ng m−3), spring (13.5±11.2 ng m−3), and summer (10.6±9.2 ng m−3). The above seasonal variation trend is consistent with other whole-year observations in urban Xi'an, Beijing, and Hong Kong, China (Yuan et al., 2021; Chow et al., 2016; Wang et al., 2021; Yang et al., 2020); rural Flanders, Belgium (Kahnt et al., 2013); and Mount Wuyi, China (Ren et al., 2023). Such a large seasonal difference in NAC abundances can be attributed to discrepant emission intensities, formation rates, and meteorological conditions. As seen in Table 1, NO2, which acts as an important nitration agent in NAC formation and a major tracer of traffic emissions, also showed higher concentrations in winter, autumn, and spring when compared to summer. Meanwhile, SO2 and CO, which share common anthropogenic sources such as coal combustion and biomass burning, also exhibited higher levels in cold seasons than in the hot season at the same site. In addition, the lower temperature in winter was favorable for gas-to-particle partitioning of NACs and their precursors. Additionally, the accumulation of NACs during the cold season was exacerbated by relatively weak radiation and the presence of a lower mixed boundary layer. Conversely, during summer, strong light intensity, favorable diffusion conditions, and the abundant oxidants facilitate the photolysis and dilution of NACs. Furthermore, the abundance of NACs also varied greatly with locations. In general, elevated NAC concentrations were observed at urban and rural sites when compared with mountain environments. It is because there were higher emissions and/or formation rates at urban and rural sites, especially under the conditions of high NOx and intensive anthropogenic VOCs, while mountain sites were rarely affected by anthropogenic emissions. Moreover, data from 2014 to 2021 revealed no significant trends in NAC concentrations across the same seasonal and site-type conditions; therefore, temporal variation was not considered a primary focus of this study.
Table 1Sampling information and average concentrations (± standard deviation) of NACs (unit: ng m−3), trace gases, and meteorological parameters.
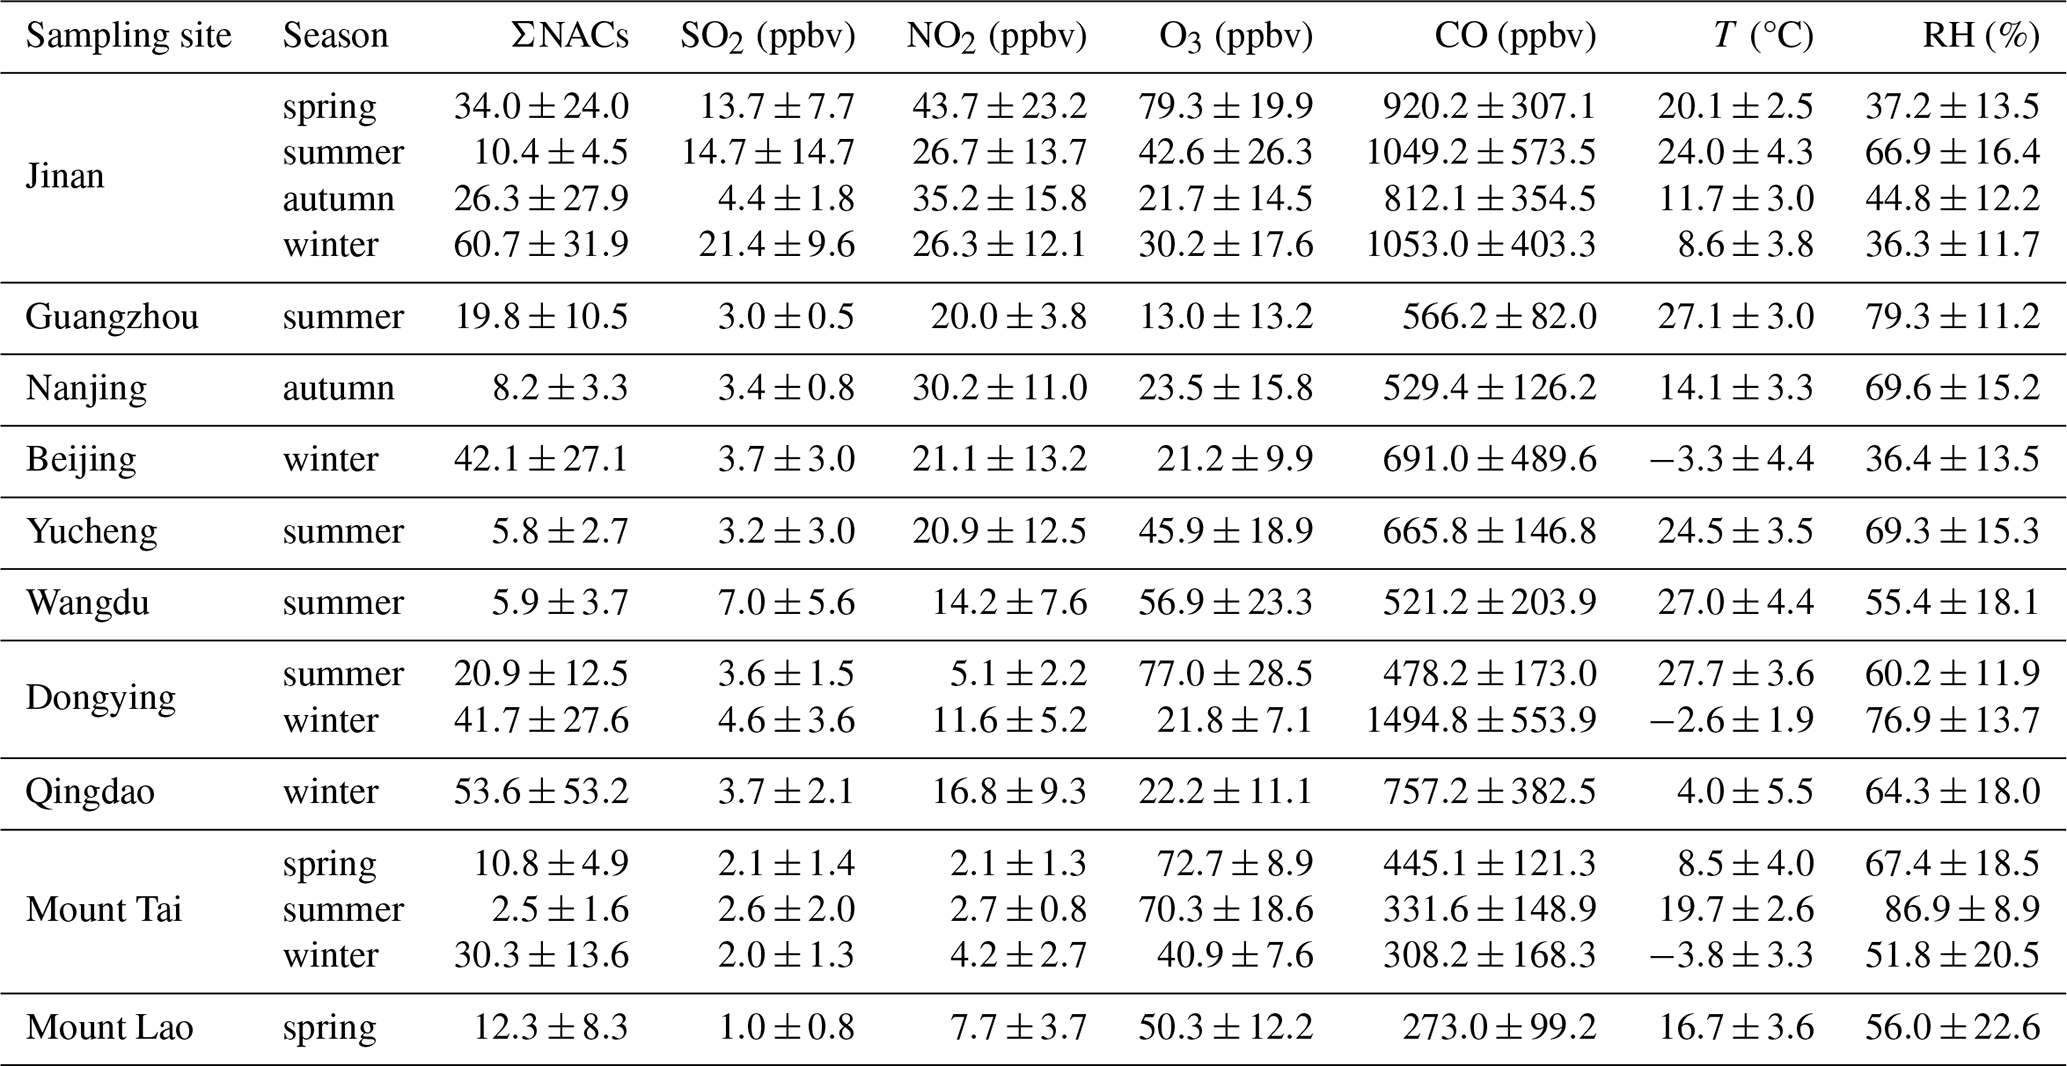
Figure 3 compares the abundances of particulate NACs across different sites in the same season by similar analytical methods. During springtime, the average NAC concentrations in Jinan in this work were comparable to those reported in urban Rome, Italy (Cecinato et al., 2005), and significantly higher than those in other urban, rural, and mountain sites over the world (Fig. 3a). Summertime NACs measured in urban Jinan and Guangzhou also showed elevated concentrations when compared with those observed in other locations (Ren et al., 2022; Ikemori et al., 2019), which are mainly attributed to the large anthropogenic emissions in these two cities (Fig. 3b). Moreover, particulate NAC concentrations also showed higher levels in rural Dongying, where they were significantly affected by biomass burning activities in early summer, as confirmed by Zhang et al. (2021). Lower summertime particulate NAC concentrations were detected in rural sites (i.e., Wangdu and Yucheng), similar to the results in previous studies conducted in rural Xianghe, China (Teich et al., 2017), and urban Los Angeles, USA (Zhang et al., 2013) in summer. In addition, the average NAC levels in Jinan in northern China in autumn (Fig. 3c) was generally comparable to that measured in urban Beijing and Xi'an (Li et al., 2020c; Yuan et al., 2021) but higher than those observed in urban Hong Kong (Chow et al., 2016) and Nanjing (this study) in southern China, where it was relatively rarely affected by coal combustion and biomass burning and experienced frequent rainfall. Moreover, the wintertime observations in northern China in this study were as high as those in most previous studies, further indicating the high emissions and concentrations of NACs caused by intensified combustion activities for heating (Fig. 3d).
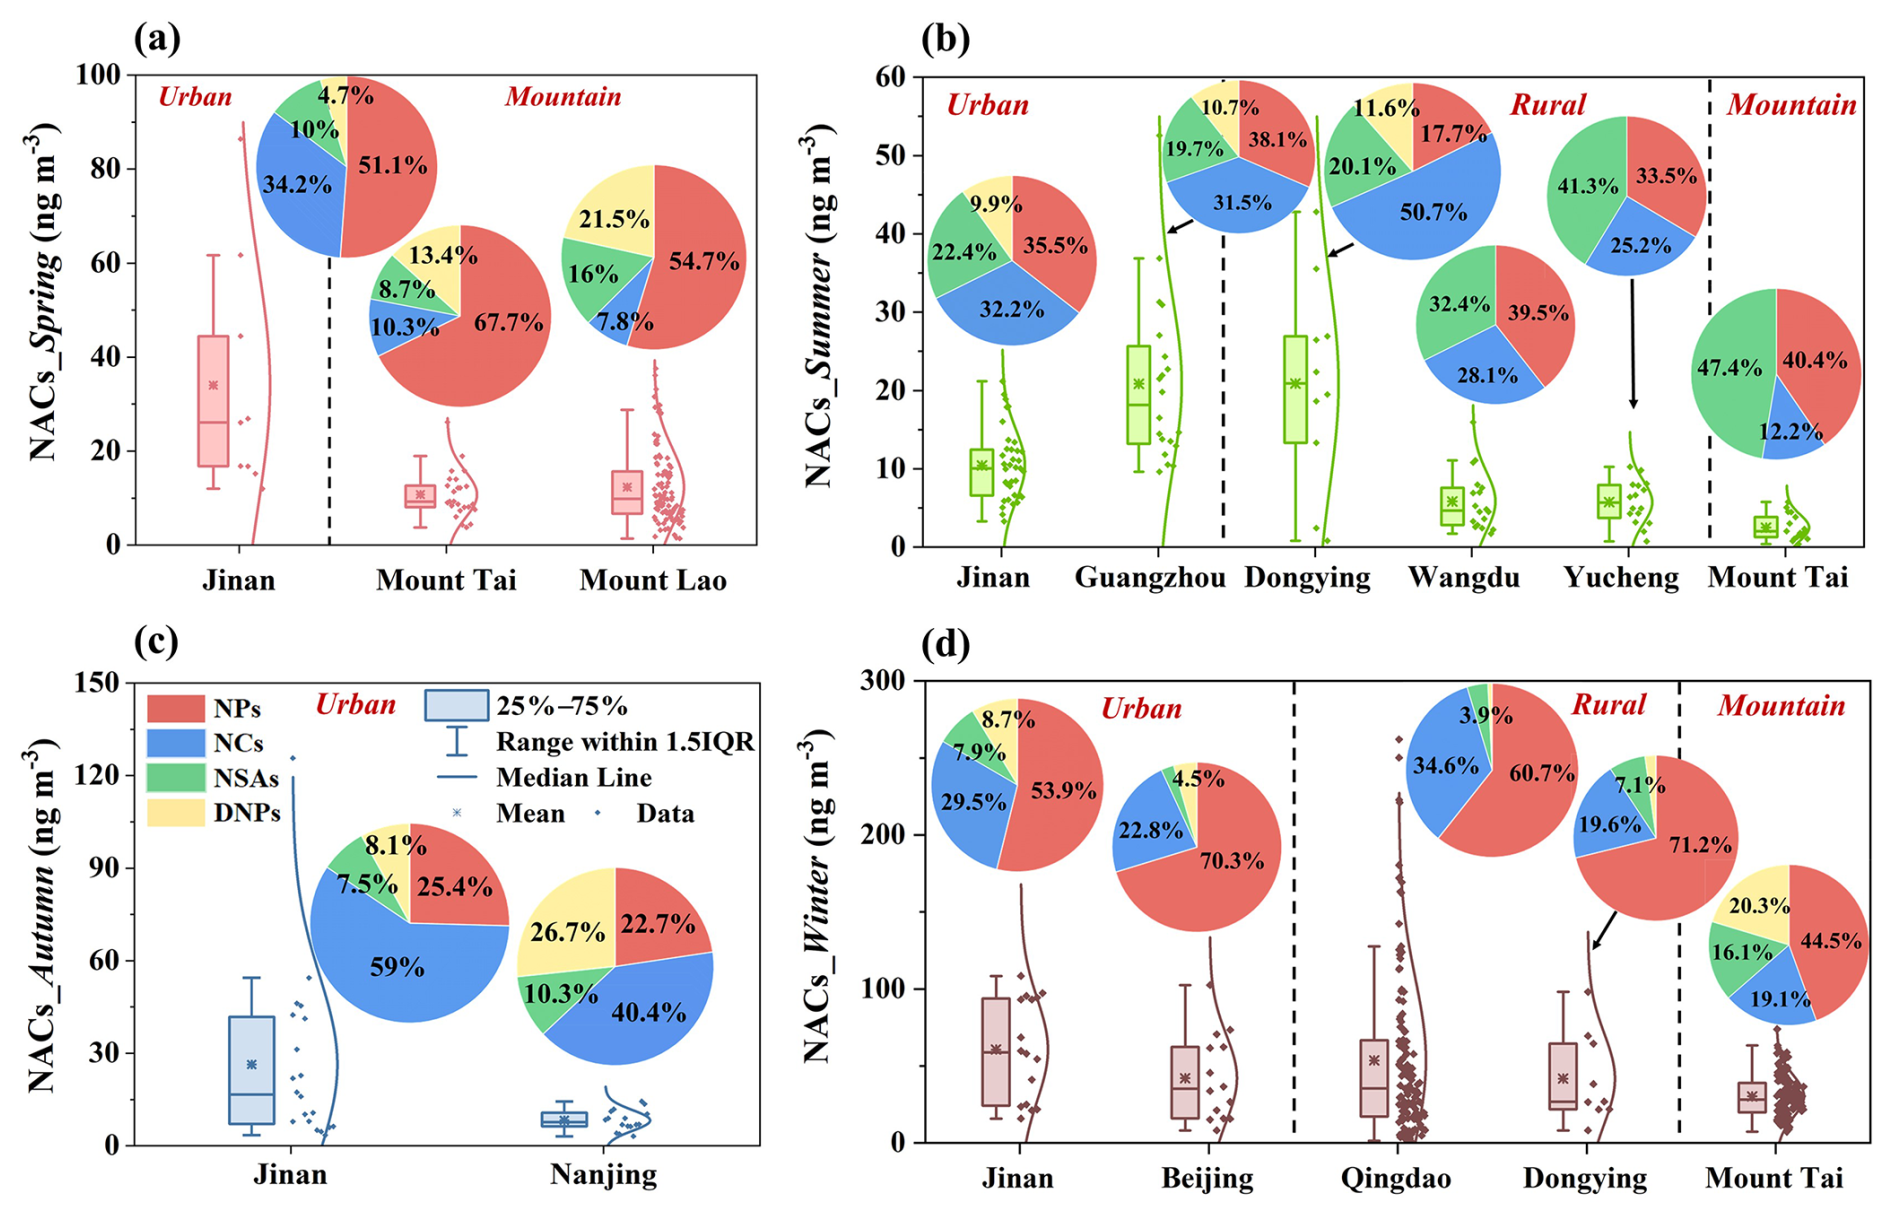
Figure 2Box plots of NAC concentrations and pie charts of their compositions at urban, rural, and mountain sites in different seasons.
The composition of particulate NACs also varied according to the sampling locations and seasons. As shown in the pie chart in Fig. 2, NPs and NCs were the most abundant species among the four categories of NACs at most urban and rural sites due to their higher emission factors, abundant precursors, and longer atmospheric lifetimes than other NACs. The dominance of NPs and NCs in this study coincides with the findings from previous studies in other locations (Cai et al., 2022; Li et al., 2020b; Wang et al., 2019). However, the fractional composition of NACs in spring and winter at mountain sites, being dominated by NPs and DNPs, differed from that at other types of sites. Previous studies have suggested that DNPs could be formed from further oxidation of NPs by acquiring a nitro group (Yuan et al., 2016); the elevated DNP fraction at mountain sites are mainly attributable to the secondary formation processes. Additionally, it should be noted that the increased proportions of NSAs were observed in rural and mountain sites in summer (Fig. 2b), which is in good agreement with a recent study in urban Nanjing (Cao et al., 2023) and the rural Indo-Gangetic Plain (IGP) (Rana and Sarkar, 2024). The dominance of NPs and NSAs at these remote sites may arise from aged plumes or intensive photochemical oxidation of aromatic precursors in the presence of NOx (Jang and Kamens, 2001). The above results suggest that the difference in particulate NAC compositions across various locations and seasons is probably associated with anthropogenic emissions and secondary formation processes.
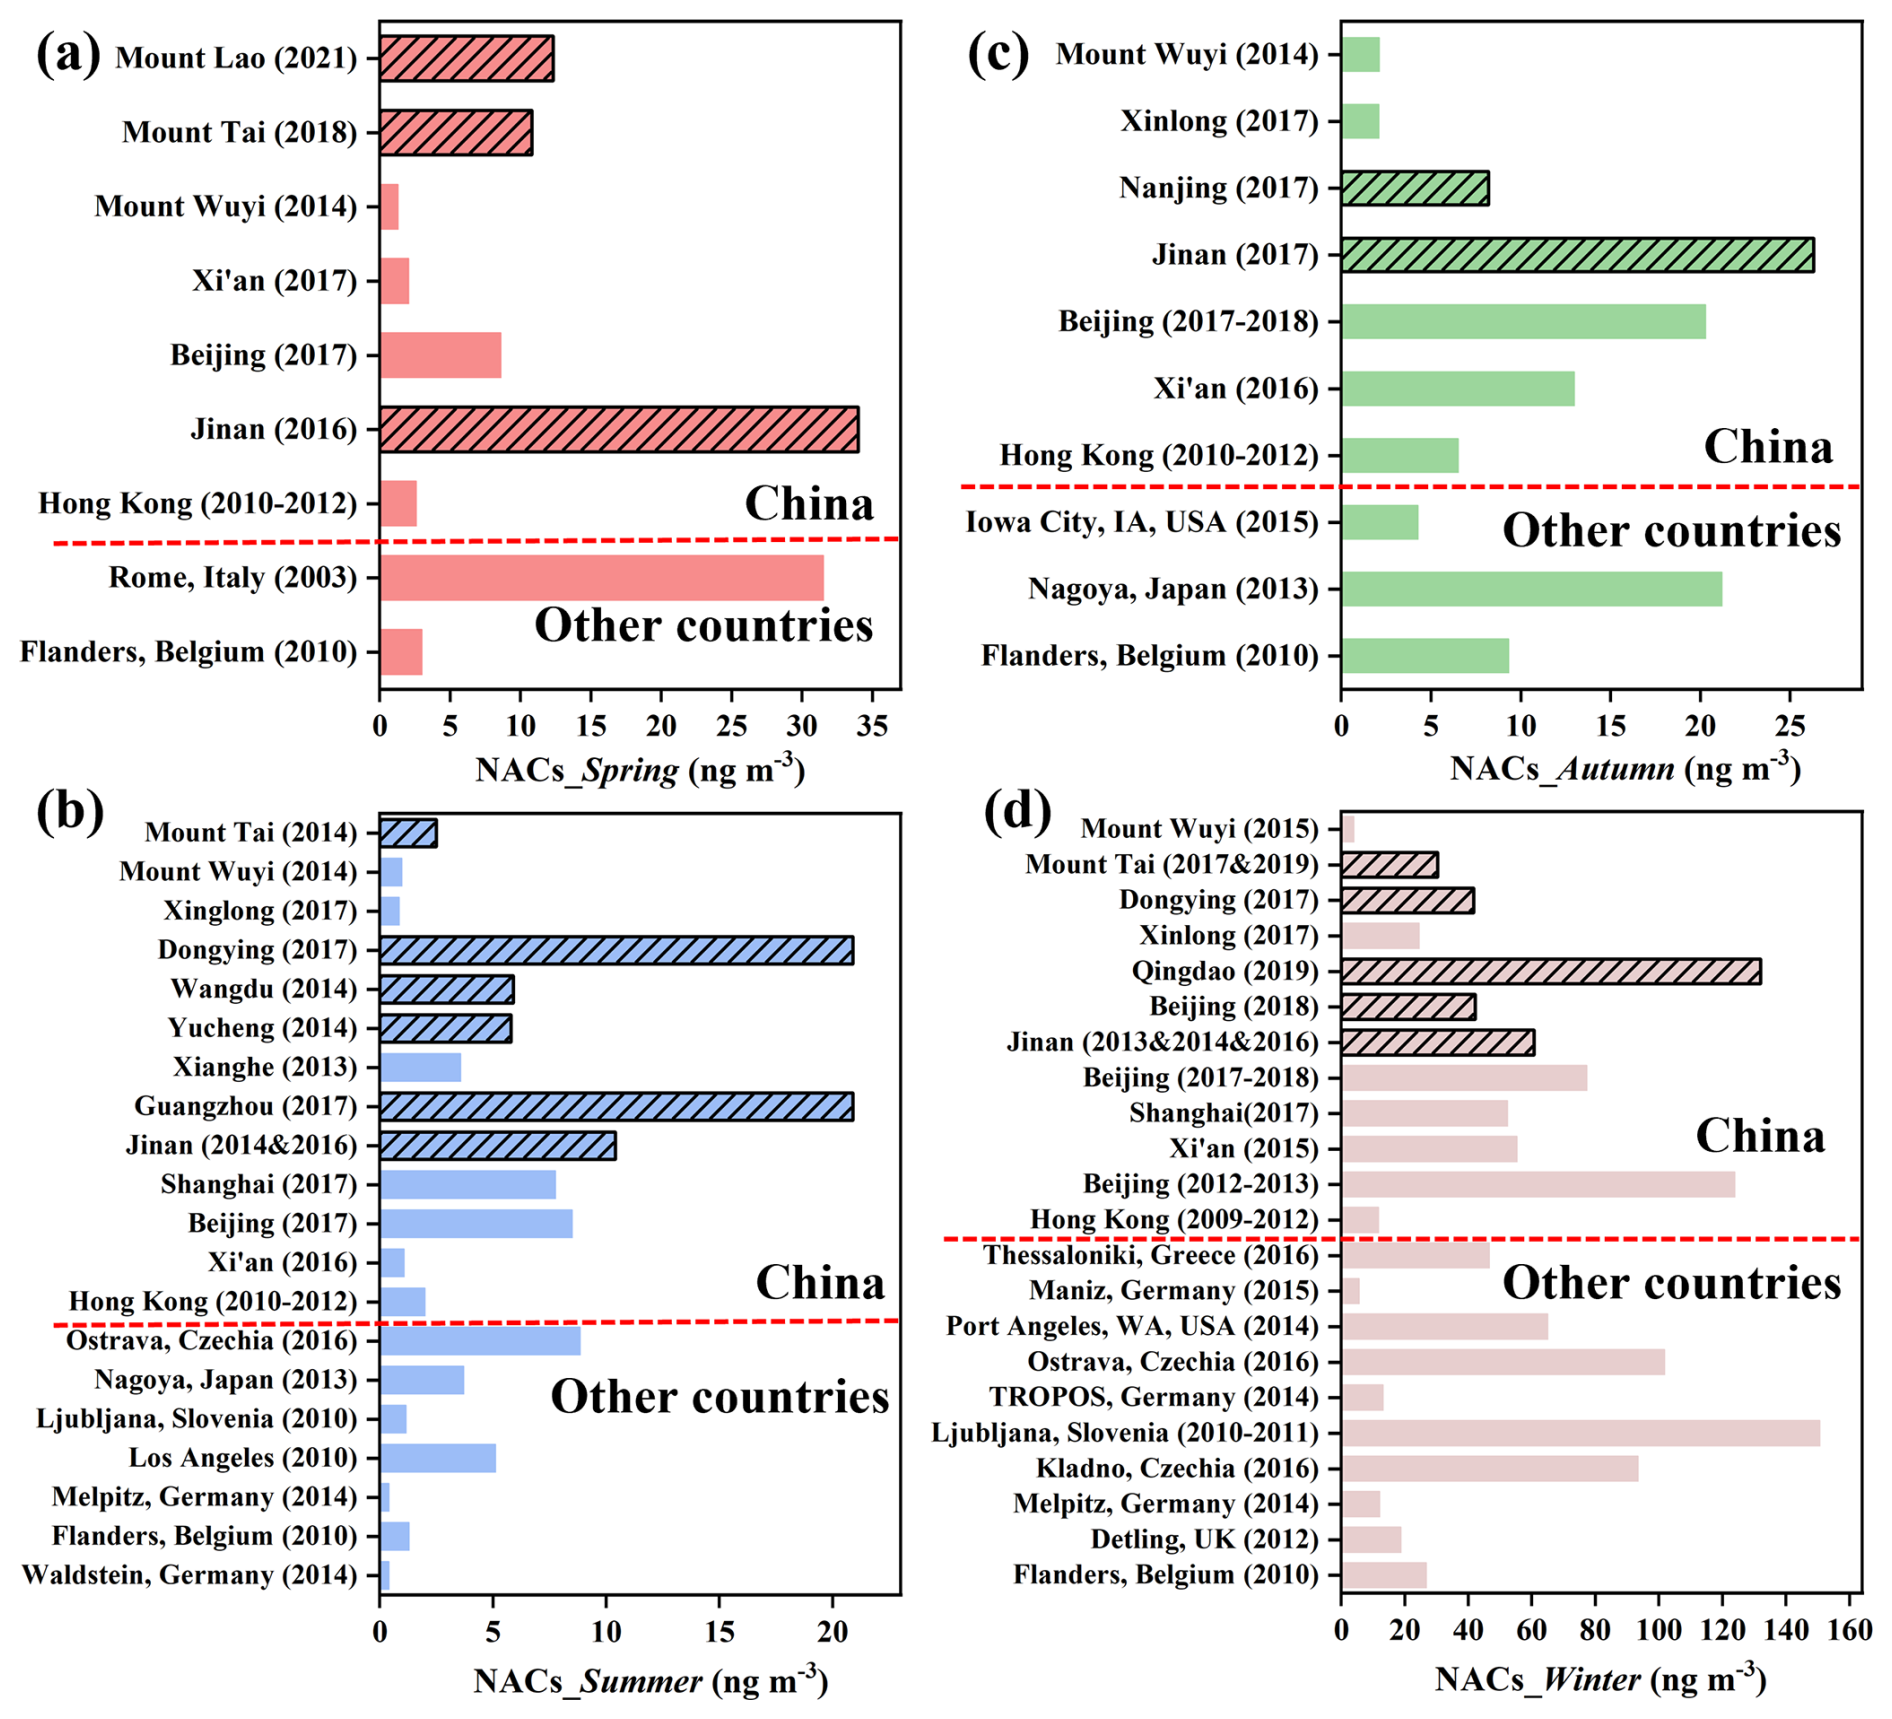
Figure 3Comparison of particulate NACs measured in this study (marked with filled black lines) with previous studies conducted in China and other countries in (a) spring, (b) summer, (c) autumn, and (d) winter.
3.2 Key driving factors of NACs variation identified by the SHAP approach
With the data of source apportionment, meteorological parameters (i.e., T, RH, wind speed, surface solar radiation, and boundary layer height), and particle loading (i.e., Sa), we further quantified the impacts of different primary emissions (PEs), meteorological factors, and secondary formation (SF). Including gas-phase reaction (GR) and heterogeneous reaction represented by aerosol surface area (Sa), we quantified their impacts on the variations of total NACs via the SHAP algorithm. The mean absolute SHAP values can be used to rank the major driving factors in the production (including emission and formation) and loss of fine particulate NACs across all samples, with a larger absolute SHAP value representing a higher influence on NAC levels. As shown in Fig. 4a, coal combustion ranked as the most important factor affecting NAC concentrations, exhibiting an average contribution of 8.0±4.9 ng m−3, followed by traffic emission, temperature, biomass burning, aerosol surface area, gas-phase reaction, boundary layer height, and surface solar radiation, with the SHAP values of 7.4±6.6, 6.9±3.0, 6.3±6.3, 5.6±7.1, 4.6±4.3, 1.9±1.8, and 1.0±0.8 ng m−3, respectively. The mean SHAP values of the remaining factors were less than 1.0 ng m−3, which had minor impacts on ambient NACs in this work. Overall, the major primary emissions, including coal combustion, traffic emission, and biomass burning, together contributed 49.3 % to the variation of NACs during the sampling periods, while meteorological conditions and secondary formation explained 27.4 % and 23.3 %, respectively (Fig. 4b). This enhancement in anthropogenic emissions is consistent with the findings reported in previous NAC studies (Wang et al., 2018; Yuan et al., 2021). However, the integration of the explainable EML framework constitutes a methodological advancement by enabling quantitative evaluation of source contributions, thereby providing a more nuanced and context-specific understanding of the driving factor across diverse atmospheric conditions.
Figure 4c–g show the SHAP values for each feature and each sample and display the relationships between the SHAP value and the feature value to investigate its influence on the variation of NACs. A positive SHAP value indicates that the variable increases the predicted NAC concentration relative to the baseline, whereas a negative SHAP value suggests that higher values of the variable are associated with a decrease in NAC concentrations. As shown in Fig. 4c, among the different primary sources, coal combustion, traffic emission, and biomass burning all exhibited a strong positive correlation with predicted NACs, in alignment with previous studies that suggest the important roles of anthropogenic emissions in driving high NAC concentrations. For example, our previous study determined that the emission factors of particulate NACs for residential coal combustion were 0.2–10.1 mg kg−1, with the total emission of 178 Mg in China in 2016 (Lu et al., 2019b). Particulate NACs were also detected from direct traffic emissions, with the emission factor reaching up to 89.6 µg km−1 (Nojima et al., 1983; Lu et al., 2019a). Furthermore, the emission factor of NACs from biomass burning can exceed 10 mg kg−1, which makes them regarded as key tracers of biomass burning organic aerosols (Wang et al., 2017; Iinuma et al., 2010). Gas-phase reaction also demonstrated a positive association with NAC formation, mainly attributed to the fact that oxidation and nitration of precursors acted as important formation pathways for atmospheric NACs. Additionally, temperature, as the leading meteorological contributor, showed a negative response to NAC formation (see Fig. 4d). This result confirms the recent finding that the concentrations of particulate NACs largely depend on the temperature-dependent partitioning between the gas and particle phase and are prone to formation at low ambient temperatures via enhanced transfer from the gas phase (Al-Naiema and Stone, 2017; Yuan et al., 2016). With the increase in aerosol surface area, its SHAP values increased accordingly (Fig. 4e), which is similar to the previous study in Beijing, where high Sa would facilitate gas–particle partitioning of NACs and their precursors and subsequent heterogeneous reactions (Wang et al., 2019). Notably, at low temperature (approximately <10 °C), the contribution on NACs exhibited an explosive enhancement, accompanied by a pronounced synergistic effect with higher Sa (Fig. S8), indicating enhanced gas-to-particle partitioning and heterogeneous formation. Conversely, at higher temperature, high Sa appears to suppress NAC formation, possibly as a result of intensified photochemical reactions facilitating gas-phase products, high temperature promoting the partitioning to the particle phase, or dilution effects caused by increased mixing heights in hot seasons. The relationship between boundary layer height and their SHAP values showed a nonlinear response (Fig. 4f), with a decreasing trend in low-BLH regimes (0–600 m), accompanied by a relatively constant SHAP value in high-BLH regimes (>600 m). In low-BLH conditions, increasing BLH levels reduced the concentrations of NACs due to the enhanced diffusion and dilution (Krautstrunk et al., 2000). When BLH was above 600 m, the BLH ceased to affect the surface concentrations of NAC. As to surface solar radiation, its SHAP values did not present an obvious correlation with its levels (Fig. 4g). Generally, high solar radiation can promote the secondary formation of some NACs (Vione et al., 2001), but it also acts as a sink for NACs via photolysis during the daytime (Bejan et al., 2020).
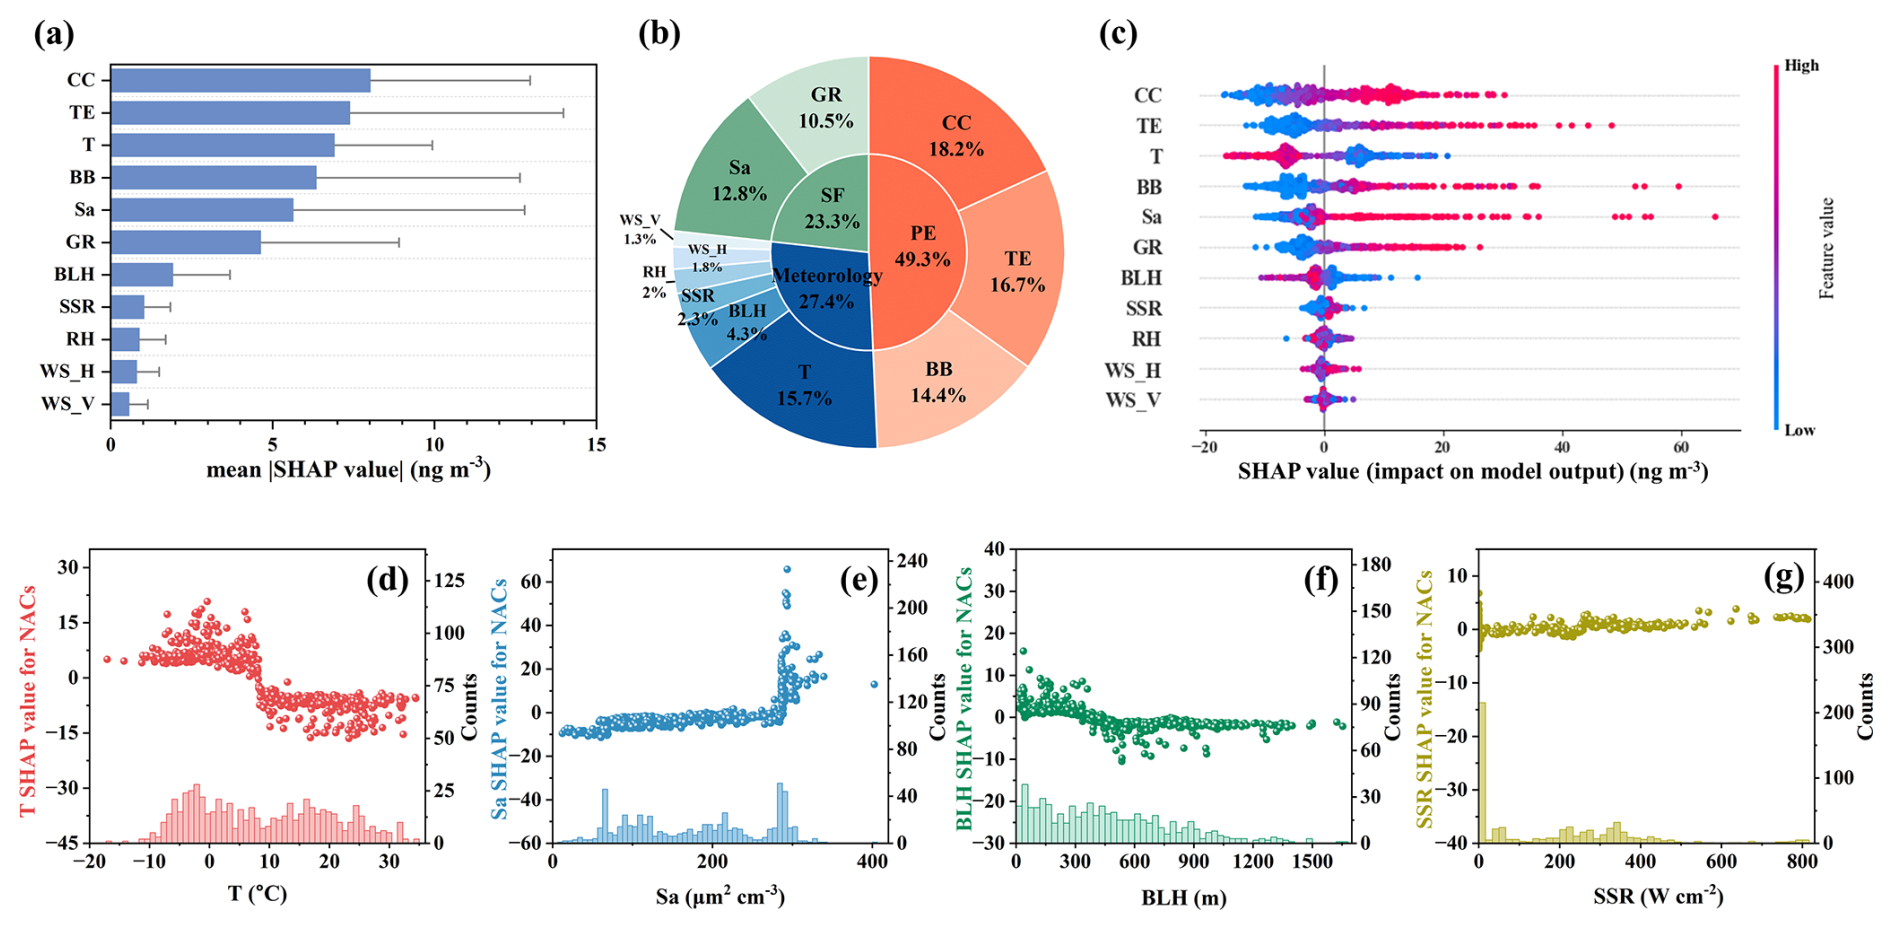
Figure 4(a) The ranking of the importance for all input variables (CC: coal combustion; TE: traffic emission; T: temperature; BB: biomass burning; Sa: aerosol surface area; GR: gas-phase reaction; BLH: boundary layer height; SSR: surface net solar radiation; RH: relative humidity; WS_H: horizontal wind speed; WS_V: vertical wind speed) calculated via the SHAP algorithm (average absolute contribution), (b) the impacts of driving factors on variations of NACs from SHAP analysis during the whole sampling periods (PE and SF represent primary emissions and secondary formation, respectively), (c) SHAP summary plots for all samples with the shift in color of the scatter plot from blue to red, indicating an increase in driving factor values, and the relationships between the SHAP values and parameter values for (d) temperature (T), (e) aerosol surface area (Sa), (f) boundary layer height (BLH), and (g) surface net solar radiation (SSR), with the right y axis corresponding to the frequency distribution of the measured variables.
3.3 Driving forces of NAC variation for different seasons and functional types
To make clear the dominant driving factors for the variations of fine particulate NACs in different seasons, the contribution of each factor during the four seasons is compared in Fig. 5. As shown in Fig. 5a–c, overall, primary emissions were still the main drivers, accounting for 45.9 %–62.5 % of NACs across the four seasons, with the lowest impacts appearing in winter. Among the four identified sources, coal combustion and traffic emissions had large impacts on the variation of NACs, with a total contribution of 67.3 %–80.8 %. Particularly, enhanced contributions from primary emissions, in particular traffic emissions, were noticed in autumn. As to meteorological parameters, according to the absolute SHAP values, temperature had the greatest impacts, with a contribution of 52.9 %–68.3 %. Additionally, the impacts of secondary formation on ambient NACs exhibit minimal fluctuation across different seasons, except in winter, when a slightly higher contribution (27.8 %) was observed.
Then, we further compare the positive or negative feature importance of various driving factors for the variations in particulate NACs. As shown in Fig. 5d–g, the impacts in spring, summer, and autumn were significantly different from those in winter. The most crucial driving factor in spring was coal combustion, contributing 6.9 ng m−3 to ambient NACs, followed by surface solar radiation and horizontal wind speed. In summer, the main influencing factor was traffic emissions, with the SHAP value of 2.6 ng m−3, followed by heterogeneous reaction (0.87 ng m−3) (Fig. 5e). Particularly, traffic emission stood out and exhibited a very high positive contribution to NAC levels in autumn with the SHAP value of 12.5 ng m−3 (Fig. 5f). However, during wintertime, temperature ranked first among all driving factors, with a contribution of 5.6 ng m−3 (Fig. 5g), followed by biomass burning (2.9 ng m−3), gas-phase reaction (2.1 ng m−3), and coal combustion (1.9 ng m−3). This difference implied that the low ambient temperature in winter strongly affected the emissions intensity and gas-to-particle partitioning, which enhanced the production of particulate NACs. The dominance of the impact of temperature rather than combustion sources in winter was also related to the relatively higher fraction of atmospheric samples from Mount Tai in this season. Moreover, the significant enhancements of primary emissions (i.e., biomass burning and coal combustion) and secondary formation in winter, when compared with autumn and summer, indicate that the air masses in winter were mainly associated with substantial emissions of anthropogenic pollutants and subsequent oxidation processes.
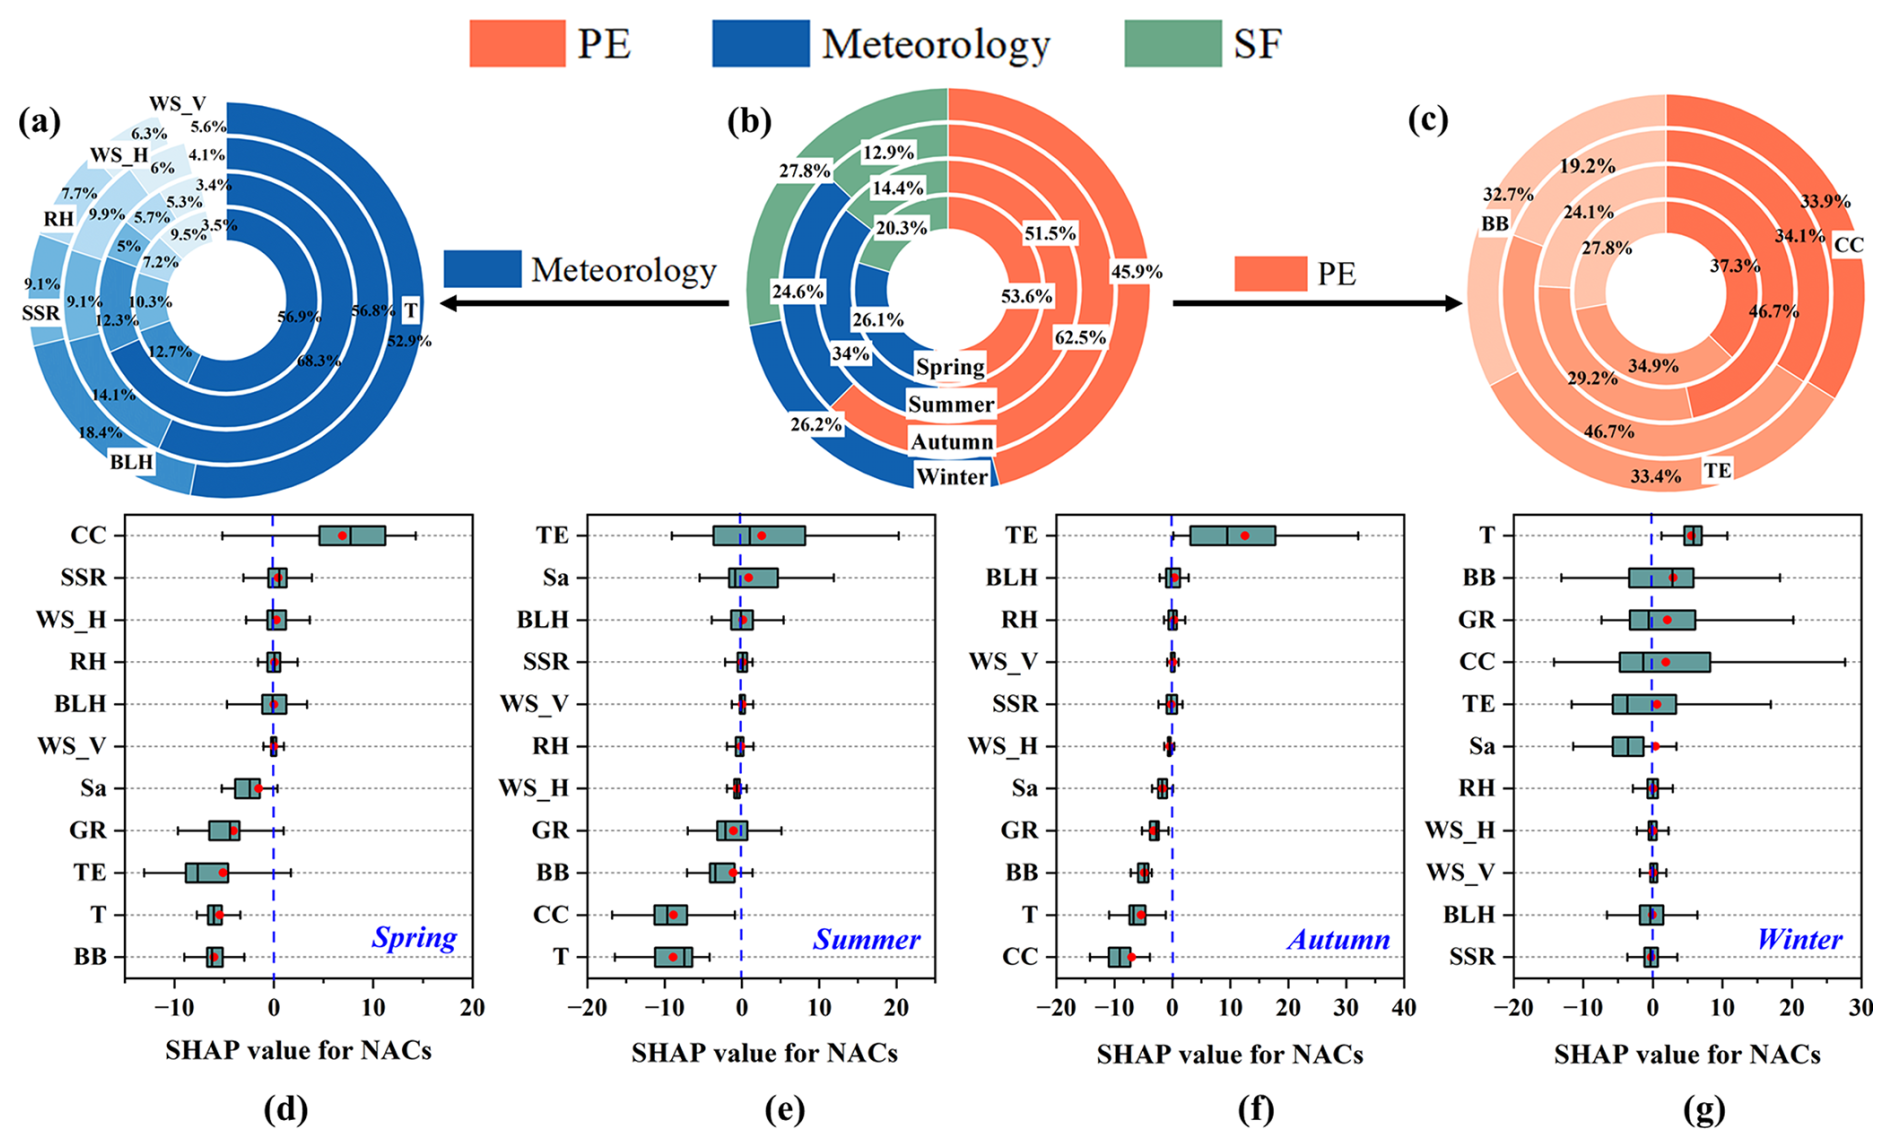
Figure 5The absolute contributions of (a) meteorological conditions, (b) all factors, and (c) primary emissions for the variations of NACs in four seasons from SHAP analysis and box plots with the order of SHAP values for each driving factor in (d) spring, (e) summer, (f) autumn, and (g) winter. PE and SF refer to primary emissions and secondary formation, respectively.
In addition, we further explore the differences in dominant driving factors for NACs with different functional groups (i.e., NPs, NCs, and NSAs) based on the model of multi-objective variables. Generally, it is evident that primary emissions played important roles in the variations of all three types of NACs, including NPs, NCs, and NSAs, with the highest contribution of 66.7 % for NCs, followed by NPs (50.2 %) and NSAs (23.1 %) (Fig. 6a–c). Meteorological parameters also exhibited high contributions to the variations of NPs with a mean value of 28.0 %, followed by NCs (17.4 %) and NSAs (13.5 %). Additionally, secondary formation contributed the most to particulate NSA levels, with a proportion of 63.4 %, which was obviously higher than NPs (21.8 %) and NCs (16.0 %). Specifically, as shown in Figs. 6 and S9a, coal combustion had the largest impact on NPs, followed by temperature and traffic emissions, with the average absolute SHAP values of 5.7±3.1, 4.3±2.1, and 3.9±2.7 ng m−3, respectively. This result aligns with previous studies that highlighted the intensive emissions of particulate NPs from coal combustion and traffic sources, with emission factors of 0.01–0.9 mg kg−1 and 1.7–26.7 µg km−1, respectively (Lu et al., 2019a, b). Besides, the semi-volatile characteristic and relatively high saturated vapor pressures of NPs make them more susceptible to the change in temperature, as confirmed by a previous observational study (Li et al., 2020a). For NCs, biomass burning showed a dominant effect on their variation, with the average absolute SHAP value of 4.6±5.8 ng m−3, contributing approximately 1.3 and 2.1 times more than traffic emissions and coal combustion, respectively (see Figs. 6 and S9b). The predominance of biomass burning as a source of NCs is in accordance with previous studies. As reported by a previous study of Wang et al. (2017), NCs were the most abundant compounds detected in freshly emitted particulate NACs during biomass burning periods. Apart from direct emissions, early measurements also identified cresol and substituted cresols from widespread wood burning activities, which were mainly produced from the pyrolysis of lignin. The oxidation of cresol, methylated cresol, and methyl-catechols emitted from biomass-burning-related sources is also expected as an important contributor to NCs (Iinuma et al., 2010). As to NSAs, they exhibited a strong positive association with gas-phase reaction (Fig. S9c), with the average absolute value of 1.7±1.3 ng m−3, suggesting that these compounds were mainly produced through the oxidation and nitration of precursors, which is consistent with other field observations (Yuan et al., 2021). Furthermore, aerosol surface area also contributed significantly to the variation of NACs, especially for NPs (2.6±3.9 ng m−3) and NCs (2.0±2.4 ng m−3) (Fig. 6f), indicating the important contribution from heterogeneous formation. Overall, the results demonstrate that the multi-target EML model effectively captured the distinct source contributions and formation pathways associated with different NAC subclasses. Coal combustion was identified as the most important driver for NPs, biomass burning dominated the formation of NCs, and NSAs were primarily linked to gas-phase formation. These findings highlight the strength of this integrated EML approach in differentiating functional group-specific drivers and emphasize the importance of targeted mitigation strategies for various NAC species.
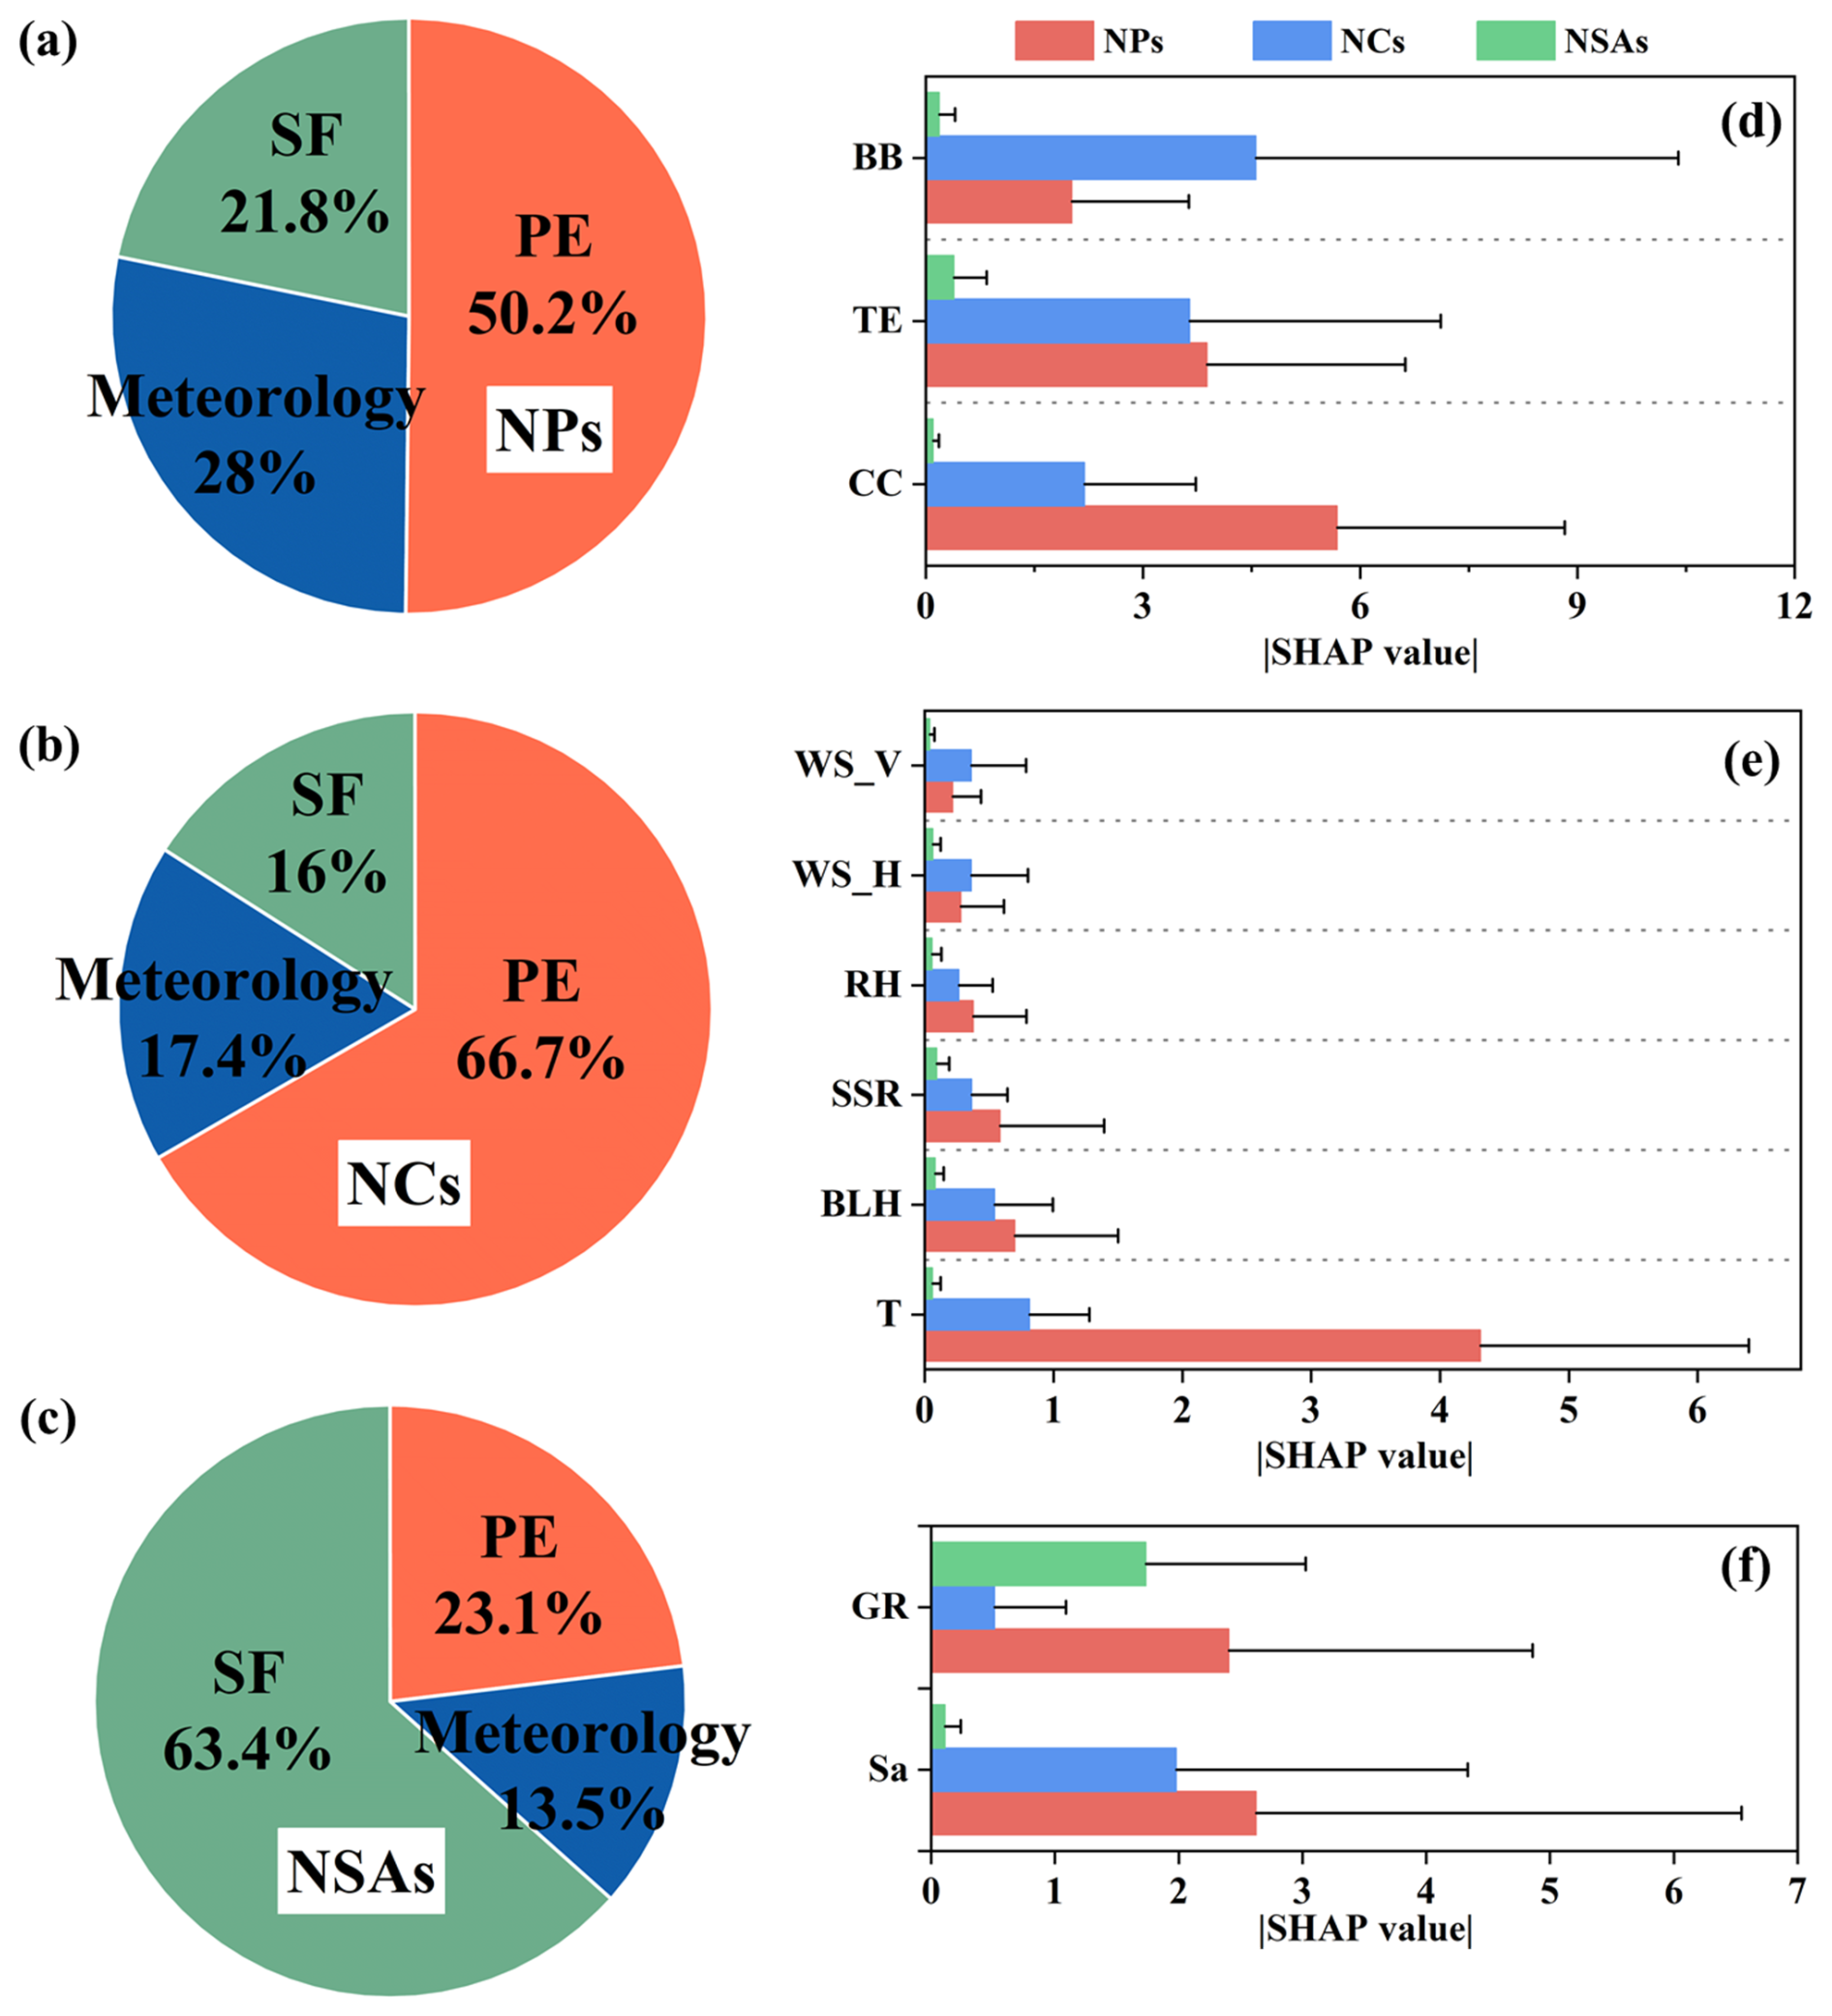
Figure 6The impacts of primary emissions (PE), meteorological conditions, and secondary formation (SF) on the variations of (a) NPs, (b) NCs, and (c) NSAs from SHAP analysis and relative importance of (d) primary emissions (including coal combustion (CC), traffic emission (TE), and biomass burning (BB)), (e) meteorological conditions (including temperature (T), boundary layer height (BLH), surface net solar radiation (SSR), relative humidity (RH), horizontal wind speed (WS_H), and vertical wind speed (WS_V)), and (f) secondary formation (including gas-phase reaction (GR) and heterogeneous reaction represented by aerosol surface area (Sa)).
3.4 Response of NACs to driving factors in different locations
To understand the combined impacts of three categories of driving factors (i.e., primary emissions, secondary formation, and meteorological conditions) on the variations of NACs, more than 300 samples collected in wintertime that covered multiple sites were selected for further analysis. Based on the discrepancies in geographical locations and emission intensity of air pollutants, these sampling sites were categorized into three scenarios: urban (Jinan and Beijing), rural (Dongying and Qingdao), and mountain (Mount Tai) areas.
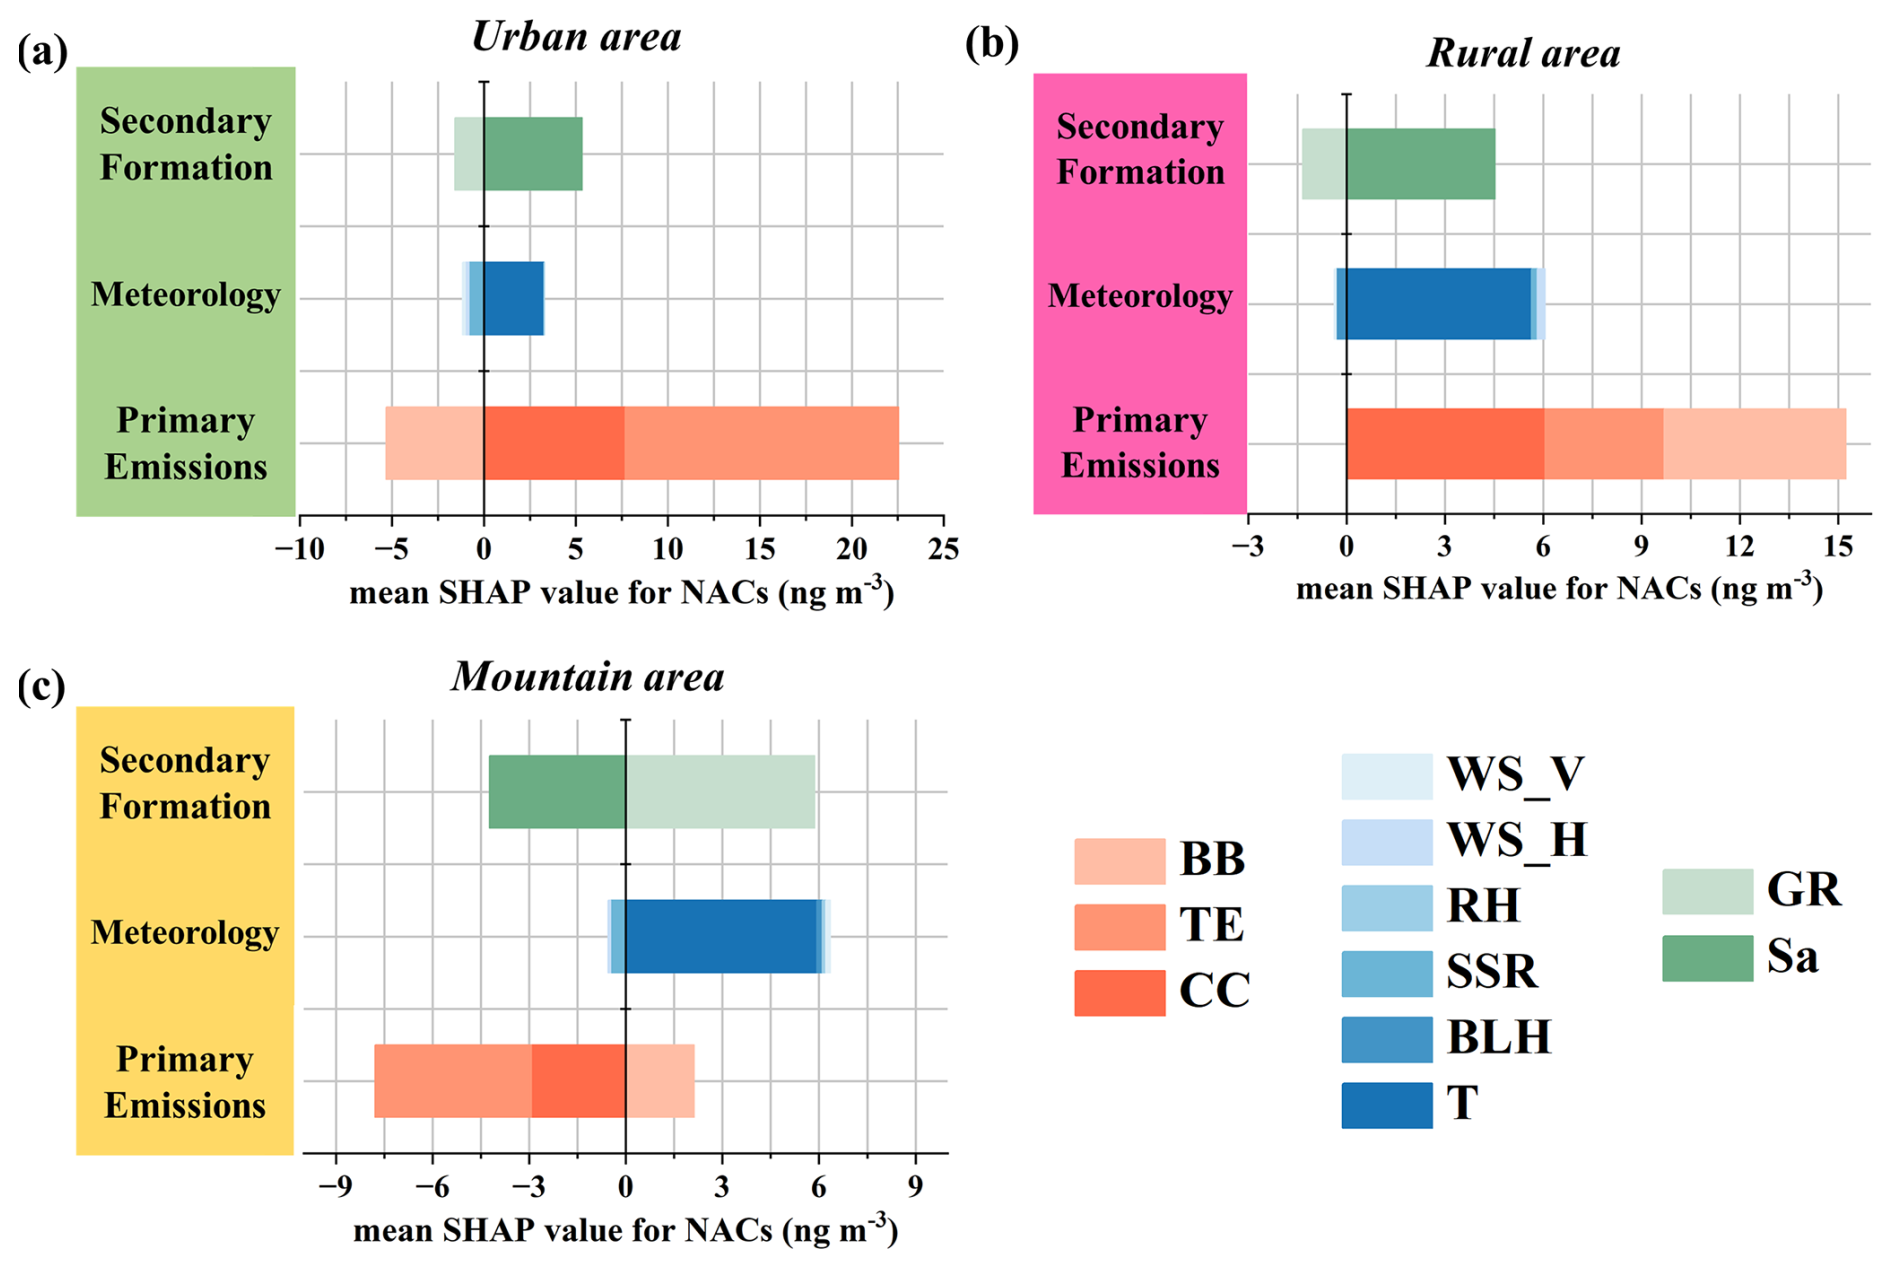
Figure 7The combined contributions of sources (i.e., coal combustion (CC), traffic emission (TE), and biomass burning (BB)), meteorological conditions (i.e., temperature (T), boundary layer height (BLH), surface net solar radiation (SSR), vertical wind speed (WS_V), horizontal wind speed (WS_H), and relative humidity (RH)), and secondary formation (i.e., gas-phase reaction (GR) and heterogeneous reaction represented by the aerosol surface area (Sa)) to the variations of NACs in (a) urban, (b) rural, and (c) mountain areas.
As shown in Figs. 7 and S10, there were large discrepancies in the dominant driving factors for fine particulate NACs across different locations. In urban areas, primary emissions exhibited positive impacts on ambient NACs, with the mean SHAP value of 17.2 ng m−3. Among the 11 variables, traffic emissions ranked first in urban areas, contributing 14.9 ng m−3 to the NAC variation, followed by coal combustion (7.7 ng m−3). The direct emissions from traffic sources have been reported as one of the significant contributors to the particulate NACs in urban areas (Delhomme et al., 2010; Sjögren et al., 1995). The observed enhancement of traffic emissions in this study is mostly responsible for the heavily trafficked urban districts in Jinan and Beijing, especially at rush hours. In rural areas, the integrated impacts of primary sources also contributed positively to particulate NACs, with mean SHAP values of 15.2 ng m−3. Coal combustion and biomass burning turned out to be the most important driving factors, with the mean SHAP values of 6.1 and 5.6 ng m−3, respectively, which can be attributed to emissions from central- and residential-heating activities in cold seasons. In contrast, at the mountain area, the mean contribution of primary sources reduced to −5.7 ng m−3. This negative value reflects the minimal contribution of local anthropogenic emissions in this region, resulting in lower concentrations of NACs compared to other sites. Then, gas-phase oxidation dominated; secondary formation significantly affected NAC levels, with the mean contribution of 5.9 ng m−3. This is ascribed to rare anthropogenic emission sources at the top of the mountain, where multiple oxidation and nitration reactions became remarkable. The relatively high concentrations of particulate NACs at the mountain site were also probably associated with the air mass transport from anthropogenic activities in urban regions (Jiang et al., 2022), with the mean SHAP value of 2.1 ng m−3 for biomass burning. These results indicate that primary sources served as the predominant contributors to particulate NACs in urban and rural areas, suggesting the necessity of making control policy on long-term reduction of anthropogenic emissions for addressing the NAC pollution. Additionally, temperature ranked high among all driving factors, with mean contributions of 3.3, 5.6, and 5.9 ng m−3 for urban, rural, and mountain areas, respectively, suggesting the enhanced partitioning of the gas-phase NACs into the particle phase under low temperature during wintertime. Besides, heterogeneous reaction represented by aerosol surface area also presented positive contributions at urban and rural areas, with the mean values of 5.3 and 4.5 ng m−3, respectively. Severely polluted sites in urban and rural areas tended to have increased particle number and high aerosol surface area density, which facilitated the partitioning of NACs and related precursors from the gas phase to the particle phase and the heterogeneous reaction processes. However, heterogeneous reaction showed negative impacts on NAC formation at the mountain site, which may be affected by various factors, such as relatively low atmospheric particulate matter levels, diffusion, and transport processes. The above machine learning results reveal the combined but differential contributions of primary sources, secondary formation, and meteorological conditions to the variations of ambient NACs in different locations. Particularly, this study provides a foundation for developing more precisely targeted control strategies on NACs, with implications for mitigate particulate matter pollution.
In this study, we applied a multi-target-variable ensemble machine learning framework coupled with the SHAP algorithm to explore the impacts of primary emissions, secondary formation, and meteorological conditions on fine particulate NACs in the atmosphere at urban, rural, and mountain sites based on field-observation datasets. The EML model showed satisfactory performance that could effectively capture and interpret the variations of ambient NACs during all the sampling periods. Overall, primary emissions, including coal combustion, traffic emission, and biomass burning, were the most important variables for NAC variations, contributing 49.3 % in total, while meteorological conditions and secondary formation accounted for 27.4 % and 23.3 %, respectively. Among the driving factors, primary emissions and secondary formation contributed positively to the enhancement of NACs, while temperature and BLH (<600 m) displayed negative impacts. Our results indicate that the main influencing factors of particulate NACs varied across the four seasons and various locations due to differences in pollutant emission intensities and meteorological conditions. Anthropogenic emissions represented primary sources of NACs in spring, summer, and autumn, whereas temperature turned out to be the most critical factor in winter, which may be associated with the higher sample coverage from Mount Tai among all the samples. In addition, the main drivers of NACs differed significantly among functional groups. Coal combustion and temperature served as the dominant driving factors for NPs, and biomass burning had the largest impact on ambient NCs. Meanwhile, gas-phase oxidation emerged as the most important contributor to the variation of NSAs. A detailed analysis of NAC formation and loss for different locations (including urban, rural, and mountain areas) during wintertime revealed significant impacts of temperature, secondary formation, and biomass burning on NACs at the mountain site. In contrast, the major contributors in urban areas were traffic emissions and coal combustion, and in rural areas, the major contributors were coal combustion and temperature.
This study integrated multiple field measurements with interpretable ensemble machine learning to investigate the impact of primary emissions, secondary formation, and meteorological conditions on atmospheric particulate NACs. The result elucidates the nonlinear atmospheric processes of particulate NACs and provides new insights into their sources and influencing factors in various atmospheric environments. Particularly, the integration of PMF-based source apportionment with a data-driven ensemble machine learning model and the SHAP analysis method proved to be a potent tool for rapidly diagnosing the driving factors for organic aerosols, which is helpful for the control strategies targeting aerosol pollution. This hybrid approach not only enhances the interpretability of ML results but also allows for a more robust and quantitative assessment of the contributions of individual sources and environmental drivers. In future research, utilizing larger-scale datasets and deep learning techniques are required to achieve more comprehensive and precise predictions and understanding of atmospheric NACs and other organic components.
| NACs | Nitro-aromatic compounds | BrC | Brown carbon |
| NPs | Nitrophenol and its derivatives | VOCs | Volatile organic compounds |
| NCs | Nitrocatechol and its derivatives | T | Temperature |
| NSAs | Nitrosalicylic acids | RH | Relative humidity |
| DNPs | Dinitrophenol and its derivatives | SSR | Surface net solar radiation |
| 4NP | 4-nitrophenol | PMF | Positive matrix factorization |
| 3M4NP | 3-methyl-4-nitrophenol | PCA | Principal component analysis |
| 2M4NP | 2-methyl-4-nitrophenol | ML | Machine learning |
| 2,6DM4NP | 2,6-dimethyl-4-nitrophenol | SHAP | SHapley Additive exPlanation |
| 4NC | 4-nitrocatechol | EML | Ensemble machine learning |
| 4M5NC | 4-methyl-5-nitrocatechol | BLH | Boundary layer height |
| 3M6NC | 3-methyl-6-nitrocatechol | WS_H | Horizontal wind speed |
| 3M5NC | 3-methyl-5-nitrocatechol | WS_V | Vertical wind speed |
| 5NSA | 5-nitrosalicylic acid | Sa | Aerosol surface area |
| 3NSA | 3-nitrosalicylic acid | EDTA | ethylenediaminetetraacetic acid |
| 2,4DNP | 2,4-dinitrophenol | BB | Biomass burning |
| 4M2,6DNP | 4-methyl-2,6-dinitrophenol | RF | Random forest |
| CC | Coal combustion | XGBoost | Extreme gradient boosting |
| TE | Traffic emission | LightGBM | Light gradient boosting machine |
| GR | Gas-phase reaction | MLP | Multilayer perceptron |
| PE | Primary emission | R2 | Coefficient of determination |
| SF | Secondary formation | MAE | Mean absolute error |
| RMSE | Root mean squared error |
The datasets used and analyzed during the current study are available from Mendeley (https://doi.org/10.17632/fp9zkv28p2.2; Li and Wang, 2025).
The supplement related to this article is available online at https://doi.org/10.5194/acp-25-8407-2025-supplement.
The original paper was written by ML. XW conceptualized the paper, designed the research, and revised the paper. ML, TL, and YW carried out the analysis and designed the figures. Sampling and laboratory analyses were conducted by ML, YJ, and RL. Data interpretation was supported by YZ, WN, JG, LX, QZ, and WW.
The contact author has declared that none of the authors has any competing interests.
Publisher's note: Copernicus Publications remains neutral with regard to jurisdictional claims made in the text, published maps, institutional affiliations, or any other geographical representation in this paper. While Copernicus Publications makes every effort to include appropriate place names, the final responsibility lies with the authors.
We sincerely thank the China National Environmental Monitoring Centre for providing the tracer gases data, as well as the Mount Tai Meteorological Station and Weather Underground for providing meteorological data. We also gratefully acknowledge the handling editor and reviewers for their insightful comments and suggestions, which have greatly improved the quality of the original paper.
This research has been supported by the National Key Research and Development Program of China (grant no. 2023YFC3706302) and the National Natural Science Foundation of China (grant nos. 42377094 and 42361144721).
This paper was edited by Qi Chen and reviewed by three anonymous referees.
Al-Naiema, I. M. and Stone, E. A.: Evaluation of anthropogenic secondary organic aerosol tracers from aromatic hydrocarbons, Atmos. Chem. Phys., 17, 2053–2065, https://doi.org/10.5194/acp-17-2053-2017, 2017.
Atkinson, R., Aschmann, S. M., Arey, J., and Carter, W. P. L.: Formation of ring-retaining products from the OH radical-initiated reactions of benzene and toluene, Int. J. Chem. Kinet., 21, 801–827, https://doi.org/10.1002/kin.550210907, 1989.
Atkinson, R., Aschmann, S., and Arey, J.: Reactions of hydroxyl and nitrogen trioxide radicals with phenol, cresols, and 2-nitrophenol at 296±2 K, Environ. Sci. Technol., 26, 1394–1403, https://doi.org/10.1021/es00031a018, 1992.
Bejan, I., Abd El Aal, Y., Barnes, I., Benter, T., Bohn, B., Wiesen, P., and Kleffmann, J.: The photolysis of ortho-nitrophenols: a new gas phase source of HONO, Phys. Chem. Chem. Phys., 8, 2028–2035, https://doi.org/10.1039/B516590C, 2006.
Bejan, I., Barnes, I., Olariu, R., Zhou, S., Wiesen, P., and Benter, T.: Investigations on the gas-phase photolysis and OH radical kinetics of methyl-2-nitrophenols, Phys. Chem. Chem. Phys., 9, 5686–5692, https://doi.org/10.1039/b709464g, 2007.
Bejan, I. G., Olariu, R.-I., and Wiesen, P.: Secondary Organic Aerosol Formation from Nitrophenols Photolysis under Atmospheric Conditions, Atmosphere, 11, 1346, https://doi.org/10.3390/atmos11121346, 2020.
Cai, D., Wang, X., George, C., Cheng, T., Herrmann, H., Li, X., and Chen, J.: Formation of Secondary Nitroaromatic Compounds in Polluted Urban Environments, J. Geophys. Res.-Atmos., 127, e2021JD036167, https://doi.org/10.1029/2021JD036167, 2022.
Cao, M., Yu, W., Chen, M., and Chen, M.: Characterization of nitrated aromatic compounds in fine particles from Nanjing, China: Optical properties, source allocation, and secondary processes, Environ. Pollut., 316, 120650, https://doi.org/10.1016/j.envpol.2022.120650, 2023.
Carneiro, T. C., Rocha, P. A. C., Carvalho, P. C. M., and Fernández-Ramírez, L. M.: Ridge regression ensemble of machine learning models applied to solar and wind forecasting in Brazil and Spain, Appl. Energy, 314, 118936, https://doi.org/10.1016/j.apenergy.2022.118936, 2022.
Cecinato, A., Di Palo, V., Pomata, D., Tomasi Sciano, M., and Possanzini, M.: Measurement of phase-distributed nitrophenols in Rome ambient air, Chemosphere, 59, 679–683, https://doi.org/10.1016/j.chemosphere.2004.10.045, 2005.
Cheng, S., Zhou, C., Yin, H., Sun, J., and Han, K.: OH produced from o-nitrophenol photolysis: a combined experimental and theoretical investigation, J. Chem. Phys., 130, 234311, https://doi.org/10.1063/1.3152635, 2009.
Chen, X., Ma, W., Zheng, F., Wang, Z., Hua, C., Li, Y., Wu, J., Li, B., Jiang, J., Yan, C., Petäjä, T., Bianchi, F., Kerminen, V.-M., Worsnop, D. R., Liu, Y., Xia, M., and Kulmala, M.: Identifying Driving Factors of Atmospheric N2O5 with Machine Learning, Environ. Sci. Technol., 58, 11568–11577, https://doi.org/10.1021/acs.est.4c00651, 2024.
Chow, K., Huang, X., and Yu, J.: Quantification of nitroaromatic compounds in atmospheric fine particulate matter in Hong Kong over 3 years: field measurement evidence for secondary formation derived from biomass burning emissions, Environ. Chem., 13, 665–673, https://doi.org/10.1071/En15174, 2016.
Delhomme, O., Morville, S., and Millet, M.: Seasonal and diurnal variations of atmospheric concentrations of phenols and nitrophenols measured in the Strasbourg area, France, Atmos. Pollut. Res., 1, 16–22, https://doi.org/10.5094/apr.2010.003, 2010.
Fernandez, P., Grifoll, M., Solanas, A. M., Bayona, J. M., and Albaiges, J.: Bioassay-directed chemical analysis of genotoxic components in coastal sediments, Environ. Sci. Technol., 26, 817–829, https://doi.org/10.1021/es00028a024, 1992.
Frka, S., Sala, M., Kroflic, A., Hus, M., Cusak, A., and Grgic, I.: Quantum chemical calculations resolved identification of methylnitrocatechols in atmospheric aerosols, Environ. Sci. Technol., 50, 5526–5535, https://doi.org/10.1021/acs.est.6b00823, 2016.
Gui, K., Che, H., Zeng, Z., Wang, Y., Zhai, S., Wang, Z., Luo, M., Zhang, L., Liao, T., Zhao, H., Li, L., Zheng, Y., and Zhang, X.: Construction of a virtual PM2.5 observation network in China based on high-density surface meteorological observations using the Extreme Gradient Boosting model, Environ. Int., 141, 105801, https://doi.org/10.1016/j.envint.2020.105801, 2020.
Harrison, M. A. J., Barra, S., Borghesi, D., Vione, D., Arsene, C., and Olariu, R. L.: Nitrated phenols in the atmosphere: a review, Atmos. Environ., 39, 231–248, https://doi.org/10.1016/j.atmosenv.2004.09.044, 2005.
Iinuma, Y., Böge, O., Gräfe, R., and Herrmann, H.: Methyl-nitrocatechols: atmospheric tracer compounds for biomass burning secondary organic aerosols, Environ. Sci. Technol., 44, 8453–8459, https://doi.org/10.1021/es102938a, 2010.
Ikemori, F., Nakayama, T., and Hasegawa, H.: Characterization and possible sources of nitrated mono- and di-aromatic hydrocarbons containing hydroxyl and/or carboxyl functional groups in ambient particles in Nagoya, Japan, Atmos. Environ., 211, 91–102, https://doi.org/10.1016/j.atmosenv.2019.05.009, 2019.
Jang, M. and Kamens, R. M.: Characterization of Secondary Aerosol from the Photooxidation of Toluene in the Presence of NOx and 1-Propene, Environ. Sci. Technol., 35, 3626–3639, https://doi.org/10.1021/es010676+, 2001.
Jiang, Y., Xue, L., Shen, H., Dong, C., Xiao, Z., and Wang, W.: Dominant Processes of HONO Derived from Multiple Field Observations in Contrasting Environments, Environ. Sci. Technol. Lett., 9, 258–264, https://doi.org/10.1021/acs.estlett.2c00004, 2022.
Jiang, Y., Wang, X., Li, M., Liang, Y., Liu, Z., Chen, J., Guan, T., Mu, J., Zhu, Y., Meng, H., Zhou, Y., Yao, L., Xue, L., and Wang, W.: Comprehensive understanding on sources of high levels of fine particulate nitro-aromatic compounds at a coastal rural area in northern China, J. Environ. Sci., 135, 483–494, https://doi.org/10.1016/j.jes.2022.09.033, 2024.
Ju, Y., Sun, G., Chen, Q., Zhang, M., Zhu, H., and Rehman, M. U.: A Model Combining Convolutional Neural Network and LightGBM Algorithm for Ultra-Short-Term Wind Power Forecasting, IEEE Access, 7, 28309–28318, https://doi.org/10.1109/ACCESS.2019.2901920, 2019.
Kahnt, A., Behrouzi, S., Vermeylen, R., Safi Shalamzari, M., Vercauteren, J., Roekens, E., Claeys, M., and Maenhaut, W.: One-year study of nitro-organic compounds and their relation to wood burning in PM10 aerosol from a rural site in Belgium, Atmos. Environ., 81, 561–568, https://doi.org/10.1016/j.atmosenv.2013.09.041, 2013.
Kitanovski, Z., Grgić, I., Vermeylen, R., Claeys, M., and Maenhaut, W.: Liquid chromatography tandem mass spectrometry method for characterization of monoaromatic nitro-compounds in atmospheric particulate matter, J. Chromatogr. A, 1268, 35–43, https://doi.org/10.1016/j.chroma.2012.10.021, 2012.
Krautstrunk, M., Neumann-Hauf, G., Schlager, H., Klemm, O., Beyrich, F., Corsmeier, U., Kalthoff, N., and Kotzian, M.: An experimental study on the planetary boundary layer transport of air pollutants over East Germany, Atmos. Environ., 34, 1247–1266, https://doi.org/10.1016/S1352-2310(99)00124-7, 2000.
Leuenberger, C., Czuczwa, J., Tremp, J., and Giger, W.: Nitrated phenols in rain: Atmospheric occurrence of phytotoxic pollutants, Chemosphere, 17, 511–515, https://doi.org/10.1016/0045-6535(88)90026-4, 1988.
Li, M. and Wang, X.: Data of particulate nitro-aromatic compounds and other relevant parameters in eastern China, Mendeley Data, V2 [data set], https://doi.org/10.17632/fp9zkv28p2.2, 2025.
Li, M., Liu, H., Geng, G., Hong, C., Liu, F., Song, Y., Tong, D., Zheng, B., Cui, H., Man, H., Zhang, Q., and He, K.: Anthropogenic emission inventories in China: a review, Natl. Sci. Rev., 4, 834–866, https://doi.org/10.1093/nsr/nwx150, 2017.
Li, M., Wang, X., Lu, C., Li, R., Zhang, J., Dong, S., Yang, L., Xue, L., Chen, J., and Wang, W.: Nitrated phenols and the phenolic precursors in the atmosphere in urban Jinan, China, Sci. Total Environ., 714, 136760, https://doi.org/10.1016/j.scitotenv.2020.136760, 2020a.
Li, M., Wang, X., Li, J., Liu, M., Li, H., Zhao, M., Guo, Y., Liu, Y., Dong, S., Wu, D., Guo, Z., Xue, L., Zhou, Y., Wang, Y., and Wang, W.: Large Contributions of Gas-Particle Partitioning and Heterogenous Processes to Particulate Nitroaromatic Compounds at a Mountain Site Revealed by Observation-Based and Multiphase Modeling, J. Geophys. Res.-Atmos., 129, e2024JD041578, https://doi.org/10.1029/2024JD041578, 2024.
Li, X., Jiang, L., Hoa, L. P., Lyu, Y., Xu, T., Yang, X., Iinuma, Y., Chen, J., and Herrmann, H.: Size distribution of particle-phase sugar and nitrophenol tracers during severe urban haze episodes in Shanghai, Atmos. Environ., 145, 115–127, https://doi.org/10.1016/j.atmosenv.2016.09.030, 2016.
Li, X., Wang, Y., Hu, M., Tan, T., Li, M., Wu, Z., Chen, S., and Tang, X.: Characterizing chemical composition and light absorption of nitroaromatic compounds in the winter of Beijing, Atmos. Environ., 237, 117712, https://doi.org/10.1016/j.atmosenv.2020.117712, 2020b.
Li, X., Yang, Y., Liu, S., Zhao, Q., Wang, G., and Wang, Y.: Light absorption properties of brown carbon (BrC) in autumn and winter in Beijing: Composition, formation and contribution of nitrated aromatic compounds, Atmos. Environ., 223, 117289, https://doi.org/10.1016/j.atmosenv.2020.117289, 2020c.
Lu, C., Wang, X., Zhang, J., Liu, Z., Liang, Y., Dong, S., Li, M., Chen, J., Chen, H., Xie, H., Xue, L., and Wang, W.: Substantial emissions of nitrated aromatic compounds in the particle and gas phases in the waste gases from eight industries, Environ. Pollut., 283, 117132, https://doi.org/10.1016/j.envpol.2021.117132, 2021.
Lu, C. Y., Wang, X. F., Dong, S. W., Zhang, J., Li, J., Zhao, Y. N., Liang, Y. H., Xue, L. K., Xie, H. J., Zhang, Q. Z., and Wang, W. X.: Emissions of fine particulate nitrated phenols from various on-road vehicles in China, Environ. Res., 179, 108709, https://doi.org/10.1016/j.envres.2019.108709, 2019a.
Lu, C. Y., Wang, X. F., Li, R., Gu, R. R., Zhang, Y. X., Li, W. J., Gao, R., Chen, B., Xue, L. K., and Wang, W. X.: Emissions of fine particulate nitrated phenols from residential coal combustion in China, Atmos. Environ., 203, 10–17, https://doi.org/10.1016/j.atmosenv.2019.01.047, 2019b.
Lundberg, S. M. and Lee, S.-I.: A unified approach to interpreting model predictions, Proceedings of the 31st International Conference on Neural Information Processing Systems, Long Beach, California, USA, 4768–4777, https://dl.acm.org/doi/10.5555/3295222.3295230, 2017.
Lüttke, J., Scheer, V., Levsen, K., Wünsch, G., Neil Cape, J., Hargreaves, K. J., Storeton-West, R. L., Acker, K., Wieprecht, W., and Jones, B.: Occurrence and formation of nitrated phenols in and out of cloud, Atmos. Environ., 31, 2637–2648, https://doi.org/10.1016/S1352-2310(96)00229-4, 1997.
Lüttke, J., Levsen, K., Acker, K., Wieprecht, W., and Möller, D.: Phenols and nitrated phenols in clouds at mount brocken, Int. J. Environ. Anal. Chem., 74, 69–89, https://doi.org/10.1080/03067319908031417, 1999.
Ma, J., Zhang, R., Xu, J., and Yu, Z.: MERRA-2 PM2.5 mass concentration reconstruction in China mainland based on LightGBM machine learning, Sci. Total Environ., 827, 154363, https://doi.org/10.1016/j.scitotenv.2022.154363, 2022.
Mohr, C., Lopez-Hilfiker, F. D., Zotter, P., Prevot, A. S., Xu, L., Ng, N. L., Herndon, S. C., Williams, L. R., Franklin, J. P., Zahniser, M. S., Worsnop, D. R., Knighton, W. B., Aiken, A. C., Gorkowski, K. J., Dubey, M. K., Allan, J. D., and Thornton, J. A.: Contribution of nitrated phenols to wood burning brown carbon light absorption in Detling, United Kingdom during winter time, Environ. Sci. Technol., 47, 6316–6324, https://doi.org/10.1021/es400683v, 2013.
Nojima, K., Kawaguchi, A., Ohya, T., Kanno, S., and Hirobe, M.: Studies on Photochemical Reaction of Air Pollutants. X. Identification of Nitrophenols in Suspended Particulates, Chem. Pharm. Bull., 31, 1047–1051, https://doi.org/10.1248/cpb.31.1047, 1983.
Opitz, D. and Maclin, R.: Popular ensemble methods: An empirical study, J. Artif. Intell. Res., 11, 169–198, https://doi.org/10.1613/jair.614, 1999.
Paatero, P. and Tapper, U.: Positive matrix factorization: A non-negative factor model with optimal utilization of error estimates of data values, Environmetrics., 5, 111–126, https://doi.org/10.1002/env.3170050203, 1994.
Peng, X., Xie, T.-T., Tang, M.-X., Cheng, Y., Peng, Y., Wei, F.-H., Cao, L.-M., Yu, K., Du, K., He, L.-Y., and Huang, X.-F.: Critical Role of Secondary Organic Aerosol in Urban Atmospheric Visibility Improvement Identified by Machine Learning, Environ. Sci. Technol. Lett., 10, 976–982, https://doi.org/10.1021/acs.estlett.3c00084, 2023a.
Peng, Y., Yuan, B., Yang, S., Wang, S., Yang, X., Wang, W., Li, J., Song, X., Wu, C., Qi, J., Zheng, E., Ye, C., Huang, S., Hu, W., Song, W., Wang, X., Wang, B., and Shao, M.: Photolysis frequency of nitrophenols derived from ambient measurements, Sci. Total Environ., 869, 161810, https://doi.org/10.1016/j.scitotenv.2023.161810, 2023b.
Petkovic, D., Altman, R., Wong, M., and Vigil, A.: Improving the explainability of Random Forest classifier-user centered approach, in: Biocomputing 2018, World Scientific, 204–215, https://doi.org/10.1142/9789813235533_0019, 2017.
Purohit, V. and Basu, A. K.: Mutagenicity of Nitroaromatic Compounds, Chem. Res. Toxicol., 13, 673–692, https://doi.org/10.1021/tx000002x, 2000.
Qin, X., Zhou, S., Li, H., Wang, G., Chen, C., Liu, C., Wang, X., Huo, J., Lin, Y., Chen, J., Fu, Q., Duan, Y., Huang, K., and Deng, C.: Enhanced natural releases of mercury in response to the reduction in anthropogenic emissions during the COVID-19 lockdown by explainable machine learning, Atmos. Chem. Phys., 22, 15851–15865, https://doi.org/10.5194/acp-22-15851-2022, 2022.
Rana, A. and Sarkar, S.: The role of nitroaromatic compounds (NACs) in constraining BrC absorption in the Indo-Gangetic Plain (IGP), Sci. Total Environ., 917, 170523, https://doi.org/10.1016/j.scitotenv.2024.170523, 2024.
Reifman, J. and Feldman, E. E.: Multilayer perceptron for nonlinear programming, Comput. Oper. Res., 29, 1237–1250, https://doi.org/10.1016/S0305-0548(01)00027-2, 2002.
Ren, Y., Wei, J., Wang, G., Wu, Z., Ji, Y., and Li, H.: Evolution of aerosol chemistry in Beijing under strong influence of anthropogenic pollutants: Composition, sources, and secondary formation of fine particulate nitrated aromatic compounds, Environ. Res., 204, 111982, https://doi.org/10.1016/j.envres.2021.111982, 2022.
Ren, Y., Wang, G., Wei, J., Tao, J., Zhang, Z., and Li, H.: Contributions of primary emissions and secondary formation to nitrated aromatic compounds in themountain background region of Southeast China, Atmos. Chem. Phys., 23, 6835–6848, https://doi.org/10.5194/acp-23-6835-2023, 2023.
Si, M. and Du, K.: Development of a predictive emissions model using a gradient boosting machine learning method, Environ. Technol. Innovation, 20, 101028, https://doi.org/10.1016/j.eti.2020.101028, 2020.
Sjögren, M., Li, H., Rannug, U., and Westerholm, R.: A multivariate statistical analysis of chemical composition and physical characteristics of ten diesel fuels, Fuel, 74, 983–989, https://doi.org/10.1016/0016-2361(95)00056-B, 1995.
Teich, M., van Pinxteren, D., Wang, M., Kecorius, S., Wang, Z., Müller, T., Močnik, G., and Herrmann, H.: Contributions of nitrated aromatic compounds to the light absorption of water-soluble and particulate brown carbon in different atmospheric environments in Germany and China, Atmos. Chem. Phys., 17, 1653–1672, https://doi.org/10.5194/acp-17-1653-2017, 2017.
Vanni, A., Pellegrino, V., Gamberini, R., and Calabria, A.: An evidence for nitrophenols contamination in Antarctic fresh-water and snow. Simultaneous determination of nitrophenols and nitroarenes at ng/L levels, Int. J. Environ. Anal. Chem., 79, 349–365, https://doi.org/10.1080/03067310108044394, 2001.
Vidović, K., Lašič Jurković, D., Šala, M., Kroflič, A., and Grgić, I.: Nighttime aqueous-phase formation of nitrocatechols in the atmospheric condensed phase, Environ. Sci. Technol., 52, 9722–9730, https://doi.org/10.1021/acs.est.8b01161, 2018.
Vione, D., Maurino, V., Minero, C., and Pelizzetti, E.: Phenol photonitration upon UV irradiation of nitrite in aqueous solution I: Effects of oxygen and 2-propanol, Chemosphere, 45, 893–902, https://doi.org/10.1016/S0045-6535(01)00035-2, 2001.
Wang, F., Zhang, Z., Wang, G., Wang, Z., Li, M., Liang, W., Gao, J., Wang, W., Chen, D., Feng, Y., and Shi, G.: Machine learning and theoretical analysis release the non-linear relationship among ozone, secondary organic aerosol and volatile organic compounds, J. Environ. Sci., 114, 75–84, https://doi.org/10.1016/j.jes.2021.07.026, 2022a.
Wang, L., Wang, X., Gu, R., Wang, H., Yao, L., Wen, L., Zhu, F., Wang, W., Xue, L., Yang, L., Lu, K., Chen, J., Wang, T., Zhang, Y., and Wang, W.: Observations of fine particulate nitrated phenols in four sites in northern China: concentrations, source apportionment, and secondary formation, Atmos. Chem. Phys., 18, 4349–4359, https://doi.org/10.5194/acp-18-4349-2018, 2018.
Wang, X., Gu, R., Wang, L., Xu, W., Zhang, Y., Chen, B., Li, W., Xue, L., Chen, J., and Wang, W.: Emissions of fine particulate nitrated phenols from the burning of five common types of biomass, Environ. Pollut., 230, 405–412, https://doi.org/10.1016/j.envpol.2017.06.072, 2017.
Wang, Y., Hu, M., Wang, Y., Zheng, J., Shang, D., Yang, Y., Liu, Y., Li, X., Tang, R., Zhu, W., Du, Z., Wu, Y., Guo, S., Wu, Z., Lou, S., Hallquist, M., and Yu, J. Z.: The formation of nitro-aromatic compounds under high NOx and anthropogenic VOC conditions in urban Beijing, China, Atmos. Chem. Phys., 19, 7649–7665, https://doi.org/10.5194/acp-19-7649-2019, 2019.
Wang, Y., Du, Y., Fang, J., Dong, X., Wang, Q., Ban, J., Sun, Q., Ma, R., Zhang, W., He, M. Z., Liu, C., Niu, Y., Chen, R., Kan, H., and Li, T.: A Random Forest Model for Daily PM2.5 Personal Exposure Assessment for a Chinese Cohort, Environ. Sci. Technol. Lett., 9, 466–472, https://doi.org/10.1021/acs.estlett.1c00970, 2022b.
Wang, Z., Zhang, J., Zhang, L., Liang, Y., and Shi, Q.: Characterization of nitroaromatic compounds in atmospheric particulate matter from Beijing, Atmos. Environ., 246, 118046, https://doi.org/10.1016/j.atmosenv.2020.118046, 2021.
Xia, M., Chen, X., Ma, W., Guo, Y., Yin, R., Zhan, J., Zhang, Y., Wang, Z., Zheng, F., Xie, J., Wang, Y., Hua, C., Liu, Y., Yan, C., and Kulmala, M.: Observations and Modeling of Gaseous Nitrated Phenols in Urban Beijing: Insights From Seasonal Comparison and Budget Analysis, J. Geophys. Res.-Atmos., 128, e2023JD039551, https://doi.org/10.1029/2023JD039551, 2023.
Xie, M., Chen, X., Hays, M. D., Lewandowski, M., Offenberg, J., Kleindienst, T. E., and Holder, A. L.: Light absorption of secondary organic aerosol: composition and contribution of nitroaromatic compounds, Environ. Sci. Technol., 51, 11607–11616, https://doi.org/10.1021/acs.est.7b03263, 2017.
Yang, W., Ji, H., Li, F., He, X., Zhang, S., Nan, X., Du, T., Li, K., and Han, C.: Important yet Overlooked HONO Source from Aqueous-phase Photochemical Oxidation of Nitrophenols, Environ. Sci. Technol., 58, 15722–15731, https://doi.org/10.1021/acs.est.4c05048, 2024.
Yang, Y., Li, X., Shen, R., Liu, Z., Ji, D., and Wang, Y.: Seasonal variation and sources of derivatized phenols in atmospheric fine particulate matter in North China Plain, J. Environ. Sci., 89, 136–144, https://doi.org/10.1016/j.jes.2019.10.015, 2020.
Yuan, B., Liggio, J., Wentzell, J., Li, S.-M., Stark, H., Roberts, J. M., Gilman, J., Lerner, B., Warneke, C., Li, R., Leithead, A., Osthoff, H. D., Wild, R., Brown, S. S., and de Gouw, J. A.: Secondary formation of nitrated phenols: insights from observations during the Uintah Basin Winter Ozone Study (UBWOS) 2014, Atmos. Chem. Phys., 16, 2139–2153, https://doi.org/10.5194/acp-16-2139-2016, 2016.
Yuan, W., Huang, R.-J., Yang, L., Wang, T., Duan, J., Guo, J., Ni, H., Chen, Y., Chen, Q., Li, Y., Dusek, U., O'Dowd, C., and Hoffmann, T.: Measurement report: PM2.5-bound nitrated aromatic compounds in Xi'an, Northwest China – seasonal variations and contributions to optical properties of brown carbon, Atmos. Chem. Phys., 21, 3685–3697, https://doi.org/10.5194/acp-21-3685-2021, 2021.
Zhang, J., Zhou, X., Wang, Z., Yang, L., Wang, J., and Wang, W.: Trace elements in PM2.5 in Shandong Province: Source identification and health risk assessment, Sci. Total Environ., 621, 558–577, https://doi.org/10.1016/j.scitotenv.2017.11.292, 2018.
Zhang, J., Wang, X., Li, R., Dong, S., Chen, J., Zhang, Y., Zheng, P., Li, M., Chen, T., Liu, Y., Xue, L., Zhou, X., Du, L., Zhang, Q., and Wang, W.: Significant impacts of anthropogenic activities on monoterpene and oleic acid-derived particulate organic nitrates in the North China Plain, Atmos. Res., 256, 105585, https://doi.org/10.1016/j.atmosres.2021.105585, 2021.
Zhang, X., Lin, Y.-H., Surratt, J. D., and Weber, R. J.: Sources, Composition and Absorption Ångström Exponent of Light-absorbing Organic Components in Aerosol Extracts from the Los Angeles Basin, Environ. Sci. Technol., 47, 3685–3693, https://doi.org/10.1021/es305047b, 2013.
Zheng, B., Tong, D., Li, M., Liu, F., Hong, C., Geng, G., Li, H., Li, X., Peng, L., Qi, J., Yan, L., Zhang, Y., Zhao, H., Zheng, Y., He, K., and Zhang, Q.: Trends in China's anthropogenic emissions since 2010 as the consequence of clean air actions, Atmos. Chem. Phys., 18, 14095–14111, https://doi.org/10.5194/acp-18-14095-2018, 2018.