the Creative Commons Attribution 4.0 License.
the Creative Commons Attribution 4.0 License.
 | 06 Nov 2025
Influence of oceanic ventilation and terrestrial transport on the atmospheric volatile chlorinated hydrocarbons over the Western Pacific
Shan-Shan Liu
Jie Ni
Jin-Ming Song
Xu-Xu Gao
Zhen He
Volatile chlorinated hydrocarbons (VCHCs), key ozone-depleting substances and greenhouse gases, depend on oceanic emission and uptake for their atmospheric budget. However, data on VCHCs in the Western Pacific remain limited. This study investigated the distribution and sources of VCHCs (CHCl3, C2HCl3, CCl4, and CH3CCl3) in the Western Pacific during 2019-2020. Elevated seawater concentrations of CHCl3 and C2HCl3 in the Kuroshio-Oyashio Extension were driven by mesoscale eddies, enhancing primary productivity, while CCl4 and CH3CCl3 concentrations were mainly influenced by atmospheric inputs. Atmospheric concentrations of VCHCs decreased from coastal to open ocean areas, with terrestrial air masses contributing significantly. Additionally, positive saturation anomalies and correlations with chlorophyll a indicated the marine biological source for atmospheric CHCl3 and C2HCl3. However, the atmospheric concentration variability of these gases was not fully consistent with oceanic emissions indicators (saturation anomalies and sea–air fluxes) and showed strong correlations with terrestrial tracers, indicating that land-derived atmospheric transport primarily influenced atmospheric CHCl3 and C2HCl3. The estimated sea–air flux indicated that the Western Pacific acted as a source for CHCl3 and C2HCl3 but a sink for CCl4 and CH3CCl3, with the potential to absorb 14.3 ± 6.8 % of CCl4 emissions from Eastern China, 5.6 ± 2.5 % from Eastern Asia, and 2.1 ± 1.1 % of global emissions. Additionally, this region accounted for 6.3 ± 2.8 % of the global oceanic absorption of CCl4. These findings underscore the Western Pacific's key role in regulating atmospheric CCl4 concentrations and mitigating its accumulation in Eastern Asia, providing essential data for global VCHCs emission and uptake estimates.
- Article
(7199 KB) - Full-text XML
-
Supplement
(3173 KB) - BibTeX
- EndNote


Volatile halocarbons (VHCs) are ozone-depleting substances and greenhouse gases (Abrahamsson et al., 1995; Abrahamsson and Edkahl, 1996). As an important component of VHCs, volatile chlorinated hydrocarbons (VCHCs) are believed to be important carriers of chlorine to the stratosphere. Among them, carbon tetrachloride (CCl4), chloroform (CHCl3), methyl chloroform (CH3CCl3), and trichloroethene (C2HCl3) account for an estimated 11 % of the total organic chlorine in the troposphere (WMO, 2022). Long-lived compounds such as CCl4 and CH3CCl3, which have atmospheric lifetimes exceeding six months, are well-mixed in the troposphere except where there are local sources. They are major contributors to both the greenhouse effect and ozone depletion, and their usage and emissions are subject to regulation under the Montreal Protocol (1987). In contrast, short-lived species such as C2HCl3 and CHCl3 are classified as halogenated very short-lived substances (VSLSs), with typical atmospheric lifetimes of less than six months (WMO, 2007), and are currently not regulated under the Montreal Protocol. Nevertheless, a significant portion of VSLSs and their degradation products reach the stratosphere, with over 80 % of chlorinated VSLSs estimated to reach these altitudes (Carpenter et al., 2014). Although present at low concentrations, VSLSs exert disproportionately large impacts on radiative forcing and climate through ozone depletion, particularly due to their breakdown in the lower atmosphere, which is more sensitive to climate change (Hossaini et al., 2015, 2017; An et al., 2023; Saiz-Lopez et al., 2023).
The oceans, acting as source and sink of VCHCs (C2HCl3, CHCl3, CCl4, and CH3CCl3), play a significant role in the biogeochemical cycling of VCHCs (Blake et al., 2003; Karlsson et al., 2008; Butler et al., 2016). CHCl3 and C2HCl3 in the oceans come from both anthropogenic and natural sources (Abrahamsson and Edkahl, 1996; Moore, 2003; Karlsson et al., 2008; He et al., 2013b). Previous studies have revealed that marine microalgae (Scarratt and Moore, 1999; Lim et al., 2018), macroalgae (Gschwend et al., 1985; Abrahamsson et al., 1995), and various other marine organisms (Khan et al., 2011) act as natural sources of CHCl3 and C2HCl3. The tropical diatoms, the cyanobacterium Synechococcus and the chlorophyte Parachlorella, and purple sulfur bacteria, have been shown to produce CHCl3 (Scarratt and Moore, 1999; Plummer and Edzwald, 2002; Lim et al., 2018). Moreover, CHCl3 emissions have also been found in regions like the Antarctic tundra (Zhang et al., 2021), Dead Sea landscapes (Shechner et al., 2019), and coastal wetlands affected by sea level rise (Jiao et al., 2018), entering the ocean via land runoff and atmospheric deposition. Abrahamsson et al. (1995) argued that C2HCl3 emissions from algae to the atmosphere are present in non-negligible amounts within the global atmospheric chlorine budget. Anthropogenic emissions of CHCl3 mainly come from its use as a raw material in refrigerant hydrochlorofluorocarbon-22 (HCFC-22) production and as a byproduct of the water chlorination and bleaching processes in the pulp and paper industry (McCulloch, 2003). C2HCl3 is also emitted from its use as a solvent and as feedstock in producing HFCs and other chemicals (Chipperfield et al., 2020). Notably, while the Montreal Protocol regulates the use of HCFC-22 in dispersive applications, demand for the refrigerant as a feedstock in the manufacture of fluoropolymers is surging (Say et al., 2020). These anthropogenic CHCl3 and C2HCl3 ultimately enter the ocean through land runoff and atmospheric deposition, especially in coastal and estuarine regions (Yokouchi et al., 2005). In contrast, oceanic CH3CCl3 and CCl4 are largely from anthropogenic sources (Butler et al., 2016; WMO, 2022). As a primary component of cleaning agents, dry-cleaning solvents, and degreasing agents, CH3CCl3 previously saw widespread use (Wang et al., 1995). CCl4 was previously extensively used in chlorine gas production, industrial bleaching, organic chemical solvents, and fire extinguisher production (Rigby et al., 2014). Moreover, these two gases are used as solvents and feedstock chemicals in producing HFCs and other chemicals (Chipperfield et al., 2020). Although their usage is banned in the Montreal Protocol (1987) and its amendments and adjustments, unregulated emissions persist from specific manufacturing activities. For example, Liang et al. (2016) and Sherry et al. (2018) showed that CCl4 production is linked to non-feedstock emissions associated with chloromethane and perchloroethylene manufacturing facilities. They also demonstrated that up to 10 Gg yr−1 of CCl4 emissions may be produced by unreported, unintentional release during chlorine production, including emissions from chlor-alkali plants and their use in industrial and domestic bleaching. Additionally, Li et al. (2024) identified potential CCl4 sources in eastern China, including the manufacture of general-purpose machinery, raw chemical materials, and chemical products.
Substantial spatial and temporal variabilities characterize the distributions of VCHCs in oceans, with higher concentrations in estuaries than nearshore zones, and higher concentrations in nearshore zones than in the open ocean. These distributions are mainly influenced by anthropogenic emissions from terrestrial sources (Yokouchi et al., 2005; Bravo-Linares et al., 2007; Liang et al., 2014) and by the biological processes of algae in nearshore zones (Christof et al., 2002; Karlsson et al., 2008; Yang et al., 2015). In addition, the distributions of VCHCs are related to various factors, including source strength, season, topography, tides, and water masses (Yang et al., 2015; Liu et al., 2021). Previous studies have pointed out that land-based inputs have significant impacts on the distributions of marine VCHCs because VCHCs from human activities exceed marine emissions (Lunt et al., 2018; Fang et al., 2019; An et al., 2021; Yi et al., 2023). For example, persistent large emissions of CCl4 from Eastern Asia, accounting for approximately 40 % of global emissions (Lunt et al., 2018), coincided with a global increase in CCl4 mole fractions between 2010 and 2015, as noted by Fang et al. (2019). This growth, notably driven by eastern China, has potential implications for Antarctic ozone layer recovery. However, according to the latest data from WMO (2022), the CCl4 emissions from eastern China showed a significant decline from 2016 to 2019, dropping from 11.3 ± 1.9 Gg yr−1 in 2016 to 6.3 ± 1.1 Gg yr−1 in 2019. Similarly, An et al. (2023) reported a decline in CHCl3 emissions from China, which peaked at 193 Gg yr−1 in 2017 and decreased to 147 Gg yr−1 by 2018, where, as of 2020, it has remained relatively constant. Yu et al. (2020) demonstrated a successful reduction in China CH3CCl3 emissions from 1.6 Gg yr−1 in 2007 to 0.3 Gg yr−1 in 2013, demonstrating compliance with the Montreal Protocol. Despite these declines in VCHCs emissions, Eastern Asia continues to be an important source of global VCHCs emissions (WMO, 2022).
The Western Pacific exerts a profound influence on sea–air exchanges and the global biogeochemical cycles of materials (Tsunogai, 2002; Shi et al., 2022). The dynamic western boundary currents, equatorial Pacific circulation systems, and the expansive Western Pacific Warm Pool play pivotal roles in vertical water mass transport and material/heat exchange between the equatorial and subtropical Pacific regions (Hu et al., 2015). These oceanic processes likely impact the variations in emissions of VCHCs in the Western Pacific. Additionally, owing to its proximity to land, encompassing regions such as the Philippines and Japan, atmospheric vertical diffusion and pollutant transport from land may significantly influence atmospheric VCHCs levels over the Western Pacific (Lunt et al., 2018). While a few studies have observed seawater and atmospheric VCHCs in the Western Pacific (Quack and Suess, 1999; Liu et al., 2021), comprehensive data on atmospheric and seawater VCHCs in the Western Pacific remain scarce. Consequently, substantial uncertainties persist in estimates of oceanic sources and sinks of VCHCs (Blake et al., 2003; Butler et al., 2016). A noticeable research gap exists concerning our understanding of VCHCs in the Western Pacific. Furthermore, the lack of comprehensive knowledge regarding the biogeochemical factors that control VCHCs concentrations and sea–air fluxes produces uncertainties in global emission estimates.
In this study, a comprehensive field investigation was carried out in the Western Pacific with two primary objectives. Firstly, the study aimed to understand how oceanic physical and biogeochemical processes influence the distributions and emissions of these climatic VCHCs by examining various sources. Secondly, the study sought to ascertain the influence of the Western Pacific on the levels of volatile VCHCs in the atmosphere, evaluating whether it acts primarily as a source or sink of these VCHCs. Investigating the distributions of VCHCs in both the seawater and the atmosphere, along with determining their sea–air fluxes, is essential for evaluating their potential impacts on the global halogen cycle.
2.1 Study area
Our measurements were conducted on board the R/V Dongfanghong 3 from 31 October to 1 December 2019, and the R/V Kexue from 3 October 2019 to 5 January 2020. A total of 65 stations were surveyed across the study region (Fig. 1a), where seawater samples were collected at all stations and atmospheric samples obtained at 41 stations. Each station provided three replicate surface seawater samples and one atmospheric sample. The Western Pacific survey area was divided into the Kuroshio-Oyashio Extension (KOE), North Pacific Subtropical Gyre (NPSG), and Western Pacific Warm Pool (WPWP) based on oceanographic features, including seawater temperature, salinity, nutrient concentrations, and Chl a concentrations observed in this study (Figs. S1 and S2 in the Supplement). Details of the classification criteria are given in the Supplement (Sect. S1).
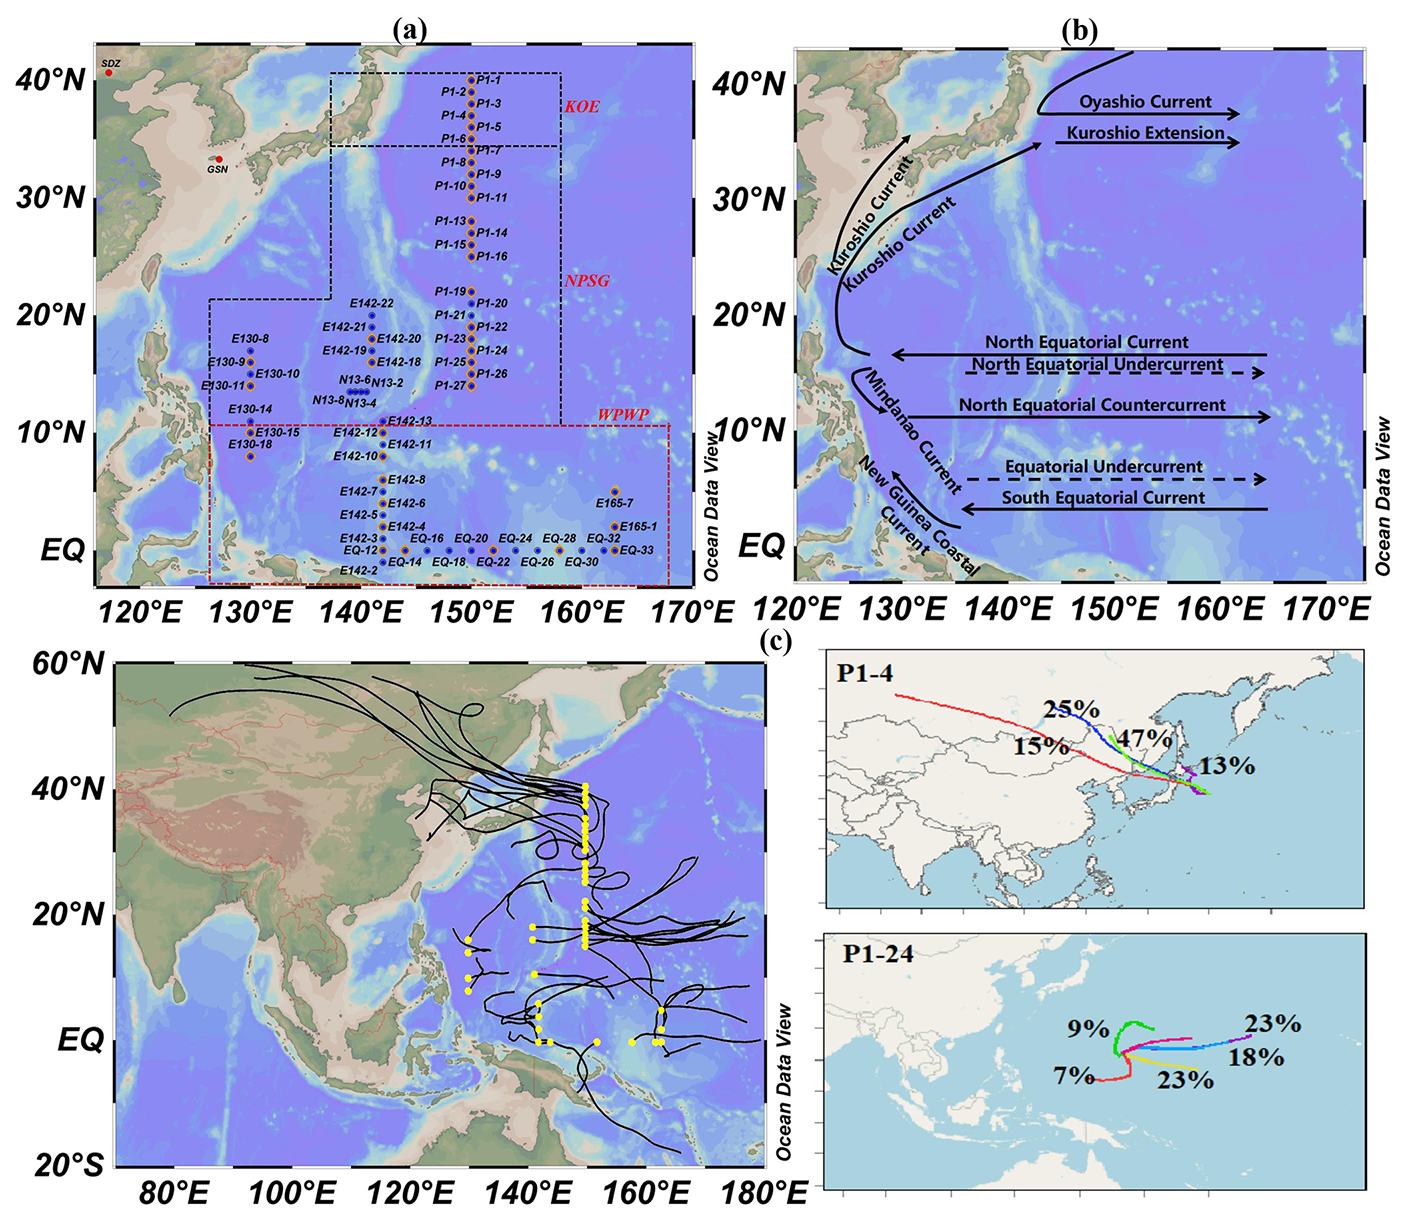
Figure 1(a) Locations of sampling stations (orange diamonds represent atmospheric sampling stations; SDZ: Shangdianzi background station; GSN: Gosan station). VCHCs data for the GSN were obtained from AGAGE network (https://agage.mit.edu/, last access: 6 November 2024), and for the SDZ were derived from Yi et al. (2023). (b) A schematic map of the major currents of the Western Pacific. (c) Cluster analysis of 96 h backward trajectories for different stations over the Western Pacific. The ensemble 96 h back-trajectories were within the lower troposphere above 100 m. (Figures generated using Ocean Data View; Reiner Schlitzer, Ocean Data View, 2025, https://odv.awi.de, last access: 16 August 2025).
The cruises encompassed a broad geographic range, extending from coastal to open-ocean areas and from tropical to subtropical latitudes. Data were collected along multiple transects, summarized here along two primary directions: the South-North (S-N) direction (from 1° S to 40° N) and the East-West (E-W) direction (from 130° E to 165° E). The circulation patterns of the Western Pacific, depicted in Fig. 1b, are intricate and encompass multiple oceanic currents, including the Oyashio Current (OC), the North Equatorial Current (NEC), the North Equatorial Counter Current (NECC), the Mindanao Current (MC), and the Kuroshio Current (KC). This intricate marine circulation system and the intense ocean-atmosphere interactions bestow the Western Pacific with a pivotal role in oceanic environmental changes, water mass exchanges, nutrient and heat transport, global biogeochemical cycles, and climatic transitions (Hu et al., 2020). Further, with the planet's largest warm pool and most robust tropical convection, the WPWP area is a critical player in global sea–air substance exchange. Meteorological patterns in this area are also significantly influenced by the Indo-Australian monsoon (Wang et al., 2004; Li et al., 2019). Thus, the combined forces of the NEC-MC-KC system and the region's distinct meteorological conditions inevitably modulate the biogeochemical cycling of VCHCs in both seawater and the atmosphere.
2.2 Analysis of VCHCs in air
Atmospheric samples were collected by 3 L pre-evacuated stainless-steel Summa polished canisters (SilconCan, Restek Co., Ltd) that were pre-cleaned to measure VCHCs concentrations at ambient pressure. These sampling canisters underwent an intensive cleaning process using an automated cleaning system (Nutech 2010 DS) prior to sample collection. Previous studies have shown that VCHCs remain stable in rigorously pre-cleaned Summa canisters for more than 3 months (Yokouchi et al., 1999, 2013; Yu et al., 2020). To avoid ship exhaust contamination, sampling was conducted upwind on the ship's top deck during low-speed transit. All atmospheric samples were analyzed within 3 months after the collection. Meteorological parameters such as wind speed and direction were recorded by shipboard sensors at a height of 10 m above the sea surface.
The atmospheric concentrations of VCHCs were determined using a three-stage cold-trap preconcentrator (Nutech 8900DS) coupled with a gas chromatography–mass spectrometry (GC–MS) system (Agilent 7890A/5975C). Chromatographic separation was achieved on a DB-624 capillary column (60 m × 0.25 mm × 1.4 µm film thickness) in selective ion monitoring (SIM) mode. Prior to injection, samples (400 mL) were preconcentrated using the three-stage cold-trap system, effectively removing interfering components such as H2O and CO2. Target compounds were quantified using a multipoint external calibration method. Calibration curves were established with a 100 ppbv mixed standard gas (Spectra Gases, USA), which was dynamically diluted with ultra-high-purity nitrogen using a mass-flow-controlled dilution system (Nutech 2202A; accuracy ±1 %) to achieve pptv–low ppbv concentration levels. Six concentration gradients were prepared, and the diluted standards were analyzed following the same procedures as the field samples. The calibration results showed correlation coefficients for all target compounds are ≥ 0.996. According to the US EPA (2019) procedure, the method detection limits (MDL) of the target compounds ranged from 0.10 to 1.0 pptv. MDL is defined as 3.143 × standard deviation of seven replicates of the low concentration standard gases (5 × the expected MDL), where 3.143 represents the t-value at 99 % confidence level. Precision in this study was assessed from seven replicate measurements of standard gas samples prepared at environmentally relevant concentrations, with relative standard deviations (RSD) consistently below 7 % for all target compounds (Table S1). This method has been validated through comparisons with the China Meteorological Administration Meteorological Observation Centre for independent analysis using an AGAGE-traceable Medusa-GC/MS system (Zhang et al., 2017; Yu et al., 2020; An et al., 2021). Furthermore, it is consistent with previously published methodologies (Zhang et al., 2010; Zheng et al., 2013; Yi et al., 2021; Li et al., 2024). Detailed analytical procedures and data processing methods are provided in the Supplement (Sects. S2 and S3).
2.3 Analysis of VCHCs in seawater
Surface seawater (5 m) was collected using a 12 L Niskin sampler equipped with a temperature-salinity-depth probe (CTD) for concurrent temperature and salinity measurements. Samples were transferred into 100 mL airtight glass syringes without headspace, stored in the dark at 4 °C, and analyzed within 4 h of collection. To minimize compound concentration changes, Samples for VCHCs were analyzed immediately onboard using a cold trap purge-and-trap gas chromatograph equipped with an electron capture detector (GC–ECD, Agilent 6890A). Briefly, seawater samples (100 mL) were transferred to a purge-and-trap apparatus and purged with high-purity nitrogen at a flow rate of 60 mL min−1 for 14 min. The purged VCHCs were sequentially passed through glass tubes containing magnesium perchlorate (MgClO4) and sodium hydroxide (NaOH) for drying and CO2 removal, followed by enrichment onto a trap column (length: 30 cm; diameter: 0.8 mm) immersed in liquid nitrogen. After trapping, the trap was subsequently heated with boiling water, and the desorbed gases were introduced into the GC using high-purity nitrogen. Separation was performed on a DB-624 capillary column (60 m × 0.53 mm × 3.0 µm film thickness) with the following temperature program: 45 °C (hold 10 min), ramp to 200 °C at 15 °C min−1, and hold for 5 min. The inlet and detector temperatures were 110 and 275 °C, respectively, and the carrier gas (ultrapure N2) flow rate was 2.1 mL min−1.
Identification and quantification of the VCHCs in seawater were based on retention times and liquid standards purchased from o2si in the US (purity > 99 %). The liquid standards were diluted twice with methanol (Merck, Darmstadt, Germany, suitable for purging and analysis) to obtain the desired standard concentrations. Using the same analytical method as for the surface seawater samples, the deep seawater (5000 m) was purged with high-purity N2 to remove the background VCHCs, and standard curves were established by diluting VCHCs standards in series (correlation coefficients > 0.995). The detection limits for target compounds in this method ranged between 0.05 and 0.50 pmol L−1 with a relative standard deviation of 3 % to 9 % (He et al., 2013b, c).
2.4 Determination of chlorophyll a (Chl a) in seawater
For the analysis of Chl a, seawater samples (500 mL) were vacuum-filtered through a 0.7 µm Whatman GF/F glass fiber filter (diameter: 47 mm) and stored in the dark at −20 °C. Upon transport to the laboratory, the samples were extracted in the dark with 10 mL of 90 % acetone for 24 h and centrifuged at 4000 rpm for 10 min. The supernatant was then analyzed using a fluorescence spectrophotometer (F-4500, Hitachi), achieving a detection limit of 0.01 µg L−1.
2.5 Calculation of sea–air fluxes and saturation anomalies
The sea–air fluxes of VCHCs, denoted by F (nmol m−2 d−1), were calculated according to Eq. (1):
where kw (m d−1) is the gas exchange constant. Cw and Ca are the concentrations of VCHCs in surface seawater and the atmosphere, respectively. H is the dimensionless Henry's Law constant, calculated as the equation of seawater temperature (T, in Kelvin). Specifically, the H values for CHCl3 and C2HCl3 were derived from seawater-based temperature–H parameterizations reported by Moore (2000) (Eqs. 2 and 3). The H value for CCl4 was obtained from the seawater-based equation of Hunter-Smith et al. (1983) (Eq. 4). For CH3CCl3, the temperature dependence was taken from the freshwater measurements of Schwardt et al. (2021) and subsequently adjusted to seawater conditions using the Sechenov “salting-out” relationship, with the salting-out coefficient (ks) reported by Gossett (1987) (Eq. 5).
kw was calculated using the parameterization of Wanninkhof (2014) (Eq. 6):
where u is the wind speed and Sc is the Schmidt constant. The Sc values of VCHCs were calculated following Khalil et al. (1999) (Eq. 7):
where t (°C) represents the temperature of the surface seawater and M is the molecular weight of VCHCs.
Saturation anomalies Δ (%) were calculated as the deviation of the observed dissolved concentration from equilibrium with air, according to Eq. (8) (Kurihara et al., 2010).
A positive saturation anomaly implies a net flux from the ocean to the air.
The uncertainty of the sea–air fluxes obtained in this study arises from both systematic and random measurement errors. Propagation of error analysis was performed to quantify the uncertainty associated with the calculated sea–air fluxes, following the approach described by Shoemaker et al. (1974) (Eq. 9).
The precision of VCHCs measurements was under 9 %, determined based on repeated sample injections. The overall error was calculated at approximately 20 %, primarily due to the value of 20 % from Wanninkhof (2014) for uncertainty in kw, influenced by wind speed and Sc variabilities. Also, while a single Henry's Law calculation was done, there is uncertainty in both the determination of H and the temperature dependence. Thus, the error of the flux estimate in this study was determined to be > 20 %.
2.6 Data analysis
The Hybrid Single Particle Lagrangian Integrated Trajectory (HYSPLIT) model, provided by the National Oceanic and Atmospheric Administration (NOAA) (https://www.ready.noaa.gov/, last access: 25 November 2024), was employed to generate 96 h backward trajectories for air masses. The Matlab software was used to compile and analyze all survey station back trajectories. The TrajStat module for the MeteoInfo software was applied for trajectory analysis, enabling the clustering of trajectories based on geographic origins and historical paths identified in a previous study (Squizzato and Masiol, 2015). Following convention (Byčenkienė et al., 2014; Liu et al., 2017), these trajectories were initialized 100 m above sea level. Meteorological data were obtained from the Global Data Assimilation System (GDAS) dataset (http://ready.arl.noaa.gov/archives.php, last access: 25 November 2024).
3.1 Variability of the overlying atmospheric VCHCs concentrations
The atmospheric mixing ratios of the four VCHCs over the Western Pacific are summarized in Figs. 2, 3, and S3. The results indicated that the distributions of the selected VCHCs were correlated with both source strength and prevailing meteorological conditions. To clarify the drivers behind the observed concentration fluctuations and spatial patterns, the trace gases were classified into two groups based on their molecular lifetimes (Table S1).
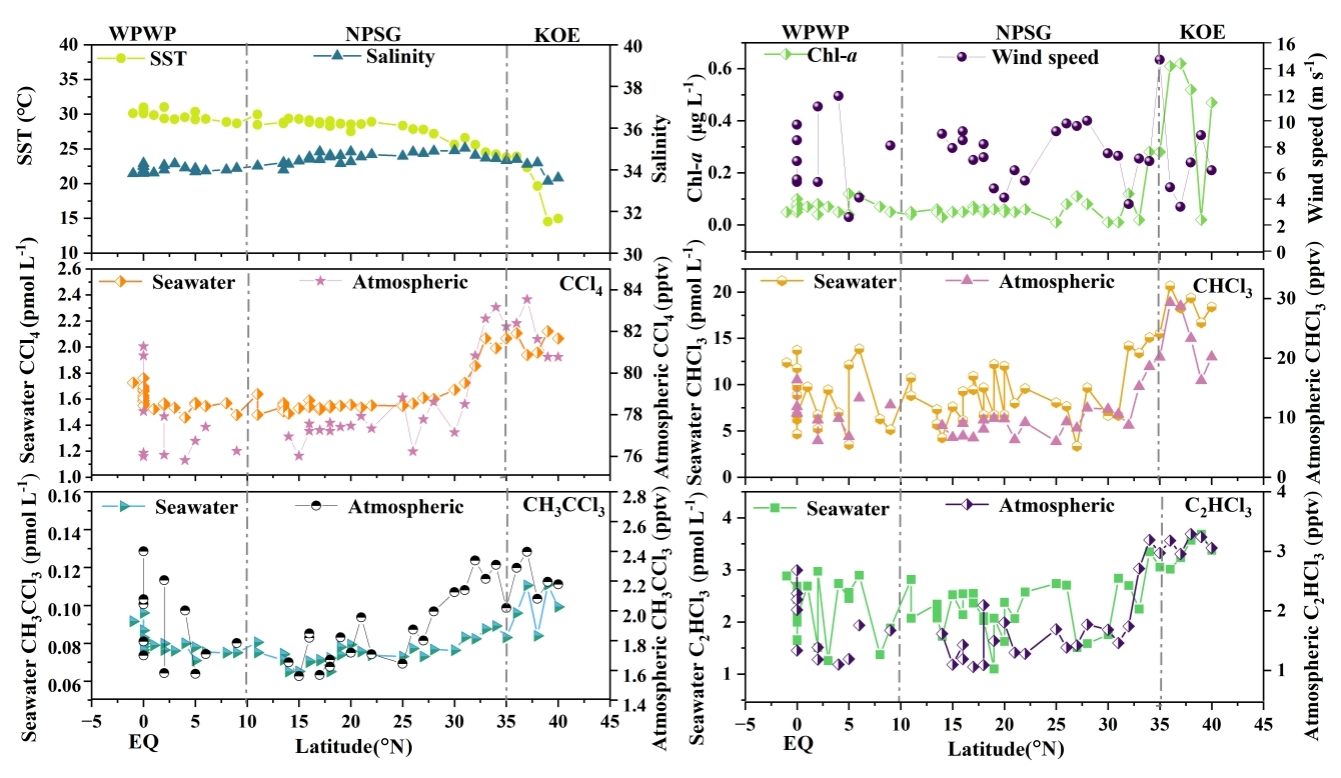
Figure 2Latitudinal distributions of SST, salinity, and Chl a, and surface seawater and atmospheric concentrations of CCl4, CHCl3, CH3CCl3, and C2HCl3, along with wind speed in the Western Pacific.
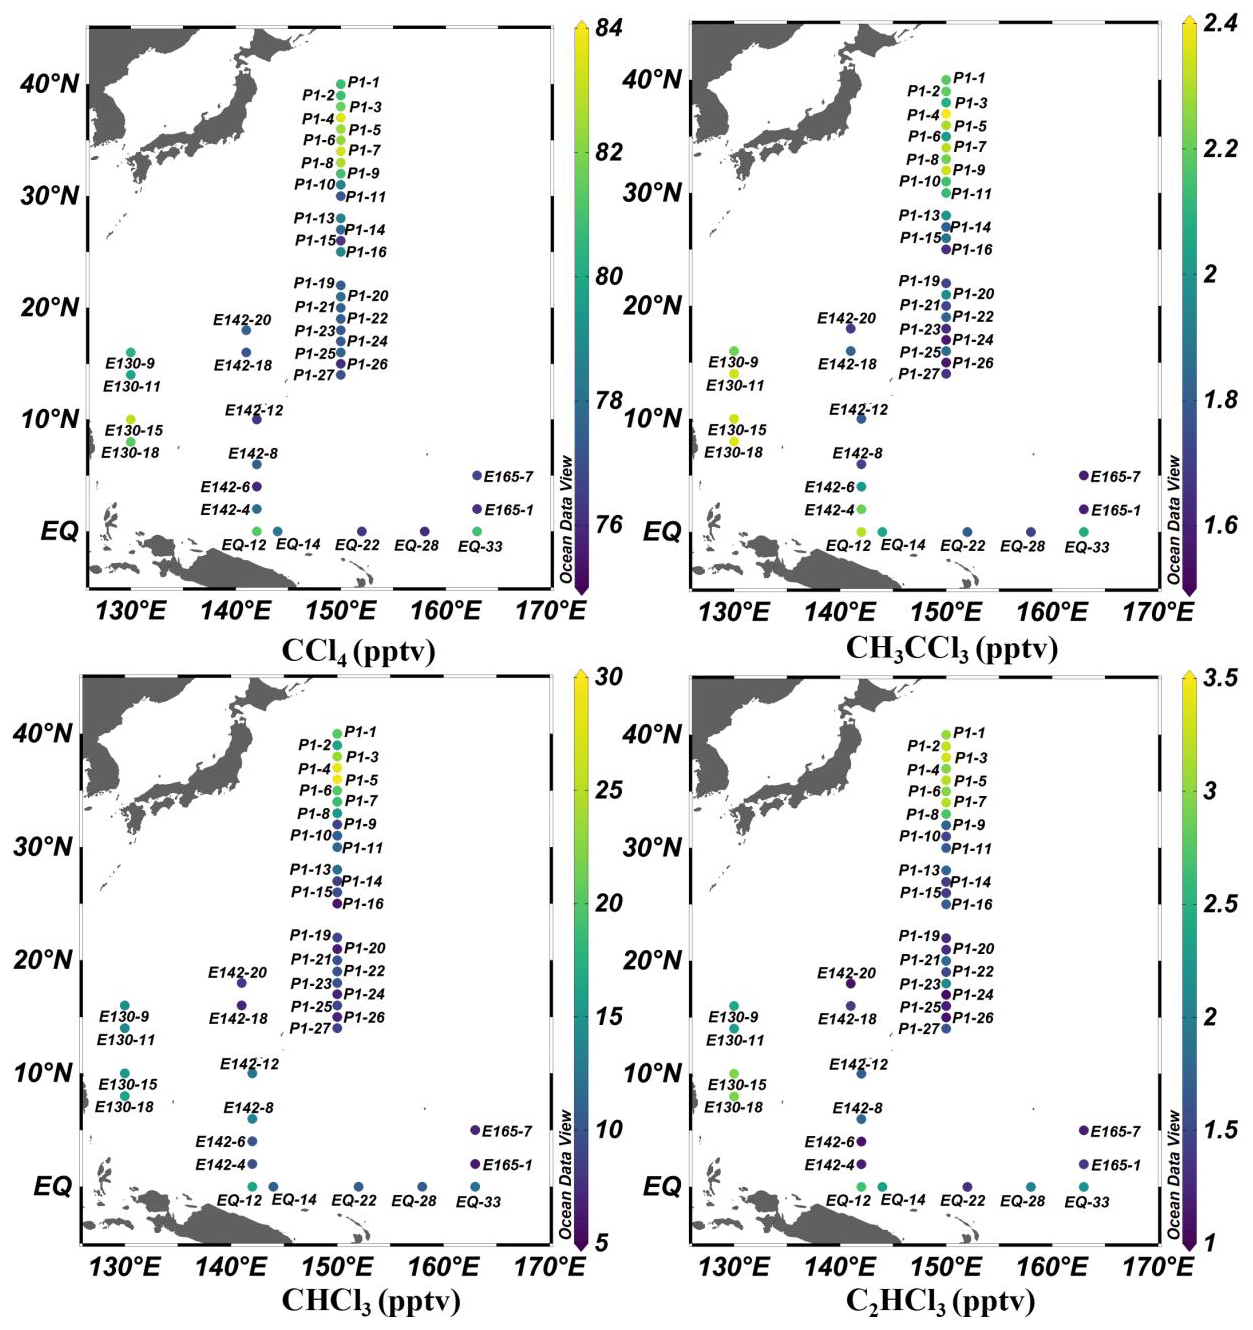
Figure 3Distributions of CCl4, CH3CCl3, CHCl3, and C2HCl3 in the marine atmospheric boundary layer of the Western Pacific. (Figures generated using Ocean Data View; Schlitzer, Reiner, Ocean Data View, https://odv.awi.de, 2025).
3.1.1 CCl4 and CH3CCl3
Atmospheric concentrations of CCl4 and CH3CCl3 over the Western Pacific varied from 75.8 to 83.7 pptv (mean: 78.8 pptv) and from 1.6 to 2.4 pptv (mean: 2.0 pptv), respectively (Figs. 3 and S3). The concentration of CCl4 was similar to the average background mixing ratio of 78.5 pptv in the Northern Hemisphere during a survey from October 2019 to January 2020, as reported by the AGAGE network (https://agage.mit.edu/, last access: 6 November 2024). However, it was considerably lower than the concentrations reported by Blake et al. (2003) for the Pacific Ocean (108.7 pptv) from 24 February to 10 April 2001, the measurements by Zhang et al. (2010) in 2007 for the Pearl River Delta region (116 pptv), those by Ou-Yang et al. (2017) in 2015 for the Mt. Fuji Research Station in Japan (84 pptv), and by Zheng et al. (2019) in 2015 at the Yellow River delta in China (109 pptv). Similarly, the mean CH3CCl3 concentration in this study (2.0 pptv) exceeded the average background mixing ratio of 1.67 pptv in the Northern Hemisphere during a survey from October 2019 to January 2020 (https://agage.mit.edu/). However, the level reported here was lower than the concentration reported by He et al. (2013b) for the South Yellow Sea (9.1 pptv) from 2 to 9 May 2012. Similarly, it was considerably lower than those reported by Blake et al. (2003) for the Pacific Ocean (132 pptv) from 24 February to 10 April 2001. It was also lower than the observed concentrations in the Pearl River Delta region (53 pptv) from 25 October to 1 December 2007, by Zhang et al. (2010); the Mt. Fuji Research Station in Japan (4.0 pptv) from 12 to 17 August 2015, by Ou-Yang et al. (2017); and the Yellow River Delta region, Northern China (2.8 pptv) from 8 June to 9 July 2017, by Zheng et al. (2019). These discrepancies likely reflect temporal variability in emissions and changes in the global burden, as well as differences in the sampling locations. Most samples in this study were collected in regions less influenced by continental outflow, resulting in relatively low concentrations.
Figure 3 shows the spatial distributions of atmospheric mixing ratios of CCl4 and CH3CCl3. Significant enhancements were observed at nearshore stations (e.g., P1-4, P1-5, P1-7, P1-8 and EQ12). CCl4 concentrations in these stations were 4 %–6 % higher than the regional average, exceeding its analytical precision threshold of 3σ (3.3 %, Table S1). These enhancements exhibited clear spatial consistency, systematically concentrated in nearshore areas influenced by continental air masses (Figs. 1c and 3). Moreover, the elevated levels coincided with enhanced concentrations of the independent anthropogenic tracer SF6 (Ni et al., 2023), further corroborating their origin from continental pollution outflows. This result is also consistent with previous studies reporting that elevated CCl4 and CH3CCl3 levels are primarily concentrated in coastal regions (Blake et al., 2003; Zhang et al., 2010).
In this study, the highest atmospheric concentrations of CCl4 and CH3CCl3 were recorded at station P1-4 near Japan. Backward trajectory cluster analysis (Figs. 1c and S4) indicated that approximately 13 % of the air masses originated from short-range transport along the eastern coast of Japan, while the remaining 87 % were associated with long-range transport from Siberia and Northeast China and subsequently passed over the eastern coast of Japan. Although Siberia and Northeast China are not typical source regions for halocarbons, previous studies have shown that air masses from these regions may mix with pollution plumes from East Asian industrial areas during long-range transport (Stohl et al., 2002; Blake et al., 2003; Liang et al., 2004; Chang et al., 2022), which could lead to elevated VCHCs concentrations at downwind observation stations. This is corroborated by reports of CCl4 pollution events at the Shangdianzi (SDZ) regional background station in Northern China (117.17° E, 40.65° N, Fig. 1a), with peak mixing ratios reaching 151 pptv (Yi et al., 2023). As anthropogenic compounds, CCl4 and CH3CCl3 are primarily emitted from industrial activities, including chloromethane and perchloroethylene production (Liang et al., 2016; Sherry et al., 2018), as well as unreported releases from chlorine and bleaching processes (estimated up to 10 Gg yr−1). Furthermore, Zheng et al. (2019) and Ou-Yang et al. (2017) reported elevated CCl4 and CH3CCl3 levels in China and Japan, respectively. Lunt et al. (2018) identified continued CCl4 emissions from Eastern Asia. Collectively, these findings suggested that continental air mass transport was likely the dominant factor driving the elevated CCl4 and CH3CCl3 levels observed at station P1-4 during the study period. In contrast, the lowest CCl4 and CH3CCl3 concentrations were observed at station P1-24, where all affecting air mass trajectories came from the Pacific Ocean (Figs. 1c and S4), indicating the influence of clean marine background air (Fig. 1c).
3.1.2 CHCl3 and C2HCl3
The atmospheric mixing ratios of CHCl3 and C2HCl3 over the Western Pacific ranged from 6.0 to 29.4 pptv (mean: 12.4 ± 5.7 pptv) and from 1.1 to 3.4 pptv (mean: 2.0 ± 0.7 pptv), respectively. The concentration of CHCl3 measured in the current work was similar to the average background mixing ratio of 11.82 pptv measured in the Northern Hemisphere during the survey period from October 2019 to January 2020, as reported by AGAGE network (https://agage.mit.edu/). However, it was lower than values reported from other areas, such as the Mt. Fuji Research station of Japan from 12 to 17 August 2015 (39 ± 11 pptv; Ou-Yang et al., 2017), and the Yellow River Delta region, Northern China, from 8 June to 9 July 2017 (283 pptv; Zheng et al., 2019). The measurements of C2HCl3 were lower than in areas close to land sources, such as the South Yellow Sea from 2 May to 9, 2012 (27.3 pptv; He et al., 2013b) and the Yellow River Delta region, Northern China, from 8 June to 9 July 2017 (20 pptv; Zheng et al., 2019). This difference could be attributed to the surveyed area being a relatively open sea, where the dilution effect by air from the marine boundary layer (MBL) is more pronounced. Furthermore, the air in the study area is more photochemically aged, leading to lower observed values of C2HCl3.
Spatially, elevated concentrations of atmospheric CHCl3 and C2HCl3 were detected in nearshore regions, such as the KEO area and stations EQ12, E130-15, and E130-18 (Figs. 2 and 3). Both CHCl3 and C2HCl3 showed significant correlations with SF6 (r = 0.56, n = 38, p < 0.01 and r = 0.54, n = 38, p < 0.01, respectively; Fig. S5). The result indicated that the high concentrations of these two gases in the atmosphere mainly originated from anthropogenic input, as SF6 is an important indicator of terrigenous sources. The 96 h backward trajectory cluster analysis revealed that the KEO region is affected by air masses originating from Siberia, Northeast China, Korea, and Japan (Fig. 1c). While Siberia and Northeast China themselves are not recognized as major VCHCs source regions, the long-range air masses from these areas may have entrained polluted plumes during their transport (Sect. 3.1.1). Indeed, surrounding regions are known to be significant emitters: Fang et al. (2019) reported a marked rise in China's CHCl3 emissions in recent years, and An et al. (2023) further showed that emissions peaked at 193 Gg yr−1 in 2017 before declining to 147 Gg yr−1 in 2018 and remaining stable thereafter, with eastern China consistently identified as a major contributor. Moreover, Ou-Yang et al. (2017) observed high atmospheric CHCl3 mixing ratios (39 ± 11 pptv) at the Mt. Fuji research station, Japan, in 2015; and in 2017, the highest annual mean CHCl3 (43 ± 18 pptv) was recorded at the Gosan station (GSN, 127.17° E, 33.28° N, 72 m above sea level, a regional baseline station; Fig. 1a) on Jeju Island, South Korea. Furthermore, industrial activities are known sources of CHCl3 and C2HCl3 (Montzka et al., 2011; Oram et al., 2017; Zheng et al., 2019). Thus, the elevated CHCl3 and C2HCl3 observed in the KEO region were likely related to terrestrial air mass transport and subsequent mixing with polluted plumes during their transit.
In addition to terrestrial contributions, positive saturation anomalies of CHCl3 and C2HCl3 in surface seawater (Fig. 4) indicated supersaturation, suggesting the oceanic emissions as a potential source of atmospheric CHCl3 and C2HCl3. Previous studies have reported that substantial amounts of CHCl3 and C2HCl3 are released from marine macroalgae and microalgae (Abrahamsson et al., 1995, 2004a; Chuck et al., 2005; Ekdahl et al., 1998; Lim et al., 2018) and subsequently transferred to the atmosphere via sea–air diffusion. Consistent with this, atmospheric CHCl3 and C2HCl3 exhibited significant positive correlations with Chl a levels in the study area (r = 0.83 and 0.58, p < 0.01, n = 41; Fig. S6), supporting a potential biological contribution. Nevertheless, atmospheric levels of CHCl3 and C2HCl3 were not fully consistent with oceanic emissions indicators (saturation anomalies and sea–air fluxes). In the KOE region, where atmospheric mixing ratios and Chl a were elevated, their saturation anomalies were relatively low compared to other regions (Fig. 4), and estimated sea–air fluxes showed no significant enhancement (Fig. 5). Moreover, strong correlations between atmospheric concentrations of CHCl3 and C2HCl3 with terrestrial tracers (CCl4, CH3CCl3, and SF6; Figs. S6 and S7) suggested shared terrestrial sources or common atmospheric processes. Collectively, these results indicate that although marine biological production contributes to CHCl3 and C2HCl3 emissions, terrestrial transport was the dominant factor controlling their atmospheric variability in the study region.
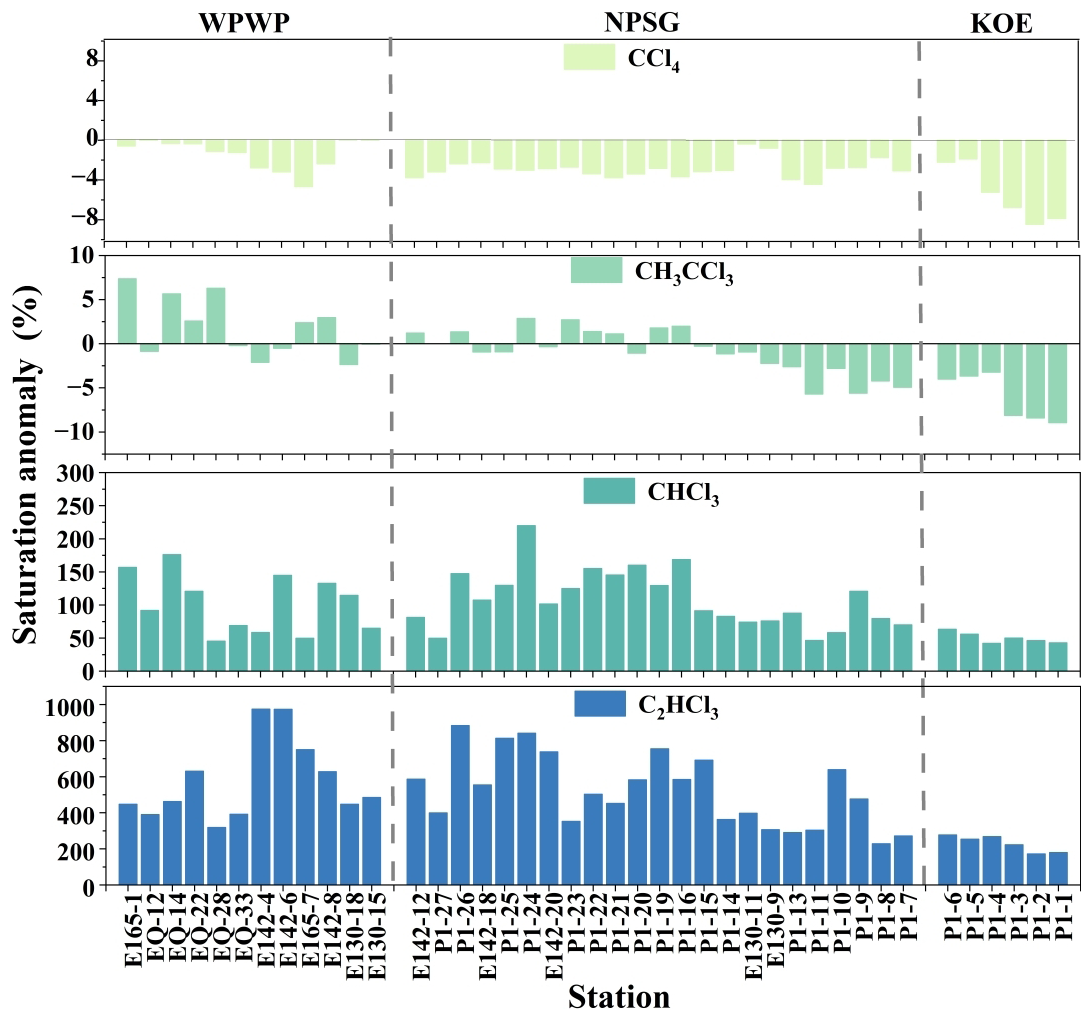
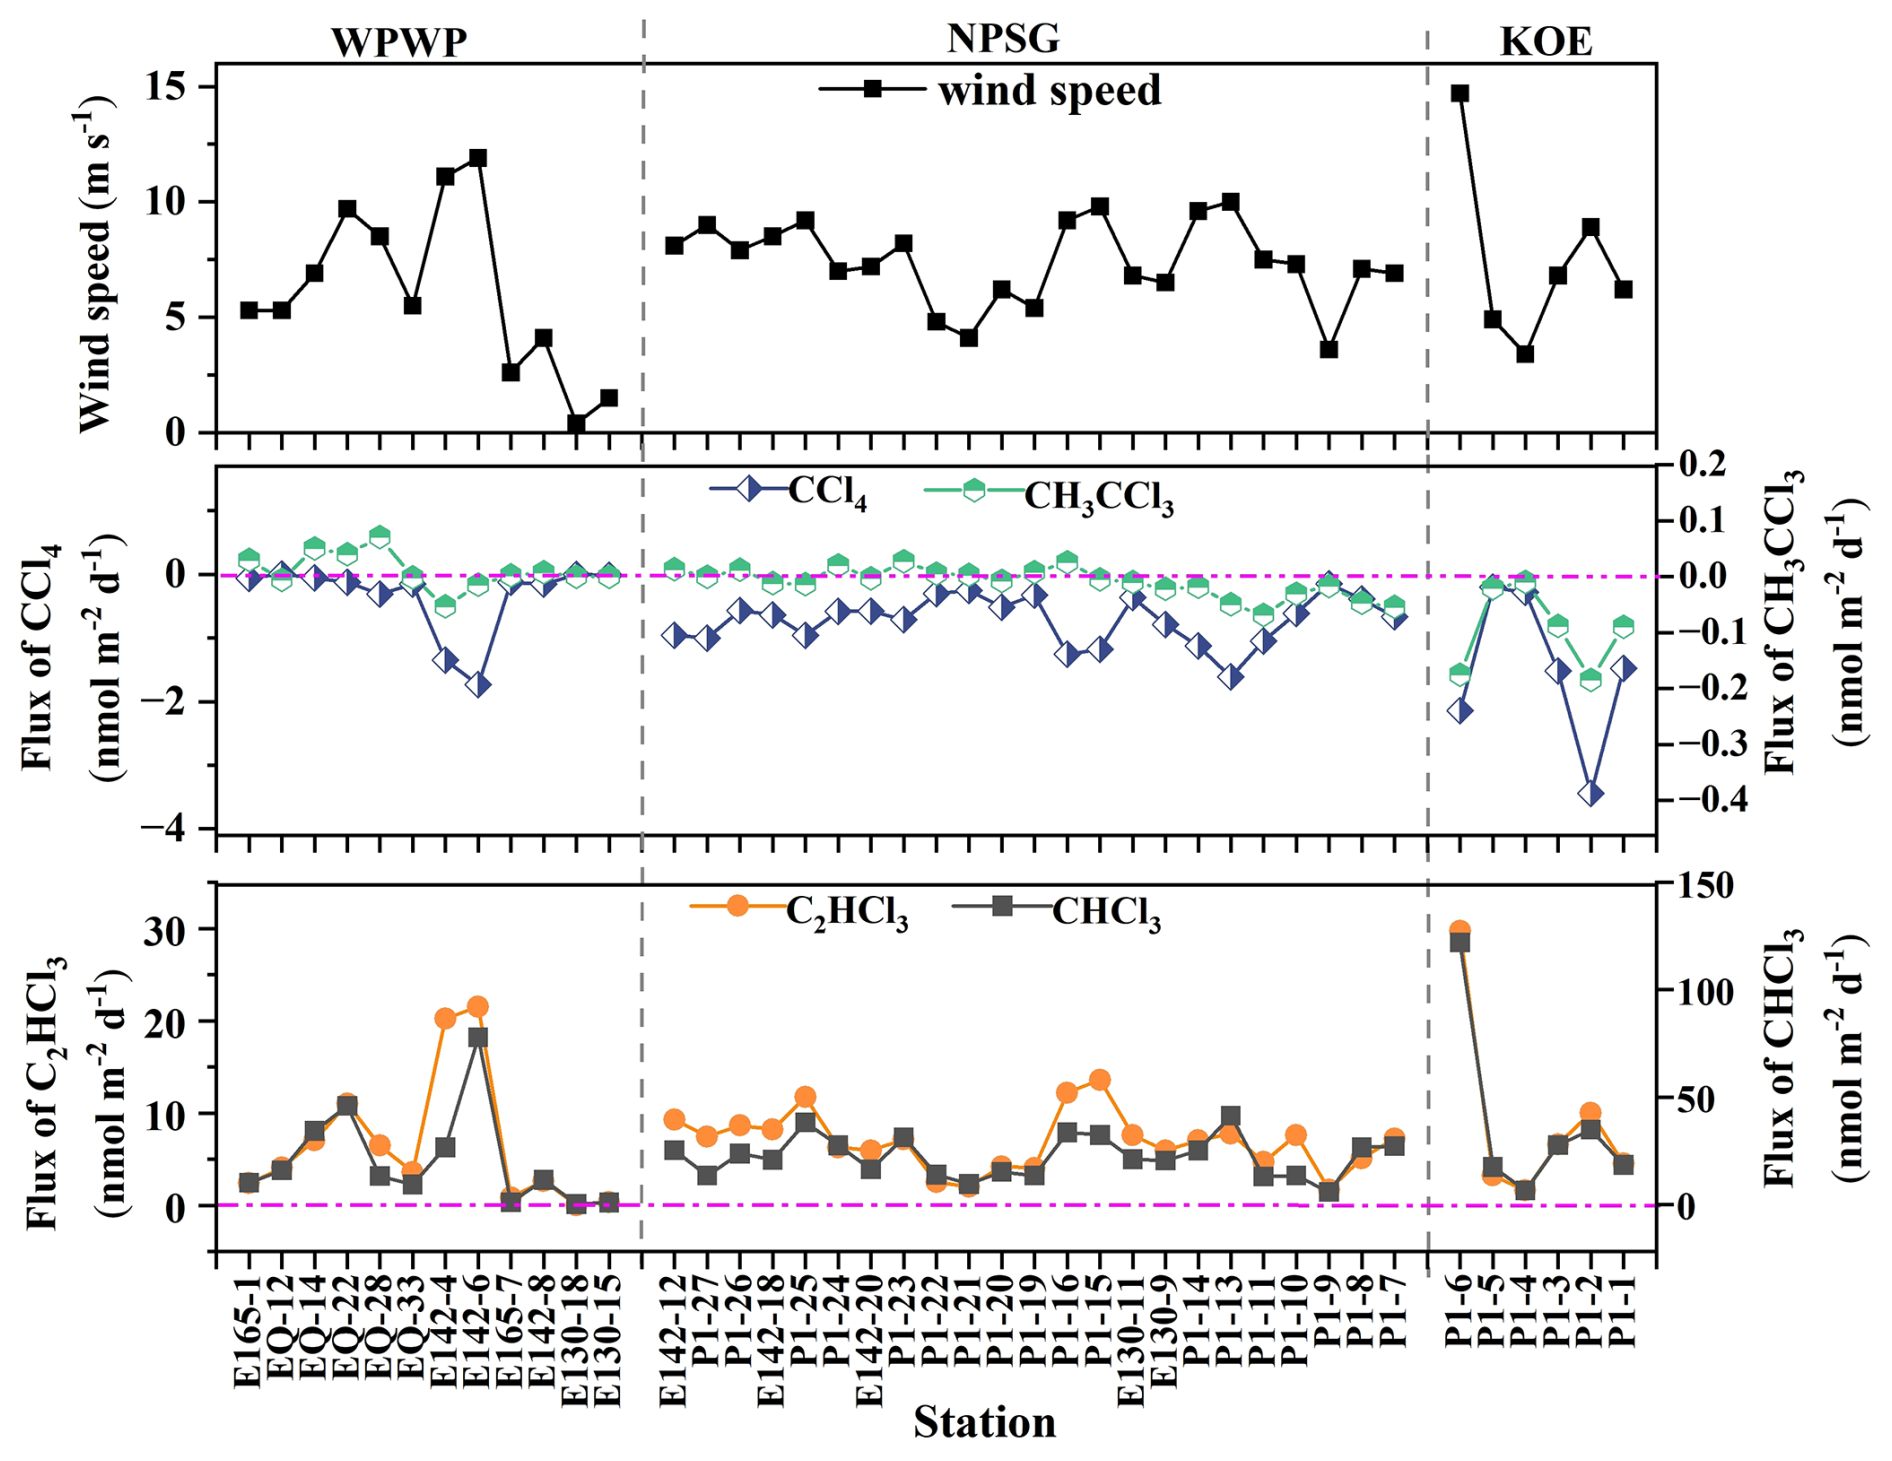
Figure 5Sea–air fluxes of CCl4, CH3CCl3, CHCl3, and C2HCl3, along with wind speeds in the Western Pacific.
3.2 Regional characteristics of seawater VCHCs and their driving factors
The seawater distributions of CHCl3, C2HCl3, CCl4, and CH3CCl3 are shown in Fig. 2. Seawater CHCl3, C2HCl3, CCl4, and CH3CCl3 exhibited significant regional variability in the Western Pacific. Surface seawater concentrations of CHCl3, C2HCl3, CCl4, and CH3CCl3 in the KOE region were higher than those in the NPSG and WPWP (Fig. 2).
3.2.1 Kuroshio-Oyashio Extension
The KOE area is characterized by a complex hydrography, with sharp meridional gradients in temperature and salinity due to the convergence of the warm, saline KC and the cold, less saline OC (Fig. 2). Moreover, the KC transports warm seawater northward, where it cools and blends with the nutrient-rich OC (Wan et al., 2023; Xu et al., 2023). The resulting upward flux of nutrients induced by the mesoscale eddies from the Kuroshio and the Kuroshio Extension replenish the upper ocean in the KOE with a substantial nutrient supply (Fig. S2). This, in turn, enhances primary productivity in the surface seawater, as evidenced by the elevated Chl a concentrations observed here (Figs. 2 and S2).
The higher surface seawater concentrations of CHCl3 and C2HCl3 in the KOE are likely attributable to a combination of factors, including phytoplankton activity, terrestrial air mass transport, and physical conditions. Given the proximity of the KOE region to land, atmospheric CHCl3 and C2HCl3 might have been augmented by inputs from long-distance land-based air masses originating from land (as discussed in Sect. 3.1). Additionally, the lower surface seawater temperature (SST) in this region facilitated the dissolution of CHCl3 and C2HCl3, while high atmospheric concentrations of these compounds from long-distance land transport could have helped to replenish the CHCl3 and C2HCl3 in the surface seawater. However, the positive saturation anomalies of CHCl3 and C2HCl3 were observed in the KOE (Fig. 4). In addition, elevated seawater concentrations of CHCl3 and C2HCl3, corresponding to high Chl a concentrations in the KOE region (Fig. 2), could be indicative of the influence of emissions from phytoplankton. Previous studies have demonstrated that phytoplankton blooms significantly contribute to the production of these compounds (Abrahamsson et al., 1995, 2004b; Chuck et al., 2005; Roy et al., 2011; Lim et al., 2018). In particular, diatoms and prymnesiophytes have been identified as dominant microalgal groups releasing CHCl3 (Roy et al., 2011; Lim et al., 2018). In the Northwest Pacific, diatoms and dinoflagellates are prevalent, with diatoms thriving in the nutrient-rich Oyashio region (Wang et al., 2022), further supporting the biogenic origin of CHCl3 and C2HCl3 in this area. Taken together, the observed positive saturation anomalies (Fig. 4), together with the short atmospheric lifetimes of these compounds (< 6 months; WMO, 2022), indicated that in situ phytoplankton emissions exert a stronger control on seawater concentrations of CHCl3 and C2HCl3 than terrestrial atmospheric inputs.
In contrast, CCl4 and CH3CCl3 exhibited negative saturation anomalies in the KOE region (Fig. 4). Given that both gases are primarily of anthropogenic origin (Wang et al., 1995; Rigby et al., 2014), their elevated seawater concentrations in this region (Fig. 2) are likely attributable to long-range atmospheric transport from land. Moreover, the relatively low SST in the KOE might further enhance their solubility, reinforcing this undersaturation (Fig. 4). Collectively, these results highlight the dominant influence of atmospheric inputs in controlling the distribution of seawater of CCl4 and CH3CCl3 in the KOE.
3.2.2 North Pacific Subtropical Gyre
In contrast to the KOE, the NPSG lies at the center of the subtropical gyre and is strongly influenced by a deep nutricline (Fig. 1a and b). It is characterized by high temperature and salinity but persistently low nutrient concentrations, as regional hydrographic conditions restrict the upward flux of nutrients through vertical transport (Xu et al., 2023; Fig. S2). Nutrient replenishment occurs primarily via vertical eddy diffusion, which is generally insufficient to sustain high productivity (Gupta et al., 2022). Consequently, the surface waters remain chronically nutrient-deficient, and the NPSG is often regarded as an oceanic desert with limited biological standing stocks. Figure 2 shows that concentrations of CHCl3, C2HCl3, CCl4, and CH3CCl3 in the NPSG were lower than in the KOE, likely because the NPSG is located far from land (Fig. 1a) and has a high SST (Fig. 2). Additionally, the Chl a levels and nutrients were considerably lower in the NPSG than in the KOE region (Fig. S2). This suggested that the reduced release of CHCl3 and C2HCl3 from phytoplankton could have also contributed to the lower concentrations of these gases observed in the NPSG. Previous studies have confirmed that nutrient limitation reduces phytoplankton abundance, thereby lowering halocarbon production and emissions (Smythe-Wright et al., 2010; Liu et al., 2021).
3.2.3 Western Pacific Warm Pool
The WPWP is distinguished by strong stratification and a prominent barrier layer formed by heavy precipitation, which enhances surface-layer stability and restricts vertical nutrient transport (Qu and Meyers, 2005; Xu et al., 2023). Despite the abundance of subsurface nutrients, the presence of a shallow mixed layer and thick barrier layer limits nutrient exchange with the euphotic zone (Fig. S2). These conditions constrain primary productivity and, together with high SST, lead to relatively low surface seawater concentrations of CHCl3 and C2HCl3, comparable to those observed in the NPSG (Fig. 2). However, seawater concentrations of CCl4 and CH3CCl3 were relatively elevated near the equatorial WPWP (Fig. 2). This pattern likely reflected the proximity to landmasses such as Papua New Guinea, where terrestrial inputs via riverine runoff and atmospheric transport contribute to enhanced concentrations of these compounds in surface seawater (Fig. 1c).
3.2.4 Correlations between VCHCs in seawater
CHCl3 and C2HCl3 were found to be supersaturated in seawater, with previous studies suggesting that they primarily originate from biological processes within the ocean rather than relying solely on atmospheric inputs (Sect. 3.2.1). The strong positive correlation between CHCl3 and C2HCl3 in seawater (r = 0.71, p < 0.01, n = 65; Fig. S8) supported the idea that these compounds share a similar production mechanism, specifically emissions from biological processes. In contrast, CCl4 and CH3CCl3 were undersaturated in seawater and primarily entered the ocean through atmospheric deposition, meaning that their concentrations in seawater were more influenced by atmospheric inputs (Sect. 3.2.1). Moreover, despite the supersaturation of CHCl3 and C2HCl3 in seawater and the undersaturation of CCl4 and CH3CCl3, these four compounds still exhibited significant linear correlations in their concentrations (Fig. S8), suggesting that they were influenced by similar oceanic and atmospheric processes. This correlation likely reflected partially overlapping sources, such as riverine input and atmospheric transport (Fogelqvist, 1985; He et al., 2013a, c). Additionally, oceanic physical processes, such as water mass mixing, diffusion, and vertical movement, played a crucial role in the distribution of gases in seawater (Doney et al., 2012). The synchronous influence of these processes on VCHCs might have been the reason for the linear correlation and similar distribution patterns observed for these four VCHCs in seawater. Specifically, in the Western Pacific, the unique hydrodynamic conditions significantly influenced the distribution patterns of CHCl3, C2HCl3, CCl4, and CH3CCl3. Major ocean currents, such as the Kuroshio and Oyashio, created zones of convergence and divergence that enhanced vertical and horizontal mixing, transporting gases from deeper waters to the surface and redistributing them across different regions, affecting their concentrations and distribution. Additionally, mesoscale eddies contribute to the diffusion of gases within the water column, resulting in gases from different sources (biogenic and atmospheric deposition) being more uniformly distributed in seawater (McGillicuddy, 2016; Xu et al., 2023).
3.3 Sea–air fluxes and saturation anomalies of VCHCs
The saturation anomalies and sea–air fluxes of CHCl3, C2HCl3, CCl4, and CH3CCl3 were estimated based on their simultaneously measured seawater and atmospheric concentrations, as outlined in Sect. 2.5 (Figs. 4 and 5). The saturation anomalies of CHCl3 and C2HCl3 were positive, whereas CCl4 and CH3CCl3 exhibited negative saturation anomalies at most stations of this study (Fig. 4). Moreover, the mean sea–air fluxes (range) for CHCl3, C2HCl3, CCl4, and CH3CCl3 were 23.96 (0.10–121.98), 7.18 (0.02–29.76), −0.73 (−3.44–0.00), and −0.02 (−0.18–0.07) nmol m−2 d−1. These results indicated that CHCl3 and C2HCl3 were in a state of supersaturation in the surface seawater, leading to their emission into the overlying atmosphere. In contrast, CCl4 and CH3CCl3 were undersaturated within the surface seawater and were assimilated from the overlying atmosphere. Hence, we tentatively concluded that the Western Pacific was a source of CHCl3 and C2HCl3 and a sink for CCl4 and CH3CCl3 during the cruise periods.
Compared to the marginal sea of the Western Pacific, this study's estimates of CHCl3 and C2HCl3 emission and CCl4 and CH3CCl3 uptake were lower (Yang et al., 2015; He et al., 2017; Wei et al., 2019). For example, the average flux of CHCl3 and C2HCl3 in this study was significantly lower than those reported in the northern Yellow Sea and Bohai Sea by He et al. (2017) (C2HCl3: 162.6 nmol m−2 d−1), Wei et al. (2019) (CHCl3: 177.5 nmol m−2 d−1, C2HCl3: 99.5 nmol m−2 d−1), He et al. (2019) (C2HCl3: 59.4 nmol m−2 d−1), and Yang et al. (2015) (CHCl3: 183.4 nmol m−2 d−1). Compared with the average fluxes of CCl4 (−21.3 nmol m−2 d−1) and CH3CCl3 (−6.8 nmol m−2 d−1) in the South Yellow Sea and East China Sea as reported by Yang et al. (2015), the average fluxes of CCl4 and CH3CCl3 in this study were lower. Although there were significant differences in sea–air fluxes compared with the marginal sea of the Western Pacific, both indicated that the ocean is a source of CHCl3 and C2HCl3 in the atmosphere, but a sink of CCl4 and CH3CCl3.
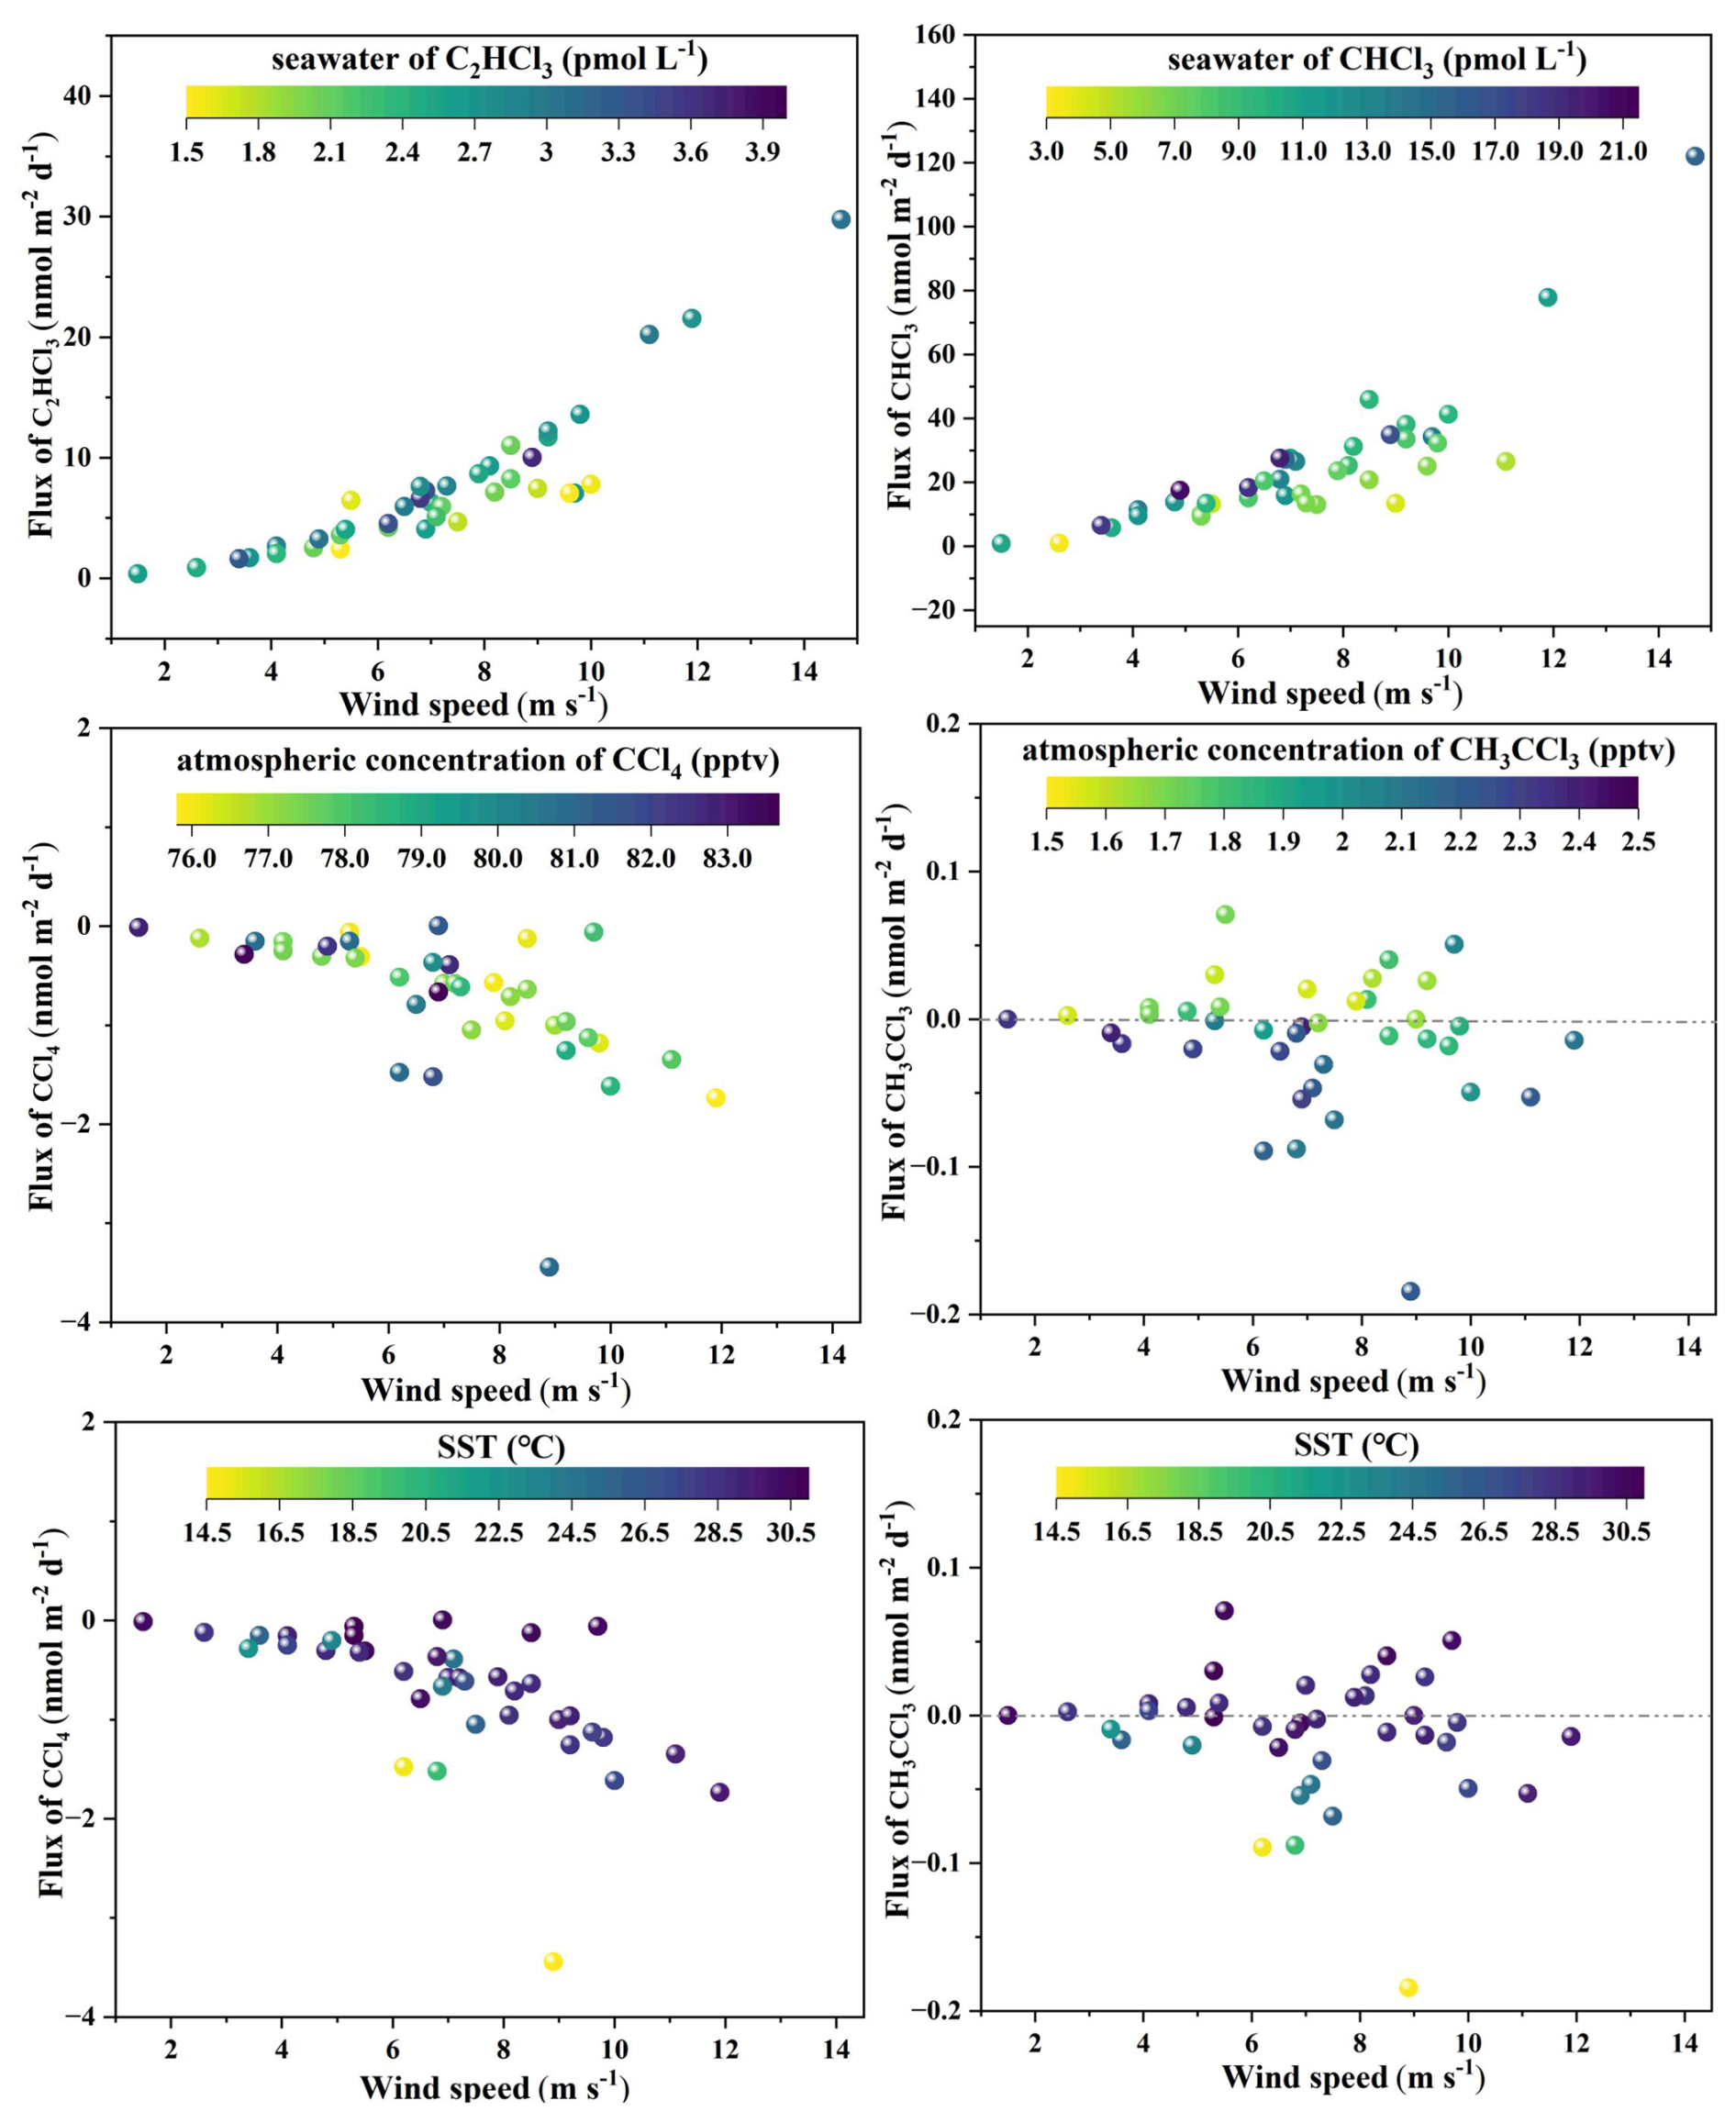
Figure 6Relationships between sea–air fluxes of VCHCs and wind speed, SST, and VCHCs concentrations in seawater and the atmosphere.
As shown in Figs. 5 and 6, the fluxes of CHCl3 and C2HCl3 in the Western Pacific exhibited considerable spatial variability and generally corresponded with wind speeds. For instance, high fluxes of CHCl3 and C2HCl3 at station P1-6 coincided with high wind speeds, while the low CHCl3 and C2HCl3 fluxes at station E130-15 coincided with low wind speeds. However, as shown in Fig. 6, at a given wind speed, the fluxes were low due to low seawater concentrations of CHCl3 and C2HCl3. Thus, seawater concentrations also had a large influence on the spatial variability of the sea–air fluxes of CHCl3 and C2HCl3. The air-sea fluxes of CCl4 and CH3CCl3 were also higher at stations with high wind speeds (Figs. 5 and 6). Similarly, Butler et al. (2016) found that the air-sea exchange rate was the primary driver of oceanic uptake of CCl4, mainly driven by wind speed. However, the highest air–sea fluxes of CCl4 and CH3CCl3 were observed at station P1-2, which had the highest equilibrium solubility (ratio of atmospheric concentration to Henry's Law constant) (Fig. 5). Moreover, at a given wind speed, the fluxes of CCl4 and CH3CCl3 were lower where their atmospheric concentrations were lower and where SST was higher (Fig. 6). Therefore, the spatial variability of sea–air CCl4 and CH3CCl3 fluxes were not only affected by wind speed but were also related to atmospheric CCl4 and CH3CCl3 concentrations and SST. A similar investigation observed a comparable relationship between sea–air fluxes, wind speed, and atmospheric concentration while examining the distribution of SF6 in seawater (Ni et al., 2023).
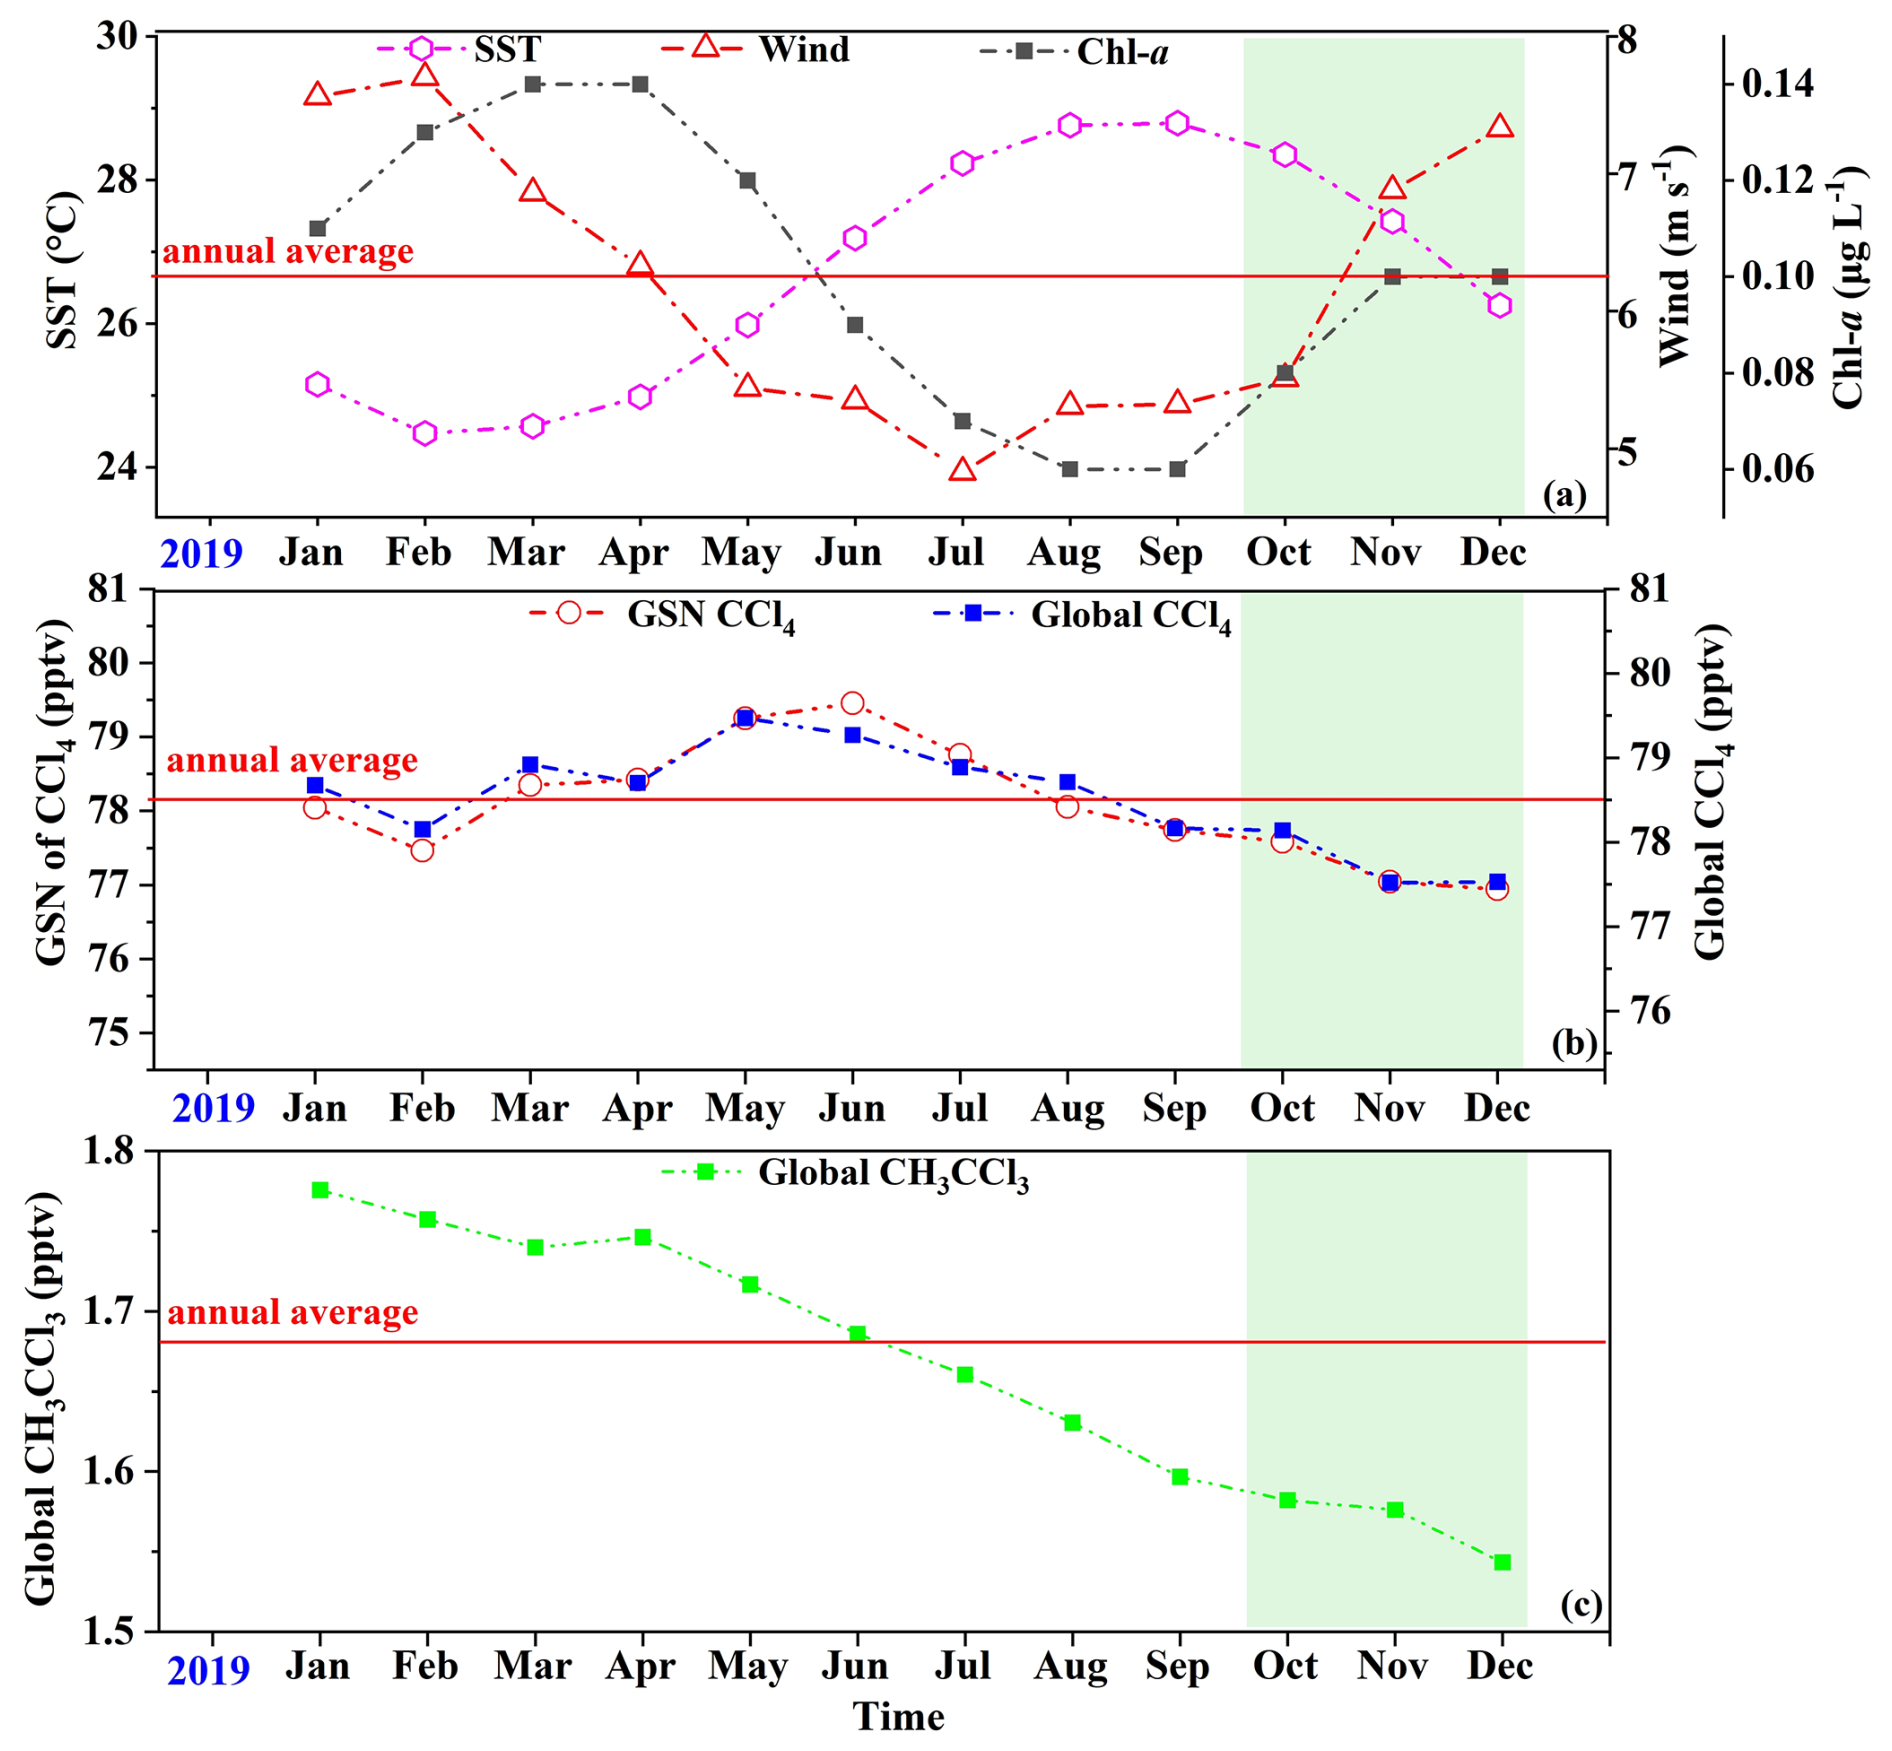
Figure 7(a) Interannual variations of wind speed, SST, and Chl a concentration in the study area during 2019. (b) Interannual variability of CCl4 at the GSN site in 2019 compared with the global mean. (c) Interannual variability of CH3CCl3 at the global scale in 2019. Wind speed data were obtained from the ERA5 reanalysis (Hersbach et al., 2020), SST data from the ECCO2 cube92 dataset (Menemenlis et al., 2008), and Chl a data from the NASA Ocean Biology Processing Group (2022). Atmospheric CCl4 and CH3CCl3 data were obtained from the AGAGE network (https://agage.mit.edu/). Shaded areas indicate the cruise sampling periods.
It should be noted that the sea–air flux estimates of CHCl3, C2HCl3, CCl4, and CH3CCl3 presented in this study are derived exclusively from autumn and winter cruise observations, and thus may not fully represent their annual averages due to seasonal variability. The spatiotemporal patterns of sea–air fluxes are primarily governed by the concentrations of VCHCs in the atmosphere and seawater, SST, and wind speed. In particular, seawater concentrations of CHCl3 and C2HCl3 are strongly modulated by biological activity (Sect. 3.2), while both SST and wind speed exhibit pronounced seasonal variations (Fig. 7a). Moreover, according to AGAGE data (https://agage.mit.edu/), the interannual variability of global atmospheric CCl4 in 2019 was 2 %, with variability at GSN sites of 3 % (Fig. 7b), whereas global atmospheric CH3CCl3 varied by 13 % (Fig. 7c). During the observation period (October–December 2019), mean atmospheric CCl4 concentrations at both GSN sites and the global scale were approximately 1 % lower than their respective annual means, while the global CH3CCl3 concentration was about 6 % lower (Fig. 7c). These results suggest that atmospheric CCl4 levels in the Western Pacific were likely close to the annual mean during this period, whereas CH3CCl3 levels were possibly somewhat lower. In addition, SST and Chl a in the study region during the observation period were broadly consistent with their annual means, whereas wind speeds were on average 6 % higher (Fig. 7a; Tang et al., 2022). Consequently, the sea–air fluxes of CHCl3, C2HCl3, and CCl4 reported in this study are likely somewhat higher than the annual mean, primarily due to the elevated wind speeds during the cruises.
In the Western Pacific (130–180° E, 0–40° N, area: 2.17 × 10⁷ km2), the estimated annual oceanic uptake of CCl4 was 0.9 Gg yr−1. The associated uncertainty was quantified by combining the 95 % confidence interval, derived from the standard error of fluxes within the study region, with the inherent > 20 % systematic uncertainty of flux estimates. The resulting uptake range is 0.5–1.3 Gg yr−1, with an overall uncertainty of 0.4 Gg yr−1. Given that fluxes during the observation period were likely higher than annual averages, the annual CCl4 uptake estimated in this study may be slightly overestimated. Moreover, considering that elevated SST reduces gas solubility, strengthens ocean stratification, and alters wind patterns, future warming of the western Pacific is expected to diminish the oceanic sink capacity for CCl4.
3.4 The role of the Western Pacific in regulating Eastern Asia CCl4
Eastern Asia, particularly eastern China, was a major source of global CCl4 emissions, significantly contributing to the global CCl4 burden (Lunt et al., 2018). The primary emission sources included the manufacture of general-purpose machinery, the production of CH3Cl, CH2Cl2, CHCl3, and C2Cl4, which generate CCl4 as a byproduct, as well as the use of CCl4 as a raw material and processing agent in the chemical manufacturing industry (Park et al., 2018; Li et al., 2024). Although CCl4 emissions from eastern China declined significantly by nearly 45 % between 2016 and 2019, Eastern Asia remained a major source of atmospheric CCl4 (WMO, 2022). Our study suggested that CCl4 emissions from Eastern Asia may have been a significant source of atmospheric CCl4 in the Western Pacific (Sect. 3.1). The Western Pacific, as a sink for East Asian CCl4, played a key role in regulating atmospheric CCl4 concentrations. Based on our estimates (Sect. 3.3), the estimated oceanic absorption of CCl4 in the Western Pacific (0.9 ± 0.4 Gg yr−1) accounted for 14.3 ± 6.8 % of the Eastern China emissions (6.3 ± 1.1 Gg yr−1 in 2019; WMO, 2022), 5.6 ± 2.5 % of the emissions from Eastern Asia (16 (9–24) Gg yr−1 on average between 2009 and 2016; Lunt et al., 2018), and 2.1 ± 1.1 % of the total global emissions (global emissions were 44 ± 14 Gg yr−1; WMO, 2022). Furthermore, the estimated oceanic absorption of CCl4 in the Western Pacific accounted for 6.3 ± 2.8 % of the global oceanic absorption (14.4 Gg yr−1; Butler et al., 2016). These data indicated that the Western Pacific as a sink of CCl4 was crucial for regulating atmospheric CCl4 concentrations and mitigating the accumulation of CCl4 in the atmosphere of Eastern Asia. This result was consistent with Butler et al. (2016), further confirming the critical role of the Western Pacific in the global CCl4 cycle and emphasizing the ocean's indispensable role as a sink for atmospheric CCl4. Notably, despite the estimate originating from a region with relatively little anthropogenic influence, the absorption capacity of the Western Pacific indicates it can significantly contribute to reducing global CCl4 levels. This finding also aligned with Yvon-Lewis and Butler (2002), who demonstrated that oceans could effectively remove substantial quantities of CCl4 from the atmosphere.
Additionally, a substantial body of prior data has indicated there is a CCl4 deficit in deep ocean waters, especially in regions characterized by low oxygen levels (Krysell et al., 1994; Tanhua and Olsson, 2005). Recent studies have observed widespread undersaturation of CCl4 in the surface waters of the Pacific, Atlantic, and Southern Oceans, suggesting the oceans consume a substantial amount of atmospheric CCl4 and that biological sinks for CCl4 may exist in the surface or near-surface waters of the oceans (Butler et al., 2016; Suntharalingam et al., 2019). These findings further supported the role of oceans as a CCl4 sink and provided important insights for future oceanic environmental management and pollution control.
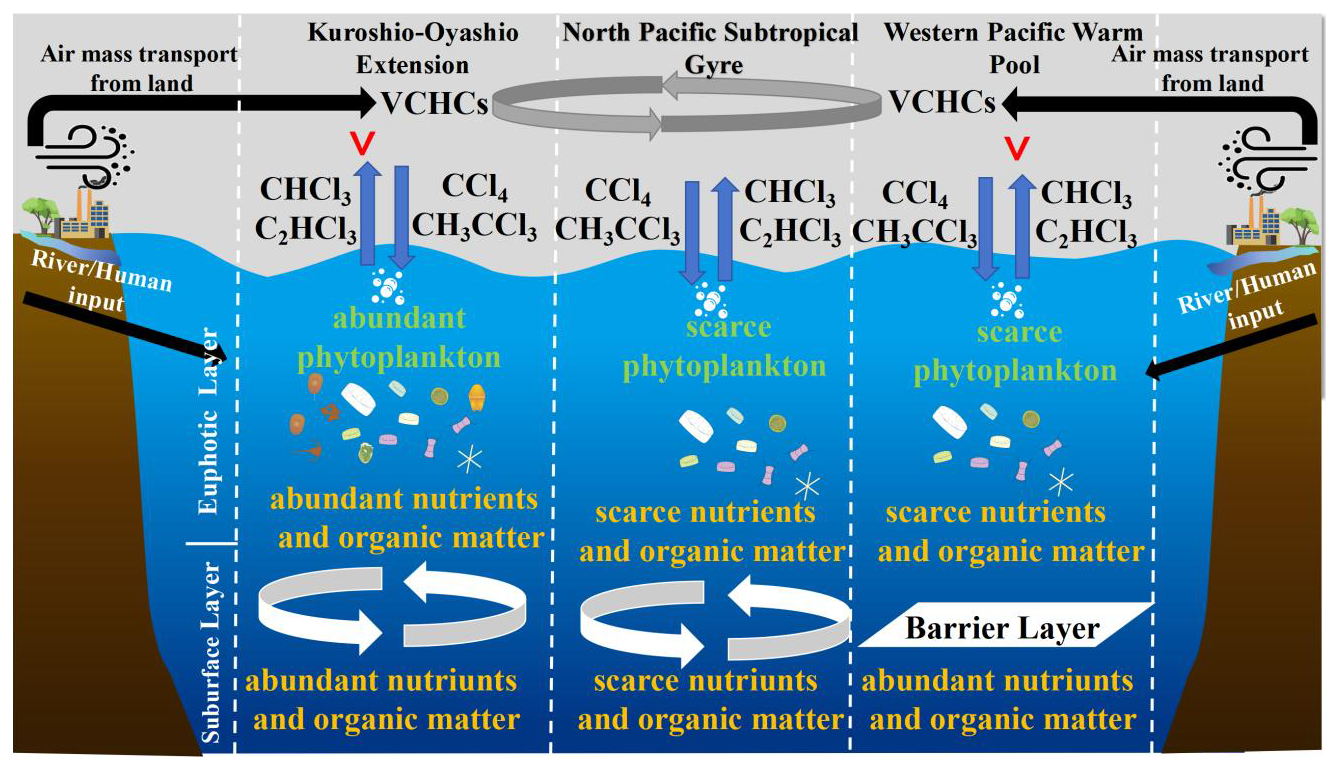
Figure 8Schematic diagram of key processes and factors controlling the production, distribution, and sea–air interactions of VCHCs in the Western Pacific.
This study investigated the seawater and atmospheric concentrations, sea–air fluxes, sources, and control factors of VCHCs in the Western Pacific during October 2019 and January 2020. As summarized from Fig. 8, the presence or absence of upwelling, whether the upwelling carries nutrients, and the transport of terrestrial inputs govern the biogeochemical characteristics of surface seawater in the Western Pacific, thereby influencing the concentrations and distributions of climatically relevant VCHCs. Specifically, the mesoscale eddies in the KOE region induced upwelling, bringing nutrient-rich subsurface water to the surface. This upwelling supplied ample nutrients to the surface seawater, enhancing phytoplankton growth and organic matter photoreactions. These processes potentially enhanced the production of CHCl3 and C2HCl3, resulting in high seawater concentrations of these compounds in the KOE. In contrast, the lower seawater concentrations of CHCl3 and C2HCl3 in the NPSG and WPWP were attributed to the oligotrophic subsurface seawater in the NPSG and the suppression of upward nutrient and organic matter fluxes due to a robust barrier layer in the WPWP. The elevated seawater concentrations of CCl4 and CH3CCl3 observed in the coastal area were caused by atmospheric inputs, seawater temperatures, and upwelling. Atmospheric mixing ratios of CCl4 and CH3CCl3 over the Western Pacific were predominantly determined by atmospheric inputs from land, as revealed through backward trajectory analysis. However, the atmospheric concentration of CHCl3 and C2HCl3 in the study area was likely influenced by a combination of atmospheric transport from the continent and ocean emissions, with continental air mass transport potentially contributing more significantly. The preliminary estimation indicated that approximately 2.1 ± 1.1 % of global CCl4 emissions were absorbed by the Western Pacific. Our study also showed that 14.3 ± 6.8 % of CCl4 emitted from Eastern China and 5.6 ± 2.5 % of Eastern Asia CCl4 emissions could be absorbed by the Western Pacific, highlighting its crucial role in regulating atmospheric CCl4 concentrations and mitigating accumulation in the Eastern Asia atmosphere. In light of these findings, we tentatively propose that the capacity of the ocean to act as a sink for CCl4 may warrant reevaluation. The global oceanic uptake of CCl4 and CH3CCl3 and emissions of CHCl3 and C2HCl3 could have an influence on their global abundances and impact atmospheric chemistry. Future studies should prioritize expanded temporal and spatial observations to better constrain these processes and improve climate predictions.
The datasets are accessible via Figshare at https://doi.org/10.6084/m9.figshare.25639146.v1 (Liu, 2025).
The supplement related to this article is available online at https://doi.org/10.5194/acp-25-14967-2025-supplement.
SL and JN designed the study, conducted VCHC measurements in the Western Pacific, analyzed the results, and contributed to manuscript writing. XG assisted with the observations. JS reviewed and revised the manuscript. ZH interpreted the data and contributed to the manuscript. GY interpreted the analyzed results and reviewed and revised the manuscript.
The contact author has declared that none of the authors has any competing interests.
Publisher's note: Copernicus Publications remains neutral with regard to jurisdictional claims made in the text, published maps, institutional affiliations, or any other geographical representation in this paper. While Copernicus Publications makes every effort to include appropriate place names, the final responsibility lies with the authors. Views expressed in the text are those of the authors and do not necessarily reflect the views of the publisher.
We thank the chief scientists, captains, and crews of the R/V Kexue and Dongfanghong 3 for their assistance and cooperation during the investigation. We thank the Institute of Oceanology, CAS, for samples and data from the NORC2019-09 cruise (NSFC grant 41849909) and the First Institute of Oceanography, MNR, for Chl a data, with special thanks to Honghai Zhang of Ocean University of China for Chl a data.
This research has been supported by the Innovative Research Group Project of the National Natural Science Foundation of China (grant nos. 42276039 and 42406040), Taishan Scholars Project Special Fund Support (tspd 20240805), Postdoctoral Fellowship Program of CPSF (GZC20232705), Shandong Provincial Postdoctoral Foundation Project (Innovation Project) (SDCX-ZG-202400181), and the Qingdao Postdoctoral Applied Research Project (QDBSH20240101018).
This paper was edited by Tao Wang and reviewed by two anonymous referees.
Abrahamsson, K. and Ekdahl, A.: Volatile halogenated compounds and chlorophenols in the Skagerrak, J. Sea Res., 35, 73–79, https://doi.org/10.1016/S1385-1101(96)90736-4, 1996.
Abrahamsson, K., Ekdahl, A., Collén, J., and Pedersén, M.: Marine algae – a source of trichloroethylene and perchloroethylene, Limnol. Oceanogr., 40, 1321–1326, https://doi.org/10.4319/lo.1995.40.7.1321, 1995.
Abrahamsson, K., Bertilsson, S., Chierici, M., Fransson, A., Froneman, P. W., Lorén, A., and Pakhomov, E. A.: Variations of biochemical parameters along a transect in the Southern Ocean, with special emphasis on volatile halogenated organic compounds, Deep-Sea Res. Part II: Top. Stud. Oceanogr., 51, 2745–2756, https://doi.org/10.1016/j.dsr2.2004.09.004, 2004a.
Abrahamsson, K., Lorén, A., Wulff, A., and Wängberg, S. Å.: Air–sea exchange of halocarbons: the influence of diurnal and regional variations and distribution of pigments, Deep-Sea Res. Part II: Top. Stud. Oceanogr., 51, 2789–2805, https://doi.org/10.1016/j.dsr2.2004.09.005, 2004b.
An, M., Western, L. M., Say, D., Chen, L., Claxton, T., Ganesan, A. L., Hossaini, R., Krummel, P. B., Manning, A. J., and Mühle, J.: Rapid increase in dichloromethane emissions from China inferred through atmospheric observations, Nat. Commun., 12, 7279, https://doi.org/10.1038/s41467-021-27592-y, 2021.
An, M., Western, L. M., Hu, J., Yao, B., Mühle, J., Ganesan, A. L., Prinn, R. G., Krummel, P. B., Hossaini, R., Fang, X., O'Doherty, A., Weiss, R. F., Young, D., and Rigby, M.: Anthropogenic chloroform emissions from China drive changes in global emissions, Environ. Sci. Technol., 57, 13925–13936, https://doi.org/10.1021/acs.est.3c01898, 2023.
Blake, N. J., Blake, D. R., Simpson, I. J., Meinardi, S., Swanson, A. L., Lopez, J. P., Katzenstein, A., Barletta, B., Shirai, T., Atlas, E., Sachse, G., Avery, M., Vay, S., Fuelberg, H., Kiley, C. M., Kita, K., and Rowland, F. S.: NMHCs and halocarbons in Asian continental outflow during the Transport and Chemical Evolution over the Pacific (TRACE-P) field campaign: Comparison with PEM-West B, J. Geophys. Res.-Atmos., 108, https://doi.org/10.1029/2002JD003367, 2003.
Bravo-Linares, C. M., Mudge, S. M., and Loyola-Sepulveda, R. H.: Occurrence of volatile organic compounds (VOCs) in Liverpool Bay, Irish Sea, Mar. Pollut. Bull., 54, 1742–1753, https://doi.org/10.1016/j.marpolbul.2007.07.013, 2007.
Butler, J. H., Yvon-Lewis, S. A., Lobert, J. M., King, D. B., Montzka, S. A., Bullister, J. L., Koropalov, V., Elkins, J. W., Hall, B. D., Hu, L., and Liu, Y.: A comprehensive estimate for loss of atmospheric carbon tetrachloride (CCl4) to the ocean, Atmos. Chem. Phys., 16, 10899–10910, https://doi.org/10.5194/acp-16-10899-2016, 2016.
Byčenkienė, S., Dudoitis, V., and Ulevicius, V.: The use of trajectory cluster analysis to evaluate the long-range transport of black carbon aerosol in the south-eastern Baltic region, Adv. Meteorol., 2014, 137694, https://doi.org/10.1155/2014/137694, 2014.
Carpenter, L. J., Reimann, S., Burkholder, J. B., Clerbaux, C., Hall, B. D., Hossaini, R., Laube, J., and Yvon-Lewis, S.: Update on ozone-depleting substances (ODSs) and other gases of interest to the Montreal Protocol, in: Scientific Assessment of Ozone Depletion: 2014, edited by: Ayité-Lô, N. A., Newman, P. A., Pyle, J. A., and Ravishankara, A. R., World Meteorological Organization, Geneva, Switzerland, 101 pp., ISBN 9789966076014, 2014.
Chang, C. Y., Wang, J. L., Chen, Y. C., Pan, X. X., Chen, W. N., Lin, M. R., Ho, Y. J., Chuang, M. T., Liu, W. T., and Chang, C. C.: A study of the vertical homogeneity of trace gases in East Asian continental outflow, Chemosphere, 297, 134165, https://doi.org/10.1016/j.chemosphere.2022.134165, 2022.
Chipperfield, M. P., Hossaini, R., Montzka, S. A., Reimann, S., Sherry, D., and Tegtmeier, S.: Renewed and emerging concerns over the production and emission of ozone-depleting substances, Nat. Rev. Earth Environ., 1, 251–263, https://doi.org/10.1038/s43017-020-0048-8, 2020.
Christof, O., Seifert, R., and Michaelis, W.: Volatile halogenated organic compounds in European estuaries, Biogeochemistry, 59, 143–160, https://doi.org/10.1023/A:1015592115435, 2002.
Chuck, A. L., Turner, S. M., and Liss, P. S.: Oceanic distributions and air–sea fluxes of biogenic halocarbons in the open ocean, J. Geophys. Res.-Oceans, 110, https://doi.org/10.1029/2004JC002741, 2005.
Doney, S. C., Ruckelshaus, M., Duffy, J. E., Barry, J. P., Chan, F., English, C. A., Galindo, H. M., Grebmeier, J. M., Hollowed, A. B., Knowlton, N., Polovina, J., Rabalais, N. N., Sydeman, W. J., and Talley, L. D.: Climate change impacts on marine ecosystems, Annu. Rev. Mar. Sci., 4, 11–37, https://doi.org/10.1146/annurev-marine-041911-111611, 2012.
Ekdahl, A., Pedersén, M., and Abrahamsson, K.: A study of the diurnal variation of biogenic volatile halocarbons, Mar. Chem., 63, 1–8, https://doi.org/10.1016/S0304-4203(98)00047-4, 1998.
Fang, X., Park, S., Saito, T., Tunnicliffe, R., Ganesan, A. L., Rigby, M., Li, S., Yokouchi, Y., Fraser, P. J., Harth, C. M., Krummel, P. B., Mühle, J., O'Doherty, S., Salameh, P. K., Simmonds, P. G., Weiss, R. F., Young, D., Lunt, M. F., Manning, A. J., Gressent, A., and Prinn, R. G.: Rapid increase in ozone-depleting chloroform emissions from China, Nat. Geosci., 12, 89–93, https://doi.org/10.1038/s41561-018-0278-2, 2019.
Fogelqvist, E.: Carbon tetrachloride, tetrachloroethylene, 1,1,1-trichloroethane and bromoform in Arctic seawater, J. Geophys. Res.-Oceans, 90, 9181–9193, https://doi.org/10.1029/JC090iC05p09181, 1985.
Gossett, J. M.: Measurement of Henry's law constants for C1 and C2 chlorinated hydrocarbons, Environ. Sci. Technol., 21, 202–208, https://doi.org/10.1021/es00156a012, 1987.
Gschwend, P. M., MacFarlane, J. K., and Newman, K. A.: Volatile halogenated organic compounds released to seawater from temperate marine macroalgae, Science, 227, 1033–1035, https://doi.org/10.1126/science.227.4690.1033, 1985.
Gupta, M., Williams, R. G., Lauderdale, J. M., Jahn, O., Hill, C., Dutkiewicz, S., and Follows, M. J.: A nutrient relay sustains subtropical ocean productivity, Proc. Natl. Acad. Sci. USA, 119, e2206504119, https://doi.org/10.1073/pnas.2206504119, 2022.
He, Z., Yang, G. P., and Lu, X. L.: Distributions and sea-to-air fluxes of volatile halocarbons in the East China Sea in early winter, Chemosphere, 90, 747–757, https://doi.org/10.1016/j.chemosphere.2012.09.067, 2013a.
He, Z., Yang, G. P., Lu, X. L., Ding, Q. Y., and Zhang, H. H.: Halocarbons in the marine atmosphere and surface seawater of the South Yellow Sea during spring, Atmos. Environ., 80, 514–523, https://doi.org/10.1016/j.atmosenv.2013.08.025, 2013b.
He, Z., Yang, G. P., Lu, X. L., and Zhang, H.: Distributions and sea-to-air fluxes of chloroform, trichloroethylene, tetrachloroethylene, chlorodibromomethane and bromoform in the Yellow Sea and the East China Sea during spring, Environ. Pollut., 177, 28–37, https://doi.org/10.1016/j.envpol.2013.02.008, 2013c.
He, Z., Liu, Q. L., Zhang, Y. J., and Yang, G. P.: Distribution and sea-to-air fluxes of volatile halocarbons in the Bohai Sea and North Yellow Sea during spring, Sci. Total Environ., 585, 546–553, https://doi.org/10.1016/j.scitotenv.2017.01.065, 2017.
He, Z., Liu, S. S., Ni, J., Chen, Y., and Yang, G. P.: Spatio-temporal variability and sources of volatile halocarbons in the South Yellow Sea and the East China Sea, Mar. Pollut. Bull., 149, 110583, https://doi.org/10.1016/j.marpolbul.2019.110583, 2019.
Hersbach, H., Bell, B., Berrisford, P., Hirahara, S., Horányi, A., Muñoz-Sabater, J., Nicolas, J., Peubey, C., Radu, R., Schepers, D., Simmons, A., Soci, C., Abdalla, S., Abellan, X., Balsamo, G., Bechtold, P., Biavati, G., Bidlot, J., Bonavita, M., De Chiara, G., Dahlgren, P., Dee, D., Diamantakis, M., Dragani, R., Flemming, J., Forbes, R., Fuentes, M., Geer, A., Haimberger, L., Healy, S., Hogan, R. J., Hólm, E., Janisková, M., Keeley, S., Laloyaux, P., Lopez, P., Lupu, C., Radnoti, G., de Rosnay, P., Rozum, I., Vamborg, F., Villaume, S., and Thépaut, J. N.: The ERA5 global reanalysis, Q. J. R. Meteorol. Soc., 146, 1999–2049, https://doi.org/10.1002/qj.3803, 2020.
Hossaini, R., Chipperfield, M. P., Saiz-Lopez, A., Harrison, J. J., von Glasow, R., Atlas, R., Navarro, E., Montzka, M., Feng, S. A., Dhomse, W., Harth, S., Mühle, C., Lunder, J., O'Doherty, C., Young, S., Reimann, D., Vollmer, S., Krummel, M. K., and Bernath, P. B.: Growth in stratospheric chlorine from short-lived chemicals not controlled by the Montreal Protocol, Geophys. Res. Lett., 42, 4573–4580, https://doi.org/10.1002/2015GL063783, 2015.
Hossaini, R., Chipperfield, M. P., Montzka, S. A., Leeson, A. A., Dhomse, S. S., and Pyle, J. A.: The increasing threat to stratospheric ozone from dichloromethane, Nat. Commun., 8, 15962, https://doi.org/10.17863/CAM.21715, 2017.
Hu, D., Wu, L., Cai, W., Gupta, A. S., Ganachaud, A., Qiu, B., Gordon, A. L., Lin, X., Chen, Z., and Hu, S.: Pacific western boundary currents and their roles in climate, Nature, 522, 299–308, https://doi.org/10.1038/nature14504, 2015.
Hu, D., Wang, F., Sprintall, J., Wu, L., Riser, S., Cravatte, S., Gordon, A., Zhang, L., Chen, D., Zhou, L., Ando, K., Wang, J., Park, J.-H., Wang, S., Wang, J., Zhang, D., Feng, J., Villanoy, C., Kaluwin, C., Qu, T., and Yin, Y.: Review on observational studies of western tropical Pacific Ocean circulation and climate, J. Oceanol. Limnol., 38, 906–929, https://doi.org/10.1007/s00343-020-0240-1, 2020.
Hunter-Smith, R. J., Balls, P. W., and Liss, P. S.: Henry's law constants and the air–sea exchange of various low molecular weight halocarbon gases, Tellus B: Chem. Phys. Meteorol., 35, 170–176, https://doi.org/10.1111/j.1600-0889.1983.tb00021.x, 1983.
Jiao, Y., Ruecker, A., Deventer, M. J., Chow, A. T., and Rhew, R. C.: Halocarbon emissions from a degraded forested wetland in coastal South Carolina impacted by sea level rise, ACS Earth Space Chem., 2, 955–967, https://doi.org/10.1021/acsearthspacechem.8b00044, 2018.
Karlsson, A., Auer, N., Schulz-Bull, D., and Abrahamsson, K.: Cyanobacterial blooms in the Baltic – a source of halocarbons, Mar. Chem., 110, 129–139, https://doi.org/10.1016/j.marchem.2008.04.010, 2008.
Khalil, M. A. K., Moore, R. M., Harper, D. B., Lobert, J. M., Erickson, D. J., Koropalov, V., Sturges, W. T., and Keene, W. C.: Natural emissions of chlorine-containing gases: Reactive Chlorine Emissions Inventory, J. Geophys. Res.-Atmos., 104, 8333–8346, https://doi.org/10.1029/1998JD100079, 1999.
Khan, M. A. H., Rhew, R. C., Whelan, M. E., Zhou, K., and Deverel, S. J.: Methyl halide and chloroform emissions from a subsiding Sacramento–San Joaquin Delta island converted to rice fields, Atmos. Environ., 45, 977–985, https://doi.org/10.1016/j.atmosenv.2010.10.053, 2011.
Krysell, M., Fogelqvist, E., and Tanhua, T.: Apparent removal of the transient tracer carbon tetrachloride from anoxic seawater, Geophys. Res. Lett., 21, 2511–2514, https://doi.org/10.1029/94GL02336, 1994.
Kurihara, M. K., Kimura, M., Iwamoto, Y., Narita, Y., Ooki, A., Eum, Y. J., Tsuda, A., Suzuki, K., Tani, Y., and Yokouchi, Y.: Distributions of short-lived iodocarbons and biogenic trace gases in the open ocean and atmosphere in the western North Pacific, Mar. Chem., 118, 156–170, https://doi.org/10.1016/j.marchem.2009.12.001, 2010.
Li, B., Huang, J., Hu, X., Zhang, L., Ma, M., Hu, L., Chen, D., Du, Q., Sun, Y., and Cai, Z.: CCl4 emissions in eastern China during 2021–2022 and exploration of potential new sources, Nat. Commun., 15, 1725, https://doi.org/10.1038/s41467-024-45981-x, 2024.
Li, J. L., Zhai, X., Ma, Z., Zhang, H. H., and Yang, G. P.: Spatial distributions and sea-to-air fluxes of non-methane hydrocarbons in the atmosphere and seawater of the western Pacific, Sci. Total Environ., 672, 491–501, https://doi.org/10.1016/j.scitotenv.2019.04.019, 2019.
Liang, Q., Jaeglé, L., Jaffe, D. A., Weiss-Penzias, P., Heckman, A., and Snow, J. A.: Long-range transport of Asian pollution to the northeast Pacific: Seasonal variations and transport pathways of carbon monoxide, J. Geophys. Res.-Atmos., 109, https://doi.org/10.1029/2003JD004402, 2004.
Liang, Q., Newman, P. A., Daniel, J. S., Reimann, S., Hall, B. D., Dutton, G., and Kuijpers, L. J.: Constraining the carbon tetrachloride (CCl4) budget using its global trend and inter-hemispheric gradient, Geophys. Res. Lett., 41, 5307–5315, https://doi.org/10.1002/2014GL060754, 2014.
Liang, Q., Newman, P. A., and Reimann, S.: SPARC Report on the Mystery of Carbon Tetrachloride, World Climate Research Programme, Geneva, Switzerland, 74 pp., https://doi.org/10.3929/ethz-a-010690647, 2016.
Lim, Y. K., Phang, S. M., Sturges, W. T., Malin, G., and Rahman, N. B. A.: Emission of short-lived halocarbons by three common tropical marine microalgae during batch culture, J. Appl. Phycol., 30, 1–13, https://doi.org/10.1007/s10811-017-1250-z, 2018.
Liu, S. S.: Volatile chlorocarbon dataset in the western Pacific, Figshare [data set], https://doi.org/10.6084/m9.figshare.25639146.v1, 2025.
Liu, S. S., Yang, G. P., He, Z., Gao, X. X., and Xu, F.: Oceanic emissions of methyl halides and effect of nutrient concentration on their production: A case of the Northwest Pacific (2° N to 24° N), Sci. Total Environ., 769, 144488, https://doi.org/10.1016/j.scitotenv.2020.144488, 2021.
Liu, T., Gong, S., He, J., Yu, M., Wang, Q., Li, H., Liu, W., Zhang, J., Li, L., Wang, X., Li, S., Lu, Y., Du, H., Wang, Y., Zhou, C., Liu, H., and Zhao, Q.: Attributions of meteorological and emission factors to the 2015 winter severe haze pollution episodes in China's Jing-Jin-Ji area, Atmos. Chem. Phys., 17, 2971–2980, https://doi.org/10.5194/acp-17-2971-2017, 2017.
Lunt, M. F., Park, S., Li, S., Henne, S., Manning, A. J., Ganesan, A. L., Simpson, I. J., Blake, D. R., Liang, Q., O'Doherty, S., Harth, C. M., Mühle, J., Salameh, P. K., Weiss, R. F., Krummel, P. B., Fraser, P. J., Prinn, R. G., Reimann, S., and Rigby, M.: Reconciling reported and unreported CFC-11 emissions with atmospheric observations, Geophys. Res. Lett., 45, 11423–11430, https://doi.org/10.1029/2018GL079500, 2018.
McCulloch, A.: Chloroform in the environment: occurrence, sources, sinks and effects, Chemosphere, 50, 1291–1308, https://doi.org/10.1016/S0045-6535(02)00697-5, 2003.
McGillicuddy Jr., D. J.: Mechanisms of physical–biological–biogeochemical interaction at the oceanic mesoscale, Annu. Rev. Mar. Sci., 8, 125–159, https://doi.org/10.1146/annurev-marine-010814-015606, 2016.
Menemenlis, D., Campin, J. M., Heimbach, P., Hill, C., Lee, T., Nguyen, A., Schodlok, M., and Zhang, H.: ECCO2: High-resolution global ocean and sea ice data synthesis, Mercator Ocean Q. Newsl., 31, 13–21, 2008.
Montzka, S. A., Reimann, S., Engel, A., Krüger, K., O'Doherty, S., and Sturges, W. T.: Ozone-depleting substances (ODSs) and related chemicals, in: Scientific Assessment of Ozone Depletion: 2010, Global Ozone Research and Monitoring Project – Report No. 52, World Meteorological Organization, Geneva, Switzerland, ISBN: 9966731962, 2011.
Moore, R. M.: The solubility of a suite of low molecular weight organochlorine compounds in seawater and implications for estimating the marine source of methyl chloride to the atmosphere, Chemosphere-Glob. Change Sci., 2, 95–99, https://doi.org/10.1016/S1465-9972(99)00045-8, 2000.
Moore, R. M.: Marine sources of volatile organohalogens, in: Natural Production of Organohalogen Compounds, The Handbook of Environmental Chemistry, edited by: Gribble, G. W., Springer, Berlin, Heidelberg, Germany, https://doi.org/10.1007/b10449, 2003.
NASA Ocean Biology Processing Group: Aqua MODIS Level 3 Mapped Chlorophyll Data, Version R2022.0, NASA Ocean Biology Distributed Active Archive Center [data set], https://doi.org/10.5067/AQUA/MODIS/L3M/CHL/2022, 2022.
Ni, J., Liu, S. S., Lang, X. P., He, Z., and Yang, G. P.: Sulfur hexafluoride in the marine atmosphere and surface seawater of the western Pacific and eastern Indian Ocean, Environ. Pollut., 335, 122266, https://doi.org/10.1016/j.envpol.2023.122266, 2023.
Oram, D. E., Ashfold, M. J., Laube, J. C., Gooch, L. J., Humphrey, S., Sturges, W. T., Leedham Elvidge, E. C., Forster, G. L., Harris, N. R. P., Mead, M. I., Samah, A. A., Phang, S. M., Ou-Yang, C.-F., Lin, N.-H., Wang, J.-L., Baker, A. K., Brenninkmeijer, C. A. M., and Sherry, D.: A growing threat to the ozone layer from short-lived anthropogenic chlorocarbons, Atmos. Chem. Phys., 17, 11929–11941, https://doi.org/10.5194/acp-17-11929-2017, 2017.
Ou-Yang, C. F., Chang, C. C., Wang, J. L., Shimada, K., Hatakeyama, S., Kato, S., Chiu, J. Y., Sheu, G. R., and Lin, N. H.: Characteristics of summertime volatile organic compounds in the lower free troposphere: background measurements at Mt. Fuji, Aerosol Air Qual. Res., 17, 3037–3051, https://doi.org/10.4209/aaqr.2017.04.0144, 2017.
Park, S., Li, S., Mühle, J., O'Doherty, S., Weiss, R. F., Fang, X., Reimann, S., and Prinn, R. G.: Toward resolving the budget discrepancy of ozone-depleting carbon tetrachloride (CCl4): an analysis of top-down emissions from China, Atmos. Chem. Phys., 18, 11729–11738, https://doi.org/10.5194/acp-18-11729-2018, 2018.
Plummer, J. D. and Edzwald, J. K.: Effects of chlorine and ozone on algal cell properties and removal of algae by coagulation, J. Water Supply Res. Technol. Aqua, 51, 307–318, https://doi.org/10.2166/aqua.2002.0033, 2002.
Qu, T. and Meyers, G.: Seasonal variation of barrier layer in the south-eastern tropical Indian Ocean, J. Geophys. Res.-Oceans, 110, https://doi.org/10.1029/2004JC002816, 2005.
Quack, B. and Suess, E.: Volatile halogenated hydrocarbons over the western Pacific between 43° N and 4° N, J. Geophys. Res.-Atmos., 104, 1663–1678, https://doi.org/10.1029/98JD02730, 1999.
Rigby, M., Prinn, R. G., O'Doherty, S., Miller, B. R., Ivy, D., Mühle, J., Harth, C. M., Salameh, P. K., Arnold, T., Weiss, R. F., Krummel, P. B., Steele, L. P., Fraser, P. J., Young, D., and Simmonds, P. G.: Recent and future trends in synthetic greenhouse gas radiative forcing, Geophys. Res. Lett., 41, 2623–2630, https://doi.org/10.1002/2013GL059099, 2014.
Roy, R., Pratihary, A., Narvenkar, G., Mochemadkar, S., Gauns, M., and Naqvi, S. W. A.: The relationship between volatile halocarbons and phytoplankton pigments during a Trichodesmium bloom in the coastal eastern Arabian Sea, Estuar. Coast. Shelf Sci., 95, 110–118, https://doi.org/10.1016/j.ecss.2011.08.025, 2011.
Saiz-Lopez, A., Fernandez, R. P., Li, Q., Cuevas, C. A., Fu, X., Kinnison, D. E., Tilmes, S., Mahajan, A. S., Gómez Martín, J. C., Iglesias-Suarez, F., Hossaini, R., Plane, J. M. C., Myhre, G., and Lamarque, J.-F.: Natural short-lived halogens exert an indirect cooling effect on the climate, Nature, 618, 967–973, https://doi.org/10.1038/s41586-023-06119-z, 2023.
Say, D., Kuyper, B., Western, L., Khan, M. A. H., Lesch, T., Labuschagne, C., Martin, D., Young, D., Manning, A. J., O'Doherty, S., Rigby, M., Krummel, P. B., Davies-Coleman, M. T., Ganesan, A. L., and Shallcross, D. E.: Emissions and marine boundary layer concentrations of unregulated chlorocarbons measured at Cape Point, South Africa, Environ. Sci. Technol., 54, 10514–10523, https://doi.org/10.1021/acs.est.0c02057, 2020.
Scarratt, M. G. and Moore, R. M.: Production of chlorinated hydrocarbons and methyl iodide by the red microalga Porphyridium purpureum, Limnol. Oceanogr., 44, 703–707, https://doi.org/10.4319/lo.1999.44.3.0703, 1999.
Schwardt, A., Dahmke, A., and Köber, R.: Henry's law constants of volatile organic compounds between 0 and 95 °C – data compilation and complementation in context of urban temperature increases of the subsurface, Chemosphere, 272, 129858, https://doi.org/10.1016/j.chemosphere.2021.129858, 2021.
Shechner, M., Guenther, A., Rhew, R., Wishkerman, A., Li, Q., Blake, D., Lerner, G., and Tas, E.: Emission of volatile halogenated organic compounds over various Dead Sea landscapes, Atmos. Chem. Phys., 19, 7667–7690, https://doi.org/10.5194/acp-19-7667-2019, 2019.
Sherry, D., McCulloch, A., Liang, Q., Reimann, S., and Newman, P. A.: Current sources of carbon tetrachloride (CCl4) in our atmosphere, Environ. Res. Lett., 13, 024004, https://doi.org/10.1088/1748-9326/aa9c87, 2018.
Shi, J., Jia, Q., Nürnberg, D., Li, T., Xiong, Z., and Qin, B.: Coupled nutricline and productivity variations during the Pliocene in the western Pacific warm pool and their paleoceanographic implications, Glob. Planet. Change, 212, 103810, https://doi.org/10.1016/j.gloplacha.2022.103810, 2022.
Shoemaker, D. P., Garland, G. W., and Steinfeld, J. I.: Propagation of errors, in: Experiments in Physical Chemistry, 3rd edn., McGraw-Hill, New York, USA, 51–58, ISBN: 9780070570030, 1974.
Smythe-Wright, D., Peckett, C., Boswell, S., and Harrison, R.: Controls on the production of organohalogens by phytoplankton: effect of nitrate concentration and grazing, J. Geophys. Res.-Biogeosci., 115, G03020, https://doi.org/10.1029/2009JG001036, 2010.
Squizzato, S. and Masiol, M.: Application of meteorology-based methods to determine local and external contributions to particulate matter pollution: a case study in Venice (Italy), Atmos. Environ., 119, 69–81, https://doi.org/10.1016/j.atmosenv.2015.08.026, 2015.
Stohl, A., Eckhardt, S., Forster, C., James, P., and Spichtinger, N.: On the pathways and timescales of intercontinental air pollution transport, J. Geophys. Res. Atmos., 107, ACH–6, https://doi.org/10.1029/2001JD001396, 2002.
Suntharalingam, P., Buitenhuis, E., Carpenter, L. J., Butler, J. H., Messias, M. J., Andrews, S. J., and Hackenberg, S. C.: Evaluating oceanic uptake of atmospheric CCl4: a combined analysis of model simulations and observations, Geophys. Res. Lett., 46, 472–482, https://doi.org/10.1029/2018GL080612, 2019.
Tang, C., Tao, X., Wei, Y., Tong, Z., Zhu, F., and Lin, H.: Analysis and prediction of wind speed effects in East Asia and the western Pacific based on multi-source data, Sustainability, 14, 12089, https://doi.org/10.3390/su141912089, 2022.
Tanhua, T. and Olsson, K. A.: Removal and bioaccumulation of anthropogenic, halogenated transient tracers in an anoxic fjord, Mar. Chem., 94, 27–41, https://doi.org/10.1016/j.marchem.2004.07.009, 2005.
Tsunogai, S.: The western North Pacific playing a key role in global biogeochemical fluxes, J. Oceanogr., 58, 245–257, https://doi.org/10.1023/A:1015805607724, 2002.
US EPA: Method TO-15A: determination of volatile organic compounds (VOCs) in air collected in specially prepared canisters and analyzed by gas chromatography–mass spectrometry (GC–MS), United States Environmental Protection Agency, Washington, D.C., USA, https://nepis.epa.gov/Exe/ZyNET.exe/P100YDPO.TXT?ZyActionD=ZyDocument&Client=EPA&Index=2016+Thru+2020 (last access: 8 October 2025), 2019.
Wan, S., Xiang, R., Steinke, S., Du, Y., Yang, Y., Wang, S., and Wang, H.: Impact of the western Pacific warm pool and Kuroshio dynamics in the Okinawa Trough during the Holocene, Glob. Planet. Change, 224, 104116, https://doi.org/10.1016/j.gloplacha.2023.104116, 2023.
Wang, B., Kang, I. S., and Lee, J. Y.: Ensemble simulations of Asian–Australian monsoon variability by 11 AGCMs, J. Clim., 17, 803–818, https://doi.org/10.1175/1520-0442(2004)017<0803:ESOAMV>2.0.CO;2, 2004.
Wang, J. L., Blake, D. R., and Rowland, F. S.: Seasonal variations in the atmospheric distribution of a reactive chlorine compound, tetrachloroethene (CCl2=CCl2), Geophys. Res. Lett., 22, 1097–1100, https://doi.org/10.1029/95GL01069, 1995.
Wang, Y., Bi, R., Zhang, J., Gao, J., Takeda, S., Kondo, Y., Chen, F., Jin, G., Sachs, J. P., and Zhao, M.: Phytoplankton distributions in the Kuroshio–Oyashio region of the Northwest Pacific Ocean: implications for marine ecology and carbon cycle, Front. Mar. Sci., 9, 865142, https://doi.org/10.3389/fmars.2022.865142, 2022.
Wanninkhof, R.: Relationship between wind speed and gas exchange over the ocean revisited, Limnol. Oceanogr. Methods, 12, 351–362, https://doi.org/10.4319/lom.2014.12.351, 2014.
Wei, Y., He, Z., and Yang, G. P.: Seasonal and spatial variations of chloroform, trichloroethylene, tetrachloroethylene, chlorodibromomethane, and bromoform in the northern Yellow Sea and Bohai Sea, Environ. Chem., 16, 114–124, https://doi.org/10.1071/EN18222, 2019.
WMO (World Meteorological Organization): Scientific Assessment of Ozone Depletion: 2006, Global Ozone Research and Monitoring Project – Report No. 50, World Meteorological Organization, Geneva, Switzerland, 572 pp., ISBN: 9789280727562, 2007.
WMO (World Meteorological Organization): Scientific Assessment of Ozone Depletion: 2022, Global Ozone Research and Monitoring Project – Report No. 278, World Meteorological Organization, Geneva, Switzerland, 509 pp., ISBN: 9789914733976, 2022.
Xu, F., Zhang, H. H., Yan, S. B., Sun, M. X., Wu, J. W., and Yang, G. P.: Biogeochemical controls on climatically active gases and atmospheric sulfate aerosols in the western Pacific, Environ. Res., 220, 115211, https://doi.org/10.1016/j.envres.2023.115211, 2023.
Yang, G. P., Li, L., Lu, X. L., and Zhang, L.: Distributions and sea-to-air fluxes of volatile halocarbons in the southern Yellow Sea and the East China Sea, Acta Oceanol. Sin., 34, 9–20, https://doi.org/10.1007/s13131-015-0622-y, 2015.
Yi, L., Wu, J., An, M., Xu, W., Fang, X., Yao, B., Li, Y., Gao, D., Zhao, X., and Hu, J.: The atmospheric concentrations and emissions of major halocarbons in China during 2009–2019, Environ. Pollut., 284, 117190, https://doi.org/10.1016/j.envpol.2021.117190, 2021.
Yi, L., An, M., Yu, H., Ma, Z., Xu, L., O'Doherty, S., Rigby, M., Western, L. M., Ganesan, A. L., Zhou, L., Shi, Q., Hu, Y., Yao, B., Xu, W., and Hu, J.: In situ observations of halogenated gases at the Shangdianzi background station and emission estimates for northern China, Environ. Sci. Technol., 57, 7217–7229, https://doi.org/10.1021/acs.est.3c00695, 2023.
Yokouchi, Y., Li, H. J., Machida, T., Aoki, S., and Akimoto, H.: Isoprene in the marine boundary layer (Southeast Asian Sea, eastern Indian Ocean, and Southern Ocean): comparison with dimethyl sulfide and bromoform, J. Geophys. Res.-Atmos., 104, 8067–8076, https://doi.org/10.1029/1998JD100013, 1999.
Yokouchi, Y., Inagaki, T., Yazawa, K., Tamaru, T., Enomoto, T., and Izumi, K.: Estimates of ratios of anthropogenic halocarbon emissions from Japan based on aircraft monitoring over Sagami Bay, Japan, J. Geophys. Res.-Atmos., 110, https://doi.org/10.1029/2004JD005320, 2005.
Yokouchi, Y., Inoue, J., and Toom-Sauntry, D.: Distribution of natural halocarbons in marine boundary air over the Arctic Ocean, Geophys. Res. Lett., 40, 4086–4091, https://doi.org/10.1002/grl.50734, 2013.
Yu, D., Yao, B., Lin, W., Vollmer, M. K., Ge, B., Zhang, G., Li, Y., Xu, H., O'Doherty, S., Chen, L., and Reimann, S.: Atmospheric CH3CCl3 observations in China: historical trends and implications, Atmos. Res., 231, 104658, https://doi.org/10.1016/j.atmosres.2019.104658, 2020.
Yvon-Lewis, S. A. and Butler, J. H.: Effect of oceanic uptake on atmospheric lifetimes of selected trace gases, J. Geophys. Res.-Atmos., 107, ACH–1, https://doi.org/10.1029/2001JD001267, 2002.
Zhang, G., Yao, B., Vollmer, M. K., Montzka, S. A., Mühle, J., Weiss, R. F., O'Doherty, S., Li, Y., Fang, S., and Reimann, S.: Ambient mixing ratios of atmospheric halogenated compounds at five background stations in China, Atmos. Environ., 160, 55–69, https://doi.org/10.1016/j.atmosenv.2017.04.017, 2017.
Zhang, W., Jiao, Y., Zhu, R., Rhew, R. C., Sun, B., and Dai, H.: Chloroform (CHCl3) emissions from coastal Antarctic tundra, Geophys. Res. Lett., 48, e2021GL093811, https://doi.org/10.1029/2021GL093811, 2021.
Zhang, Y. L., Guo, H., Wang, X. M., Simpson, I. J., Barletta, B., Blake, D. R., Meinardi, S., Rowland, F. S., Cheng, H. R., Saunders, S. M., and Lam, S. H. M.: Emission patterns and spatiotemporal variations of halocarbons in the Pearl River Delta region, southern China, J. Geophys. Res.-Atmos., 115, https://doi.org/10.1029/2009JD013726, 2010.
Zheng, J., Yu, Y., Mo, Z., Zhang, Z., Wang, X., Yin, S., Peng, K., Yang, Y., Feng, X., and Cai, H.: Industrial sector-based volatile organic compound (VOC) source profiles measured in manufacturing facilities in the Pearl River Delta, China, Sci. Total Environ., 456, 127–136, https://doi.org/10.1016/j.scitotenv.2013.03.055, 2013.
Zheng, P., Chen, T., Dong, C., Liu, Y., Li, H., Han, G., Sun, J., Wu, L., Gao, X., Wang, X., Qi, Y., Zhang, Q., and Xue, L.: Characteristics and sources of halogenated hydrocarbons in the Yellow River Delta region, northern China, Atmos. Res., 225, 70–80, https://doi.org/10.1016/j.atmosres.2019.03.039, 2019.