the Creative Commons Attribution 4.0 License.
the Creative Commons Attribution 4.0 License.
 | 14 May 2024
Variability in the properties of the distribution of the relative humidity with respect to ice: implications for contrail formation
Sidiki Sanogo
Olivier Boucher
Nicolas Bellouin
Audran Borella
Kevin Wolf
Susanne Rohs
Relative humidity with respect to ice (RHi) is a key variable in the formation of cirrus clouds and contrails. We document its probability density function (PDF) using long-term Measurements of Ozone, Water Vapour, Carbon Monoxide and Nitrogen Oxides by In-Service Airbus Aircraft (MOZAIC) and the In-service Aircraft for a Global Observing System (IAGOS) observations over the period 1995–2022 in the upper troposphere (UT) and the lower stratosphere (LS) between 325 and 175 hPa. The characteristics of the RHi PDF differ in the UT and in the LS of the high-latitude regions (HLs) and mid-latitude regions (MLs) of the Northern Hemisphere. In the LS, this PDF decreases exponentially with increasing RHi. In the UT, it first increases exponentially in subsaturated conditions and then decreases exponentially in supersaturated conditions. Because of these different behaviors, the PDF for the combined UT and LS is bimodal. In contrast to the HLs and the MLs, the RHi PDF in the tropical troposphere decreases exponentially with increasing RHi. The different forms of PDF, in the tropics and in the higher-latitude regions, lead to a global PDF of RHi in subsaturated tropospheric conditions that is almost uniform. These findings invite caution when using MOZAIC and IAGOS measurements to calibrate large-scale simulations of RHi. The variability in RHi properties associated with that of temperature also has implications for the formation of contrails. We examined the impact of switching fuel (from kerosene to bioethanol or liquid hydrogen) on the frequency of contrail formation using the Schmidt–Appleman criterion. We show that bioethanol and, to a larger extent, liquid hydrogen would produce more contrails. The impact of a potential change from kerosene to these alternative fuels decreases with decreasing pressure but increases when moving from the higher latitudes of the Northern Hemisphere to the tropics. Finally, we emphasize that investigations of the impact on contrail occurrence frequency as a result of switching from fossil kerosene to more sustainable fuels must be carried out in various meteorological conditions.
- Article
(3851 KB) - Full-text XML
-
Supplement
(408 KB) - BibTeX
- EndNote


Water vapor in the Earth's atmosphere is responsible for two-thirds of the natural greenhouse effect (Peixoto and Oort, 1992). It plays an important role in the transport of energy from the Earth's surface into the atmosphere via evapotranspiration of water on the ground and condensation and freezing in the atmosphere (Gierens et al., 2012). A convenient variable to analyze the condensation and freezing processes at play in in situ cirrus clouds and contrail formation is the relative humidity with respect to ice (RHi). Situations where RHi is 100 % are said to be “saturated with respect to ice”. It is common for water vapor to be ice supersaturated (RHi>100 %) in the upper troposphere (UT) and lower stratosphere (LS) and also in the lower troposphere in Antarctica (Gierens et al., 1999; Gierens and Brinkop, 2012; Genthon et al., 2017; Petzold et al., 2020).
Ice supersaturation occurrence is a prerequisite for the formation of in situ natural cirrus clouds and persistent contrails (Schumann, 1996; Heymsfield et al., 2017). In situ cirrus clouds may form in the UT and in the LS via homogeneous nucleation at temperatures colder than −38 °C, and RHi above 140 % is then necessary (Heymsfield et al., 2017; Kanji et al., 2017). Cirrus clouds may also form via heterogeneous freezing at temperatures lower than 0 °C with RHi above 100 % in the presence of ice-nucleating particles (Heymsfield et al., 2017; Kanji et al., 2017). The formation mechanism of contrails is quite different to those of natural cirrus clouds. Contrails are linked to the atmospheric conditions that influence the complex processes occurring in the wake of aircraft (Schumann, 1996; Kärcher, 2018). Schmidt (1941) and Appleman (1953) provided a simple thermodynamic criterion, known as the Schmidt–Appleman criterion (SAc), which approximates the complex dynamical processes and is based only on ambient temperature and relative humidity. It has been amended by Schumann (1996), taking into account fuel combustion properties and the aircraft-engine propulsion efficiency (see Sect. 2.4 for a refresher on the criterion).
Contrails can evolve into ice clouds, known as contrail-cirrus clouds (Kärcher, 2018). Like natural cirrus clouds, contrail-cirrus clouds have a radiative forcing that is of relevance to the Earth's climate (Kärcher, 2018; Lee et al., 2021; Schumann et al., 2021). They interact with both solar and terrestrial radiation, and the net effect is a warming of the climate system (Lee et al., 2021). However, there is a large spread in the net radiative forcing for individual contrail-cirrus clouds, and the average magnitude of this effect is still uncertain. For instance, for the year 2018, the effective radiative forcing (ERF) of contrail-cirrus clouds in high-humidity regions was estimated to be 57.4 mW m−2, with a 5 %–95 % likelihood range of 17 to 98 mW m−2 (Lee et al., 2021). This non-CO2 forcing of aviation might be stronger than that from CO2 (34.3 mW m−2 with a 5 %–95 % likelihood range of 31 to 38 mW m−2) (Lee et al., 2021). Overall, the uncertainty associated with the ERF of contrails and contrail-cirrus clouds represents a significant part of the uncertainty associated with the total ERF of aviation on the Earth's climate (Lee et al., 2021). A further uncertainty regarding the climate impact of contrail-cirrus clouds relates to their efficacy in warming the Earth's surface. Some studies (e.g., Ponater et al., 2021; Bickel, 2023) suggest that their efficacy might be lower than 1, meaning that contrail radiative forcing may be less efficient at causing surface temperature change than CO2 radiative forcing.
The accurate representation of ice-supersaturated regions (ISSRs) in numerical weather prediction models is important to improve the prediction of persistent contrails, which, in turn, is important for mitigation strategies aiming to reduce the climate impact of the aviation sector through contrail avoidance (Sperber and Gierens, 2023). This requires a good characterization of the spatial and temporal distribution of RHi. For this purpose, the characterization of ISSRs (corresponding to the upper tail of the RHi distribution) has been carried out in past studies (e.g., Gierens et al., 1999; Petzold et al., 2020). The frequency of occurrence of ISSRs has been shown to depend on the location and season. In terms of spatial variability, the highest frequency is observed in deep-convection regions in the tropics above 200 hPa (Spichtinger et al., 2003a, b; Lamquin et al., 2012). ISSRs are more frequent at 300–200 hPa and 400–300 hPa in the mid- and high-latitude regions, respectively (Lamquin et al., 2012). In terms of seasonality, the highest frequency of occurrence in the Northern Hemisphere mid-latitude regions is observed in winter, followed by spring, while they are less frequent in summer and autumn (Petzold et al., 2020; Wolf et al., 2023). On a global scale, the seasonality of ISSR frequency shows spatial disparities depending on pressure level (see Fig. 10 in Lamquin et al., 2012). It should be noted that the magnitude of the ISSR frequency of occurrence depends on the observational products being considered (e.g., airborne or spaceborne observations) due to differences in observation methods and their horizontal and vertical resolutions. Analysis using the European research program MOZAIC showed that, on average in the troposphere, an aircraft above 300 hPa has a 20 %–30 % and 35 %–40 % probability of encountering an ISSR in summer and in winter, respectively, when flying over North America, the North Atlantic, and Europe (Petzold et al., 2020). So, the average spatial distribution of ISSRs is fairly well documented in the literature. However, the occurrence of contrails also depends on the ambient temperature, the fuel combustion properties, and the engine propulsion efficiency (Schumann, 1996).
The probability density function (PDF) of RHi has also been analyzed in several studies (e.g., Lamquin et al., 2012; Diao et al., 2014; Smit et al., 2014; Petzold et al., 2020) based on in situ measurements. They all found a bimodal PDF with a first mode between 0 % and 10 % and a second mode between 95 % and 112 %. However, there is still a gap in our knowledge of the properties of the tropospheric and stratospheric PDFs of RHi. Gierens et al. (1999) showed that the large-scale PDFs of RHi in the UT and in the LS are different at 250 hPa and 200 hPa. The PDF of RHi in the LS follows an exponential decay both below and above saturation and therefore does not show any break in slope in the vicinity of 100 %, unlike in the UT. Contradictory findings of Spichtinger et al. (2003a) indicate that the RHi PDF in the LS exhibits a break in slope in the vicinity of 100 % over the location of Lindenberg (Germany) using radiosonde observations. The question of how these properties vary between the tropics and the mid- and high-latitude regions, and also with pressure, has so far not been fully answered.
In this context, the objectives of this study are twofold: (1) to document the properties of the PDF of RHi in the UT and in the LS in both clear and cloudy conditions as a function of latitude and pressure and (2) to document the frequency of occurrence of conditions favorable to the formation of non-persistent and persistent contrails and the impact of a fuel change on these frequencies using the Schmidt–Appleman criterion.
This article is structured as follows: Section 2 details the dataset used in the study and describes our methodology. Section 3 documents the properties of the PDF of RHi and the frequency of occurrence of the conditions favorable to contrail formation. Finally, Sect. 4 summarizes our main findings.
2.1 Dataset from IAGOS and MOZAIC passenger aircraft
We analyzed RHi from airborne measurements over the period 1995– 2022. Measurements of ambient temperature (T) and pressure (p), relative humidity with respect to liquid water (RHl), ozone volume mixing ratio (), and ice crystal number concentration (Ni) are also analyzed either to understand the properties of the PDF of RHi or to document the frequency of the conditions favorable to the formation of contrails. They are all obtained from the Measurements of Ozone, Water Vapour, Carbon Monoxide and Nitrogen Oxides by In-Service Airbus Aircraft (MOZAIC) program (Marenco et al., 1998) over the period 1995–2014 and from the In-service Aircraft for a Global Observing System (IAGOS) program (Petzold et al., 2015) over the period 2011–2022. Data for Ni are available only from a subset of the IAGOS flights. The MOZAIC and IAGOS data are measured with a temporal sampling of 4 s. In this study, for each flight, we used the latest version (file version 3.1.1 to 3.1.4) available at the time of our study.
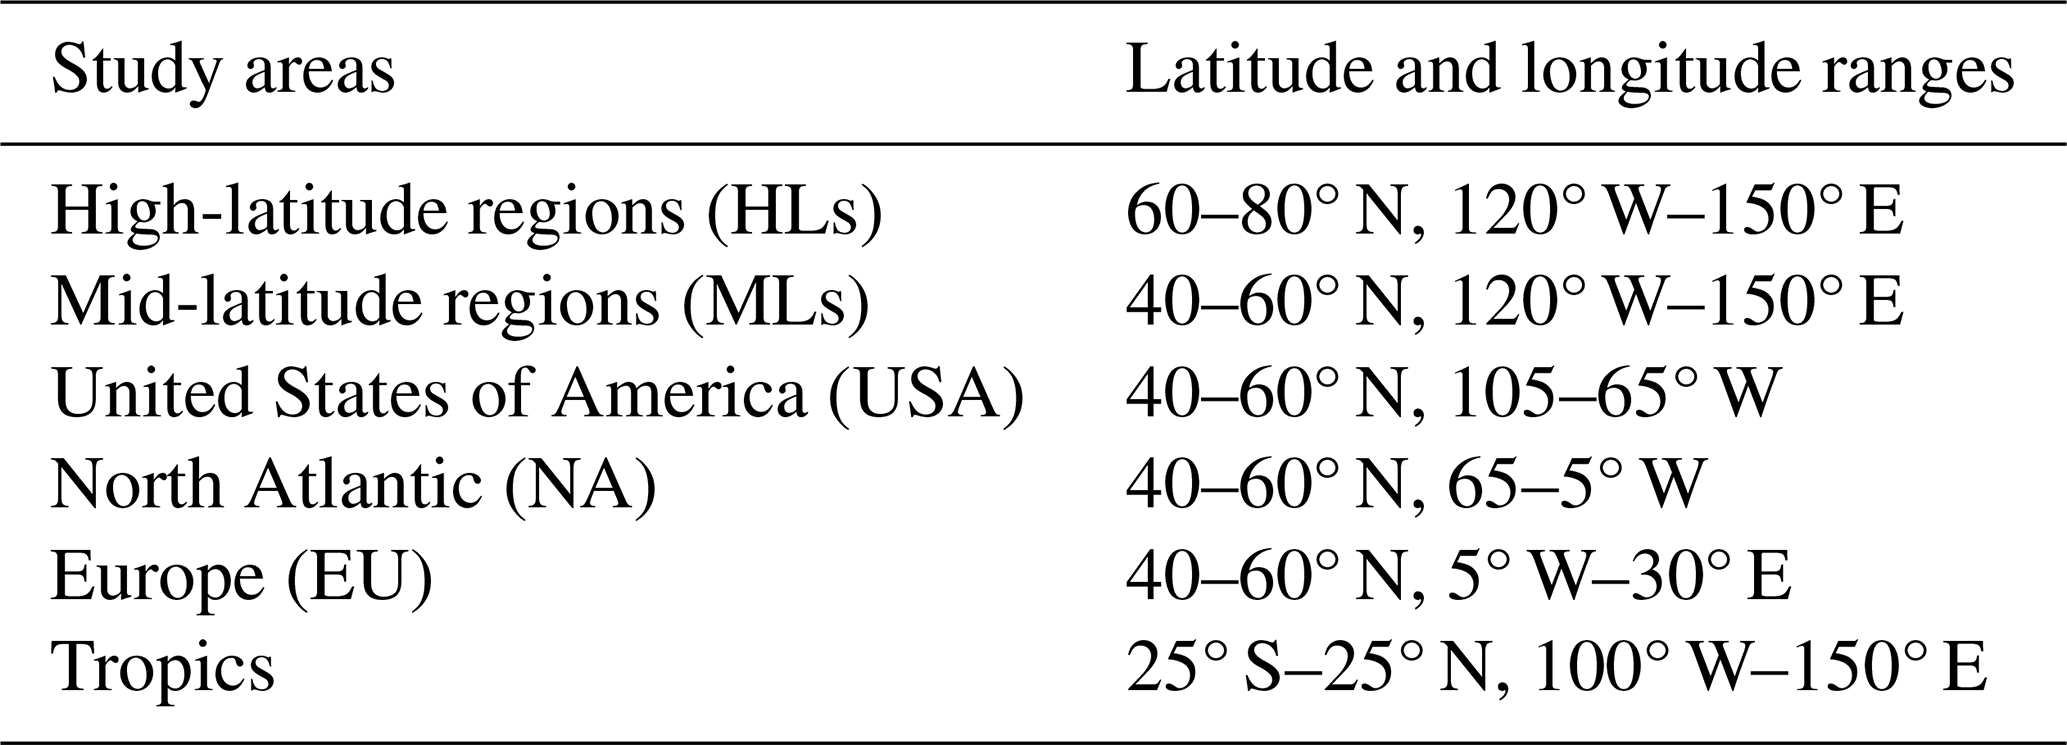
Figure 1 shows the spatio-temporal distribution of RHi measurements in the upper troposphere–lower stratosphere (UTLS), defined here as the pressure layer between 325 and 175 hPa. The best-sampled areas are in the mid-latitude regions (MLs) of the Northern Hemisphere. They are the United States of America (40–60° N, 120–65° W; USA hereafter), Europe (40–60° N, 5° W–30° E; EU hereafter), and especially the North Atlantic corridor (40–60° N, 65–5° W; NA thereafter). Sampling over Russia, Asia, the high-latitude regions (HLs) of the Northern Hemisphere, and the tropics is less dense. Our study is focused on the HLs, the MLs, and the tropics. The area of the MLs in a longitude range from the USA to Europe is analyzed in more detail. The geographical coordinates of the different study areas are provided in Table 1. For documenting the PDF of RHi, we considered data above 325 hPa by splitting the UTLS into three layers: 325–275 hPA, 275–225 hPa, and 225–175 hPa, using a resolution of 50 hPa. Most measurements are performed in the 275–225 and 225–175 hPa layers (Fig. 2). Those performed in the 325–275 hPa layer are less numerous (Fig. 2), but they represent 186 812, 4 963 539, and 2 980 377 measurements in the HLs, in the MLs, and in the tropics, respectively.
.
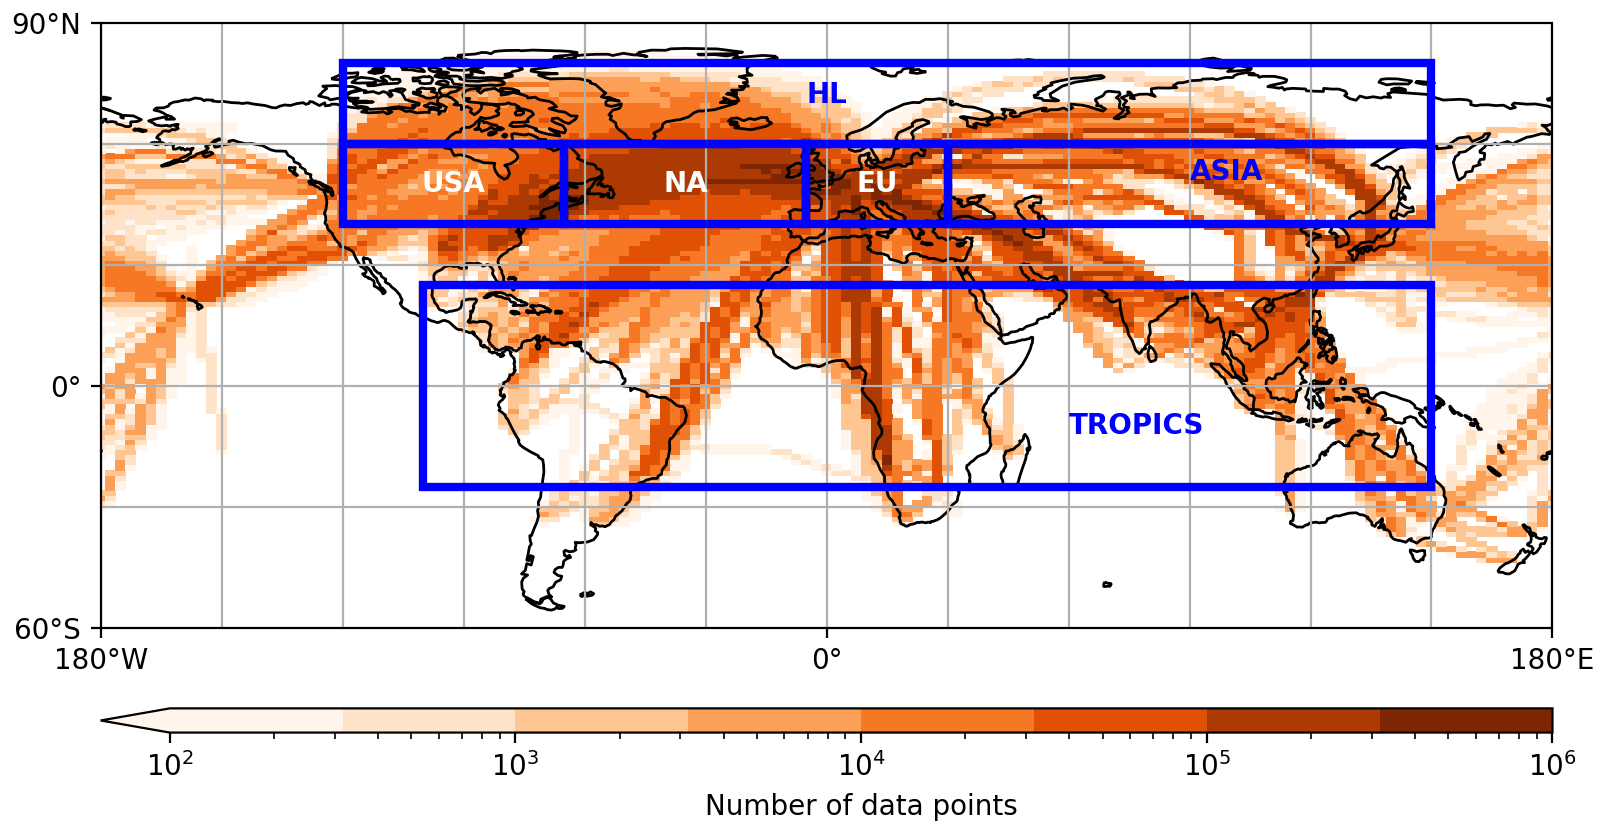
Figure 1Global coverage of RHi observations by MOZAIC and IAGOS aircraft over the 1995–2022 period, between 325 and 175 hPa, shown as the total number of measurements per 2.5°×2.5° grid box (log scale). The areas delimited by blue boxes represent the study areas. Their coordinates are provided in Table 1.
Table 1Names of study areas and their geographical coordinates.
.
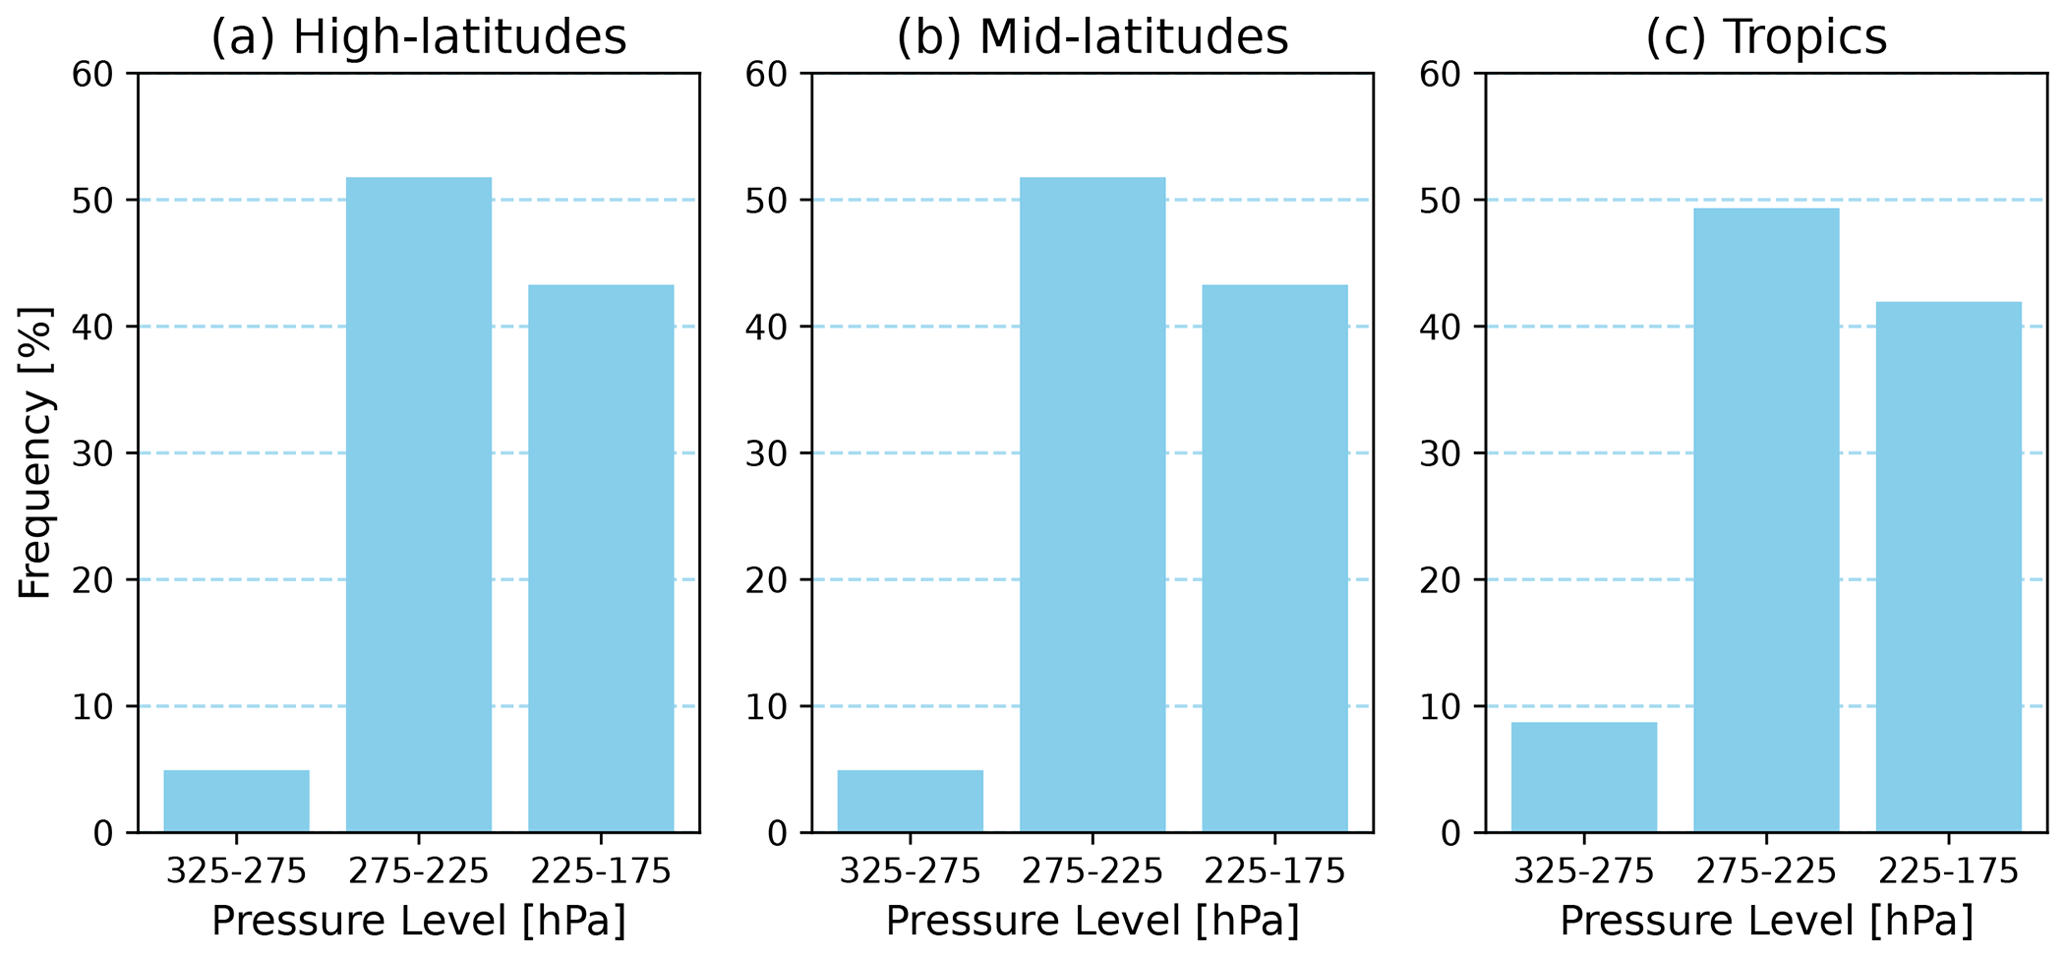
Figure 2Relative frequency of RHi measurements per pressure layer in (a) the HLs and (b) the MLs of the Northern Hemisphere and (c) in the tropics over the period 1995–2022.
2.2 Data selection
MOZAIC and IAGOS data are assigned different quality levels, ranging from “good” to “not validated”. In this study, only “good” measurements of RHi, RHl, T, p, , and Ni are considered. It should be noted that, between the years 2011 and 2017, there was a grounding problem with the IAGOS data acquisition system. For this period, the quality flag of RHi is not well-derived but is known to be similar to that of RHl. We therefore selected RHi values using the RHl quality flag for this particular period. We follow Gierens et al. (1999) by separating UT and LS air mass measurements on the basis of their . Because the mean value of the ozone mixing ratio at the thermal tropopause is 130 ppb with a standard deviation of 92 ppb (Duhnke et al., 1998), we consider measurements to be from a UT air mass if ppb and from an LS air mass if not. This approach is used for a comparison of our results to those of Gierens et al. (1999). A sensitivity analysis using the threshold of 2 potential vorticity units, as simulated by the fifth generation of the European Centre for Medium-Range Weather Forecasts atmospheric reanalysis (ERA5) to discriminate tropospheric and stratospheric measurements, showed consistent results with the -based approach (not shown).
2.3 Differentiation of clear-sky and cloudy conditions
The Ni variable is used to differentiate observations measured in cirrus clouds from those in clear-sky conditions. Different thresholds are used in the literature. For instance, Beswick et al. (2015) and Lloyd et al. (2020) used a threshold of 0.05 particles cm−3, while Petzold et al. (2017) used a lower threshold of 0.015 particles cm−3. Here, we used an even smaller threshold of 0.001 particles cm−3; i.e., we considered cloud measurements to have Ni≥0.001 particles cm−3. We used this threshold to be more restrictive in the discrimination of the clear conditions for the investigations of the origin of the wet mode in the PDF of RHi. We then perform a sensitivity test with thresholds of 0.015 and 0.05 particles cm−3 since the threshold of 0.001 cm−3 is associated with detection uncertainties that can exceed 50 % (Petzold et al., 2017). To exclude potential measurements in the presence of supercooled liquid water, as in Petzold et al. (2017), we considered only Ni data for which the temperature is colder than −40 °C, which corresponds to the threshold for the homogeneous freezing of water droplets (Petzold et al., 2017). Because of low sampling of the HLs by IAGOS aircraft equipped with Ni measurement sensors, the analysis involving screening clear and cloudy conditions is restricted only to the MLs and to the tropics.
2.4 Contrail detection: Schmidt–Appleman criterion
The combustion of kerosene (or alternative fuels) releases hot and humid air behind the aircraft, which is progressively diluted in the cold and dry ambient atmosphere. This mixture follows a line in a p–T diagram (Schumann, 1996). In this framework, contrails form at ambient temperature below a critical value Tcrit and RHl larger than RHlcrit (Schumann, 1996). We used this criterion, known as SAc, to document the frequency of non-persistent and persistent contrail formation as a function of the pressure for the following fuels: kerosene, bioethanol, and liquid hydrogen. Contrails are persistent if RHi is above 100 % (see Fig. 3 in Schumann, 1996).
The approximation of Tcrit frequently used in the literature (e.g., Rap et al., 2010).
where G (in Pa K−1) is the slope of the mixture line in the p–T diagram and is defined as follows:
G combines the atmospheric properties (the ambient pressure (in Pa) of the flight altitude, the isobaric heat capacity of air cp=1004 J kg−1 K−1, the ratio of the molecular masses of water vapor and dry air ϵ≈0.622), the fuel properties (the specific combustion heat of the fuel Q (in J kg−1)), the emission index of water vapor for the fuels EI (in kg kg−1), and the aircraft-engine propulsion efficiency of the aircraft η. In this study, we consider η = 0.3, which corresponds to a typical present-day fleet value (Schumann, 1996, 2012). The values of Q and EI for the different fuels are listed in Schumann (1996) and in Wolf et al. (2023).
The RH threshold for an ambient temperature T is determined by the following equation:
where is the saturation water vapor pressure. For more details, the reader should refer for example to Schumann (1996) and Rap et al. (2010).
3.1 Number of ice crystals in cirrus clouds
Situations that are ice supersaturated and subsaturated are observed in both clear and cloudy conditions (Kahn et al., 2009; Krämer et al., 2009, 2016; Petzold et al., 2017). Therefore, for a better characterization of the PDF of RHi, we first document how clear and cloudy conditions are sampled in IAGOS measurements. For this purpose, we used three different detection thresholds (0.001, 0.015, and 0.05 particles cm−3) for characterizing clouds based on their ice crystal number concentrations Ni (see Sect. 2.3). We found that IAGOS aircraft encounter cirrus clouds with larger Ni in the tropics than in the MLs, which is consistent with Petzold et al. (2017) (Fig. 3). Considering only non-zero Ni values, the percentages of data points above the thresholds of 0.015 (0.05) particles cm−3 are 63 (47) % and 56 (40) % for the 275–225 and 225–175 hPa layers, respectively, in the tropics (Fig. 3). In the MLs, the percentages are 58 (38) % for the 325–275 hPa layer and 40 (20) % for the 275–225 hPa layer (Fig. 3). The highest fraction of Ni<0.015 cm−3 in MLs is observed at the altitudes of 225–175 hPa, with a value of 72 % (Fig. 3). The higher Ni in cirrus clouds in the tropics compared to the MLs between 275–175 hPa is consistent with the findings of studies using synergetic lidar–radar satellite data (e.g., Sourdeval et al., 2018) and can be explained by the fact that, in the tropical region, strong updrafts in convective regions produce ice supersaturation and cause high nucleation rates that lead to high number concentrations of ice crystals (Krämer et al., 2016).
.
Figure 3Cumulative PDF of the ice crystal number concentrations in the MLs of the Northern Hemisphere and in the tropics over the period 2011–2022 for different pressure layers. The vertical dashed gray lines correspond to the concentration thresholds of 0.001, 0.015, and 0.05 cm−3 (see text).
3.2 How often do IAGOS aircraft fly in cirrus clouds?
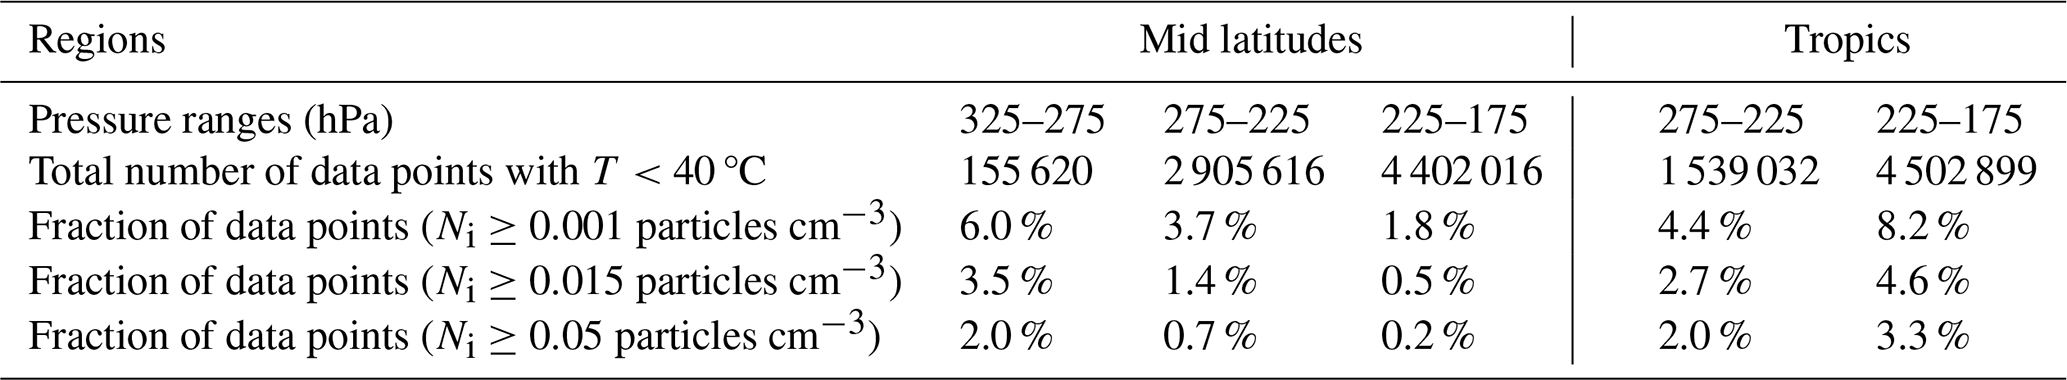
The fractions of aircraft flying time in cirrus clouds are presented in Table 2. They are computed for each pressure layer as the number of measurements of Ni collocated with measurements of temperatures lower than −40 °C that are at least equal to the cirrus cloud detection threshold divided by the total number of measurements. These fractions can also be interpreted as cirrus cloud occurrence frequencies as seen by IAGOS. The occurrence frequency of cirrus clouds decreases in the MLs with decreasing pressure (when going from 275–225 to 225–175 hPa), while it increases in the tropics. Using 0.001 particles cm−3 as a threshold, we determined fractions of 4.4 % and 8.2 % in the tropics and 3.7 % to 1.8 % in the MLs (Table 2). On average, the total occurrence frequency of cirrus clouds is highest in the tropics (Table 2). This is consistent with the findings of Petzold et al. (2017), who showed that IAGOS data capture the global pattern of cirrus clouds. When the detection threshold is increased to 0.015 and 0.05 particles cm−3, cirrus cloud occurrence frequency decreases, in particular in the 225–175 hPa layer (Table 2), but remains large. This suggests that the properties of RHi PDF from MOZAIC and IAGOS measurements correspond to a combination of clear-sky and cloudy-sky conditions.
Table 2Number of data points (with ambient temperature lower than −40 °C) including a measurement of the ice crystal number concentration (Ni) and percentage of data points for which Ni≥0.001, 0.015, and 0.05 particles cm−3 in the MLs of the Northern Hemisphere and in the tropics over the period 2011–2022.
.
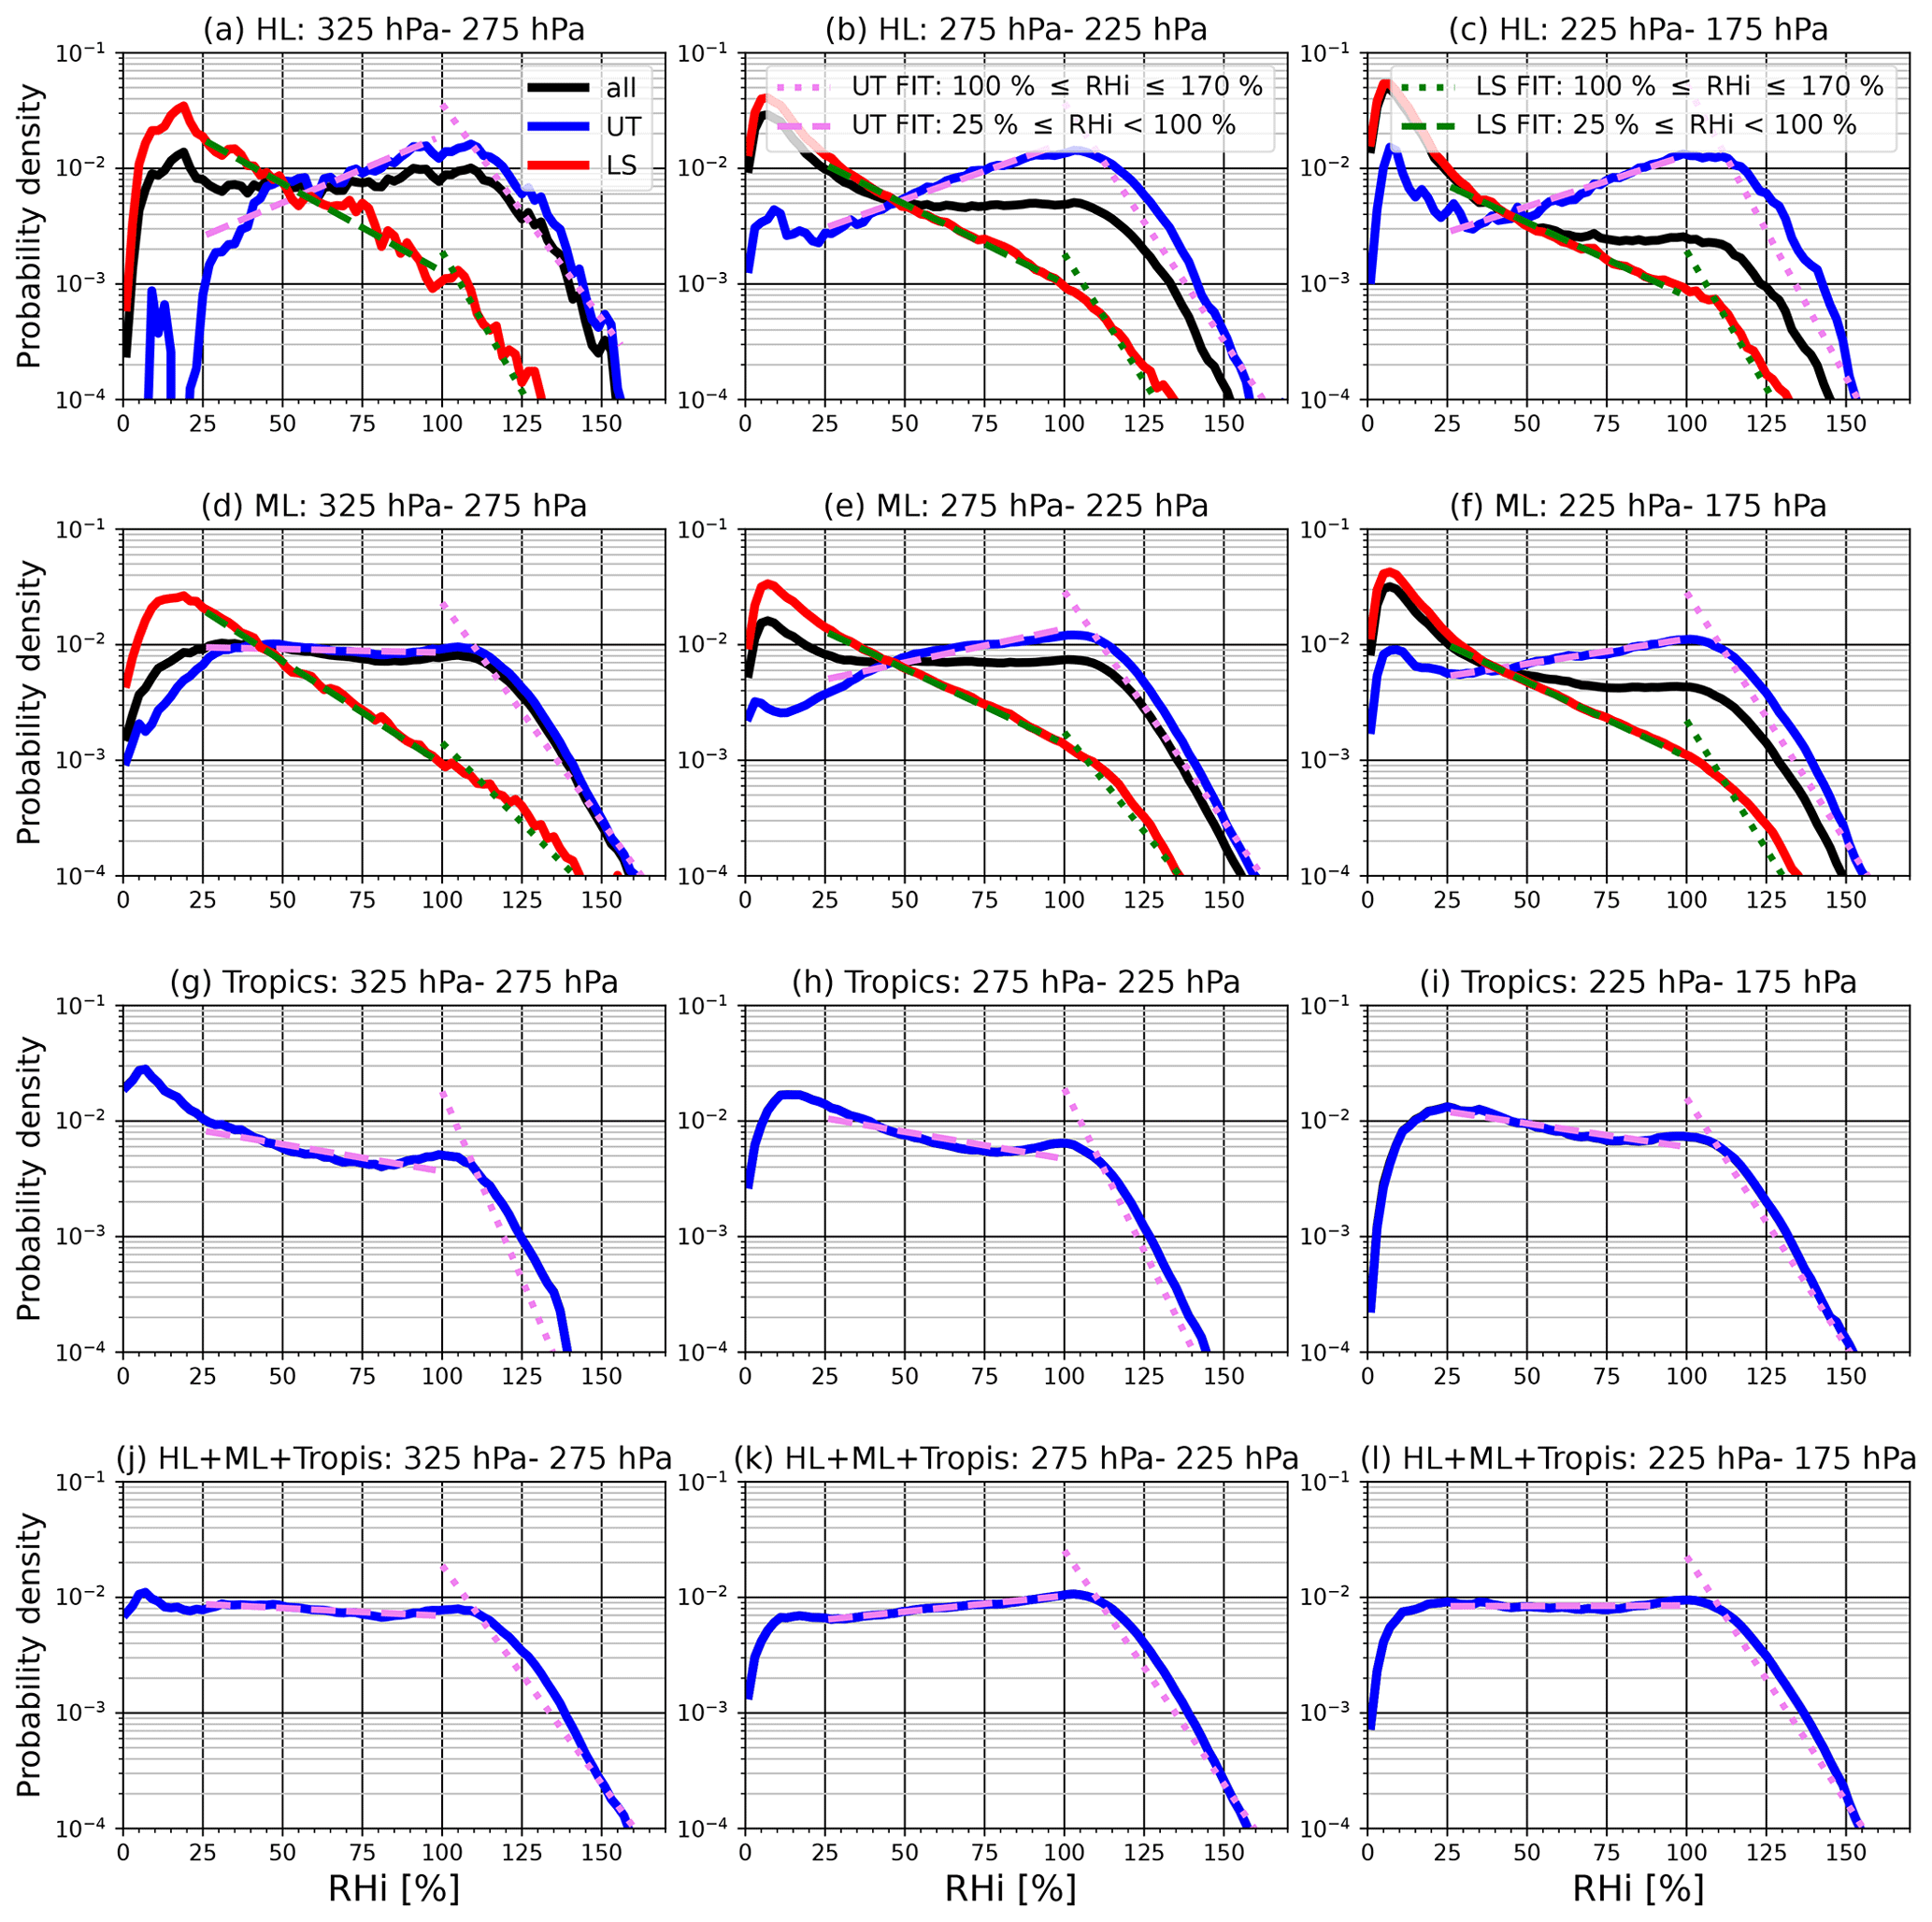
Figure 4Probability density function of the relative humidity with respect to ice (in %) computed over the period 1995–2022 for the pressure layers 325–275, 275–225, and 225–175 hPa, (a–c) in the HLs of the Northern Hemisphere, (d–f) in the MLs of the Northern Hemisphere, (g–i) for the tropical region, and (j–l) the PDF of the three domains combined. For each pressure layer, the tropospheric RHi PDF (blue), the stratospheric RHi PDF (red), and their combined PDF (black) are shown. The dashed and dotted green lines correspond to the fit for RHi ∈ [25 %, 100 %) and for RHi ∈ [100 %, 170 %], respectively, in the stratosphere. The dashed and dotted pink lines are those for the troposphere.
Table 3Long-term (1995–2022) mean and standard deviation of the RHi values in the UT (and in the LS) in the HLs and in the MLs of the Northern Hemisphere and in the tropics.
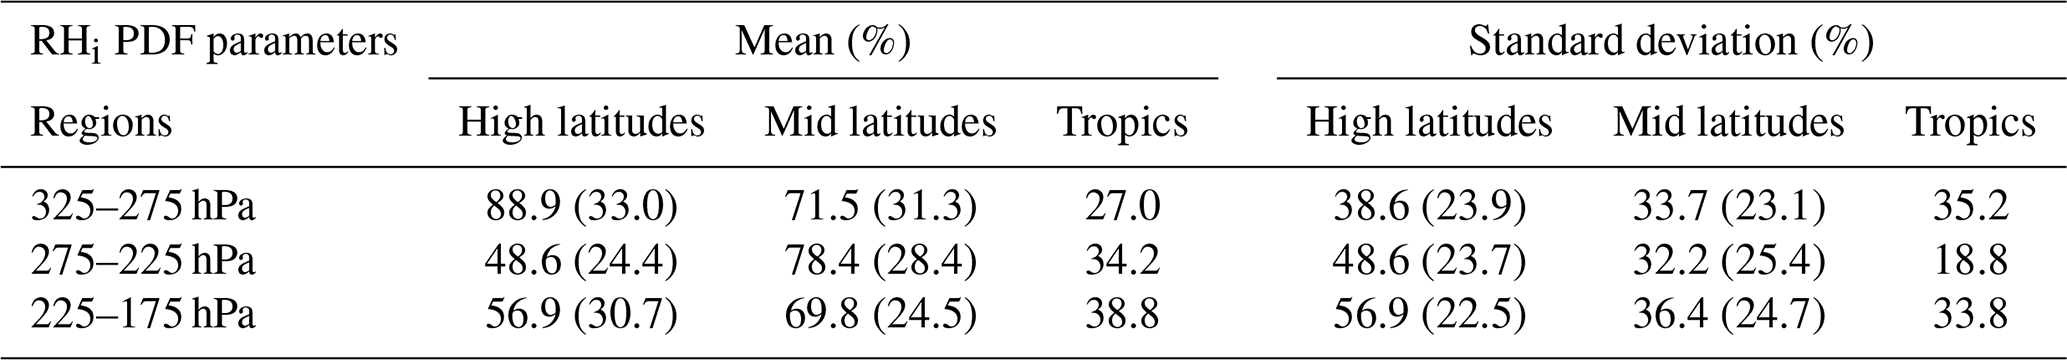
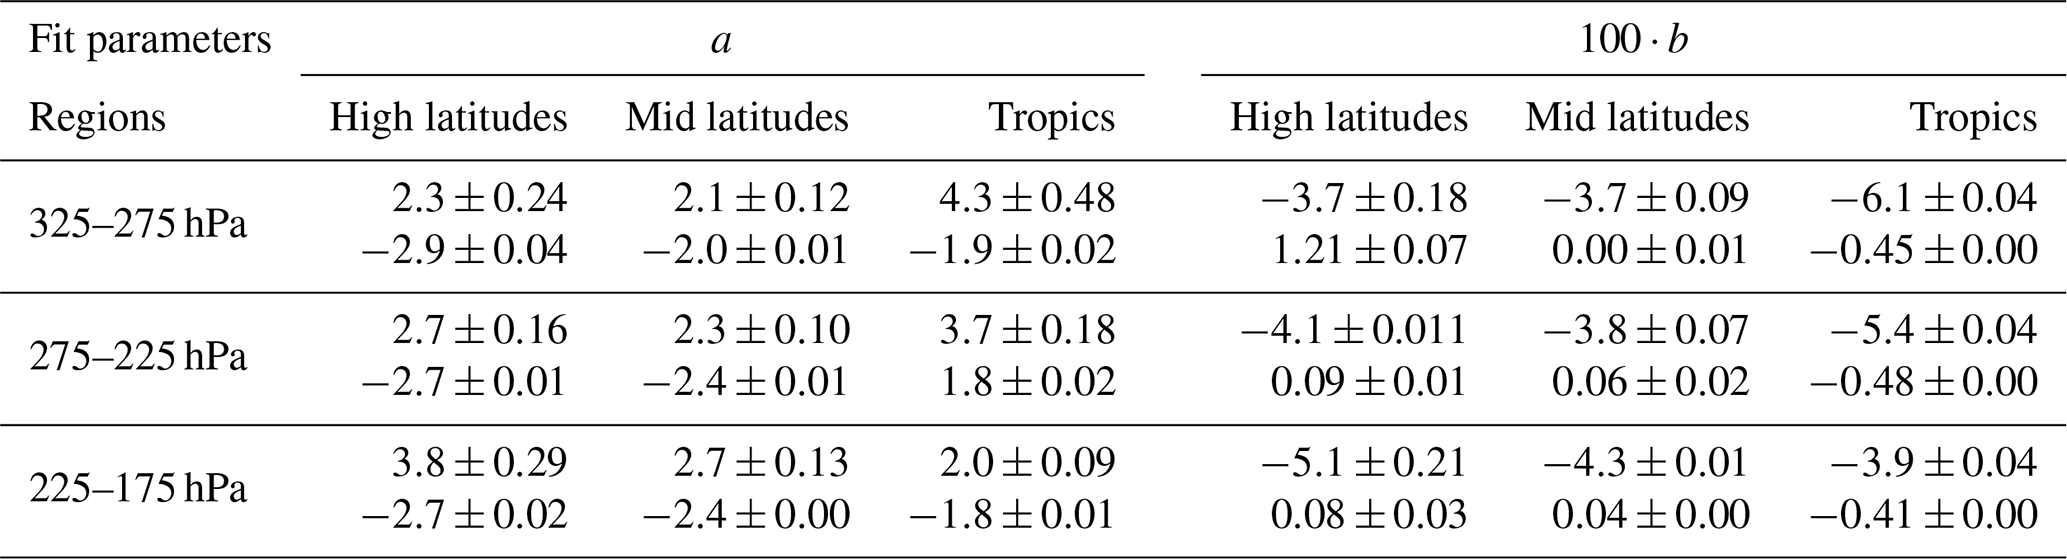
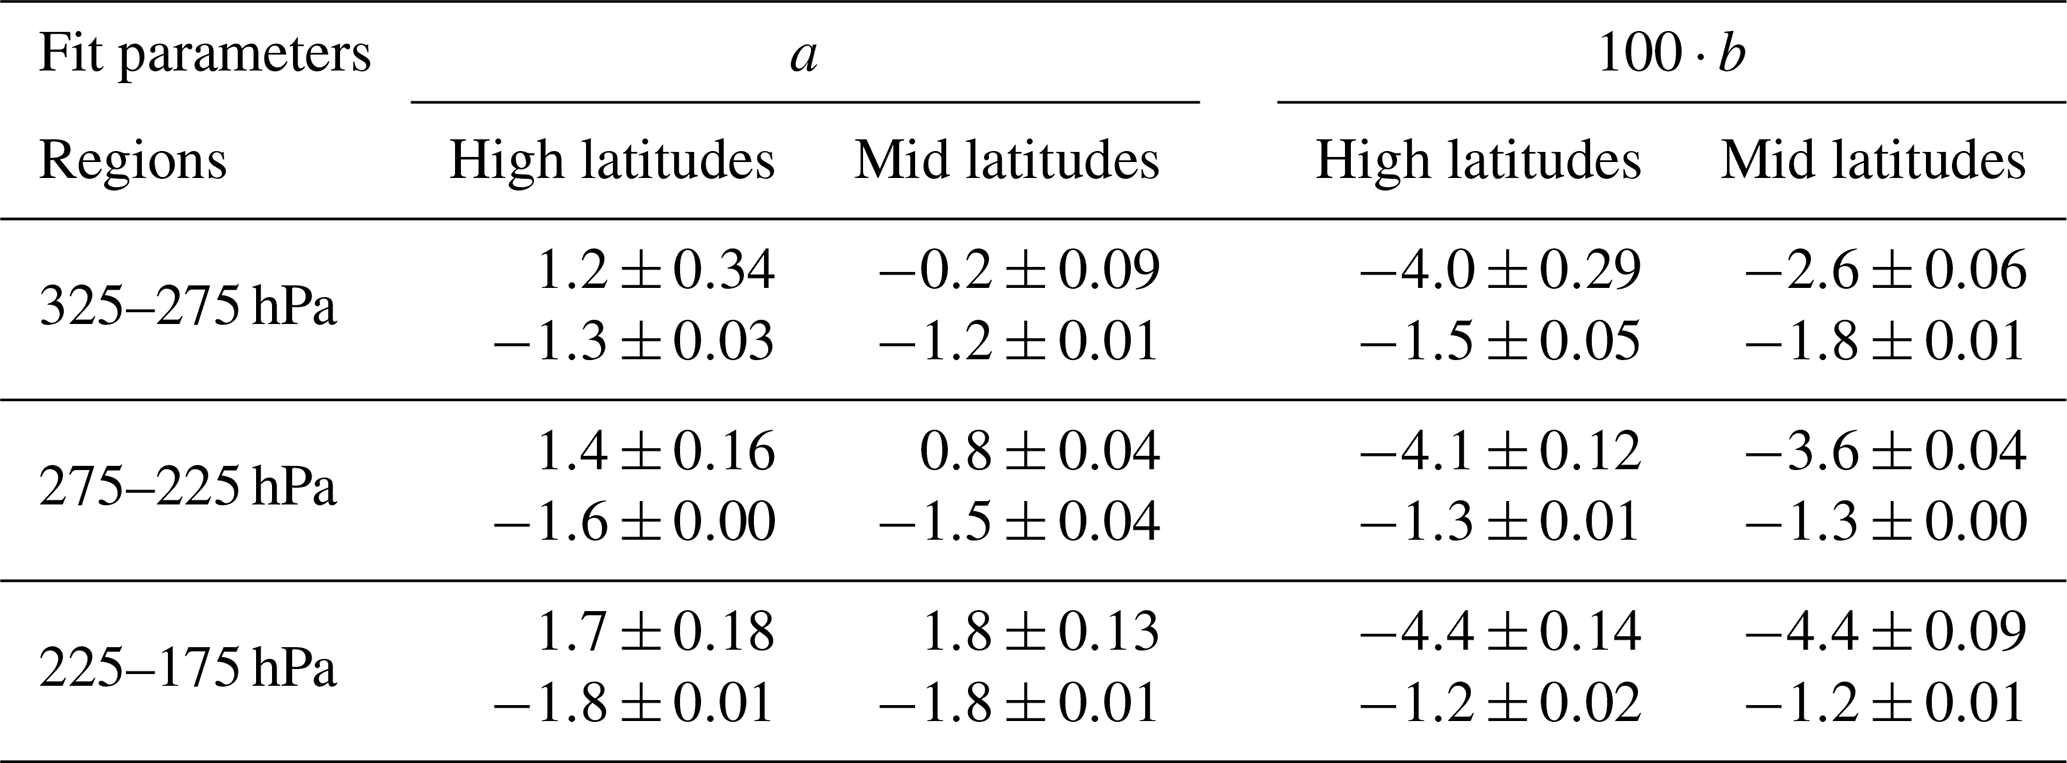
Table 4Values (with uncertainty range of ±1 SD – standard deviation) of the parameters a and b of the fit lines (see Eq. 4) in the supersaturated (top) and subsaturated (bottom) part of the RHi distribution in the UT, computed over the period 1995–2022. The values of b are multiplied by 100 for the sake of legibility.
3.3 Characteristics of the RHi probability density function
3.3.1 Upper troposphere
Gierens et al. (1999) showed that over larger spatial scales and longer timescales, the distributions of RHi smaller and larger than 100 % in the UT follow a uniform law and an exponential law, respectively. However, RHi is modulated in space and time by fluctuations in specific humidity and temperature (Diao et al., 2014). Consequently, its statistical distribution is subject to spatial variability. This is illustrated in Fig. 4, which shows the PDF of RHi in the MLs, in the HLs, and in the tropics, for the 325–275, 275–225, and 225–175 hPa pressure layers, respectively. In the MLs, the characteristics of the RHi PDF depend on the pressure level. It is unimodal in 325–275 hPa with a mode at 108 % (Fig. 4d), while it is bimodal in the 275–225 and 225–175 hPa layers. The two modes in 275–225 hPa are centered at 5 % and 108 % (Fig. 4e), while those in 225–175 hPa are located at 8 % and 100 % (Fig. 4f). The existence or the magnitude of the dry mode in the 275–225 and 225–175 hPa layers in the MLs is not certain. It may correspond to LS measurements but be erroneously attributed to the UT because of uncertainties in the method for discriminating UT and LS measurements of RHi. We therefore focused the following analysis on the RHi values greater than 25 %. The presence of a wet mode was reported in the study of Spichtinger et al. (2003a) based on radiosoundings over Lindenberg (Germany). In agreement with Reutter et al. (2020), who analyzed RHi in the North Atlantic, the mean and the standard deviation of RHi distributions in the UT vary little with the pressure level in the MLs (Table 3). However, their variations are substantial in the tropics and HLs (Table 3).
An important point, common to these UT RHi distributions and consistently with Gierens et al. (1999), is that the PDF decreases exponentially with increasing RHi beyond a value S (here, S ∈ [100 %, 110 %]). For a quantitative intercomparison of the part of the RHi PDF corresponding to RHi≥S, we take S=100 %, and like Gierens et al. (1999), we fit each PDF using the following straight line:
in which a is the intercept and b is the slope. For the three different pressure layers, b (multiplied by 100 for legibility) is close to −4 and a is between 2 and 3 in the MLs (Table 4). The PDF has different characteristics in the range of RHi that correspond to subsaturation. The PDF of RHi ∈ [25 %, 100 %) increases (b≥0) instead of decreasing exponentially with increasing RHi in the 275–225 and 225–175 hPa layers (Table 4). In the 325–275 hPa layer, the PDF is nearly uniform (b≈0) for RHi ∈ [25 %, 100 %) (Table 4). The comparison of USA, the North Atlantic, and Europe reveals that, in the first order, the distributions of RHi over the three regions are consistent with each other in the 275–225 and 225–175 hPa layers (Fig. 5). However, substantial differences appear in the 325–275 hPa layer. The magnitude of the dry mode at these pressure levels is higher in the USA compared to the other two areas (Fig. 5) for all seasons (see Fig. S1 in the Supplement). In addition, the PDF of RHi between 25 % and 100 % is almost uniform over Europe, while it increases and decreases exponentially over the North Atlantic and USA, respectively (Fig. 5). This implies differences between the three sub-regions in the mechanisms that modulate RHi variability in the pressure range 325–275 hPa. Insufficient sampling may also be a contributing factor, since fewer measurements were made at these pressure levels (Fig. 2). The UT RHi PDFs in the HLs exhibit similar features to those in the MLs (Fig. 4a–c). However, for RHi between 25 % and 100 %, the exponential rate of increase b is slightly higher in the HLs than in the MLs (Fig. 4a–f, Table 4).
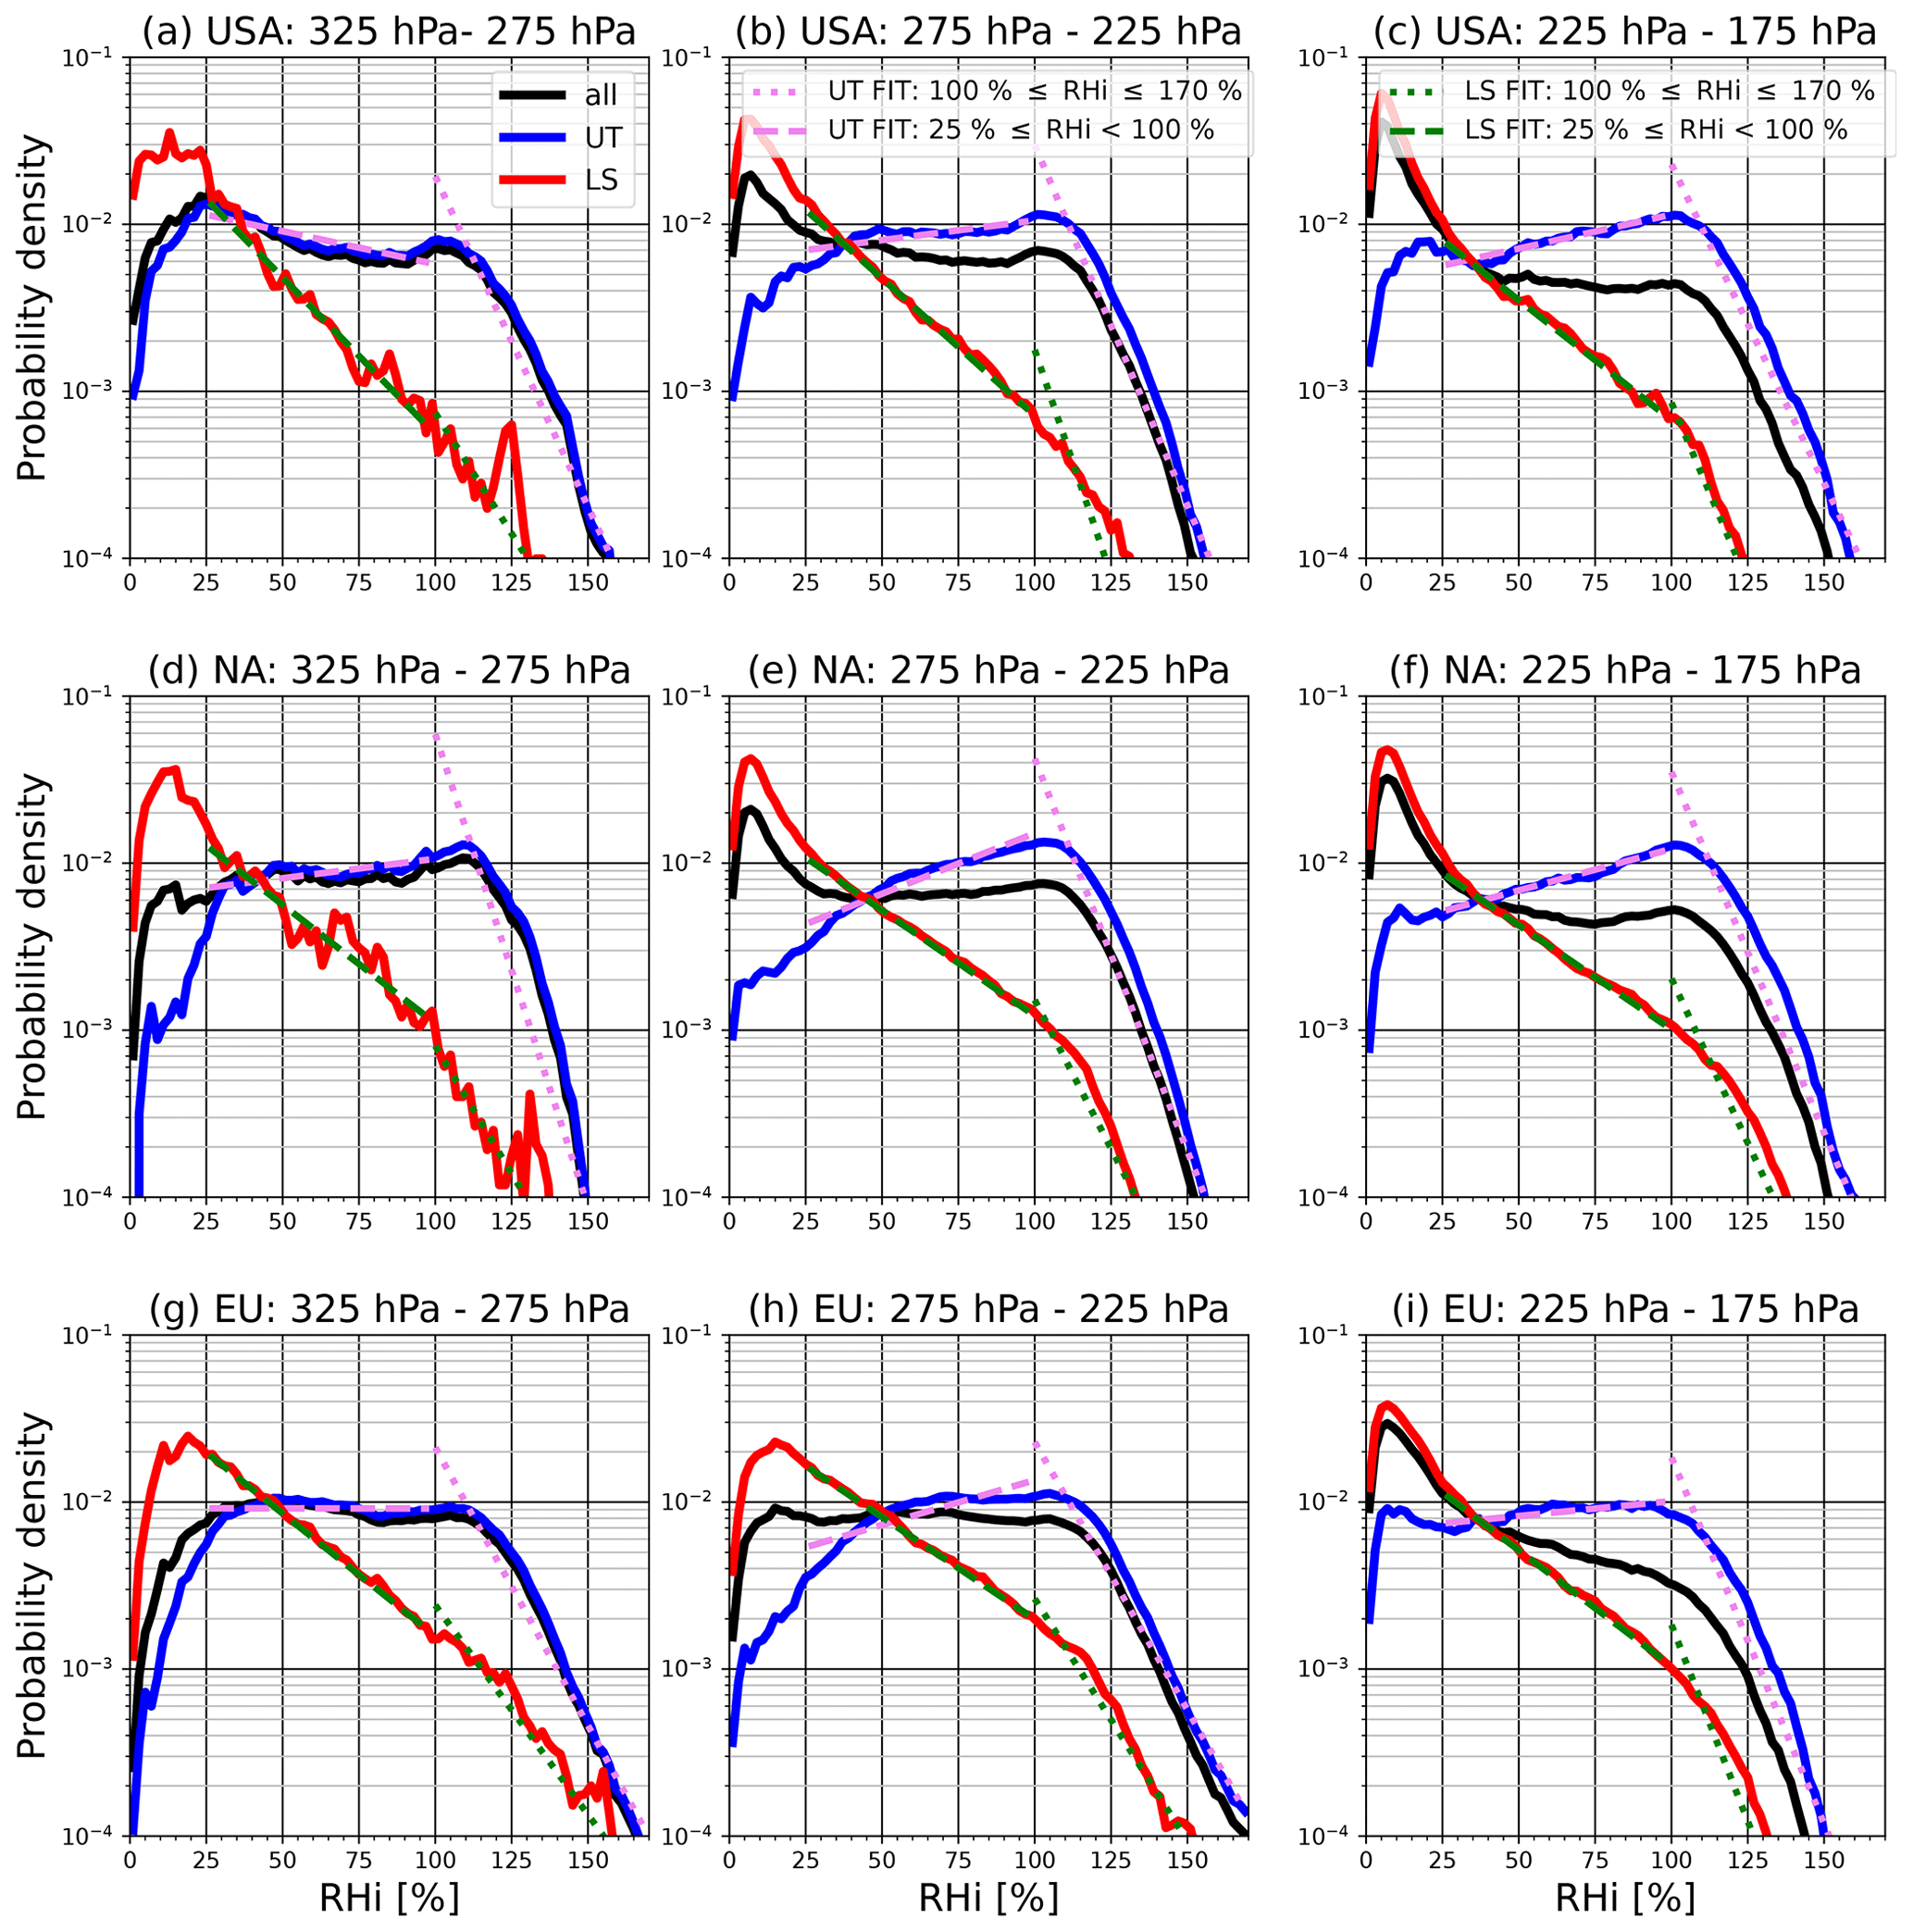
In the tropical region, the evolution of the RHi PDF with pressure is different (Fig. 4g–i). The PDFs are bimodal, and, in contrast to the MLs and the HLs, the magnitude of the dry mode increases with increasing pressure (i.e., going down in the atmosphere) while that of the wet mode increases. This is due to the warm tropical temperatures, which favor low RHi for 325–275 hPa despite the higher availability of water vapor compared to the other two pressure layers considered here. Unlike the MLs and the HLs, the existence of a mode between 0 % and 25 % is more certain in the tropics since the measurements analyzed are less affected by stratospheric measurements. For RHi≥25 %, the PDF is characterized by an exponential decay on both sides of the mode at 100 %. The characteristics of the PDF above 100 % are similar to those of the RHi PDF in the MLs and the HLs. The important difference is that the absolute value of the rate parameter b decreases with decreasing pressure in the tropics, whereas it increases in MLs and HLs (Table 4). It is worth noting that the global PDF (PDF combining RHi measurements in HLs, MLs, and tropics) includes opposing tendencies in the PDF of RHi lower than 100 % between the tropics and the Northern Hemisphere, resulting in an almost uniform PDF (b≈0, Fig. 4j–l). These results are consistent with the findings of Gierens et al. (1999).
3.3.2 Lower stratosphere
In this section, we document the RHi PDF in the LS. This analysis is carried out only in the MLs and the HLs because in MOZAIC and IAGOS stratospheric measurements are very few in the 325–175 hPa layer in the tropics. The mean RHi decreases with decreasing pressure in the MLs and HLs, while its standard deviation varies very little (Table 3). Reutter et al. (2020) found similar results over the northern portion of the Atlantic Ocean.
The observed temperatures in the UT and the LS are relatively close, but water vapor transport into the LS through the tropopause is low (Petzold et al., 2020; Reutter et al., 2020). This makes the mean value of RHi lower in the LS than in the UT. Another important difference between the LS and the UT, common to the MLs and the HLs and to the three pressure layers considered here, is that in the LS, the PDF of RHi greater than 25 % decreases exponentially with increasing RHi (Fig. 4a–f, Table 5). This exponentially decaying PDF of RHi in the LS, with a break in the slope around 100 %, is a feature reported by Spichtinger et al. (2003a) over Lindenberg (Germany). Our results show that this property is common to the RHi PDF in the MLs and the HLs of the Northern Hemisphere in the 275–225 and 225–175 hPa layers (Fig. 4b, c, e, and f). For these pressure layers, Gierens et al. (1999) did not find the break in slope around 100 % in the MOZAIC data for the period 1995–1997. This might be due to an undersampling of the LS properties of RHi PDF over the period they considered. It is worth noting that in the 325–275 hPa layer, the break in slope around 100 % in the RHi PDF in the LS is marked only in the HLs (Fig. 4a). In the MLs, the break in slope seems to be undersampled in the USA in the MOZAIC and IAGOS data (Fig. 5a). In the LS, unlike the UT, the dry mode between 0 % and 25 % is expected due to the low water vapor content (see Petzold et al., 2020).
3.3.3 Lower stratosphere and upper troposphere
As shown above, there are differences between the shapes of RHi PDF in the UT and in the LS in the HLs and in the MLs. In this section, we analyzed the properties that emerge when the UT and the LS are considered together. Such an approach is used in several studies (e.g., Lamquin et al., 2012; Smit et al., 2014; Diao et al., 2014; Petzold et al., 2020). We found, in agreement with these studies, that the RHi PDF in the UTLS is bimodal (Fig. 4a–f). The mode of the RHi PDF between 0 % and ∼50 % (depending on pressure layer and region) is essentially a characteristic of the LS, while that for RHi greater than ∼50 % is dominated by the features of the RHi PDF in the UT (Fig. 4a–f). The magnitude of the dry mode varies with the pressure level. It increases when going up from 325 to 175 hPa in the LS (Fig. 4a–f) since at these pressure levels in the LS, water vapor decreases while the temperature increases (Reutter et al., 2020; Petzold et al., 2020). The RHi PDF of the MLs includes more UT measurements than the RHi PDF of the HLs since the pressure level of the tropopause increases (i.e., its altitude decreases) with latitude. Consequently, the shape of the upper tail of the RHi PDF is more dominated by the tropospheric PDF in the MLs than in the HLs (Fig. 4). In the MLs, some differences can be noted at the sub-regional scale regarding the shape of the RHi PDF. The exact ranges of the lower/upper tail of the PDF of RHi dominated by the LS/UT features depend on the location (Fig. 5).
.
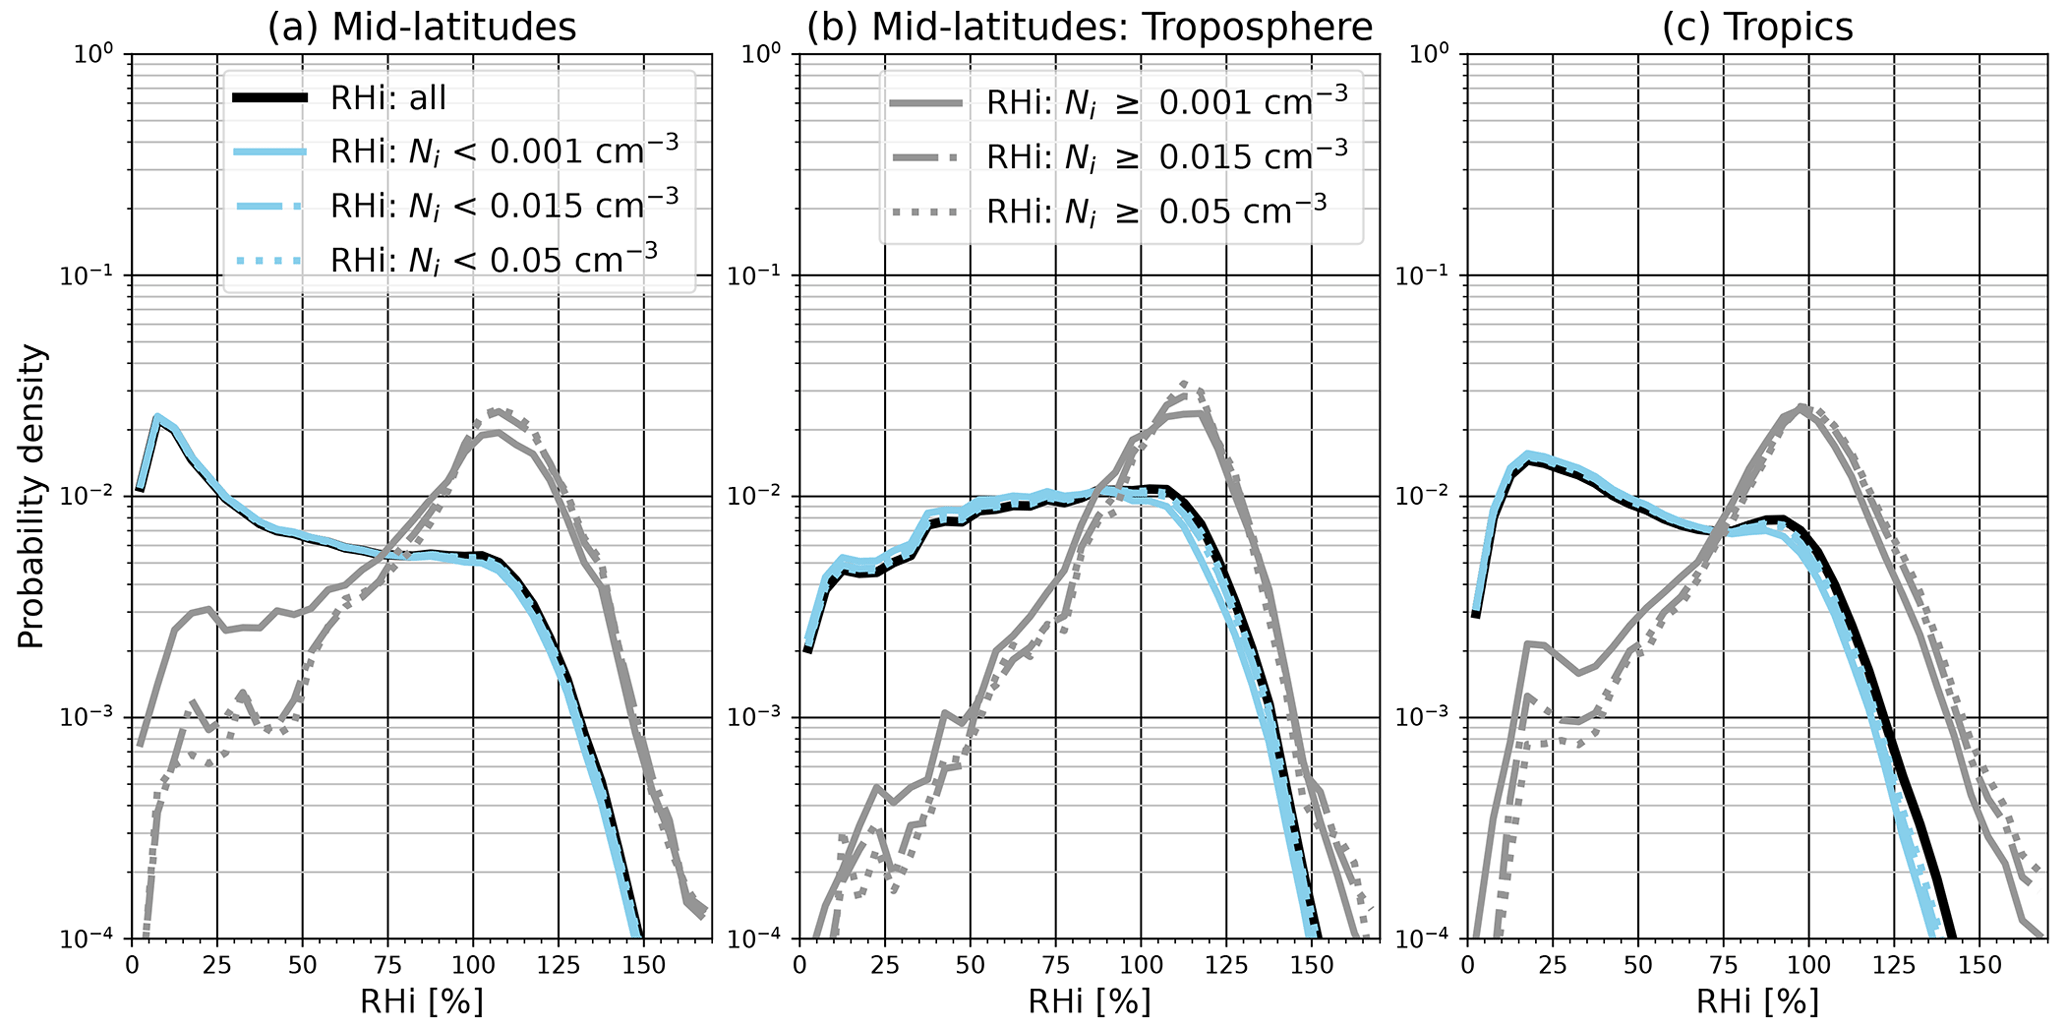
Figure 6Probability density function of RHi in clear-sky (sky blue), in cloudy (gray), and in all-sky (black) conditions (a) in the upper troposphere and the lower stratosphere in the mid-latitudes of the Northern Hemisphere, (b) only in the upper troposphere in the MLs of the Northern Hemisphere, and (c) in the tropical upper troposphere and lower stratosphere, computed over the period 2011–2022. Only RHi measurements collocated with measurements of temperature lower than −40 °C are used in the analysis.
3.3.4 Clear vs. cloudy conditions
To further document the RHi PDF, we compared its properties in clear and cirrus cloud conditions between 325–175 hPa in the MLs and in the tropics using the subsample of data measured on board aircraft equipped with sensors measuring ice crystal number concentration. In these two regions, the aforementioned wet mode, in the vicinity of 100 % in the RHi PDF that combines clear and cloudy conditions, appears to come essentially from cirrus clouds (Fig. 6). Conditions with Ni<0.001 particles cm−3 associated with the slow and complex processes of cirrus cloud formation and dissipation may also contribute. Consequently, this mode also partly appears in clear-sky conditions depending on the region. In the subsample of the IAGOS data analyzed here, it is more prominent in the tropics than in the MLs (Fig. 6a–c). Petzold et al. (2017) conducted similar analyses in different regions, including areas in the tropics and MLs using IAGOS data of the period from July 2014 to October 2015. They found that the RHi wet mode in the tropical Atlantic is more prominent (see their Fig. 8b). This characteristic seems to be smoothed out in satellite and lidar–radar synergistic data, since Kahn et al. (2009) and Lamquin et al. (2012) reported no mode in the vicinity of 100 % under clear conditions.
In addition to the mode around 100 %, the PDF of in-cloud RHi also shows a dry mode between 0 % and 50 % (Fig. 6a and c), which could correspond to a measurement artifact. The positions of the mode around 100 % are different between the MLs and the tropics (Fig. 6a–c). It is subsaturated in the tropics, while it is supersaturated in the MLs (Fig. 6a and b). Cirrus clouds can exhibit ice-subsaturated and ice-supersaturated conditions depending on the stage of their life cycle (Petzold et al., 2020; Li et al., 2023). Some studies (e.g., Krämer et al., 2009; Petzold et al., 2017) have found that the mode of the PDF of RHi in cirrus clouds is ice supersaturated, while others (e.g., Kahn et al., 2009; Ovarlez et al., 2002; Li et al., 2023) found an ice-subsaturated mode. Since the magnitude and position of this wet mode depend on the region as illustrated in this study and reported in the literature, further studies are needed to better characterize it and elucidate the mechanisms involved.
The PDF of in-cloud RHi decreases for subsaturated conditions but increases for supersaturated conditions when increasing the detection threshold (Fig. 6). This is consistent with the fact that, more generally, high concentrations of ice crystals are associated with high RHi (Petzold et al., 2017; Krämer et al., 2016). The lower tail of the PDF of RHi could include measurements in contrails or at the bottom of cirrus clouds where subsaturated conditions are observed more often (Dekoutsidis et al., 2023). They may also correspond to measurements carried out in diluted cirrus clouds or in the proximity of cirrus clouds where ice crystals may be mixed with clear air by turbulence. Erroneous measurements may also contribute since the uncertainties associated with these thresholds are large (more than 50 % for the threshold of 0.001 particles cm−3; see Sect. 2.3).
.
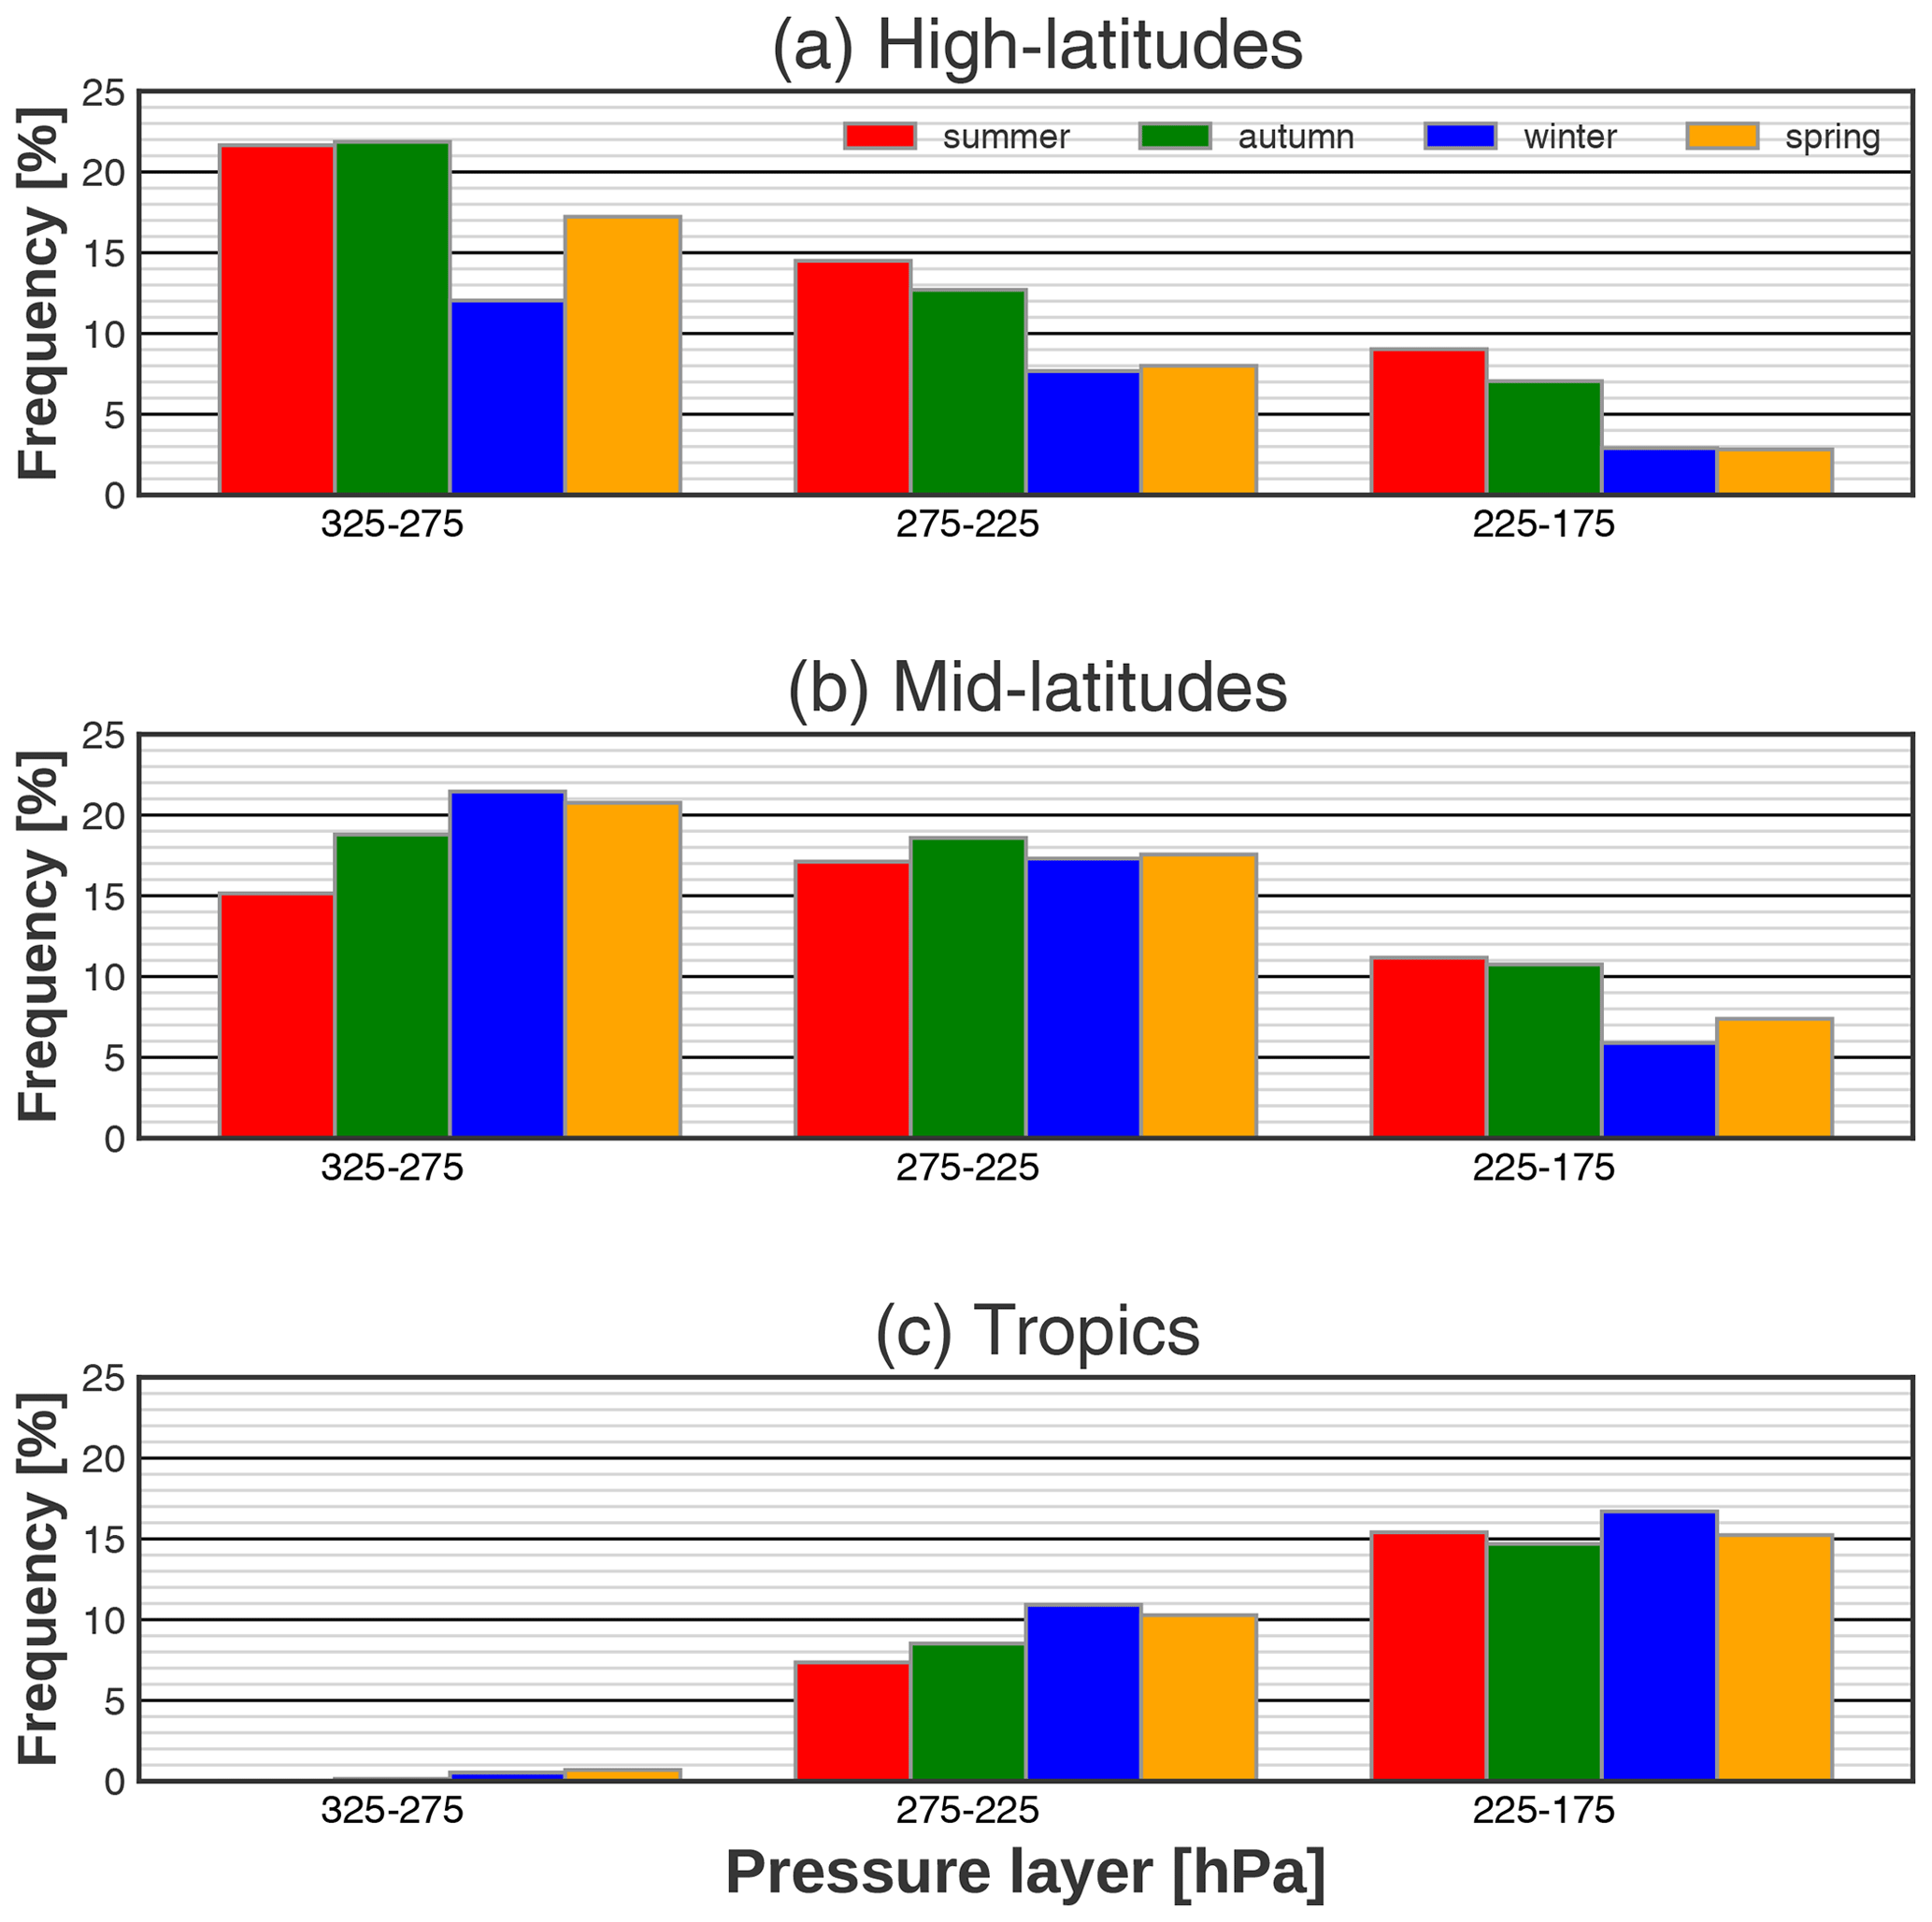
Figure 7Frequency of ISSRs (in %) for four seasons (color bars) and three pressure layers when considering only measurements with temperature lower than −38 °C for (a) the HLs and (b) the MLs of the Northern Hemisphere and (c) the tropics.
3.4 Implications of RHi variability for contrail formation
3.4.1 Frequency of ice supersaturation regions
In this section, we investigate the frequency of occurrence of ISSRs, which are necessary for persistent contrail formation (Schmidt, 1941; Appleman, 1953). We computed this frequency as the ratio of aircraft flight time in ISSRs to total flight time. The frequency of ISSRs collocated with measurements of temperatures lower than −38 °C (temperatures at which cirrus clouds may form by homogeneous nucleation; see Sect. 1) is presented in Fig. 7, while the frequency of ISSRs with no restriction on the temperature is presented in Fig. 8. The difference between these two frequencies is low (less than 3 %) except for the 325–275 hPa layer in the tropics, where it is relatively high (6 %). In the HLs and in the MLs, ISSR frequency decreases with the pressure level (Fig. 8a–c). In the HLs, for the 325–275, 275–225, and 225–175 hPa layers, the occurrence frequencies of ISSRs with no restriction on the temperature are 19.2 %, 11.0 %, and 5.5 %, respectively, while they are 21 %, 17.8 %, and 9.0 % in the MLs. In the tropics, ISSRs occur more frequently (15.6 % of the time) in the 225–175 hPa layer. In the 325–275 and 275–225 hPa layers they occur 8 % and 10.4 % of the time, respectively. It should be noted that, for the three regions, the frequency of ISSRs is characterized by regional and seasonal variability. In the tropics (for the 325–275, 275–225, and 225–175 hPa layers) and in the MLs (for the 325–275 hPa layer), MOZAIC and IAGOS aircraft flying time in the ISSR is highest in winter and lowest in summer (Fig. 7b and c). In the three pressure layers in the HLs and for the 225–175 hPa layer in the MLs, the frequency of ISSRs seems to be essentially driven by the seasonal evolution of LS conditions (Fig. 7a and b; see also Fig. S2), which are drier than UT conditions. In the Northern Hemisphere, the altitude of the tropopause is lower in winter and spring than in summer and autumn (Liu et al., 2014). As a result, LS air masses are sampled by MOZAIC and IAGOS aircraft more frequently in winter and spring than in summer and autumn (Fig. S2). In the 275–225 hPa layer in the MLs, the seasonality of ISSR frequency is less marked (Fig. 7b). In the 325–275 hPa layer, ISSR seasonality seems to follow that of temperature (Fig. 7b). In line with Lamquin et al. (2012) findings, the seasonality of ISSR frequency combining tropospheric and stratospheric conditions varies as a function of latitude and pressure.
.
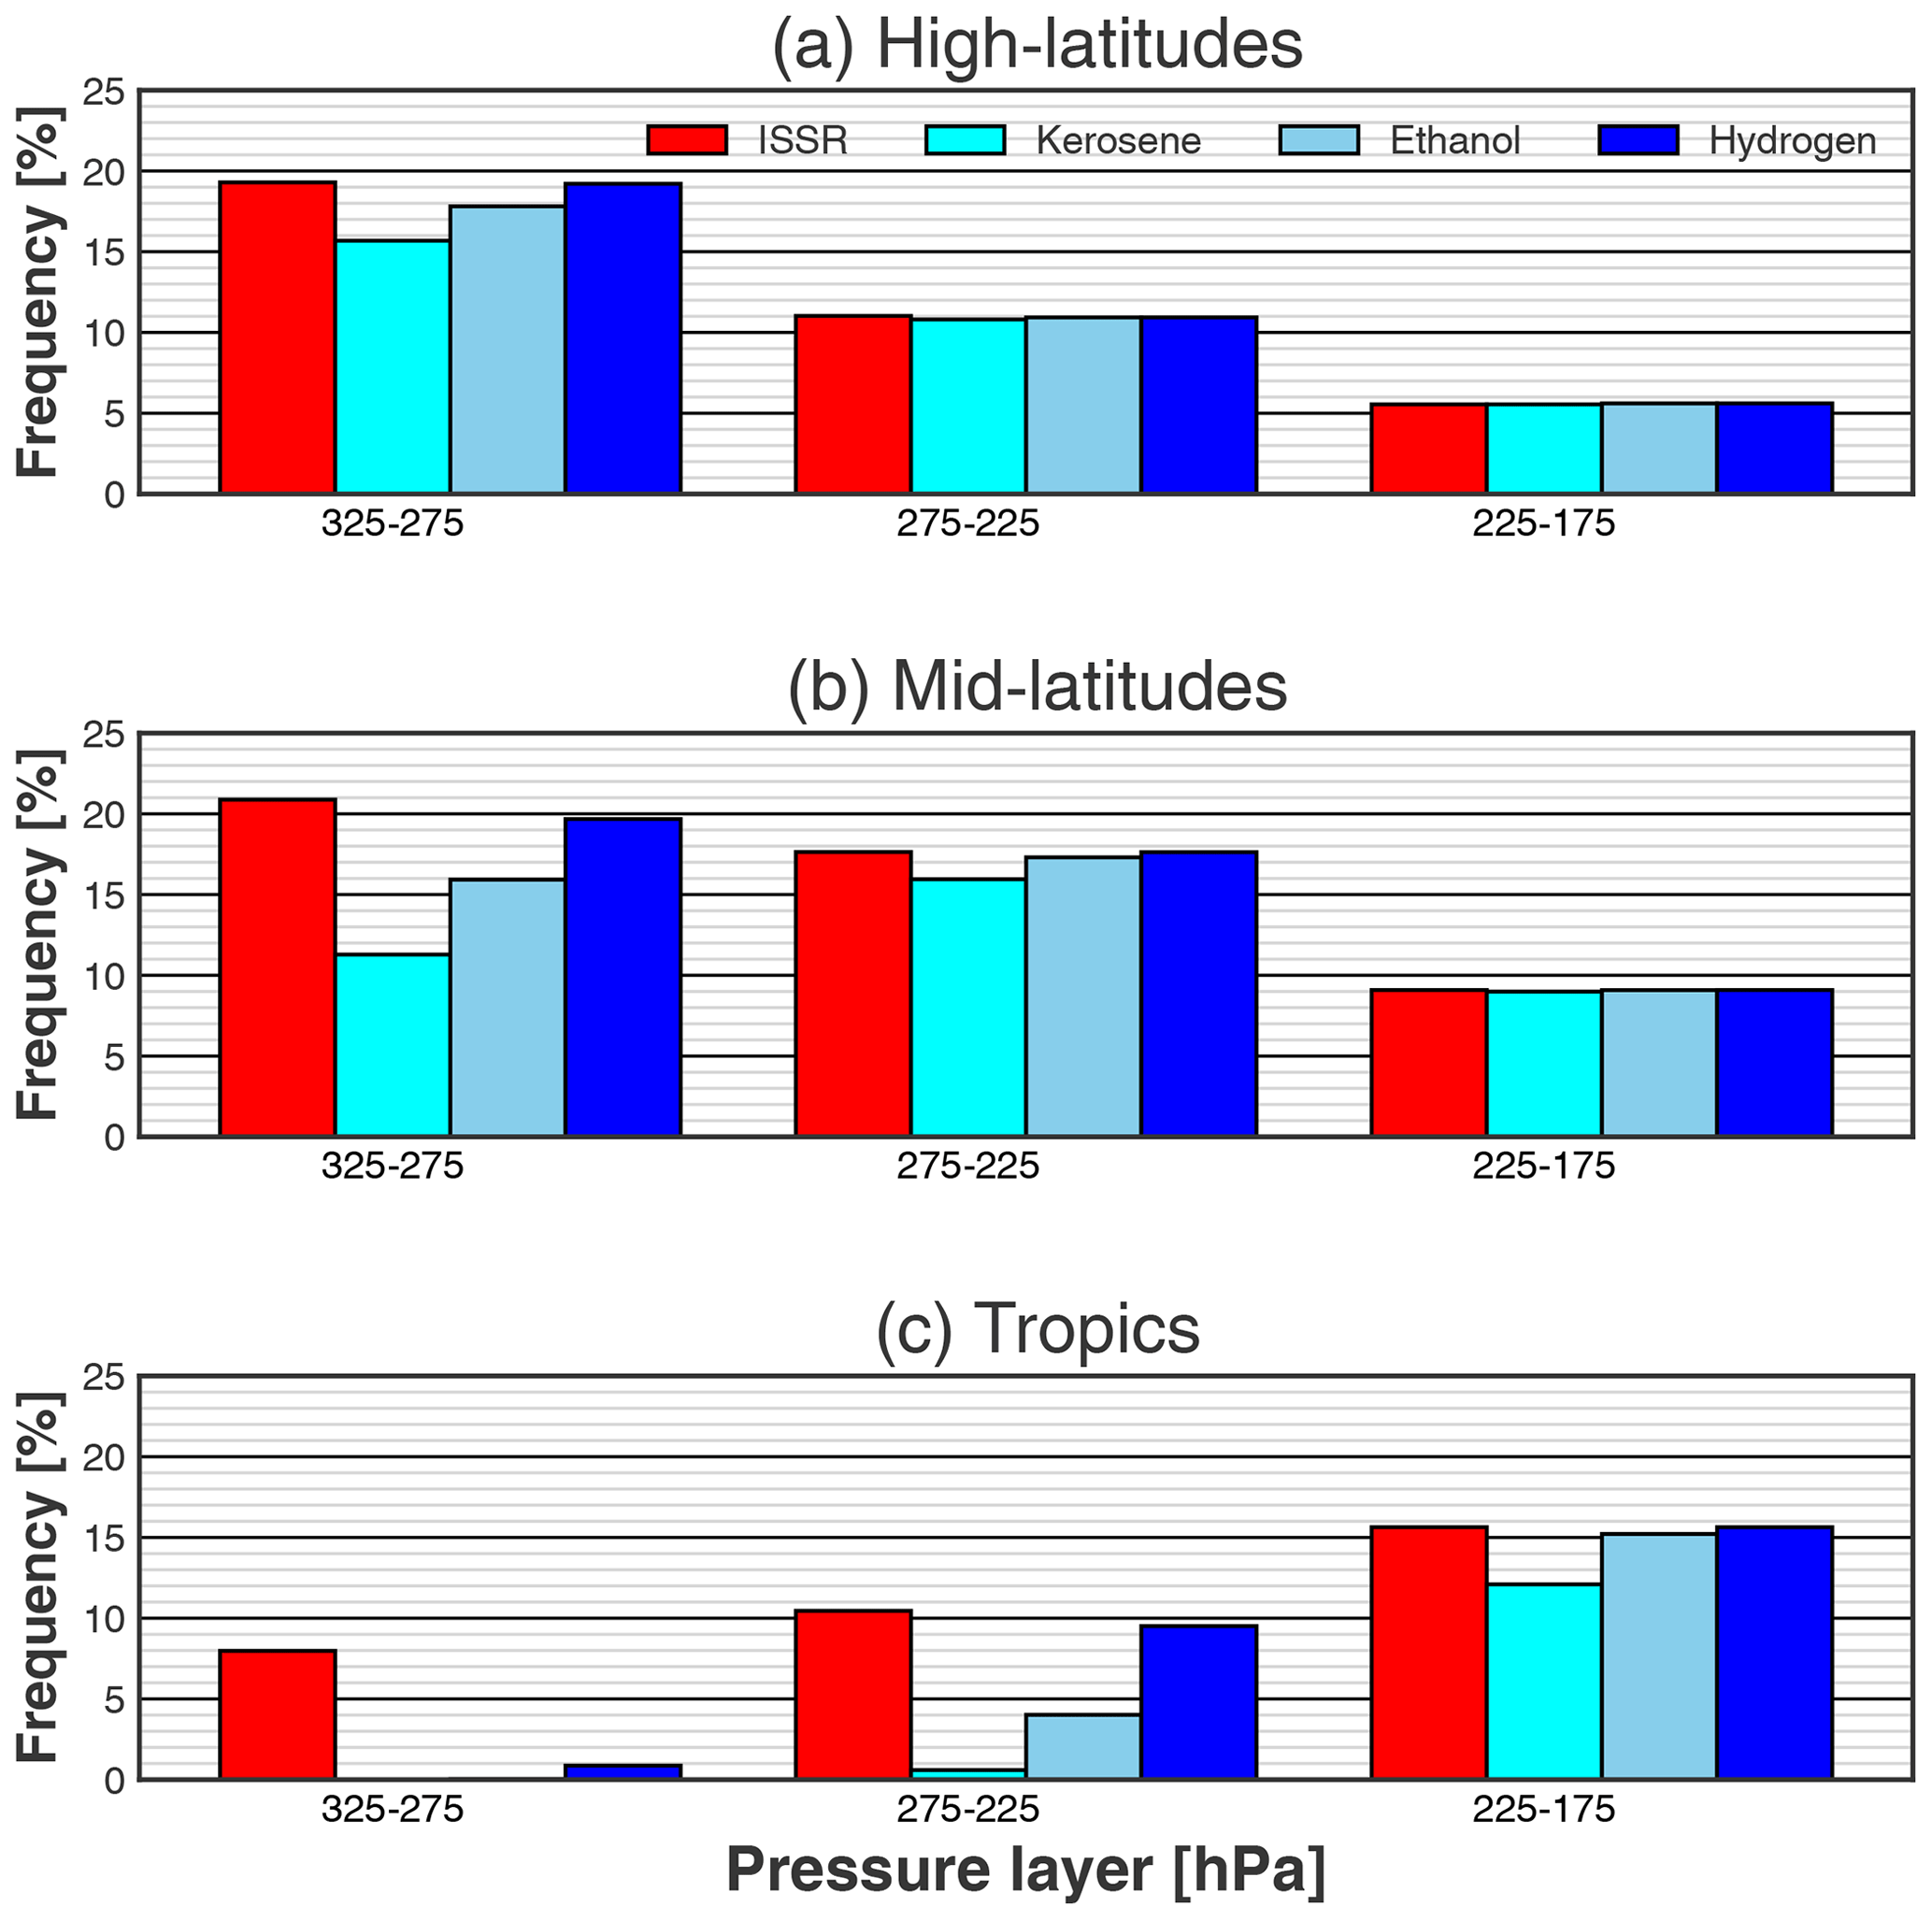
Figure 8Annual average frequency (%) of ISSRs (red) and of persistent contrail formation conditions for three pressure layers for kerosene (cyan), bioethanol (sky blue), and liquid hydrogen (blue) fuels over the (a) HLs and (b) MLs of the Northern Hemisphere and over (c) the tropics.
3.4.2 Frequency of contrail formation and fuel choice
Investigations are being carried out by the aviation industry about the possibility of using bioethanol (ethanol, hereafter) and liquid hydrogen (hydrogen, hereafter) as alternative fuels to kerosene. Ethanol and hydrogen are two fuels that could qualify as sustainable aviation fuels, and their use is expected to reduce aviation-induced CO2 emissions if they are generated from carbon-neutral sources (Ng et al., 2021). They could, however, produce contrails which have a net warming effect on the climate (see Sect. 1). Here, we used the SAc to test the impact of using ethanol or hydrogen on the formation of contrails compared to kerosene. The SAc also accounts for the aircraft-engine propulsion efficiency η (see Sect. 2.4), which is expected to continue to increase in the future (Sahoo et al., 2020). Since our study is focused only on the impact of fuel choice, we used a typical present-day aircraft-engine propulsion efficiency of 0.3. The SAc is applied to MOZAIC and IAGOS measurements, varying the specific combustion heat of the fuel Q and the emission index of water vapor for the EI of kerosene, ethanol, and hydrogen. The values of Q and EI are set to 43.2 MJ kg−1 and 1.25 kg kg−1 for kerosene, set to 27.2 MJ kg−1 and 1.17 kg kg−1 for ethanol, and set to 120 MJ kg−1 and 8.94 kg kg−1 for hydrogen (Schumann, 1996; Wolf et al., 2023).
The fraction of flying time during which aircraft can produce persistent contrails as a function of the fuel used is shown in Fig. 8. These fractions or frequencies depend on the region and the altitude of the flight. For instance, MOZAIC and IAGOS aircraft using kerosene and flying in the HLs in the 325–275 hPa pressure layer are estimated to have produced persistent contrails during 15.8 % of the flight time (Fig. 8a). This frequency decreases to 11 % and to 5.5 % for the 275–225 and 225–175 hPa layers, respectively. For the 325–275 hPa layer, MOZAIC and IAGOS aircraft would have formed persistent contrails more often if they had used hydrogen or ethanol (19.2 % and 18 %, respectively) instead of kerosene, while the fuel used has almost no effect for the 225–175 hPa layer (Fig. 8a). Comparing ISSR frequency shows that for the 325–275 hPa layer, aircraft that use kerosene fly in ice-supersaturated air masses for 3.4 % of the time without producing persistent contrails. This frequency is equal to 1.2 % for ethanol and 0 % for hydrogen, indicating that persistent contrails would form as soon as air masses are ice supersaturated when using hydrogen fuel. The impact of the fuel choice is much weaker for the 275–225 and 225–175 hPa layers (Fig. 8a).
Like in the HLs, the impact of switching from kerosene to ethanol or to hydrogen on the formation of persistent contrails decreases with decreasing pressure in the MLs. In these regions, with kerosene as fuel, aircraft produce persistent contrails more frequently (for 16 % of the flight time) in the 275–225 hPa layer (Fig. 8b), which corresponds to the pressure range where aircraft fly most (Fig. 2). This occurrence frequency is about 11.3 % in the 325–275 hPa layer and 9 % in the 225–175 hPa layer (Fig. 8b). Overall, the impact of switching fuel is highest for 325–275 hPa and lowest for 225–175 hPa (Fig. 8b).
Persistent contrail occurrence, as a function of fuel in the tropics, increases with decreasing pressure. More importantly, the impact of switching from kerosene to ethanol or hydrogen is most important at pressures in which aircraft fly the most (275–225 hPa) (Figs. 8c and 2c). At these altitudes, persistent contrails occur 0.7 % of the time with kerosene but would occur 4.0 % and 9.5 % of the time with ethanol and hydrogen, respectively (Fig. 8c). The change is also important in the 225–175 hPa layer (Fig. 8c).
.
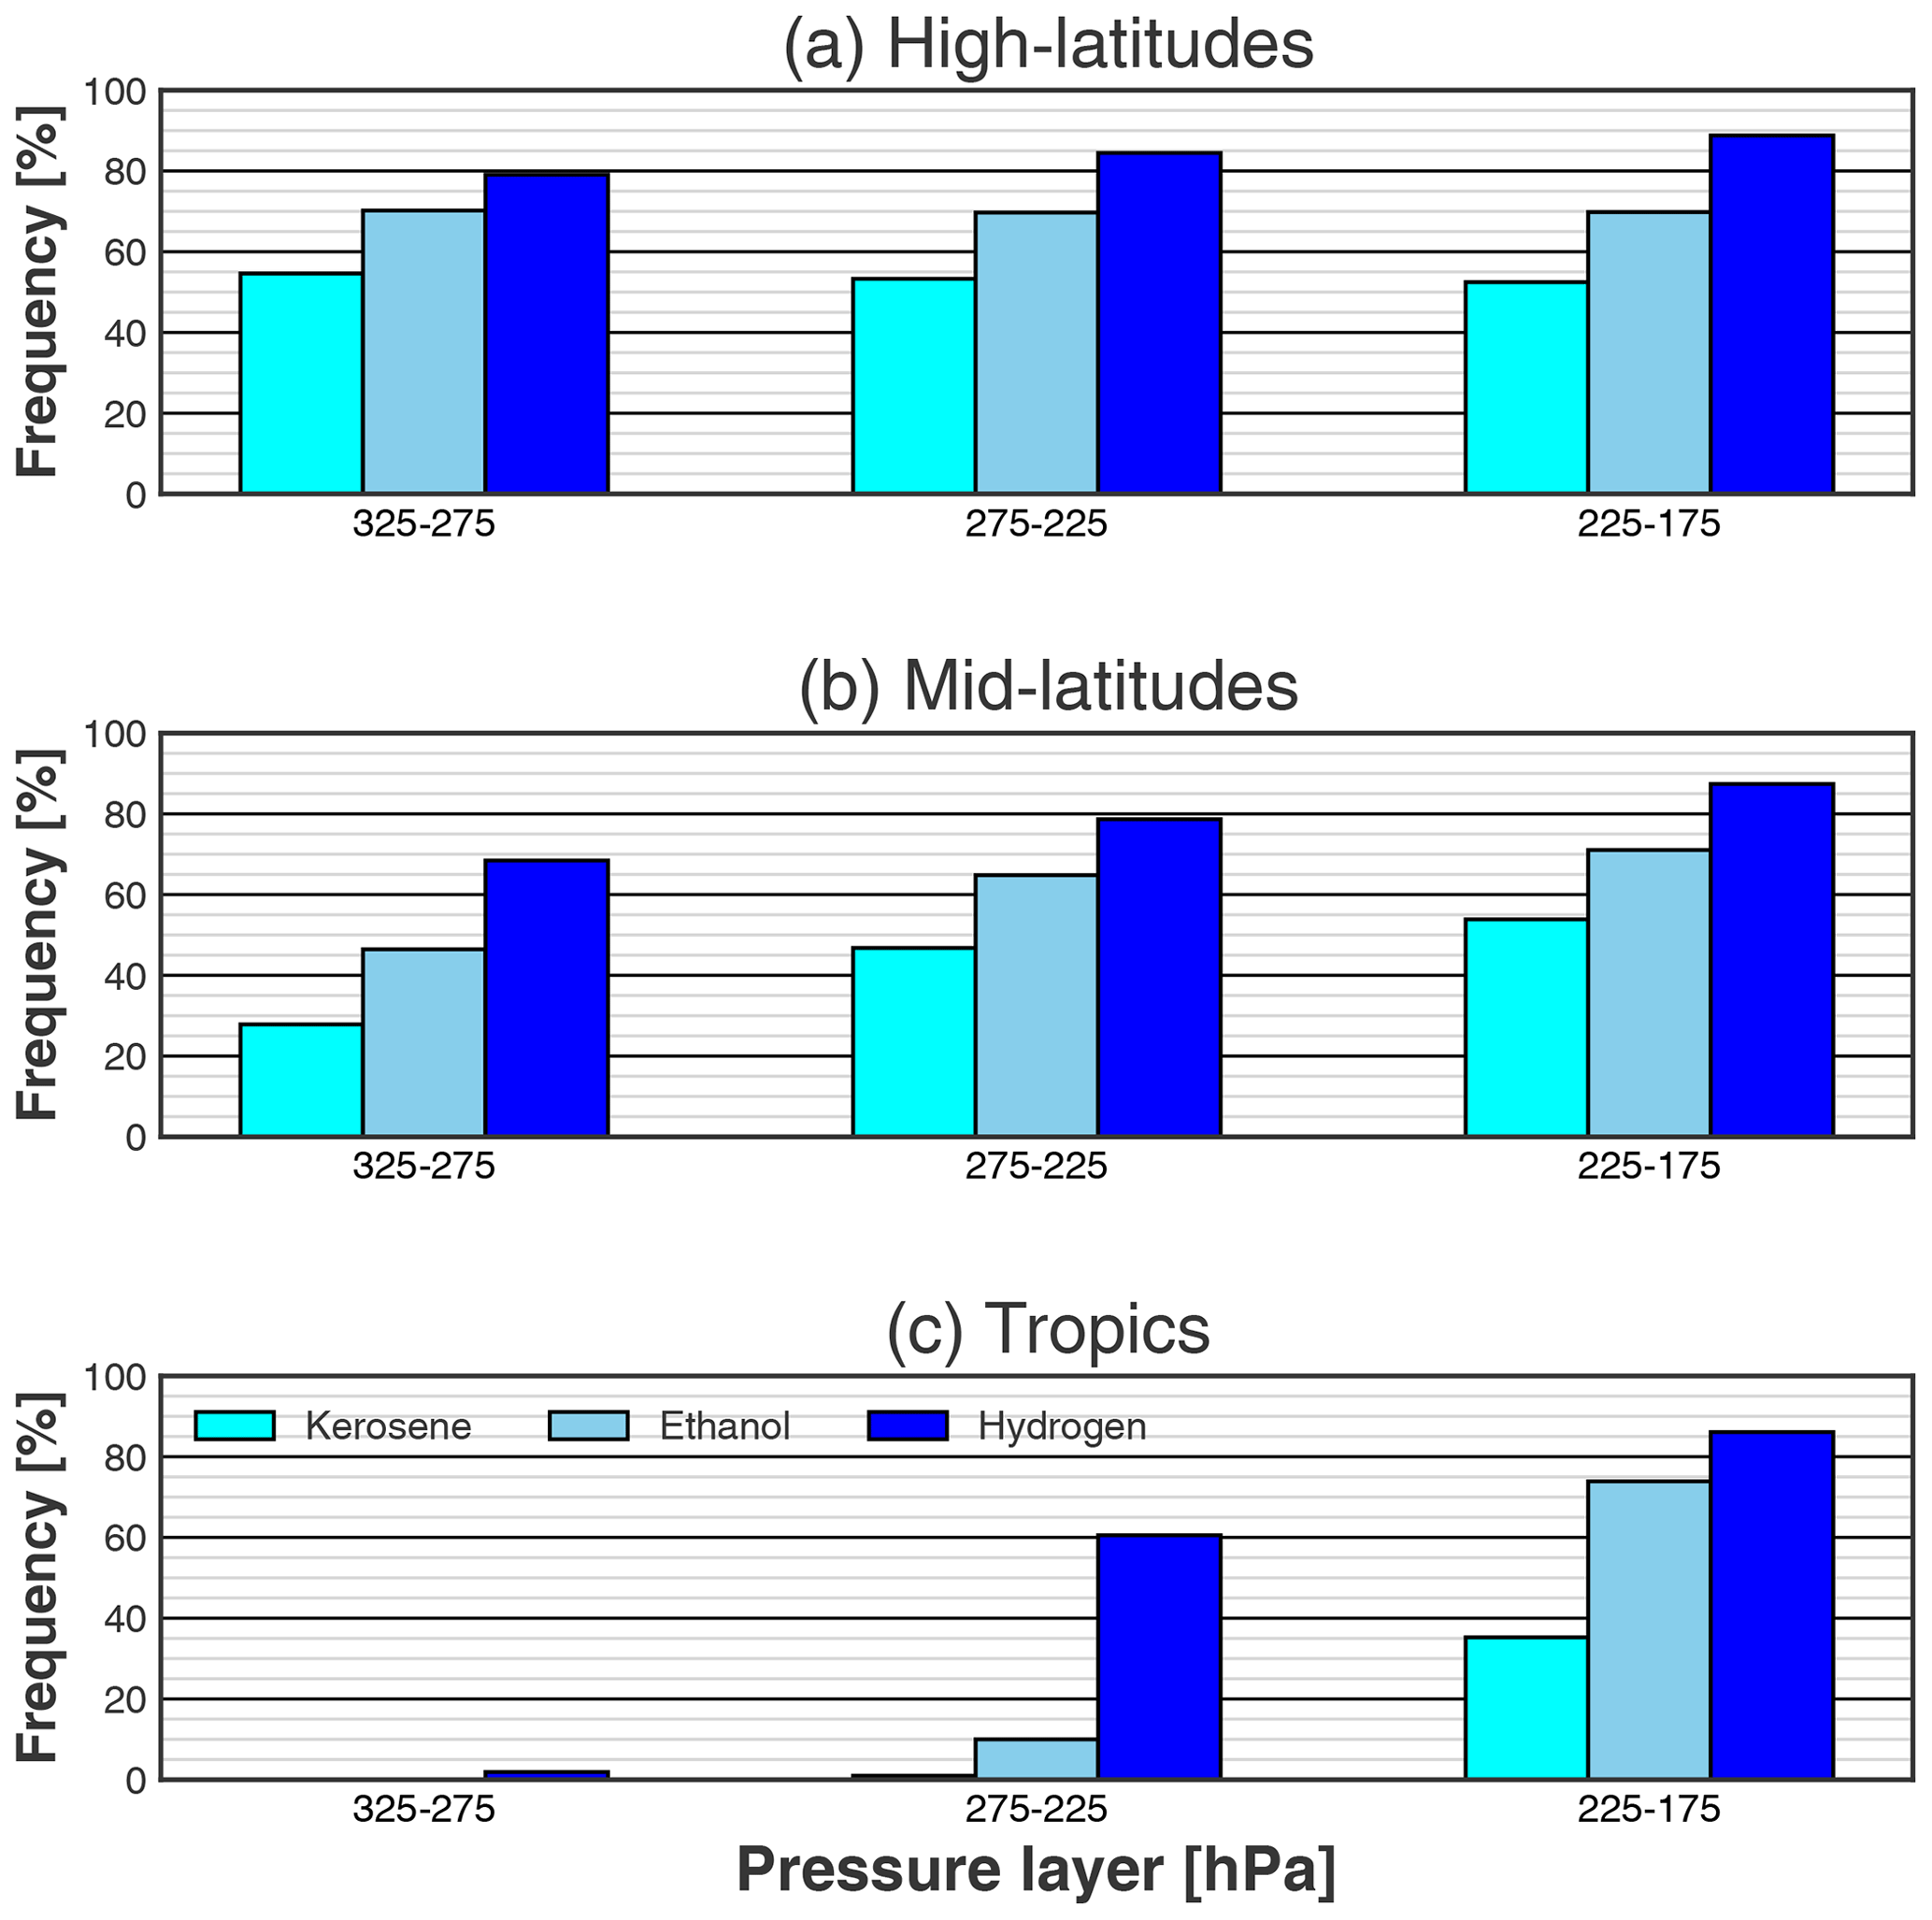
Figure 9Annual average frequency (%) of non-persistent contrail formation conditions for three pressure layers for kerosene (cyan), bioethanol (sky blue), and liquid hydrogen (blue) fuels over the (a) HLs and (b) MLs of the Northern Hemisphere and over (c) the tropics.
Overall, the differences in the impact of switching from kerosene to ethanol or to hydrogen are driven by temperature variability. The differences are higher in warmer seasons than in colder seasons (see Tables S1–S3 in the Supplement). At low ambient temperature, the contrail plume exceeds water saturation more readily due to the curvature of the vapor pressure curve, regardless of the fuel being considered. At higher ambient temperatures, the contrail plume may stay subsaturated with respect to liquid water if the ratio of EI to Q is low. Therefore, persistent contrails are less frequent with kerosene than with hydrogen and ethanol. With the warming of the upper troposphere expected as a result of climate change (Kumar et al., 2022), the impact of switching from kerosene to ethanol or to hydrogen on contrail formation frequency could further increase in the future, potentially affecting pressure layers (e.g., 225–175 hPa in the high and mid latitudes) and seasons (winter and spring in the high and mid latitudes) where it is low under present conditions.
The frequency of non-persistent contrail formation increases with latitude and with decreasing pressure between 325 and 175 hPa (Fig. 9). At these pressure layers, the impact of switching from kerosene to ethanol or to hydrogen is largest in the tropics (Fig. 9) and in summer, followed by autumn for the three regions (not shown). Our results confirm and generalize those of Wolf et al. (2023), who showed that the impact of switching from kerosene to ethanol or to hydrogen will be greater on the occurrence of non-persistent contrails than on persistent contrails using radiosoundings in the Paris region.
In the present study, we documented the properties of the atmospheric RHi PDF over the period 1995–2022 using the long-term MOZAIC and IAGOS observations made on board passenger aircraft. The frequency of the contrail formation conditions is also analyzed. The analyses are carried out over the HLs and MLs of the Northern Hemisphere and in the tropics, in the UT and the LS. The UT and LS pressure layer (325–175 hPa) is split into three pressure layers with a resolution of 50 hPa. Measurements with an ozone volume mixing ratio below 130 ppb are flagged as belonging to the UT, while those with an ozone volume mixing ratio above 130 ppb are flagged as LS measurements. RHi PDF properties are also documented in clear-sky and in cirrus cloud conditions. We used ice crystal number concentration thresholds of 0.001, 0.015, and 0.05 particles cm−3 for cloud detection. The contrail formation conditions have been detected using the Schmidt–Appleman criterion considering an aircraft-engine propulsion efficiency of 0.3. The main results of our analysis are as follows:
-
The cirrus clouds fraction sampled by IAGOS aircraft depends on the detection threshold and the location. Cirrus clouds are more frequent in the tropics than in the MLs, and their frequency decreases if a higher detection threshold is chosen. Cirrus clouds are characterized by a higher amount of ice supersaturation than clear sky, which shifts the overall RHi PDF towards more ice supersaturation with a peak around 100 %.
-
We characterized the PDF of RHi in the UT. In the HLs, the MLs, and the tropics, the PDF decreases exponentially with increasing RHi in ice supersaturation conditions. In subsaturated conditions, it increases exponentially with RHi in the HLs and the MLs, while it decreases exponentially in the tropics. Combining these different shapes of subsaturated RHi PDF in the tropics and in mid and high latitudes leads to a global tropospheric RHi PDF that follows an almost uniform distribution.
-
The RHi PDF in the LS is different from that in the UT in the HLs and MLs. It decreases exponentially with increasing RHi in both sub- and supersaturated regions. However, the slope of the decrease in the PDF is higher for supersaturated conditions than it is for subsaturated conditions. The combination of these different shapes of subsaturated RHi PDF in the LS and in the UT leads to a bimodal PDF in the MLs and in the HLs.
-
The probability of forming non-persistent and persistent contrails by aircraft using bioethanol and liquid hydrogen instead of kerosene was also analyzed. Both are candidate fuels for reducing the climate impact of aviation. We found that these alternative fuels are more likely to produce contrails than kerosene. However, the magnitude of their impact on persistent contrail formation depends on pressure level and latitude. In the HLs of the Northern Hemisphere, switching from kerosene to liquid hydrogen or bioethanol has very little impact on the persistent contrail frequency for the 275–225 and 225–175 hPa layers. The reason is that, in the HLs of the Northern Hemisphere, aircraft running on kerosene already form persistent contrails nearly every time they encounter air masses that are supersaturated with respect to ice at these altitudes. The same conclusions are found for 225–175 hPa in the MLs. Overall, the impact of switching from kerosene to liquid hydrogen or bioethanol on persistent contrail occurrence decreases from the tropics to high-latitude regions. It decreases with pressure between 325 and 175 hPa except in the tropics. The impact of switching from kerosene to liquid hydrogen will be more important for non-persistent contrails.
This study updates and completes some aspects of the studies of Gierens et al. (1999) and Spichtinger et al. (2003a) regarding the characteristics of the RHi PDF. We draw several recommendations from our study. Comparisons between models and observations need to be performed for the UT and the LS separately and preferably over different regions and pressure levels, distinguishing cloud-free and cloudy conditions. Models that are calibrated to reproduce the global RHi PDF from MOZAIC and IAGOS data may do so for the wrong reasons. Similarly, it is important that observing systems designed to monitor UTLS humidity have the capability to distinguish the UT from the LS. This may be a challenge for satellite-based systems, which may not have a sufficiently good vertical resolution. Finally, studies on the impact on the contrail occurrence of switching from fossil kerosene to more sustainable fuels must be conducted in various meteorological conditions.
The Python codes used to perform the analysis are available on request from the corresponding author.
The MOZAIC and IAGOS data can be downloaded from the IAGOS data portal at https://doi.org/10.25326/20 (Boulanger et al., 2020).
The supplement related to this article is available online at: https://doi.org/10.5194/acp-24-5495-2024-supplement.
SS, OB, and NB designed the study. SS carried out the analysis and the preparation of the manuscript. OB and AB helped with the analysis. OB, AB, NB, and KW contributed to the preparation of the manuscript. SR provided the MOZAIC and IAGOS data.
The contact author has declared that none of the authors has any competing interests.
Publisher's note: Copernicus Publications remains neutral with regard to jurisdictional claims made in the text, published maps, institutional affiliations, or any other geographical representation in this paper. While Copernicus Publications makes every effort to include appropriate place names, the final responsibility lies with the authors.
We acknowledge the strong support of the European Commission, Airbus, and the airlines (Deutsche Lufthansa, Air France, Austrian Airlines, Air Namibia, Cathay Pacific, Iberia Airlines, China Airlines, Hawaiian Airlines, Eurowings Discover, and Air Canada) that have carried the MOZAIC or IAGOS equipment and performed maintenance since 1994. IAGOS has been funded by the European Union projects IAGOS–DS and IAGOS–ERI, INSU-CNRS (France), Météo-France, Université Paul Sabatier (Toulouse, France), and Forschungszentrum Jülich (FZJ, Jülich, Germany).
This research has been supported by the French Ministère de la Transition écologique et Solidaire (no. DGAC 382 N2021-39), with support from France's Plan National de Relance et de Resilience (PNRR) and the European Union's NextGenerationEU.
This paper was edited by Martina Krämer and reviewed by two anonymous referees.
Appleman, H.: The formation of exhaust condensation trails by jet aircraft, B. Am. Meteorol. Soc., 34, 14–20, https://doi.org/10.1175/1520-0477-34.1.14, 1953. a, b
Beswick, K., Baumgardner, D., Gallagher, M., Raga, G. B., Minnis, P., Spangenberg, D. A., Volz-Thomas, A., Nedelec, P., and Wang, K.-Y.: Properties of small cirrus ice crystals from commercial aircraft measurements and implications for flight operations, Tellus B, 67, 27876, https://doi.org/10.3402/tellusb.v67.27876, 2015. a
Bickel, M.: Climate impact of contrail cirrus, DLR-Forschungsbericht DLR-FB-2023-14, Dissertation, PhD thesis, Ludwig-Maximilians-Universität München, p. 133, https://doi.org/10.57676/mzmg-r403, 2023. a
Boulanger, D., Thouret, V., and Petzold, A.: IAGOS Data Portal, AERIS [data set], https://doi.org/10.25326/20, 2020. a
Dekoutsidis, G., Groß, S., Wirth, M., Krämer, M., and Rolf, C.: Characteristics of supersaturation in midlatitude cirrus clouds and their adjacent cloud-free air, Atmos. Chem. Phys., 23, 3103–3117, https://doi.org/10.5194/acp-23-3103-2023, 2023. a
Diao, M., Zondlo, M. A., Heymsfield, A. J., Avallone, L., Paige, M., Beaton, S., Campos, T., and Rogers, D.: Cloud-scale ice-supersaturated regions spatially correlate with high water vapor heterogeneities, Atmos. Chem. Phys., 14, 2639–2656, https://doi.org/10.5194/acp-14-2639-2014, 2014. a, b, c
Duhnke, K., Wefers, J., Speth, P., Kley, D., Marenco, A., and Smit, H. G.: Untersuchung der in MOZAIC gemessenen Ozon-und Wasserdampfverteilung im polaren Strahlstrom über dem Nordatlantik, Tech. rep., Forschungszentrum Jülich, https://juser.fz-juelich.de/record/864943 (last access: 20 August 2023), 1998. a
Genthon, C., Piard, L., Vignon, E., Madeleine, J.-B., Casado, M., and Gallée, H.: Atmospheric moisture supersaturation in the near-surface atmosphere at Dome C, Antarctic Plateau, Atmos. Chem. Phys., 17, 691–704, https://doi.org/10.5194/acp-17-691-2017, 2017. a
Gierens, K. and Brinkop, S.: Dynamical characteristics of ice supersaturated regions, Atmos. Chem. Phys., 12, 11933–11942, https://doi.org/10.5194/acp-12-11933-2012, 2012. a
Gierens, K., Schumann, U., Helten, M., Smit, H., and Marenco, A.: A distribution law for relative humidity in the upper troposphere and lower stratosphere derived from three years of MOZAIC measurements, Ann. Geophys., 17, 1218–1226, https://doi.org/10.1007/s00585-999-1218-7, 1999. a, b, c, d, e, f, g, h, i, j, k
Gierens, K., Spichtinger, P., and Schumann, U.: Ice supersaturation, in: Atmospheric Physics: Background–Methods–Trends, Springer, 135–150, https://doi.org/10.1007/978-3-642-30183-4, 2012. a
Heymsfield, A., Krämer, M., Luebke, A., Brown, P., Cziczo, D., Franklin, C., Lawson, P., Lohmann, U., McFarquhar, G., Ulanowski, Z., and Van Tricht, K.: Cirrus clouds, Meteor. Monogr., 58, 2.1–62.26, https://doi.org/10.1175/AMSMONOGRAPHS-D-16-0010.1, 2017. a, b, c
Kahn, B. H., Gettelman, A., Fetzer, E. J., Eldering, A., and Liang, C. K.: Cloudy and clear-sky relative humidity in the upper troposphere observed by the A-train, J. Geophys. Res., 114, D00H02, https://doi.org/10.1029/2009JD011738, 2009. a, b, c
Kanji, Z. A., Ladino, L. A., Wex, H., Boose, Y., Burkert-Kohn, M., Cziczo, D. J., and Krämer, M.: Overview of ice nucleating particles, Meteor. Monogr., 58, 1.1–1.33, https://doi.org/10.1175/AMSMONOGRAPHS-D-16-0006.1, 2017. a, b
Kärcher, B.: Formation and radiative forcing of contrail cirrus, Nat. Commun., 9, 1824, https://doi.org/10.1038/s41467-018-04068-0, 2018. a, b, c
Krämer, M., Schiller, C., Afchine, A., Bauer, R., Gensch, I., Mangold, A., Schlicht, S., Spelten, N., Sitnikov, N., Borrmann, S., de Reus, M., and Spichtinger, P.: Ice supersaturations and cirrus cloud crystal numbers, Atmos. Chem. Phys., 9, 3505–3522, https://doi.org/10.5194/acp-9-3505-2009, 2009. a, b
Krämer, M., Rolf, C., Luebke, A., Afchine, A., Spelten, N., Costa, A., Meyer, J., Zöger, M., Smith, J., Herman, R. L., Buchholz, B., Ebert, V., Baumgardner, D., Borrmann, S., Klingebiel, M., and Avallone, L.: A microphysics guide to cirrus clouds – Part 1: Cirrus types, Atmos. Chem. Phys., 16, 3463–3483, https://doi.org/10.5194/acp-16-3463-2016, 2016. a, b, c
Kumar, T. L., Durga, G. P., Aravindhavel, A., Barbosa, H., and Rao, D. N.: Analysis of tropospheric warming and stratospheric cooling in the present and future climate from the suite of CMIP6 models, Theor. Appl. Climatol., 149, 1717–1726, https://doi.org/10.1007/s00704-022-04136-y, 2022. a
Lamquin, N., Stubenrauch, C., Gierens, K., Burkhardt, U., and Smit, H.: A global climatology of upper-tropospheric ice supersaturation occurrence inferred from the Atmospheric Infrared Sounder calibrated by MOZAIC, Atmos. Chem. Phys., 12, 381–405, https://doi.org/10.5194/acp-12-381-2012, 2012. a, b, c, d, e, f, g
Lee, D. S., Fahey, D. W., Skowron, A., Allen, M. R., Burkhardt, U., Chen, Q., Doherty, S. J., Freeman, S., Forster, P. M., Fuglestvedt, J., Gettelman, A., De León, R. R., Lim, L. L., Lund, M. T., Millar, R. J., Owen, B., Penner, J. E., Pitari, G., Prather, M. J., Sausen, R., and Wilcox, L. J.: The contribution of global aviation to anthropogenic climate forcing for 2000 to 2018, Atmos. Environ., 244, 117834, https://doi.org/10.1016/j.atmosenv.2020.117834, 2021. a, b, c, d, e
Li, Y., Mahnke, C., Rohs, S., Bundke, U., Spelten, N., Dekoutsidis, G., Groß, S., Voigt, C., Schumann, U., Petzold, A., and Krämer, M.: Upper-tropospheric slightly ice-subsaturated regions: frequency of occurrence and statistical evidence for the appearance of contrail cirrus, Atmos. Chem. Phys., 23, 2251–2271, https://doi.org/10.5194/acp-23-2251-2023, 2023. a, b
Liu, Y., Xu, T., and Liu, J.: Characteristics of the seasonal variation of the global tropopause revealed by COSMIC/GPS data, Adv. Space Res., 54, 2274–2285, https://doi.org/10.1016/j.asr.2014.08.020, 2014. a
Lloyd, G., Gallagher, M., Choularton, T., Krämer, M., Andreas, P., and Baumgardner, D.: In situ measurements of cirrus clouds on a global scale, Atmosphere, 12, 41, https://doi.org/10.3390/atmos12010041, 2020. a
Marenco, A., Thouret, V., Nédélec, P., Smit, H., Helten, M., Kley, D., Karcher, F., Simon, P., Law, K., Pyle, J., Poschmann, G., Von Wrede, R., Hume, C., and Cook, T.: Measurement of ozone and water vapor by Airbus in-service aircraft: The MOZAIC airborne program, An overview, J. Geophys. Res.-Atmos., 103, 25631–25642, https://doi.org/10.1029/98JD00977, 1998. a
Ng, K. S., Farooq, D., and Yang, A.: Global biorenewable development strategies for sustainable aviation fuel production, Renew. Sustain. Energ. Rev., 150, 111502, https://doi.org/10.1016/j.rser.2021.111502, 2021. a
Ovarlez, J., Gayet, J.-F., Gierens, K., Ström, J., Ovarlez, H., Auriol, F., Busen, R., and Schumann, U.: Water vapour measurements inside cirrus clouds in Northern and Southern hemispheres during INCA, Geophys. Res. Lett., 29, 60-1–60-4, https://doi.org/10.1029/2001GL014440, 2002. a
Peixoto, J. P. and Oort, A. H.: Physics of Climate, in: Chap. 2, 1st Edn., American Institute of Physics, New York, NY, USA, 101–125, ISBN 9780883187128, 1992. a
Petzold, A., Thouret, V., Gerbig, C., Zahn, A., Brenninkmeijer, C. A., Gallagher, M., Hermann, M., Pontaud, M., Ziereis, H., Boulanger, D., Marshall, J., Nédélec, P., Smit, H. G. J., Friess, U., Flaud, J.-M., Wahner, A., Cammas, J.-P., Volz-Thomas, A., and IAGOS Team: Global-scale atmosphere monitoring by in-service aircraft–current achievements and future prospects of the European Research Infrastructure IAGOS, Tellus B, 67, 28452, https://doi.org/10.3402/tellusb.v67.28452, 2015. a
Petzold, A., Krämer, M., Neis, P., Rolf, C., Rohs, S., Berkes, F., Smit, H. G., Gallagher, M., Beswick, K., Lloyd, G., Baumgardner, D., Spichtinger, P., Nédélec, P., Ebert, V., Buchholz, B., Riese, M., and Wahner, A.: Upper tropospheric water vapour and its interaction with cirrus clouds as seen from IAGOS long-term routine in situ observations, Faraday Discuss., 200, 229–249, 2017. a, b, c, d, e, f, g, h, i, j
Petzold, A., Neis, P., Rütimann, M., Rohs, S., Berkes, F., Smit, H. G. J., Krämer, M., Spelten, N., Spichtinger, P., Nédélec, P., and Wahner, A.: Ice-supersaturated air masses in the northern mid-latitudes from regular in situ observations by passenger aircraft: vertical distribution, seasonality and tropospheric fingerprint, Atmos. Chem. Phys., 20, 8157–8179, https://doi.org/10.5194/acp-20-8157-2020, 2020. a, b, c, d, e, f, g, h, i, j
Ponater, M., Bickel, M., Bock, L., and Burkhardt, U.: Towards determining the contrail cirrus efficacy, Aerospace, 8, 42, https://doi.org/10.3390/aerospace8020042, 2021. a
Rap, A., Forster, P., Jones, A., Boucher, O., Haywood, J., Bellouin, N., and De Leon, R.: Parameterization of contrails in the UK Met Office climate model, J. Geophys. Res., 115, D10205, https://doi.org/10.1029/2009JD012443, 2010. a, b
Reutter, P., Neis, P., Rohs, S., and Sauvage, B.: Ice supersaturated regions: properties and validation of ERA-Interim reanalysis with IAGOS in situ water vapour measurements, Atmos. Chem. Phys., 20, 787–804, https://doi.org/10.5194/acp-20-787-2020, 2020. a, b, c, d
Sahoo, S., Zhao, X., and Kyprianidis, K.: A review of concepts, benefits, and challenges for future electrical propulsion-based aircraft, Aerospace, 7, 44, https://doi.org/10.3390/aerospace7040044, 2020. a
Schmidt, E.: Die Entstehung von Eisnebel aus den Auspuffgasen von Flugmotoren, Schriften der Deutschen Akademie der Luftfahrtforschung, Heft 44, 5, Verlag R. Oldenbourg, München, 1–15, https://elib.dlr.de/107948/ (last access: 2 November 2023), 1941. a, b
Schumann, U.: On conditions for contrail formation from aircraft exhausts, Meteorol. Z., 5, 4–23, https://doi.org/10.1127/metz/5/1996/4, 1996. a, b, c, d, e, f, g, h, i, j, k
Schumann, U.: A contrail cirrus prediction model, Geosci. Model Dev., 5, 543–580, https://doi.org/10.5194/gmd-5-543-2012, 2012. a
Schumann, U., Bugliaro, L., Dörnbrack, A., Baumann, R., and Voigt, C.: Aviation contrail cirrus and radiative forcing over Europe during 6 months of COVID-19, J. Geophys. Res., 48, e2021GL092771, https://doi.org/10.1029/2021GL092771, 2021. a
Smit, H. G., Rohs, S., Neis, P., Boulanger, D., Krämer, M., Wahner, A., and Petzold, A.: Reanalysis of upper troposphere humidity data from the MOZAIC programme for the period 1994 to 2009, Atmos. Chem. Phys., 14, 13241–13255, https://doi.org/10.5194/acp-14-13241-2014, 2014. a, b
Sourdeval, O., Gryspeerdt, E., Krämer, M., Goren, T., Delanoë, J., Afchine, A., Hemmer, F., and Quaas, J.: Ice crystal number concentration estimates from lidar–radar satellite remote sensing – Part 1: Method and evaluation, Atmos. Chem. Phys., 18, 14327–14350, https://doi.org/10.5194/acp-18-14327-2018, 2018. a
Sperber, D. and Gierens, K.: Towards a more reliable forecast of ice supersaturation: concept of a one-moment ice-cloud scheme that avoids saturation adjustment, Atmos. Chem. Phys., 23, 15609–15627, https://doi.org/10.5194/acp-23-15609-2023, 2023. a
Spichtinger, P., Gierens, K., Leiterer, U., and Dier, H.: Ice supersaturation in the tropopause region over Lindenberg, Germany, Meteorol. Z., 12, 143–156, https://doi.org/10.1256/qj.02.141, 2003a. a, b, c, d, e
Spichtinger, P., Gierens, K., and Read, W.: The global distribution of ice-supersaturated regions as seen by the Microwave Limb Sounder, Q. J. Roy. Meteorol. Soc., 129, 3391–3410, https://doi.org/10.1256/qj.02.141, 2003b. a
Wolf, K., Bellouin, N., and Boucher, O.: Long-term upper-troposphere climatology of potential contrail occurrence over the Paris area derived from radiosonde observations, Atmos. Chem. Phys., 23, 287–309, https://doi.org/10.5194/acp-23-287-2023, 2023. a, b, c, d