the Creative Commons Attribution 4.0 License.
the Creative Commons Attribution 4.0 License.
 | 27 Jan 2023
Long-term monitoring of cloud water chemistry at Whiteface Mountain: the emergence of a new chemical regime
Christopher E. Lawrence
Paul Casson
Richard Brandt
James J. Schwab
James E. Dukett
Phil Snyder
Elizabeth Yerger
Daniel Kelting
Trevor C. VandenBoer
Atmospheric aqueous chemistry can have profound effects on our environment. The importance of chemistry within the atmospheric aqueous phase started gaining widespread attention in the 1970s as there was growing concern over the negative impacts on ecosystem health from acid deposition. Research at mountaintop observatories including Whiteface Mountain (WFM) showed that gas phase sulfur dioxide emissions react in cloud droplets to form sulfuric acid, which also impacted air quality by increasing aerosol mass loadings. The current study updates the long-term trends in cloud water composition at WFM for the period 1994–2021, with special consideration given to samples that have traditionally been excluded from analysis due to inorganic charge imbalance. We emphasize three major findings: (1) a growing abundance of total organic carbon (TOC), with annual median concentrations more than doubling since measurements began in 2009, (2) a growing imbalance between the measured inorganic cations and anions, consistent with independent rain water observations, implying that a substantial fraction of anions are no longer being measured with the historical suite of measurements, and (3) a growing number of samples exhibiting greater ammonium concentrations than sulfate plus nitrate concentrations, which now routinely describes over one-third of samples. Organic acids are identified as the most likely candidates for the missing anions, since the measured inorganic ion imbalance correlates strongly with measured TOC concentrations. An “inferred cloud droplet pH” is introduced to estimate the pH of the vast majority of cloud droplets as they reside in the atmosphere using a simple method to account for the expected mixing state of calcium and magnesium containing particles. While the inferred cloud droplet pH closely matches the measured bulk cloud water pH during the early years of the cloud water monitoring program, a growing discrepancy is found over the latter half of the record. We interpret these observations as indicating a growing fraction of cloud droplet acidity that is no longer accounted for by the measured sulfate, nitrate and ammonium concentrations. Altogether, these observations indicate that the chemical system at WFM has shifted away from a system dominated by sulfate to a system controlled by base cations, reactive nitrogen species and organic compounds. Further research is required to understand the effects on air quality, climate and ecosystem health.
- Article
(3068 KB) - Full-text XML
-
Supplement
(3286 KB) - BibTeX
- EndNote


Whiteface Mountain (WFM) has been an important site for cloud water chemistry measurements dating back to the 1980s (Falconer and Falconer, 1980; Mohnen and Vong, 1993), with routine summertime cloud water monitoring beginning in 1994. Through field experiments at WFM and other locations in the eastern US, researchers established that gas phase sulfur dioxide (SO2), originating largely from fossil fuel combustion, can dissolve in cloud droplets and undergo aqueous oxidation to form sulfate (SO). This chemistry has contributed substantially to particulate mass, posing significant health risks and contributing to cooling effects on the climate (Kiehl and Briegleb, 1993; Pope and Dockery, 2006; Myhre et al., 2013). Sulfate and nitrate (NO) are also the major causes behind acid deposition, a process that can have detrimental ecosystem effects such as decreased aquatic biodiversity, calcium depletion from soils, release of toxic aluminum (Gorham, 1998; Likens et al., 1998; Driscoll et al., 2001; Menz and Seip, 2004) and deterioration of building materials (Xie et al., 2004; Bravo et al., 2006). These growing societal and environmental problems helped influence and shape amendments to the Clean Air Act in the 1990s focusing on the criteria air pollutants SO2 and NOx. Starting in 1994, the U.S. Environmental Protection Agency (EPA) formed a network of the mountaintop sites in the eastern US through the mountain acid deposition program (MADPro) to begin monitoring the progress of Clean Air Act amendments (Baumgardner et al., 2003). Regulation of these emissions proved to be successful, as SO2 and to a lesser extent NOx have decreased for several decades in the US (US EPA, 2019), leading to decreases in acid rain throughout the eastern US, including New York state (Rattigan et al., 2017). Substantial decreases were also observed in cloud water acidity at WFM (Dukett et al., 2011), corresponding to decreases in particulate matter concentrations of SO and NO (Schwab et al., 2016b). Many ecosystems in the Adirondacks previously impacted by acid deposition have shown signs of recovery (Driscoll et al., 2016).
Routine long-term measurements of cloud water or fog water are not widely available, but other locations worldwide have seen similar long-term reductions in SO and/or NO concentrations with concomitant decrease in acidity, including California's central valley (Herckes et al., 2015), Pennsylvania (Straub, 2017), New Hampshire (Murray et al., 2013), the UK (Cape et al., 2015), Italy (Giulianelli et al., 2014), France (Deguillaume et al., 2014) and Japan (Yamaguchi et al., 2015; Watanabe et al., 2022). A thorough review of both long-term and short-term cloud and fog chemistry studies has been recently compiled by Isil et al. (2022).
The significant reductions in SO and NO, and therefore cloud water acidity, at WFM indicate a dramatically changed chemical system, with a growing contribution from less well-understood and more labile analytes such as organic compounds and ammonium (NH). Organic compounds are found ubiquitously throughout the atmosphere, playing key roles in ozone formation and aerosol physicochemical properties such as hygroscopicity, optical properties and reactivity (Jimenez et al., 2009). During a 2 week pilot study at WFM in 2017, organic matter was shown to comprise as much as 93 %, and an average of 78 %, of submicron aerosol mass (Zhang et al., 2019). Similarly, total organic carbon (TOC), the sum of soluble and insoluble OC, is a major component within cloud and fog droplets (Herckes et al., 2013). Organic compounds are chemically complex, containing thousands of compounds, all with different chemical and physical properties spanning orders of magnitude in volatility and solubility, which dictates the chemical pathways they can take part in (Jimenez et al., 2009), making their identification and potential environmental effects challenging to determine (Thornton et al., 2020). The controlling factors for TOC concentrations in cloud droplets are highly uncertain (Ervens, 2015). Organic compounds can also interact with inorganic ions within cloud droplets to form compounds like organic salts, organic nitrogen and organic sulfur compounds (McNeill, 2015).
Reactive nitrogen deposition, from both reduced and oxidized forms, has also been gaining increased attention (Kanakidou et al., 2016; Stevens et al., 2018). While nitrogen can act as a nutrient in ecosystems that are nitrogen limited, excess deposition can lead to harmful environmental effects such as soil acidification by leaching out buffering base cations like calcium (Ca2+), magnesium (Mg2+) and potassium (K+), and through nitrification, potentially mobilizing toxic metals such as aluminum (Lawrence and David, 1997; Tian and Niu, 2015). Nitrogen deposition, when combined with other factors, can also contribute to harmful algal blooms, which threaten aquatic ecosystems and human health (Paerl and Otten, 2013). A significant fraction of total nitrogen (TN) in cloud and rain water is organic nitrogen (ON), typically comprising ∼ 30 % of water soluble nitrogen (Cape et al., 2011). Much like organic carbon, the sources of organic nitrogen, as well as the chemical aging, deposition and ecosystem effects, are highly uncertain and require more research. Ammonia (NH3) is the primary atmospheric base in Earth’s atmosphere, and an unregulated gas phase pollutant with increasingly recognized importance to atmospheric chemistry. Despite emissions of NH3 in the US largely decreasing prior to 2015 (US EPA, 2019), since then atmospheric concentrations of NH3 appear to be increasing (Warner et al., 2017; Liu et al., 2019; Yu et al., 2018). At the same time, across New York state, aerosol NH concentrations have steadily decreased and wet precipitation NH concentrations have remained relatively constant (Rattigan et al., 2017), suggesting that complex long-term shifts in NH3 partitioning are taking place.
This paper provides an updated review of trends in summertime cloud water composition at WFM using data obtained from MADPro (1994–2000), the long-term monitoring conducted by the Adirondack Lake Survey Corporation (ALSC) (2001–2017) and recent measurements conducted under the oversight of the Lance Lab at the Atmospheric Sciences Research Center (ASRC) (2018–2021). While ASRC conducted the cloud water sampling in recent years, the majority of the chemical analysis was conducted by the Adirondack Watershed Institute (AWI) in 2018 and 2019 and by ALSC in 2020 and 2021. A detailed review of the sample collection methods and laboratory analyses over this period are also discussed, with a focus on major system changes that have not been fully described in previously published scientific papers. Previous works have reported trends in bulk cloud water composition at WFM up to 2013, largely focusing on analytes most relevant for acid deposition (Aleksic et al., 2009; Dukett et al., 2011; Schwab et al., 2016b). Here, a critical review of past data analysis methodologies is presented, alongside a thorough assessment and justification for modifications to these methodologies, which have resulted in significant changes to the long-term trends. In this paper, we also report the first long-term trends in cloud water TOC at WFM.
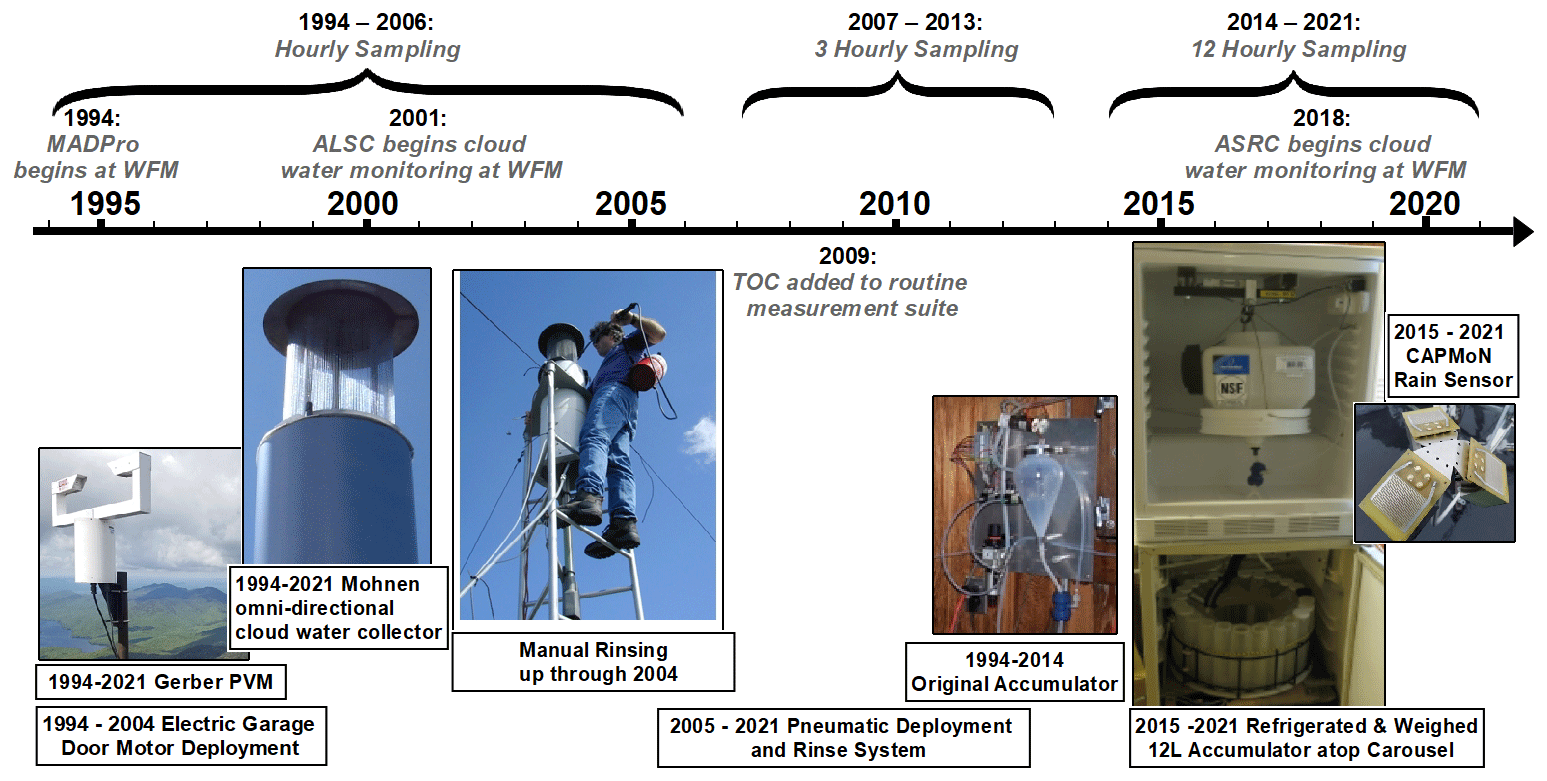
Figure 1Timeline of major events in cloud water collection at WFM for the routine long-term dataset analyzed in this paper (1994–2021), with sampling conducted by the mountain acid deposition program (MADPro) 1994–2000, the Adirondack Lake Survey Corporation (ALSC) 2001–2017 and the Atmospheric Sciences Research Center (ASRC) 2018–2021, and two major system overhauls in 2005 and in 2015. While ASRC conducted the cloud water sampling in recent years, the majority of the chemical analysis was conducted by the Adirondack Watershed Institute (AWI) in 2018 and 2019 and by ALSC in 2020 and 2021. The same basic protocols, cloud water collector and liquid water content sensor were used throughout this entire measurement period, but sampling frequency decreased from hourly to 3-hourly to 12-hourly, necessitating a larger accumulator vessel and an additional refrigerator to house it. Automated filtering began in 2018. Photos documenting the manual rinsing process and the original accumulator were obtained from Eric Hebert, Environmental Engineering and Measurement Services, Inc.
2.1 Site description and collection methods
Whiteface Mountain (WFM) is located in the “High Peaks” Region of the Adirondacks Mountains in Upstate, NY, with summit elevation of 1483 m. The WFM site history is described in detail by Schwab et al. (2016a, b). It should be noted that the first cloud water TOC measurements at WFM were conducted for a handful of cloud events in 1987, along with the first published organic acid measurements in cloud water at WFM. This powerful seminal study showed that potential sources of organic carbon including organic acids could share similar sources with SO and NO (Khwaja et al., 1995). Water soluble organic carbon (WSOC) measurements were also previously obtained for a selection of cloud water samples at WFM from 1990 to 1992 (Anastasio et al., 1994).
All of the bulk cloud water data reported in this paper used a Mohnen omni-directional passive cloud water collector (Mohnen, 1980) (Fig. 1). The collector contains two disks with 0.035–0.04 mm Teflon strings strung vertically between the disks. As cloud droplets pass through the collector and collide with the Teflon strings, water beads up and eventually drips down the strings. The cloud water is then funneled by gravity through a tube and fed into a high density polyethylene vessel called an accumulator. At regular intervals, the accumulator then dumps into 1 L sample bottles contained in a carousel within a refrigerator below the accumulator (Baumgardner et al., 1997).

Figure 2Schematic of the physical components of the current cloud water collection system inside the research observatory at the summit of WFM. A series of valves control where the collected cloud water is directed at specific times, with multiple opportunities to be directed to a waste stream marked “Drain”. Up to 1 L is collected in each bottle within the carousel. The two refrigerated parts of the system house the Accumulator and the Carousel, where the sample is stored for up to 3 d before delivery to an analytical laboratory for analysis.
Deployment of the collector was automated starting in 1994 during the MADPro campaign, and, since that time, the following meteorological parameters have been used to trigger deployment of the collector: (1) liquid water content (LWC) above 0.05 g m−3 measured by a Gerber particle volume (PVM) (Gerber, 1991), indicating the presence of a cloud, (2) temperature above 2 ∘C to prevent damage to the collector from riming, (3) presence of rain not detected, limiting measurements to non-precipitating clouds. An Aerochem gridded rain sensor was used from 1994 to 2014, which was updated in 2015 to a CAPMoN heated grid rain sensor (Mekis et al., 2018), (4) and lastly, wind-speed above 2 m s−1, as measured using a RM Young anemometer, allowing cloudy air to pass through the collector. If all of these meteorological parameters are met for at least 1 min, the collector is raised from its protective housing, exposing the Teflon strings to the passing airflow. If the state meteorological parameters are not met for at least 1 min, the collector returns to its protective housing. A rain valve in line with the accumulator is instantaneously activated (within 1 s) if rain is detected, sending rain water to waste. Figure 1 summarizes the major events and changes to the cloud water collection at WFM.
The automated collection system originally deployed the cloud water collector using an electric garage door opener motor, which was upgraded in 2005 to a pneumatic system to increase deployment and retraction speed. A pressurized tank of deionized water also replaced the manual electric pump spray system in 2005. To monitor for potential contamination, blanks and rinses of the cloud collector were obtained regularly throughout each summer and assessed for the same analytes as the cloud water samples. The collector was rinsed with deionized water for at least 15 s between samples, except when sample changes occurred while deployed in cloud.
Cloud water samples were refrigerated at temperatures of 4 ∘C for up to 3 d within the carousel refrigerator and then transported to a laboratory for subsequent chemical analysis. From 1994–2006, the accumulator dumped into a sample bottle every hour, and the carousel advanced to the next bottle. Starting in 2007, samples were dumped every hour and later pooled together into 3 h composite samples prior to analysis. In 2014, the 1 h samples were pooled together into 12 h composite samples. Then, starting in 2015, the 1 L accumulator was replaced with a 12 L accumulator to accumulate cloud water over 12 h periods, providing up to one daytime and one nighttime sample per day. The new 12 L accumulator was housed in a separate refrigerator above the carousel refrigerator with the intent of preventing microbial degradation prior to freezing the sample, and a measurement of the accumulator weight was added to continuously monitor the volume of cloud water collected.
Control of the cloud water collection system is accomplished through four pinch valves, three of which divert the sample stream one of two ways under different conditions, and a pneumatic “Dump valve” to start or stop flow out of the accumulator. The “Collector valve” diverts flow to waste whenever the collector is not actively deployed, primarily for the purpose of diverting cleansing spray water to the waste stream. The “Drain valve” diverts flow to waste after 1 L has been collected in sample bottles within the carousel (since bottles in the carousel can only hold 1 L). The “Rain valve” operates at a higher frequency than the 1 min timescale of the “Collector valve” and diverts flow to waste when the rain sensor detects rain but the collector has not yet retracted back into its housing.
Starting in 2018, an automated filtering system with in-line peristaltic pump was added just prior to the accumulator (Fig. 2). This change in protocol was introduced in an attempt to further safeguard samples for subsequent analysis of the organic constituents, since organics now comprise a major fraction of aerosol and cloud water solute mass, and their chemical and physical properties remain poorly understood. Automated filtering could be important for preserving some organic compounds for up to 3 d within the carousel refrigerator, since some microbes are known to both consume and produce organic compounds even at temperatures as low as 0 ∘C (Šantl Temkiv et al., 2022). Note that for TOC, microbial degradation is only important if it leads to organic compounds volatilizing out of solution. For the first year of automated filtering, only a few samples were filtered during collection, and field tests were conducted to verify that the filter used did not introduce measurement artifacts. It should be noted that after automated filtering commenced, TOC could no longer be measured, as filtration removes insoluble organic carbon, and measurements of water soluble organic carbon (WSOC) were obtained, instead. To evaluate the potential impact of this change in protocol, both TOC and WSOC were measured for a subset of samples in 2018 and 2019, and these results indicated on average 15 % insoluble organic carbon (Fig. S2 in the Supplement), consistent with previous studies at other locations (Herckes et al., 2013).
As used by Khwaja et al. (1995), a pre-washed 0.4 µm track-etched polycarbonate filter was selected, to limit potential degradation of organics but with low enough pressure drop to attain reliable operation of the automated filtering apparatus. The in-line filter was housed within the accumulator refrigerator to further limit microbial growth on the filter substrate. Since pressures in excess of 40 psig could occur under high particulate load on the filter, PTFE reinforced silicone peristaltic pump tubing (GORE STA-PURE PCS) was used to prevent tubing rupture, and filters were replaced during every site visit, nominally every 3 d. The peristaltic pump was also triggered to only turn on during cloud events when the collector was deployed, to prevent unnecessary wear and tear on the peristaltic pump tubing.
2.2 Chemical analysis and data handling
The list of routinely measured analytes for this long-term dataset is conductivity, pH, SO, NO, NH, chloride (Cl−), sodium (Na), calcium (Ca), magnesium (Mg) and potassium (K), with TOC measurements beginning in 2009 and WSOC measurements beginning for a subset of samples in 2018 and the majority of samples 2019–2021. From 1994–2007, nitrite (NO) was also measured. However, concentrations were rarely above detection limits and, on average, NO contributed less than 1 µeq L−1 to the ion balance. Due to these reasons, NO was no longer included in the suite of measured analytes. The measurement techniques, method detection limits, precision and accuracy for the MADPro, ALSC and AWI measurements are summarized in Table S1 in the Supplement and further described by Isil et al. (2000) and Lee et al. (2022). Measurements conducted by AWI in 2018 and 2019 are described here. Sulfate and Cl− concentrations were measured via ion chromatography (IC) using a Lachat QC 8500 ion chromatograph. A cadmium reduction technique coupled with a Lachat QC 8500 flow injection analyzer was used to measure NO, as described by the EPA 352.2 method. It should be noted that cadmium reduction measures both NO and NO, potentially biasing NO high. AWI measured NO concentration for a subset of 14 cloud water samples in 2018 using a Dionex Integrion HPIC system and found that on average NO was still only 2 % of NO concentrations. For NH measurements, samples were injected with an alkaline solution of sodium hydroxide, converting all NH to NH3. The NH3 was then separated from the solution using a hydrophobic semi-permeable membrane, which was then combined with a solution containing a pH indicator and measured continuously at 590 nm using a flow photometer. WSOC was measured using a Shimadzu TOC-VCPN total organic carbon analyzer. Accuracy was determined using prepared reference standards and were run every 10 cloud samples. Metals including Ca, Mg, Na and K were measured using inductively coupled plasma - atomic emissions spectrometry (ICAP-AES).
It is important to note that the methods used by MADPro, ALSC and AWI measure total metal concentrations rather than their ionic forms, which could potentially overestimate the role of metals in the overall charge balance. Samples for the majority of 2019 and 2020 and all of 2021 were filtered during the collection process, removing potential insoluble Ca and Mg larger than 0.4 µm, and yet reductions in the concentrations of Ca and Mg were not observed, in spite of the relatively high pH often encountered in recent years. This suggests that a large fraction of Ca and Mg in the historical cloud water dataset was also dissolved. The assumption has long been that all measured Ca and Mg were fully dissolved within cloud water due to the dilute aqueous solutions that comprise cloud droplets. To evaluate whether this assumption has merit, 10 unfiltered cloud water samples collected 2018–2020 were reanalyzed by the Lance Lab using Metrohm 761 Compact Ion Chromatograph with a Metrosep C Supp 2 – 150/4 cation column. The samples were re-analyzed twice, once unfiltered and once filtered using a 0.4 µm polycarbonate filter. Figure S4 compares the concentrations of Ca2+ and Mg2+ before and after filtering, while Fig. S5 compares the filtered Ca2+ and Mg2+ measurements to the original unfiltered elemental Ca and Mg concentrations measured by AWI or ALSC. For both sets of figures, the slopes of the regression lines ranged from 0.971 to 1.08 with linear correlation coefficient 0.94–0.98, indicating that filtration removed little to no insoluble Ca or Mg. To further evaluate what fraction of Ca or Mg we expect to be dissolved in the cloud water, the solubility of CaCO3 and MgCO3 were calculated as a function of pH (Fig. S6). These calculations show that for the full range of pH and dilution experienced by our cloud water samples to date, CaCO3 and MgCO3 are expected to be completely dissolved. Only at pH values of eight and greater do we expect these species to remain in the solid phase. Other forms of calcium and magnesium, e.g. CaCl2, Ca(NO3)2 or Ca(OH)2, are even more soluble and even more likely to be completely dissolved at the pH and liquid water contents encountered at WFM. Based on the IC analysis and calculations described above, we therefore assume that the measured metal concentrations are equivalent to their ionic concentrations, as commonly assumed in past analyses of this dataset.
Another common practice, made by both MADPro and ALSC, was to categorize samples based on ion balance criteria according to the relative percent difference (RPD) between the measured cation and anion concentrations, calculated as follows:
Samples were categorized as valid based on RPD using the following thresholds: RPD < 100 % when both ∑Cations and ∑Anions < 100 µeq L−1, or RPD < 25 % when either ∑Cations or ∑Anions > 100 µeq L−1. Samples that did not match these criteria were considered invalid. Samples with flagged data due to suspected measurement problems were also considered invalid, which were extremely rare, only representing < 1 % of samples. Samples for which all analytes could not be measured (for instance, due to insufficient sample volume) were omitted from our separate analysis of invalid and valid datasets, and we refer to these samples as unclassified since ion balance could not be fully assessed for these samples. Fewer than 10 % of samples were unclassified. Previous analyses involving the MADPro and ALSC datasets typically only used valid data (i.e. those samples that passed the ion balance criteria and were also not subject to any known or suspected measurement problems), which has important implications for the data interpretation and the resulting long-term trends, as will be discussed in the results section of this work.
Previous studies also often focused on reporting sample volume-weighted analyte concentrations due to a focus on wet deposition, whereas we report measured cloud water concentrations and cloud water loadings, the latter of which complements measurements of aerosol loadings. Since a typical cloud droplet is more likely to evaporate than deposit to the surface at any given time (Seinfeld and Pandis, 2016), this latter focus on atmospheric loadings is useful for investigating chemical processes occurring in the atmosphere separately from the influence of sample dilution at higher LWC.
To account for variability in LWC that potentially affected cloud water concentrations, cloud water loadings (CWL) are calculated as follows (Elbert et al., 2000; Marinoni et al., 2004; Kim et al., 2019):
where CWL is expressed in µg solute per m3 of air, LWCsamp is the representative LWC during which the sample was collected expressed in g water per m3 of air, [Xi] is the liquid concentration of a given solute ion i expressed in µeq solute per L of water, mwi is the molecular weight of the solute in g mol−1, Zi is the solute charge and ρw is the density of cloud water (assumed to be 1 g cm−3). To calculate TOC CWL, is replaced with molar concentration in µmol C per L and mwi=12 g mol−1. While the long-term WFM dataset included average LWC values for each sample, there is no record of how these values were determined, and careful analysis indicates that these values included LWC values during periods with drizzle when collected cloud water was being sent to a waste stream and the collector is not deployed, a common occurrence during the night. To avoid introducing bias into the CWL calculation, we recalculated LWCsamp by removing LWC values from the average when the rain sensor detected rain for > 15 % of a given measurement period or the collector is deployed for the less < 25 % of a measurement period as described in the supplemental material (Fig. S7). Since this additional information about the collector status and meteorological conditions during each hour is only available starting in 2009, only data from 2009 to 2021 are included in our LWCsamp and CWL calculations.
In the present study, data analysis is performed within the statistical software R (R Core Team, 2021). Measured analyte concentrations and conductivity exhibit a log-normal distribution; therefore, median values were used rather than means for trend analysis, as the median is more robust to outliers and a better representation of the population. Additionally, due to significant variance within the trend data, Mann–Kendall (MK) trend tests combined with Theil–Sen slope estimators (Sen, 1968) were employed to obtain a robust estimate of the slope of the long-term trends in measured analyte concentrations, with its significance determined by the calculated p value from MK test.
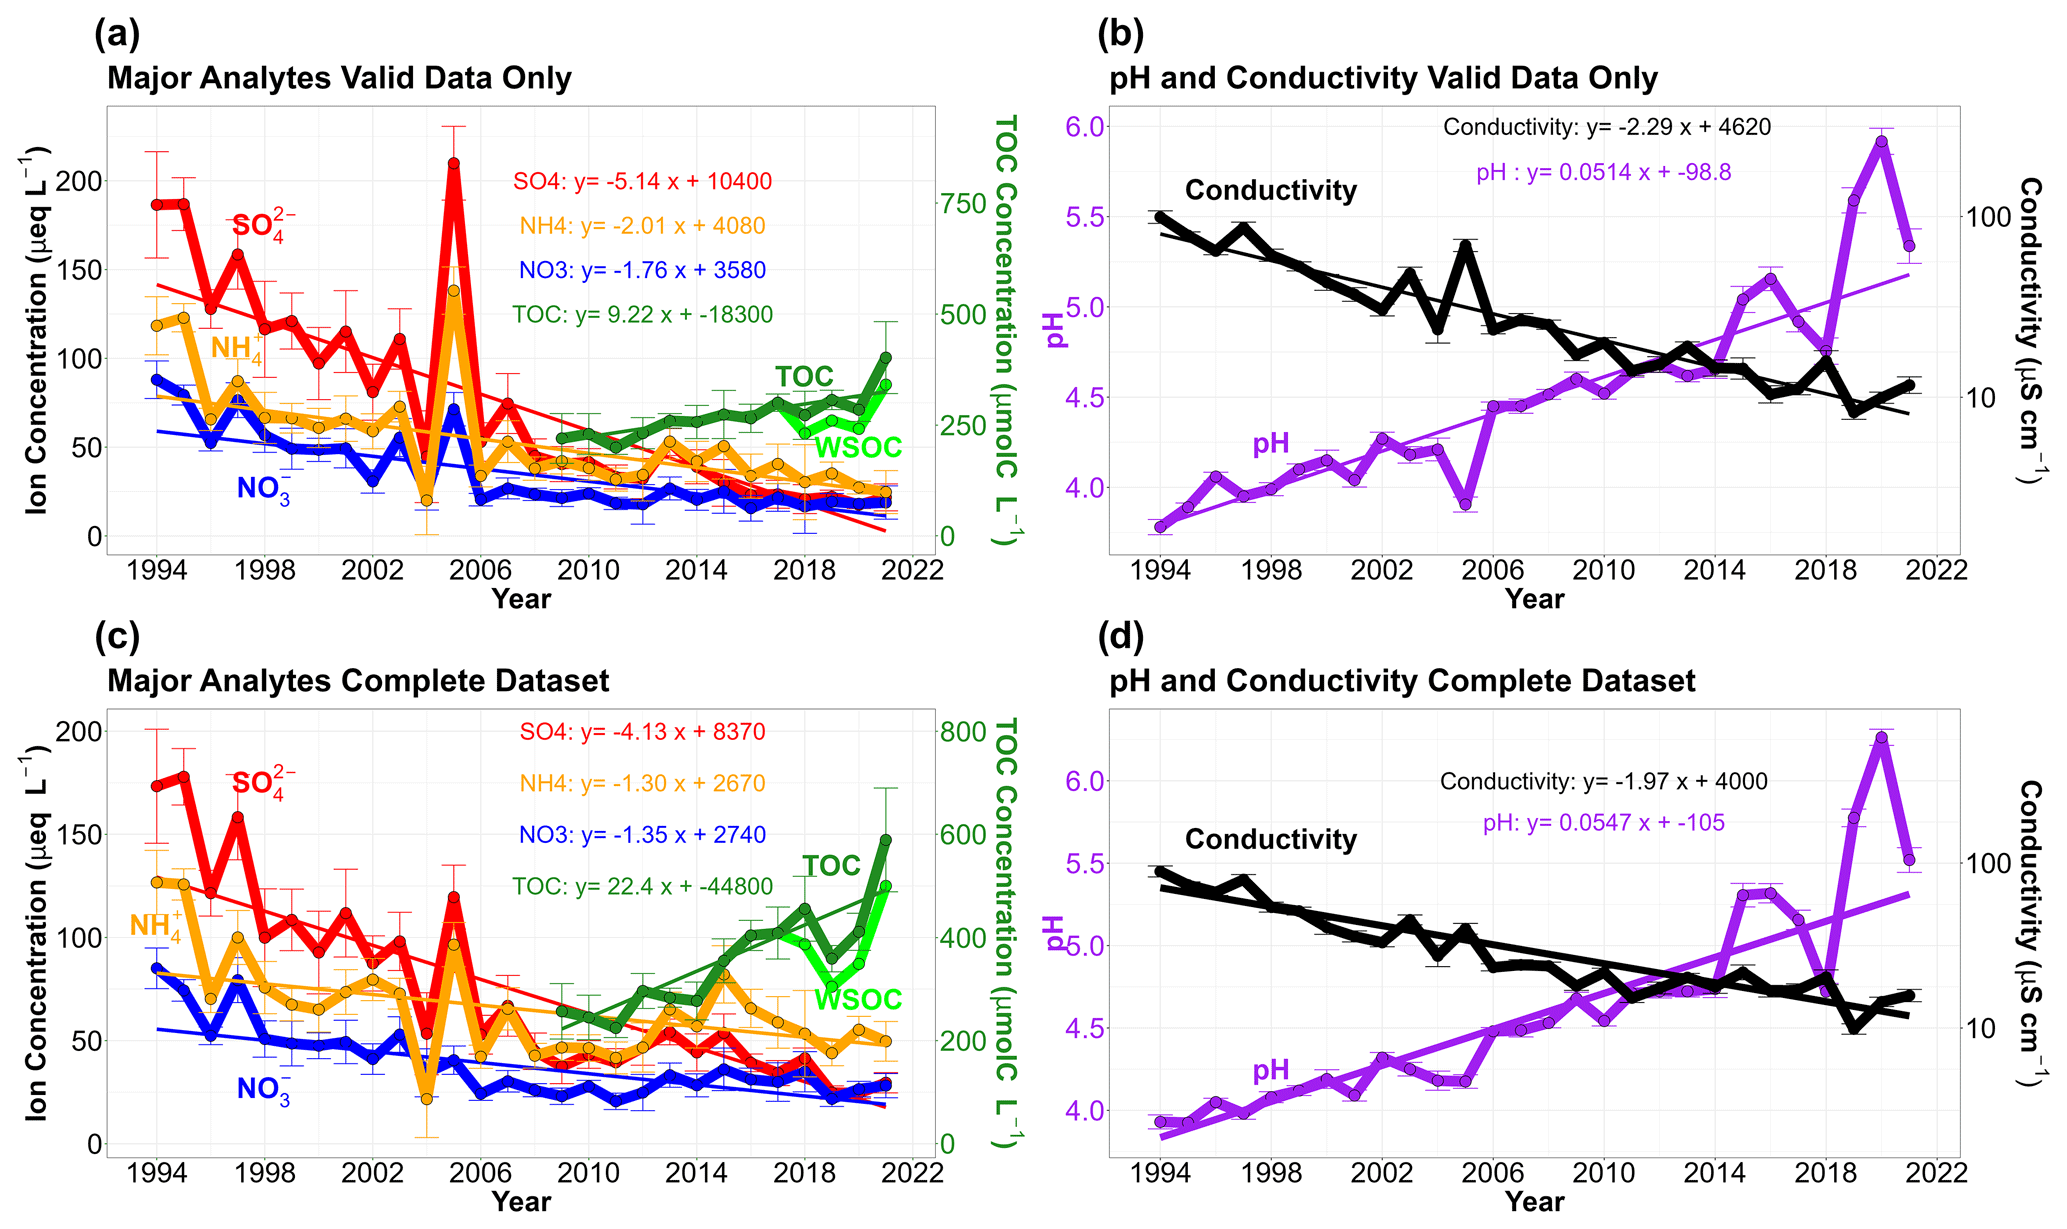
Figure 3Annual median trends in cloud water collected from the summit of WFM. Panels (a) and (b) include valid data, samples achieving an approximate ion balance, while panels (c) and (d) include the entire available dataset. Annual median trends in major analyte concentrations reported in µeq L−1 for ions on the left axis and µmol C L−1 for TOC on the right axis. Conductivity is measured in µS cm−1 on the right axis in panels (b) and (d). Measured annual median WSOC for samples collected in 2018–2021 are shown in light green for comparison to the estimated TOC concentrations in these years. Error bars represent the standard error of the annual mean concentrations. Standard error of the annual mean were used instead of interquartile range as the large sample to sample spread in the cloud water composition produced large error bars, making the figures difficult to read.
3.1 Trends in valid data
This section updates the long-term trends in cloud water composition at WFM that were previously reported by Aleksic et al. (2009), Dukett et al. (2011) and Schwab et al. (2016b), now including data through 2021. Figure 3a shows annual median analyte concentrations and the slopes of the linear trend analysis for the valid dataset, while Table S2a shows the slopes and associated p values for all measured analytes. Annual median cloud water pH increased from 3.78 in 1994 to 5.34 in 2021, corresponding with a substantial decrease in conductivity and SO concentrations. A similar trend was found in data reported by Pye et al. (2020) for cloud water pH from the 1990s to the 2010s while showing data as far back as the 1970s being highly acidified and remaining flat until the 1990s. Meanwhile, NO, NH and Cl− concentrations exhibited relatively modest decreases, which leveled off starting in 2006. The remaining ions exhibited no discernible trends.
TOC is the only analyte that shows evidence of an increasing trend (plotted on the right axis in Fig. 3a). This is the first reported long-term trend for cloud water TOC at WFM. It should be noted that for 2009, the first year of routine TOC measurements, TOC analysis was only conducted on 20 samples in total, compared to 80–285 samples per year with TOC measurements from 2010–2021. In spite of the small samples size for 2009, these data are included in the trend analysis as there is no evidence of measurement error or bias, and their inclusion does not strongly impact the resulting trend. Since TOC concentrations could not be measured for samples when automated filtering was performed during collection (as applied for samples 2018–2021), annual median TOC concentrations for these 4 years were estimated based on the average 85 % WSOC TOC ratio observed for the subset of samples from 2018 and 2019 where both WSOC and TOC were measured (Fig. S2). Both WSOC and TOC concentrations are shown in Fig. 3a for these 4 years, but only the estimated TOC concentrations are used in the trend analysis.
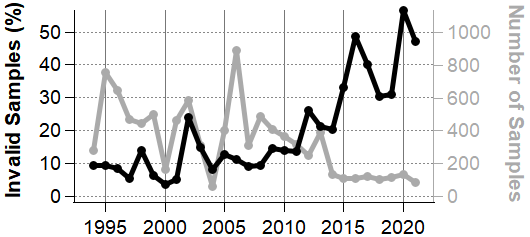
Figure 4Annual percentage of cloud water samples considered invalid according to ion balance criteria [invalid(invalid + valid)] (black, left axis) and total number of samples (valid + invalid + unclassified) in each year (grey, right axis).
3.2 The growing influence of invalid data
Review of the cloud water measurements obtained at WFM shows that the proportion of so-called invalid samples has increased substantially over the past several years, increasing from 9.3 % in 1994 to 47 % in 2021 and peaking at 57 % in 2020 (Fig. 4). While there is a seasonality to the percentage of invalid samples, every summer month shows an increasing slope (Fig. S3). This classification, based on ion balance criteria, was originally intended to reduce the impact from measurement error, as it is assumed that positively charged cations should be balanced by negatively charged anions in any natural bulk water systems. Implicit in this characterization is the assumption that the majority of ions are being analyzed for. This growing ion imbalance in cloud water coincides with increasing cation anion ratios observed in rain water collected by the National Atmospheric Deposition Program (NADP) over the same time period throughout NY State (Rattigan et al., 2017) and more broadly across the eastern US and Canada (Feng et al., 2021), based upon the same standard suite of inorganic analytes. Since the rain water observations are entirely independent of the cloud water measurements, it is highly unlikely that the growing number of invalid samples is due to a measurement artifact. Crucially, aside from ion imbalance, there is no evidence that the so-called invalid cloud water samples were subject to measurement bias and should be discarded. We hypothesize, instead, that the growing ion imbalance is due to unmeasured ions like organic acids that are growing in abundance, as also hypothesized by Dukett et al. (2011) and Feng et al. (2021). Since organic acids are known to comprise a significant fraction of TOC (Herckes et al., 2013), the measured trend in TOC concentrations at WFM supports this hypothesis.
Since the invalid dataset now comprises nearly half of the samples, it is worth analyzing this dataset separately. These samples are potentially representing a chemically distinct subset of samples that are encountered more frequently in recent years. To summarize, invalid samples are considerably less acidic (0.5–1 pH units) and exhibit higher concentrations of NH, TOC, Ca2+ and K+ (Fig. S8), and the trends are significantly different as well. After around 2006, trends in the invalid dataset appear to begin diverging from the valid dataset. On average, LWC is higher within the valid dataset, which tends to dilute samples and thus reduce all analyte concentrations. However, there is not a growing divergence between the trends of valid and invalid LWC; therefore, LWC trends alone do not explain the divergence between valid and invalid concentrations. These observations show that while the invalid samples have been growing more common, the composition of the invalid samples has also grown more concentrated in TOC, NH, NO and Ca2+ over the past decade.
3.3 Trends of the complete dataset
Including valid, invalid and unclassified data, the trends still exhibit significant reductions in conductivity, SO, NO and NH concentrations (Fig. 3b and Table S2b). However, the reductions are lower in magnitude compared to only the valid data. For instance, the slope of the regression line for SO concentrations decreases from 5.14 to 4.13 µeq L−1 yr−1. Notably, the reactive nitrogen species (NH and NO) exhibit a more noticeable uptick in concentration from 2007 to 2014 before decreasing again. This apparent inflection point in the trends, starting around 2006, appears to signify the emergence of a new chemical regime that has been growing in importance along with the growing fraction of invalid samples. The biggest impact of including the invalid data in our analysis is a stronger increasing trend in TOC concentrations, which more than doubles from 2009 to 2021. TOC shows a strong seasonality, typically with June and July exhibiting the highest concentrations for the year (Fig. S9). Theil–Sen regression analysis reveals a statistically significant increasing trend for TOC in the months of June, July and September. No other analyte measured in WFM cloud water exhibits any significant seasonality during any month. Annual median concentrations for the complete dataset show that NH has been increasingly capable of neutralizing SO and NO, which is well matched by a decreasing trend in measured H+ (Fig. 5). Note that for individual cloud water samples, NH concentrations can be greater than both SO and NO concentrations combined (in terms of µeq L−1), which occurred for 1203 out of 9429 cloud water samples from 1994 to 2021.
The increasing trend in annual median cation anion ratios within cloud water over the entire record is 1.97 % yr−1 (.001), including only samples where cations and anions for all measured analytes are reported. Emergence of a new chemical regime within the past decade is further supported by these observations, with annual median ion imbalance < 20 % prior to 2009, after which median ion imbalance has exceeded 20 % in every subsequent year except 2018.
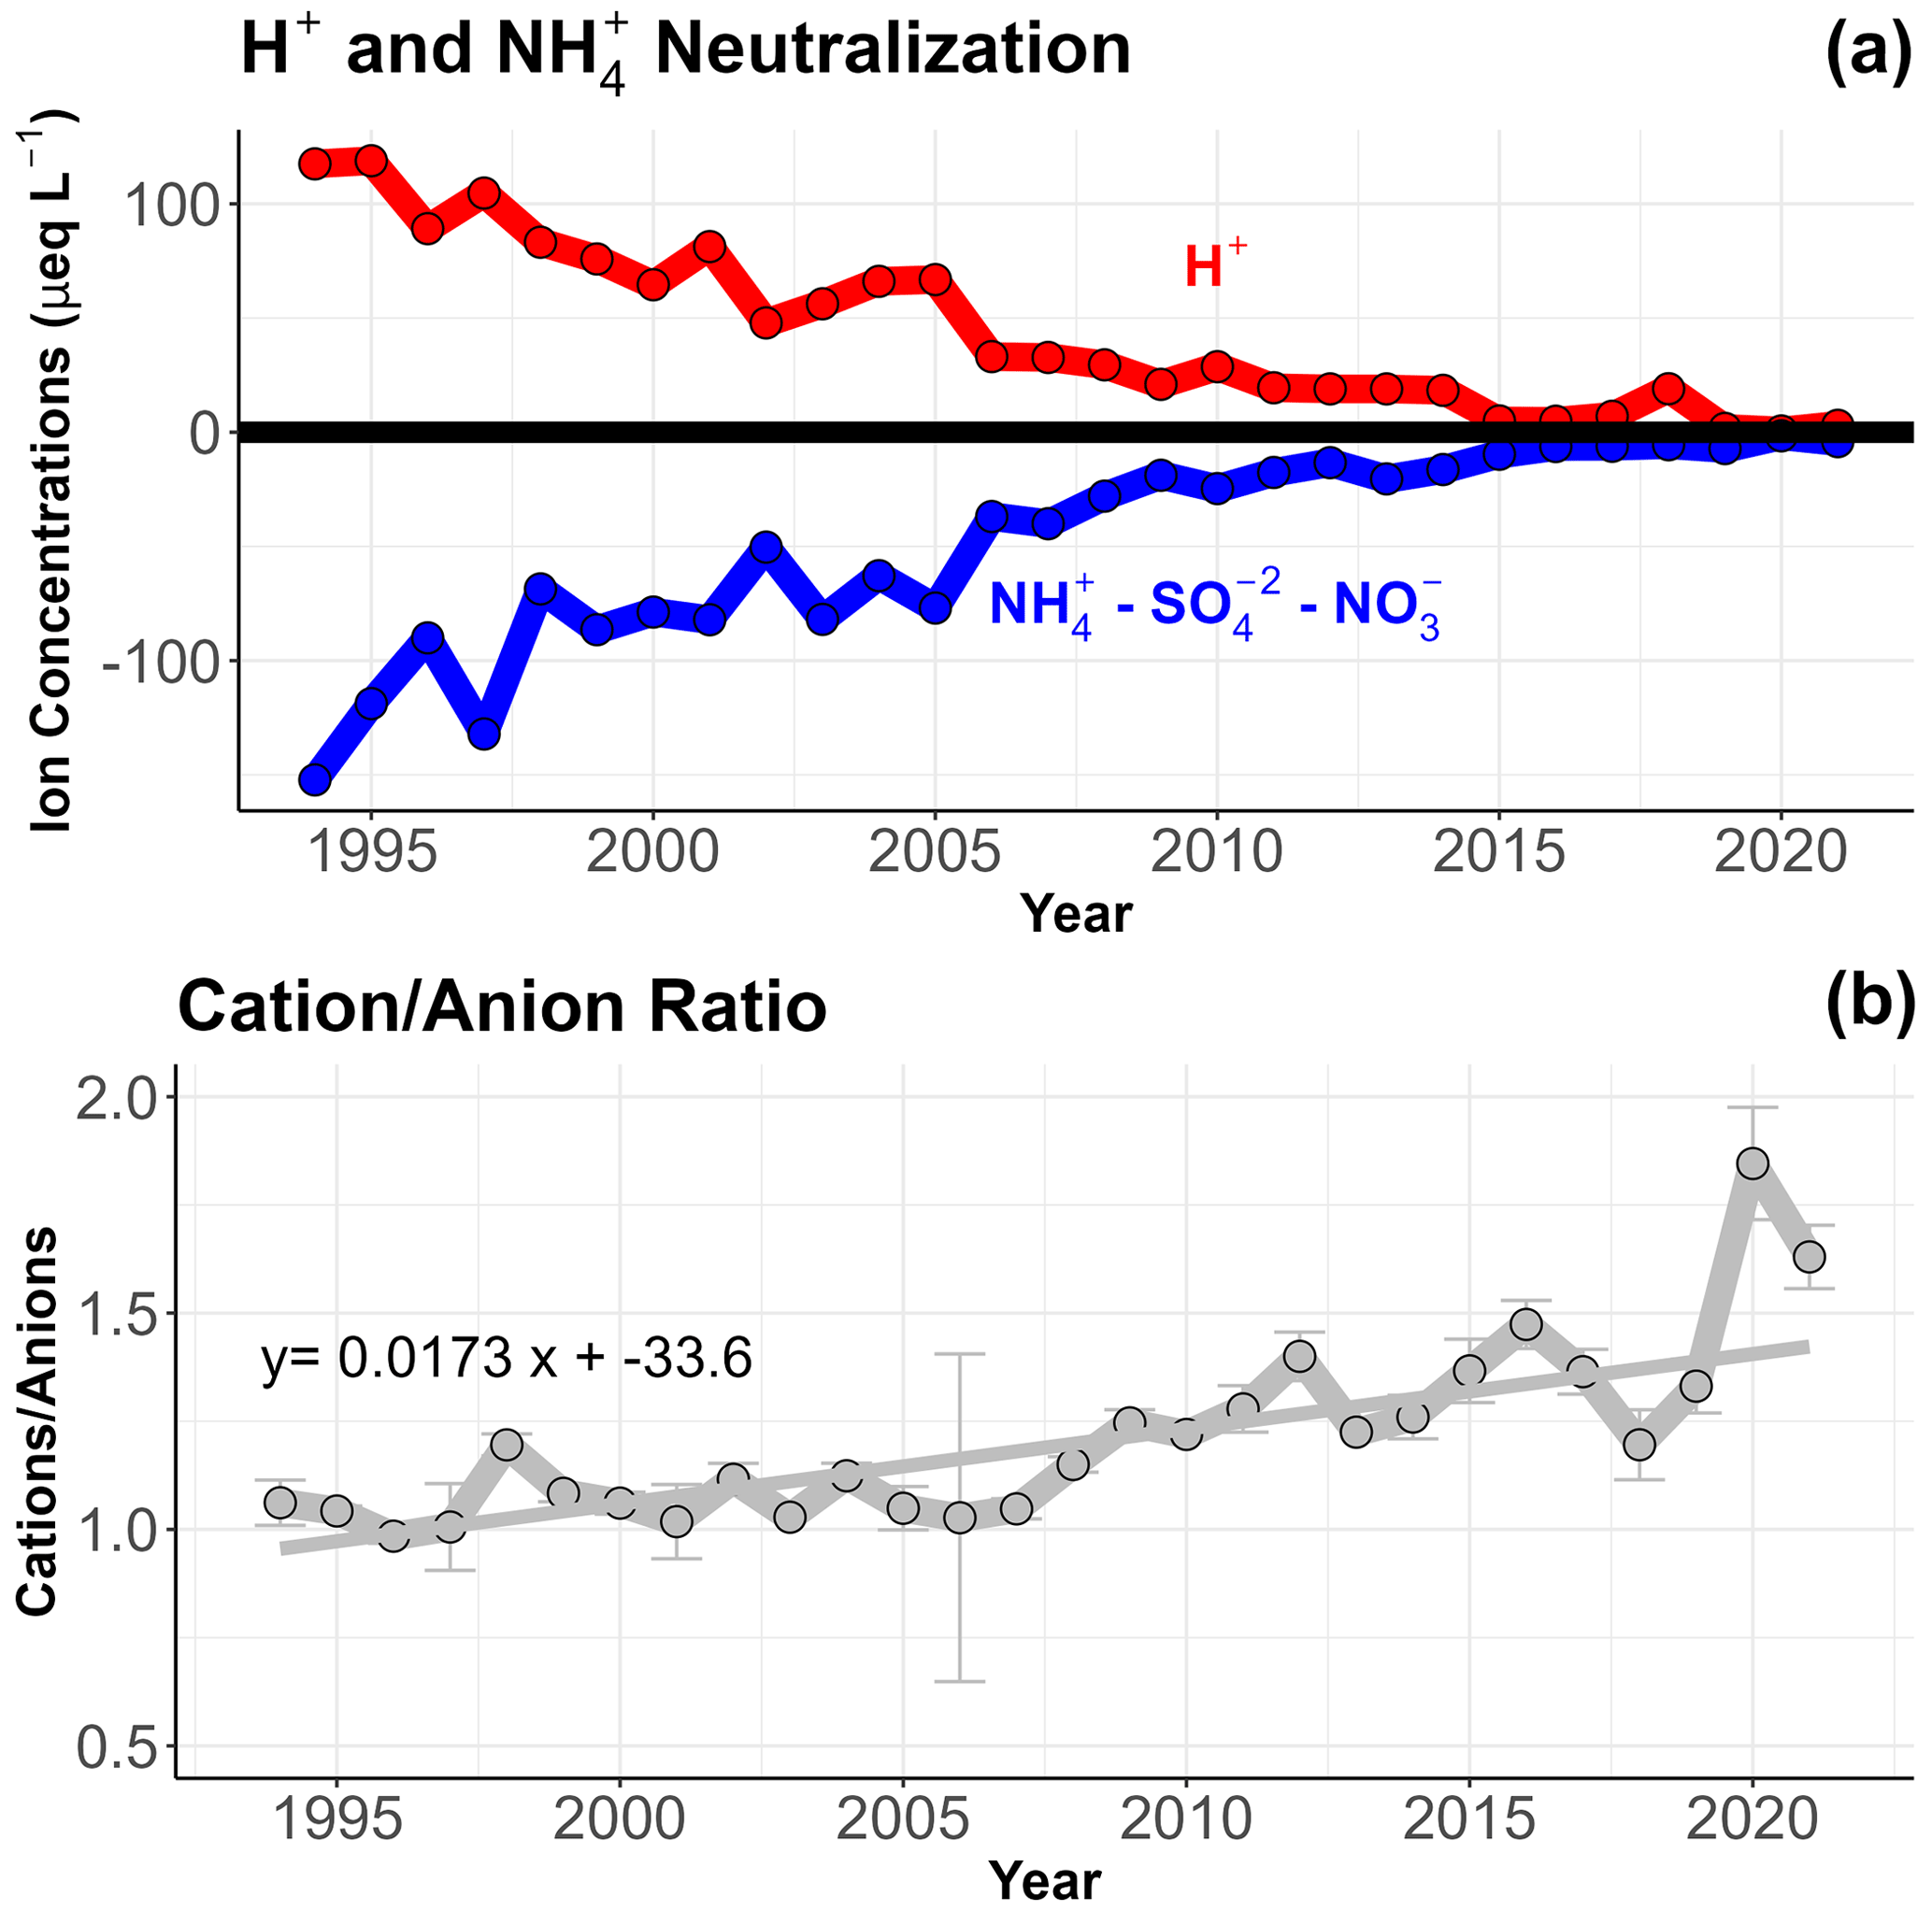
Figure 5(a) Annual median measured H+ concentrations and neutralization of SO and NO by NH, and (b) annual median cation anion ratios in cloud water collected from the summit of WFM (complete dataset).
The analysis so far has focused on cloud water concentrations, which can be impacted by changes in meteorological parameters like LWC that are unrelated to changes in chemistry or emissions. Previous works have investigated the role of LWC on analyte concentrations (Elbert et al., 2000; Aleksic and Dukett, 2010; van Pinxteren et al., 2016), finding a weak non-linear negative relationship between total ion concentration (TIC) and LWC, with considerable variance within the data. Aleksic and Dukett (2010) used a probabilistic technique to describe the relationship between binned LWC and TIC, with TIC showing a negative exponential relationship with LWC. When using this type of LWC binning technique for TOC, a similar probabilistic relationship can be found (Fig. S10), where a decreasing trend is observed in TOC as LWC increases, but exhibiting large variability within each bin, similar to what has been found previously at other locations (Herckes et al., 2013).
An alternate way to report cloud and precipitation composition is to weight by sample volume (Schwab et al., 2016a; Rattigan et al., 2017), which provides a means for determining the net accumulation of a particular analyte in the environment. Sample volume for cloud water is dependent on the collection efficiency of the cloud water collector, which is influenced by wind speed, LWC and updraft, complicating the relationship between sample volume and cloud composition. In our analysis, instead of sample volume, samples are weighted by liquid water content (LWC) to determine cloud water loadings (CWLs), also referred to as air-equivalent concentrations (Marinoni et al., 2004; Wang et al., 2016; Kim et al., 2019), which has the added advantage of being directly comparable to aerosol loadings.
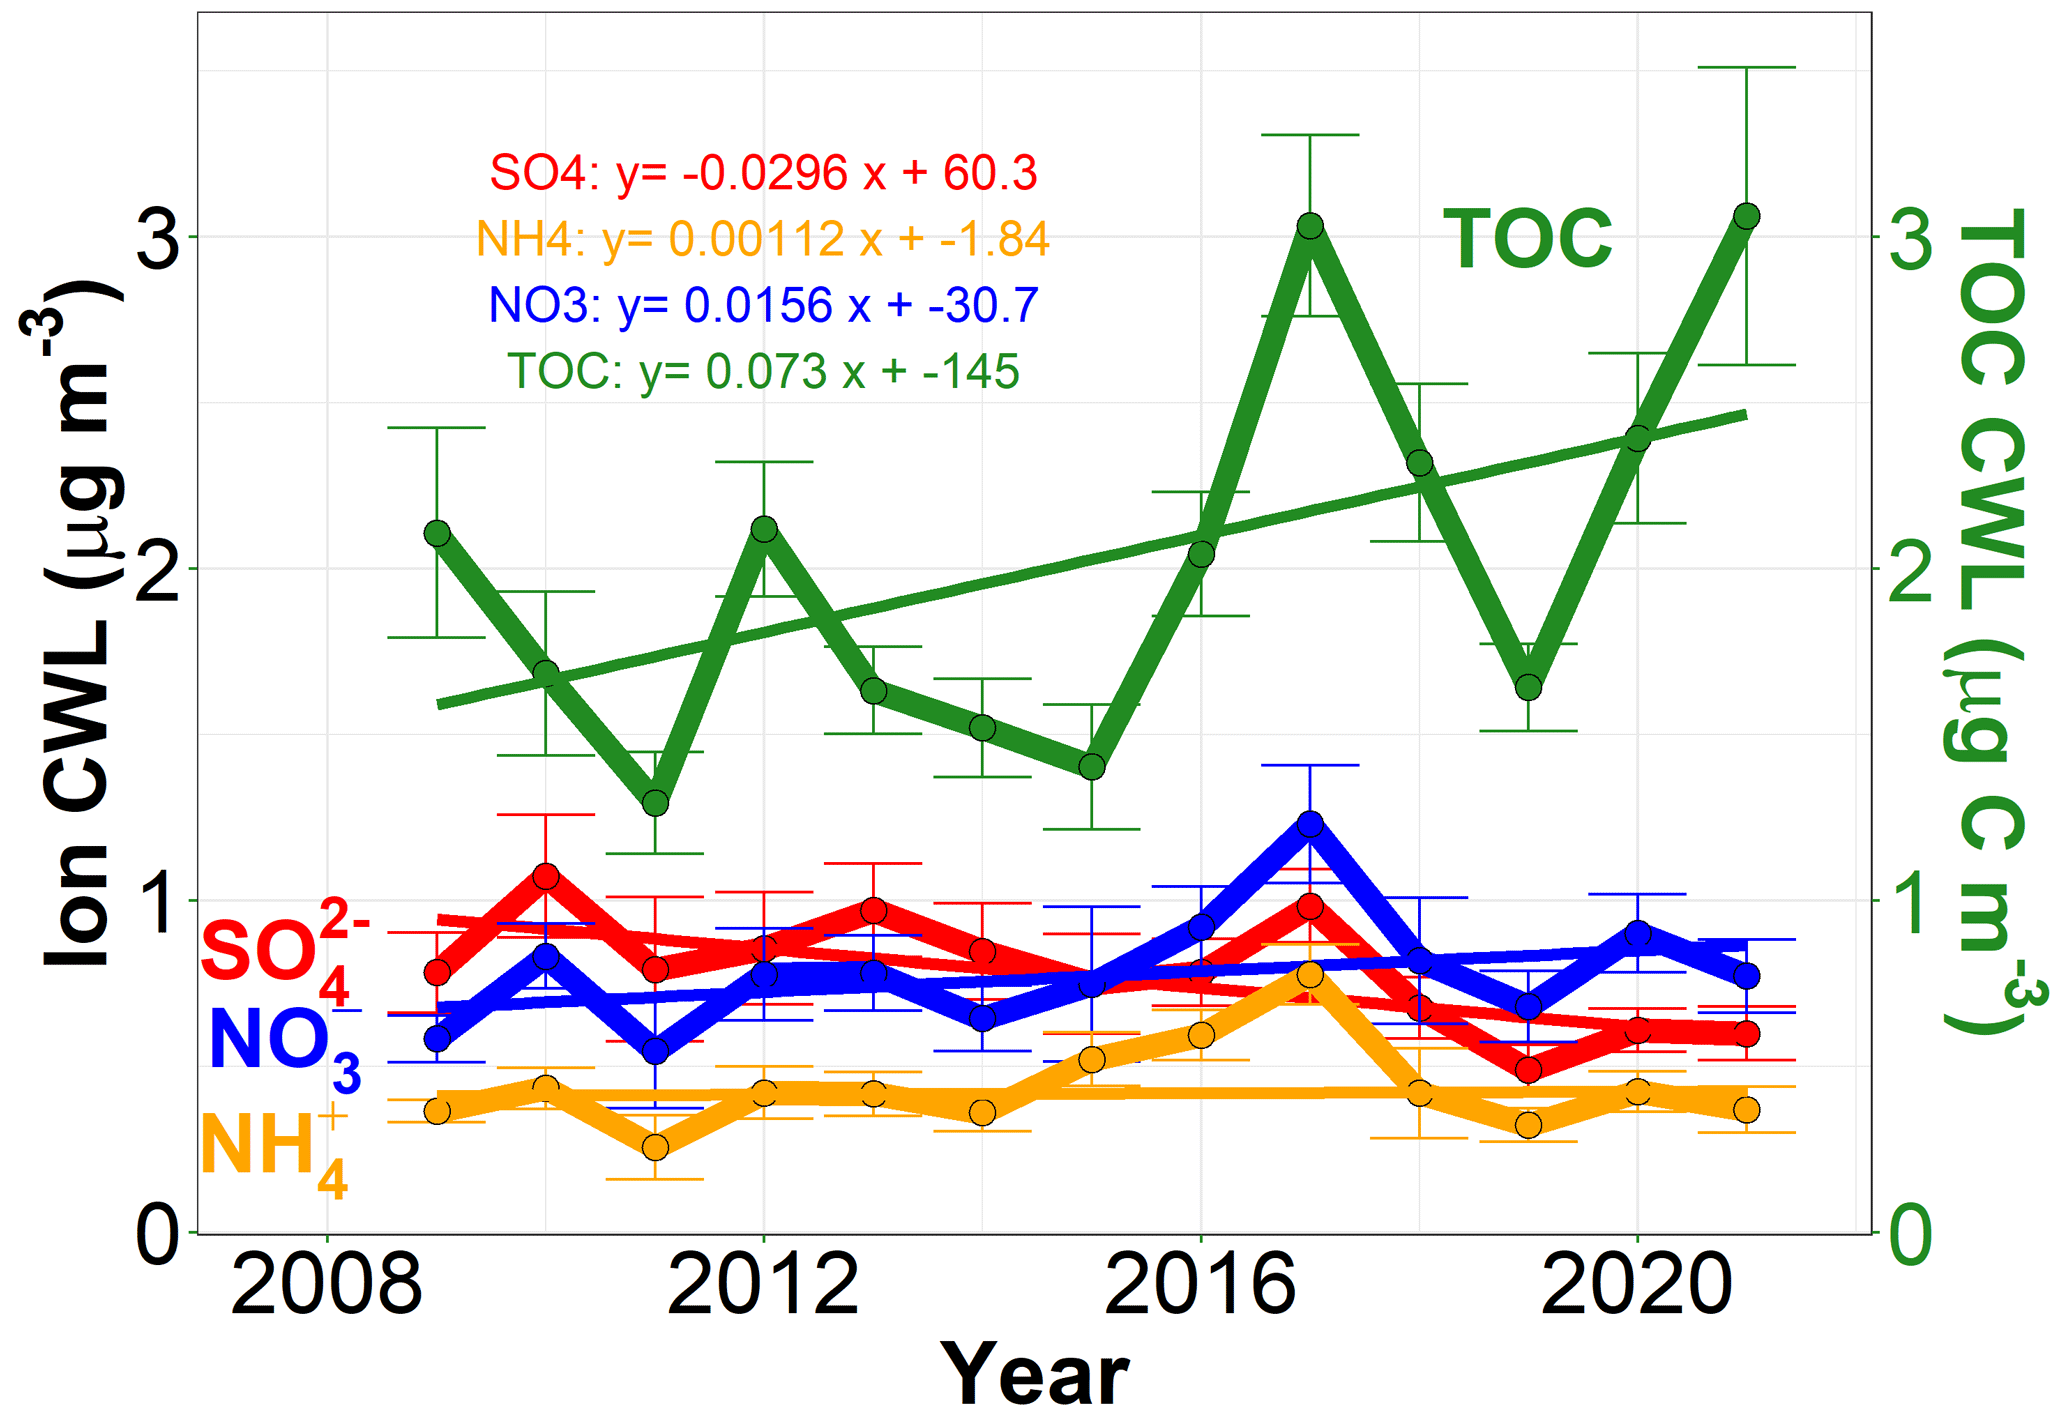
Figure 6Linear trends in annual median cloud water loadings (CWLs) for the major inorganic ions and TOC between 2009–2021 for the complete dataset, using the meteorology criteria outlined in the Supplement, Sect. S5 to calculate average in-cloud LWC values associated with each sample.
Figure 6 and Table S3 show the trends and the associated p values in median CWL for 2009–2021, a time period for which meteorological data were available for calculating the average in-cloud LWC for each cloud water sample within the complete dataset. Focusing on this date range has the added advantage of focusing on a time period that is chemically distinct from the earlier half of the long-term record (e.g. with NH concentrations growing in abundance relative to both SO and NO and changing trends in all the major analytes, as shown in Fig. 3c). Using the same analysis method as in previous sections, increasing trends in Ca, Mg, Na, Cl− and K CWL since 2009 are observed. The trends in Ca and Mg CWL imply increased influence from mineral or soil dust, while the increasing trends in Na and Cl− suggest increasing influence from sea spray or playa dust. The increasing K trend could indicate increased influence from wildfires (Simoneit, 2002; Pachon et al., 2013), though K can also be found in mineral dust. Meanwhile, there is no statistically significant trend in LWC, SO, NH, NO or TOC CWL over this time period. This surprising result indicates that the large increasing trend in TOC concentrations since 2009 reported in Fig. 3c is not statistically significant when accounting for LWC, despite the positive slope of the TOC CWL regression line. Additional measurement uncertainty introduced by the LWC measurements may partly account for the higher p value and reduced significance of the TOC CWL trend, but complex relationships between LWC and TOC concentrations (e.g. dilution and partitioning of soluble organic gases and/or drier air masses associated with greater biomass burning emissions) could also be playing a role.
Two independent measures (cation anion ratio and predicted/measured conductivity) imply that as pH increases, there is a growing abundance of analytes that are not being measured, particularly above 4.5 pH (Fig. S11). The measured ion imbalance suggests that more of the missing analytes are anions than cations. Here, we discuss potential missing anions responsible for the increasing trend in cation anion ratios in WFM cloud water.
5.1 Bicarbonate
Due to increasing cloud water pH, bicarbonate (HCO) is hypothesized to have a growing contribution to ion balance. The dissolution of CO2 is a major source of HCO by partitioning into cloud droplets and hydrolyzing to form carbonic acid (H2CO3) with an acid dissociation constant of (pKa =6.36). This contribution of HCO from CO2 increases as pH increases until it reaches its pKa of 10.3, where the relative contribution of CO becomes more important. Highly alkaline dust particles containing calcium and magnesium carbonate (CaCO3 and MgCO3) can also be a major source of HCO. Cloud water collection sites that are heavily influenced by mineral dust often report pH values above seven (Khemani et al., 1987; Budhavant et al., 2014), leading to relatively acid-buffered cloud water. While the suite of measurements at WFM did not include HCO, it can be estimated using pH dependent equilibrium equations for an aqueous system open to the atmosphere, calculated as follows:
where represents the partial pressure of CO2, assumed to be 410 ppm, H M atm−1 is the Henry's law constant of CO2, and Ka1 is the acid dissociation constant of CO2 (Sander, 2015). Temperature was also assumed to be 298 K. There is virtually no change to the overall ion balance when including estimated HCO (Fig. S12). Even for pH values above six (approximately the pKa of H2CO3), there are only modest improvements in overall ion balance. Based on these estimates, it is unlikely that HCO is a major driver of ion imbalance in the WFM cloud water observations. Importantly, these are only estimates of HCO concentrations based on equilibrium with the atmosphere. There has been significant discussion on the validity of Henry's Law constants for cloud drop distributions, as several field studies note significant departures of measurements from gas–aqueous phase partitioning (Pandis and Seinfeld, 1991; Winiwarter et al., 1994; Straub, 2017). It is plausible that some deviations could also exist for the carbonate system, thus leading to inaccurate HCO concentration estimates. One fog water monitoring site in Pennsylvania found similar anion deficiency in their system and hypothesized HCO as one potentially missing anion. For better estimates, they used inorganic carbon measurements from a TOC analyzer and assumed all inorganic carbon was part of the carbonate system. They then used the pH of the fog water to calculate the fraction of HCO. This led to around a 2.4× greater concentrations of HCO on average than predictions based on Henry's Law, improving overall ion balance (Straub, 2017). It should be noted that the fog water exhibited considerably greater pH values than WFM cloud water, however, and only fog water samples with pH > 6.0 showed appreciable ion imbalance, reinforcing our assessment that HCO concentrations are likely negligible for the majority of cloud water samples from WFM.
5.2 Organic anions
Organic anions such as formate, acetate and oxalate are known to be present in cloud and rain water, including at WFM (Khwaja et al., 1995; Chapman et al., 2008; Herckes et al., 2013; Akpo et al., 2015). A strong correlation between TOC and ion imbalance (R2=0.55, p<0.001) implies that an important fraction of missing anions are likely organic (Fig. S13). Further evidence for missing organic acids is revealed when investigating ion balance as a function of pH. At low pH, the ratio of measured cations to anions is approximately 1, approaching ion balance. As pH increases, the ratio decreases, reaching a minimum of 0.69 for pH 5.5–6.3, with large decreases in the ratio at pH bins of 4.0–4.8 and 4.8–5.5 (Fig. S14). These pH bins are close to the pKa values of formic and acetic acid (3.74 and 4.75, respectively), often the most abundant organic acids found in cloud water (Herckes et al., 2013). As pH increases, a greater fraction of these acids, and others, are expected to exist in their anionic form and contribute more significantly to charge balance. Increasing cloud water pH also increases the fraction of volatile and semi-volatile organic acids that reside in the aqueous phase, contributing further to the ion imbalance (Seinfeld and Pandis, 2016). Similarly, Fig. S11 shows that the ratio of predicted/measured conductivity decreases as pH increases, indicating a missing source of ions within the system that could be organic in nature.
Assuming that the missing anions are carboxylates, the contribution of organic acids to TOC can be approximated. We introduce the value of a carbon to charge ratio () to represent how many carboxylic acid functional groups are associated with every carbon atom in an organic molecule. Figure S15 shows the annual median faction of organic acids to TOC for four different ratios of 1, 2, 3, and 5. represents the smallest mono and dicarboxylic acids formic and oxalic acid. represents slightly larger but commonly found compounds like acetic and succinic acid. represents compounds like propionic and lactic acid. Lastly, is used to represent large organic compounds like humic-like substance (HULIS), a class of compounds that are not well defined but often represent a large fraction of WSOC (Perminova et al., 2003; Graber and Rudich, 2006; Spranger et al., 2020). A representative HULIS compound with a molecular weight of 360 g mol−1, an organic matter/organic carbon ratio of 2 and three carboxylic acid functional groups indicates a molecule with 15 carbon atoms and a value of five. These values are estimated based on available literature (Perminova et al., 2003; Graber and Rudich, 2006; Salma and Láng, 2008; Brege et al., 2018; Cook et al., 2017; Qin et al., 2022). Ionic organic compounds represent an important fraction of TOC, which we estimate range from 4.81 %–24.0 % in 2009 to 7.28 %–36.4 % in 2021, and potentially peaking at 58.0 % in 2020. There is also strong evidence that this fraction is increasing as indicated by Theil–Sen regression (p=0.0327), indicating that not only is TOC increasing but organic ions are also increasing. There is very little data to constrain high molecular weight organic compounds in WFM cloud water. One study by Cook et al. (2017) measured high molecular weight organic compounds for eight cloud water samples collected at WFM in 2014 using electrospray ionization coupled with Fourier transform ion cyclotron resonance mass spectrometry (FTICR-MS). This work found that the distribution of the carbon numbers were largely centered around 15 atoms, which is in rough agreement with our estimate of three carboxylic acid groups and a molecular weight of 360 g mol−1. Therefore, the ratios of 1 and 5 may serve as useful lower and upper estimates for the fraction of TOC that is ionic. More detailed chemical analysis is required to better estimate the contribution of organic anions to the chemical system.
6.1 Changing relationship between H+ and conductivity
While our analysis of the long-term cloud water dataset at WFM illuminates important differences from previous analyses, there is no doubt that significant progress has been made in reducing ambient concentrations of criteria pollutants across the US and at WFM since the 1990s, resulting in significant decreases in SO and NO concentrations, with associated increases in cloud water pH and decreases in conductivity. These overall trends highlight that, generally, conductivity is controlled by H+ concentrations, due to the high limiting molar conductivity of H+ ( S cm2 mol−1) compared to other analytes (e.g. 160.0 S cm2 mol−1 for SO and 73.5 S cm2 mol−1 for NH) (Coury, 1999). In recent years, this relationship is diminishing. Figure 8a shows the relationship between conductivity and pH for individual cloud water samples throughout the entire 28 year record (1994–2021). pH values range from < 3 to nearly as high as 7, and conductivity values likewise span nearly three orders of magnitude. Many samples exhibit a strong linear relationship between H+ and conductivity, especially in more acidified cloud samples. However, beginning at pH values above 4, many samples deviate from this linear relationship, with higher conductivity values than expected for samples with high pH. To reach these same conductivity values, the cloud water samples requires much higher concentrations of other ions such as NH and Ca2+. The emergence of this new “non-linear regime” with both high pH and high conductivity implies that one cannot assume that samples with higher pH are “cleaner”, as was typically the case in decades past at WFM. To better investigate this non-linear relationship between conductivity and H+, we propose a new method of classifying cloud water data as follows:
where MCond is the measured specific conductivity and HCond is the conductivity from the H+ ion, calculated from
where Λ+ is the limiting molar conductivity of the H+ ion at infinite dilution arising from the auto-ionization of pure water. If RCond<0.35, less than 35 % of the total conductivity of the sample can be explained by H+. For samples with RCond>0.35, to the left of the dashed line on Fig. 7a, a linear relationship between conductivity and pH is observed, and for samples with RCond<0.35 this linear relationship breaks down. The following section will compare differences in chemistry between the two regimes.
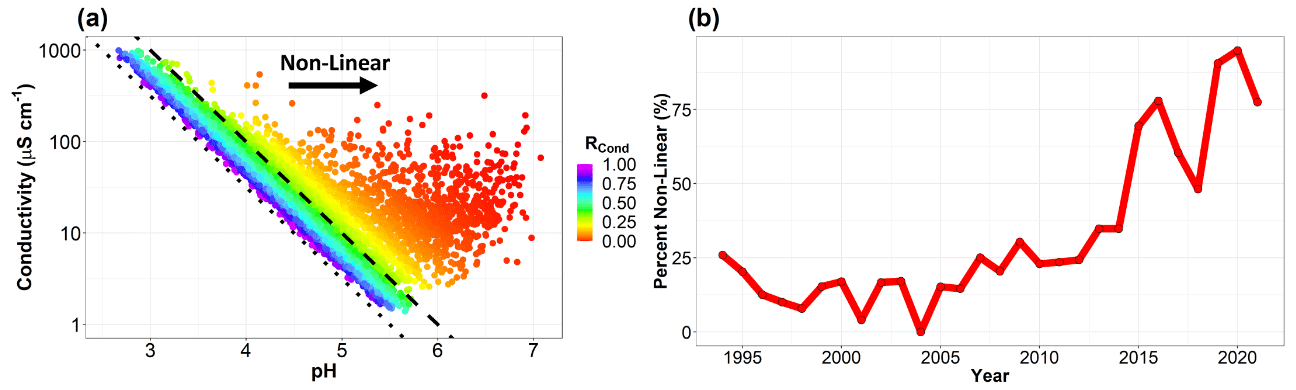
Figure 7(a) Conductivity and pH for individual cloud water samples from 1994 to 2021. The linear and non-linear regimes are distinguished with a dashed line that indicates H+ contribution to the measured conductivity is exactly 35 %. To the right of this line, H+ contributes less to the measured conductivity, and we refer to this as the non-linear regime, since conductivity and pH no longer exhibit a clear linear relationship. The dotted line represents the conductivity if H+ is the only ion present. (b) Percent of samples in the non-linear regime for each year of sampling at WFM.
Table 1Linear versus non-linear regime median concentrations for all measured analytes and associated p values for the Dunn test.

6.2 Linear regime vs non-linear regime
There are many similarities between the valid/invalid and linear/non-linear classifications. Figure 7b shows that a growing fraction of samples are in the non-linear regime, peaking at over 90 % of samples in 2020. Table 1 uses a Dunn test to compare median concentrations between the linear and non-linear regimes (averaged over all years for which data are available, i.e. 1994–2021 for all analytes except for TOC, which was averaged over 2009–2021). Conductivity and SO are nearly double and cloud water pH is 1 unit lower in the linear dataset compared to the non-linear dataset, highlighting the dominance of SO and H+ in the linear regime. There is no obvious difference in NO concentrations between the two datasets, implying that the controlling factors for NO are unrelated to the relationship between H+ and conductivity. Every other measured ion shows higher concentrations in the non-linear dataset than the linear dataset, with considerably higher concentrations of TOC, Ca2+ and Mg2+, and in addition, an overall greater ion imbalance. Therefore, the linear regime can be characterized as a highly acidified system controlled by SO, and the non-linear regime is a system with greater TOC, NH and base cations. The non-linear regime is becoming the predominate system in WFM cloud water.
6.3 Is cloud water representative of cloud droplets?
With the reductions in SO and NO, species such as Ca2+ have grown in relative importance to ion balance, conductivity and pH. Sources of atmospheric Ca2+ can include fossil fuel combustion in the form of fly ash (Lee and Pacyna, 1999), but the dominant source is generally thought to be mineral dust particles containing bases like calcium carbonate (CaCO3) and calcium oxide (CaO) (Reff et al., 2009). These particles typically raise the pH of cloud and rain water, particularly evident in observations from India (Khemani et al., 1987; Budhavant et al., 2014). Within WFM cloud water, there is a considerably higher concentration of Ca2+ for samples within the non-linear regime, contributing to the higher measured pH values.
Due to the mechanism by which they are lofted into the atmosphere, mineral dust aerosols are known to exist primarily in the coarse mode (i.e. with dry particle diameter > 1 µm) (Seinfeld and Pandis, 2016). While these aerosol particles can make up a substantial fraction of the overall aerosol mass concentration, they generally represent a very small fraction of the aerosol number concentration (Mahowald et al., 2014). Therefore, even if these particles are hygroscopic, only a small fraction of activated cloud droplets are likely affected by coarse mode aerosol, even at a remote location like WFM where aerosol concentrations are relatively low. During a pilot study at WFM in 2017, cloud droplets intercepted at the summit of WFM were shown to be primarily comprised of cloud condensation nuclei with 100–300 nm dry diameter (Lance et al., 2020), consistent with this general understanding.
When the rare alkaline cloud droplets, formed on coarse mineral dust aerosol, are collected by the cloud water collection system, they can have an out-sized impact on the bulk cloud water sample, which may no longer well represent the majority of cloud droplets as they existed in the cloud. This is supported by work from Moore et al. (2004) using a multistage cloud collector at WFM, which found that Ca2+ and Mg2+ concentrations were 2–30 and 2–58 times greater, respectively, in large droplets than small droplets. Size resolved aerosol composition data in nearby Ontario, Canada (VandenBoer et al., 2011) indicate that 65 %–95 % of the total aerosol Ca2+ mass and 78 %–99 % of Mg2+ were within super micron (> 1 µm) aerosol in 2009–2010 when those measurements were conducted, while > 99 % of the total number of aerosol were found in sub micron particles (Fig. S16).
Based on this general understanding of coarse mode aerosol, as discussed above, we expect that bulk collection of cloud water is often no longer representative of the vast majority of cloud droplets as they existed in the atmosphere and could bias our understanding of cloud droplet pH. In an attempt to better account for this potential bias, a new calculation for inferred pH of a typical cloud droplet (pHTD) is introduced:
where [H+], [Ca2+] and [Mg2+] are the measured concentrations in units of eq L−1 within bulk cloud water. We refer to this as the “top down” (TD) approach for estimating acidity of the majority of cloud droplets because it is based on the measured bulk cloud water pH, which is assumed to provide the cumulative impact from all dissolved ions (identified or not). By accounting for measured Ca2+ and Mg2+ concentrations, this calculation is an attempt to remove the influence of mineral dust particles on the bulk cloud water pH, assuming that measured Ca and Mg concentrations are associated with dissolved alkaline compounds such as CaCO3 or MgCO3 in equilibrium with atmospheric CO2, and that a very small number of droplets contain these minerals at all. These assumptions are supported by the assessment of Ca and Mg soluble fractions reported in Sect. S4 of the Supplement and the size-resolved aerosol composition measurements described in Sect. S13 of the Supplement. Additional measurements (e.g. size resolved aerosol and/or cloud droplet residual composition collocated with the cloud water measurements) would be needed to better constrain the cloud droplet pH estimate. While the measured pH of bulk cloud water is relevant for wet deposition, we propose that pHTD is more relevant for processes occurring within the majority of cloud droplets as they existed in the atmosphere.
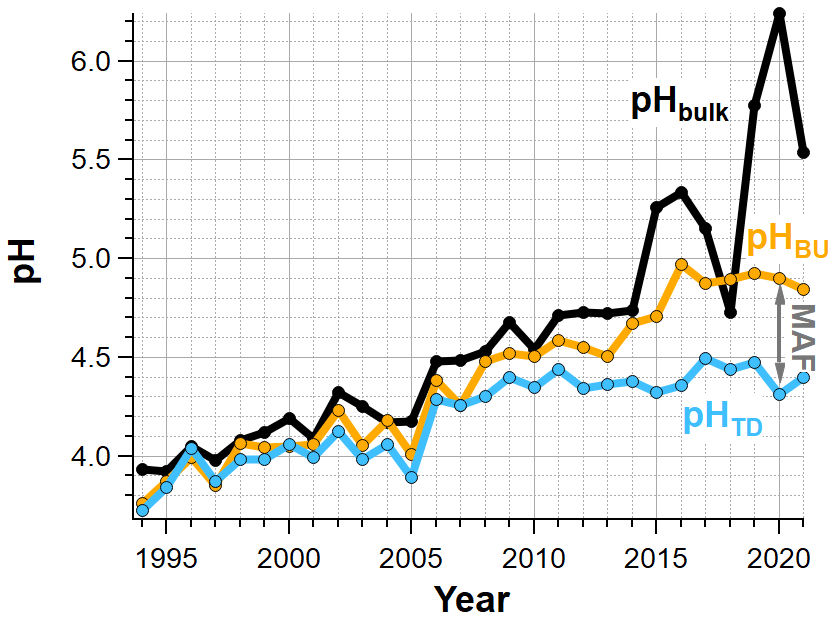
Figure 8Annual median bulk cloud water pH (black) compared to estimated cloud droplet pH calculated from the bulk cloud water pH and measured Ca2+ and Mg2+ concentrations (pHTD, blue) and estimated cloud droplet pH calculated from measured SO, NO and NH concentrations (pHBU, orange).
Figure 8 shows the annual median estimated cloud droplet pH (pHTD, blue) and measured bulk cloud water pH (black). During the first ∼ 10 years of the cloud water monitoring program, pHTD increases in parallel with pHbulk, but the influence of base cations on measured pH has grown over time. Despite measured pH continuing to increase, there has been little change in pHTD since ∼ 2010. In 2020, Ca2+ and Mg2+ are calculated to have increased the median cloud water pH from 4.3 to 6.2, resulting in nearly two orders of magnitude decrease in H+ concentrations.
To further evaluate the causative factors behind the growing discrepancy between the measured bulk cloud water pH and estimated cloud droplet pH, we also calculate one of the simplest pH proxies based on measured SO, NO and NH concentrations (Pye et al., 2020):
This “bottom up” (BU) approach includes the major inorganic species known to form through secondary processes, which are typically found in fine aerosol and are therefore typically found in the vast majority of cloud condensation nuclei. Gas phase NH3 and/or HNO3 that dissolved into cloud droplets are also included with this proxy method. Entirely neglected in this approach are contributions from organic acids within fine aerosols, or partitioning of organic acid gases to the aqueous phase after cloud droplet activation. Also, as noted previously, a substantial fraction of cloud water samples exhibit greater [NH] than [SO] + [NO], which corresponds to negative values for [H+]BU. This is a significant limitation for this proxy method in recent years, when over 40 % of cloud water samples exhibit this condition (Fig. 9). Since negative H+ values cannot be included in the pHBU calculation, only the samples traditionally expected to be acidic (i.e. those with relatively high SO and/or NO) are included in the annual average pHBU in Fig. 8. If cloud droplets are more acidic than pHBU, this implies that other ions within cloud droplets (other than SO or NO) are making significant contributions to the cloud droplet acidity.
Early in the cloud water monitoring program, annual median pHBU tracked pHTD well, indicating that SO, NO and NH concentrations alone were able to capture the estimated cloud droplet pH (within 0.2 pH units through 2009). In recent years, a growing discrepancy between annual median pHBU and pHTD is observed, with as much as 0.61 pH difference observed in 2016. These results indicate that SO, NO and NH are increasingly unable to explain the estimated cloud droplet pH.
In calculating pHTD, it is important to note that even though pH can shift dramatically when accounting for the influence from rare alkaline droplets, the cation anion ratio remains exactly the same as it was for bulk cloud water since the increased H+ is exactly balanced by the removal of the two base cation species (Ca2+ and Mg2+). Therefore, the reassessment of bulk cloud water data in terms of inferred cloud droplet acidity does not resolve the ion imbalance problem.
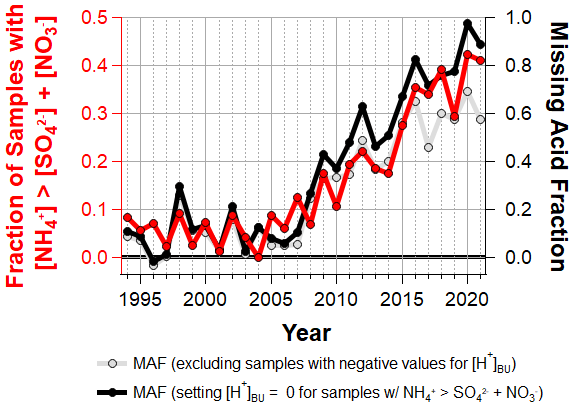
Figure 9Fraction of cloud water samples where [NH] > [SO] + [NO] (left axis) and annual median missing acid fraction (right axis).
The top down and bottom up approaches described above provide two independent estimates for cloud droplet pH. By comparing these two proxies, we then infer the fraction of cloud droplet acidity that is unexplained by the major inorganic ions. We define the missing acid fraction (MAF) as
When MAF is zero, the measured SO, NO and NH concentrations are sufficient to explain 100 % of the inferred cloud droplet acidity, and when MAF is 1.0, the measured SO, NO and NH concentrations explain 0 % of the inferred cloud droplet acidity. Figure 9 shows the annual median MAF with two different ways of handling samples with negative values for [H+]BU. First, samples with negative values for [H+]BU were excluded from the calculation (plotted in grey). Out of concern that a majority of cloud water samples now exhibit [NH] > [SO] + [NO], another calculation for MAF was performed by setting [H+]BU to zero for this subset of samples, as SO and NO are completely neutralized by NH under these conditions (plotted in black). Prior to ∼ 2008, [SO] + [NO] − [NH] was able to capture the inferred cloud droplet acidity typically within about 20 %. Since then, a rapid increase in the contribution of unmeasured ions to cloud droplet acidity is inferred from this dataset, with more than half of the inferred cloud droplet acidity left unexplained in the last several years.
6.4 Implications for cloud droplet pH
The large and growing discrepancy between estimated cloud droplet pH and measured SO, NO and NH concentrations over the past decade in cloud water at WFM coincides with a growing number of samples with higher conductivity than can be explained with the measured inorganic analytes (Fig. S11) and a growing abundance of cloud water organic carbon. Altogether, these independent measures provide strong support for the hypothesis that organic acids are growing in importance and now have a significant impact on cloud droplet acidity (further discussed in Sect. S14 of the Supplement). This is a major departure from the original intent of the collection site to monitor and investigate inorganic acid deposition.
In addition to increasing TOC concentrations, there is evidence that a growing fraction of TOC is ionic since the ion imbalance is growing faster than the increase in TOC concentrations (Fig. S15). Given that the proportion of organic acids in their deprotonated state is dependent on pH, and yet the estimated cloud droplet pH has been relatively flat for the past 15 years, the increasing ion imbalance suggests that organic acids could be increasing in total concentration as well as relative importance. Finally, annual median cloud droplet pH averages 4.4 for the years 2009 to 2021, which is close to the pKa for formic acid and acetic acid (pKa =3.74 and 4.75, respectively). These two organic acids have been found to be the most abundant organic acids in cloud and rain water (Khwaja, 1995; Keene and Galloway, 1986; Paulot et al., 2011; Herckes et al., 2013; Millet et al., 2015; Pye et al., 2020), but will contribute much less to ion balance at a pH of 4.4 than the annual median bulk cloud water pH of > 5.5 in recent years would suggest. Measured concentrations for a larger range of organic acids than typically analyzed for may be necessary to capture the important chemical species controlling cloud droplet pH.
A number of assumptions must be recognized when interpreting results from this simple analysis. For a more precise estimate of typical cloud droplet acidity, other ions associated with coarse mode aerosol, like NO, would also be included in the pHTD calculation. However, given that NO may be found predominantly in coarse or fine aerosol at different times (VandenBoer et al., 2011), the contribution from coarse mode NO is not sufficiently constrained by the measurements available. To the degree that NO is present in coarse mode aerosol along with Ca2+ and Mg2+, the calculation for pHTD would be an underestimate for cloud droplet pH. Similarly, pHBU would be underestimated to the same degree, since a fraction of NO would not have been present in cloud droplets that formed on fine aerosol, as had been assumed. A combination of NOx reductions and potentially increasing mineral dust aerosol within the region may be changing the fraction of NO3 within fine aerosol, which would need to be better constrained to improve our pHBU and MAF estimates.
Also implicitly assumed is that LWC associated with coarse mode aerosol is negligible for both the pHTD and pHBU proxies of cloud droplet pH. We argue that this is a decent assumption since, while the coarse mode aerosol can contribute significant aerosol mass in spite of extremely low number concentrations due to their much larger size (1–2 orders of magnitude larger diameter for the coarse mode than the accumulation mode), the relative contribution of liquid water from cloud droplets formed on coarse mode aerosol is much lower due to the inverse relationship between condensational growth rate and droplet diameter (i.e. droplets originating from the coarse and accumulation modes are likely to have diameters within a factor of two of each other, for non-precipitating clouds (Seinfeld and Pandis, 2016)).
Conversely, we argue that using the bulk cloud water pH as a constraint for simulations of gas/droplet partitioning and aqueous chemistry, without accounting for the aerosol mixing state, can lead to substantial biases for the vast majority of cloud droplets as they existed in the atmosphere. Size-resolved measurements of Ca2+, Mg2+ and NO in aerosol and/or cloud droplet residuals are required to confirm the validity of the pHTD estimates reported here in order to confidently and accurately evaluate these types of atmospheric processes. But, inferring cloud droplet pH as we do in this paper may yield a much better representation of a typical cloud droplet than the bulk cloud water measurements do in the present day.
While we cannot directly evaluate the validity of our simple calculation for pHTD with the current suite of measurements, it is encouraging that several important relationships are substantially simplified when evaluated against pHTD instead of the measured bulk cloud water pH. In particular, the relationship between pHTD, LWC and SO concentrations is much simpler and easier to explain (Fig. S18). For a given LWC, there is a clear inverse relationship between SO and pHTD, which maxes out at pHTD ∼ 5.6 at very low SO concentrations, coinciding with the pH expected for a pure water droplet in equilibrium with atmospheric CO2. In contrast, SO concentrations exhibit a much more chaotic relationship with measured bulk pH values.
The relationship between TOC concentrations and pHTD is also substantially simplified. Figure 10 shows that TOC concentrations are much better correlated with pHTD values throughout the entire dataset (2009–2021), as compared to measured bulk cloud water pH. This might imply that, like SO, organic compounds within cloud water are tightly linked with the cloud droplet pH. This finding may be consistent with the majority of organic aerosol mass being of secondary origin (Jimenez et al., 2009), since several known mechanisms for secondary organic aerosol (SOA) formation include acid dependent reactions (Hallquist et al., 2009; Tilgner et al., 2021). However, the other major secondary aerosol species including NH also show simplified relationships with pHTD as compared to measured bulk cloud water pH (Fig. S19), which may imply that the emissions sources or formation mechanisms for these chemical species are linked in other ways, in tandem with their known prevalence in fine aerosol.
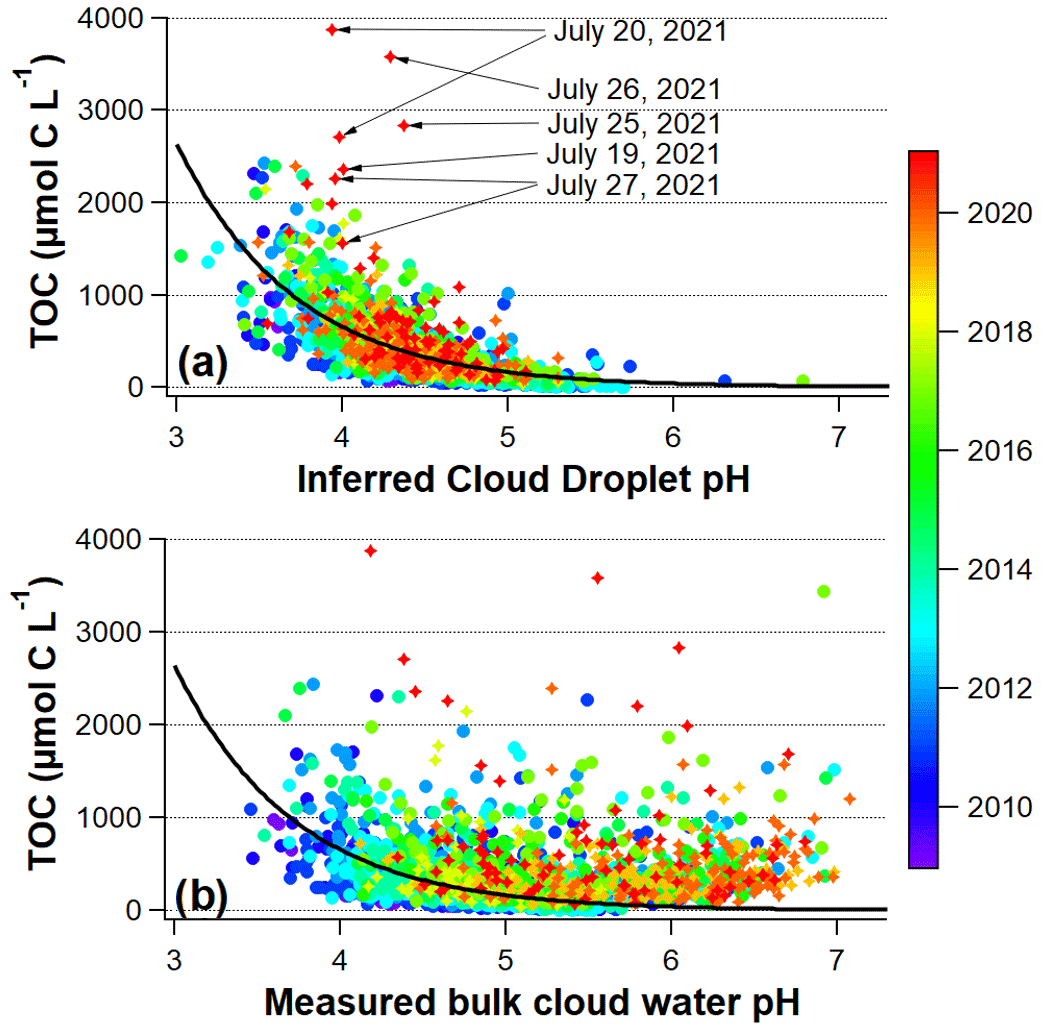
Figure 10Measured TOC concentrations for individual samples 2009–2017 (circles) and measured WSOC concentrations for individual samples 2018–2021 (stars), versus (a) inferred cloud droplet pH (pHTD) and (b) measured bulk cloud water pH, colored by the year that the cloud water sample was collected at WFM. The exponential curve in both (a) and (b) is the fit to all data in (a): , , .
6.5 Driving factors for increasing TOC
The growing abundance of TOC in cloud water (both in relative and absolute terms) may be at least partially due to an increase in partitioning of volatile low molecular weight organic acids to the condensed phase as a result of lower cloud droplet acidity (Tilgner et al., 2021). However, the strong inverse relationship between TOC and estimated cloud droplet pH (Fig. 10a) appears to undermine this hypothesis. Furthermore, SO concentrations and pHTD trends have been relatively flat in recent years, in contrast to the rapid increase in TOC concentrations, which shows no signs of slowing down. There is also evidence that cloud water TOC in the late 1980's and early 1990's, when cloud droplet acidity was very high, were similar to concentrations today (Khwaja et al., 1995; Anastasio et al., 1994), which would also suggest a decoupling of SO and TOC trends.
Another potential driving factor for the increasing TOC trend is an increase in wildfire smoke, which can be an important source of both primary and secondary organic matter in both aerosol and cloud water, even after multiple days of transport downwind (Cook et al., 2017; Di Lorenzo et al., 2018; Zhou et al., 2017; Lee et al., 2022). Figure 10a highlights several cloud water samples with exceptionally high measured WSOC concentrations coinciding with a haze event across the northeastern US in July 2021, associated with wildfire smoke originating in south central Canada and the northwestern US (Shrestha et al., 2022) (further described in Sect. S16 of the Supplement). Black carbon and carbon monoxide measurements from the summit of WFM were also unusually high (e.g. as high as 1780 ng m−3, compared to a more typical value of 100 ng m−3 for black carbon). The relatively close proximity of some of these fires to WFM may have been partly responsible for the exceptionally high WSOC concentrations and the strong deviation from the well established correlation with pHTD, possibly due to an unusually large contribution from freshly emitted primary organic matter. Episodic events with exceptionally high concentrations such as these are the reason we report annual median rather than annual mean concentrations for the long-term trends. The increasing median trend of K+, particularly since 2009 (Fig. S8), is potential evidence for increased smoke influence, as K+ is often used as a passive biomass burning tracer (Reid et al., 2005).
This work updates the long-term trend analysis of cloud water chemistry monitoring at Whiteface Mountain (WFM) over the past 28 years, with critical review of past methodologies resulting in significant changes to the data interpretation and additional analysis of TOC trends since 2009 when TOC was first routinely measured at WFM. In the past, many samples were excluded from analysis if they did not achieve an approximate ion balance from measured species. Using this criteria, a growing number of samples were being excluded from the dataset, peaking at 57 % of the samples in 2020, with no evidence of measurement error. When evaluating the complete dataset, decreases in SO, NH and NO become more modest; organic carbon increases at a much faster rate; and increasing trends in Ca2+ and Mg2+ emerge. The increasing fraction of samples that do not achieve ion balance is associated with an increasing inorganic cation anion ratio, implying there are anions that are not being measured with the long-term measurement suite, which are growing in abundance. When evaluating changes in cloud water loading (CWL), the trend in organic carbon is no longer significant, indicating that much of the trend in TOC was associated with variability in LWC. The increasing trend in Ca2+ CWL remains significant.
When investigating potential missing anions, HCO and organic acids were identified as two important candidates. Estimates of HCO using cloud water pH and atmospheric CO2 indicate that for most cloud water samples, HCO is negligible. For samples with pH > 6, which are growing more common, HCO and CO could be important. However, samples with bulk cloud water pH this high are often likely impacted by externally mixed alkaline droplets formed on coarse mineral dust aerosol that do not represent the majority of cloud droplets as they existed in the atmosphere. Organic acids are therefore likely more important than HCO for explaining ion imbalance for the majority of cloud droplets originating from fine (submicron) cloud condensation nuclei. VandenBoer et al. (2011) found that organic acids were found predominantly within submicron aerosol, which supports this hypothesis. The strong correlation between organic carbon and inorganic ion imbalance also supports this hypothesis, since organic acids are known to comprise a significant fraction of organic carbon.
In the early years of the cloud water monitoring program, conductivity was largely controlled by H+ due to its high concentrations and large molar conductivity relative to other ions in the system. In recent years, conductivity is no longer linearly proportional to H+ concentrations. We use the break down of the linear relationship between conductivity and H+ to characterize a new chemical regime that is less acidic but exhibits relatively high conductivity. A growing fraction of samples are now being classified in this non-linear regime, peaking at over 90 % of samples in 2020. The non-linear regime is characterized by higher concentrations of TOC, NH and base cations, particularly Ca2+.
Altogether, the reduction of SO and NO, and increases in Ca2+ and Mg2+, have resulted in a situation where bulk cloud water pH likely does not represent the majority of cloud droplets as they existed in the atmosphere, since Ca2+ and Mg2+ are believed to primarily reside in coarse aerosol that only represents a small fraction of cloud droplets. To account for this bias, we proposed a new calculation for “Estimated cloud droplet pH” that accounts for the measured Ca and Mg concentrations. While measured bulk cloud water pH has steadily increased for the entire duration of routine cloud water monitoring program, estimated cloud droplet pH has remained flat since 2009, implying that much of the increasing cloud water pH in recent years is driven by Ca2+ and Mg2+ rather than the reductions in SO.
A growing number of samples exhibit concentrations of NH that are greater than the sum of SO and NO concentrations, providing further evidence for a major missing source of acidity. For the samples where it is possible to predict cloud droplet acidity from the measured SO, NO and NH concentrations, a growing discrepancy is found in comparison to the estimated cloud droplet pH, with the majority of the inferred cloud droplet acidity unexplained by the measured SO, NO and NH concentrations in the past several years.
Considerable changes have occurred in cloud water at WFM over the past 28 years of monitoring, from a system dominated by SO to a system controlled by base cations and organic compounds. Many other regions in the world are seeing changes as SO2 emissions continue to decrease. This type of system is considerably less studied, with important implications for air quality, ecosystem health and climate. More research, in combination with additional measurements of aerosol and trace gases, are required to better understand the system. As WFM and potentially other regions of the world enter this new chemical regime, additional measurements will be needed to study the effect on important processes like secondary organic aerosol production and nitrogen deposition.
Cloud water data can be found at http://atmoschem.asrc.cestm.albany.edu/~cloudwater/pub/Data.htm (Lance, 2023). The code and data used to make the figures can be found at https://doi.org/10.5281/Zenodo.7379622 (Lawrence, 2022).
The supplement related to this article is available online at: https://doi.org/10.5194/acp-23-1619-2023-supplement.
JED and PS conducted the cloud water sampling and chemical analysis 2001–2017. PC, RB, CEL and SL conducted the cloud water sampling 2018–2021. DK and EY conducted the chemical analysis 2018–2019. PS conducted the chemical analysis 2020–2021. CEL and SL analyzed the datasets. CEL carried out the statistical analyses. CEL and SL wrote the paper with contributions from all co-authors.
The contact author has declared that none of the authors has any competing interests.
The New York State Energy Research and Development Authority (NYSERDA) has not reviewed the information contained herein, and the opinions expressed in this report do not necessarily reflect those of NYSERDA or the State of New York.
Publisher's note: Copernicus Publications remains neutral with regard to jurisdictional claims in published maps and institutional affiliations.
Cloud water measurements reported in this paper were supported by NYSERDA from 2001 to 2021. Previous cloud water measurements (1994–2000) conducted by MADPro were funded by the U.S. EPA under contract 68-02-4451 and 68-D2-0134. WFM trace gas and meteorological measurements were also supported by NYSERDA. Paul Casson and Sara Lance thank Eric Hebert for helping to set up the cloud water collection system. Sara Lance and Christopher E. Lawrence thank Gabriele Pfister and Rajesh Kumar of NCAR for providing output from the WRF-Chem forecast.
This research has been supported by the New York State Energy Research and Development Authority (grant nos. 124461 and 48971) and the National Aeronautics and Space Administration (grant no. 80NSSC21K1633).
This paper was edited by Barbara Ervens and reviewed by two anonymous referees.
Akpo, A. B., Galy-Lacaux, C., Laouali, D., Delon, C., Liousse, C., Adon, M., Gardrat, E., Mariscal, A., and Darakpa, C.: Precipitation chemistry and wet deposition in a remote wet savanna site in West Africa: Djougou (Benin), Atmos. Environ., 115, 110–123, https://doi.org/10.1016/j.atmosenv.2015.04.064, 2015. a
Aleksic, N. and Dukett, J. E.: Probabilistic relationship between liquid water content and ion concentrations in cloud water, Atmos. Res., 98, 400–405, https://doi.org/10.1016/j.atmosres.2010.08.003, 2010. a, b
Aleksic, N., Roy, K., Sistla, G., Dukett, J., Houck, N., and Casson, P.: Analysis of cloud and precipitation chemistry at Whiteface Mountain, NY, Atmos. Environ., 43, 2709–2716, https://doi.org/10.1016/j.atmosenv.2009.02.053, 2009. a, b
Anastasio, C., Faust, B., and Allen, J.: Aqueous phase photochemical formation of hydrogen peroxide in authentic cloud waters, J. Geophys. Res.-Atmos., 99, 8231–8248, https://doi.org/10.1029/94JD00085, 1994. a, b
Baumgardner, R. E., Kronmiller, K. G., Anderson, J. B., Bowser, J. J., and Edgerton, E. S.: Development of an automated cloud water collection system for use in atmospheric monitoring networks, Atmos. Environ., 31, 2003–2010, https://doi.org/10.1016/S1352-2310(96)00325-1, 1997. a
Baumgardner, R. E., Isil, S. S., Lavery, T. F., Rogers, C. M., and Mohnen, V. A.: Estimates of cloud water deposition at Mountain Acid Deposition Program sites in the Appalachian Mountains, J. Air Waste Manage., 53, 291–308, https://doi.org/10.1080/10473289.2003.10466153, 2003. a
Bravo, A. H., Soto, A., R., Sosa, E. R., Sánchez, A. P., Alarcón, J. A. L., Kahl, J., and Ruíz, B. J.: Effect of acid rain on building material of the El Tajín archaeological zone in Veracruz, Mexico, Environ. Pollut., 144, 655–660, https://doi.org/10.1016/j.envpol.2005.12.052, 2006. a
Brege, M., Paglione, M., Gilardoni, S., Decesari, S., Facchini, M. C., and Mazzoleni, L. R.: Molecular insights on aging and aqueous-phase processing from ambient biomass burning emissions-influenced Po Valley fog and aerosol, Atmos. Chem. Phys., 18, 13197–13214, https://doi.org/10.5194/acp-18-13197-2018, 2018. a
Budhavant, K., Rao, P., Safai, P., Granat, L., and Rodhe, H.: Chemical composition of the inorganic fraction of cloud-water at a high altitude station in West India, Atmos. Environ., 88, 59–65, https://doi.org/10.1016/j.atmosenv.2014.01.039, 2014. a, b
Cape, J. N., Cornell, S. E., Jickells, T. D., and Nemitz, E.: Organic nitrogen in the atmosphere – Where does it come from? A review of sources and methods, Atmos. Res., 102, 30–48, https://doi.org/10.1016/j.atmosres.2011.07.009, 2011. a
Cape, J. N., Smith, R. I., Fowler, D., Beswick, K., and Choularton, T.: Long-term trends in rain and cloud chemistry in a region of complex topography, Atmos. Res., 153, 335–347, https://doi.org/10.1016/j.atmosres.2014.09.003, 2015. a
Chapman, P. J., Clark, J. M., Reynolds, B., and Adamson, J. K.: The influence of organic acids in relation to acid deposition in controlling the acidity of soil and stream waters on a seasonal basis, Environ. Pollut., 151, 110–120, https://doi.org/10.1016/j.envpol.2007.03.001, 2008. a
Cook, R. D., Lin, Y.-H., Peng, Z., Boone, E., Chu, R. K., Dukett, J. E., Gunsch, M. J., Zhang, W., Tolic, N., Laskin, A., and Pratt, K. A.: Biogenic, urban, and wildfire influences on the molecular composition of dissolved organic compounds in cloud water, Atmos. Chem. Phys., 17, 15167–15180, https://doi.org/10.5194/acp-17-15167-2017, 2017. a, b, c
Coury, L.: Conductance Measurements Part 1: Theory, Current Separations, 3, p. 6, 1999. a
Deguillaume, L., Charbouillot, T., Joly, M., Vaïtilingom, M., Parazols, M., Marinoni, A., Amato, P., Delort, A.-M., Vinatier, V., Flossmann, A., Chaumerliac, N., Pichon, J. M., Houdier, S., Laj, P., Sellegri, K., Colomb, A., Brigante, M., and Mailhot, G.: Classification of clouds sampled at the puy de Dôme (France) based on 10 yr of monitoring of their physicochemical properties, Atmos. Chem. Phys., 14, 1485–1506, https://doi.org/10.5194/acp-14-1485-2014, 2014. a
Di Lorenzo, R. A., Place, B. K., VandenBoer, T. C., and Young, C. J.: Composition of Size-Resolved Aged Boreal Fire Aerosols: Brown Carbon, Biomass Burning Tracers, and Reduced Nitrogen, ACS Earth Space Chem., 2, 278–285, https://doi.org/10.1021/acsearthspacechem.7b00137, 2018. a
Driscoll, C. T., Lawrence, G. B., Bulger, A. J., Butler, T. J., Cronan, C. S., Eagar, C., Lambert, K. F., Likens, G. E., Stoddard, J. L., and Weathers, K. C.: Acidic Deposition in the Northeastern United States: Sources and Inputs, Ecosystem Effects, and Management Strategies: The effects of acidic deposition in the northeastern United States include the acidification of soil and water, which stresses terrestrial and aquatic biota, BioScience, 51, 180–198, https://doi.org/10.1641/0006-3568(2001)051[0180:ADITNU]2.0.CO;2, 2001. a
Driscoll, C. T., Driscoll, K. M., Fakhraei, H., and Civerolo, K.: Long-term temporal trends and spatial patterns in the acid-base chemistry of lakes in the Adirondack region of New York in response to decreases in acidic deposition, Atmos. Environ., 146, 5–14, https://doi.org/10.1016/j.atmosenv.2016.08.034, 2016. a
Dukett, J. E., Aleksic, N., Houck, N., Snyder, P., Casson, P., and Cantwell, M.: Progress toward clean cloud water at Whiteface Mountain New York, Atmos. Environ., 45, 6669–6673, https://doi.org/10.1016/j.atmosenv.2011.08.070, tex.ids= dukettProgressCleanCloud2011, 2011. a, b, c, d
Elbert, W., Hoffmann, M. R., Krämer, M., Schmitt, G., and Andreae, M. O.: Control of solute concentrations in cloud and fog water by liquid water content, Atmos. Environ., 34, 1109–1122, https://doi.org/10.1016/S1352-2310(99)00351-9, 2000. a, b
Ervens, B.: Modeling the Processing of Aerosol and Trace Gases in Clouds and Fogs, Chem. Rev., 115, 4157–4198, https://doi.org/10.1021/cr5005887, 2015. a
Falconer, R. E. and Falconer, P. D.: Determination of cloud water acidity at a mountain observatory in the Adirondack Mountains of New York State, J. Geophys. Res.-Oceans, 85, 7465–7470, https://doi.org/10.1029/JC085iC12p07465, 1980. a
Feng, J., Vet, R., Cole, A., Zhang, L., Cheng, I., O'Brien, J., and Macdonald, A.-M.: Inorganic chemical components in precipitation in the eastern U.S. and Eastern Canada during 1989–2016: Temporal and regional trends of wet concentration and wet deposition from the NADP and CAPMoN measurements, Atmos. Environ., 254, 118367, https://doi.org/10.1016/j.atmosenv.2021.118367, 2021. a, b
Gerber, H.: Direct measurement of suspended particulate volume concentration and far-infrared extinction coefficient with a laser-diffraction instrument, Appl. Optics, 30, 4824–4831, https://doi.org/10.1364/AO.30.004824, 1991. a
Giulianelli, L., Gilardoni, S., Tarozzi, L., Rinaldi, M., Decesari, S., Carbone, C., Facchini, M. C., and Fuzzi, S.: Fog occurrence and chemical composition in the Po valley over the last twenty years, Atmos. Environ., 98, 394–401, https://doi.org/10.1016/j.atmosenv.2014.08.080, 2014. a
Gorham, E.: Acid deposition and its ecological effects: a brief history of research, Environ. Sci. Policy, 1, 153–166, https://doi.org/10.1016/S1462-9011(98)00025-2, 1998. a
Graber, E. R. and Rudich, Y.: Atmospheric HULIS: How humic-like are they? A comprehensive and critical review, Atmos. Chem. Phys., 6, 729–753, https://doi.org/10.5194/acp-6-729-2006, 2006. a, b
Hallquist, M., Wenger, J. C., Baltensperger, U., Rudich, Y., Simpson, D., Claeys, M., Dommen, J., Donahue, N. M., George, C., Goldstein, A. H., Hamilton, J. F., Herrmann, H., Hoffmann, T., Iinuma, Y., Jang, M., Jenkin, M. E., Jimenez, J. L., Kiendler-Scharr, A., Maenhaut, W., McFiggans, G., Mentel, Th. F., Monod, A., Prévôt, A. S. H., Seinfeld, J. H., Surratt, J. D., Szmigielski, R., and Wildt, J.: The formation, properties and impact of secondary organic aerosol: current and emerging issues, Atmos. Chem. Phys., 9, 5155–5236, https://doi.org/10.5194/acp-9-5155-2009, 2009. a
Herckes, P., Valsaraj, K. T., and Collett, J. L.: A review of observations of organic matter in fogs and clouds: Origin, processing and fate, Atmos. Res., 132–133, 434–449, https://doi.org/10.1016/j.atmosres.2013.06.005, 2013. a, b, c, d, e, f, g
Herckes, P., Marcotte, A. R., Wang, Y., and Collett, J. L.: Fog composition in the Central Valley of California over three decades, Atmos. Res., 151, 20–30, https://doi.org/10.1016/j.atmosres.2014.01.025, 2015. a
Isil, S., Mohnen, V. A., Lovett, G., Miller, E., Anderson, J. G., Lavery, T., and Baumgardner, R.: Mountain Acid Deposition Program (MADPro) Cloud Deposition to the Appalachina Mountains 1994 to 1999 Report, Tech. Rep. EPA/600/R–01/016, U.S, Environmental Protection Agency (EPA), Office of Research and Development, Washington, DC, 2000. a
Isil, S., Collett, J., Lynch, J., Weiss-Penzias, P., and Rogers, C. M.: Cloud and fog deposition: Monitoring in high elevation and coastal ecosystems. The past, present, and future, Atmos. Environ., 274, 118997, https://doi.org/10.1016/j.atmosenv.2022.118997, 2022. a
Jimenez, J. L., Canagaratna, M. R., Donahue, N. M., Prevot, A. S. H., Zhang, Q., Kroll, J. H., DeCarlo, P. F., Allan, J. D., Coe, H., Ng, N. L., Aiken, A. C., Docherty, K. S., Ulbrich, I. M., Grieshop, A. P., Robinson, A. L., Duplissy, J., Smith, J. D., Wilson, K. R., Lanz, V. A., Hueglin, C., Sun, Y. L., Tian, J., Laaksonen, A., Raatikainen, T., Rautiainen, J., Vaattovaara, P., Ehn, M., Kulmala, M., Tomlinson, J. M., Collins, D. R., Cubison, M. J., E., Dunlea, J., Huffman, J. A., Onasch, T. B., Alfarra, M. R., Williams, P. I., Bower, K., Kondo, Y., Schneider, J., Drewnick, F., Borrmann, S., Weimer, S., Demerjian, K., Salcedo, D., Cottrell, L., Griffin, R., Takami, A., Miyoshi, T., Hatakeyama, S., Shimono, A., Sun, J. Y., Zhang, Y. M., Dzepina, K., Kimmel, J. R., Sueper, D., Jayne, J. T., Herndon, S. C., Trimborn, A. M., Williams, L. R., Wood, E. C., Middlebrook, A. M., Kolb, C. E., Baltensperger, U., and Worsnop, D. R.: Evolution of Organic Aerosols in the Atmosphere, Science, 326, 1525–1529, https://doi.org/10.1126/science.1180353, 2009. a, b, c
Kanakidou, M., Myriokefalitakis, S., Daskalakis, N., Fanourgakis, G., Nenes, A., Baker, A. R., Tsigaridis, K., and Mihalopoulos, N.: Past, Present and Future Atmospheric Nitrogen Deposition, J. Atmos. Sci., 73, 2039–2047, https://doi.org/10.1175/JAS-D-15-0278.1, 2016. a
Keene, W. C. and Galloway, J. N.: Considerations regarding sources for formic and acetic acids in the troposphere, J. Geophys. Res.-Atmos., 91, 14466–14474, https://doi.org/10.1029/JD091iD13p14466, 1986. a
Khemani, L. T., Momin, G. A., Naik, M. S., Rao, P. S. P., Safai, P. D., and Murty, A. S. R.: Influence of alkaline particulates on pH of cloud and rain water in India, Atmos. Environ., 21, 1137–1145, https://doi.org/10.1016/0004-6981(87)90241-1, 1987. a, b
Khwaja, H. A.: Atmospheric concentrations of carboxylic acids and related compounds at a semiurban site, Atmos. Environ., 29, 127–139, https://doi.org/10.1016/1352-2310(94)00211-3, 1995. a
Khwaja, H. A., Brudnoy, S., and Husain, L.: Chemical characterization of three summer cloud episodes at whiteface mountain, Chemosphere, 31, 3357–3381, https://doi.org/10.1016/0045-6535(95)00187-D, 1995. a, b, c, d
Kiehl, J. T. and Briegleb, B. P.: The Relative Roles of Sulfate Aerosols and Greenhouse Gases in Climate Forcing, Science, 260, 311–314, https://doi.org/10.1126/science.260.5106.311, 1993. a
Kim, H., Collier, S., Ge, X., Xu, J., Sun, Y., Jiang, W., Wang, Y., Herckes, P., and Zhang, Q.: Chemical processing of water-soluble species and formation of secondary organic aerosol in fogs, Atmos. Environ., 200, 158–166, https://doi.org/10.1016/j.atmosenv.2018.11.062, 2019. a, b
Lance, S.: Whiteface Mountain Cloud Water Chemical Composition 2018–2021, http://atmoschem.asrc.cestm.albany.edu/~cloudwater/pub/Data.htm, last access: 24 January 2023. a
Lance, S., Zhang, J., Schwab, J. J., Casson, P., Brandt, R. E., Fitzjarrald, D. R., Schwab, M. J., Sicker, J., Lu, C.-H., Chen, S.-P., Yun, J., Freedman, J. M., Shrestha, B., Min, Q., Beauharnois, M., Crandall, B., Joseph, E., Brewer, M. J., Minder, J. R., Orlowski, D., Christiansen, A., Carlton, A. G., and Barth, M. C.: Overview of the CPOC Pilot Study at Whiteface Mountain, NY: Cloud Processing of Organics within Clouds (CPOC), B. Am. Meteorol. Soc., 101, E1820–E1841, https://doi.org/10.1175/BAMS-D-19-0022.1, 2020. a
Lawrence, C.: Plot Code for Long-Term Monitoring of Cloud Water Chemistry at Whiteface Mountain: The Emergence of New Chemical Regime (v1,0.1) Zenodo [code and data set] https://doi.org/10.5281/zenodo.7379622, 2022. a
Lawrence, G. B. and David, M. B.: Response of Aluminum Solubility to Elevated Nitrification in Soil of a Red Spruce Stand in Eastern Maine, Environ. Sci. Technol., 31, 825–830, https://doi.org/10.1021/es960515j, 1997. a
Lee, D. S. and Pacyna, J. M.: An industrial emissions inventory of calcium for Europe, Atmos. Environ., 33, 1687–1697, https://doi.org/10.1016/S1352-2310(98)00286-6, 1999. a
Lee, J. Y., Peterson, P. K., Vear, L. R., Cook, R. D., Sullivan, A. P., Smith, E., Hawkins, L. N., Olson, N. E., Hems, R., Snyder, P. K., and Pratt, K. A.: Wildfire Smoke Influence on Cloud Water Chemical Composition at Whiteface Mountain, New York, J. Geophys. Res.-Atmos., 127, e2022JD037177, https://doi.org/10.1029/2022JD037177, 2022. a, b
Likens, G., Driscoll, C., Buso, D., Siccama, T., Johnson, C., Lovett, G., Fahey, T., Reiners, W., Ryan, D., Martin, C., and Bailey, S.: The biogeochemistry of calcium at Hubbard Brook, Biogeochem., 41, 89–173, https://doi.org/10.1023/A:1005984620681, 1998. a
Liu, L., Zhang, X., Wong, A. Y. H., Xu, W., Liu, X., Li, Y., Mi, H., Lu, X., Zhao, L., Wang, Z., Wu, X., and Wei, J.: Estimating global surface ammonia concentrations inferred from satellite retrievals, Atmos. Chem. Phys., 19, 12051–12066, https://doi.org/10.5194/acp-19-12051-2019, 2019. a
Mahowald, N., Albani, S., Kok, J. F., Engelstaeder, S., Scanza, R., Ward, D. S., and Flanner, M. G.: The size distribution of desert dust aerosols and its impact on the Earth system, Aeolian Res., 15, 53–71, https://doi.org/10.1016/j.aeolia.2013.09.002, 2014. a
Marinoni, A., Laj, P., Sellegri, K., and Mailhot, G.: Cloud chemistry at the Puy de Dôme: variability and relationships with environmental factors, Atmos. Chem. Phys., 4, 715–728, https://doi.org/10.5194/acp-4-715-2004, 2004. a, b
McNeill, V. F.: Aqueous Organic Chemistry in the Atmosphere: Sources and Chemical Processing of Organic Aerosols, Environ. Sci. Technol., 49, 1237–1244, https://doi.org/10.1021/es5043707, 2015. a
Mekis, E., Donaldson, N., Reid, J., Zucconi, A., Hoover, J., Li, Q., Nitu, R., and Melo, S.: An Overview of Surface-Based Precipitation Observations at Environment and Climate Change Canada, Atmos.-Ocean, 56, 71–95, https://doi.org/10.1080/07055900.2018.1433627, 2018. a
Menz, F. C. and Seip, H. M.: Acid rain in Europe and the United States: an update, Environ. Sci. Policy, 7, 253–265, https://doi.org/10.1016/j.envsci.2004.05.005, 2004. a
Millet, D. B., Baasandorj, M., Farmer, D. K., Thornton, J. A., Baumann, K., Brophy, P., Chaliyakunnel, S., de Gouw, J. A., Graus, M., Hu, L., Koss, A., Lee, B. H., Lopez-Hilfiker, F. D., Neuman, J. A., Paulot, F., Peischl, J., Pollack, I. B., Ryerson, T. B., Warneke, C., Williams, B. J., and Xu, J.: A large and ubiquitous source of atmospheric formic acid, Atmos. Chem. Phys., 15, 6283–6304, https://doi.org/10.5194/acp-15-6283-2015, 2015. a
Mohnen, V. A.: Cloud water collection from aircraft, Atmos. Technol., United States, 12, https://www.osti.gov/biblio/6320448-cloud-water-collection-from-aircraft (last access: 8 April 2021), 1980. a
Mohnen, V. A. and Vong, R. J.: A climatology of cloud chemistry for the eastern United States derived from the mountain cloud chemistry project, Environ. Rev., 1, 38–54, 1993. a
Moore, K. F., Eli Sherman, D., Reilly, J. E., Hannigan, M. P., Lee, T., and Collett, J. L.: Drop size-dependent chemical composition of clouds and fogs. Part II: Relevance to interpreting the aerosol/trace gas/fog system, Atmos. Environ., 38, 1403–1415, https://doi.org/10.1016/j.atmosenv.2003.12.014, 2004. a
Murray, G. L. D., Kimball, K. D., Hill, L. B., Hislop, J. E., and Weathers, K. C.: Long-Term Trends in Cloud and Rain Chemistry on Mount Washington, New Hampshire, Water Air Soil Pollut., 224, 1653, https://doi.org/10.1007/s11270-013-1653-7, 2013. a
Myhre, G., Shindell, D., Bréon, F.-M., Collins, W., Fuglestvedt, J., Huang, J., Koch, D., Lamarque, J.-F., Lee, D., Mendoza, B., Nakajima, T., Robock, A., Stephens, G., Zhang, H., Aamaas, B., Boucher, O., Dalsøren, S. B., Daniel, J. S., Forster, P., Granier, C., Haigh, J., Hodnebrog, O., Kaplan, J. O., Marston, G., Nielsen, C. J., O’Neill, B. C., Peters, G. P., Pongratz, J., Ramaswamy, V., Roth, R., Rotstayn, L., Smith, S. J., Stevenson, D., Vernier, J.-P., Wild, O., Young, P., Jacob, D., Ravishankara, A. R., and Shine, K.: Anthropogenic and Natural Radiative Forcing, IPCC, 5, p. 82, 2013. a
Pachon, J. E., Weber, R. J., Zhang, X., Mulholland, J. A., and Russell, A. G.: Revising the use of potassium (K) in the source apportionment of PM2.5, Atmos. Pollut. Res., 4, 14–21, https://doi.org/10.5094/APR.2013.002, 2013. a
Paerl, H. W. and Otten, T. G.: Harmful cyanobacterial blooms: causes, consequences, and controls, Microb. Ecol., 65, 995–1010, https://doi.org/10.1007/s00248-012-0159-y, 2013. a
Pandis, S. N. and Seinfeld, J. H.: Should bulk cloudwater or fogwater samples obey Henry's law?, J. Geophys. Res.-Atmos., 96, 10791–10798, https://doi.org/10.1029/91JD01031, 1991. a
Paulot, F., Wunch, D., Crounse, J. D., Toon, G. C., Millet, D. B., DeCarlo, P. F., Vigouroux, C., Deutscher, N. M., González Abad, G., Notholt, J., Warneke, T., Hannigan, J. W., Warneke, C., de Gouw, J. A., Dunlea, E. J., De Mazière, M., Griffith, D. W. T., Bernath, P., Jimenez, J. L., and Wennberg, P. O.: Importance of secondary sources in the atmospheric budgets of formic and acetic acids, Atmos. Chem. Phys., 11, 1989–2013, https://doi.org/10.5194/acp-11-1989-2011, 2011. a
Perminova, I. V., Frimmel, F. H., Kudryavtsev, A. V., Kulikova, N. A., Abbt-Braun, G., Hesse, S., and Petrosyan, V. S.: Molecular Weight Characteristics of Humic Substances from Different Environments As Determined by Size Exclusion Chromatography and Their Statistical Evaluation, Environ. Sci. Technol., 37, 2477–2485, https://doi.org/10.1021/es0258069, 2003. a, b
Pope, A. and Dockery, D. W.: Health Effects of Fine Particulate Air Pollution: Lines that Connect, J. Air Waste Manage., 56, 709–742, https://doi.org/10.1080/10473289.2006.10464485, 2006. a
Pye, H. O. T., Nenes, A., Alexander, B., Ault, A. P., Barth, M. C., Clegg, S. L., Collett Jr., J. L., Fahey, K. M., Hennigan, C. J., Herrmann, H., Kanakidou, M., Kelly, J. T., Ku, I.-T., McNeill, V. F., Riemer, N., Schaefer, T., Shi, G., Tilgner, A., Walker, J. T., Wang, T., Weber, R., Xing, J., Zaveri, R. A., and Zuend, A.: The acidity of atmospheric particles and clouds, Atmos. Chem. Phys., 20, 4809–4888, https://doi.org/10.5194/acp-20-4809-2020, 2020. a, b, c
Qin, J., Zhang, L., Qin, Y., Shi, S., Li, J., Gao, Y., Tan, J., and Wang, X.: pH-Dependent Chemical Transformations of Humic-Like Substances and Further Cognitions Revealed by Optical Methods, Environ. Sci. Technol., 56, 7578–7587, https://doi.org/10.1021/acs.est.1c07729, 2022. a
Rattigan, O. V., Civerolo, K. L., and Felton, H. D.: Trends in wet precipitation, particulate, and gas-phase species in New York State, Atmos. Pollut. Res., 8, 1090–1102, https://doi.org/10.1016/j.apr.2017.04.007, 2017. a, b, c, d
R Core Team: R: A language and environment for statistical computing, https://www.R-project.org/, last access: 9 August 2021. a
Reff, A., Bhave, P. V., Simon, H., Pace, T. G., Pouliot, G. A., Mobley, J. D., and Houyoux, M.: Emissions Inventory of PM2.5 Trace Elements across the United States, Environ. Sci. Technol., 43, 5790–5796, https://doi.org/10.1021/es802930x, 2009. a
Reid, J. S., Koppmann, R., Eck, T. F., and Eleuterio, D. P.: A review of biomass burning emissions part II: intensive physical properties of biomass burning particles, Atmos. Chem. Phys., 5, 799–825, https://doi.org/10.5194/acp-5-799-2005, 2005. a
Salma, I. and Láng, G. G.: How many carboxyl groups does an average molecule of humic-like substances contain?, Atmos. Chem. Phys., 8, 5997–6002, https://doi.org/10.5194/acp-8-5997-2008, 2008. a
Sander, R.: Compilation of Henry's law constants (version 4.0) for water as solvent, Atmos. Chem. Phys., 15, 4399–4981, https://doi.org/10.5194/acp-15-4399-2015, 2015. a
Šantl Temkiv, T., Amato, P., Casamayor, E. O., Lee, P. K. H., and Pointing, S. B.: Microbial ecology of the atmosphere, FEMS Microbio. Rev., 46, fuac009, https://doi.org/10.1093/femsre/fuac009, 2022. a
Schwab, J. J., Casson, P., Brandt, R., Husain, L., Dutkewicz, V., Wolfe, D., Demerjian, K. L., Civerolo, K. L., Rattigan, O. V., Felton, H. D., and Dukett, J. E.: Atmospheric Chemistry Measurements at Whiteface Mountain, NY: Cloud Water Chemistry, Precipitation Chemistry, and Particulate Matter, Aerosol Air Qual. Res., 16, 841–854, https://doi.org/10.4209/aaqr.2015.05.0344, 2016a. a, b
Schwab, J. J., Wolfe, D., Casson, P., Brandt, R., Demerjian, K. L., Husain, L., Dutkiewicz, V. A., Civerolo, K. L., and Rattigan, O. V.: Atmospheric Science Research at Whiteface Mountain, NY: Site Description and History, Aerosol Air Qual. Res., 16, 827–840, https://doi.org/10.4209/aaqr.2015.05.0343, 2016b. a, b, c, d
Seinfeld, J. H. and Pandis, S. N.: Atmospheric Chemistry and Physics: From Air Pollution to Climate Change, Wiley, 3rd Edn., ISBN 978-1-118-94740-1, 2016. a, b, c, d
Sen, P. K.: Estimates of the Regression Coefficient Based on Kendall's Tau, J. Am. Stat. Assoc., 63, 1379–1389, https://doi.org/10.2307/2285891, 1968. a
Shrestha, B., Brotzge, J. A., and Wang, J.: Observations and Impacts of Long-Range Transported Wildfire Smoke on Air Quality Across New York State During July 2021, Geophys. Res. Lett., 49, e2022GL100216, https://doi.org/10.1029/2022GL100216, 2022. a
Simoneit, B. R. T.: Biomass burning – a review of organic tracers for smoke from incomplete combustion, Appl. Geochem., 17, 129–162, https://doi.org/10.1016/S0883-2927(01)00061-0, 2002. a
Spranger, T., van Pinxteren, D., and Herrmann, H.: Atmospheric “HULIS” in Different Environments: Polarities, Molecular Sizes, and Sources Suggest More Than 50 % Are Not “Humic-like”, ACS Earth Space Chem., 4, 272–282, https://doi.org/10.1021/acsearthspacechem.9b00299, 2020. a
Stevens, C. J., David, T. I., and Storkey, J.: Atmospheric nitrogen deposition in terrestrial ecosystems: Its impact on plant communities and consequences across trophic levels, Funct. Ecol., 32, 1757–1769, https://doi.org/10.1111/1365-2435.13063, 2018. a
Straub, D. J.: Radiation fog chemical composition and its temporal trend over an eight year period, Atmos. Environ., 148, 49–61, https://doi.org/10.1016/j.atmosenv.2016.10.031, 2017. a, b, c
Thornton, J. A., Mohr, C., Schobesberger, S., D’Ambro, E. L., Lee, B. H., and Lopez-Hilfiker, F. D.: Evaluating Organic Aerosol Sources and Evolution with a Combined Molecular Composition and Volatility Framework Using the Filter Inlet for Gases and Aerosols (FIGAERO), Accounts Chem. Res., 53, 1415–1426, https://doi.org/10.1021/acs.accounts.0c00259, 2020. a
Tian, D. and Niu, S.: A global analysis of soil acidification caused by nitrogen addition, Environ. Res. Lett., 10, 024019, https://doi.org/10.1088/1748-9326/10/2/024019, 2015. a
Tilgner, A., Schaefer, T., Alexander, B., Barth, M., Collett Jr., J. L., Fahey, K. M., Nenes, A., Pye, H. O. T., Herrmann, H., and McNeill, V. F.: Acidity and the multiphase chemistry of atmospheric aqueous particles and clouds, Atmos. Chem. Phys., 21, 13483–13536, https://doi.org/10.5194/acp-21-13483-2021, 2021. a, b
US EPA: Air Pollutant Emissions Trends Data, https://www.epa.gov/air-emissions-inventories/air-pollutant-emissions-trends-data, last access: 13 November 2019. a, b
VandenBoer, T. C., Petroff, A., Markovic, M. Z., and Murphy, J. G.: Size distribution of alkyl amines in continental particulate matter and their online detection in the gas and particle phase, Atmos. Chem. Phys., 11, 4319–4332, https://doi.org/10.5194/acp-11-4319-2011, 2011. a, b, c
van Pinxteren, D., Fomba, K. W., Mertes, S., Müller, K., Spindler, G., Schneider, J., Lee, T., Collett, J. L., and Herrmann, H.: Cloud water composition during HCCT-2010: Scavenging efficiencies, solute concentrations, and droplet size dependence of inorganic ions and dissolved organic carbon, Atmos. Chem. Phys., 16, 3185–3205, https://doi.org/10.5194/acp-16-3185-2016, 2016. a
Wang, Z., Mora Ramirez, M., Dadashazar, H., MacDonald, A. B., Crosbie, E., Bates, K. H., Coggon, M. M., Craven, J. S., Lynch, P., Campbell, J. R., Azadi Aghdam, M., Woods, R. K., Jonsson, H., Flagan, R. C., Seinfeld, J. H., and Sorooshian, A.: Contrasting cloud composition between coupled and decoupled marine boundary layer clouds, J. Geophys. Res.-Atmos., 121, 11679–11691, https://doi.org/10.1002/2016JD025695, 2016. a
Warner, J. X., Dickerson, R. R., Wei, Z., Strow, L. L., Wang, Y., and Liang, Q.: Increased atmospheric ammonia over the world's major agricultural areas detected from space, Geophys. Res. Lett., 44, 2875–2884, https://doi.org/10.1002/2016GL072305, 2017. a
Watanabe, K., Ji, J., Harada, H., Sunada, Y., and Honoki, H.: Recent Characteristics of Fog Water Chemistry at Mt. Tateyama, Central Japan: Recovery from High Sulfate and Acidity, Water Air Soil Pollut., 233, 300, https://doi.org/10.1007/s11270-022-05778-4, 2022. a
Winiwarter, W., Fierlinger, H., Puxbaum, H., Facchini, M. C., Arends, B. G., Fuzzi, S., Schell, D., Kaminski, U., Pahl, S., Schneider, T., Berner, A., Solly, I., and Kruisz, C.: Henry's law and the behavior of weak acids and bases in fog and cloud, J. Atmos. Chem., 19, 173–188, https://doi.org/10.1007/BF00696588, 1994. a
Xie, S., Qi, L., and Zhou, D.: Investigation of the effects of acid rain on the deterioration of cement concrete using accelerated tests established in laboratory, Atmos. Environ., 38, 4457–4466, https://doi.org/10.1016/j.atmosenv.2004.05.017, 2004. a
Yamaguchi, T., Katata, G., Noguchi, I., Sakai, S., Watanabe, Y., Uematsu, M., and Furutani, H.: Long-term observation of fog chemistry and estimation of fog water and nitrogen input via fog water deposition at a mountainous site in Hokkaido, Japan, Atmos. Res., 151, 82–92, https://doi.org/10.1016/j.atmosres.2014.01.023, 2015. a
Yu, F., Nair, A. A., and Luo, G.: Long-Term Trend of Gaseous Ammonia Over the United States: Modeling and Comparison With Observations, J. Geophys. Res.-Atmos., 123, 8315–8325, https://doi.org/10.1029/2018JD028412, 2018. a
Zhang, F., Yu, X., Sui, X., Chen, J., Zhu, Z., and Yu, X.-Y.: Evolution of aqSOA from the Air–Liquid Interfacial Photochemistry of Glyoxal and Hydroxyl Radicals, Environ. Sci. Technol., 53, 10236–10245, https://doi.org/10.1021/acs.est.9b03642, 2019. a
Zhou, S., Collier, S., Jaffe, D. A., Briggs, N. L., Hee, J., Sedlacek III, A. J., Kleinman, L., Onasch, T. B., and Zhang, Q.: Regional influence of wildfires on aerosol chemistry in the western US and insights into atmospheric aging of biomass burning organic aerosol, Atmos. Chem. Phys., 17, 2477–2493, https://doi.org/10.5194/acp-17-2477-2017, 2017. a
- Abstract
- Introduction
- Collection history, methods, laboratory procedure and data analysis
- Long-term trends
- Relationship between cloud chemistry and liquid water content
- Potential missing ions
- A new chemical regime
- Summary and conclusions
- Code and data availability
- Author contributions
- Competing interests
- Disclaimer
- Acknowledgements
- Financial support
- Review statement
- References
- Supplement
clean.
- Abstract
- Introduction
- Collection history, methods, laboratory procedure and data analysis
- Long-term trends
- Relationship between cloud chemistry and liquid water content
- Potential missing ions
- A new chemical regime
- Summary and conclusions
- Code and data availability
- Author contributions
- Competing interests
- Disclaimer
- Acknowledgements
- Financial support
- Review statement
- References
- Supplement