the Creative Commons Attribution 4.0 License.
the Creative Commons Attribution 4.0 License.
 | 24 Jan 2023
Mercury in the free troposphere and bidirectional atmosphere–vegetation exchanges – insights from Maïdo mountain observatory in the Southern Hemisphere tropics
Alkuin M. Koenig
Olivier Magand
Bert Verreyken
Jerome Brioude
Crist Amelynck
Niels Schoon
Aurélie Colomb
Beatriz Ferreira Araujo
Michel Ramonet
Mahesh K. Sha
Jean-Pierre Cammas
Jeroen E. Sonke
Aurélien Dommergue
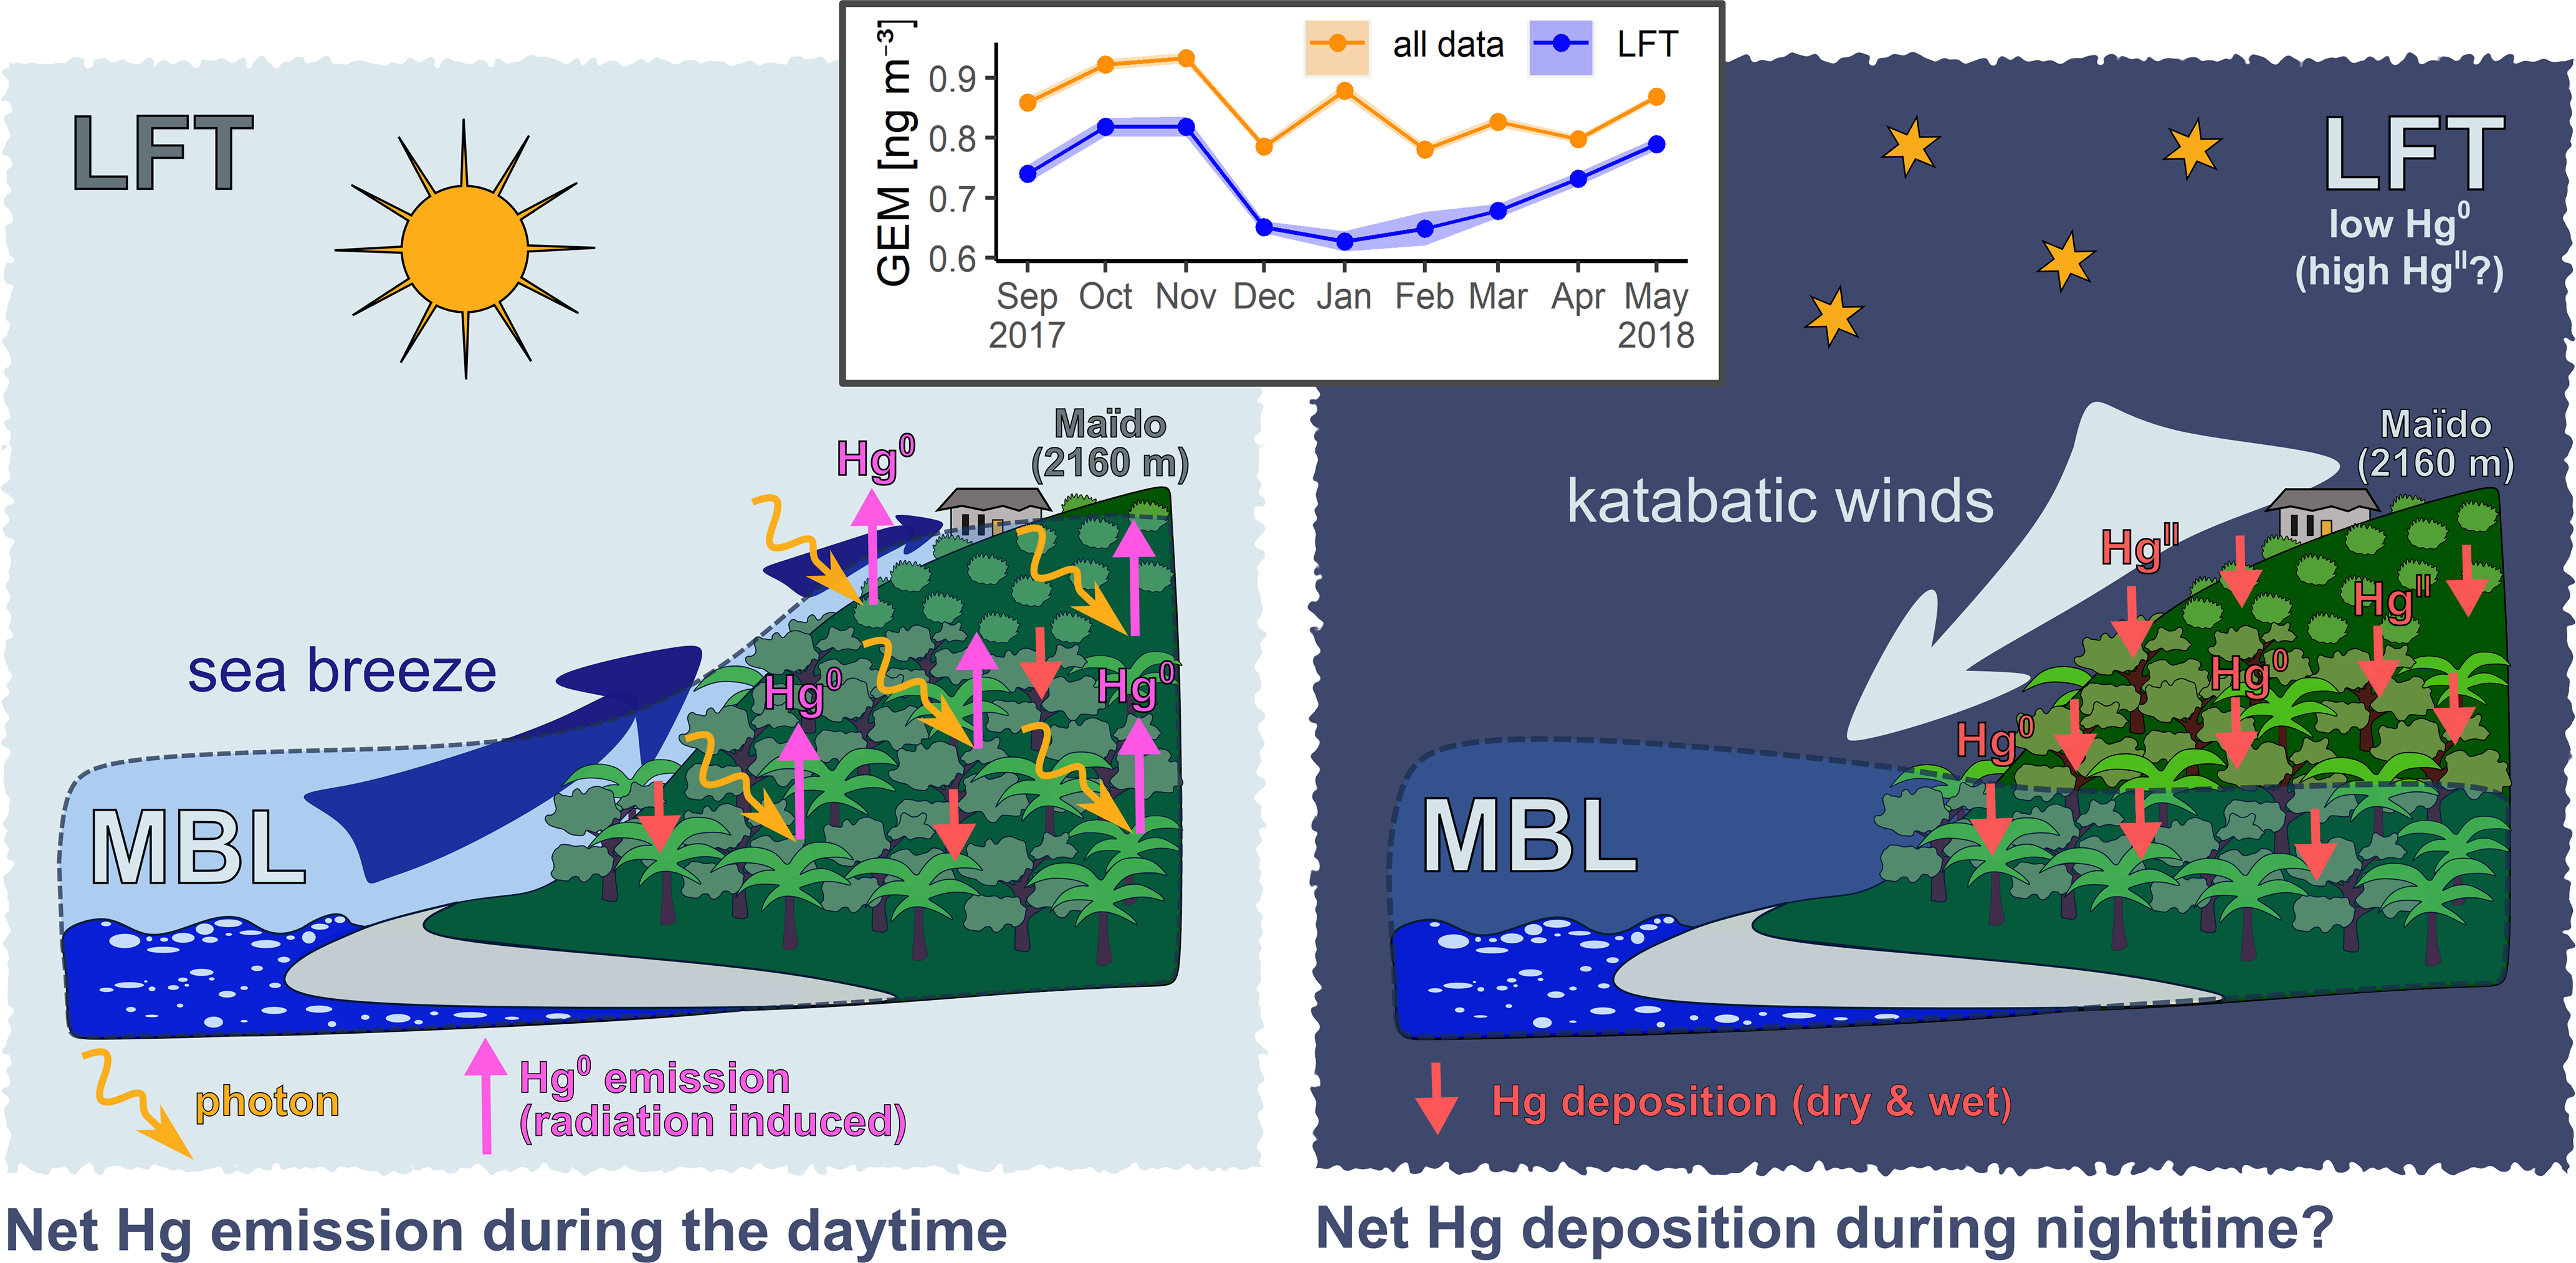
Atmospheric mercury (Hg) observations in the lower free troposphere (LFT) can give important insights into Hg redox chemistry and can help constrain Hg background concentrations on a regional level. Relatively continuous sampling of LFT air, inaccessible to most ground-based stations, can be achieved at high-altitude observatories. However, such high-altitude observatories are rare, especially in the Southern Hemisphere (SH), and atmospheric Hg in the SH LFT is unconstrained. To fill this gap, we continuously measured gaseous elemental mercury (GEM; hourly) and reactive mercury (RM; integrated over ∼ 6–14 d) for 9 months at Maïdo mountain observatory (2160 m a.s.l.) on remote Réunion Island (21.1∘ S, 55.5∘ E) in the tropical Indian Ocean. GEM exhibits a marked diurnal variation characterized by a midday peak (mean: 0.95 ng m−3; SD: 0.08 ng m−3) and a nighttime low (mean: 0.78 ng m−3; SD: 0.11 ng m−3). We find that this diurnal variation is likely driven by the interplay of important GEM photo-reemission from the islands' vegetated surfaces (i.e. vegetation + soil) during daylight hours (8–22 ng m−2 h−1), boundary layer influences during the day, and predominant LFT influences at night. We estimate GEM in the LFT based on nighttime observations in particularly dry air masses and find a notable seasonal variation, with LFT GEM being lowest from December to March (mean 0.66 ng m−3; SD: 0.07 ng m−3) and highest from September to November (mean: 0.79 ng m−3; SD: 0.09 ng m−3). Such a clear GEM seasonality contrasts with the weak seasonal variation reported for the SH marine boundary layer but is in line with modeling results, highlighting the added value of continuous Hg observations in the LFT. Maïdo RM is 10.6 pg m−3 (SD: 5.9 pg m−3) on average, but RM in the cloud-free LFT might be about twice as high, as weekly–biweekly sampled RM observations are likely diluted by low-RM contributions from the boundary layer and clouds.
- Article
(6251 KB) - Full-text XML
-
Supplement
(1454 KB) - BibTeX
- EndNote


Atmospheric mercury (Hg) observations are unequally distributed over the globe in several ways. On the one hand, many more sampling sites exist in the Northern Hemisphere (NH) than in the Southern Hemisphere (SH) (Sprovieri et al., 2016). On the other hand, most Hg observations in either hemisphere are made at ground level and within the boundary layer. In this lowermost layer of the atmosphere, Hg concentrations are importantly affected by atmosphere–surface interactions such as local emissions and dry deposition. However, much of the long-range transport of Hg, which leads to its global distribution, does not occur within the relatively shallow boundary layer but in the free troposphere where winds tend to be strongest and transport tends to be fastest (Travnikov, 2011). The fate of Hg in the free troposphere, detached from direct surface influences, depends strongly on chemical transformations (Travnikov, 2011) because divalent oxidized mercury (HgII), water-soluble and readily incorporated into water droplets and adsorbed onto particles, is removed from the atmosphere much more quickly than poorly soluble elemental mercury (Hg0) (Schroeder and Munthe, 1998; Ariya et al., 2015; Lindberg et al., 2007).
Hg redox chemistry in the atmosphere is still subject to considerable uncertainties, and the debate on the dominant Hg oxidants in the atmosphere has been ongoing for more than 2 decades (Lin, 2011; Ariya et al., 2008; Lindberg et al., 2007; Dibble et al., 2020; Calvert and Lindberg, 2005; Lindqvist and Rodhe, 1985). In many studies, it was assumed that atmospheric ozone (O3) and hydroxyl radicals (OH) act as dominant Hg oxidants (Lin, 2011). However, thermodynamic considerations and quantum chemistry calculations showed that the homogeneous and direct oxidation of Hg0 to HgII via either O3 or OH is likely insignificant in the real atmosphere (Calvert and Lindberg, 2005; Dibble et al., 2020). Besides, the detection of Hg0 depletion events in polar regions (Schroeder et al., 1998) led to the increasing consideration of halogens, mainly bromine (Br) radicals, as important Hg oxidants. Indeed, the widely used mercury simulation of the GEOS-Chem chemical transport model (Selin et al., 2007) employed in recent versions a two-step Br-initiated pathway as the main Hg0 oxidation pathway (Horowitz et al., 2017; Feinberg et al., 2022). This reaction scheme was recently updated by Shah et al. (2021), who somewhat reconciled earlier studies by introducing, among others, a two-step OH-initiated oxidation pathway alongside the abovementioned Br-induced pathway and by introducing O3 as a second-stage oxidant for both the Br- and OH-initiated oxidation pathways.
Despite these important new developments, Hg redox chemistry remains insufficiently constrained by observations. As Hg concentrations in the free troposphere are less sensitive to direct surface–atmosphere interactions than in the boundary layer, it could be argued that Hg observations in the free troposphere are especially valuable for constraining Hg redox chemistry. However, such observations are rare, especially in the SH. Apart from aircraft campaigns, mountain observatories are currently the only practical way of measuring Hg in the free troposphere (Travnikov, 2011). While these observatories are still subject to surface influences and often exhibit a complex variability in the origin of sampled air masses due to orographic and thermal flows (Forrer et al., 2000), they are usually able to sample air from the lower free troposphere (LFT) with regularity, especially during stable atmospheric conditions and at night (Reidmiller et al., 2010; Kleissl et al., 2007; Hahn et al., 1992; Baray et al., 2013; Collaud Coen et al., 2011). Atmospheric Hg observations from NH mountain sites such as Pic du Midi in France (Fu et al., 2016a, c; Marusczak et al., 2017), Mauna Loa in Hawaii (Carbone et al., 2016; Luippold et al., 2020), Jungfraujoch in Switzerland (Denzler et al., 2017), Mount Bachelor (Weisspenzias et al., 2007; Swartzendruber et al., 2006) in the US, Storm Peak (Obrist et al., 2008; Faïn et al., 2009) in the US, and Lulin in Taiwan (Nguyen et al., 2019, 2022; Sheu et al., 2010), among others, have provided important insights into the transport and chemistry of atmospheric Hg. Meanwhile, to our best knowledge, mountain-top observations of atmospheric Hg in the SH have until now only been reported from the Chacaltaya observatory in the tropical Bolivian Andes (Koenig et al., 2021).
To fill data gaps in the SH in general and the SH LFT more specifically, we continuously measured from September 2017 to May 2018 (9 months) atmospheric Hg at Maïdo mountain observatory (2160 m a.s.l.), a high-altitude regional GAW station on Réunion Island (21.1∘ S, 55.4∘ E) in the tropical Indian Ocean (Baray et al., 2013). Atmospheric Hg was sampled in the form of gaseous elemental mercury (GEM; atmospheric Hg0) with a high time resolution (every 15 min) and in the form of reactive mercury (RM; atmospheric HgII) with a lower time resolution (integrated over ∼ 6–14 d). Our measurement period overlapped with the OCTAVE project (“Oxygenated Compounds in the Tropical Atmosphere: Variability and Exchanges”, http://octave.aeronomie.be, last access: 18 January 2023), dedicated to the study of oxygenated organic compounds in tropical regions (Rocco et al., 2020). This is further complemented by regular and continuous observations of atmospheric trace gases such as carbon dioxide (CO2), methane (CH4), carbon monoxide (CO), and ozone (O3) at the observatory (Baray et al., 2013; Zhou et al., 2018; Duflot et al., 2019).
Here, we (1) give an overview of the 9 months of continuous GEM and RM observations at Maïdo observatory in the tropical Indian Ocean. We (2) derive and discuss a time series of GEM in the LFT and estimate RM in the LFT. Finally, with the help of ancillary data and the FLEXPART-AROME Lagrangian dispersion model, we (3) explore possible drivers for remarkably pronounced GEM diurnal cycles at Maïdo and address the potential role of GEM photo-reemission from the island's vegetated surface.
2.1 Site description
Maïdo observatory (21.0792∘ S, 55.38∘ E) lies at an altitude of 2160 m a.s.l. on the remote Réunion Island in the tropical Indian Ocean, about 700 km east of Madagascar (see Fig. 1a). Réunion is a relatively small island (∼ 2512 km2) with a complex orography due to its volcanic origin (Gillot and Nativel, 1989). The volcano “Piton de la Fournaise” in the east of the island is still very active, with on average one eruption every 7–10 months (Stieltjes and Moutou, 1989; Villeneuve and Bachèlery, 2006). The island, especially its mountain slopes, is densely covered by evergreen forest, while its beach strips are highly populated (population density for 2022: 358 inhabitants per square kilometer). Maïdo observatory is directly surrounded by shrublands, while lush tropical vegetation is found further to the north-east, in the Cirque de Mafate (a densely vegetated volcanic caldera). To the west of Maïdo lies a high tamarisk forest, which also dominates the coastal region where the closest urban areas of Saint Paul and Le Port (105 000 and 40 000 inhabitants, 13 and 15 km from the observatory, respectively) are located (Rose et al., 2019).
The local atmospheric circulation of Réunion Island is complex and a result of both orographic and thermal flows (Lesouëf et al., 2011; Foucart et al., 2018). Orographic flows are induced by the island's rugged relief, which represents an environmental obstacle to the trade winds (east–south-easterlies on average). Upon encountering Réunion Island, these air masses can either rise (orographic lifting regime) or they can flow around the island, in which case an overturning loop can be observed in the north-west of the island (Foucart et al., 2018). Thermal flows, which are driven by differential heating and cooling of the island's surface, follow an important diurnal cyclicity (see Fig. 1b). Nocturnal radiative surface cooling creates a cold downwash (or katabatic wind) along the slopes of the island (Baray et al., 2013), which usually leads to cloudless nights in the mountain regions. After sunrise, radiative heating typically generates a sea breeze circulation and upslope winds (or anabatic winds), which are accompanied by cumulus clouds (Lesouëf et al., 2011).
Maïdo observatory samples mostly air from the LFT during nighttime due to the abovementioned katabatic winds that develop after sunset and mostly manifest as easterlies (Fig. 1). During the daytime, the observatory is importantly influenced by the planetary boundary layer (PBL) of the island as well as the marine boundary layer (MBL) of the surrounding ocean, brought to the observatory by a sea breeze circulation and anabatic winds, which usually manifest as westerlies (Lesouëf et al., 2011). When the daytime sea breeze weakens on the western coast, moist air masses can also originate from the nearby Cirque de Mafate to the north-east or get advected from the windward (eastern) side of the island by strong south-easterly trade winds (Lesouëf et al., 2011, 2013; Tulet et al., 2017).
While atmospheric transport to Réunion Island on the mesoscale is dominated by south-easterly trade winds (Foucart et al., 2018; see also Supplement Sect. S1), transport pathways can change under the influence of tropical cyclones developing over the south-western Indian Ocean (Tulet et al., 2021; Pohl et al., 2016), mostly from November to April (the cyclonic season). Several cyclonic storms affected Réunion Island during our measurement period (September 2017–May 2018), with the most noteworthy storms being Ava (∼ 13 d, 27 December 2017–9 January 2018), Berguitta (∼ 11 d, 9–20 January 2018), Dumazile (∼ 6 d, 1–6 March 2018), Eliakim (∼ 7 d, 13–20 March 2018), and Fakir (∼ 5 d, 20–25 April 2018) (http://www.meteo.fr/temps/domtom/La_Reunion/webcmrs9.0/anglais/index.html, last access: 10 August 2022).
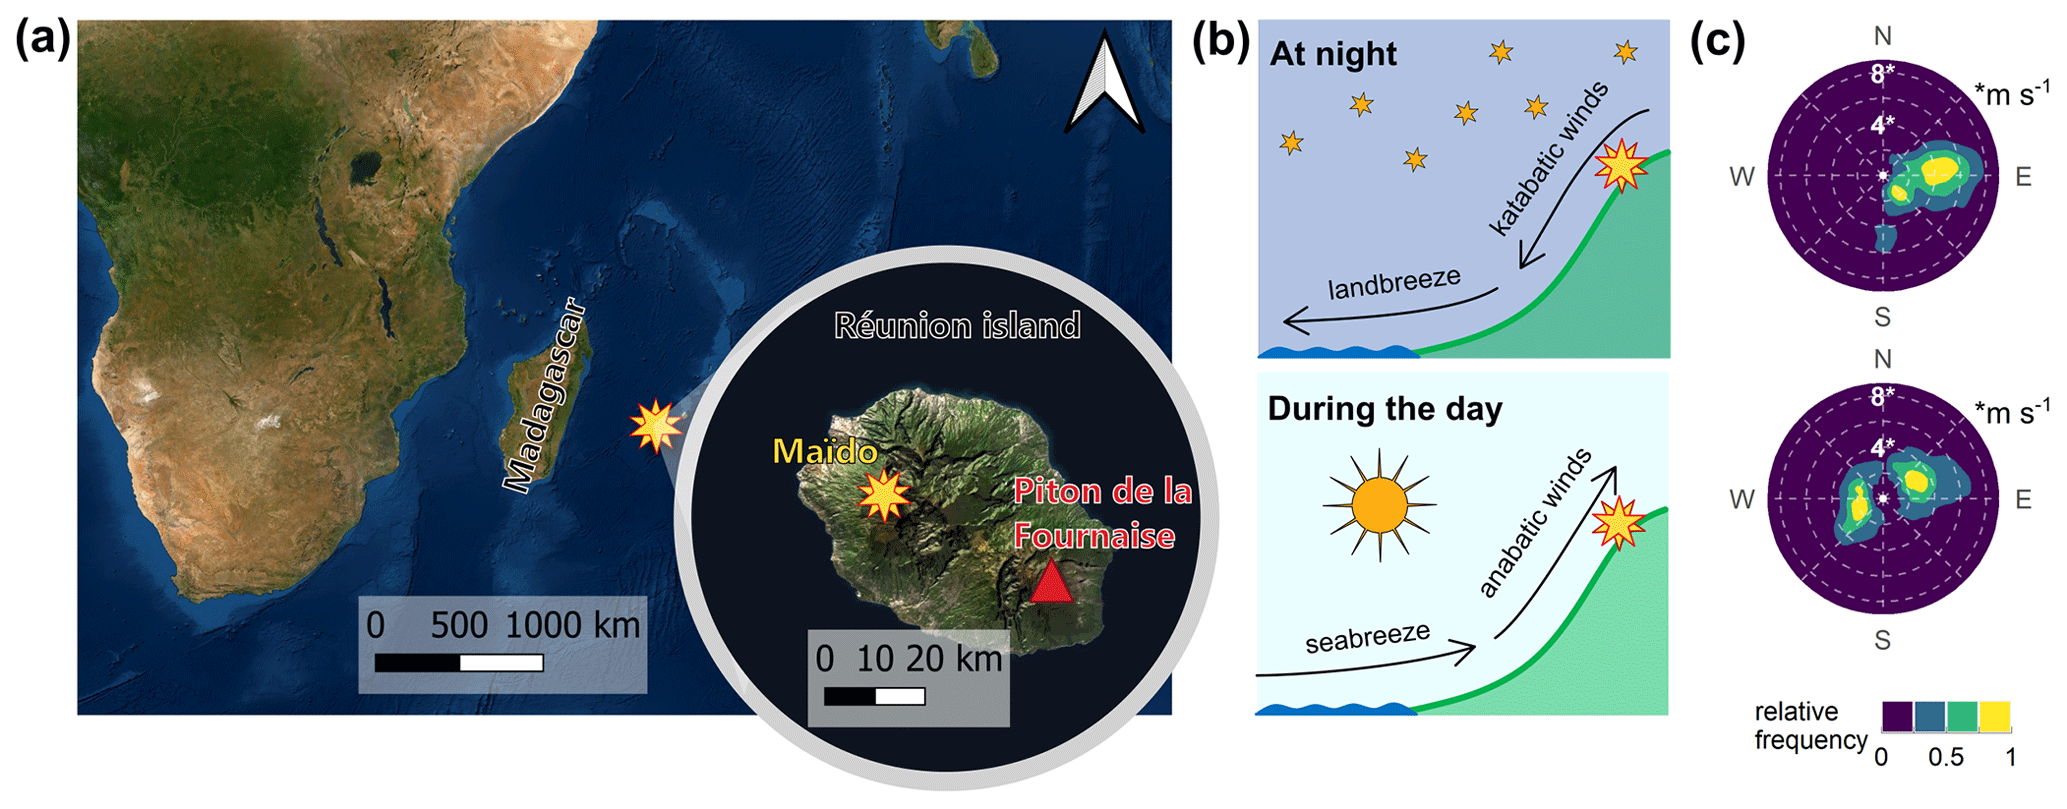
Figure 1Site overview. (a) The location of Réunion Island in the tropical Indian Ocean and the location of Maïdo observatory (star) on Réunion Island (zoomed-in image). The rugged orography of the island was represented by overlaying a digital elevation model (Jarvis et al., 2008) over an aerial image (obtained from ESRI). (b) Schema of simplified mesoscale circulation patterns affecting Maïdo (star), characterized by katabatic winds and mostly lower free tropospheric influences during the night (top) and by anabatic winds and boundary layer influences during the day (bottom). (c) Wind speed and wind direction at Maïdo (observations from July 2017 to July 2018) show important day–night differences (compare to b), with mostly fast easterly katabatic winds during nighttime (top) and a competition between easterlies and westerlies during daytime (bottom). The radial axis gives the wind speed (see dashed circles). The numbers give wind speed (m s−1). The color scale is normalized, so that “1” corresponds to the most frequent combination of wind direction and wind speed.
2.2 GEM and RM observations
Between September 2017 and June 2018, GEM was continuously measured from the instrumented platform at Maïdo observatory using two Tekran® 2537 Model 2537A analyzers (Tekran Inc., Toronto, Canada) operating under Global Mercury Observation System (GMOS) standard operating procedures (Munthe et al., 2011; D'Amore et al., 2015). The 1/4 inch (6.35 mm) unheated perfluoroalkoxy (PFA) sampling line was protected from UV radiation with a white opaque tube (polyvinyl chloride) to avoid photochemical reactions inside the line. The inlet, installed 2 m high on the stationary instrumented platform (6 m a.g.l.), was connected to a single polytetrafluoroethylene (PTFE) filter holder, composed of one 0.45 µm PES (polyethersulfone) filter (47 mm diameter). This analytical configuration has been set up to measure GEM instead of total gaseous mercury (TGM) as well as to collect RM compounds for further analysis.
GEM then passed through the 9.5 m-long sampling line and a second single PTFE filter holder, composed of one 0.45 µm PTFE filter (47 mm diameter), into the Tekran® 2537, where it was collected on gold traps before thermal desorption and quantification by cold vapor atomic fluorescence spectroscopy (CV-AFS). GEM was analyzed every 15 min at a flow rate of 1.3 L min−1 under standard conditions of 273.14 K and 1013.25 hPa (STP). The instrument detection limit is 0.1 ng m−3. GEM concentrations are expressed (ng m−3) under STP. Calibration of the Tekran® 2537 was performed using both the internal Hg permeation sources (every week) and manual injections of saturated Hg vapor (every 3 months). The flow rate in the Tekran® 2537 as well as the internal mass-flow meter itself was also frequently checked by an external and calibrated mass-flow meter. The Tekran® 2537 deployed at Maïdo observatory experienced less than 5 % and 1 % shifts in the manual injection checking and mass-flow meter calibration, respectively. The room in which the instrument was placed was permanently air-conditioned to 22–23 ∘C, thus allowing it to be permanently 2–3 ∘C above the outside temperatures, whatever the season, to avoid condensation in the sampling line. Raw GEM time series were quality controlled according to the guidelines proposed within the GMOS network, using dedicated software developed at the Institute of Environmental Geosciences in 2012 (see https://gmos.aeris-data.fr/, last access: 25 May 2022). During this automated procedure, the raw dataset is compared against potential flags corresponding to more than 40 criteria that specifically refer to all operation phases related to the calculation of Hg concentrations and calibration (D'Amore et al., 2015), thus marking GEM readings as “valid”, “warning”, or “invalid”. The quality-assured and quality-controlled dataset was then generated from the site manager under consideration of the previously flagged dataset, field notes, logbooks, and site characteristics (Magand and Dommergue, 2022).
RM was sampled with a significantly lower frequency than GEM, with collection times varying from 5.8 to 14.1 d to allow for the concentration of enough RM mass on the dedicated 0.45 µm PES filter. It has been shown that PES membranes can collect RM (gaseous oxidized mercury + particle-bound mercury) quantitatively, similarly to cation exchange membranes (Dunham-Cheatham et al., 2020; Gustin et al., 2015). After collection in the field, PES filters were separately stored in Petri dishes inside double-zipper bags and kept frozen at −20 ∘C until analysis. After shipment to the laboratory, each PES filter was placed in a PTFE beaker. PES filters were digested in 16 mL of ERi 2.5 % inverse aqua regia (a solution of 97.5 % vol H2O, 1.7 % vol bi-distilled HNO3 12.4N solution and 0.8 % vol bi-distilled HCl 7.5N solution. The bi-distilled HNO3 and HCl solutions correspond to 78 % vol HNO3 and 83 % vol HCl, respectively). The beakers were closed and placed on a heating plate (120 ∘C) for 12 h before analysis, which was done with a Brooks Rand Model III CV-AFS detector. The method detection limit was 5 pg Hg (Marusczak et al., 2017) and the average LOD was around 35 pg for the entire sampling and analytical process. The standard reference material was NIST 3133 and ORMC-5 from NRC. The standard measurement procedure included the CV-AFS calibration (0–50 pg; NIST 3133) and a quality control sequence for 12 samples. The performance of the CV-AFS was assessed based on ORMC-5, showing concentrations between 89 % and 120 % of the expected value. The volume of air collected on PES filters was calculated from the Tekran® 2537 flow rate at the inlet. RM concentrations are expressed (pg m−3) under standard conditions of 273.14 K and 1013.25 hPa.
2.3 Volatile organic compound (VOC) observations
We make use of VOC observations to characterize the origin of sampled air masses and the extent to which they were impacted by surface influences. These data were generated in the framework of the OCTAVE project (http://octave.aeronomie.be; last access: 25 May 2022), which aimed to better understand the transport and role of VOCs in tropical regions (Verreyken et al., 2019, 2020, 2021; Rocco et al., 2020).
VOCs were measured by two highly sensitive proton-transfer-reaction quadrupole mass spectrometers (hs PTR-Quad-MS; Ionicon Analytik GmbH, Innsbruck, Austria) belonging to the Royal Belgian Institute for Space Aeronomy (BIRA-IASB) and the Laboratoire des Sciences du Climat et de l'Environnement (LSCE). The BIRA PTR-MS was deployed at Maïdo in multiple ion detection mode to generate a near-continuous 2-year dataset of VOCs (from 19 October 2017 to 26 November 2019) (Verreyken et al., 2021). The LSCE PTR-MS measurements were recorded during the intensive field OCTAVE campaign at three different locations (Maïdo observatory, Le Port coastal urban city, and the tropical Bélouve forest) (Rocco et al., 2020). Principal recorded VOCs were acetaldehyde (CH3CHO), acetone (CH3COCH3), methanol (CH3OH), formic acid (HCOOH), acetic acid (CH3COOH), acetonitrile (CH3CN), benzene (C6H6), toluene (C7H8), isoprene (C5H8), monoterpenes (C10H16), methyl vinyl ketone (MVK), methyl ethyl ketone (MEK) and dimethyl sulfide (DMS), a volatile organic sulfur compound. More technical and analytical information can be found in Verreyken et al. (2021, 2020) and Rocco et al. (2020).
2.4 Meteorological observations
We use observations on meteorological parameters (temperature, relative humidity, wind speed, wind direction, and incoming solar radiation) as continuously taken at the Piton–Maïdo meteorological station, at ∼ 2150 m a.s.l. and around ∼ 1 km from Maïdo observatory. This meteorological station is permanently checked and validated by the French national meteorological service (Météo-France) and consists of a pyrocontrol probe, a Vaisala HMP110 humidity probe, an ultrasonic GILL WS2 sensor, and a K&Z CM5 pyranometer. Specific humidity was calculated from temperature and relative humidity observations but assuming a constant atmospheric pressure (780 hPa) corresponding approximately to the sampling altitude (2150 m a.s.l.).
2.5 Other ancillary data
Maïdo observatory is registered as an ICOS (Integrated Carbon Observation System), NDACC (Network for the Detection of Atmospheric Composition Change), and ACTRIS (Aerosols, Clouds and Trace gases Research Infrastructure) atmospheric measurement site and a regional GAW (Global Atmospheric Watch) station (WMO region I, Africa). In this framework, the atmospheric observatory continuously houses a suite of both in situ and remote sensing instruments from which a list of continuous measurements can be found online (https://osur.univ-reunion.fr/observations/osu-r-stations/opar/, last access: 26 May 2022). Among them, greenhouse gases (CO, CO2, CH4) were specifically useful in the context of the present study.
Greenhouse gas measurements were performed with a PICARRO G2401 analyzer and following standardized ICOS protocols for measurement, processing, calibration, and quality control, described in detail elsewhere (Hazan et al., 2016; Laurent, 2017; Heiskanen et al., 2022; Yver-Kwok et al., 2021). The analyzer was calibrated once a month with four cylinders of reference gases prepared and calibrated by the Flask and Calibration Laboratory (FCL) of ICOS in accordance with the WMO reference scales (CO2-X2019, CH4-X2004A, CO-X2014A). Two other reference gases were used for the quality control of the measurements at a rate of a daily injection for the short-term target gas and one injection per month for the long-term target gas.
Ozone (O3) was measured with a UV photometric Thermo Scientific 49i analyzer with a detection limit of 1 ppb and a time resolution of 1 min. This instrument operates on the principle that O3 molecules absorb UV light at a wavelength of 254 nm and that the degree to which the UV light is absorbed is directly related to the O3 concentration as described by the Beer–Lambert law (Swinehart, 1962). Calibration was carried out every 3 months with an O3 generator, validated by the French air quality monitoring agency.
2.6 FLEXPART-AROME transport modeling and source–receptor relationships (SRRs)
Here we use the model results obtained by Verreyken et al. (2021) concerning mesoscale air mass transport to Maïdo. Briefly, mesoscale transport to Maïdo was estimated with the help of FLEXPART-AROME (Verreyken et al., 2019; Brioude et al., 2013), which feeds the FLEXPART Lagrangian particle dispersion model (Stohl et al., 2005; Pisso et al., 2019) with meteorological input from the high-resolution (horizontal: 2.5×2.5 km2) AROME regional climatological model (Seity et al., 2011). AROME is used by Météo-France as the operational mesoscale numerical weather prediction model for the Indian Ocean.
From 3 November 2017 to 26 November 2019, 20 000 initial air particles were launched every hour (on the hour: 08:00, 09:00, etc.) from Maïdo observatory (more specifically, homogeneously from a 20 m-deep layer above the station) and followed for 24 h into the past. Residence times of air parcels were calculated on a 0.025∘ × 0.025∘ grid (∼ 2.5 km horizontal resolution) within a domain spanning 19.5–22.5∘ S and 53.0–58.0∘ E. The grid contained 15 vertical layers, 10 layers between 0 and 500 m a.g.l. (50 m thickness), 3 layers between 500 and 2000 m a.g.l. (500 m thickness), and 2 additional layers above (10 000 and 24 000 m a.g.l.). More detailed information on this model run can be found in Verreyken et al. (2021).
SRRs describe the sensitivity of observed concentrations to surface emissions from regions of interest and are thus a practical tool to estimate quantitatively to what degree observed concentrations at Maïdo observatory are impacted by emissions from the island's surface. We calculated SRRs by dividing FLEXPART-AROME-derived air mass residence times by a constant minimal boundary layer height, as described in Seibert and Frank (2004). More details can be found in Supplement Sect. S6.
2.7 Data treatment and statistical tools
All data analysis was performed with R 3.6.0 (R Core Team, 2019) and using the “tidyverse” collection of R packages (Wickham et al., 2019). Most visualizations were done with the R package “ggplot2” (Wickham, 2016), while the site overview map (Fig. 1) was generated with QGIS (QGIS Development Team, 2022), and the graphical abstract was created with Inkscape (Inkscape Project, 2022). Digitization of figures was done with WebPlotDigitizer (Rohatgi, 2021).
We worked with hourly averages whenever possible. Hourly averages were defined as follows. For GEM, CO, CO2, CH4, O3, and VOCs, the hourly average at hour “h” corresponds to all data taken between “h” and “h + 1”; for example, the hourly average for 09:00 corresponds to all observations between 09:00 and 09:59.
Relative humidity (RH) and temperature (T) measurements as obtained from Météo-France are reported at the round hour only. To make this as congruent as possible with the abovementioned hourly averaging of trace gases and VOCs, we assigned the average of the two reported values at “h” and “h + 1” to measurements taken at hour “h”. Continuing with the above example, the hourly average of RH (or T) for 09:00 corresponds to the average of the two RH (or T) observations reported at 09:00 and 10:00.
The used FLEXPART dispersion runs (see Sect. 2.6) were launched instantaneously at every hour on the hour (e.g. 08:00, 09:00, 10:00). Here, we assigned to in situ measurements taken between “h” and “h + 1” the FLEXPART dispersion run arriving at “h + 1”; for example, we assigned to the hourly average of 09:00, which represents all data taken between 09:00:00 and 09:59:59, the backward dispersion run launched at 10:00. The same applies for all FLEXPART-derived SRRs.
3.1 Overview: Hg observations at Maïdo
3.1.1 GEM
For the 9 months of available observations (September 2017–May 2018), mean GEM at Maïdo (see Fig. 2a) was 0.85 ng m−3 (SD: 0.12 ng m−3). This is quite low in comparison to reported atmospheric Hg concentrations at low-altitude SH background sites such as Amsterdam Island in the southern Indian Ocean (55 m a.s.l.; GEM mean: ∼ 1.05 ng m−3; Angot et al., 2014; Slemr et al., 2015, 2020), Cape Point in South Africa (230 m a.s.l.; ∼ 1.0 ng m−3; Slemr et al., 2015, 2020) and Darwin in northern Australia (25 m a.s.l.; ∼ 0.95 ng m−3; Howard et al., 2017) but comparable to reported GEM concentrations from the more elevated Bariloche Argentina (800 m a.s.l.; ∼ 0.86 ng m−3, Diéguez et al., 2019) and the high-altitude Chacaltaya observatory in Bolivia (5240 m a.s.l.; total gaseous mercury: ∼ 0.89 ng m−3 during the ENSO-neutral year 2014–2015, Koenig et al., 2021). Based on all data taken, no clear seasonality emerges in GEM at Maïdo, apart from somewhat increased concentrations between September and November (SON mean: 0.91 ng m−3, SD: 0.12 ng m−3). Higher GEM in SON might be related to the increased occurrence of biomass burning events in the SH from August to November (Edwards et al., 2006). In fact, it has been shown that biomass-burning-influenced air masses can get transported to Maïdo observatory, especially those originating from Africa and Madagascar (Verreyken et al., 2020).
GEM showed a marked diurnal variation, with a minimum at night (23:00–05:59 local time (LT); mean: 0.78 ng m−3; SD: 0.11 ng m−3), rising concentrations after dawn, and a peak around noon (from 12:00 to 13:59 LT; mean: 0.95 ng m−3; SD: 0.08 ng m−3), after which concentrations decrease again (Fig. 2b). This contrasts with the relatively weak diurnal variation (diurnal range < 0.05 ng m−3) at marine or coastal sites in the SH such as Amsterdam Island and Cape Point (Slemr et al., 2020; Angot et al., 2014; Slemr et al., 2015). On the other hand, Maïdo GEM diurnal variation with its midday peak is comparable to the summertime diurnal GEM variation at Dumont d'Urville and Concordia Station in Antarctica, where diurnal GEM variability has been attributed to photo-reemission of GEM from the snowpack (Song et al., 2018; Angot et al., 2016a, b). The possible relationship between diurnal GEM cycles at Maïdo and photo-reemission is explored in Sect. 3.3.
3.1.2 RM
Mean RM at Maïdo is quite low (10.6 pg m−3; SD: 5.9; 35 samples in total) compared to reported mean RM concentrations at other mountain observatories (range: ∼ 20–133 pg m−3; Fu et al., 2016a; Marusczak et al., 2016; Nguyen et al., 2021; Swartzendruber et al., 2006; Luippold et al., 2020; Faïn et al., 2009). It must be noted that all these other observatories lie in the NH, and most of them measured RM (in the form of GOM and PBM separately) with a Tekran® speciation unit. The potassium chloride (KCl) denuder used in the Tekran® speciation unit has been proven to not collect all RM species quantitatively, causing RM measurements in ambient air to be biased low (Gustin et al., 2019, 2021; McClure et al., 2014; Lyman et al., 2010). Denuder-based RM observations at Pic du Midi mountain observatory in France were later corrected upwards by 30 % (mean from 40 to 52 pg m−3) after comparison to a PES-membrane-based measurement protocol nearly identical to ours (Marusczak et al., 2017), which has been shown to sample RM more quantitatively (Gustin et al., 2021; Dunham-Cheatham et al., 2020). The difference between RM concentrations at Maïdo and these other mountain observatories may thus be even larger if the likely low bias of the earlier denuder-based measurements is accounted for.
RM at Maïdo showed a more significant seasonal variation than GEM, with 14.9 pg m−3 (SD: 6.5) for September–November (SON), 8.2 pg m−3 (SD: 5.0) for December–March (DJFM), and 8.8 pg m−3 (SD: 3.1) for April–June (AMJ) (Fig. 2c, d). These seasonal differences are statistically significant between SON and DJFM and between SON and AMJ (p < 0.05, Mann–Whitney U test) but statistically insignificant (p=0.3) between DJFM and AMJ. Individual low RM observations (< 5 pg m−3) may relate to elevated RM wet deposition, especially in DJFM, the wet season, which is characterized by elevated rainfall (Fig. 2c) and increased relative humidity at Maïdo (mean: 86 % in DJFM vs. 70 % for the rest of the year).
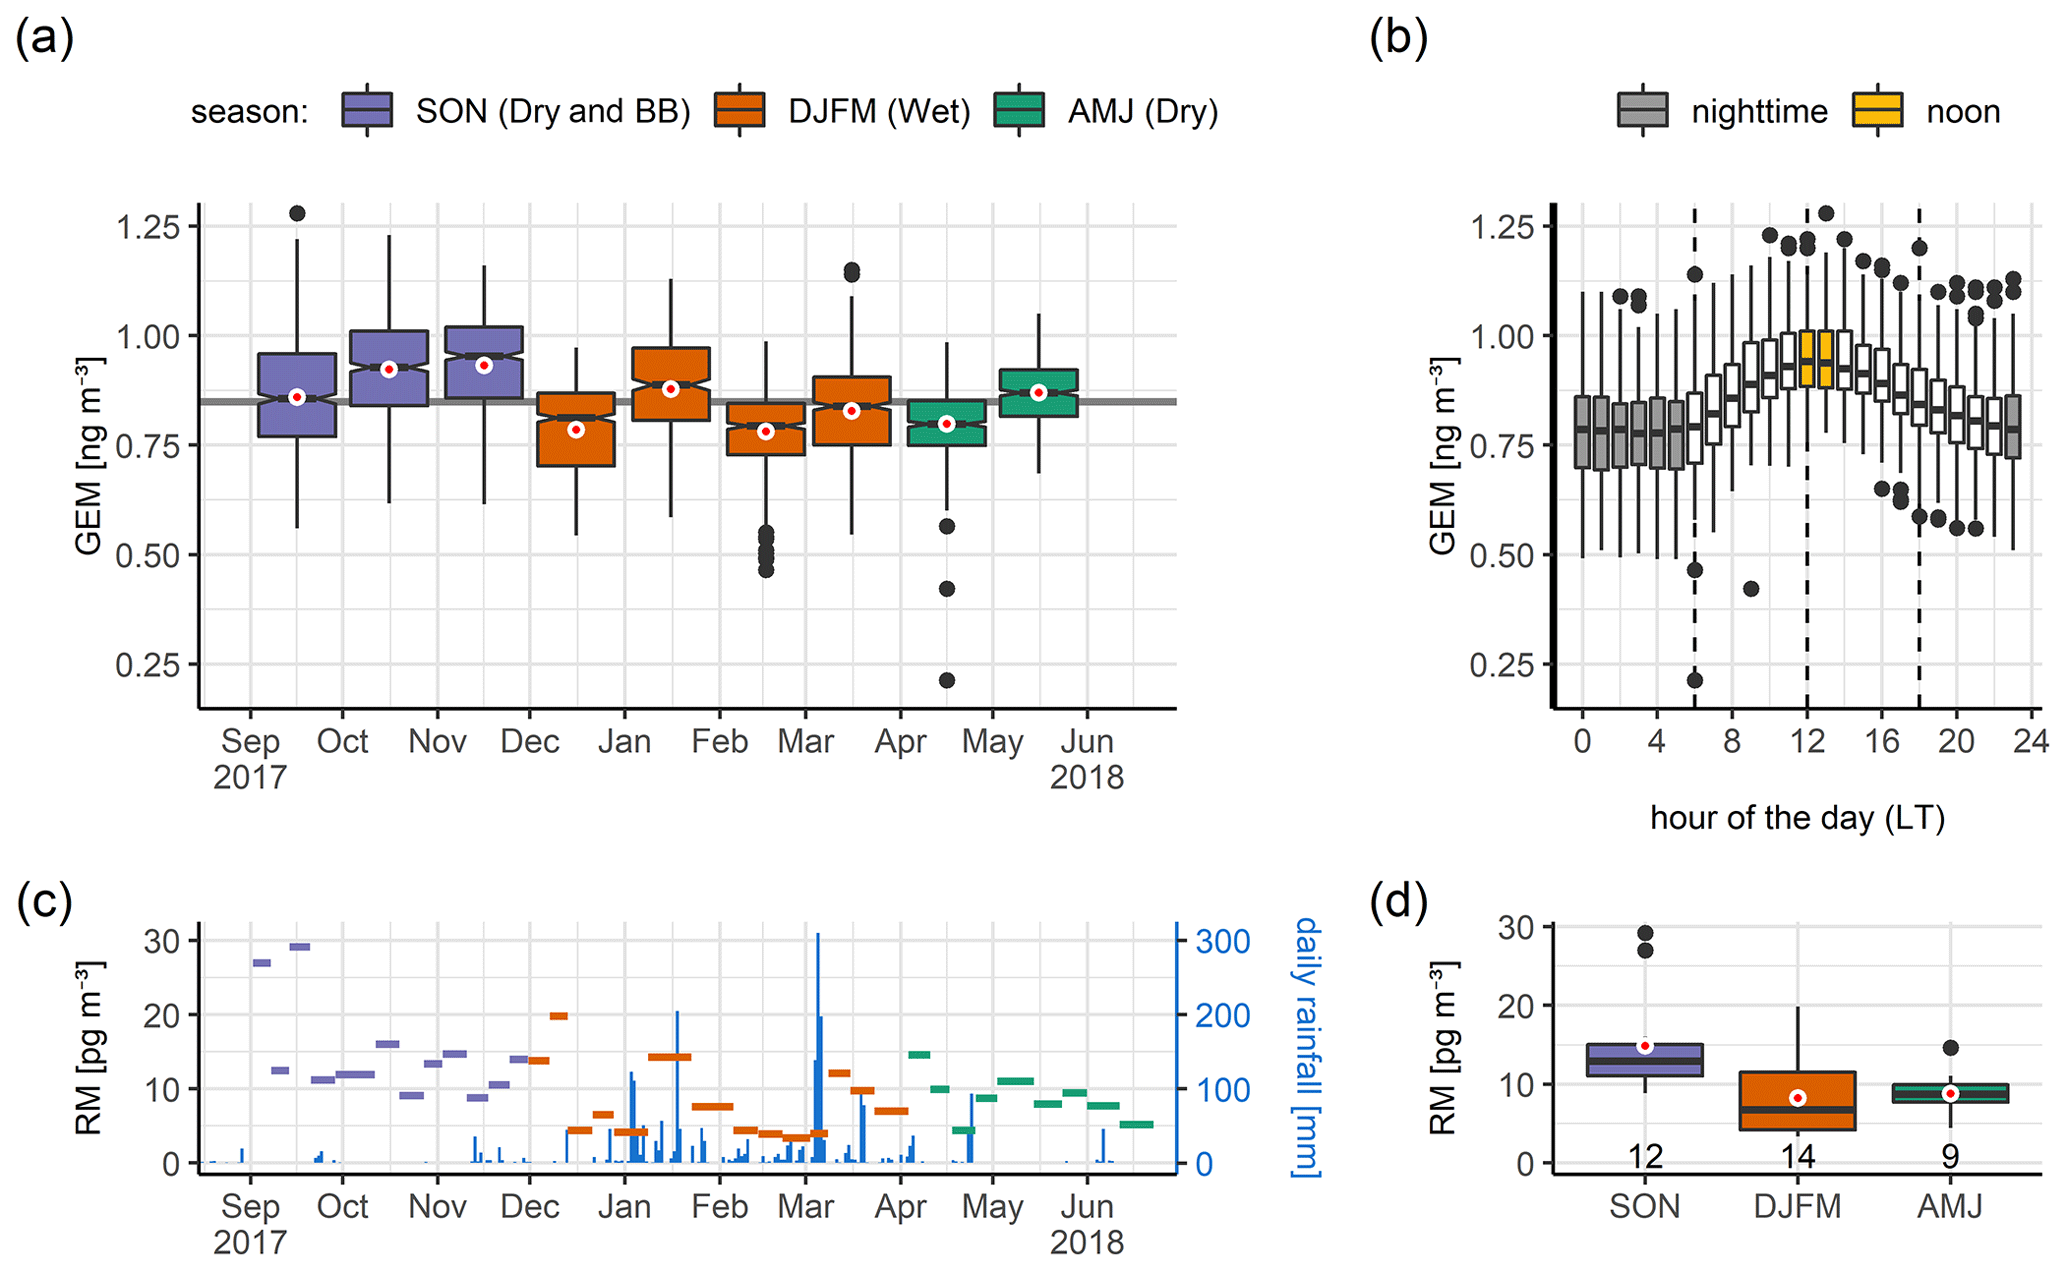
Figure 2Overview of Hg observations. (a) Overview of 9 months of hourly GEM measurements at Maïdo. Red dots show arithmetic means. The notches show the 95 % confidence interval for the median. The gray horizontal line gives the arithmetic mean of the whole dataset, which is nearly identical to the median (0.85 ng m−3 in both cases). (b) Diurnal GEM variation at Maïdo, characterized by a marked nighttime (23:00–05:59 LT) minimum and a noon (12:00–13:59 LT) peak. (c) Overview of RM measurements at Maïdo (a total of 35 weekly or biweekly samples). The length of each bar corresponds to the integration time of the respective RM observation. Total daily precipitation at Maïdo is given as blue bars (see the right axis). Around 82 % of all precipitation during the 9-month measurement period fell between 1 December 2017 and 31 March 2018 (DJFM, corresponding to the wet season). (d) Seasonal variation in RM sampled at Maïdo. Red dots show arithmetic means. The numbers indicate the number of available RM samples for the respective season.
3.2 Hg in the LFT of the SH tropical Indian Ocean
3.2.1 LFT GEM time series
A major goal of measuring Hg at Maïdo was getting insight into Hg in the LFT of the SH tropical Indian Ocean. While Maïdo is influenced by the boundary layer (BL) during the daytime, the observatory samples mostly air from the LFT during nighttime (see the site description in Sect. 2.1).
That said, we observed that nighttime observations at Maïdo are not always representative of the LFT, which is consistent with previous research at Maïdo observatory (Guilpart et al., 2017). Specifically, when humidity remained high at night (specific humidity > ∼ 10 g kg−1, RH > ∼ 90 %), nighttime observations at Maïdo most likely remained importantly BL influenced. This appears to occur notably during cyclonic storms, during which the diurnal variability of GEM and specific humidity nearly disappears (see Supplement Sect. S2).
To estimate GEM in the LFT, we thus selected nighttime data and additionally removed all GEM observations sampled in air masses with a specific humidity higher than a seasonally variable threshold. As a threshold, we used the monthly median nighttime specific humidity at coordinates for Maïdo and 800 hPa (∼ 1950 m a.s.l.) as obtained from the ERA5 global reanalysis (Hersbach et al., 2020) (see Supplement Sect. S3).
Our estimate of GEM in the LFT (Fig. 3; see the data table in Supplement Sect. S4) shows a significant seasonal variation during the 9 months of observations, with remarkably low mean GEM concentrations of 0.66 ng m−3 (SD: 0.07 ng m−3) in DJFM, corresponding to the wet season or austral summer. For each of the 9 months, monthly averaged LFT GEM was considerably lower (0.11 ng m−3 lower on average) than unfiltered Maïdo GEM (i.e. all data), with the difference being most pronounced in DJFM (0.25 ng m−3 lower in the LFT), likely due to the increased occurrence of cyclonic storms during that time of the year. Maïdo LFT GEM seasonality is nearly inverse to the TGM seasonality observed at the Chacaltaya mountain-top observatory (5240 m a.s.l.) in the tropical Andes, to our knowledge the only other observatory in the SH where strongly free troposphere-influenced air is sampled with regularity (Aliaga et al., 2021) and Hg observations are available (Koenig et al., 2021). This difference suggests that the seasonal variation of Maïdo LFT GEM is likely driven by other processes than TGM (GEM + RM) seasonality at Chacaltaya, which has been mainly attributed to biomass burning, vegetation uptake, and interhemispheric exchange in the upper troposphere (Koenig et al., 2021, 2022).
Based on the same filtering procedure as for LFT GEM, we estimated LFT CO, CH4, and O3 (see Fig. 3), although no O3 observations were available from September to December 2017. In contrast to GEM, the application of the LFT filter had little effect on CO and O3 concentrations, indicating that concentration differences between BL and LFT are much less pronounced for these compounds than for GEM. The strong CO enhancement between September and November is likely due to increased biomass burning in the SH during that time of the year (Edwards et al., 2006; Callewaert et al., 2022). While it is likely that LFT GEM concentrations in SON are biomass burning influenced, the seasonal variations of LFT GEM and LFT CO are clearly different, especially after February 2018, when CO remains low while GEM increases, again suggesting that the seasonal variation of Maïdo LFT GEM is likely dominated by other drivers than biomass burning. Seasonal variation in transport pathways and long-range transport of anthropogenic emissions could conceivably impact Maïdo LFT GEM seasonality. While long-range transport pathways were very similar for SON (September–November 2017) and AMJ (April–June 2018), some differences could be seen in DJFM (December 2017–March 2018), during which a fraction of northerly air masses even originated north of the Equator (within the last 10 d before arrival at Maïdo; see Supplement Sect. 1). However, given that Hg concentrations tend to be significantly higher in the NH than in the SH (Horowitz et al., 2017; Shah et al., 2021), it appears unlikely that the low LFT GEM concentrations in DJFM are linked to these northerly air masses. Intriguingly, the seasonality of LFT GEM, with its minimum between December and March, is similar to the seasonality of LFT CH4, which, in the remote tropical Indian Ocean, is mainly driven by oxidation loss through reaction with OH (Khalil and Rasmussen, 1983). This could indicate that OH-related Hg redox chemistry (see the introduction) plays an important role in driving LFT GEM seasonality.
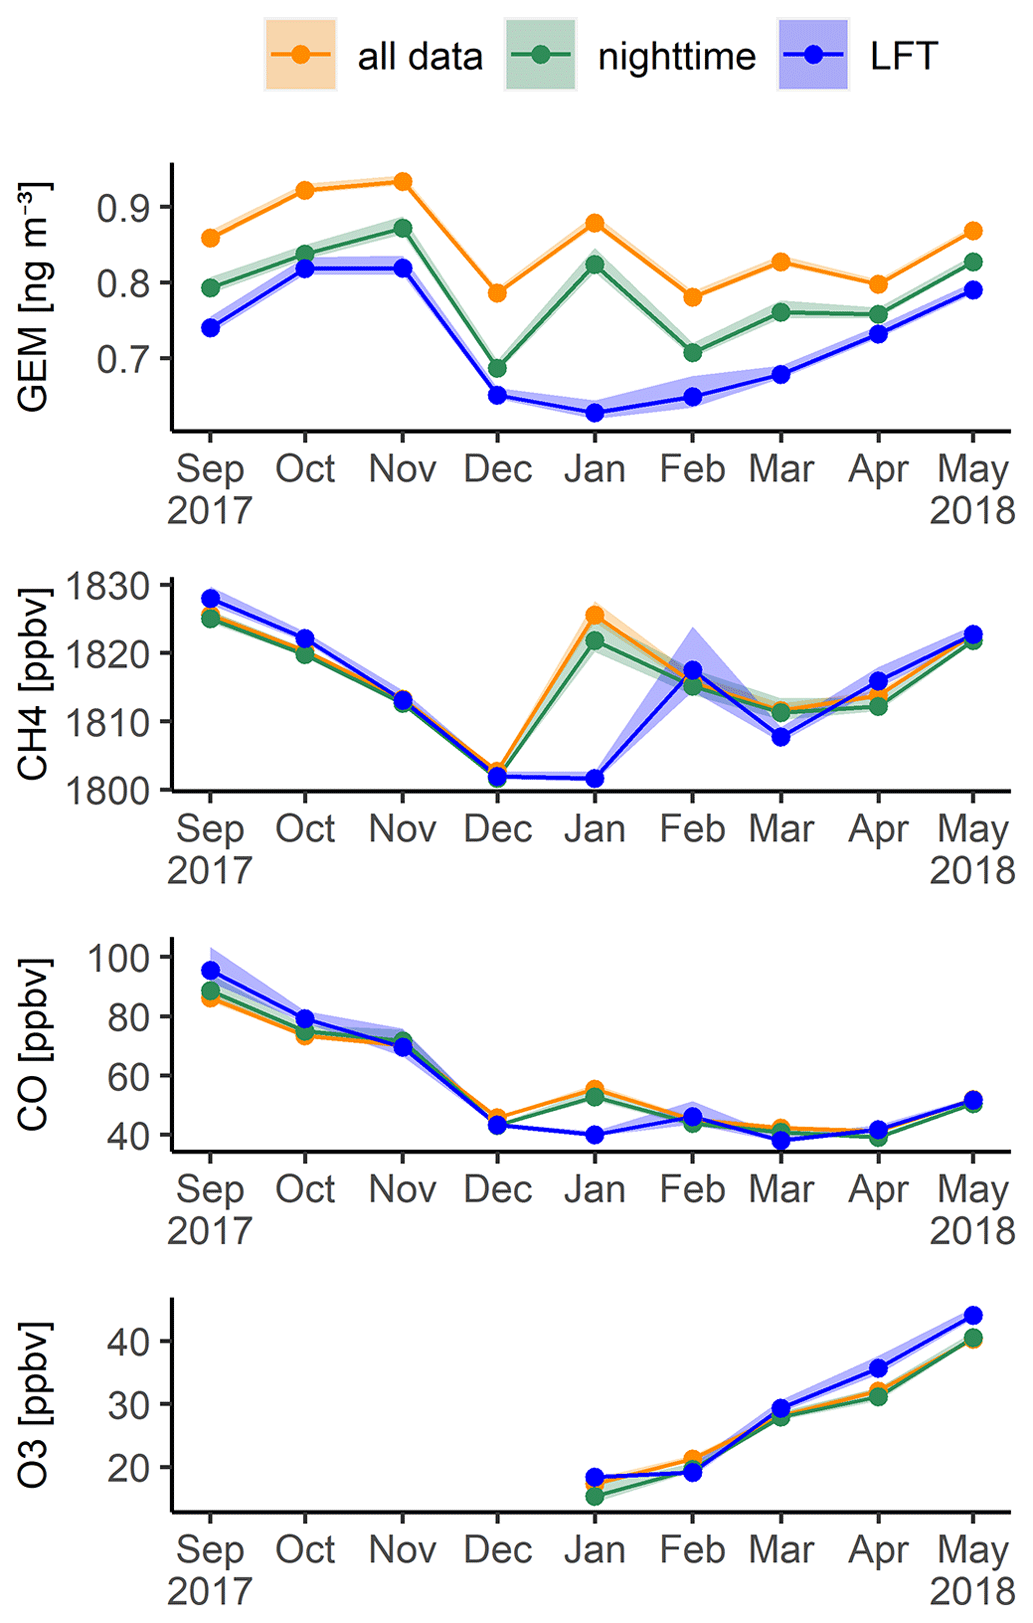
Figure 3Estimated concentrations of atmospheric GEM, CH4, CO, and O3 in the lower free troposphere (LFT) of the SH tropical Indian Ocean, as inferred from dry nighttime air masses arriving at Maïdo. LFT time series (blue lines) were obtained by selecting only nighttime data (23:00–05:59 LT, green lines) from all observations (orange lines), followed by the application of a specific humidity filter. The shaded area encloses the mean ± 2 times the standard error.
3.2.2 Maïdo LFT GEM seasonality in the context of atmospheric Hg models
GEOS-Chem modeling results predict an important seasonality of atmospheric Hg in both the NH and the SH (Horowitz et al., 2017; Shah et al., 2021; Feinberg et al., 2022). In contrast, while such a Hg seasonality has been observed in the NH, only a weak Hg seasonality has been observed at SH background sites such as Amsterdam Island and Cape Point (Slemr et al., 2015, 2020). It has been proposed that atmospheric Hg seasonality is less pronounced at SH monitoring stations as a consequence of the lower land cover in the SH (19 %) compared to the NH (39 %) and consequently a lesser importance of vegetation GEM uptake as a driver for Hg seasonality (Feinberg et al., 2022; Jiskra et al., 2018; Zhang and Zhang, 2022).
Adding another piece to this puzzle, we observed an important seasonal variation of GEM at Maïdo, but only after isolating the LFT from BL influences (Fig. 3, Sect. 3.2.1). This suggests that Hg seasonality, seemingly weak in the SH BL, might be much more pronounced in the SH free troposphere.
To illustrate how this LFT seasonal variation compares to modeled Hg seasonality in the SH and how it contrasts with the reported lack of observed Hg seasonality in the BL at other SH background sites, we digitized the GEOS-Chem modeling results from Horowitz et al. (2017) and Shah et al. (2021), which differ importantly in the used atmospheric Hg redox chemistry schemes (see the introduction). As can be seen in Fig. 4, Maïdo LFT GEM is lower than atmospheric Hg observed at other SH background sites (Amsterdam Island and Cape Point; note that at these sites TGM ∼ GEM), which itself is notably lower than modeled Hg in Shah et al. (2021). Maïdo LFT GEM is also somewhat lower than modeled Hg in Horowitz et al. (2017). As for seasonality, the minimum of Maïdo LFT GEM lies somewhere in between the modeled Hg minimum of Horowitz et al. (2017) and Shah et al. (2021), albeit somewhat closer to Horowitz et al. (2017).
Important caveats to the comparison with GEOS-Chem results have to be mentioned. (1) Both Horowitz et al. (2017) and Shah et al. (2021) evaluated Hg seasonality not for the LFT but for the lowest model layer (∼ 0–60 m a.g.l.), which lies entirely within the BL, (2) modeled Hg corresponds to different time periods than Maïdo GEM observations, and (3) the digitized modeled Hg seasonalities correspond to model results evaluated for the geographical coordinates of Amsterdam Island (37.8∘ S, 77.57∘ E), Cape Point (34.35∘ S, 18.48∘ E), and Bariloche (41.13∘ S, 71.42∘ W; only in the case of Shah et al., 2021), not Maïdo (∼ 21.08∘ S, 55.38∘ E).
The goal of this comparison is thus not to evaluate which chemistry scheme performs better but to illustrate the added benefit from relatively continuous Hg observations in the free troposphere. Modeled seasonality of atmospheric Hg is evidently sensitive to the used chemistry scheme (Fig. 4). In consequence, if Hg seasonality is observed in the free troposphere, as in the case of Maïdo, it could be used to evaluate and improve our understanding of atmospheric Hg chemistry. Inversely, the observed discrepancies between modeled and observed seasonalities in the SH MBL may indicate a model misrepresentation of more BL-specific processes, such as surface emissions, deposition velocities, or more BL-specific Hg chemistry.
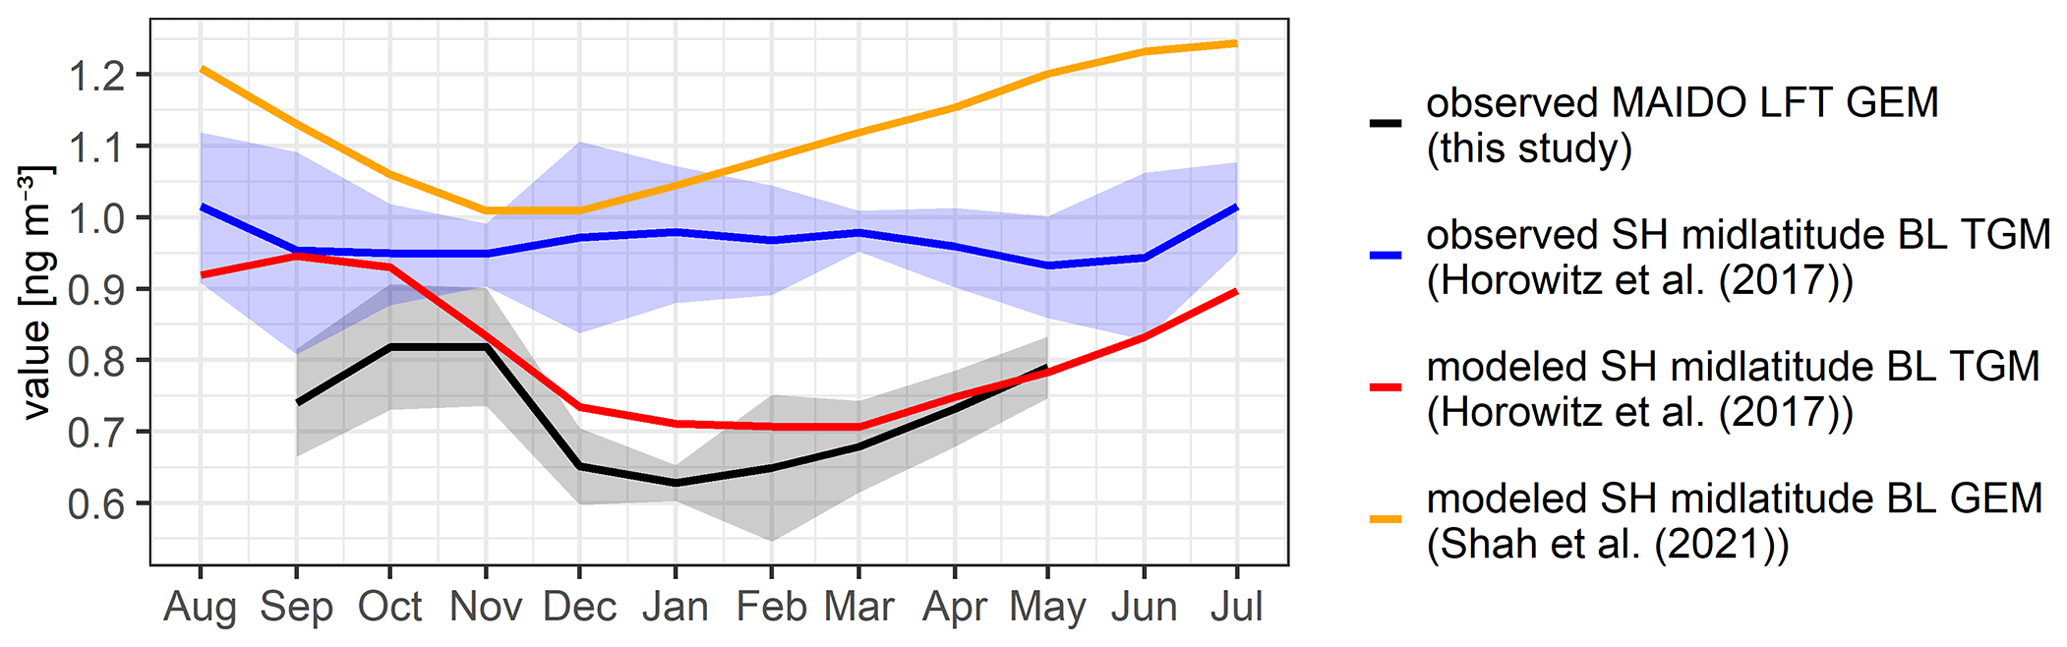
Figure 4Comparison between observed and modeled Hg seasonalities in the SH. The abbreviations LFT and BL correspond to “lower free troposphere” and “boundary layer”, respectively. Observed TGM seasonality as digitized from Horowitz et al. (2017) corresponds to observations from Amsterdam Island and Cape Point. The shaded areas give the mean ± 1 standard deviation.
3.2.3 An upper bound on RM concentrations in the LFT
While LFT and BL influences on Maïdo vary diurnally (see the site description in Sect. 2.1), our RM observations correspond to integration times of ∼ 6–14 d. In consequence, RM concentrations reported here correspond to a mix of air masses from the LFT, the PBL, and the MBL. Given the low time resolution of our RM observations, it was not possible to isolate RM in the LFT by only considering dry nighttime air masses, as we did for hourly sampled GEM (see Sect. 3.2.1).
We hence used a different approach to constrain RM in the LFT: we combined FLEXPART-AROME results with ERA5 reanalysis data (Hersbach et al., 2020) to estimate, on a seasonal basis, the fraction of sampled air masses coming from the PBL, the MBL, the cloud-free LFT, and clouds (see Supplement Sect. S5). We then estimated RM in the (cloud-free) LFT with the mixing equation below (Eq. 1). Clouds were addressed explicitly because of the elevated water solubility of atmospheric RM, which can be efficiently scavenged into cloud droplets and rain (Nair et al., 2013).
where fMBL, fPBL, fLFT(cloud-free), and fclouds are the estimated fractions of air coming from the MBL, PBL, cloud-free LFT, and clouds, respectively.
To estimate RM in the cloud-free LFT (RMLFT(cloud-free)), assumptions about mean RM concentrations in the MBL (RMMBL), the PBL (RMPBL), and clouds (RMclouds), all not known from Maïdo observations alone, had to be made. As for RMMBL, recent observations at Amsterdam Island (∼ 2700 km south-east of Maïdo) with the same measurement protocol as ours (see methods) revealed MBL RM concentrations of ∼ 4 pg m−3 (Jeroen Sonke, Beatriz F. Araujo, Olivier Magand, Aurelien Dommergue, personal communication, unpublished data). However, higher RM concentrations of ∼ 13 pg m−3 have recently been derived for MBL air arriving at the Australian coast (∼ 9200 km east of Maïdo), based on observations with cation exchange membranes (Miller et al., 2021). Here, we only aim to estimate the upper bound of RM in the (cloud-free) LFT at Maïdo, which is obtained when the lower bound of concentrations is assumed for RMMBL, RMPBL, and RMclouds (see Eq. 1). With this goal in mind, we used 0 pg m−3 for RMclouds, assuming complete scavenging of RM in clouds, and we used 4 pg m−3 for both RMPBL and RMMBL, based on observations at Amsterdam Island.
Our results suggest that RM in the cloud-free LFT might be about twice as high as the overall average at Maïdo, i.e. up to 30 pg m−3 (SD: 7) in SON, 14 pg m−3 (SD: 10) in DJFM, and 15 pg m−3 (SD: 6) in AMJ, with an average of 20 pg m−3 (SD: 13) over the whole measurement period. It is notable that even this upper limit is still at the lower end of RM concentrations reported from NH mountain sites (∼ 20–133 pg m−3; see Sect. 3.1.2). This might be partly explained by the difference in GEM concentrations between Maïdo (mean 0.85 ng m−3) and these NH measurement sites (mean ∼ 1.5 ng m−3), considering that the chemical production rate of RM in the atmosphere depends directly on GEM concentrations. However, any interpretation has to be approached with care, as our estimate of RM in the LFT is subject to important uncertainties arising from the low time resolution of our RM observations, the use of FLEXPART-AROME to estimate air mass mixing (see Supplement Sect. S5), and several assumptions.
3.3 Exploring GEM diurnal variation
3.3.1 Conditions leading to marked GEM diurnal cycles
As described above, GEM at Maïdo exhibits a marked diurnal variation, with a minimum at night when the observatory samples mostly air from the LFT, rising concentrations after dawn, and a peak around noon, after which concentrations decrease again (Fig. 2b).
To investigate possible drivers for this diurnal variation and to determine which conditions affect the amplitude of GEM diurnal cycles, we grouped days into (1) days with a strong GEM diurnal variation (Group 1: difference between noon and nighttime > 0.16 ng m−3; 55 d in total) and (2) days with a weak diurnal GEM variation (Group 2: difference between noon and nighttime < 0.08 ng m−3; 21 d in total). Days belonging to neither of these two groups were excluded from this analysis.
As can be seen in Fig. 5, Group 1 diurnal cycles are characterized by remarkably low mean GEM concentrations at night (arithmetic mean: 0.72 ng m−3 between 23:00 and 05:59 LT, SD: 0.09 ng m−3) and, by definition, by a large GEM difference between nighttime and noon (0.26 ng m−3 difference on average). On the other hand, Group 2 diurnal cycles are characterized by comparatively high GEM concentrations at night (on average 0.87 ng m−3, SD: 0.11 ng m−3) and, by definition, by a low GEM difference between nighttime and noon (0.04 ng m−3 difference on average).
We find large differences in meteorological conditions corresponding to the two groups. While marked GEM diurnal cycles (Group 1) are associated with mostly sunny days and dry nights, atypically weak diurnal cycles (Group 2) are associated with cloudy days and humid nights (Fig. 5). This suggests that Maïdo receives predominantly LFT air at night for days assigned to Group 1, while this is not the case for days assigned to Group 2.
For data belonging to Group 1, mean diurnal GEM variation anti-correlates significantly (Pearson: , p ≪ 0.01) with the diurnal variation of carbon dioxide (CO2; see Fig. 5), a long-lived (Archer et al., 2009) greenhouse gas importantly taken up by vegetation, especially during daytime (Black and Clanton, 1973). Indeed, diurnal CO2 variation at Maïdo is mostly driven by vegetation–gas exchange (Callewaert et al., 2022). Group 1 mean diurnal GEM variation also correlates significantly with the diurnal variation of isoprene (r=0.95, p ≪ 0.01), a short-lived (∼ 1 h during daytime) VOC mostly emitted by terrestrial vegetation under sunlight and heat stress (Guenther et al., 1993; Pacifico et al., 2009). At Maïdo, observed isoprene mainly originates from the vegetated mountain slopes and the densely vegetated Cirque de Mafate (see the site description in Sect. 2.1) relatively close to the observatory (Verreyken et al., 2021). These strong relationships suggest that the diurnal cycles of GEM, isoprene, and CO2 may be related to similar drivers and regions of influence. In other words, GEM diurnal variation appears to be linked to the island's vegetated surface under sunlight.
Finally, Group 1 GEM diurnal variation correlates (r=0.87, p ≪ 0.01) with that of dimethyl sulfide (DMS), a relatively short-lived (∼ 1–2 d; Chen et al., 2018; Kloster et al., 2006) VOC that is mostly emitted by marine phytoplankton (Stefels et al., 2007) and is frequently used as a tracer for marine air masses. Even though DMS concentrations at Maïdo are relatively low, the diurnal variation of Maïdo DMS is most likely related to marine influences (Verreyken et al., 2021). It is noteworthy that GEM concentrations increase immediately after sunrise (∼ 06:00–07:00 LT) and quickly decrease in the afternoon, while DMS concentrations start rising later in the day (at around 09:00 LT) and do not decline until the evening (∼ 18:00 LT, Fig. 5). This suggests that diurnal GEM variation is not in phase with the diurnal variation of MBL influences.
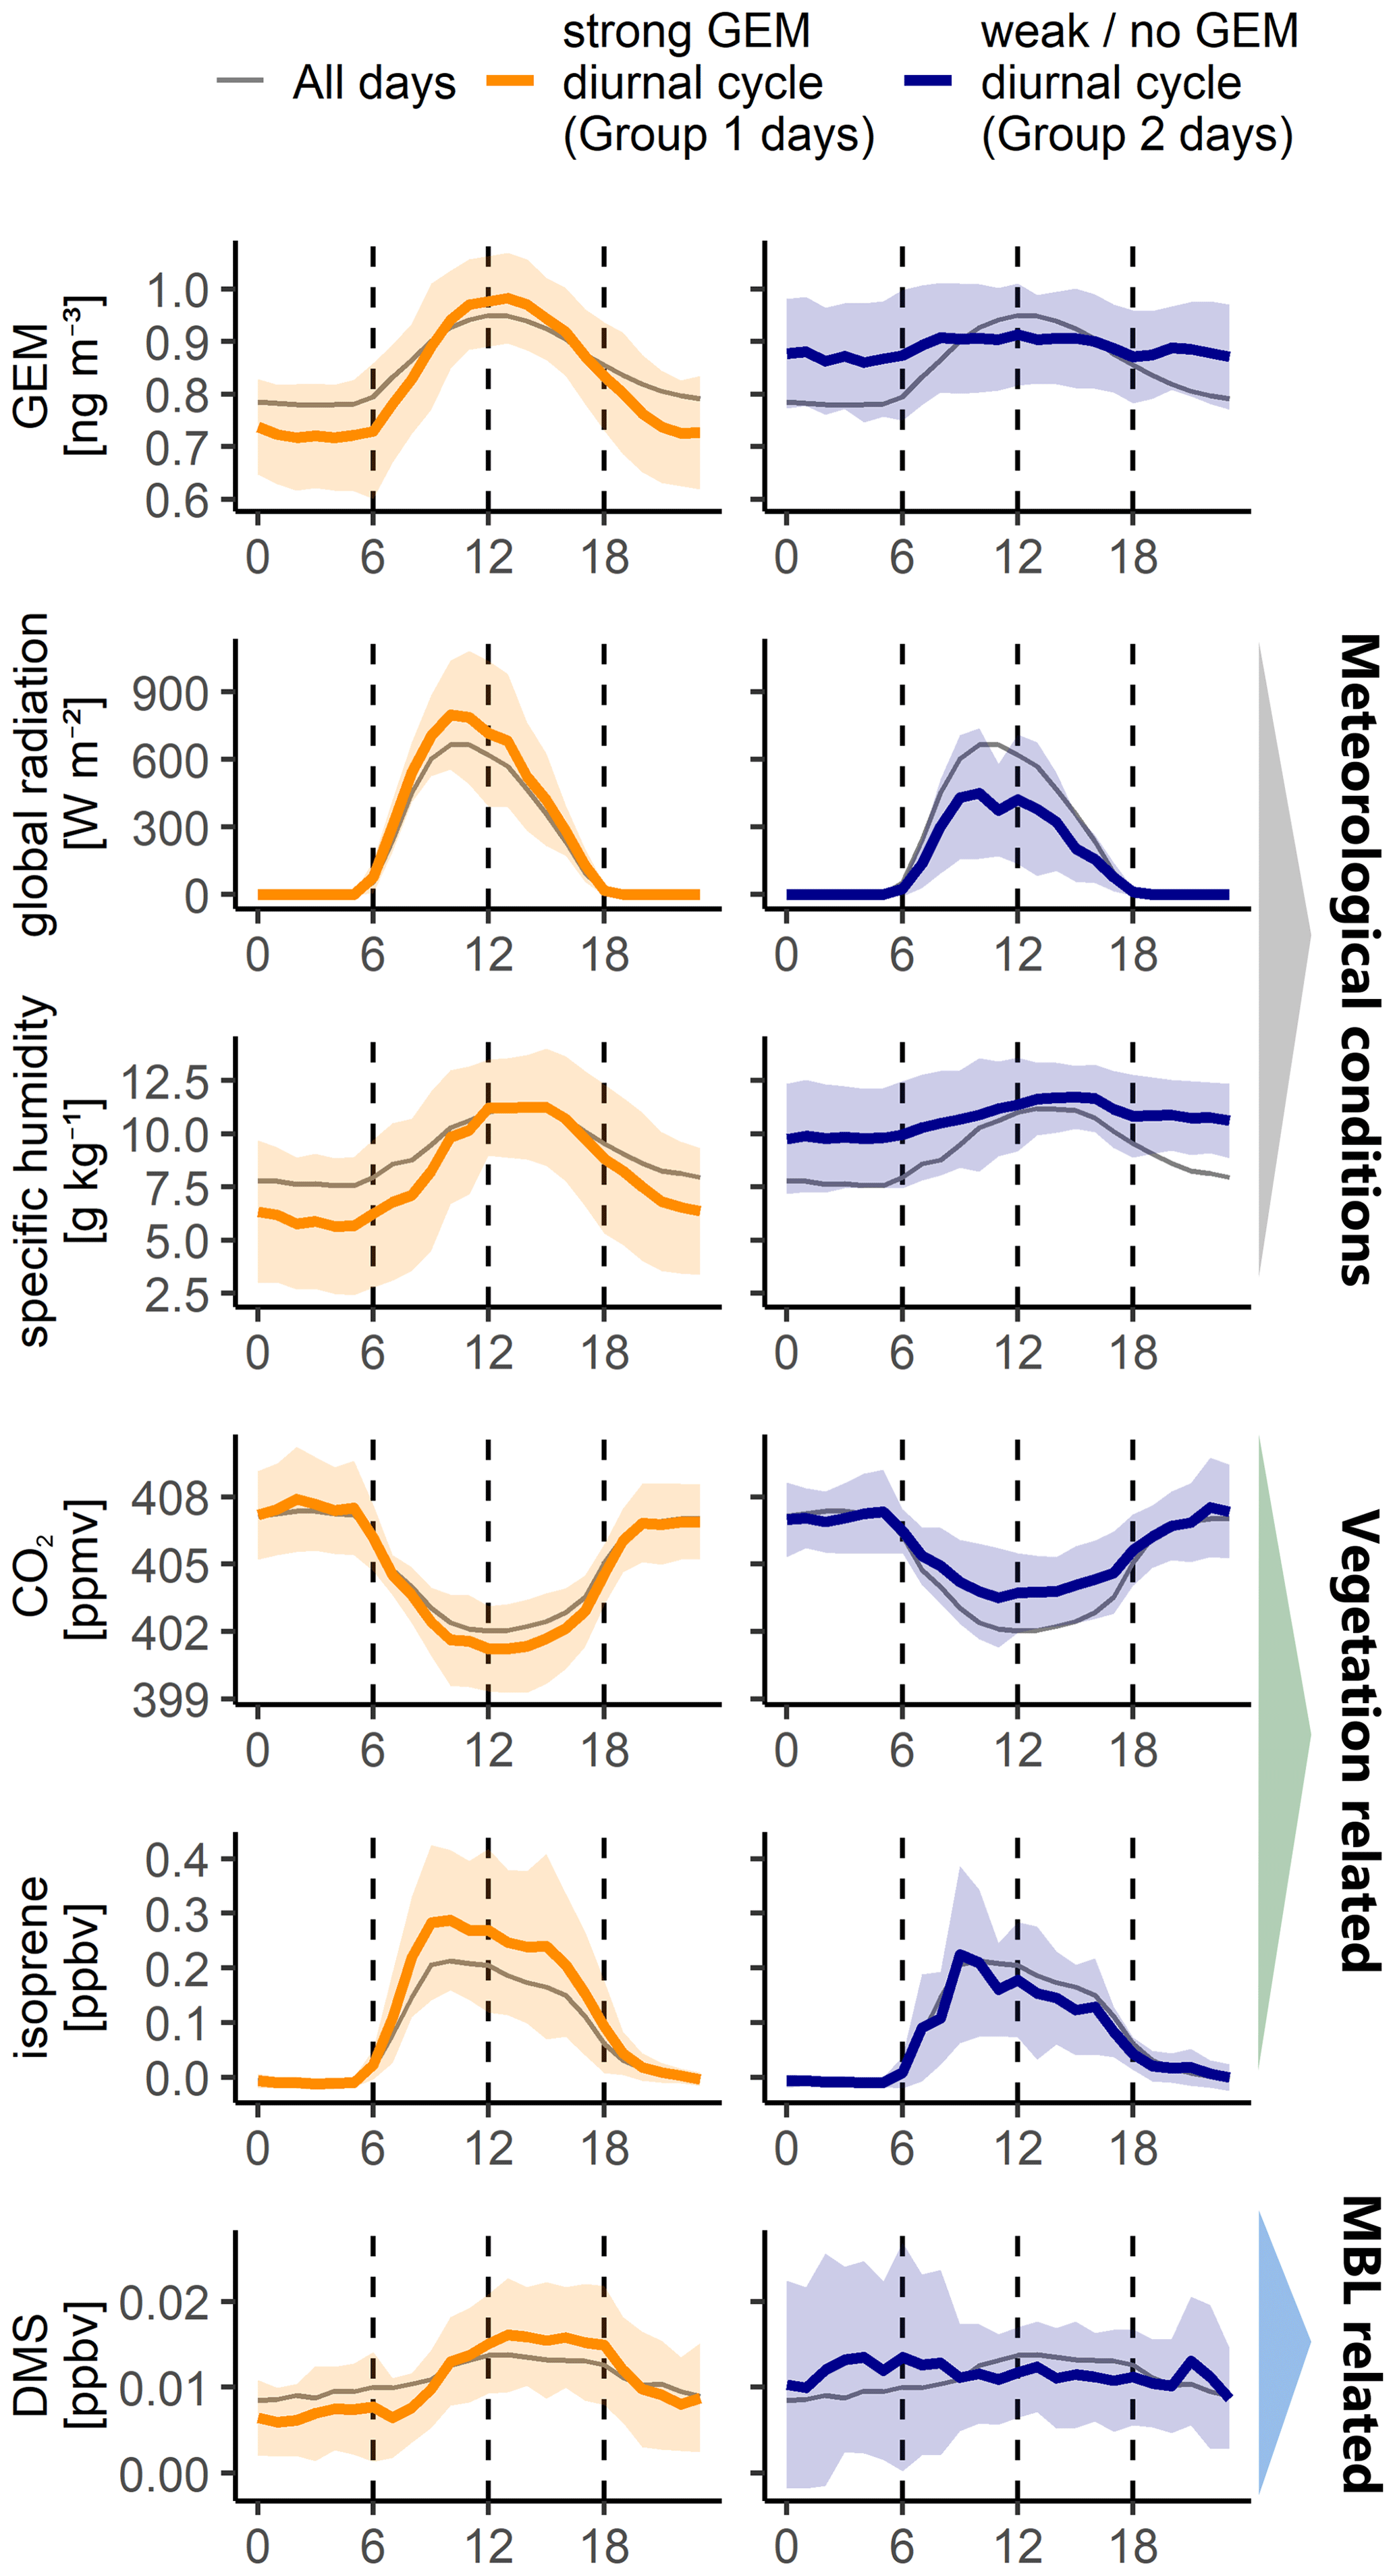
Figure 5Mean diurnal variation (arithmetic average) of GEM, solar radiation, specific humidity, CO2, isoprene, and DMS. Days have been grouped into two main groups as a function of the amplitude of diurnal GEM variation (the difference between nighttime and noon). The left column corresponds to all data on days with an especially marked GEM diurnal variation (Group 1), and the right column corresponds to all data on days with no or only a weak diurnal GEM variation (Group 2). The thin gray line shows the average diurnal cycle for all days (for which GEM observations are also available). The shaded area corresponds to the mean ± 1 standard deviation.
3.3.2 Constraining the role of mixing processes
Above, we showed that very pronounced diurnal GEM cycles (Group 1) are related to the sampling of LFT air at night and to a strong diurnal variation of DMS, which suggests an important diurnal variation in the fraction of air coming from the MBL.
Considering the reported importance of mixing processes at Maïdo (Lesouëf et al., 2013; Guilpart et al., 2017), we first explore the hypothesis that GEM diurnal cycles are purely driven by a diurnal variation in the sampled mix between LFT and MBL air masses. In this baseline hypothesis, we assume that there are no influences from the island's surface, even though the abovementioned similarities between GEM, CO2, and isoprene diurnal variations suggest otherwise (see Fig. 5).
To test this hypothesis, we built a two-box mixing model where we assume that Maïdo GEM depends only on GEM concentrations in the MBL, GEM concentrations in the LFT, as well as the diurnal variation in the mixing between LFT and MBL air (see Supplement Sect. S6). We estimated the latter with the help of FLEXPART-AROME (see Supplement Sect. S5). For simplicity, we only focus on those days that show a strong diurnal GEM variation (Group 1 in Fig. 5; 55 d in total, of which FLEXPART output is available for 40), which generally correspond to sunny days with few clouds and low nighttime humidity. This choice allows us to minimize the difficult-to-parameterize effect of clouds and provides confidence that air masses sampled at night come indeed predominantly from the LFT (see Sect. 3.2.1).
To represent LFT GEM concentrations in the two-box mixing model, we use the LFT GEM time series derived in Sect. 3.2.1 (see also Fig. 3). MBL GEM concentrations at Réunion Island are more difficult to constrain from Maïdo observations alone, as pure MBL air is rarely sampled. We thus assumed MBL GEM concentrations to be within 0.9–1.1 ng m−3 for the two-box mixing model, based on previously reported GEM concentrations in the SH MBL (Slemr et al., 2015, 2020). Considering the reported absence of clear GEM diurnal variation and the weak seasonality in the MBL of the SH (Slemr et al., 2015), we also assumed MBL concentrations to be constant throughout the day and year.
While the two-box mixing model suggests an important influence of mixing processes on GEM diurnal variation, we find that the modeled and observed diurnal GEM variations do not agree in timing (Fig. 6). A variation in mixing between LFT and MBL air as the sole driver of GEM diurnal variation cannot explain the early morning rise in GEM and would place the GEM peak in the afternoon, around 2–4 h later than observed. It must be said that the modeled diurnal GEM variation in the two-box mixing model depends directly on the FLEXPART-AROME-based estimate of the mixing between LFT air and MBL air, which could conceivably be biased. To exclude such a bias, we compared the estimated LFT/MBL mixing to the observed diurnal DMS variation as a proxy for marine influences, finding that diurnally varying MBL influences appear to be captured adequately (see Supplement Sect. S5).
We thus consider that mixing processes between MBL and LFT air, even though likely an important contributor, cannot adequately explain GEM diurnal variability alone. In the following section, we explore the potential role of the island's vegetated surface under sunlight.
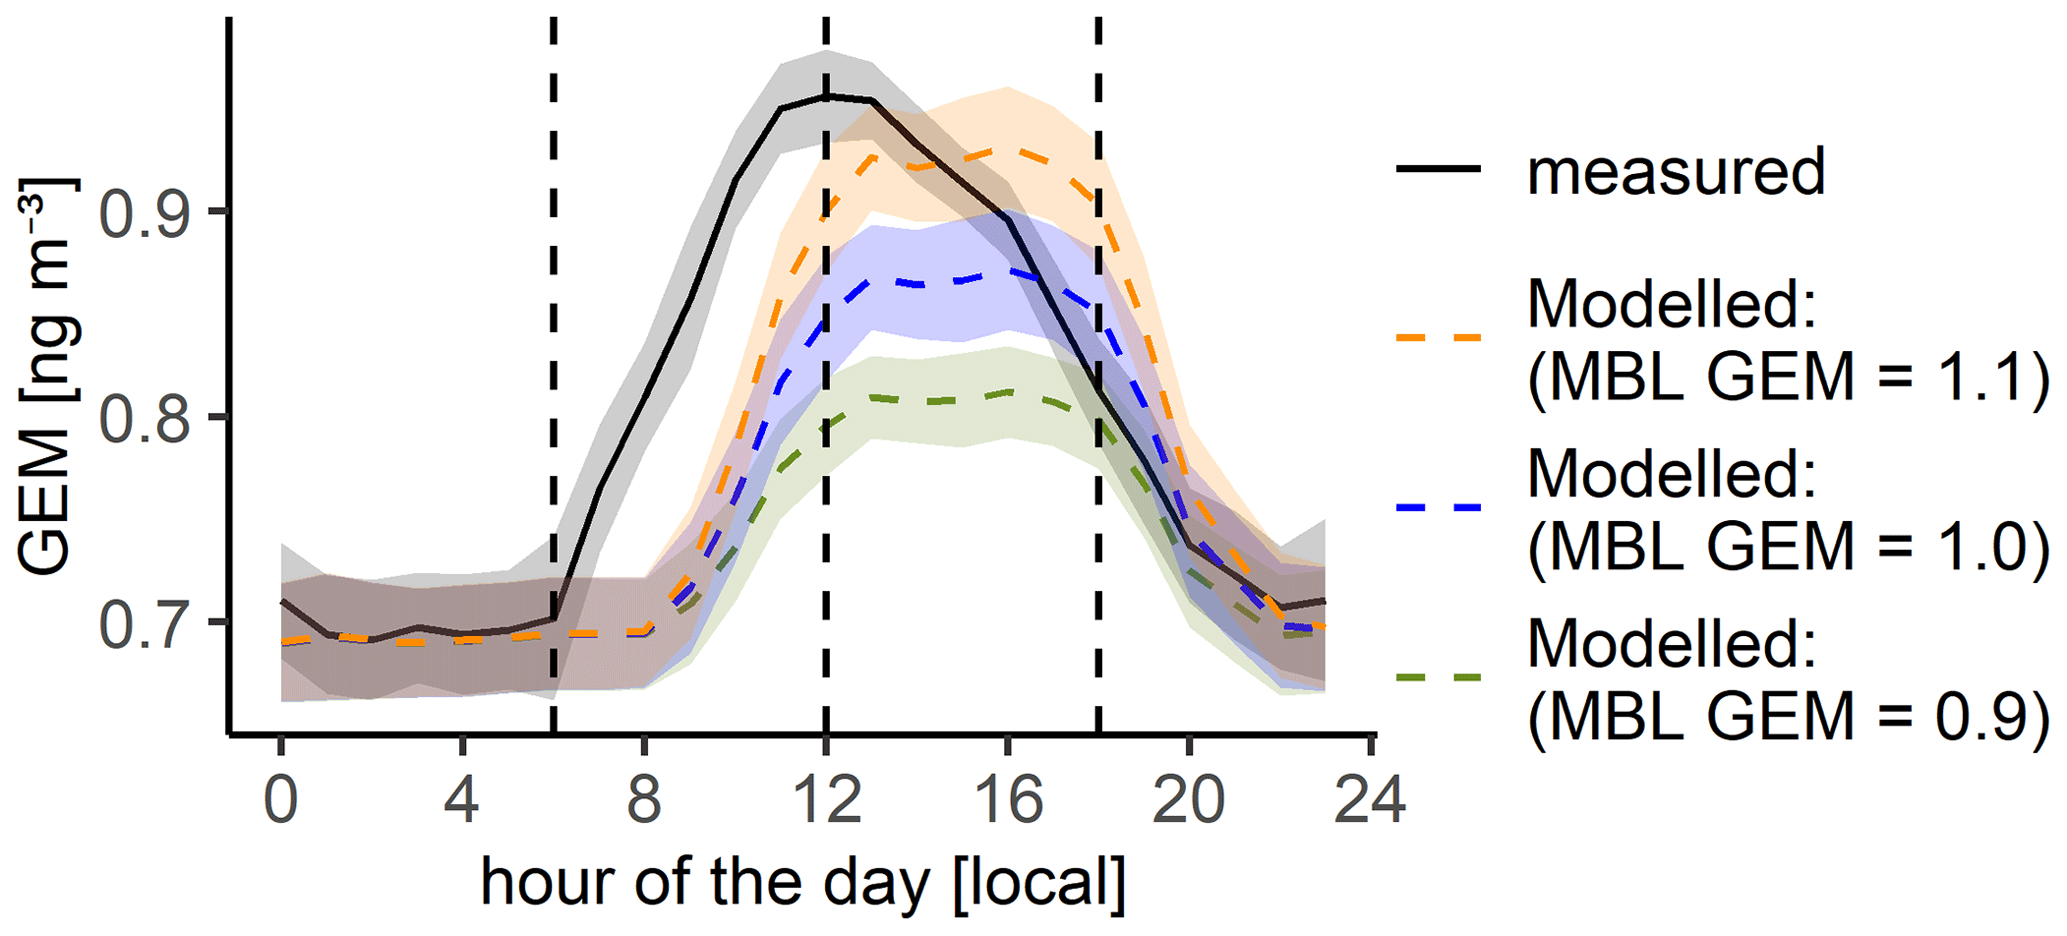
Figure 6Assessment of the role of mixing between LFT and MBL as a driver for diurnal GEM cycles. The solid line shows the observed mean diurnal GEM cycle for those days characterized by an especially marked diurnal GEM variation (Group 1). The dashed lines give the corresponding modeled diurnal GEM cycles if only the diurnal variation in the sampled mix of LFT and MBL air is considered, under the assumption of no surface influence from the island. Modeled diurnal cycles based on three different MBL concentrations (1.1, 1.0, and 0.9 ng m−3) are shown. Shaded areas give the arithmetic mean ± 2 times the standard error.
3.3.3 Radiation-driven surface emissions as a potential driver for GEM diurnal variation
We found that diurnal GEM variation at Maïdo depends on solar radiation and that marked diurnal cycles of GEM at Maïdo relate importantly to the diurnal cycles of isoprene and CO2, which have been attributed to the island's vegetated surface. This suggests that GEM diurnal cycles are related to vegetated surfaces under sunlight.
Previous work has shown that solar radiation, especially in the ultraviolet range, can cause photo-reemission of Hg from surfaces, such as snow, and lead to diurnal GEM cycles characterized by a midday peak (Song et al., 2018; Angot et al., 2016a). While terrestrial vegetation is globally a net sink of atmospheric mercury (Zhou and Obrist, 2021), fluxes between vegetation and the atmosphere are bidirectional (Agnan et al., 2016; Luo et al., 2016), and reemission also occurs from vegetated surfaces and soils (Yuan et al., 2019; Yu et al., 2020; Converse et al., 2010; Osterwalder et al., 2017). Not only RM deposited onto leaf surfaces can be photo-reduced and reemitted as GEM, but also Hg from within the leaf tissue (Yuan et al., 2019).
Considering all this, we propose the hypothesis that Maïdo GEM diurnal variation is, in addition to mixing between LFT and MBL air, driven by net daytime photo-reemission of GEM from the island's vegetated surfaces (i.e. vegetation + soil), especially from the vegetated mountain slopes close to the observatory.
We addressed this hypothesis by including a term expressing the (net) photo-reemission of GEM from vegetated surfaces into the mixing model from the previous section. We parametrize the impact of photo-reemission on observed GEM as the product of (1) the FLEXPART-AROME-derived SRRs between Maïdo observatory and vegetated surfaces, (2) total solar radiation as measured at Maïdo, and (3) a constant radiation-dependent surface emission term (see Supplement Sect. S6 for details). As in the previous section concerning the influence of mixing processes, and for the same reasons, we only focus on those days that exhibit a strong diurnal cycle (Group 1 in Fig. 5). While we assume direct proportionality between net GEM reemission and solar radiation (see Supplement Sect. S6), the magnitude of this relationship (in other words, the slope) is not known. We estimate this slope in an inverse modeling approach, i.e. we determine the most likely slope by computing the model for a wide range of values and evaluating the root mean square error (RMSE) between modeled and observed mean diurnal GEM variation.
We find that (Group 1) diurnal GEM cycles could be well explained (RMSE = 0.022 ng m−3) by a net surface GEM emission of 0.032 ng h−1 W−1 (Fig. 7), corresponding to a net emission of 21 ng m−2 h−1 at the mean diurnal solar radiation maximum at Maïdo (∼ 660 W m−2) and to an average net emission flux of 13.5 ng m−2 h−1 during hours of daylight. Extrapolated to the whole year, this flux would imply a net daytime surface emission of ∼ 59 µg m−2 yr−1. Our flux estimates depend on a variety of parameters used for the inverse modeling, such as the assumed MBL GEM concentration and the used parametrizations to estimate air mass mixing (see Supplement Sect. S5) and SRRs (see Supplement Sect. S6). To assess uncertainties, we recalculated in a Monte Carlo approach (Janssen, 2013; Metropolis and Ulam, 1949) the average net daytime emission flux for a wide range of parameters, obtaining a 95 % confidence interval of 8–22 ng m−2 h−1 (see Supplement Sect. S7). It should be noted that our flux estimate corresponds to the full ecosystem, i.e. the sum of vegetation and soil fluxes, with their relative contributions being unknown. In addition, our estimate assumes that GEM concentrations at Maïdo are not strongly affected by anthropogenic emissions downslope, similar to what has been reported for CO and CO2 (mean anthropogenic contribution at noon < 7 ppbv and < 0.2 ppm, respectively; Callewaert et al., 2022).
To our knowledge, no previous studies have derived differentiated daytime and nighttime GEM fluxes for mostly pristine tropical mountain forests or shrublands comparable to those on Réunion Island. Observed daytime Hg emission fluxes from background sites in other terrestrial environments (i.e. predominantly low-altitude and extra-tropical) were generally below ∼ 3.5 ng m−2 h−1 (median ∼ 0.8 ng m−2 h−1), significantly lower than found here (Agnan et al., 2016). Mean daytime fluxes of up to ∼ 6 ng m−2 h−1 (depending on the season) have been reported for temperate mountain meadows in the US (Converse et al., 2010) and Tibet (Sun et al., 2020). Daytime fluxes above ∼ 10 ng m−2 h−1, similar to what we derived here, were observed in some tropical environments, e.g. for an open field soil in Amazonia (Almeida et al., 2009) and a naturally preserved but anthropogenically influenced (TGM > 5 ng m−3) forest soil (soil Hg: ∼ 0.13 ) in tropical China (Fu et al., 2012). It is well reported that daytime emissions from terrestrial surfaces correlate with soil Hg concentrations and solar radiation (Agnan et al., 2016). Soil Hg concentrations on Réunion Island are high (median: 0.16 mg kg−1; range: 0.03–0.81 mg kg−1; Dœlsch et al., 2006) compared to European and other tropical topsoils (median ∼ 0.02 and ∼ 0.06 mg kg−1, respectively; Panagos et al., 2021; Lim et al., 2020). This, alongside the strong incident solar radiation around Maïdo (see Fig. 5), might explain the large daytime emission flux found here. In any case, given that studies in directly comparable environments are scarce, it is not yet possible to say whether a large daytime emission flux is specific to mountain forests and shrublands on Réunion Island or characteristic of tropical mountain environments in general.
Our results suggest that vegetated surfaces around and downslope of Maïdo are a net source of GEM to the air during hours of daylight but not necessarily during the entire 24 h period. Maïdo observatory is mostly insensitive to surface–atmosphere interactions during the night when sampled air masses come predominantly from the LFT. Even though little can be said about nighttime atmosphere–surface fluxes based on Maïdo observations alone, it is likely that net Hg deposition occurs at night onto vegetated surfaces around and downslope of Maïdo to sustain net daytime GEM emission. It is thought that vegetation GEM uptake happens mostly through plant stomata (Zhou and Obrist, 2021), whose opening varies as a function of daytime, heat stress, and evaporative loss (Roelfsema and Hedrich, 2005). While stomata tend to open most widely during the day, they often remain at least partly open during the night, especially in the case of tropical vegetation (Wang et al., 2021). This could allow for nighttime stomatal GEM uptake in addition to possible non-stomatal uptake pathways (Converse et al., 2010). In fact, significant nighttime GEM uptake by vegetation has been reported before (Kurz et al., 2020; Fu et al., 2016b; Jiskra et al., 2018; Yu et al., 2018). Adding to GEM dry deposition, katabatic winds could bring comparatively high RM concentrations in the LFT (see Sect. 3.2.3) to the mountain vegetation around and downslope of Maïdo and lead to elevated nighttime RM deposition on leaf surfaces, which could then be readily reduced and reemitted during daytime under the strong tropical sun.
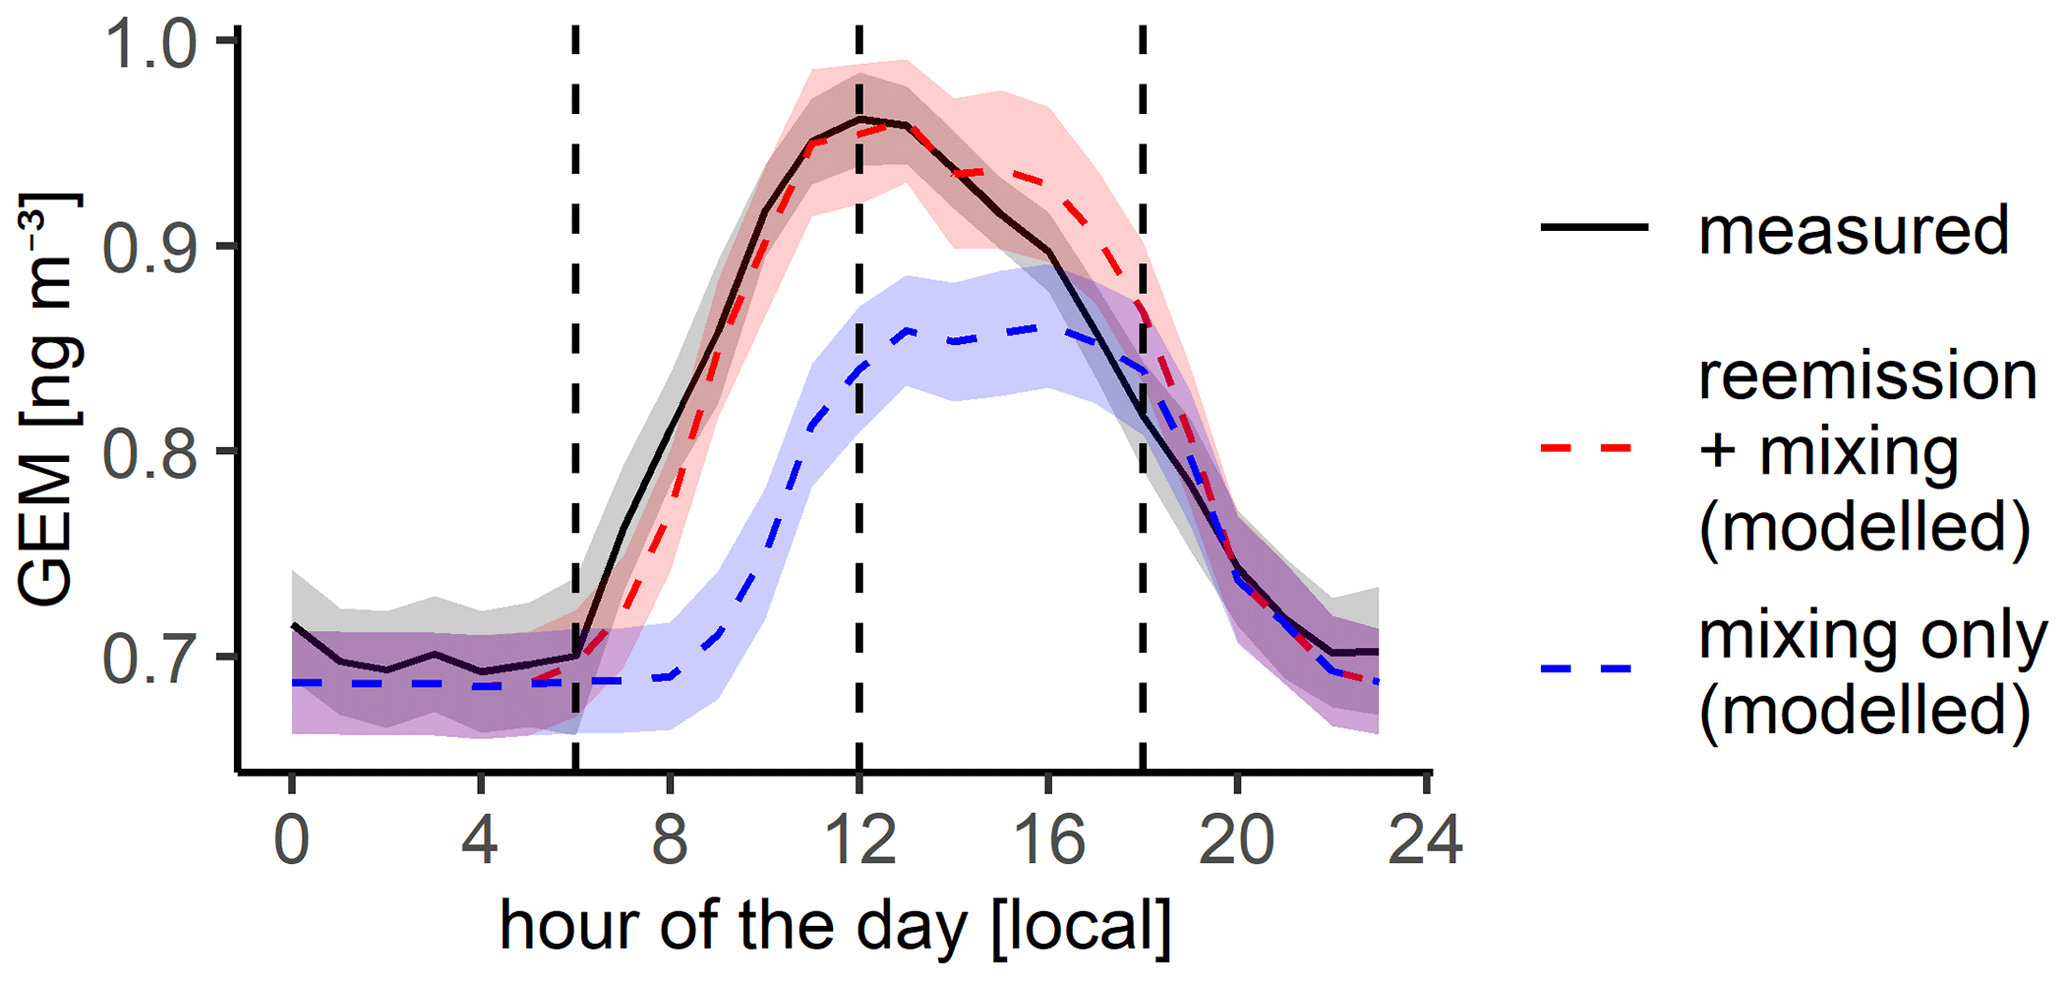
Figure 7Assessment of the potential role of surface GEM reemission as a driver for GEM diurnal cycles. The solid line shows the observed mean diurnal GEM cycle for those days characterized by an especially marked diurnal GEM variation (Group 1). The dashed lines give the corresponding modeled mean diurnal GEM cycles if (1) only mixing processes between MBL and LFT are considered (dashed blue line; assumed MBL GEM = 1.0 ng m−3) and (2) parameterized photo-reemission from the island's vegetated surface is added to the mixing model (dashed red line; assumed surface flux is a result of inverse modeling). Shaded areas show the arithmetic mean ± 2 times the standard error.
We presented 9 months of observations of GEM (sampled every 15 min) and RM (integrated over ∼ 6–14 d) at Maïdo mountain observatory (2160 m a.s.l.) on Réunion Island in the Southern Hemisphere (SH) tropical Indian Ocean. Due to mesoscale circulation characteristics, Maïdo is influenced by the boundary layer (BL) during the daytime but samples mostly air from the lower free troposphere (LFT) during nighttime. Based on nighttime observations in especially dry air masses, we estimated GEM in the LFT of the tropical Indian Ocean to be, on average, significantly lower than unfiltered Maïdo GEM observations (0.74 ng m−3 vs. 0.85 ng m−3, respectively). Maïdo LFT GEM showed an important seasonal variation, with the highest concentrations from October to November 2017 and the lowest concentrations from December 2017 to March 2018, corresponding to austral summer. Such a marked seasonal variation stands in contrast to the reported weak Hg seasonality at background sites in the SH marine boundary layer (MBL) but is congruent with the significant and photochemistry-dependent Hg seasonality reported in modeling studies. This suggests that Hg observations in the SH LFT may be particularly useful for constraining Hg chemistry and that continuous Hg monitoring at SH mountain sites could prove highly beneficial for the community.
Mean RM at Maïdo, sampled on polyethersulfone (PES) membranes, was ∼ 10.6 pg m−3, significantly lower than reported RM concentrations for mountain sites in the NH. While we estimate that RM in the (cloud-free) LFT at Maïdo may be about twice as high (∼ 20 pg m−3), we were limited by the low time resolution of RM observations (sample integration time of ∼ 6–14 d). This limitation did not allow us to capture the likely significant diurnal RM variation at Maïdo and to rigorously separate the LFT from boundary layer influences. In future studies on mountain observatories, it would be advisable to measure RM with a higher time resolution that permits resolving of diurnal variations or at least capturing of daytime and nighttime differences in RM concentrations.
GEM at Maïdo exhibits marked diurnal cycling, with a nighttime minimum and a noon maximum. GEM diurnal cycling is significantly more pronounced on sunny days than on cloudy days and disappears altogether during large-scale cyclonic storms. Marked GEM diurnal cycles are significantly correlated with isoprene, emitted from vegetation under sunlight, and anti-correlated with CO2, which is taken up by vegetation during photosynthesis. This suggests net GEM emission from the island's mostly vegetated surface during the day. GEM diurnal cycles at Maïdo could be well explained by significant GEM photo-reemission from the island's vegetated surfaces (i.e. vegetation + soil) during daylight hours combined with important MBL influences in the afternoon. Through inverse modeling, we estimated that vegetated surfaces around and downslope of Maïdo could emit on average 13.5 ng m−2 h−1 (95 % CI: 8–22 ng m−2 h−1) of GEM during daylight hours. To maintain this net daytime emission, significant net nighttime Hg deposition from the atmosphere to these vegetated surfaces is to be expected, likely through deposition of both GEM and RM. While these results are subject to considerable uncertainties, they suggest important and diurnally variable bidirectional fluxes between vegetated surfaces and the atmosphere, at least for tropical evergreen mountain forests and shrublands such as those found on Réunion Island. Future measurement campaigns on Réunion Island could explore Hg concentrations and isotopic signatures below the forest canopy, in soil, in rainfall, in litterfall, and in throughfall to rigorously constrain these bidirectional Hg fluxes and to further investigate the potentially important role of nighttime GEM uptake by vegetation.
Maïdo L2 GEM data (https://doi.org/10.25326/352) are freely available (Magand and Dommergue, 2022) at https://gmos.aeris-data.fr/ (last access: 11 August 2022) from the GMOS-FR data portal coordinated by IGE (Institut des Géosciences de l'Environnement – Grenoble, France; technical PI: Olivier Magand) and maintained by the French national center for atmospheric data and services (AERIS). Monthly averaged Maïdo L2 GEM data for different data selections (all data, nighttime only, LFT) are given in Supplement Sect. S4. Maïdo RM data are given in Supplement Sect. S8. Maïdo (O)VOC data as acquired with a hs-PTR-MS instrument in the framework of the OCTAVE project are freely available under https://doi.org/10.18758/71021061 (Amelynck et al., 2021). The hourly means of CO2, CH4, and CO concentrations and a set of meteorological parameters are available on the Carbon Portal (https://www.icos-cp.eu/, last access: 18 January 2023) and under https://doi.org/10.18160/10QG-6RP6 (De Mazière et al., 2022).
The supplement related to this article is available online at: https://doi.org/10.5194/acp-23-1309-2023-supplement.
AMK performed the formal analysis, created visualizations, and wrote the manuscript with contributions from all the co-authors. AMK, OM, BV, JB, BFA, JES, and AD contributed to experimental and statistical methods. OM, BFA, and JES were involved in data curation. OM, AD, and JES conceptualized the observational setup and the research goals. AD, JES, OM, JPC, NS, CA, and JB acquired funding. OM performed field work and validated the experimental setup. BFA and JES performed laboratory analysis. CA, MR, AC, and MKS provided experimental data. BV and JB performed FLEXPART simulations. AD and OM administrated the project. AD, JES, and OM supervised the research.
The contact author has declared that none of the authors has any competing interests.
Publisher's note: Copernicus Publications remains neutral with regard to jurisdictional claims in published maps and institutional affiliations.
This publication is part of the GMOS-Train project that has received funding from the European Union's Horizon 2020 research and innovation programme under Marie Skłodowska-Curie grant agreement no. 860497.
Maïdo GEM data were collected via instruments coordinated by the IGE-PTICHA technical platform dedicated to atmospheric chemistry field instrumentation. The authors are grateful for the AERIS data infrastructure for providing access to the GEM data in this study.
We thank OPAR (Observatoire de Physique de l'Atmosphère à La Réunion), funded by CNRS-INSU and Université de La Réunion and managed by OSU-R (Observatoire des Sciences de l'Univers à La Réunion, UMS 3365). Jean-Marc Metzger, from OSU-R, and Christelle Barthe, from LACy and Météo-France, are particularly thanked for their support in the implementation of OPAR's instrumentation and the provision of meteorological data.
The PTR-MS data from BIRA-IASB were obtained in the framework of the OCTAVE project, funded by the Belgian Federal Science Policy Office (grant no. BR/175/A2/OCTAVE) with additional support for deploying the instrument at Maïdo from Horizon 2020 (ACTRIS-2, grant no. 654109).
The ICOS station Observatoire de l'Atmosphère du Maïdo (RUN) is a Belgian–French collaboration project and operated through a collaboration between the Royal Belgian Institute for Space Aeronomy (BIRA-IASB) and the following French partners: Commissiarat à l'Energie Atomique et aux Energies Alternatives (CEA), Centre National de la Recherche Scientifique (CNRS), Université de Versailes Saint Quentin-en-Yvelines (UVSQ), and Université de La Réunion (UR). In Belgium, it has been financially supported since 2014 by EU project ICOS-Inwire and the ministerial decree for ICOS (FR/35/IC1 to FR/35/C6) and the ICOS-BE project. The authors are grateful to their colleagues Martine De Mazière, Nicolas Kumps, and Christian Hermans (BIRA-IASB) and Jean-Marc Metzger (UR) for their contributions to the labelling process, daily operations, and management of the station. We thank Johannes Bieser (Hereon) for constructive scientific discussions.
This research has been supported by Horizon 2020 in the framework of GMOS-Train (grant no. 860497) and ERA-PLANET (grant no. 689443), the Belgian Federal Science Policy Office (grant no. BR/175/A2/OCTAVE), and the French national LEFECHAT CNRS/INSU program (TOPMMODEL project, grant no. AO2017-984931 to Olivier Magand).
This paper was edited by Leiming Zhang and reviewed by two anonymous referees.
Agnan, Y., Le Dantec, T., Moore, C. W., Edwards, G. C., and Obrist, D.: New Constraints on Terrestrial Surface–Atmosphere Fluxes of Gaseous Elemental Mercury Using a Global Database, Environ. Sci. Technol., 50, 507–524, https://doi.org/10.1021/acs.est.5b04013, 2016.
Aliaga, D., Sinclair, V. A., Andrade, M., Artaxo, P., Carbone, S., Kadantsev, E., Laj, P., Wiedensohler, A., Krejci, R., and Bianchi, F.: Identifying source regions of air masses sampled at the tropical high-altitude site of Chacaltaya using WRF-FLEXPART and cluster analysis, Atmos. Chem. Phys., 21, 16453–16477, https://doi.org/10.5194/acp-21-16453-2021, 2021.
Almeida, M. D., Marins, R. V., Paraquetti, H. H. M., Bastos, W. R., and Lacerda, L. D.: Mercury degassing from forested and open field soils in Rondônia, Western Amazon, Brazil, Chemosphere, 77, 60–66, https://doi.org/10.1016/j.chemosphere.2009.05.018, 2009.
Amelynck, C., Schoon, N., and Verreyken, B.: Long-term in situ (O)VOC measurements at the Maïdo Observatory (Reunion Island), Royal Belgian Institute for Space Aeronomy (BIRA-IASB) [data set], https://doi.org/10.18758/71021061, 2021
Angot, H., Barret, M., Magand, O., Ramonet, M., and Dommergue, A.: A 2-year record of atmospheric mercury species at a background Southern Hemisphere station on Amsterdam Island, Atmos. Chem. Phys., 14, 11461–11473, https://doi.org/10.5194/acp-14-11461-2014, 2014.
Angot, H., Dion, I., Vogel, N., Legrand, M., Magand, O., and Dommergue, A.: Multi-year record of atmospheric mercury at Dumont d'Urville, East Antarcticcoast: continental outflow and oceanic influences, Atmos. Chem. Phys., 16, 8265–8279, https://doi.org/10.5194/acp-16-8265-2016, 2016a.
Angot, H., Magand, O., Helmig, D., Ricaud, P., Quennehen, B., Gallée, H., Del Guasta, M., Sprovieri, F., Pirrone, N., Savarino, J., and Dommergue, A.: New insights into the atmospheric mercury cycling in central Antarctica and implications on a continental scale, Atmos. Chem. Phys., 16, 8249–8264, https://doi.org/10.5194/acp-16-8249-2016, 2016b.
Archer, D., Eby, M., Brovkin, V., Ridgwell, A., Cao, L., Mikolajewicz, U., Caldeira, K., Matsumoto, K., Munhoven, G., Montenegro, A., and Tokos, K.: Atmospheric Lifetime of Fossil Fuel Carbon Dioxide, Annu. Rev. Earth Pl. Sc., 37, 117–134, https://doi.org/10.1146/annurev.earth.031208.100206, 2009.
Ariya, P. A., Skov, H., Grage, M. M.-L., and Goodsite, M. E.: Gaseous Elemental Mercury in the Ambient Atmosphere: Review of the Application of Theoretical Calculations and Experimental Studies for Determination of Reaction Coefficients and Mechanisms with Halogens and Other Reactants, in: Advances in Quantum Chemistry, Vol. 55, Elsevier, 43–55, https://doi.org/10.1016/S0065-3276(07)00204-3, 2008.
Ariya, P. A., Amyot, M., Dastoor, A., Deeds, D., Feinberg, A., Kos, G., Poulain, A., Ryjkov, A., Semeniuk, K., Subir, M., and Toyota, K.: Mercury Physicochemical and Biogeochemical Transformation in the Atmosphere and at Atmospheric Interfaces: A Review and Future Directions, Chem. Rev., 115, 3760–3802, https://doi.org/10.1021/cr500667e, 2015.
Baray, J.-L., Courcoux, Y., Keckhut, P., Portafaix, T., Tulet, P., Cammas, J.-P., Hauchecorne, A., Godin Beekmann, S., De Mazière, M., Hermans, C., Desmet, F., Sellegri, K., Colomb, A., Ramonet, M., Sciare, J., Vuillemin, C., Hoareau, C., Dionisi, D., Duflot, V., Vérèmes, H., Porteneuve, J., Gabarrot, F., Gaudo, T., Metzger, J.-M., Payen, G., Leclair de Bellevue, J., Barthe, C., Posny, F., Ricaud, P., Abchiche, A., and Delmas, R.: Maïdo observatory: a new high-altitude station facility at Reunion Island (21∘ S, 55∘ E) for long-term atmospheric remote sensing and in situ measurements, Atmos. Meas. Tech., 6, 2865–2877, https://doi.org/10.5194/amt-6-2865-2013, 2013.
Black Jr., C. C.: Photosynthetic carbon fixation in relation to net CO2 uptake, Ann. Rev. Plant Physio., 24, 253–286, 1973.
Brioude, J., Arnold, D., Stohl, A., Cassiani, M., Morton, D., Seibert, P., Angevine, W., Evan, S., Dingwell, A., Fast, J. D., Easter, R. C., Pisso, I., Burkhart, J., and Wotawa, G.: The Lagrangian particle dispersion model FLEXPART-WRF version 3.1, Geosci. Model Dev., 6, 1889–1904, https://doi.org/10.5194/gmd-6-1889-2013, 2013.
Callewaert, S., Brioude, J., Langerock, B., Duflot, V., Fonteyn, D., Müller, J.-F., Metzger, J.-M., Hermans, C., Kumps, N., Ramonet, M., Lopez, M., Mahieu, E., and De Mazière, M.: Analysis of CO2, CH4, and CO surface and column concentrations observed at Réunion Island by assessing WRF-Chem simulations, Atmos. Chem. Phys., 22, 7763–7792, https://doi.org/10.5194/acp-22-7763-2022, 2022.
Calvert, J. and Lindberg, S.: Mechanisms of mercury removal by O and OH in the atmosphere, Atmos. Environ., 39, 3355–3367, https://doi.org/10.1016/j.atmosenv.2005.01.055, 2005.
Carbone, F., Landis, M. S., Gencarelli, C. N., Naccarato, A., Sprovieri, F., De Simone, F., Hedgecock, I. M., and Pirrone, N.: Sea surface temperature variation linked to elemental mercury concentrations measured on Mauna Loa: SST AND HG(0) CONCENTRATION ON MAUNA LOA, Geophys. Res. Lett., 43, 7751–7757, https://doi.org/10.1002/2016GL069252, 2016.
Chen, Q., Sherwen, T., Evans, M., and Alexander, B.: DMS oxidation and sulfur aerosol formation in the marine troposphere: a focus on reactive halogen and multiphase chemistry, Atmos. Chem. Phys., 18, 13617–13637, https://doi.org/10.5194/acp-18-13617-2018, 2018.
Collaud Coen, M., Weingartner, E., Furger, M., Nyeki, S., Prévôt, A. S. H., Steinbacher, M., and Baltensperger, U.: Aerosol climatology and planetary boundary influence at the Jungfraujoch analyzed by synoptic weather types, Atmos. Chem. Phys., 11, 5931–5944, https://doi.org/10.5194/acp-11-5931-2011, 2011.
Converse, A. D., Riscassi, A. L., and Scanlon, T. M.: Seasonal variability in gaseous mercury fluxes measured in a high-elevation meadow, Atmos. Environ., 44, 2176–2185, https://doi.org/10.1016/j.atmosenv.2010.03.024, 2010.
D'Amore, F., Bencardino, M., Cinnirella, S., Sprovieri, F., and Pirrone, N.: Data quality through a web-based QA/QC system: implementation for atmospheric mercury data from the global mercury observation system, Environ. Sci. Proc. Imp., 17, 1482–1491, https://doi.org/10.1039/C5EM00205B, 2015.
De Mazière, M., Sha, M. K., Ramonet, M., and ICOS RI: ICOS Atmosphere Level 2 data, La Réunion [data set], https://doi.org/10.18160/10QG-6RP6, 2022.
Denzler, B., Bogdal, C., Henne, S., Obrist, D., Steinbacher, M., and Hungerbühler, K.: Inversion Approach to Validate Mercury Emissions Based on Background Air Monitoring at the High Altitude Research Station Jungfraujoch (3580 m), Environ. Sci. Technol., 51, 2846–2853, https://doi.org/10.1021/acs.est.6b05630, 2017.
Dibble, T. S., Tetu, H. L., Jiao, Y., Thackray, C. P., and Jacob, D. J.: Modeling the OH-Initiated Oxidation of Mercury in the Global Atmosphere without Violating Physical Laws, J. Phys. Chem. A, 124, 444–453, https://doi.org/10.1021/acs.jpca.9b10121, 2020.
Diéguez, M. C., Bencardino, M., García, P. E., D'Amore, F., Castagna, J., De Simone, F., Soto Cárdenas, C., Ribeiro Guevara, S., Pirrone, N., and Sprovieri, F.: A multi-year record of atmospheric mercury species at a background mountain station in Andean Patagonia (Argentina): Temporal trends and meteorological influence, Atmos. Environ., 214, 116819, https://doi.org/10.1016/j.atmosenv.2019.116819, 2019.
Dœlsch, E., Van de Kerchove, V., and Saint Macary, H.: Heavy metal content in soils of Réunion (Indian Ocean), Geoderma, 134, 119–134, https://doi.org/10.1016/j.geoderma.2005.09.003, 2006.
Duflot, V., Tulet, P., Flores, O., Barthe, C., Colomb, A., Deguillaume, L., Vaïtilingom, M., Perring, A., Huffman, A., Hernandez, M. T., Sellegri, K., Robinson, E., O'Connor, D. J., Gomez, O. M., Burnet, F., Bourrianne, T., Strasberg, D., Rocco, M., Bertram, A. K., Chazette, P., Totems, J., Fournel, J., Stamenoff, P., Metzger, J.-M., Chabasset, M., Rousseau, C., Bourrianne, E., Sancelme, M., Delort, A.-M., Wegener, R. E., Chou, C., and Elizondo, P.: Preliminary results from the FARCE 2015 campaign: multidisciplinary study of the forest–gas–aerosol–cloud system on the tropical island of La Réunion, Atmos. Chem. Phys., 19, 10591–10618, https://doi.org/10.5194/acp-19-10591-2019, 2019.
Dunham-Cheatham, S. M., Lyman, S., and Gustin, M. S.: Evaluation of sorption surface materials for reactive mercury compounds, Atmos. Environ., 242, 117836, https://doi.org/10.1016/j.atmosenv.2020.117836, 2020.
Edwards, D. P., Emmons, L. K., Gille, J. C., Chu, A., Attié, J.-L., Giglio, L., Wood, S. W., Haywood, J., Deeter, M. N., Massie, S. T., Ziskin, D. C., and Drummond, J. R.: Satellite-observed pollution from Southern Hemisphere biomass burning, J. Geophys. Res., 111, D14312, https://doi.org/10.1029/2005JD006655, 2006.
Faïn, X., Obrist, D., Hallar, A. G., Mccubbin, I., and Rahn, T.: High levels of reactive gaseous mercury observed at a high elevation research laboratory in the Rocky Mountains, Atmos. Chem. Phys., 9, 8049–8060, https://doi.org/10.5194/acp-9-8049-2009, 2009.
Feinberg, A., Dlamini, T., Jiskra, M., Shah, V., and Selin, N. E.: Evaluating atmospheric mercury (Hg) uptake by vegetation in a chemistry-transport model, Environ. Sci. Proc. Imp., 24, 1303–1318, https://doi.org/10.1039/D2EM00032F, 2022.
Forrer, J., Rüttimann, R., Schneiter, D., Fischer, A., Buchmann, B., and Hofer, P.: Variability of trace gases at the high-Alpine site Jungfraujoch caused by meteorological transport processes, J. Geophys. Res., 105, 12241–12251, https://doi.org/10.1029/1999JD901178, 2000.
Foucart, B., Sellegri, K., Tulet, P., Rose, C., Metzger, J.-M., and Picard, D.: High occurrence of new particle formation events at the Maïdo high-altitude observatory (2150 m), Réunion (Indian Ocean), Atmos. Chem. Phys., 18, 9243–9261, https://doi.org/10.5194/acp-18-9243-2018, 2018.
Fu, X., Feng, X., Zhang, H., Yu, B., and Chen, L.: Mercury emissions from natural surfaces highly impacted by human activities in Guangzhou province, South China, Atmos. Environ., 54, 185–193, https://doi.org/10.1016/j.atmosenv.2012.02.008, 2012.
Fu, X., Marusczak, N., Heimbürger, L.-E., Sauvage, B., Gheusi, F., Prestbo, E. M., and Sonke, J. E.: Atmospheric mercury speciation dynamics at the high-altitude Pic du Midi Observatory, southern France, Atmos. Chem. Phys., 16, 5623–5639, https://doi.org/10.5194/acp-16-5623-2016, 2016a.
Fu, X., Zhu, W., Zhang, H., Sommar, J., Yu, B., Yang, X., Wang, X., Lin, C.-J., and Feng, X.: Depletion of atmospheric gaseous elemental mercury by plant uptake at Mt.Changbai, Northeast China, Atmos. Chem. Phys., 16, 12861–12873, https://doi.org/10.5194/acp-16-12861-2016, 2016b.
Fu, X., Marusczak, N., Wang, X., Gheusi, F., and Sonke, J. E.: Isotopic Composition of Gaseous Elemental Mercury in the Free Troposphere of the Pic du Midi Observatory, France, Environ. Sci. Technol., 50, 5641–5650, https://doi.org/10.1021/acs.est.6b00033, 2016c.
Gillot, P.-Y. and Nativel, P.: Eruptive history of the Piton de la Fournaise volcano, Reunion Island, Indian Ocean, J. Volcanol. Geoth. Res., 36, 53–65, https://doi.org/10.1016/0377-0273(89)90005-X, 1989.
Guenther, A. B., Zimmerman, P. R., Harley, P. C., Monson, R. K., and Fall, R.: Isoprene and monoterpene emission rate variability: Model evaluations and sensitivity analyses, J. Geophys. Res., 98, 12609, https://doi.org/10.1029/93JD00527, 1993.
Guilpart, E., Vimeux, F., Evan, S., Brioude, J., Metzger, J.-M., Barthe, C., Risi, C., and Cattani, O.: The isotopic composition of near-surface water vapor at the Maïdo observatory (Reunion Island, southwestern Indian Ocean) documents the controls of the humidity of the subtropical troposphere: Water Vapor Isotopes in Reunion Island, J. Geophys. Res.-Atmos., 122, 9628–9650, https://doi.org/10.1002/2017JD026791, 2017.
Gustin, M. S., Amos, H. M., Huang, J., Miller, M. B., and Heidecorn, K.: Measuring and modeling mercury in the atmosphere: a critical review, Atmos. Chem. Phys., 15, 5697–5713, https://doi.org/10.5194/acp-15-5697-2015, 2015.
Gustin, M. S., Dunham-Cheatham, S. M., and Zhang, L.: Comparison of 4 Methods for Measurement of Reactive, Gaseous Oxidized, and Particulate Bound Mercury, Environ. Sci. Technol., 53, 14489–14495, https://doi.org/10.1021/acs.est.9b04648, 2019.
Gustin, M. S., Dunham-Cheatham, S. M., Huang, J., Lindberg, S., and Lyman, S. N.: Development of an Understanding of Reactive Mercury in Ambient Air: A Review, Atmosphere, 12, 73, https://doi.org/10.3390/atmos12010073, 2021.
Hahn, C. J., Merrill, J. T., and Mendonca, B. G.: Meteorological influences during MLOPEX, J. Geophys. Res., 97, 10291, https://doi.org/10.1029/91JD02299, 1992.
Hazan, L., Tarniewicz, J., Ramonet, M., Laurent, O., and Abbaris, A.: Automatic processing of atmospheric CO2 and CH4 mole fractions at the ICOS Atmosphere Thematic Centre, Atmos. Meas. Tech., 9, 4719–4736, https://doi.org/10.5194/amt-9-4719-2016, 2016.
Heiskanen, J., Brümmer, C., Buchmann, N., Calfapietra, C., Chen, H., Gielen, B., Gkritzalis, T., Hammer, S., Hartman, S., Herbst, M., Janssens, I. A., Jordan, A., Juurola, E., Karstens, U., Kasurinen, V., Kruijt, B., Lankreijer, H., Levin, I., Linderson, M.-L., Loustau, D., Merbold, L., Myhre, C. L., Papale, D., Pavelka, M., Pilegaard, K., Ramonet, M., Rebmann, C., Rinne, J., Rivier, L., Saltikoff, E., Sanders, R., Steinbacher, M., Steinhoff, T., Watson, A., Vermeulen, A. T., Vesala, T., Vítková, G., and Kutsch, W.: The Integrated Carbon Observation System in Europe, Bulletin of the American Meteorological Society, 103, E855–E872, https://doi.org/10.1175/BAMS-D-19-0364.1, 2022.
Hersbach, H., Bell, B., Berrisford, P., Hirahara, S., Horányi, A., Muñoz-Sabater, J., Nicolas, J., Peubey, C., Radu, R., Schepers, D., Simmons, A., Soci, C., Abdalla, S., Abellan, X., Balsamo, G., Bechtold, P., Biavati, G., Bidlot, J., Bonavita, M., Chiara, G., Dahlgren, P., Dee, D., Diamantakis, M., Dragani, R., Flemming, J., Forbes, R., Fuentes, M., Geer, A., Haimberger, L., Healy, S., Hogan, R. J., Hólm, E., Janisková, M., Keeley, S., Laloyaux, P., Lopez, P., Lupu, C., Radnoti, G., Rosnay, P., Rozum, I., Vamborg, F., Villaume, S., and Thépaut, J.: The ERA5 global reanalysis, Q. J. Roy. Meteorol. Soc., 146, 1999–2049, https://doi.org/10.1002/qj.3803, 2020.
Horowitz, H. M., Jacob, D. J., Zhang, Y., Dibble, T. S., Slemr, F., Amos, H. M., Schmidt, J. A., Corbitt, E. S., Marais, E. A., and Sunderland, E. M.: A new mechanism for atmospheric mercury redox chemistry: implications for the global mercury budget, Atmos. Chem. Phys., 17, 6353–6371, https://doi.org/10.5194/acp-17-6353-2017, 2017.
Howard, D., Nelson, P. F., Edwards, G. C., Morrison, A. L., Fisher, J. A., Ward, J., Harnwell, J., van der Schoot, M., Atkinson, B., Chambers, S. D., Griffiths, A. D., Werczynski, S., and Williams, A. G.: Atmospheric mercury in the Southern Hemisphere tropics: seasonal and diurnal variations and influence of inter-hemispheric transport, Atmos. Chem. Phys., 17, 11623–11636, https://doi.org/10.5194/acp-17-11623-2017, 2017.
Inkscape Project: Inkscape, version 0.92.5 [software], https://inkscape.org (last access: 18 January 2023), 2022.
Janssen, H.: Monte-Carlo based uncertainty analysis: Sampling efficiency and sampling convergence, Reliab. Eng. Syst. Safe., 109, 123–132, https://doi.org/10.1016/j.ress.2012.08.003, 2013.
Jarvis, A., Guevara, E., Reuter, H. I., and Nelson, A. D.: Hole-filled SRTM for the globe: version 4: data grid, web publication/site, CGIAR Consortium for Spatial Information [data set], https://research.utwente.nl/en/publications/hole-filled-srtm-for-the-globe-version-4-data-grid (last access: 18 January 2023) 2008.
Jiskra, M., Sonke, J. E., Obrist, D., Bieser, J., Ebinghaus, R., Myhre, C. L., Pfaffhuber, K. A., Wängberg, I., Kyllönen, K., Worthy, D., Martin, L. G., Labuschagne, C., Mkololo, T., Ramonet, M., Magand, O., and Dommergue, A.: A vegetation control on seasonal variations in global atmospheric mercury concentrations, Nat. Geosci., 11, 244–250, https://doi.org/10.1038/s41561-018-0078-8, 2018.
Khalil, M. A. K. and Rasmussen, R. A.: Sources, sinks, and seasonal cycles of atmospheric methane, J. Geophys. Res., 88, 5131–5144, https://doi.org/10.1029/JC088iC09p05131, 1983.
Kleissl, J., Honrath, R. E., Dziobak, M. P., Tanner, D., Val Martín, M., Owen, R. C., and Helmig, D.: Occurrence of upslope flows at the Pico mountaintop observatory: A case study of orographic flows on a small, volcanic island: upslope flow at the pico-nare station, J. Geophys. Res., 112, D10S35, https://doi.org/10.1029/2006JD007565, 2007.
Kloster, S., Feichter, J., Maier-Reimer, E., Six, K. D., Stier, P., and Wetzel, P.: DMS cycle in the marine ocean-atmosphere system – a global model study, Biogeosciences, 3, 29–51, https://doi.org/10.5194/bg-3-29-2006, 2006.
Koenig, A. M., Magand, O., Laj, P., Andrade, M., Moreno, I., Velarde, F., Salvatierra, G., Gutierrez, R., Blacutt, L., Aliaga, D., Reichler, T., Sellegri, K., Laurent, O., Ramonet, M., and Dommergue, A.: Seasonal patterns of atmospheric mercury in tropical South America as inferred by a continuous total gaseous mercury record at Chacaltaya station (5240 m) in Bolivia, Atmos. Chem. Phys., 21, 3447–3472, https://doi.org/10.5194/acp-21-3447-2021, 2021.
Koenig, A. M., Sonke, J. E., Magand, O., Andrade, M., Moreno, I., Velarde, F., Forno, R., Gutierrez, R., Blacutt, L., Laj, P., Ginot, P., Bieser, J., Zahn, A., Slemr, F., and Dommergue, A.: Evidence for Interhemispheric Mercury Exchange in the Pacific Ocean Upper Troposphere, J. Geophys Res.-Atmos., 127, e2021JD036283, https://doi.org/10.1029/2021JD036283, 2022.
Kurz, A. Y., Blum, J. D., Gratz, L. E., and Jaffe, D. A.: Contrasting Controls on the Diel Isotopic Variation of Hg 0 at Two High Elevation Sites in the Western United States, Environ. Sci. Technol., 54, 10502–10513, https://doi.org/10.1021/acs.est.0c01918, 2020.
Laurent, O.: ICOS Atmosphere Monitoring Station Assembly, ICOS Atmosphere Thematic Centre (ATC), Report, ICOS Atmospheric Station Specifications v1.3, ICOS-ERIC, https://doi.org/10.18160/SDW6-BX90, 2017.
Lesouëf, D., Gheusi, F., Delmas, R., and Escobar, J.: Numerical simulations of local circulations and pollution transport over Reunion Island, Ann. Geophys., 29, 53–69, https://doi.org/10.5194/angeo-29-53-2011, 2011.
Lesouëf, D., Gheusi, F., Chazette, P., Delmas, R., and Sanak, J.: Low Tropospheric Layers Over Reunion Island in Lidar-Derived Observations and a High-Resolution Model, Bound.-Lay. Meteorol., 149, 425–453, https://doi.org/10.1007/s10546-013-9851-9, 2013.
Lim, A. G., Jiskra, M., Sonke, J. E., Loiko, S. V., Kosykh, N., and Pokrovsky, O. S.: A revised pan-Arctic permafrost soil Hg pool based on Western Siberian peat Hg and carbon observations, Biogeosciences, 17, 3083–3097, https://doi.org/10.5194/bg-17-3083-2020, 2020.
Lin, C. J.: Atmospheric Chemistry of Mercury, in: Environmental Chemistry and Toxicology of Mercury: Liu/Toxicology of Mercury, edited by: Liu, G., Cai, Y., and O'Driscoll, N., John Wiley & Sons, Inc., Hoboken, NJ, USA, https://doi.org/10.1002/9781118146644, 2011.
Lindberg, S., Bullock, R., Ebinghaus, R., Engstrom, D., Feng, X., Fitzgerald, W., Pirrone, N., Prestbo, E., and Seigneur, C.: A Synthesis of Progress and Uncertainties in Attributing the Sources of Mercury in Deposition, AMBIO, 36, 19–33, https://doi.org/10.1579/0044-7447(2007)36[19:ASOPAU]2.0.CO;2, 2007.
Lindqvist, O. and Rodhe, H.: Atmospheric mercury-a review, Tellus B, 37, 136–159, https://doi.org/10.1111/j.1600-0889.1985.tb00062.x, 1985.
Luippold, A., Gustin, M. S., Dunham-Cheatham, S. M., Castro, M., Luke, W., Lyman, S., and Zhang, L.: Use of Multiple Lines of Evidence to Understand Reactive Mercury Concentrations and Chemistry in Hawai'i, Nevada, Maryland, and Utah, USA, Environ. Sci. Technol., 54, 7922–7931, https://doi.org/10.1021/acs.est.0c02283, 2020.
Luo, Y., Duan, L., Driscoll, C. T., Xu, G., Shao, M., Taylor, M., Wang, S., and Hao, J.: Foliage/atmosphere exchange of mercury in a subtropical coniferous forest in south China: Foliage Atmosphere Hg Exchange, J. Geophys. Res.-Biogeo., 121, 2006–2016, https://doi.org/10.1002/2016JG003388, 2016.
Lyman, S. N., Jaffe, D. A., and Gustin, M. S.: Release of mercury halides from KCl denuders in the presence of ozone, Atmos. Chem. Phys., 10, 8197–8204, https://doi.org/10.5194/acp-10-8197-2010, 2010.
Magand, O. and Dommergue, A.: Continuous measurements of atmospheric mercury at Maido Observatory (L2), Global Mercury Observation System [data set], https://doi.org/10.25326/352, 2022.
Marusczak, N., Sonke, J. E., Fu, X., and Jiskra, M.: Tropospheric GOM at the Pic du Midi Observatory – Correcting Bias in Denuder Based Observations, Environ. Sci. Technol., 51, 863–869, https://doi.org/10.1021/acs.est.6b04999, 2017.
McClure, C. D., Jaffe, D. A., and Edgerton, E. S.: Evaluation of the KCl Denuder Method for Gaseous Oxidized Mercury using HgBr 2 at an In-Service AMNet Site, Environ. Sci. Technol., 48, 11437–11444, https://doi.org/10.1021/es502545k, 2014.
Metropolis, N. and Ulam, S.: The Monte Carlo Method, J. Am. Stat. Assoc., 44, 335–341, https://doi.org/10.1080/01621459.1949.10483310, 1949.
Miller, M. B., Howard, D. A., Pierce, A. M., Cook, K. R., Keywood, M., Powell, J., Gustin, M. S., and Edwards, G. C.: Atmospheric reactive mercury concentrations in coastal Australia and the Southern Ocean, Sci. Total Environ., 751, 141681, https://doi.org/10.1016/j.scitotenv.2020.141681, 2021.
Munthe, J., Sprovieri, F., Horvat, M., and Ebinghaus, R.: SOPs and QA/QC protocols regarding measurements of TGM, GEM, RGM, TPM and mercury in precipitation in cooperation with WP3, WP4 and WP5, GMOS deliverable 6.1, CNR-IIA, IVL, http://www.gmos.eu (last access: 18 January 2023), 2011.
Nair, U. S., Wu, Y., Holmes, C. D., Ter Schure, A., Kallos, G., and Walters, J. T.: Cloud-resolving simulations of mercury scavenging and deposition in thunderstorms, Atmos. Chem. Phys., 13, 10143–10157, https://doi.org/10.5194/acp-13-10143-2013, 2013.
Nguyen, L. S. P., Sheu, G.-R., Lin, D.-W., and Lin, N.-H.: Temporal changes in atmospheric mercury concentrations at a background mountain site downwind of the East Asia continent in 2006–2016, Sci. Total Environ., 686, 1049–1056, https://doi.org/10.1016/j.scitotenv.2019.05.425, 2019.
Nguyen, L. S. P., Sheu, G.-R., Chang, S.-C., and Lin, N.-H.: Effects of temperature and relative humidity on the partitioning of atmospheric oxidized mercury at a high-altitude mountain background site in Taiwan, Atmos. Environ., 261, 118572, https://doi.org/10.1016/j.atmosenv.2021.118572, 2021.
Nguyen, L. S. P., Nguyen, K. T., Griffith, S. M., Sheu, G.-R., Yen, M.-C., Chang, S.-C., and Lin, N.-H.: Multiscale Temporal Variations of Atmospheric Mercury Distinguished by the Hilbert–Huang Transform Analysis Reveals Multiple El Niño–Southern Oscillation Links, Environ. Sci. Technol., 56, 1423–1432, https://doi.org/10.1021/acs.est.1c03819, 2022.
Obrist, D., Hallar, A. G., McCubbin, I., Stephens, B. B., and Rahn, T.: Atmospheric mercury concentrations at Storm Peak Laboratory in the Rocky Mountains: Evidence for long-range transport from Asia, boundary layer contributions, and plant mercury uptake, Atmos. Environ., 42, 7579–7589, https://doi.org/10.1016/j.atmosenv.2008.06.051, 2008.
Osterwalder, S., Bishop, K., Alewell, C., Fritsche, J., Laudon, H., Åkerblom, S., and Nilsson, M. B.: Mercury evasion from a boreal peatland shortens the timeline for recovery from legacy pollution, Sci. Rep., 7, 16022, https://doi.org/10.1038/s41598-017-16141-7, 2017.
Pacifico, F., Harrison, S. P., Jones, C. D., and Sitch, S.: Isoprene emissions and climate, Atmos. Environ., 43, 6121–6135, https://doi.org/10.1016/j.atmosenv.2009.09.002, 2009.
Panagos, P., Jiskra, M., Borrelli, P., Liakos, L., and Ballabio, C.: Mercury in European topsoils: Anthropogenic sources, stocks and fluxes, Environ. Res., 201, 111556, https://doi.org/10.1016/j.envres.2021.111556, 2021.
Pisso, I., Sollum, E., Grythe, H., Kristiansen, N. I., Cassiani, M., Eckhardt, S., Arnold, D., Morton, D., Thompson, R. L., Groot Zwaaftink, C. D., Evangeliou, N., Sodemann, H., Haimberger, L., Henne, S., Brunner, D., Burkhart, J. F., Fouilloux, A., Brioude, J., Philipp, A., Seibert, P., and Stohl, A.: The Lagrangian particle dispersion model FLEXPART version 10.4, Geosci. Model Dev., 12, 4955–4997, https://doi.org/10.5194/gmd-12-4955-2019, 2019.
Pohl, B., Morel, B., Barthe, C., and Bousquet, O.: Regionalizing Rainfall at Very High Resolution over La Réunion Island: A Case Study for Tropical Cyclone Ando, Mon. Weather Rev., 144, 4081–4099, https://doi.org/10.1175/MWR-D-15-0404.1, 2016.
QGIS Development Team: QGIS Geographic Information System, QGIS Association [software], https://www.qgis.org (last access: 18 January 2023), 2022.
R Core Team: R: A Language and Environment for Statistical Computing, R Foundation for Statistical Computing [software], Vienna, Austria, https://www.R-project.org/ (last access: 18 January 2023), 2019.
Reidmiller, D. R., Jaffe, D. A., Fischer, E. V., and Finley, B.: Nitrogen oxides in the boundary layer and free troposphere at the Mt. Bachelor Observatory, Atmos. Chem. Phys., 10, 6043–6062, https://doi.org/10.5194/acp-10-6043-2010, 2010.
Rocco, M., Colomb, A., Baray, J.-L., Amelynck, C., Verreyken, B., Borbon, A., Pichon, J.-M., Bouvier, L., Schoon, N., Gros, V., Sarda-Esteve, R., Tulet, P., Metzger, J.-M., Duflot, V., Guadagno, C., Peris, G., and Brioude, J.: Analysis of Volatile Organic Compounds during the OCTAVE Campaign: Sources and Distributions of Formaldehyde on Reunion Island, Atmosphere, 11, 140, https://doi.org/10.3390/atmos11020140, 2020.
Roelfsema, M. R. G. and Hedrich, R.: In the light of stomatal opening: new insights into “the Watergate”, New Phytol., 167, 665–691, https://doi.org/10.1111/j.1469-8137.2005.01460.x, 2005.
Rohatgi, A.: WebPlotDigitize, Version 4.5 [software], https://automeris.io/WebPlotDigitizer (last access: 18 January 2023), 2021.
Rose, C., Foucart, B., Picard, D., Colomb, A., Metzger, J.-M., Tulet, P., and Sellegri, K.: New particle formation in the volcanic eruption plume of the Piton de la Fournaise: specific features from a long-term dataset, Atmos. Chem. Phys., 19, 13243–13265, https://doi.org/10.5194/acp-19-13243-2019, 2019.
Schroeder, W. H. and Munthe, J.: Atmospheric mercury – An overview, Atmos. Environ., 32, 809–822, https://doi.org/10.1016/S1352-2310(97)00293-8, 1998.
Schroeder, W. H., Anlauf, K. G., Barrie, L. A., Lu, J. Y., Steffen, A., Schneeberger, D. R., and Berg, T.: Arctic springtime depletion of mercury, Nature, 394, 331–332, https://doi.org/10.1038/28530, 1998.
Seibert, P. and Frank, A.: Source-receptor matrix calculation with a Lagrangian particle dispersion model in backward mode, Atmos. Chem. Phys., 4, 51–63, https://doi.org/10.5194/acp-4-51-2004, 2004.
Seity, Y., Brousseau, P., Malardel, S., Hello, G., Bénard, P., Bouttier, F., Lac, C., and Masson, V.: The AROME-France Convective-Scale Operational Model, Mon. Weather Rev., 139, 976–991, https://doi.org/10.1175/2010MWR3425.1, 2011.
Selin, N. E., Jacob, D. J., Park, R. J., Yantosca, R. M., Strode, S., Jaeglé, L., and Jaffe, D.: Chemical cycling and deposition of atmospheric mercury: Global constraints from observations, J. Geophys. Res., 112, D02308, https://doi.org/10.1029/2006JD007450, 2007.
Shah, V., Jacob, D. J., Thackray, C. P., Wang, X., Sunderland, E. M., Dibble, T. S., Saiz-Lopez, A., Černušák, I., Kellö, V., Castro, P. J., Wu, R., and Wang, C.: Improved Mechanistic Model of the Atmospheric Redox Chemistry of Mercury, Environ. Sci. Technol., 55, 14445–14456, https://doi.org/10.1021/acs.est.1c03160, 2021.
Sheu, G.-R., Lin, N.-H., Wang, J.-L., Lee, C.-T., Ou Yang, C.-F., and Wang, S.-H.: Temporal distribution and potential sources of atmospheric mercury measured at a high-elevation background station in Taiwan, Atmos. Environ., 44, 2393–2400, https://doi.org/10.1016/j.atmosenv.2010.04.009, 2010.
Slemr, F., Angot, H., Dommergue, A., Magand, O., Barret, M., Weigelt, A., Ebinghaus, R., Brunke, E.-G., Pfaffhuber, K. A., Edwards, G., Howard, D., Powell, J., Keywood, M., and Wang, F.: Comparison of mercury concentrations measured at several sites in the Southern Hemisphere, Atmos. Chem. Phys., 15, 3125–3133, https://doi.org/10.5194/acp-15-3125-2015, 2015.
Slemr, F., Martin, L., Labuschagne, C., Mkololo, T., Angot, H., Magand, O., Dommergue, A., Garat, P., Ramonet, M., and Bieser, J.: Atmospheric mercury in the Southern Hemisphere – Part 1: Trend and inter-annual variations in atmospheric mercury at Cape Point, South Africa, in 2007–2017, and on Amsterdam Island in 2012–2017, Atmos. Chem. Phys., 20, 7683–7692, https://doi.org/10.5194/acp-20-7683-2020, 2020.
Song, S., Angot, H., Selin, N. E., Gallée, H., Sprovieri, F., Pirrone, N., Helmig, D., Savarino, J., Magand, O., and Dommergue, A.: Understanding mercury oxidation and air–snow exchange on the East Antarctic Plateau: a modeling study, Atmos. Chem. Phys., 18, 15825–15840, https://doi.org/10.5194/acp-18-15825-2018, 2018.
Sprovieri, F., Pirrone, N., Bencardino, M., D&apos;Amore, F., Carbone, F., Cinnirella, S., Mannarino, V., Landis, M., Ebinghaus, R., Weigelt, A., Brunke, E.-G., Labuschagne, C., Martin, L., Munthe, J., Wängberg, I., Artaxo, P., Morais, F., Barbosa, H. de M. J., Brito, J., Cairns, W., Barbante, C., Diéguez, M. del C., Garcia, P. E., Dommergue, A., Angot, H., Magand, O., Skov, H., Horvat, M., Kotnik, J., Read, K. A., Neves, L. M., Gawlik, B. M., Sena, F., Mashyanov, N., Obolkin, V., Wip, D., Feng, X. B., Zhang, H., Fu, X., Ramachandran, R., Cossa, D., Knoery, J., Marusczak, N., Nerentorp, M., and Norstrom, C.: Atmospheric mercury concentrations observed at ground-based monitoring sites globally distributed in the framework of the GMOS network, Atmos. Chem. Phys., 16, 11915–11935, https://doi.org/10.5194/acp-16-11915-2016, 2016.
Stefels, J., Steinke, M., Turner, S., Malin, G., and Belviso, S.: Environmental constraints on the production and removal of the climatically active gas dimethylsulphide (DMS) and implications for ecosystem modelling, Biogeochemistry, 83, 245–275, https://doi.org/10.1007/s10533-007-9091-5, 2007.
Stieltjes, L. and Moutou, P.: A statistical and probabilistic study of the historic activity of Piton de la Fournaise, Reunion Island, Indian Ocean, J. Volcanol. Geoth. Res., 36, 67–86, https://doi.org/10.1016/0377-0273(89)90006-1, 1989.
Stohl, A., Forster, C., Frank, A., Seibert, P., and Wotawa, G.: Technical note: The Lagrangian particle dispersion model FLEXPART version 6.2, Atmos. Chem. Phys., 5, 2461–2474, https://doi.org/10.5194/acp-5-2461-2005, 2005.
Sun, S., Ma, M., He, X., Obrist, D., Zhang, Q., Yin, X., Sun, T., Huang, J., Guo, J., Kang, S., and Qin, D.: Vegetation Mediated Mercury Flux and Atmospheric Mercury in the Alpine Permafrost Region of the Central Tibetan Plateau, Environ. Sci. Technol., 54, 6043–6052, https://doi.org/10.1021/acs.est.9b06636, 2020.
Swartzendruber, P. C., Jaffe, D. A., Prestbo, E. M., Weiss-Penzias, P., Selin, N. E., Park, R., Jacob, D. J., Strode, S., and Jaeglé, L.: Observations of reactive gaseous mercury in the free troposphere at the Mount Bachelor Observatory, J. Geophys. Res., 111, D24301, https://doi.org/10.1029/2006JD007415, 2006.
Swinehart, D. F.: The Beer-Lambert Law, J. Chem. Educ., 39, 333, https://doi.org/10.1021/ed039p333, 1962.
Travnikov, O.: Atmospheric Transport of Mercury, in: Environmental Chemistry and Toxicology of Mercury: Liu/Toxicology of Mercury, edited by: Liu, G., Cai, Y., and O'Driscoll, N., John Wiley & Sons, Inc., Hoboken, NJ, USA, https://doi.org/10.1002/9781118146644, 2011.
Tulet, P., Di Muro, A., Colomb, A., Denjean, C., Duflot, V., Arellano, S., Foucart, B., Brioude, J., Sellegri, K., Peltier, A., Aiuppa, A., Barthe, C., Bhugwant, C., Bielli, S., Boissier, P., Boudoire, G., Bourrianne, T., Brunet, C., Burnet, F., Cammas, J.-P., Gabarrot, F., Galle, B., Giudice, G., Guadagno, C., Jeamblu, F., Kowalski, P., Leclair de Bellevue, J., Marquestaut, N., Mékies, D., Metzger, J.-M., Pianezze, J., Portafaix, T., Sciare, J., Tournigand, A., and Villeneuve, N.: First results of the Piton de la Fournaise STRAP 2015 experiment: multidisciplinary tracking of a volcanic gas and aerosol plume, Atmos. Chem. Phys., 17, 5355–5378, https://doi.org/10.5194/acp-17-5355-2017, 2017.
Tulet, P., Aunay, B., Barruol, G., Barthe, C., Belon, R., Bielli, S., Bonnardot, F., Bousquet, O., Cammas, J.-P., Cattiaux, J., Chauvin, F., Fontaine, I., Fontaine, F. R., Gabarrot, F., Garabedian, S., Gonzalez, A., Join, J.-L., Jouvenot, F., Nortes-Martinez, D., Mékiès, D., Mouquet, P., Payen, G., Pennober, G., Pianezze, J., Rault, C., Revillion, C., Rindraharisaona, E. J., Samyn, K., Thompson, C., and Vérèmes, H.: ReNovRisk: a multidisciplinary programme to study the cyclonic risks in the South-West Indian Ocean, Nat. Hazards, 107, 1191–1223, https://doi.org/10.1007/s11069-021-04624-w, 2021.
Verreyken, B., Brioude, J., and Evan, S.: Development of turbulent scheme in the FLEXPART-AROME v1.2.1 Lagrangian particle dispersion model, Geosci. Model Dev., 12, 4245–4259, https://doi.org/10.5194/gmd-12-4245-2019, 2019.
Verreyken, B., Amelynck, C., Brioude, J., Müller, J.-F., Schoon, N., Kumps, N., Colomb, A., Metzger, J.-M., Lee, C. F., Koenig, T. K., Volkamer, R., and Stavrakou, T.: Characterisation of African biomass burning plumes and impacts on the atmospheric composition over the south-west Indian Ocean, Atmos. Chem. Phys., 20, 14821–14845, https://doi.org/10.5194/acp-20-14821-2020, 2020.
Verreyken, B., Amelynck, C., Schoon, N., Müller, J.-F., Brioude, J., Kumps, N., Hermans, C., Metzger, J.-M., Colomb, A., and Stavrakou, T.: Measurement report: Source apportionment of volatile organic compounds at the remote high-altitude Maïdo observatory, Atmos. Chem. Phys., 21, 12965–12988, https://doi.org/10.5194/acp-21-12965-2021, 2021.
Villeneuve, N. and Bachèlery, P.: Revue de la typologie des éruptions au Piton de La Fournaise, processus et risques volcaniques associés, cybergeo, Europ. J. Geogr., https://doi.org/10.4000/cybergeo.2536, 2006.
Wang, Y., Anderegg, W. R. L., Venturas, M. D., Trugman, A. T., Yu, K., and Frankenberg, C.: Optimization theory explains nighttime stomatal responses, New Phytol., 230, 1550–1561, https://doi.org/10.1111/nph.17267, 2021.
Weisspenzias, P., Jaffe, D., Swartzendruber, P., Hafner, W., Chand, D., and Prestbo, E.: Quantifying Asian and biomass burning sources of mercury using the Hg CO ratio in pollution plumes observed at the Mount Bachelor observatory, Atmos. Environ., 41, 4366–4379, https://doi.org/10.1016/j.atmosenv.2007.01.058, 2007.
Wickham, H.: ggplot2: Elegant Graphics for Data Analysis, 2nd Edn., Springer International Publishing, Imprint, Springer, Cham, https://doi.org/10.1007/978-3-319-24277-4, 2016.
Wickham, H., Averick, M., Bryan, J., Chang, W., McGowan, L., François, R., Grolemund, G., Hayes, A., Henry, L., Hester, J., Kuhn, M., Pedersen, T., Miller, E., Bache, S., Müller, K., Ooms, J., Robinson, D., Seidel, D., Spinu, V., Takahashi, K., Vaughan, D., Wilke, C., Woo, K., and Yutani, H.: Welcome to the Tidyverse, J. Open Source Softw., 4, 1686, https://doi.org/10.21105/joss.01686, 2019.
Yu, Q., Luo, Y., Wang, S., Wang, Z., Hao, J., and Duan, L.: Gaseous elemental mercury (GEM) fluxes over canopy of two typical subtropical forests in south China, Atmos. Chem. Phys., 18, 495–509, https://doi.org/10.5194/acp-18-495-2018, 2018.
Yu, Q., Luo, Y., Xu, G., Wu, Q., Wang, S., Hao, J., and Duan, L.: Subtropical Forests Act as Mercury Sinks but as Net Sources of Gaseous Elemental Mercury in South China, Environ. Sci. Technol., 54, 2772–2779, https://doi.org/10.1021/acs.est.9b06715, 2020.
Yuan, W., Sommar, J., Lin, C.-J., Wang, X., Li, K., Liu, Y., Zhang, H., Lu, Z., Wu, C., and Feng, X.: Stable Isotope Evidence Shows Re-emission of Elemental Mercury Vapor Occurring after Reductive Loss from Foliage, Environ. Sci. Technol., 53, 651–660, https://doi.org/10.1021/acs.est.8b04865, 2019.
Yver-Kwok, C., Philippon, C., Bergamaschi, P., Biermann, T., Calzolari, F., Chen, H., Conil, S., Cristofanelli, P., Delmotte, M., Hatakka, J., Heliasz, M., Hermansen, O., Komínková, K., Kubistin, D., Kumps, N., Laurent, O., Laurila, T., Lehner, I., Levula, J., Lindauer, M., Lopez, M., Mammarella, I., Manca, G., Marklund, P., Metzger, J.-M., Mölder, M., Platt, S. M., Ramonet, M., Rivier, L., Scheeren, B., Sha, M. K., Smith, P., Steinbacher, M., Vítková, G., and Wyss, S.: Evaluation and optimization of ICOS atmosphere station data as part of the labeling process, Atmos. Meas. Tech., 14, 89–116, https://doi.org/10.5194/amt-14-89-2021, 2021.
Zhang, P. and Zhang, Y.: Earth system modeling of mercury using CESM2 – Part 1: Atmospheric model CAM6-Chem/Hg v1.0, Geosci. Model Dev., 15, 3587–3601, https://doi.org/10.5194/gmd-15-3587-2022, 2022.
Zhou, J. and Obrist, D.: Global Mercury Assimilation by Vegetation, Environ. Sci. Technol., 55, 14245–14257, https://doi.org/10.1021/acs.est.1c03530, 2021.
Zhou, M., Langerock, B., Vigouroux, C., Sha, M. K., Ramonet, M., Delmotte, M., Mahieu, E., Bader, W., Hermans, C., Kumps, N., Metzger, J.-M., Duflot, V., Wang, Z., Palm, M., and De Mazière, M.: Atmospheric CO and CH4 time series and seasonal variations on Reunion Island from ground-based in situ and FTIR (NDACC and TCCON) measurements, Atmos. Chem. Phys., 18, 13881–13901, https://doi.org/10.5194/acp-18-13881-2018, 2018.