the Creative Commons Attribution 4.0 License.
the Creative Commons Attribution 4.0 License.
 | 11 Sep 2023
Surface ozone over the Tibetan Plateau controlled by stratospheric intrusion
Xiufeng Yin
Dipesh Rupakheti
Guoshuai Zhang
Jiali Luo
Shichang Kang
Benjamin de Foy
Junhua Yang
Zhenming Ji
Zhiyuan Cong
Maheswar Rupakheti
Ping Li
Yuling Hu
Qianggong Zhang
The Tibetan Plateau is a global hotspot of stratospheric intrusion, and elevated surface ozone was observed at ground monitoring sites. Still, links between the variability of surface ozone and stratospheric intrusion at the regional scale remain unclear. This study synthesized ground measurements of surface ozone over the Tibetan Plateau and analyzed their seasonal variations. The monthly mean surface ozone concentrations over the Tibetan Plateau peaked earlier in the south in April and May and later in the north in June and July. The migration of monthly surface ozone peaks was coupled with the synchronous movement of tropopause folds and the westerly jet that created conditions conducive to stratospheric ozone intrusion. Stratospheric ozone intrusion significantly contributed to surface ozone across the Tibetan Plateau, especially in the areas with high surface ozone concentrations during their peak-value month. We demonstrated that monthly variation of surface ozone over the Tibetan Plateau is mainly controlled by stratospheric intrusion, which warrants proper consideration in understanding the atmospheric chemistry and the impacts of ozone over this highland region and beyond.
- Article
(6428 KB) - Full-text XML
-
Supplement
(2201 KB) - BibTeX
- EndNote


Tropospheric surface ozone (O3) has attracted great attention during the last decades due to its impact on the oxidative capacity of the troposphere and on the radiative forcing of the atmosphere and its detrimental effects on vegetation, the ecosystem, and human health (Lu et al., 2018). Tropospheric (surface) ozone is controlled by in situ photochemical production in the troposphere and by the intrusion of ozone-laden stratospheric air (Kumar et al., 2016; Yang et al., 2022). In contrast with other air pollutants, tropospheric ozone is significantly influenced by stratospheric intrusion, especially at high elevation (Bracci et al., 2012; Cristofanelli et al., 2010; Yin et al., 2017).
The Tibetan Plateau is a vast plateau with an average elevation of ca. 4500 m above sea level, making it the highest plateau in the world. It is thus often referred to as “the roof of the world” or “the Third Pole” (Yao et al., 2012). With limited human accessibility and low levels of industrialization, the Tibetan Plateau is one of the most pristine regions in the world in terms of most air pollutants (Yin et al., 2017) and is regarded as an ideal area for studying the atmospheric environment in the free troposphere. It can provide deeper insights into changing background concentrations of atmospheric pollutants (Kang et al., 2019). The Tibetan Plateau is recognized as a global hotspot of deep stratospheric intrusion, and elevated surface ozone has been observed at some ground monitoring sites. Very high concentrations of surface O3 were reported (Cristofanelli et al., 2010; Yin et al., 2017; Zhu et al., 2004). At these sites, it was reported that vertical ozone flux from vertical transport by convective and synoptic transport was prominent in the summer at Waliguan, leading to high ozone levels (Ma et al., 2002, 2005). Studies at Shangri-La and Nam Co in the Tibetan Plateau indicated that the input of ozone from the stratosphere had potential impacts on the seasonal variations of surface ozone at each site (Yin et al., 2017; Ma et al., 2014). Still, the link between the variability of surface ozone and stratospheric intrusion at the regional scale remains unclear. In this study, (1) ground observations of surface ozone at the sites over the Tibetan Plateau were used to reveal the difference of surface ozone variation over the Tibetan Plateau from the south to the north. (2) The Weather Research and Forecasting model coupled with Chemistry (WRF-Chem) and the Community Atmosphere Model with Chemistry (CAM-chem) simulations were used to identify the impacts of long-range transport and in situ photochemical production on surface ozone over the Tibetan Plateau. (3) The distribution of tropopause fold frequencies (calculated by ERA-5 data), the position of the westerly jet (U component of winds), and the CAM-chem simulation were used to investigate the impact of stratospheric intrusion on surface ozone variation.
2.1 Surface measurements
This study synthesized ground measurements of surface ozone by analyzing the ground observation data collected at 13 sites (Shannan, Shigatse, Nyingchi, Lhasa, Changdu, Nagqu, Guoluozhou, Huangnanzhou, Hainanzhou, Haidongzhou, Xining, Haibeizhou, and Haixizhou), ranging from the southern to the central and northeastern Tibetan Plateau (Fig. 1 and Table S1 in the Supplement). Surface ozone concentrations during January 2016 to December 2021 at 13 sites were provided by the China National Environmental Monitoring Center (http://106.37.208.233:20035/, last access: 2 May 2022). Surface ozone was measured with the UV spectrophotometry method. The specifications and test procedures of ozone followed the Specifications and Test Procedures for Ambient Air Quality Continuous Automated Monitoring System for ozone (National Environmental Protection Standards of the People's Republic of China, HJ 654-2013). The inlet of the instrument was 3–20 m above the ground surface, 1 m higher than the roof of the building or the wall. The observation stations were located at least 50 m from any obvious stationary pollution sources. The data quality assurance and controls followed technical guidelines on environmental monitoring quality management (National Environmental Protection Standards of the People's Republic of China, HJ 630-2011), and the data were checked for validity based on ambient air quality standards (National Standards of the People's Republic of China, GB 3095-2012).
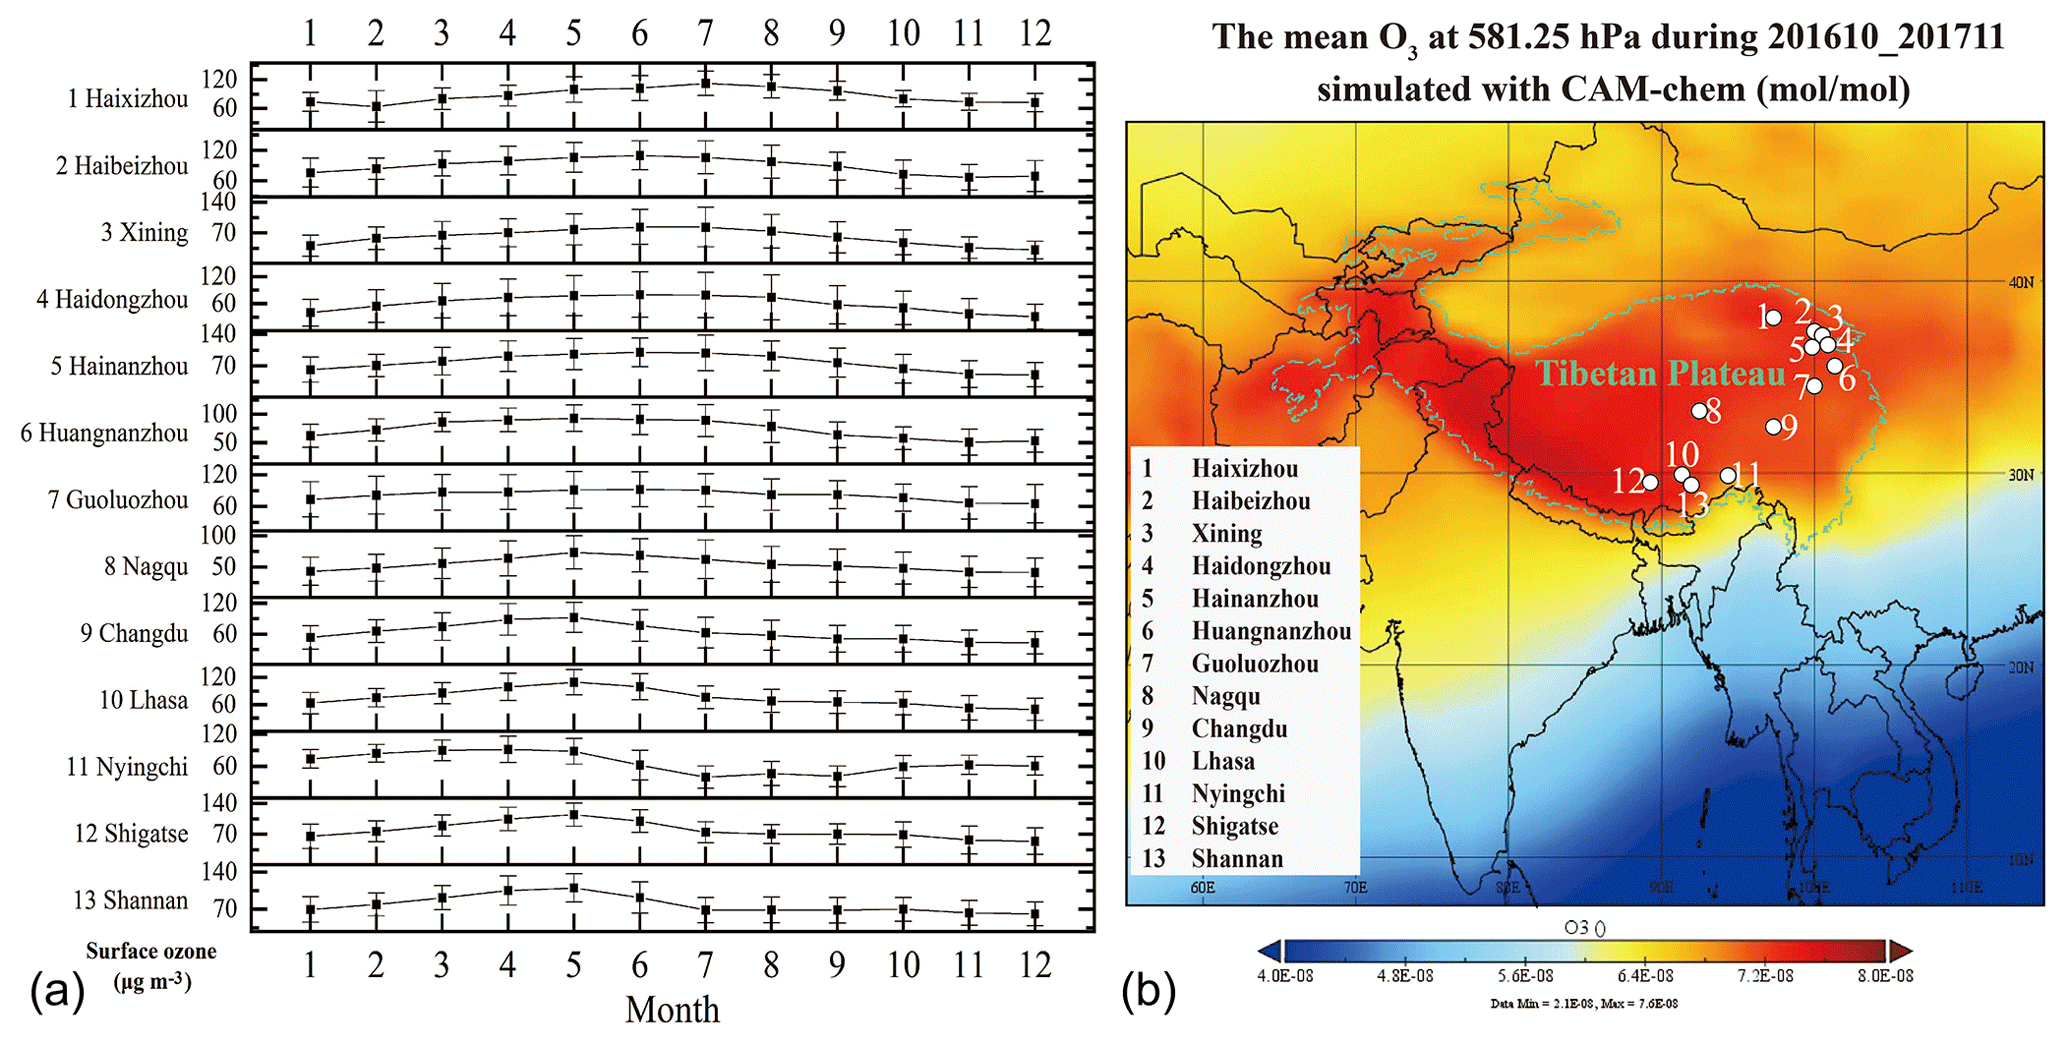
Figure 1(a) Study sites and their monthly mean surface ozone variations during January 2016 to December 2021 across the Tibetan Plateau used in this study. (b) Map of yearly mean concentration of surface ozone during January 2016 to December 2021 at 581.25 hPa simulated with CAM-chem is shown with colored shadings.
2.2 Reanalysis data
The ECMWF (European Centre for Medium-Range Weather Forecasts) ERA-5 data (0.28125∘ latitude × 0.28125∘ longitude horizontal resolution and 137 vertical levels) (Hoffmann et al., 2019) were used to analyze the monthly mean meridional cross-section structures of the troposphere and stratosphere over the Tibetan Plateau. The monthly mean total tropopause fold frequency was investigated in this study, and tropopause folds were defined by a 2 pvu (potential vorticity unit) isosurface and identified by the method described in Luo et al. (2019). Tropopause folds were defined as multiple crossings of the dynamical tropopause in a vertical profile.
2.3 Model simulation
The Community Atmosphere Model with Chemistry (CAM-chem), a global model, was used for simulations of global tropospheric and stratospheric atmospheric composition (Lamarque et al., 2012), provided by the University Corporation for Atmospheric Research (https://www.acom.ucar.edu/cam-chem/cam-chem.shtml, last access: 2 May 2022). The horizontal resolution for CAM-chem is 0.5∘ × 0.5∘. CAM-chem uses the MOZART (Model for OZone And Related chemical Tracers) chemical mechanisms (Lamarque et al., 2012), with various choices of complexity for tropospheric and stratospheric chemistry. The O3s variable, a stratospheric ozone tracer that represents the amount of ozone in the troposphere originated in the stratosphere, in the CAM-chem simulation was used in this study to indicate the intensity of the ozone transported from the stratosphere (Tilmes et al., 2016). The ratio was calculated to investigate the intensity of impacts of the stratospheric intrusion on ozone concentration in the troposphere.
Table 1The influence ratios of long-range transport (WRF-Chem set 1) and in situ photochemical production (WRF-Chem set 2) on surface ozone over the Tibetan Plateau.
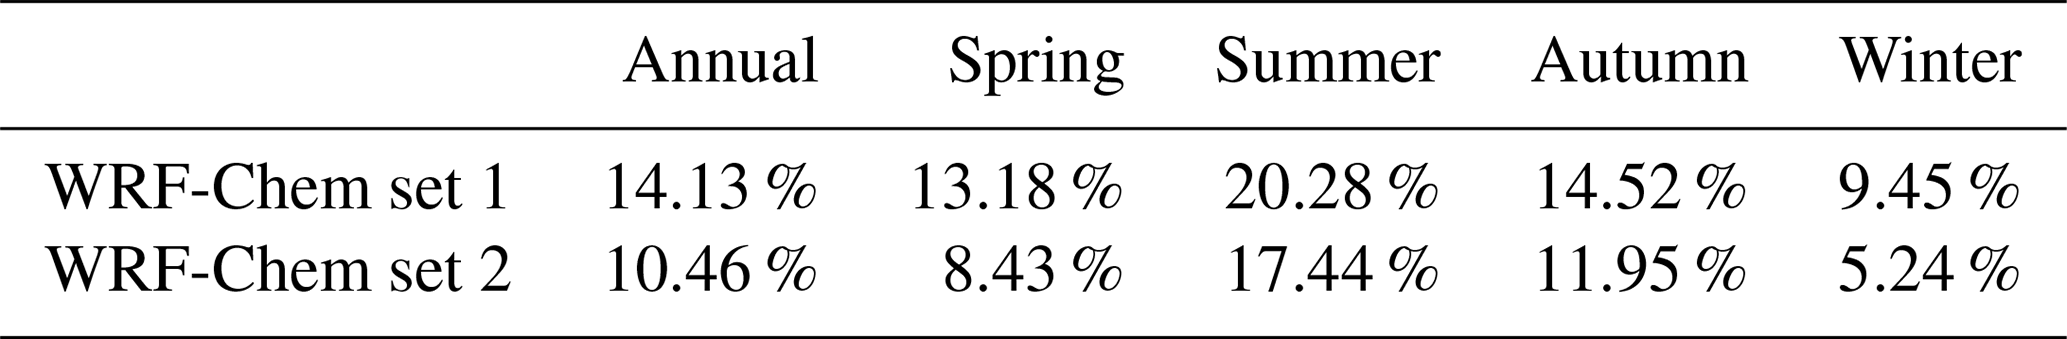
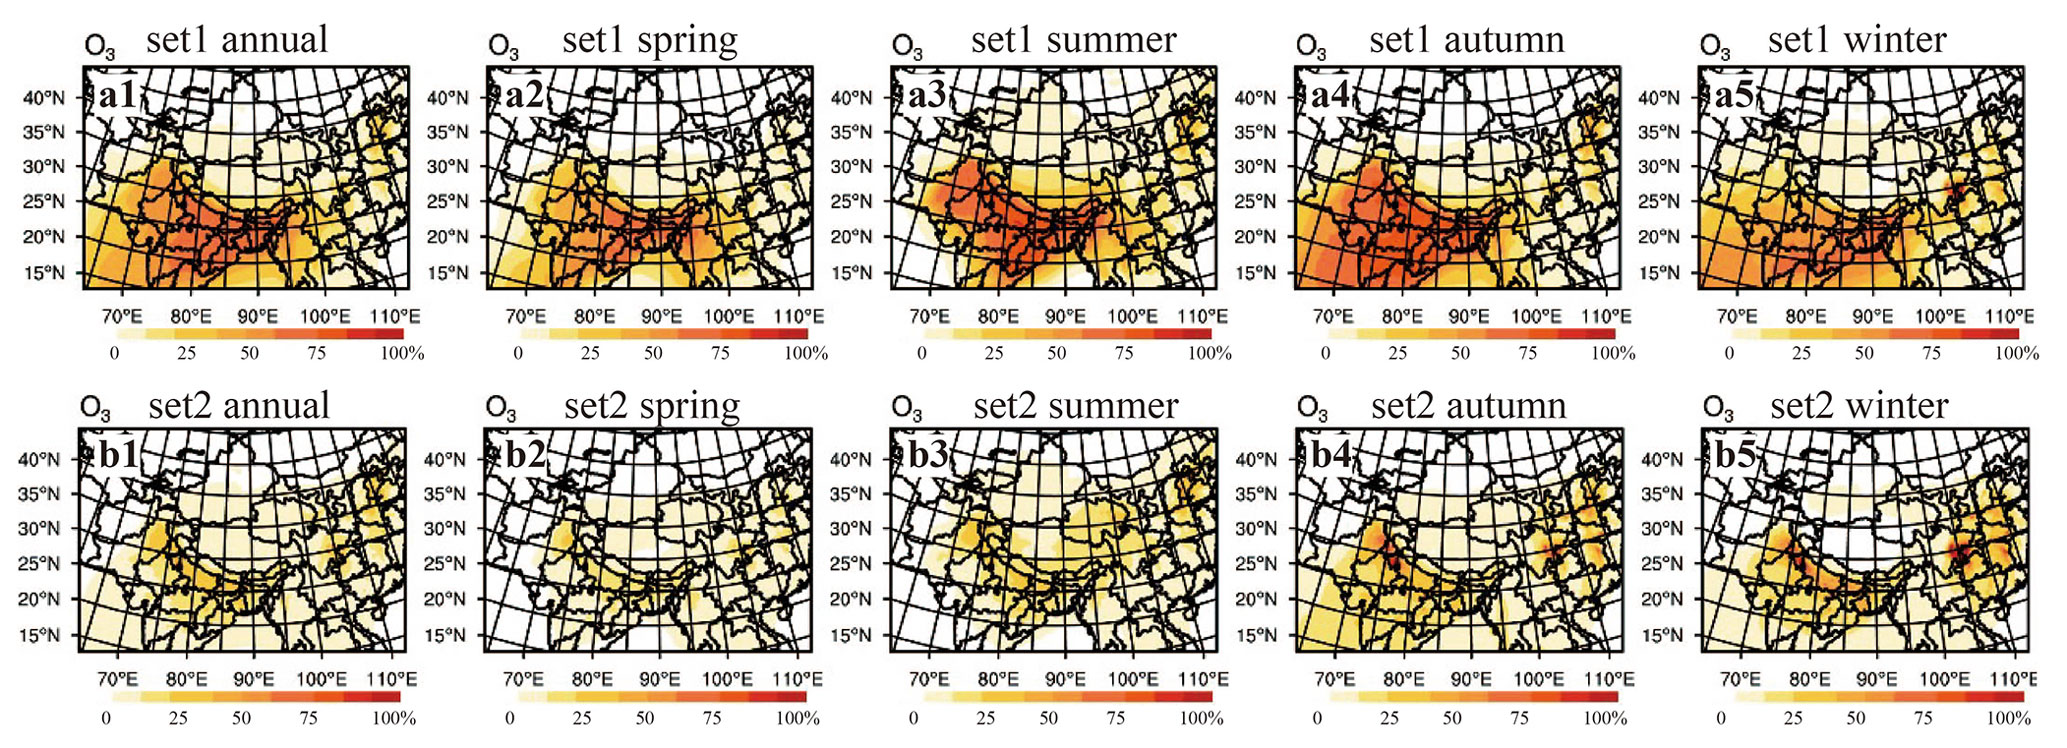
Figure 2The influence ratios of long-range transport (WRF-Chem set 1) and in situ photochemical production (WRF-Chem set 2) on surface ozone over the Tibetan Plateau.
The Weather Research and Forecasting model coupled with Chemistry (WRF-Chem) was conducted by the set adopted in Yang et al. (2022) to investigate the long-range transport from South Asia and local photochemical generation of ozone over the Tibetan Plateau. The model domain has 25 km grid spacing and covers South Asia and the Tibetan Plateau, with 155 and 135 grid cells in the west–east and north–south directions, respectively. The vertical configuration of the model includes 35 vertical sigma layers at the top pressure of 50 hPa. National Centers for Environmental Prediction Final (NCEP FNL) analysis data with a horizontal resolution of 1∘ × 1∘ at 6 h time intervals are used for the meteorological initial and boundary conditions. Both CAM-chem and WRF-Chem simulations were conducted for an entire year, from 1 November 2016 to 30 November 2017. The first month was considered the model spin-up time and was not analyzed. In WRF-Chem simulation, experiments were conducted with two sets, set 1 (CO and NO2 in South Asia were set to 0 to investigate the influence of long-range transport from South Asia) and set 2 (CO and NO2 in the Tibetan Plateau were set to 0 to investigate the influence of local photochemical generation of ozone over the Tibetan Plateau).
3.1 Surface ozone variations over the Tibetan Plateau
The mean surface ozone concentrations during 2016–2021 at 13 sites over the Tibetan Plateau peaked in different months and moved gradually from April and May in the south to June and July in the north (Fig. 1). A similar result was obtained in the month-to-month variation of mean ozone concentrations at 13 sites (Fig. S1). It is noteworthy that such regular migration of monthly ozone peaks occurred at large geographical scale, and surface ozone concentrations peaked synchronously at sites in the same zone despite the differences in size of cities and baseline levels of surface ozone. Previous studies also found that the sites in adjacent areas showed similar monthly variation of surface ozone (Ma et al., 2014; Lin et al., 2015; Ran et al., 2014; Cristofanelli et al., 2010; Zhu et al., 2004; Yin et al., 2017). The occurrence of the highest monthly concentrations of surface ozone is different in different areas over the Tibetan Plateau, ranging from April to July.
3.2 Long-range transport and photochemical production do not likely dominate surface ozone
We compared the simulated surface temperature (T2), relative humidity (RH2), wind at 10 m (wind10), and wind at 500 hPa, with surface observations provided by China Meteorological Data Service Centre (http://data.cma.cn/, last access: 2 May 2022) and ERA interim reanalysis datasets provided by ECMWF (https://apps.ecmwf.int/datasets/, last access: 2 May 2022). It was found that simulation configuration captured the meteorological fields well, which is crucial to assure prediction accuracy of air pollutant concentrations (Figs. S2–S5). In addition, surface ozone concentrations from ground observations, WRF-Chem, and CAM-chem were compared and showed a good fit (Fig. S6).
Generally, elevated tropospheric ozone budgets at ground sites result from three processes: in situ photochemical production, long-range transport, and influx of ozone from the stratosphere. South Asia is one of the biggest sources of air mass that arrives at the Tibetan Plateau by long-range transport (Yin et al., 2021), and the concentrations of air pollution, including the precursors of surface ozone (e.g., CO and volatile organic compounds, VOCs), in South Asia were high (Kumar et al., 2018). Indicated by the results in WRF-Chem simulation set 1 (Fig. 2a), long-range transport from South Asia contributed to the surface ozone in the Tibetan Plateau from 9.45 % to 20.28 % in each season, with an annual average of 14.13 % (Table 1), showing a limited impact.
The local photochemical production of ozone is generated through a chain of photochemical oxidation of CO and VOCs. The monthly variation in surface ozone at three different types of sites in the central Tibetan Plateau (Lhasa, urban site; Dangxiong, rural site; Nam Co, remote site) with varying conditions of ozone precursors was similar (Yin et al., 2017), implying the limited impact of the local photochemical production of ozone on the monthly variation of surface ozone at these sites. Indicated by results in WRF-Chem simulation set 2 (Fig. 2b), the local photochemical generation of ozone over the Tibetan Plateau contributed to the surface ozone in the Tibetan Plateau from 5.24 % to 17.44 % in each season, with an annual average of 10.46 % (Table 1). Furthermore, the net ozone photochemical production was found to be negative in the summer when surface ozone reached a maximum in the northeastern Tibetan Plateau (Zhu et al., 2004; Ma et al., 2002). Therefore, the monthly mean surface ozone peaks in the Tibetan Plateau were not mainly attributed to the local photochemical production of ozone.
Even in the summer, when the contributions from these two factors are high, the total contribution of both long-range transport from South Asia and local photochemical generation of ozone over the Tibetan Plateau to the variation of surface ozone on the Tibetan Plateau was less than 38 % (total contribution of 37.72 %). Based on the above results, we can infer that the variation of surface ozone over the Tibetan Plateau is dominated by factors other than long-range transport and in situ photochemical production.
3.3 Evidence from reanalysis data and simulations for stratospheric intrusion
Rather than long-range transport and photochemical production, the stratospheric influx of ozone is likely a main contributor to the surface ozone over the Tibetan Plateau. The impact of stratospheric intrusion on surface ozone can be supported by the monthly averages of the total tropopause fold frequencies (tropopause folds were indicated by a 2 pvu isosurface in Luo et al., 2019) over the Tibetan Plateau (Fig. 3). It was found that the displacement of the tropopause fold in the Tibetan Plateau was controlled by the movement of the westerly jet (Luo et al., 2019). The monthly mean westerly jet (indicated by the maximum speed of the U component of winds), the tropopause fold frequencies, and the transport of ozone from the stratosphere to the troposphere was calculated and visualized from April to July 2017 (Fig. 3).
In April, the westerly jet was mainly above the region within 25–40∘ N (Fig. 3). The highest total tropopause fold frequencies were mainly distributed in the ca. 25–35∘ N latitude band, covering parts of South Asia and the southern and the central Tibetan Plateau (Fig. 3). The greatest hotspot of stratospheric ozone intrusion to the troposphere was at ∼ 29∘ N (Fig. 3), similar to the area with high ozone concentration in April (Fig. 4). In May, the westerly jet moved northward, centered at ∼ 35∘ N. The stratospheric ozone intrusion to the troposphere was strong at ∼ 37.5 and ∼ 30∘ N, similar to the areas with high total tropopause fold frequencies (Fig. 3), contributing to high ozone concentrations in these areas (Fig. 3). In June, the westerly jet moved northward, and the hotspot of stratospheric ozone intrusion to the troposphere was at ∼ 38 and ∼ 32∘ N (Fig. 3); these two areas had high ozone concentrations (Fig. 4). In July, the westerly jet moved even further northward, and only the northeastern Tibetan Plateau was under the significant impact of stratospheric ozone intrusion within 31.7–40∘ N (Fig. 3), inducing high ozone concentration in the northeastern Tibetan Plateau (Fig. 4). Consistent with the monthly spatial distribution of the westerly jet and tropopause fold occurrence, stratospheric ozone intrusion showed a northward movement from April to July.
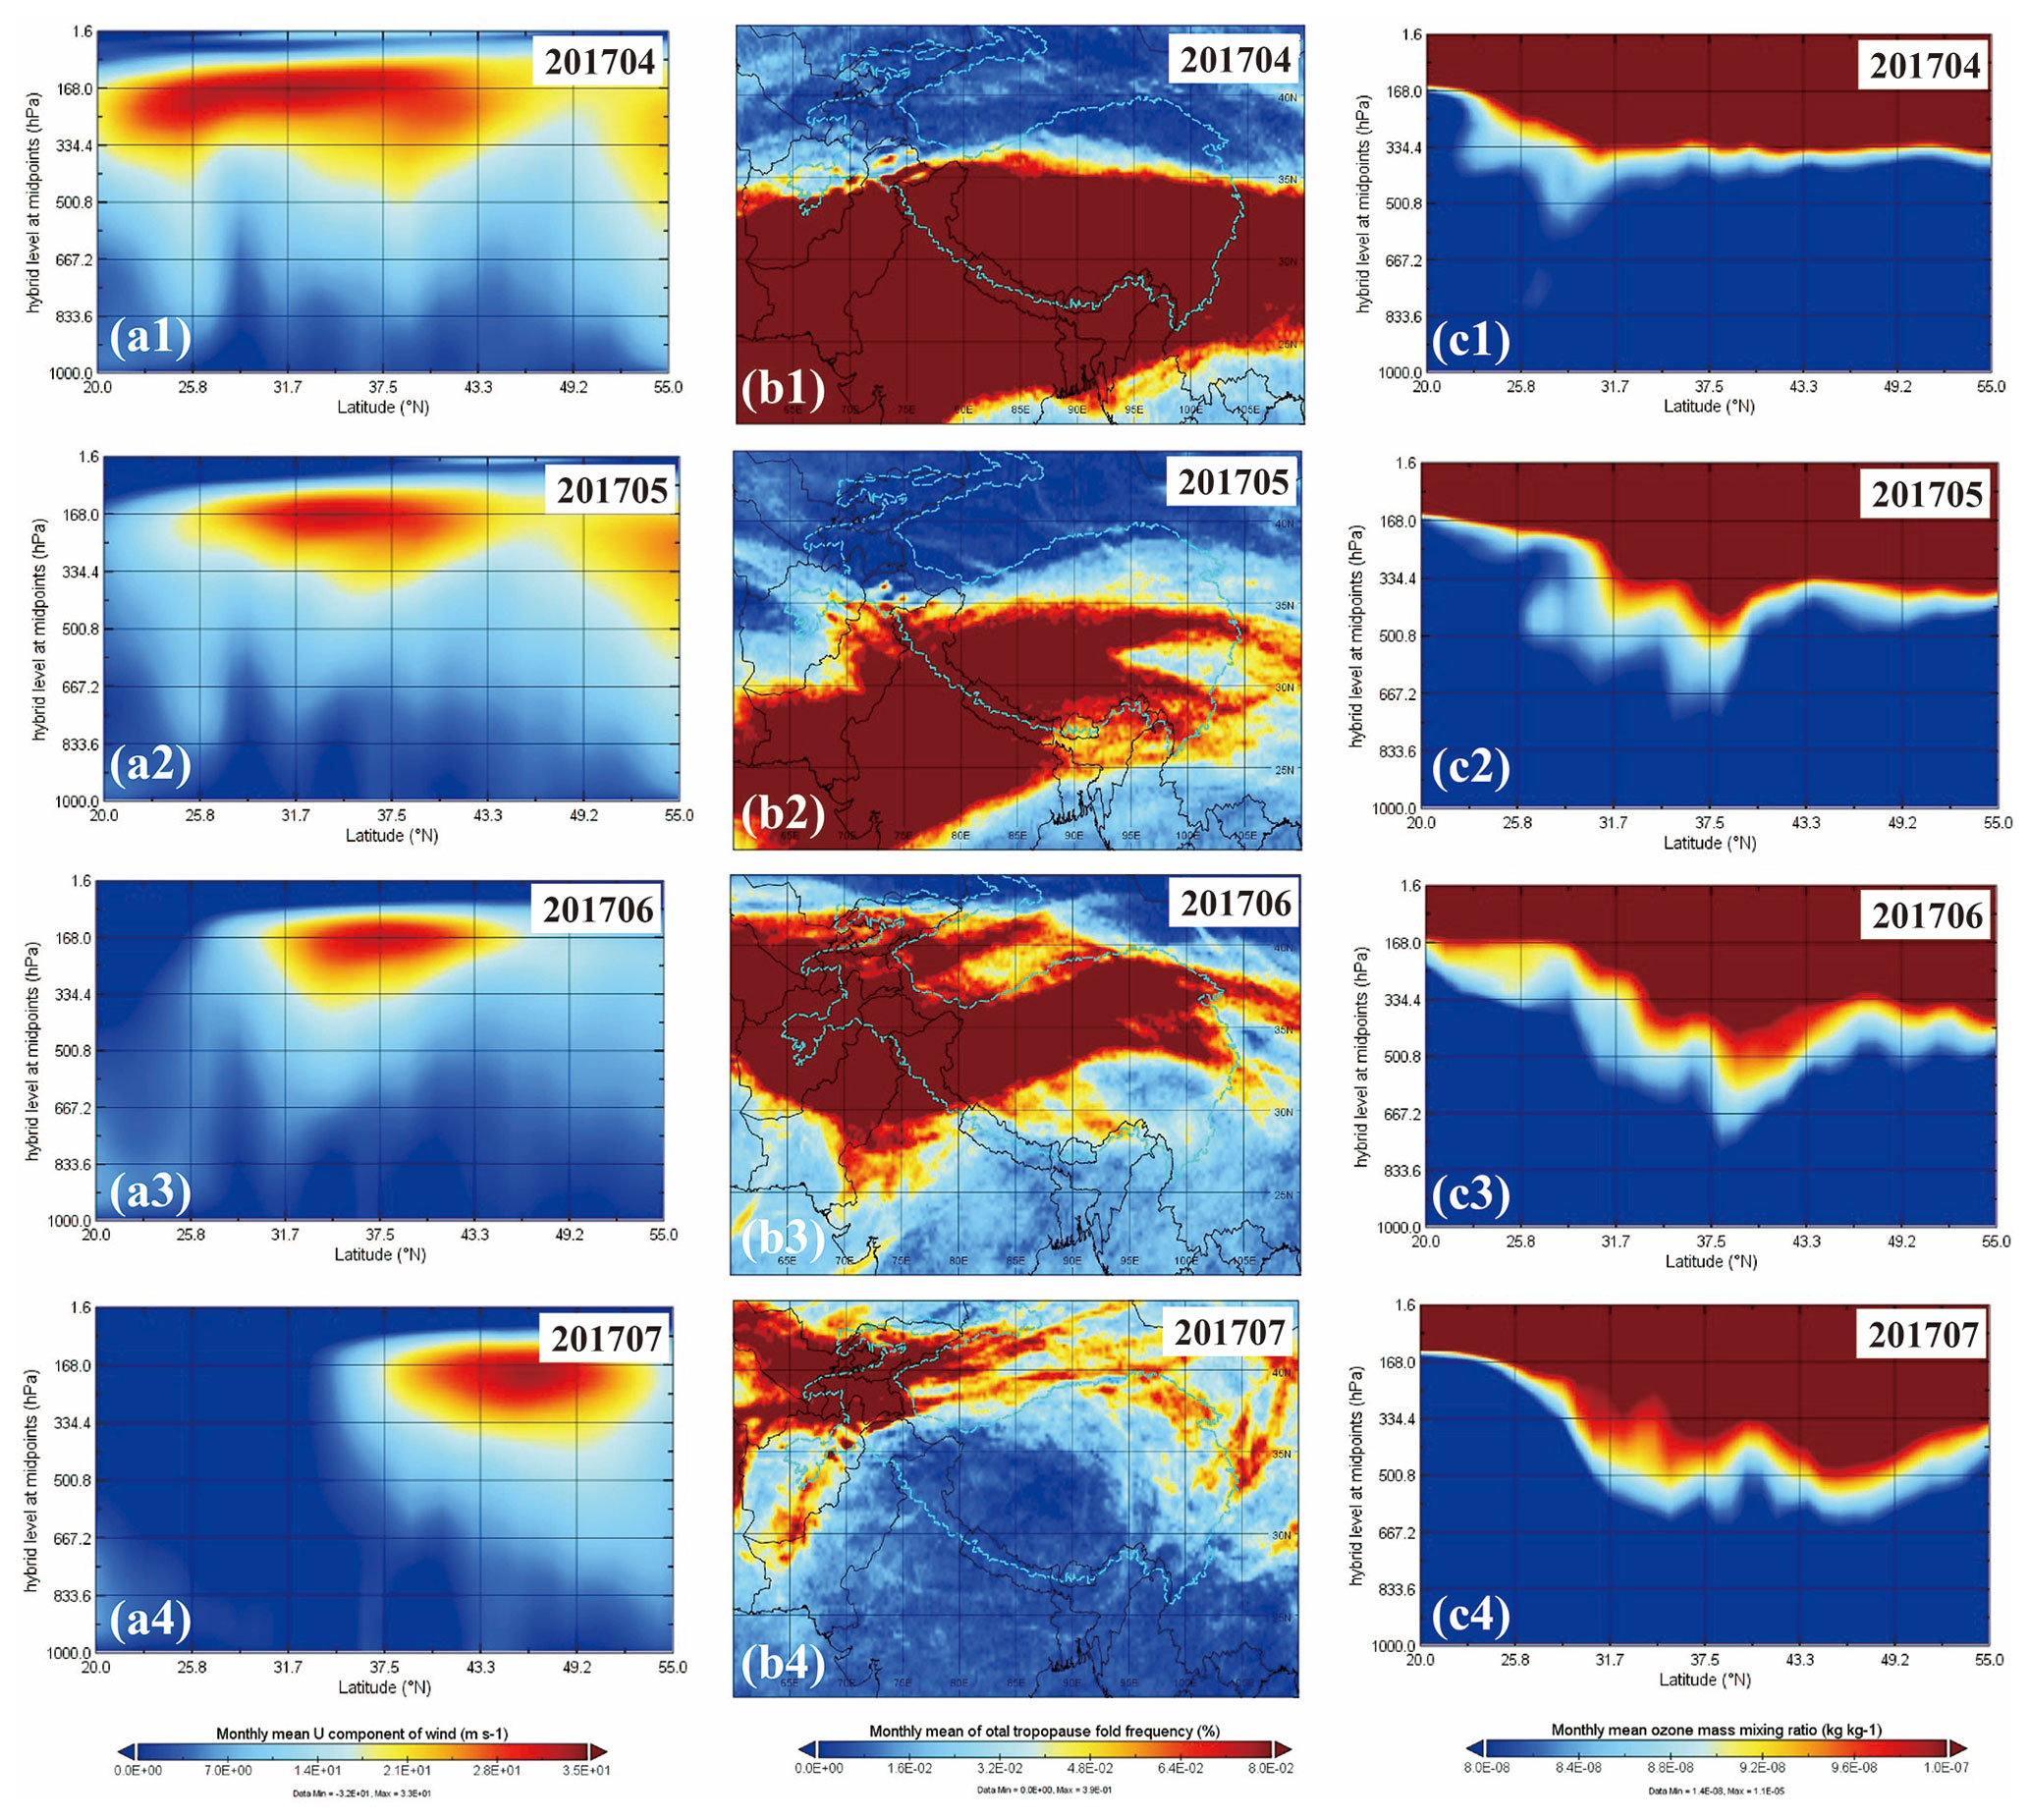
Figure 3Monthly mean meridional cross-section of ERA-5 data at 91∘ E (∼ the central Tibetan Plateau) showing the zonal winds (a) and ozone (c) in April, May, June, and July 2017. Monthly average of total tropopause fold frequencies (b) in April, May, June, and July 2017.
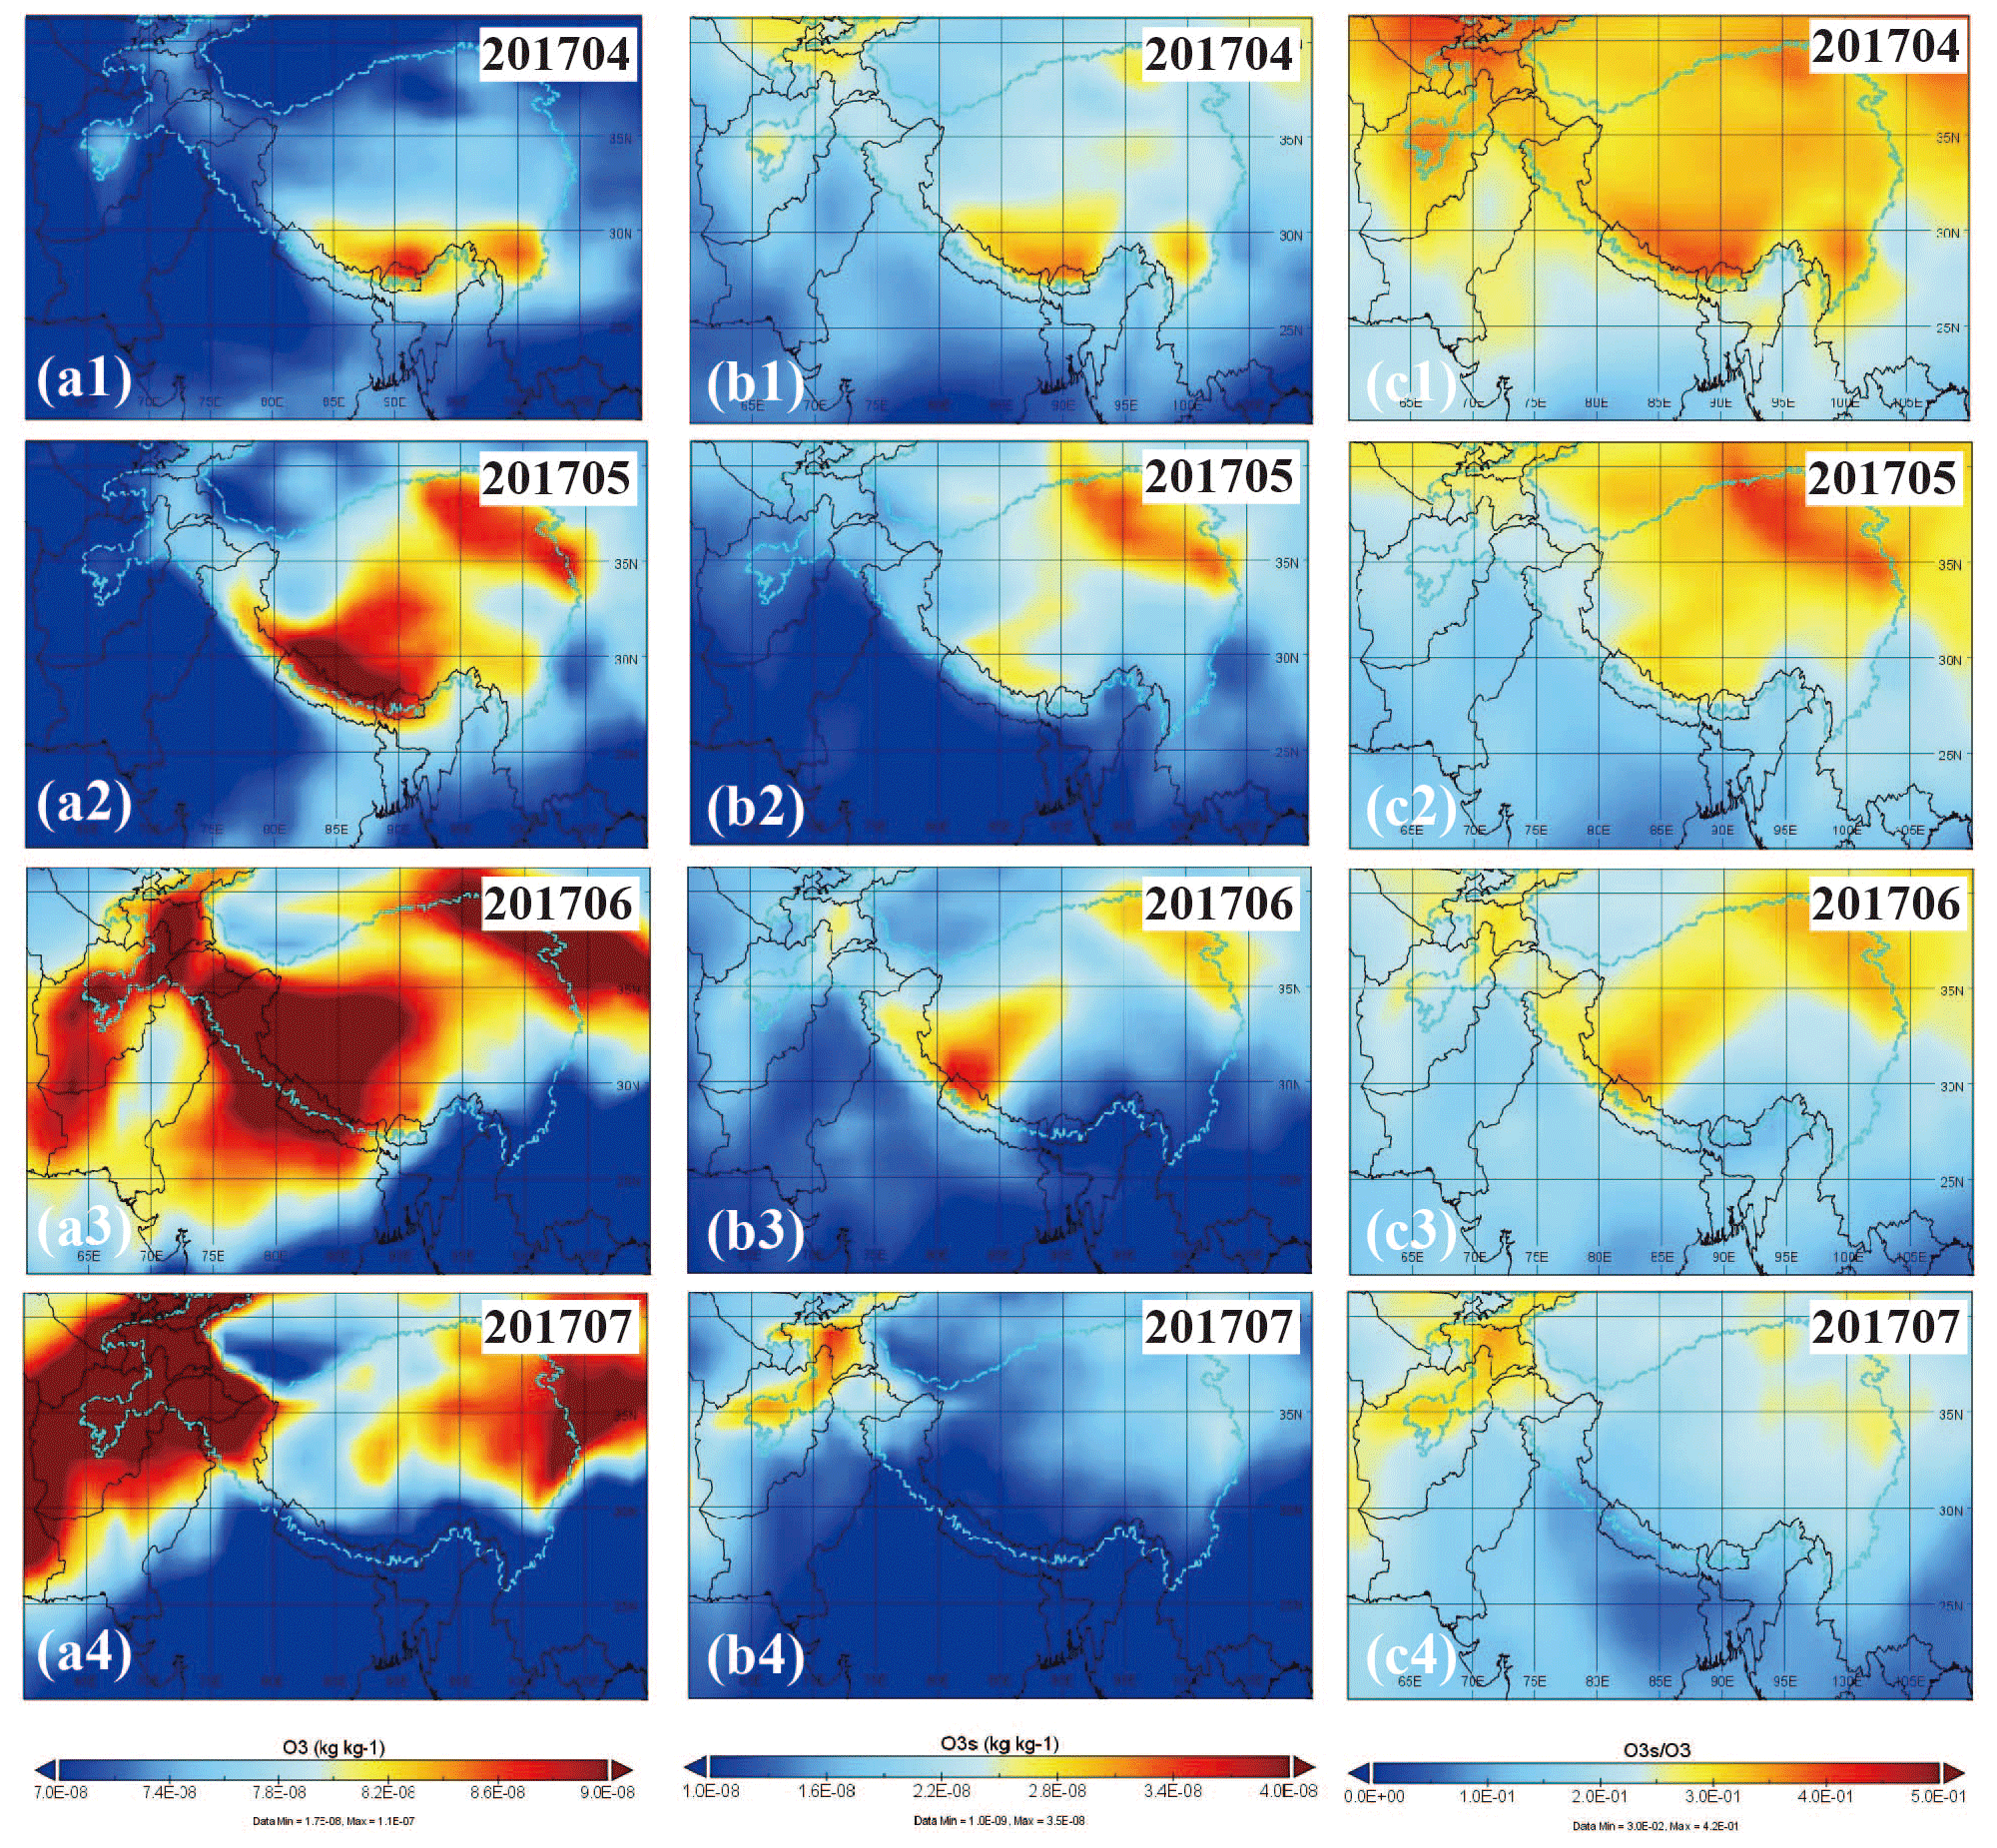
Figure 4Monthly average of (a) ozone, (b) O3s, and (c) at 581.25 hPa in April, May, June, and July 2017. The location of the Tibetan Plateau is shown with cyan contours in the maps.
3.4 Impact of stratospheric intrusion evidenced by a stratospheric ozone tracer
In the southern Tibetan Plateau, it was stated in a previous study that the surface ozone mixing ratios were significantly increased by stratospheric intrusion (+13 ppb during stratospheric intrusion) (Cristofanelli et al., 2010). Previous studies stated that the peak of surface ozone in June at Waliguan in the northeastern Tibetan Plateau was due to the downward transport of ozone from the upper troposphere and lower stratosphere (Ma et al., 2005; Ding and Wang, 2006). This is evidenced by analysis of a stratospheric ozone tracer of O3s (a stratospheric ozone tracer that represents the amount of ozone in the troposphere originated in the stratosphere in CAM-chem) across the south–north transection of the Tibetan Plateau. Figure 4a1–a4 show the surface ozone variation from April 2017 to July 2017 over the Tibetan Plateau in CAM-chem simulation. In April 2017, the hotspot area of high ozone concentration was mainly distributed in the southern Tibetan Plateau, which was consistent with the distribution of high O3s concentration (Fig. 4a). The average , representing an indication of the stratospheric ozone contribution, demonstrated that 36.5 % of surface ozone in the hotspot of the southern Tibetan Plateau (27.8–30.6∘ N, 85–92.5∘ E) was contributed by stratospheric ozone. In May and June 2017, the southern Tibetan Plateau still had high ozone concentration, and part of the northeastern Tibetan Plateau became a new hotspot with high ozone concentration. O3s in the northeastern Tibetan Plateau also had a high concentration (Fig. 4b). The average was 35.9 % in May and 29.5 % in June in the northeastern Tibetan Plateau (the region within 34.4–39.1∘ N, 90–100∘ E). The average was higher than 25% in the southern Tibetan Plateau (27.8–30.6∘ N, 85–90∘ E) and in the southwestern Tibetan Plateau (27.8–32.5∘ N, 80–85∘ E) in May. In July 2017, only the northeastern Tibetan Plateau had a high ozone concentration, and was higher than 25 % in this region. It can be stated that stratospheric ozone intrusion could elevate at least 25 % of surface ozone over the Tibetan Plateau at hotspot regions during April to July.
Ground measurements of surface ozone at 13 sites spread across the Tibetan Plateau were used for the first time in this study, as opposed to previous studies which focused mostly on individual sites. Simulation results from WRF-Chem and CAM-chem and analysis of ERA-5 reanalysis data were used to investigate the influences of long-range transport and in situ photochemical production and downward influx of ozone from the stratosphere on the variation in surface ozone. Results showed that the peak of the monthly mean surface ozone concentration occurs first over the southern and the central Tibetan Plateau in April and May and then moves progressively northwards in June and July. Such a peak shift is concurrent with northward movement of the tropopause folds and westerly jet, which act as the two main control mechanisms. The position of tropopause folds was controlled by the position of the westerly jet and created the conditions conducive to the influx of ozone-rich air from the deep stratosphere to the troposphere. The migration of the folds led to a similar migration of stratospheric intrusion from the south to the north. This led to a significant contribution of stratospheric intrusion to surface ozone, elevating surface ozone concentrations. Long-range transport and in situ photochemical production of ozone can lead to limited variation of surface ozone over the Tibetan Plateau. We suggest that the transport of stratospheric ozone to the surface is a regionally coherent and important contributor to surface ozone across the Tibetan Plateau, which needs proper consideration in understanding the atmospheric chemistry and the impacts of ozone over this highland region and beyond.
The surface ozone data at 13 sites presented in this article are available upon request from Qianggong Zhang (qianggong.zhang@itpcas.ac.cn). ERA-5 data are available through the European Centre for Medium-Range Weather Forecasts (https://cds.climate.copernicus.eu/cdsapp#!/dataset/reanalysis-era5-single-levels?tab=form, Copernicus Climate Change Service, 2017). CAM-chem data are available through the University Corporation for Atmospheric Research (https://doi.org/10.5065/NMP7-EP60, Buchholz et al., 2019).
The supplement related to this article is available online at: https://doi.org/10.5194/acp-23-10137-2023-supplement.
XY: conceptualization, visualization, and writing (original draft). BdF, DR, ZJ, ZC, GZ, and MR: writing (review and editing). JY and PL: visualization. YH and JL: visualization and writing (review). SK and QZ: conceptualization and writing (review and editing).
The contact author has declared that none of the authors has any competing interests.
Publisher’s note: Copernicus Publications remains neutral with regard to jurisdictional claims in published maps and institutional affiliations.
This article is part of the special issue “In-depth study of the atmospheric chemistry over the Tibetan Plateau: measurement, processing, and the impacts on climate and air quality (ACP/AMT inter-journal SI)”. It is not associated with a conference.
We acknowledge the China National Environmental Monitoring Center, the European Centre for Medium-Range Weather Forecasts, the Institute of Atmospheric Sciences and Climate, the University Corporation for Atmospheric Research, and the National Bureau of Statistics of China for providing the data.
This study was supported by the Second Tibetan Plateau Scientific Expedition and Research Program (STEP (grant no. 2019QZKK0605)) and the State Key Laboratory of Cryospheric Science (grant no. SKLCS-ZZ-2023). Xiufeng Yin was financially supported by the Chinese Academy of Sciences “Light of West China” program. Qianggong Zhang was financially supported by the Youth Innovation Promotion Association of CAS (grant no. 202022). Maheswar Rupakheti was supported by the Research Institute for Sustainability – Helmholtz Centre Potsdam (RIFS), formerly the Institute for Advanced Sustainability Studies (IASS), which is funded by the German Federal Ministry for Education and Research (BMBF) and the Brandenburg Ministry for Science, Research and Culture (MWKF). Dipesh Rupakheti was supported by the Startup Foundation for Introducing Talent of NUIST (grant no. 2022r024) and the Jiangsu Province “Double Innovation Doctor” program (grant no. JSSCBS20220552).
This paper was edited by Graciela Raga and reviewed by two anonymous referees.
Bracci, A., Cristofanelli, P., Sprenger, M., Bonafè, U., Calzolari, F., Duchi, R., Laj, P., Marinoni, A., Roccato, F., and Vuillermoz, E.: Transport of Stratospheric Air Masses to the Nepal Climate Observatory–Pyramid (Himalaya; 5079 m MSL): A Synoptic-Scale Investigation, J. Appl. Meteorol. Climatol., 51, 1489–1507, 2012.
Buchholz, R. R., Emmons, L. K., Tilmes, S., and The CESM2 Development Team: CESM2.1/CAM-chem Instantaneous Output for Boundary Conditions, UCAR/NCAR – Atmospheric Chemistry Observations and Modeling Laboratory [data set], https://doi.org/10.5065/NMP7-EP60, 2019.
Copernicus Climate Change Service (C3S): ERA5: Fifth generation of ECMWF atmospheric reanalyses of the global climate, Copernicus Climate Change Service Climate Data Store (CDS) [data set], https://cds.climate.copernicus.eu/cdsapp#!/home, (last access: 2 May 2022), 2017.
Cristofanelli, P., Bracci, A., Sprenger, M., Marinoni, A., Bonafè, U., Calzolari, F., Duchi, R., Laj, P., Pichon, J. M., Roccato, F., Venzac, H., Vuillermoz, E., and Bonasoni, P.: Tropospheric ozone variations at the Nepal Climate Observatory-Pyramid (Himalayas, 5079 m a.s.l.) and influence of deep stratospheric intrusion events, Atmos. Chem. Phys., 10, 6537–6549, https://doi.org/10.5194/acp-10-6537-2010, 2010.
Ding, A. and Wang, T.: Influence of stratosphere‐to‐troposphere exchange on the seasonal cycle of surface ozone at Mount Waliguan in western China, Geophys. Res. Lett., 33, L03803, https://doi.org/10.1029/2005GL024760, 2006.
Hoffmann, L., Günther, G., Li, D., Stein, O., Wu, X., Griessbach, S., Heng, Y., Konopka, P., Müller, R., Vogel, B., and Wright, J. S.: From ERA-Interim to ERA5: the considerable impact of ECMWF's next-generation reanalysis on Lagrangian transport simulations, Atmos. Chem. Phys., 19, 3097–3124, https://doi.org/10.5194/acp-19-3097-2019, 2019.
Kang, S., Zhang, Q., Qian, Y., Ji, Z., Li, C., Cong, Z., Zhang, Y., Guo, J., Du, W., and Huang, J.: Linking atmospheric pollution to cryospheric change in the Third Pole region: current progress and future prospects, Natl. Sci. Rev., 6, 796–809, 2019.
Kumar, R., Barth, M. C., Pfister, G., Delle Monache, L., Lamarque, J., Archer-Nicholls, S., Tilmes, S., Ghude, S., Wiedinmyer, C., and Naja, M.: How will air quality change in South Asia by 2050?, J. Geophys. Res.-Atmos., 123, 1840–1864, 2018.
Kumar, V., Sarkar, C., and Sinha, V.: Influence of post-harvest crop residue fires on surface ozone mixing ratios in the NW IGP analyzed using 2 years of continuous in situ trace gas measurements, J. Geophys. Res.-Atmos., 121, 3619–3633, 2016.
Lamarque, J.-F., Emmons, L. K., Hess, P. G., Kinnison, D. E., Tilmes, S., Vitt, F., Heald, C. L., Holland, E. A., Lauritzen, P. H., Neu, J., Orlando, J. J., Rasch, P. J., and Tyndall, G. K.: CAM-chem: description and evaluation of interactive atmospheric chemistry in the Community Earth System Model, Geosci. Model Dev., 5, 369–411, https://doi.org/10.5194/gmd-5-369-2012, 2012.
Lin, W., Xu, X., Zheng, X., Dawa, J., Baima, C., and Ma, J.: Two-year measurements of surface ozone at Dangxiong, a remote highland site in the Tibetan Plateau, J. Environ. Sci., 31, 133–145, 2015.
Lu, X., Hong, J., Zhang, L., Cooper, O. R., Schultz, M. G., Xu, X., Wang, T., Gao, M., Zhao, Y., and Zhang, Y.: Severe surface ozone pollution in China: a global perspective, Environ. Sci. Technol. Lett., 5, 487–494, 2018.
Luo, J., Liang, W., Xu, P., Xue, H., Zhang, M., Shang, L., and Tian, H.: Seasonal Features and a Case Study of Tropopause Folds over the Tibetan Plateau, Adv. Meteorol., 2019, 1–12, https://doi.org/10.1155/2019/4375123, 2019.
Ma, J., Liu, H., and Hauglustaine, D.: Summertime tropospheric ozone over China simulated with a regional chemical transport model 1. Model description and evaluation, J. Geophys. Res.-Atmos., 107, ACH 27-21–ACH 27-13, https://doi.org/10.1029/2001JD001354, 2002.
Ma, J., Zheng, X., and Xu, X.: Comment on “Why does surface ozone peak in summertime at Waliguan?” by Bin Zhu et al., Geophys. Res. Lett., 32, L01805, https://doi.org/10.1029/2004GL021683, 2005.
Ma, J., Lin, W. L., Zheng, X. D., Xu, X. B., Li, Z., and Yang, L. L.: Influence of air mass downward transport on the variability of surface ozone at Xianggelila Regional Atmosphere Background Station, southwest China, Atmos. Chem. Phys., 14, 5311–5325, https://doi.org/10.5194/acp-14-5311-2014, 2014.
Ran, L., Lin, W. L., Deji, Y. Z., La, B., Tsering, P. M., Xu, X. B., and Wang, W.: Surface gas pollutants in Lhasa, a highland city of Tibet – current levels and pollution implications, Atmos. Chem. Phys., 14, 10721–10730, https://doi.org/10.5194/acp-14-10721-2014, 2014.
Tilmes, S., Lamarque, J.-F., Emmons, L. K., Kinnison, D. E., Marsh, D., Garcia, R. R., Smith, A. K., Neely, R. R., Conley, A., Vitt, F., Val Martin, M., Tanimoto, H., Simpson, I., Blake, D. R., and Blake, N.: Representation of the Community Earth System Model (CESM1) CAM4-chem within the Chemistry-Climate Model Initiative (CCMI), Geosci. Model Dev., 9, 1853–1890, https://doi.org/10.5194/gmd-9-1853-2016, 2016.
Yang, J., Wang, K., Lin, M., Yin, X., and Kang, S.: Not biomass burning but stratospheric intrusion dominating tropospheric ozone over the Tibetan Plateau, P. Natl. Acad. Sci. USA, 9, e2211002119, https://doi.org/10.1073/pnas.2211002119, 2022.
Yao, T., Thompson, L., Yang, W., Yu, W., Gao, Y., Guo, X., Yang, X., Duan, K., Zhao, H., and Xu, B.: Different glacier status with atmospheric circulations in Tibetan Plateau and surroundings, Nat. Clim. Change, 2, 663–667, 2012.
Yin, X., Kang, S., de Foy, B., Cong, Z., Luo, J., Zhang, L., Ma, Y., Zhang, G., Rupakheti, D., and Zhang, Q.: Surface ozone at Nam Co in the inland Tibetan Plateau: variation, synthesis comparison and regional representativeness, Atmos. Chem. Phys., 17, 11293–11311, https://doi.org/10.5194/acp-17-11293-2017, 2017.
Yin, X., Kang, S., Foy, B. d., Rupakheti, D., Rupakheti, M., Cong, Z., Wan, X., Zhang, G., and Zhang, Q.: Impacts of Indian summer monsoon and stratospheric intrusion on air pollutants in the inland Tibetan Plateau, Geosci. Front., 12, 101255, https://doi.org/10.1016/j.gsf.2021.101255, 2021.
Zhu, B., Akimoto, H., Wang, Z., Sudo, K., Tang, J., and Uno, I.: Why does surface ozone peak in summertime at Waliguan?, Geophys. Res. Lett., 31, L01805, https://doi.org/10.1029/2004GL021683, 2004.