the Creative Commons Attribution 4.0 License.
the Creative Commons Attribution 4.0 License.
 | 12 Apr 2022
Insights into the significant increase in ozone during COVID-19 in a typical urban city of China
Kun Zhang
Zhiqiang Liu
Xiaojuan Zhang
Qing Li
Andrew Jensen
Wen Tan
Ling Huang
Yangjun Wang
Joost de Gouw
The outbreak of COVID-19 promoted strict restrictions to human activities in China, which led to a dramatic decrease in most air pollutant concentrations (e.g., PM2.5, PM10, NOx, SO2 and CO). However, an obvious increase in ozone (O3) concentrations was found during the lockdown period in most urban areas of China. In this study, we conducted field measurements targeting ozone and its key precursors by utilizing a novel proton transfer reaction time-of-flight mass spectrometer (PTR-TOF-MS) in Changzhou, which is representative of the Yangtze River Delta (YRD) city cluster of China. We further applied the integrated methodology including machine learning, an observation-based model (OBM) and sensitivity analysis to obtain insights into the reasons causing the obvious increase in ozone. Major findings include the following: (1) by deweathered calculation, we found changes in precursor emissions contributed 1.46 ppbv to the increase in the observed O3 during the full-lockdown period in 2020, while meteorology constrained 3.0 ppbv of O3 in the full-lockdown period of 2019. (2) By using an OBM, we found that although a significant reduction in O3 precursors was observed during the full-lockdown period, the photochemical formation of O3 was stronger than that during the pre-lockdown period. (3) The ratio dropped dramatically from 1.84 during the pre-lockdown to 0.79 in the full-lockdown period, which switched O3 formation from a VOC-limited regime to the boundary of a NOx- and VOC-limited regime. Additionally, box model results suggested that the decrease in the ratio during the full-lockdown period could increase the mean O3 by 2.4 ppbv. Results of this study give insights into the relationship between O3 and its precursors in urban area and demonstrate reasons for the obvious increase in O3 in most urban areas of China during the COVID-19 lockdown period. This study also underlines the necessity of controlling anthropogenic oxygenated volatile organic compounds (OVOCs), alkenes and aromatics in the sustained campaign of reducing O3 pollution in China.
- Article
(7059 KB) - Full-text XML
-
Supplement
(1396 KB) - BibTeX
- EndNote


At the end of 2019, a tragic coronavirus (COVID-19) occurred, which has caused over 271 million global infections and over 4.51 million deaths as of this writing (12 February 2022). To protect people's health, China adopted strict measures to control the spread of this pandemic. Thirty provinces, autonomous regions and municipalities launched full-lockdown responses (also known as Level-I responses, roughly from 24 January to 25 February 2020) as early as 24 January 2020 (Shen et al., 2021; Li et al., 2020; Huang et al., 2020). With the effective control of COVID-19 in China, the emergency response level in most provinces (except Hubei Province, the hardest-hit region) was gradually downgraded to a partial lockdown (Level-II and Level-III response, roughly after 25 February 2020) (Li et al., 2020), and work resumption started. During the full-lockdown period, all the social events that may cause crowds (excluding transportation and industries that maintained the basic operation of society) were severely restricted. Affected by the pandemic, many factories were shut down, and the on-road traffic volume and construction activities were reduced significantly (Zheng et al., 2020). During the full-lockdown period, dramatic decreases in air pollutants (e.g., PM2.5, NO2, black carbon (BC)) were found in China, especially in urban areas (Fan et al., 2021; Gao et al., 2021; Li et al., 2020; Xu et al., 2020; Venter et al., 2020). Surprisingly, marginal increases in O3 were observed during the lockdown period in the Yangtze River Delta (YRD) region, and this seems to be contradictory to the decrease in most air pollutants (Li et al., 2020). However, as suggested by previous studies, the formation of O3 is significantly influenced by the ratio and meteorological conditions (temperature, relative humidity and actinic flux) (Zhang et al., 2020a, b). Therefore, it is essential to investigate the changes in meteorological and emissions conditions to figure out reasons for the increase in O3 during this pandemic.
Previous studies on the O3 pollution in the YRD region have often focused on the more populated metropolitan areas, such as Shanghai and Nanjing, which are considerably far away from the industrial zones that are essentially responsible for the sources of O3 precursors (Li et al., 2019; Zhang et al., 2020b). Changzhou, located in the center of the YRD region, is a typical city with fast urbanization, heavy industrial structure, huge energy consumption, increasing vehicle stocks and frequent air pollution. Therefore, it provides a more representative environment to fully elucidate the mechanism underlying the O3 pollution in the YRD region (Shi et al., 2020). In a companion paper (Jensen et al., 2021), we also demonstrated that Changzhou is representative of the region by analyzing both surface observations and satellite data. According to previous studies, the anthropogenic VOC emissions in Changzhou were around 9–12.6 × 10⁴ t yr−1, of which industries was the dominant source, accounting for 27 %–47 % of the total VOC emissions (Cheng et al., 2016; Fu et al., 2013). It is notable that industrial sources together contributed over 80 % of anthropogenic VOC emissions (Sun et al., 2019). Apart from industrial sources, vehicle exhaust accounted for 9 %–14 % of total VOC emissions (Sun et al., 2019). However, observations regarding VOC characteristics during COVID-19 in Changzhou have rarely been conducted.
Highly time-resolved measurements of VOCs are generally very sparse and could not be easily expanded during the lockdowns. This limits our understanding of how VOCs changed and how the formation of ozone was affected. Here, we used a novel proton transfer reaction time-of-flight mass spectrometer (PTR-TOF-MS, Tofwerk, model Vocus Elf, Switzerland) to conduct online observation of VOCs in Changzhou. The characteristics of VOCs and the variations in general air pollutants in each emergency response period were analyzed. Additionally, ozone formation during each period was investigated by an observation-based model (OBM). Although COVID-19 has had terrifying impact, it has provided an opportunity to conduct a rare experiment to analyze the variations in VOCs and NOx due to changes in anthropogenic activities in a typical city of China. Furthermore, results of this study offer theoretical support for formulating refined ozone management policy in China.
2.1 Field measurement
The field campaign was conducted from 8 January to 31 March 2020 at a sampling site located on the rooftop of a building at Changzhou Environmental Monitoring Center (CEMC; 31.76∘ N, 119.96∘ E), which was approximately 15 m above ground level. As a typical urban monitoring station, this site is in the center of Changzhou, surrounded by residential and commercial areas, and is also adjacent to the main transportation junction in Changzhou (Fig. 1). According to local epidemic prevention policies, we roughly classified the measurement periods into three stages: pre-lockdown (8 to 24 January 2020), full lockdown (25 January to 24 February 2020) and partial lockdown (25 February to 31 March 2020), as defined in a study of the Yangtze River Delta (Li et al., 2020).
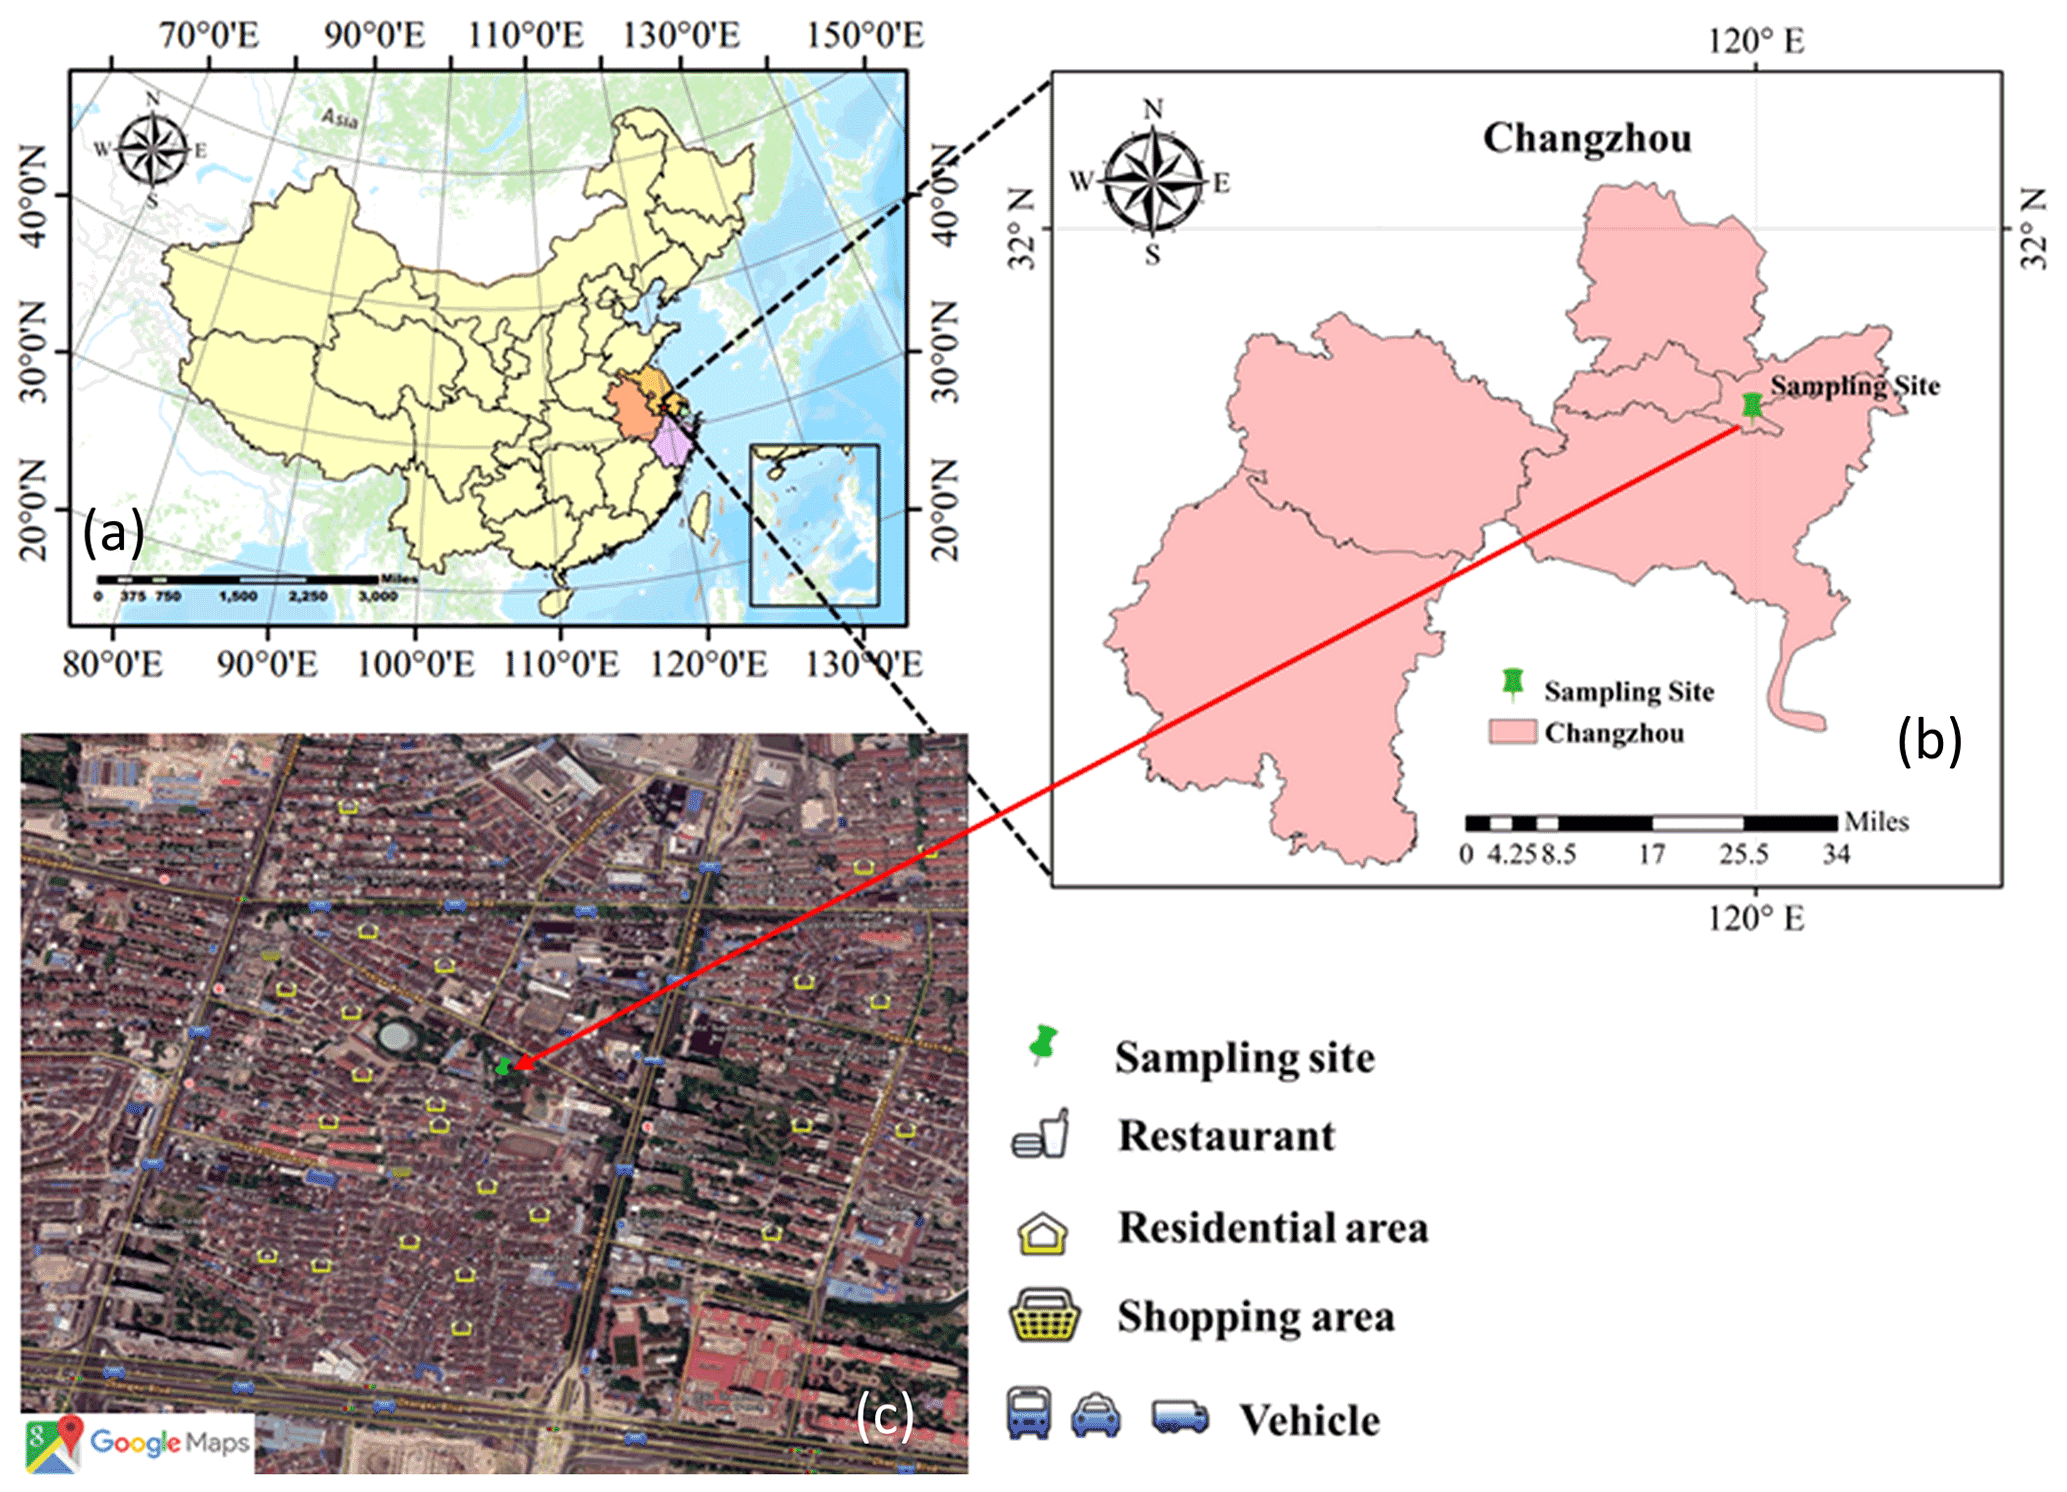
Figure 1Map of China (a); map of Changzhou (b); location of the sampling site (© Google Maps 2022).
From 8 January to 27 March 2020, the concentrations of traditional air pollutants (PM2.5, PM10, NOx, SO2, CO, O3) as well as meteorological parameters were monitored by a series of analyzers (Table 1). In particular, 87 VOC species were quantified, 59 of which were identified, by a PTR-TOF-MS with a time resolution of 1 min. Detailed measurement techniques and quality assurance and control have been documented in detail in our companion paper (Jensen et al., 2021). Here, we just briefly introduce the measurement. The air samples were directly drawn into a 3 m long tube connected to the instrument. A priming pump, with a flow rate of 4 L min−1, was used to reduce the retention time of the gas sample in the tube. To avoid blocking of the inlet tube caused by particles, a particulate filter was assembled at the front of the inlet tube. The pressure of the ion source was set as 2 mbar, and the temperature of the reaction chamber was set to 90 ∘C during the observation. VOCs are ionized by reactions with H3O+ ions from a discharge, and the product ions are detected by a time-of-flight mass analyzer ( full width at half maximum (FWHM) of 950 at 107). The PTR-TOF-MS can detect most unsaturated hydrocarbons and VOCs with functional groups but cannot detect species with proton affinities lower than that of water, namely alkanes and small alkenes. Eighteen standard gases (including acetonitrile, acetaldehyde, acrolein, acetone, isoprene, butanone, 2-butanone, benzene, 2-pentanone, ethyl acetate, toluene, methyl isobutyl ketone, styrene, xylene, trimethylbenzene, naphthalene, α-pinene and 1,3-dichlorobenzene) with concentrations of 1 ppmv were used for the calibration of the PTR-TOF-MS. In addition, a built-in calibration system was used to control the zero and standard gases.
Table 1Measurements performed during the field campaign.
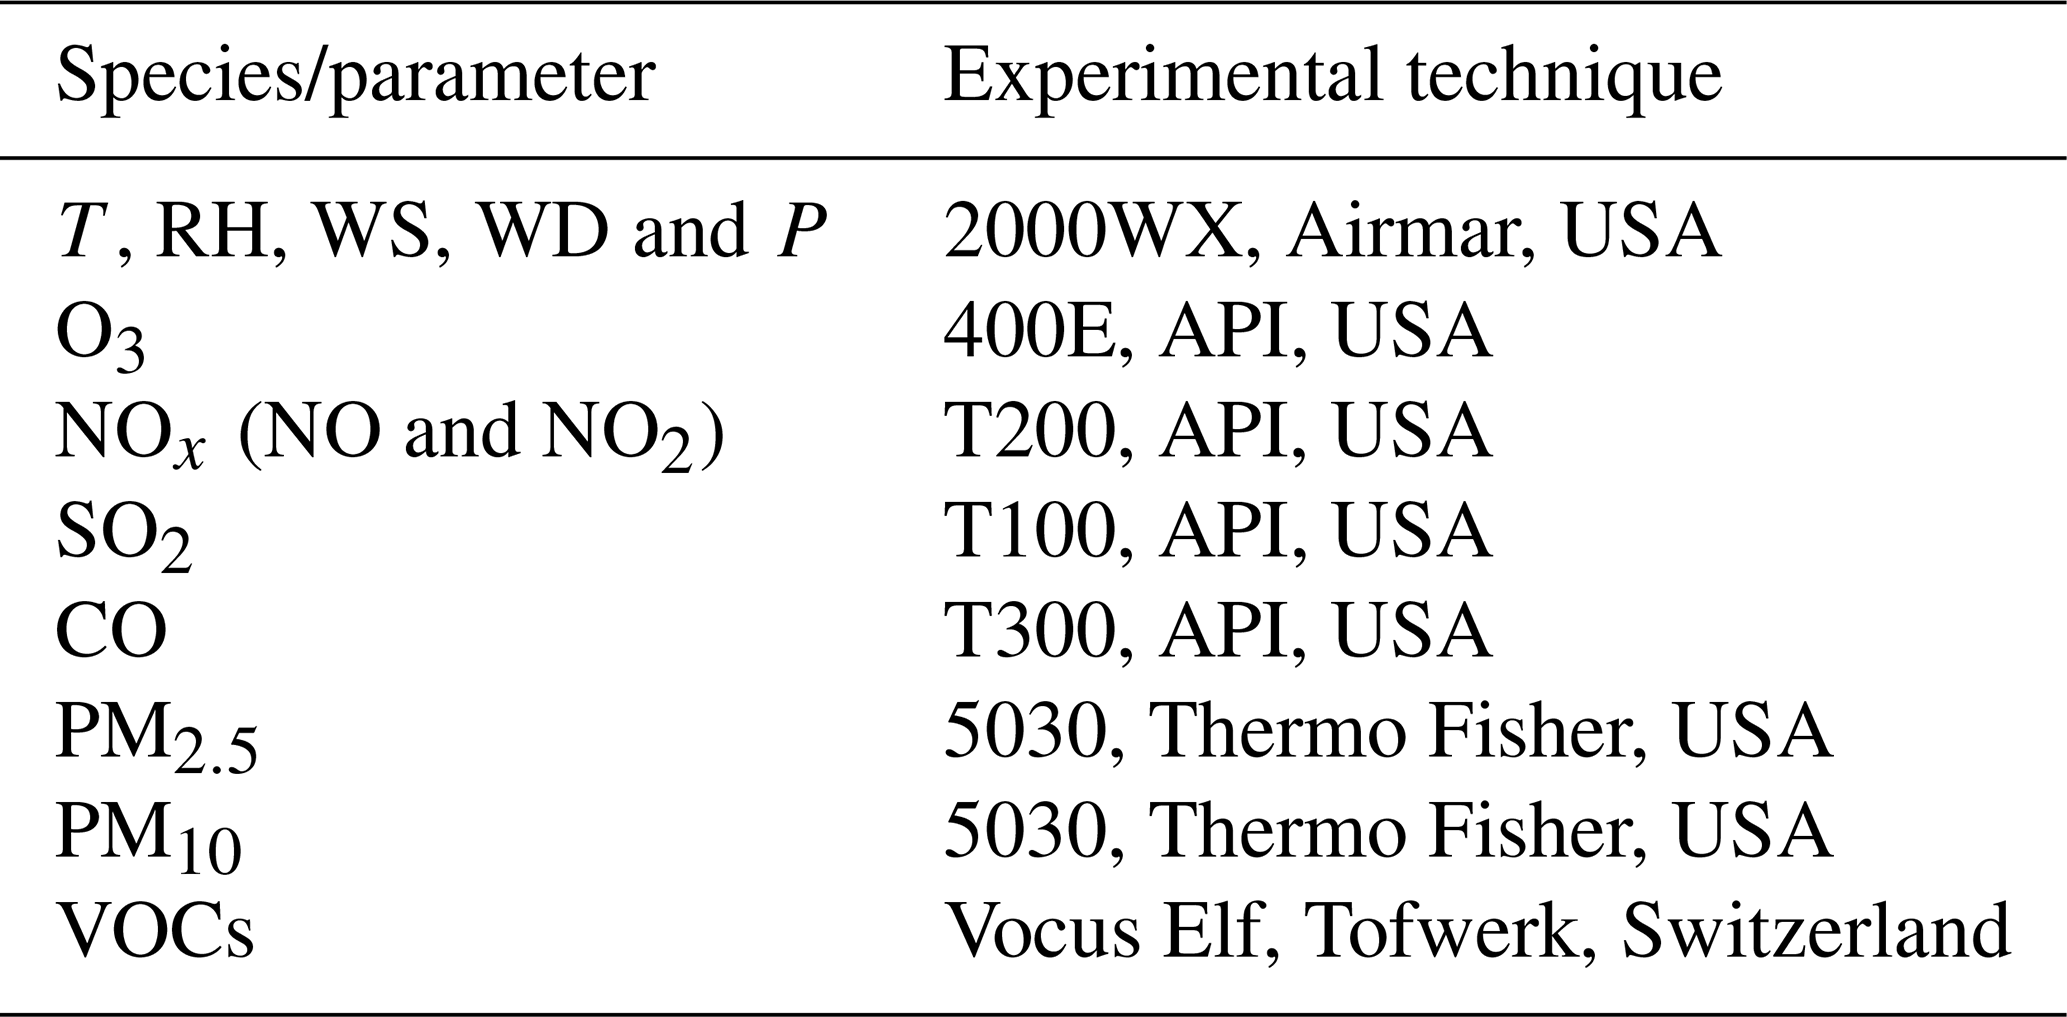
T denotes temperature; RH denotes relative humidity; WS denotes wind speed; WD denotes wind direction; P denotes pressure.
2.2 Observation-based model
An OBM coupled with MCM v3.3.1 was utilized to investigate the atmospheric oxidation capability and the radical chemistry. Detailed information about the chemistry mechanism is available on the MCM website (http://mcm.york.ac.uk/home.htt, last access: 8 July 2021). More than 5800 chemical species and 17 000 reactions are included in this mechanism. The photolysis frequencies (J values) were calculated as a function of solar zenith angle and altitude using lookup tables, calculated using the Tropospheric Ultraviolet and Visible (TUV) model (Wolfe et al., 2016). Dilution mixing within the boundary layer is considered. However, as a 0-D model, vertical or horizonal transport of air masses is not involved. The observed meteorological parameters (T, RH, P) and trace gases (NO, NO2, CO, SO2 and VOCs) were used to constrain the model. Before each simulation, the model was run for 3 d as spin-up to reach a stable state. The atmospheric oxidation capability (AOC) is quantified by Eq. (1) (Geyer et al., 2001).
where Yi denotes the primary pollutants (e.g., VOCs, CH4 and CO), X denotes atmospheric oxidants (OH, O3, NO3), and denotes the bimolecular rate constants for the reactions of Yi and X. A high value of AOC indicates fast scavenging of primary air pollutants. Additionally, OH reactivity (kOH), defined as the reaction rate coefficients multiplied by the concentrations of the reactants with OH, is also widely used as an indicator of AOC. The value of kOH depends on both the abundances and the compositions of primary pollutants and can be calculated by Eq. (2).
where denotes the reaction rate coefficients of reaction OH+Xi and Xi are the concentrations of pollutants (VOC, NO2, CO, oxygenated volatile organic compound (OVOC), etc.) (Zhu et al., 2020).
2.3 Trend analysis
The Mann–Kendall (MK) trend test is a widely used non-parametric test method (Pathakoti et al., 2021; Zhang et al., 2013). It is applicable to all distributions (that is, the data do not need to meet the assumption of a normal distribution), but the data should have no serial correlation. If the data have serial correlation, this will have an impact on the significance level (p value). In this study, the MK trend analysis was performed for individual VOC concentrations during the pre-lockdown and full-lockdown period. By using the “feasts” R package, no obvious serial correlation of individual VOCs is found. Therefore, the observed VOC data are suitable for the MK test. Detailed description and the calculation formula of the MK trend test can be found in the studies of Pathakoti et al. (2021) and Alhathloul et al. (2021). A positive Z value from the MK test indicates an increasing trend of the target compound. On the contrary, a negative Z value suggests the target compound was decreasing.
Sen's slope, a non-parametric test proposed by Sen (1968), is used in this study to assess the rate of change in individual VOC concentrations. Sen's slope is selected since it is insensitive to outliers and does not require a normal distribution of residuals. Sen's slope (Q) is mathematically represented by the following equations.
where xj and xi are concentrations of VOC species x at time j and i (1, respectively. SSij is the linear slope between time i and j, and Q is the median of SSij. Positive and negative Q values indicate an increasing or decreasing trend of VOC species x, respectively.
2.4 Deweathered model
The observed concentrations of O3 could be influenced by meteorological conditions, emissions and/or chemistry. The emissions and chemistry are treated together and separated from meteorology by the deweathered approach based on random forests (RFs). Hourly data of the Unix date (number of seconds since 1 January 1970), Julian day, weekday, hour of day, wind speed (WS), wind direction (WD), temperature (T), relative humidity (RH) and pressure (P), which are available during the whole observation, were used for the deweathered calculation of O3. The missing data were replaced by linear interpolation. Training of the models was conducted on 80 % of the input data, and the other 20 % were withheld from training. To avoid the disadvantage of overfitting during the training of RFs, a process called bagging (or bootstrap aggregation) was adopted. Bagging results in a new sampled set called out-of-bag (OOB) data. A decision tree is then grown on the OOB data. Therefore, all the decision trees are grown on different observations and avoid the overfitting (Grange and Carslaw, 2019). To determine the value of the number of trees (ntree), number of samples (nsample) and the minimal node size, a series of random forests were performed under different choices of ntree, nsample and minimal node size. The results suggest that the highest coefficient of determination (R2, 0.84) was obtained when ntree, nsample and the minimal node size were set as 300, 300 and 5, respectively (Tables S1 and S2 in the Supplement). More details of this model can be found in the study of Grange and Carslaw (2019). The uncertainty in the deweathered model is obtained by growing 50 random forest models with the hyperparameters described above, which is the same method as in Grange and Carslaw (2019). The mean and standard error of the predicted O3 concentrations are shown in Fig. S1 in the Supplement, and results of the model are stable during the 50 runs. The differences in observed O3 concentrations (O3,Obs) and deweathered O3 concentrations (O3,Normal) were regarded as the concentrations contributed by meteorology (O3,Met), which is consistent with the definition in Li et al. (2021). Correspondingly, the differences in O3,Normal concentrations in different periods represent the influence of emissions since the O3,Normal has already removed the influence of meteorological conditions.
3.1 Overview of the field campaign
Figure 2 shows the meteorological conditions during the observation. During the whole experiment, the prevailing WD was southeasterly. The average T and RH were 9.9 ± 5.1∘C and 58.9 ± 17.1 %, respectively. Compared to the pre-lockdown period, the concentrations of PM2.5, PM10, SO2, NO, NO2, total VOCs (TVOCs) and CO during the full-lockdown period decreased by 48 %, 42 %, 11 %, 65 %, 58 %, 33 % and 39 %, respectively. It should be noted that the decreasing ratio of is around 1.75, suggesting that the lockdown policy had a stronger influence on NOx emissions than VOC emissions. The O3 concentrations during the same period in 2020 and 2019 are summarized in Table 2. Considering the influence of the Chinese New Year, the corresponding period in 2019 was decided according to the lunar calendar. It should be noted that, compared to the full-lockdown period in 2019, the mean O3 concentration in 2020 is obviously higher (5.5 ppbv, Fig. 2). Meanwhile, the average O3 concentrations in the full-lockdown period in 2020 were 67 % higher than those during the pre-lockdown period in 2020. To roughly analyze the cause of the obvious increase in O3 during the full-lockdown period in 2020, we summarized the temperature (T) and relative humidity (RH) in Table 2. The T and RH in the full-lockdown period were 2020 were ∼ 1.6 ∘C higher and 6.1 % lower than those in the same period in 2019, while the P and WS were comparable during the same period in 2020 and 2019 (Table 2). The higher T was in favor of O3 formation during the full-lockdown period in 2020. As for RH, the influence on O3 is nonlinear (Zhang et al., 2020), and based on our sensitivity test, lower RH could lead to a decrease or increase in O3 concentration (Fig. S2). Overall, changes in O3 concentrations could be a result of the joint effect of meteorological conditions and emissions/chemistry; the following sections will discuss these influences separately.

Figure 2Time series of meteorological parameters and air pollutants during the whole observation. The date is given in the format month/day/year.
Table 2Comparison of average meteorological conditions during the pre-lockdown, full lockdown and partial lockdown in 2020 and the same period in 2019.

3.2 Mechanism affecting the obvious O3 increase
3.2.1 Meteorological perspective
Deweathered O3 concentrations were calculated based on the model described in Sect. 2.4. The difference between O3,Obs and O3,Normal can be regarded as the meteorological influence (O3,Met). In addition, the difference between O3,Normal concentrations in different years could be considered the influence of emissions (O3,Emi). Figure 3 exhibits the average O3,Obs, O3,Normal and O3,Met during the same periods in 2019 and 2020. It is obvious that the O3,Obs during the pre-lockdown period is much lower than that during the full-lockdown period in both years, which was partly attributed to the negative influence of meteorological conditions during the pre-lockdown period (Fig. 3). This is consistent with the increasing temperature and solar radiation, which could significantly contribute to the increase in ozone concentration, from the pre-lockdown to full-lockdown period. It should be noted that meteorology constrained O3 concentrations by 3.9 ppbv during the full-lockdown period in 2019. Apart from the influence of meteorological conditions, the O3,Normal in the full-lockdown period in 2020 is still 1.46 ppbv and 0.64 ppb higher than that during the full-lockdown period in 2019 and that during the pre-lockdown period in 2020, indicating that the inapposite decline in precursor emissions was possibly the key reason for the obvious increase in O3 during the full-lockdown period in 2020.

Figure 3Comparison of observed (Obs), weather-normalized (Normal) and meteorological-factor-impacted (Met) O3 concentrations during the same period in 2019 and 2020.
3.2.2 Ambient VOCs
As mentioned above, the changes in O3 precursor emissions strongly affected O3,Obs, and the changes in VOCs and NOx emissions would eventually be reflected by the observed concentrations of individual VOCs and NOx. Therefore, the concentrations of each VOC group in different periods were summarized (Fig. 4). OVOCs dominated the total VOC (TVOC) concentrations during the whole observation, with a daily average concentration of 21.44 ± 10.27 ppbv. During the full-lockdown period, the TVOC dropped to 22.19 ± 7.9 ppbv from 32.78 ± 13.81 ppbv, which was mainly affected by the decrease in industrial activities and traffic volume. This is proved by the trend of traffic volume, VOC emissions and traffic-/industrial-derived VOCs (Text S1 and Fig. S3). In addition, Jensen et al. (2021) found the VOC emissions from most industries in Changzhou share the same “U-shape” trend as our study. The most obvious drop was found in aromatics (∼ 54 %), followed by OVOCs (∼ 27 %), alkenes (∼ 26 %), nitrogen hydrocarbon (∼ 25 %) and other VOCs (∼ 21 %). Additionally, the discrepancy of daytime and nighttime VOC concentrations during different periods was compared (Fig. 4a). The concentration of each VOC group exhibited higher values during the nighttime, which was caused by the low-atmospheric-oxidation condition and the low atmospheric boundary layer height (Maji et al., 2020; Valach et al., 2015).
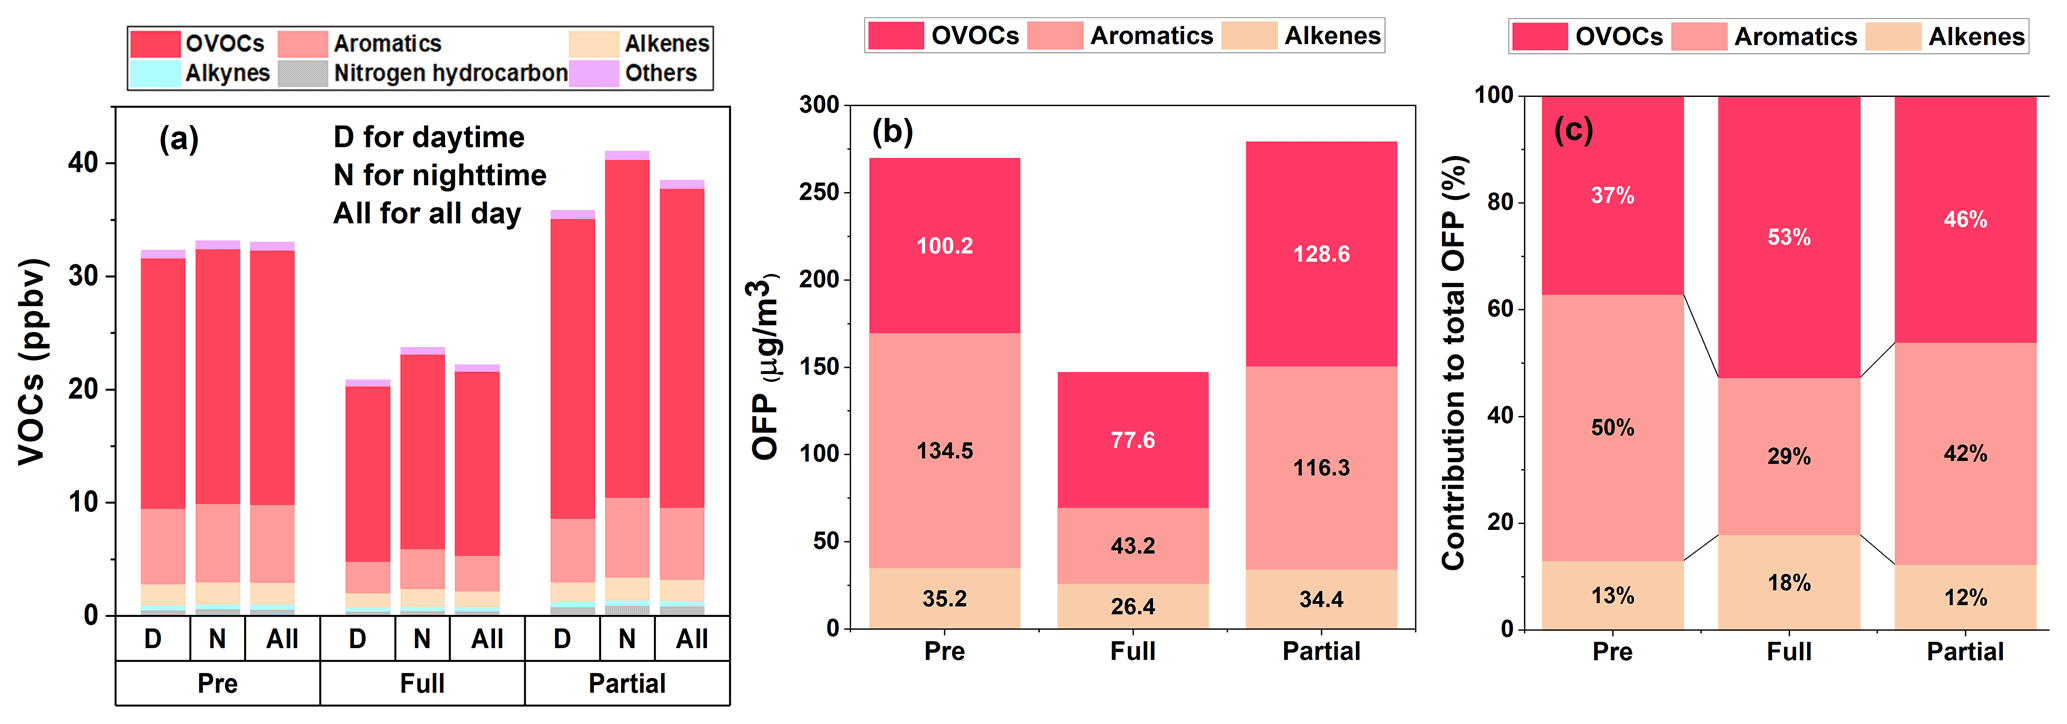
Figure 4Comparison of daytime and nighttime VOCs concentrations (a), average ozone formation potential (OFP) (b), and contribution to total OFP (c) during different periods.
Furthermore, the average concentrations of individual VOCs during different periods are summarized in Fig. 5. A total of 42 VOC species exhibited a U-shape trend during the whole observation, while formaldehyde (HCHO) and methanol showed an obvious increasing pattern. It should be noted that the measurement of HCHO could be strongly influenced by humidity. Since within the drift tube, the back reaction, which reverses the protonated HCHO back into HCHO, is highly humidity dependent (Inomata et al., 2008; Warneke et al., 2011).
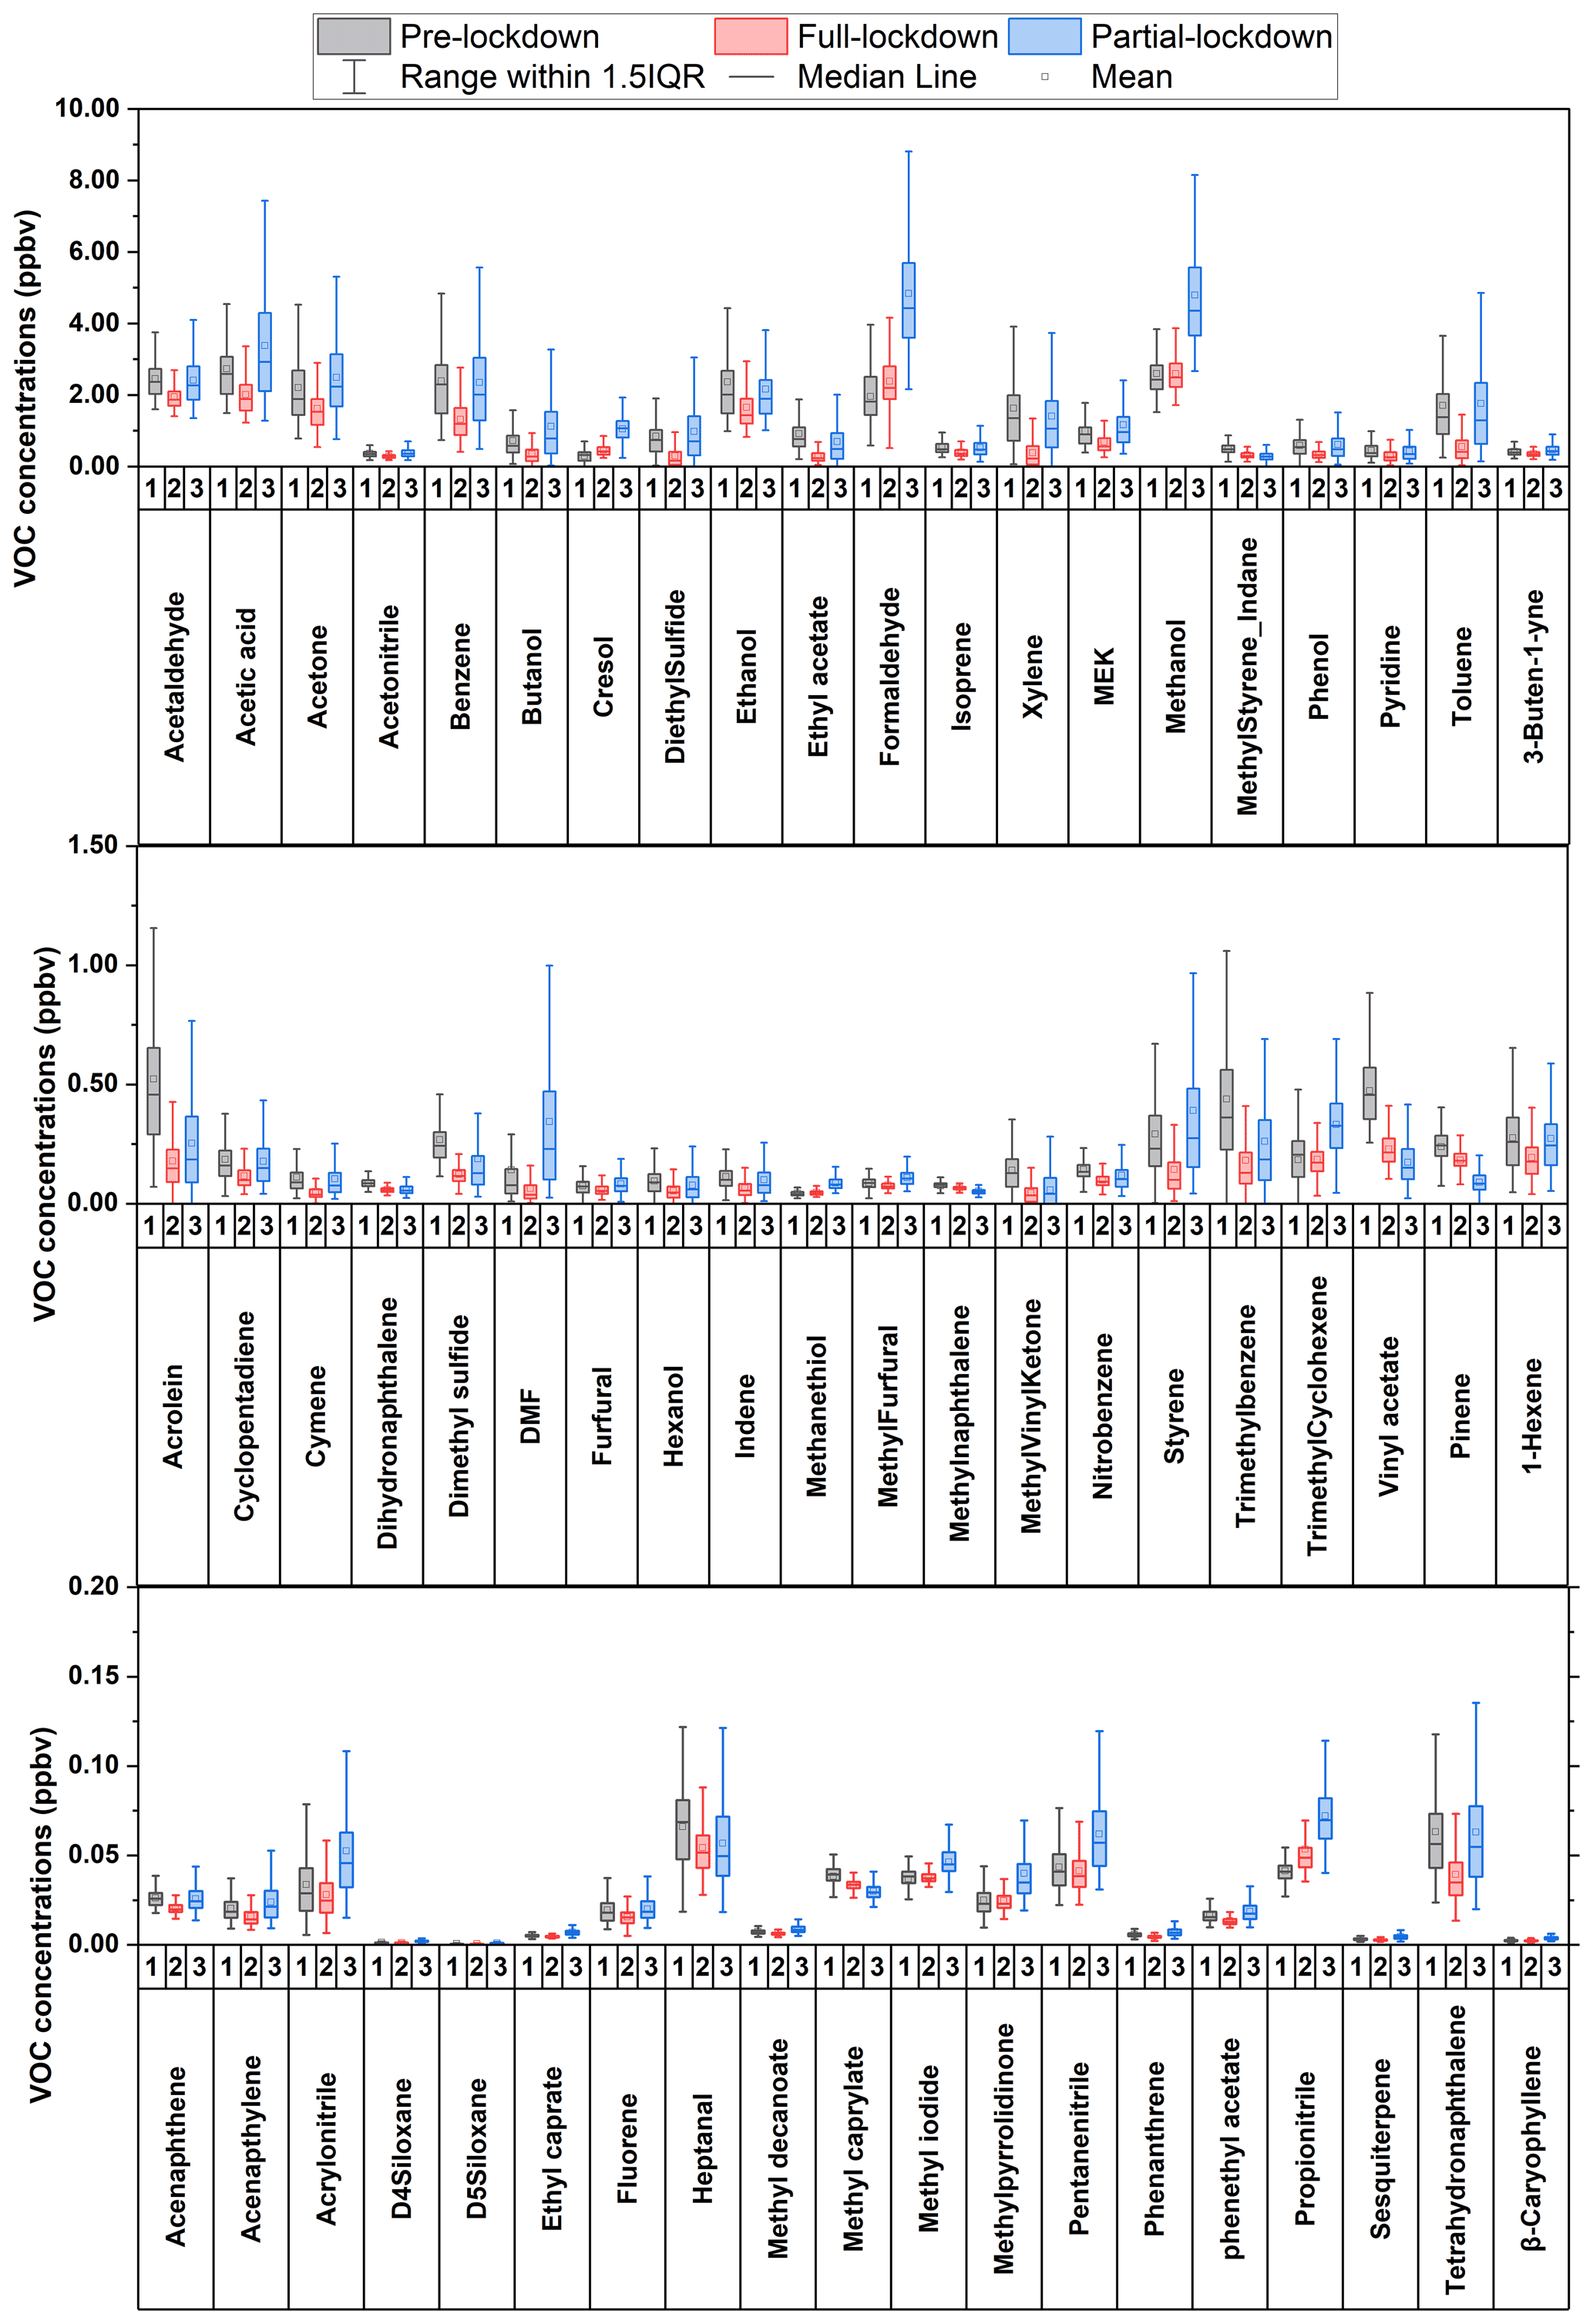
Figure 5Concentrations of individual VOC species during different periods. MEK and DMF are abbreviations of methyl ethyl ketone and dimethylformamide, respectively. IQR denotes interquartile range.
To quantitatively evaluate the changes in individual VOC concentrations from the pre-lockdown to full-lockdown period, when the variations in each VOC are obvious, we applied the MK trend test and Sen's slope analysis based on the hourly average VOC concentration data (Table S3). Table 3 lists the top 10 VOC species with a decreasing pattern (with a negative Q value) from the pre-lockdown to full-lockdown period. Toluene, benzene and xylene exhibited the most significant decreasing pattern, with a slope of 7.73 × 10⁻⁴, 7.36 × 10⁻⁴ and 7.20 × 10⁻⁴ ppbv h−1, respectively. As for NOx and TVOC, the slope was −1.62 × 10⁻² and 5.48 × 10⁻³ ppb h−1 (Table S3). This result is consistent with the drastic drop in industrial activities and traffic volumes, which are key sources of aromatics and NOx, from the pre-lockdown to full-lockdown period. Other VOCs, such as ethyl acetate, acetic acid, acetaldehyde, diethyl sulfide, ethanol, butanol and acrolein, are also tightly associated with industrial processes and thereby showed a decreasing trend from the pre-lockdown to full-lockdown period. Additionally, the average diurnal variations in acetonitrile, dimethyl formamide (DMF) and styrene, which are tracers of biomass burning and industrial emissions, exhibited significant reduction during the full-lockdown period (Fig. S4), also indicating a strong decrease in these emissions. However, formaldehyde and methanol exhibited an increasing trend, with a slope of 12.78 × 10⁻⁴ and 6.35 × 10⁻⁴ ppbv h−1, respectively. This could be explained by the secondary formation of HCHO and methanol, which was promoted under better oxidation conditions in the full-lockdown period.
Table 3Top 10 VOCs with decreasing trend from pre-lockdown to full lockdown.
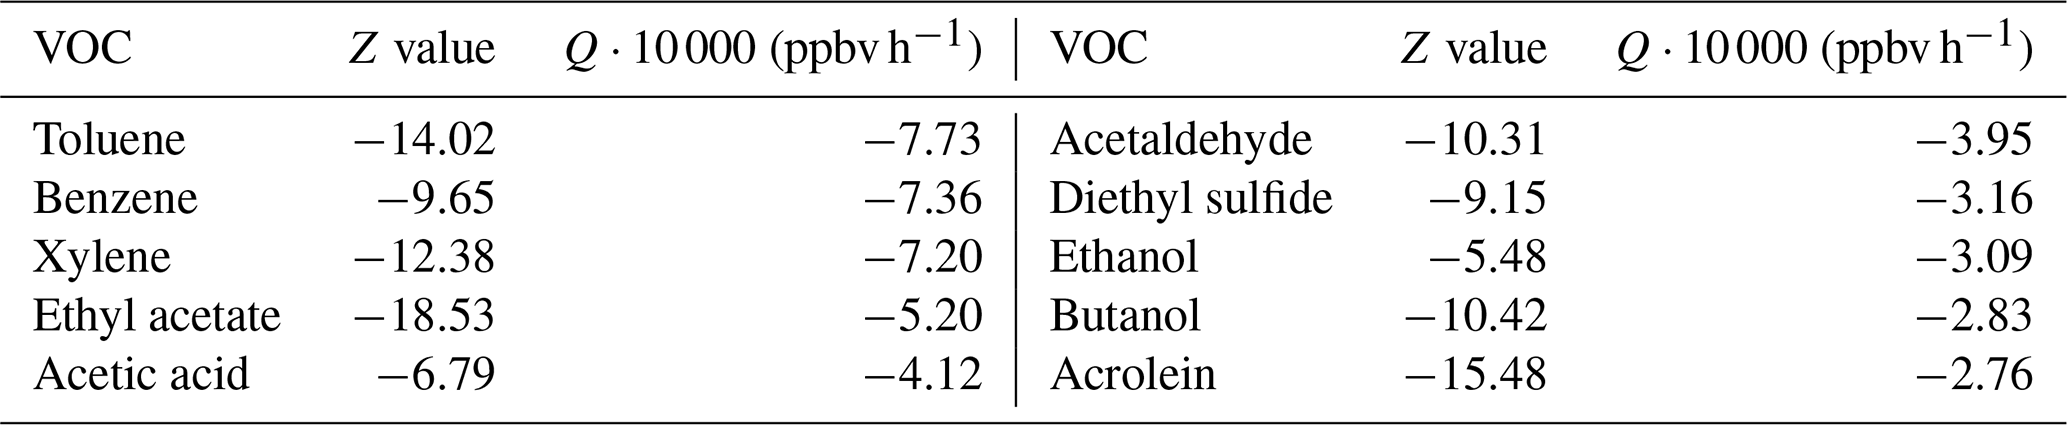

Figure 6Time series of OFP during the whole observation period (dashed lines represent the average OFP value during each period). The date is given in the format month/day/year.
3.2.3 Chemistry perspective
The reactivities of different VOCs vary significantly; hence, ozone formation potential (OFP) is used in this study to assess the potential contribution of active VOCs (including alkenes, aromatics and OVOCs) to O3 formation on the same basis, and it can be calculated by Eq. (5):
where MIRi is the ozone formation potential coefficient for a given VOC species i in the maximum increment reaction of O3, acquired from Carter (2009); [VOCi] is the concentration of VOC species i (in µg m−3). It should be noted that OFP does not indicate O3 concentration but only serves as a reference for the potential O3 produced via the degradation of VOCs. The time series of total OFP is shown in Fig. 6. The average OFP in the pre-lockdown, full-lockdown and partial-lockdown period was 269.4 ± 146.0, 147.2 ± 72.4 and 279.3 ± 168.6 µg m−3, respectively. The trend of the total OFP indicates the drastic decrease in VOC reactivities from the pre-lockdown to full-lockdown period. During the pre-lockdown period, aromatics were the dominant OFP contributor (49 %), followed by OVOCs (38 %) and alkenes (13 %) (Fig. 4). Among VOCs, xylene exhibited the maximum OFP value (68.6 ± 59.3 µg m−3), followed by acetaldehyde (28.8 ± 6.4 µg m−3), toluene (25.7 ± 20.1 µg m−3), trimethylbenzene (25.4 ± 15.8 µg m−3) and formaldehyde (22.7 ± 9.1 µg m−3) (Fig. S5). Compared to the pre-lockdown period, the OFP of aromatics decreased dramatically (−91.2 µg m−3) during the full-lockdown period (Fig. 4b), which was mainly attributed to the rapid decline in human activities (e.g., transportation and industry). However, the OFP of alkenes and OVOCs only decreased by 8.9 and 22.5 µg m−3, respectively. During the observation, the most abundant alkenes measured by the PTR-TOF-MS are 1-hexene and isoprene, with a kOH of 37 and 100 × 10−12 cm3 molec.−1 s−1 (Atkinson and Arey, 2003), respectively, which are much higher than that of the most abundant aromatics (1.22, 5.63 and 17 cm3 molec.−1 s−1 for benzene, toluene and xylene, respectively). The fast degradation of these alkenes could be attributed to the relatively small change in OFP from alkenes. As for OVOCs, the secondary formation could compensate for the decrease in primary emissions. The OFP values of aromatics and alkenes during the pre-lockdown and partial-lockdown period are comparable, but OVOCs exhibited higher OFP contribution (∼ 46 %) in the partial-lockdown period, which could be attributed to the higher AOC and enhanced solar radiation and temperature during the partial-lockdown period. To compare the average reactivity of VOCs during different periods, we calculated the mean maximum incremental reactivity (MIR), derived by dividing the total OFP by total VOC concentration, in each period. A higher MIR means stronger capability of VOCs to produce ozone. As shown in Fig. 7, the average MIR during the pre-lockdown, full-lockdown and partial-lockdown period was 3.85, 3.53 and 3.68 (grams of O3 per gram of VOC), respectively. This result suggests that VOC species composition in full lockdown is more conducive to ozone formation than that in the pre-lockdown and partial-lockdown period. However, the formation of O3 was sensitive to the ratio of and meteorological conditions, which can be significantly different in each period. As shown in Fig. 7, the average ratio in the three periods (shown in) was 1.84, 0.79, and 0.84, respectively, suggesting more NOx was reduced than VOCs during the full-lockdown period, which could further influence the sensitivity of O3 formation.
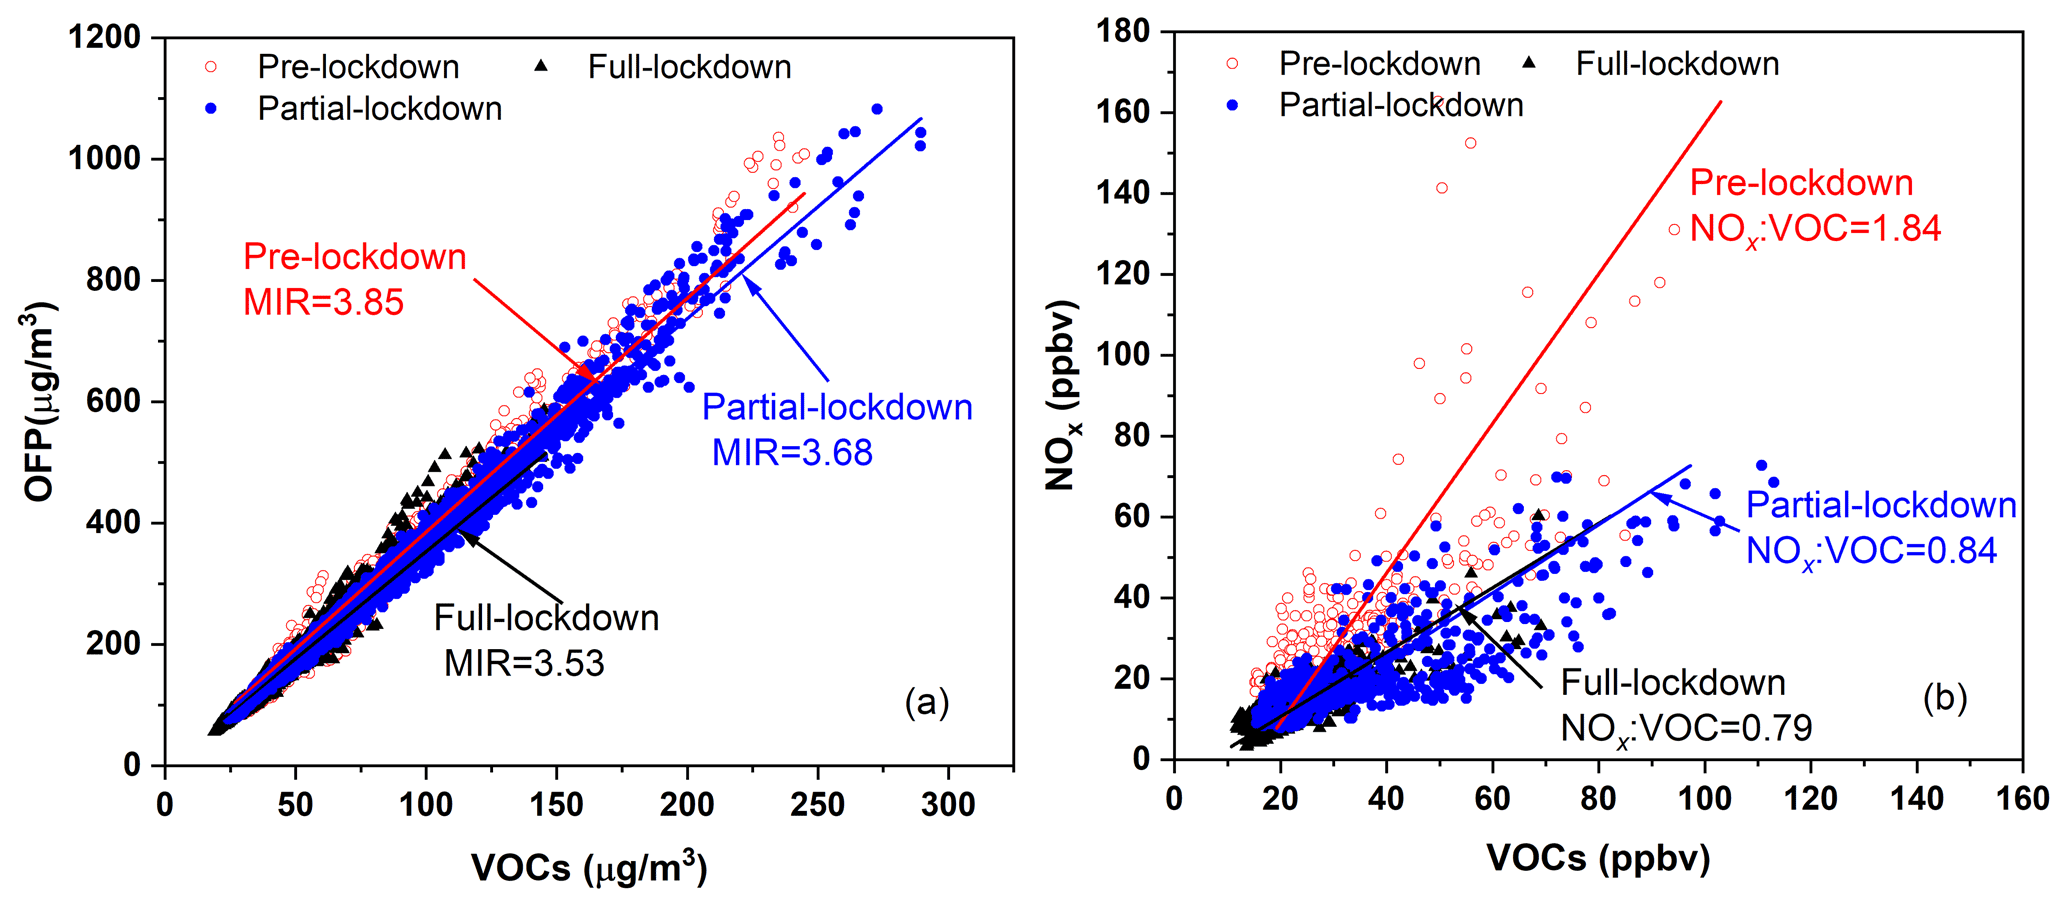

Figure 8Comparison of simulated and observed O3 (a) and simulated daytime OH concentrations (b) in three cases. IOA denotes the index of agreement; NMB denotes normalized mean bias. The date is given in the format month/day/year. The local time zone is UTC+8.
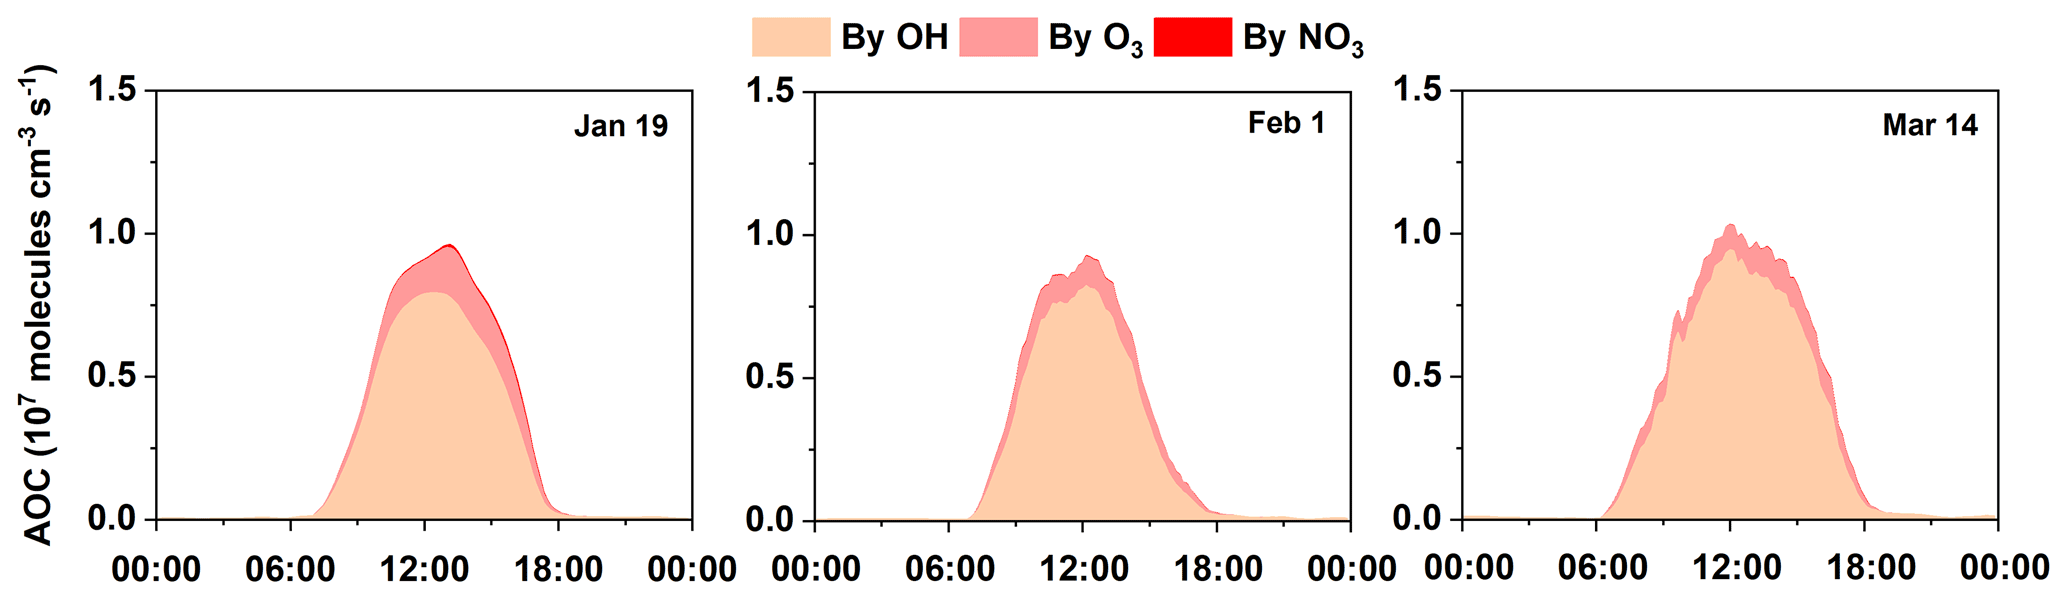
To investigate the detailed formation mechanism of O3 in each period, three cases (19 January, 1 February, 14 March) with stagnant meteorological conditions were chosen. The index of agreement (IOA) of O3 is 0.80, indicating that the model can capture the daytime variation in O3. The simulated daytime OH concentrations exhibited an increasing trend from 19 January to 14 March, with an average value of 0.36 ± 0.27 × 10⁶, 0.75 ± 0.54 × 10⁶ and 1.18 ± 0.78 × 10⁶ molec. cm−3, respectively. This could be attributed to the increasing solar radiation and temperature from January to March. To analyze the atmospheric oxidation, we calculated the AOC according to Eq. (1). The average daytime AOC on 19 January, 1 February and 14 March was 0.26 ± 0.35, 0.23 ± 0.33 and 0.31 ± 0.38 molec. cm−3 s−1, respectively (Fig. 9). Comparatively, these values are much lower than those simulated for Shanghai and Beijing (Liu et al., 2012; Zhu et al., 2020; Zhang et al., 2021) in summer, mainly due to the meteorological conditions in the winter season. It is notable that the simulated OH on 19 January was significantly lower than that on 1 February, but the AOC on 19 January was comparable to that on 1 February. This should be ascribed to the abundant primary pollutants, which efficiently react with OH, during the pre-lockdown period.
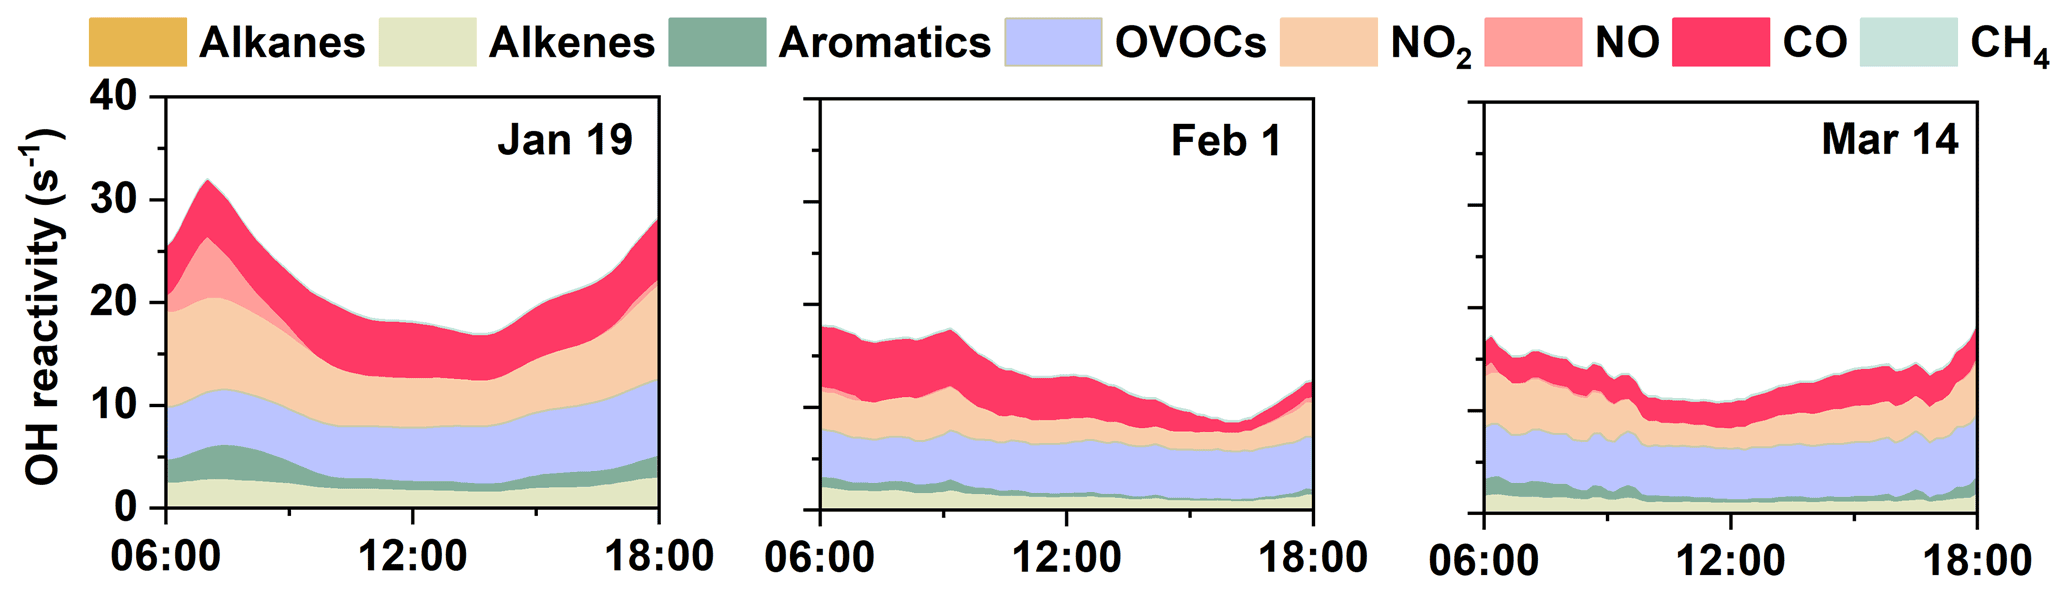
The daytime variations in OH reactivity calculated by the OBM are exhibited in Fig. 10, including the contribution from measured pollutants (e.g., VOCs, NOx and CO) and model-simulated species (OVOCs). Generally, the kOH assessed at Changzhou was in the range of 9–32 s−1, which was comparable to that calculated for other cities in China (e.g., Shanghai 4.6–25 s−1 – Zhu et al., 2020; Chongqing 15–25 s−1 – Tan et al., 2019; and Beijing 15–25 s−1 – Tan et al., 2019). It is obvious that OH reactivity peaked in the morning, with maximum values of 31.76, 17.98 and 17.30 s−1 on 19 January, 1 February and 14 March, respectively. The OH reactivity from NO2 exhibited obvious daytime variation, especially during the morning rush hour, which led to the peak kOH value during the morning. The OH reactivity (kOH) on 1 February was much lower than that in the other two cases, which was mainly due to the abundance of emissions during the pre-lockdown and partial-lockdown period. Compared to 19 January, the kOH from NO2 on 1 February and 14 March showed lower levels, with an average value of 2.62 and 3.35 s−1, respectively. This corresponds with the dramatic drop in traffic volume during lockdown periods. Similarly, compared to 19 January, the kOH values from alkenes and aromatics were lower on 1 February and 14 March. The kOH from OVOCs shared the same trend as OVOC concentration, which reached a minimum value (5.56 s−1) during the full-lockdown period.
To investigate the variation in O3 during different periods, the formation and loss pathways of O3 were calculated (Fig. 11). The formation of O3 (P(O3)) was dominated by HO2+NO and RO2+NO pathways. Although the average MIR during the full-lockdown period was the minimum among the three periods, the P(O3) on 1 February was higher than that on 19 January. This could be attributed to the higher AOC and better photochemical conditions during the full-lockdown period. Similarly, much higher P(O3) was found on 14 March. To avoid the influence of meteorological conditions and test the potential mean O3 concentrations under different ratios, a series of scenario analyses were performed based on the average conditions during the whole observation, and the isopleths of mean O3 concentrations are exhibited in Fig. 12. Note that the values of temperature and photolysis frequencies (J values) in the scenario analyses could be higher than the actual values during the pre-lockdown period and could further lead to overestimation of simulated mean O3 during the pre-lockdown period. Additionally, the VOC concentrations mentioned in this section only represent the VOC species in the MCM. By connecting the inflection points in each O3 isopleth, we obtain the ridge line, which divides the whole regime into NOx-sensitive and VOC-sensitive regimes (Fig. 12). During the pre-lockdown period, the O3 formation was in a VOC-limited regime (triangles in Fig. 12), with an average ratio of 1.84. As for the full-lockdown period, a significant decrease in NOx and VOC emissions was observed, and the ratio dropped to 0.79, which gradually switched the O3 formation to the junction of VOC-limited and NOx-limited regimes, especially on 16 and 17 February (circles in the red rectangle in Fig. 12), when the O3 formation went into NOx-limited regime. During the partial-lockdown period, increasing of VOCs and NOx emission again dragged the formation of O3 back into VOC-limited regime (triangles in Fig. 12). Interestingly, although a great deal of NOx and VOC emissions were diminished during the full-lockdown period, the average mean O3 in full lockdown was supposed to be 2.4 ppbv higher than that in the pre-lockdown period. This result is consistent with the trend of the observed maximum daily 8 h average (MDA8) O3 and the results of the deweathered calculation. Therefore, except for the influence of meteorology, the inapposite reduction ratio and further influence on chemistry were the key reasons for the obvious increase in O3 during the full-lockdown period in Changzhou in 2020.

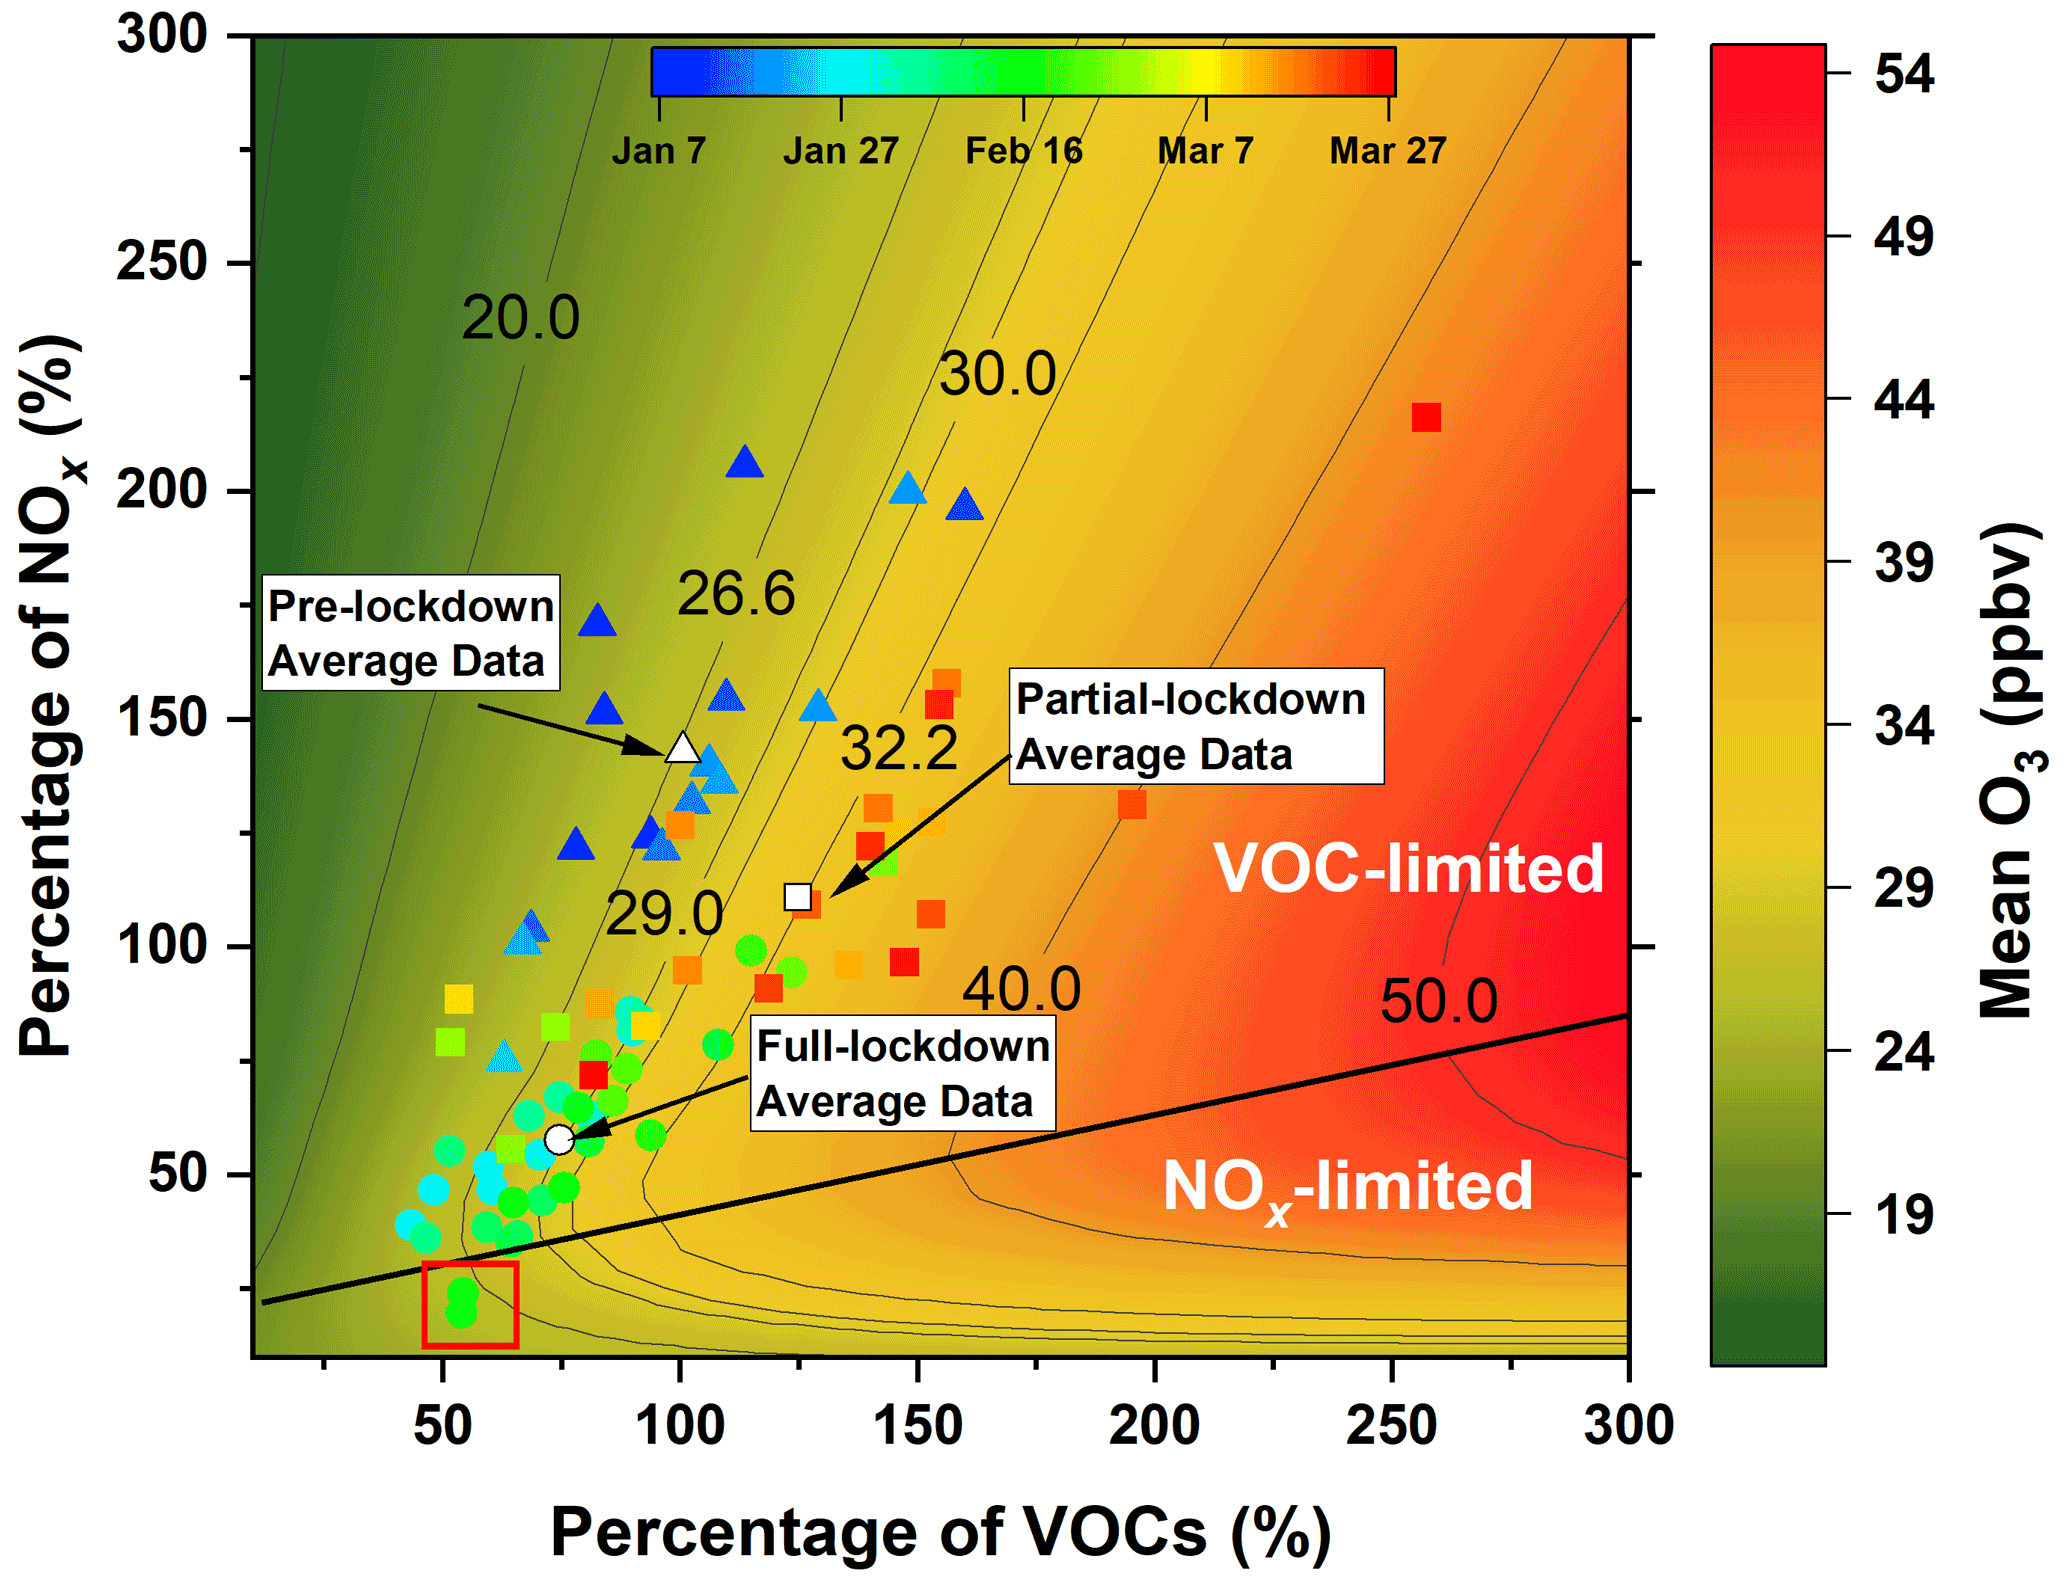
Figure 12Mean O3 isopleth. The colored circles, triangles and rectangles represent the daily average concentrations of NOx and VOCs during the pre-lockdown, full-lockdown and partial-lockdown period, respectively. The white circle, triangle and rectangle indicate the average NOx and VOC concentrations during the pre-lockdown, full-lockdown and partial-lockdown period, respectively.
The scenario analyses raise a question: how much O3 would change as a function of the reduction in NOx and VOCs? Therefore, the reduction percentage of O3 (Δ) during the pre-lockdown period as a function of the reduction in VOCs and NOx was calculated, and the result could be regarded as a potential to control O3 pollution. Based on the VOC species in MCM v3.3.1, we classified the measured VOCs into four groups: alkenes (n-butene), aromatics (including benzene, toluene, phenol, xylene, styrene, cresol and trimethylbenzene), OVOCs (including methanol, ethanol, formaldehyde, aldehyde, acrolein, methyl vinyl ketone, methyl ethyl ketone, ethyl acetate, methyl isobutyl ketone, hexanol and heptanal) and biogenic VOCs (BVOCs, including isoprene, pinene and caryophyllene). The results in Fig. 13a indicate that more reduction potential of O3 could be achieved by diminishing aromatics, followed by BVOCs, OVOCs and alkenes. It should be noted that many light alkanes and active alkenes, such as ethene and propene, could not be measured by the PTR-TOF-MS and might further lead to the underestimation of ozone production from alkanes and alkenes. Additionally, this comparison has a drawback of being influenced by the concentrations of VOCs. To normalize the influence of concentrations of VOCs, the descent rate of O3 (ΔO3 (ppbv) ΔVOCs (ppbv)) as a function of the reduction percentage of VOCs was calculated (Fig. 13b). O3 exhibited the highest dependence on BVOCs, with an average descent rate of 3.74 ± 0.09 ppbv ppbv−1. Differing from the result in Fig. 13a, diminishing alkenes could lead to a decrease in O3 by an average declining rate of 1.69 ± 0.01 ppbv ppbv−1. On the contrary, a reduction in NOx would lead to an increase in O3, with an average rate of 1.29 ± 0.21 ppbv ppbv−1 (Fig. S6). Although the descent rate of O3 started to decrease and the sensitivity of O3 formation entered a NOx-limited regime when over 70 % of NOx was eliminated, it still caused a net increase in O3.
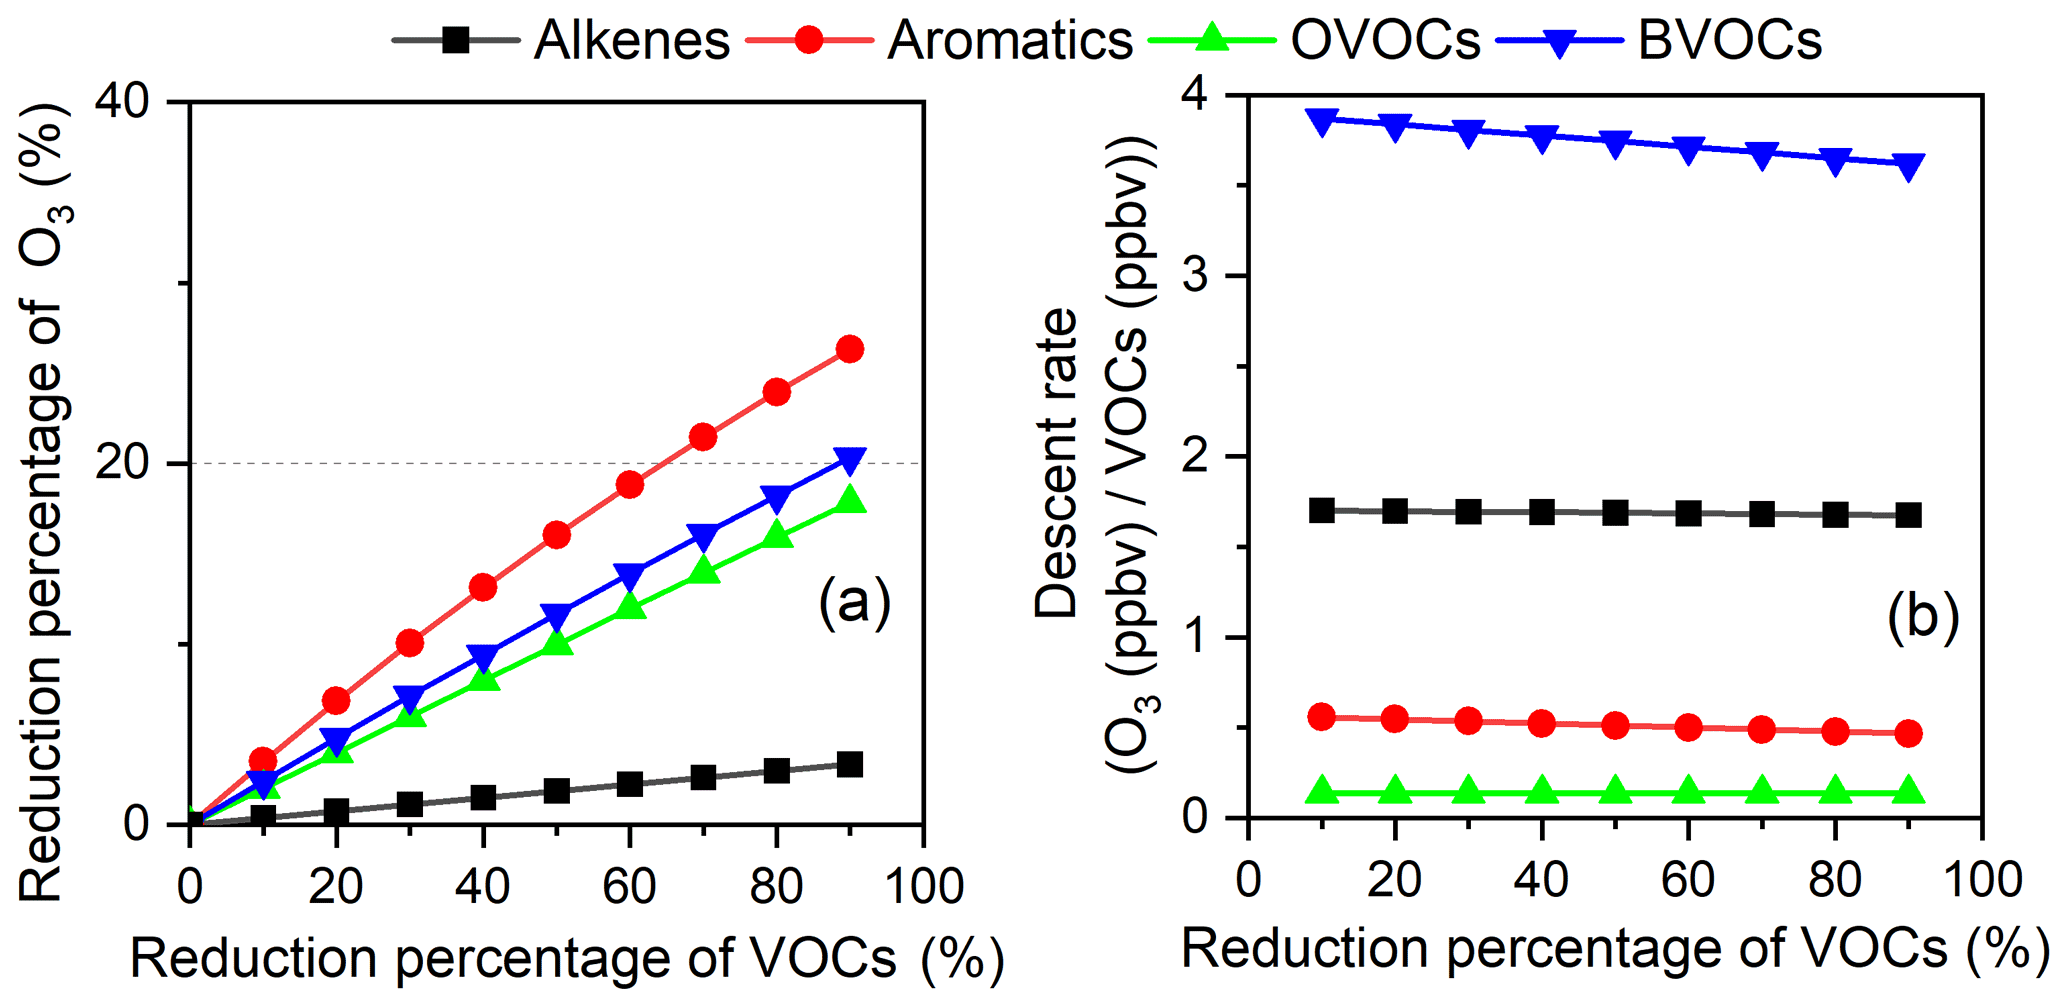
Figure 13Reduction percentage of O3 as a function of the reduction percentage of VOCs (a); descent rate of O3 as a function of the reduction percentage of VOCs (b).
Although diminishing BVOCs seems to the most efficient way to restrain O3 pollution, most BVOCs were emitted directly from plants and could not be easily controlled. Besides, a huge number of OVOCs (such as formaldehyde, aldehyde, methanol, ethanol, methyl vinyl ketone, methyl ethyl ketone) could be directly emitted from anthropogenic processes or secondarily generated from the oxidation of precursors (such as alkenes and aromatics), which complicates the control of OVOCs. Therefore, considering the reduction potential and descent rate of O3, more efforts are needed for the control of alkenes and aromatics.
3.3 Uncertainty analysis
Due to limitations in the observations, several issues should be noted in the application of the OBM to evaluate the local chemistry in the present study. Firstly, deficiency of the observation of C2–C5 alkenes and alkanes could lead to underestimation of the simulated O3. We can only obtain the C2–C5 alkene and alkane concentrations from the observation during the autumn of 2018 at the same site. To analyze the uncertainties from this disadvantage, we have performed simulation by including assumed diurnal variation in ethene, propene, butene, ethane, propane and butane, which are key C2–C5 alkenes and alkanes at this site, in the model. On average, adding 0.5–2 times more alkenes and alkanes could lead to a 1.65 %–9.49 % or 1.37 %–5.36 % increase in simulated daytime O3, respectively (Figs. S7 and S8). In addition, the deficiency of C2–C5 has potential to cause uncertainty in O3 formation potential. To quantify this impact, the empirical kinetics modeling approach (EKMA) analysis with the hypothetical diurnal variation in C2–C5 was also performed. Generally, adding C2–C5 alkenes and alkanes in the model would lead to an increase in the simulated O3 and could slightly shift the O3 isopleth to the right without changing the isopleth shape (Fig. S9). Therefore, the deficiency of C2–C5 alkenes and alkanes could result in additional uncertainties in O3 simulation (both time series and EKMA). It should be noted that, this sensitivity analysis is based on the “hypothetical” diurnal variation in C2–C5 alkenes and alkanes, which would bring in uncertainty. We hope a wider range of VOCs will be monitored simultaneously in future field campaigns to avoid this deficiency. Secondly, the photolysis frequencies (J values) were calculated as a function of solar zenith angle and altitude using lookup tables, calculated using the Tropospheric Ultraviolet and Visible (TUV) model, which could lead to uncertainty in the simulation of O3. Hence, we analysis the influence of J values by increasing or decreasing the photolysis rates by 10 % and 20 %. Results showed that the simulated O3 could decrease or increase by 25.14 % or 21.73 %, respectively, when photolysis rates were decreased or increased by 20 % (Fig. S10). In addition, the J values, which directly or indirectly influence the recycling of ROx, could lead to uncertainty in the calculation of AOC and kOH. Based on the above sensitivity analysis, we found the relative changes in AOC and kOH by 1 % changes in J values were 1.07 % and 0.14 %, respectively. Therefore, the J values are recommended to be measured during future observations.
After the outbreak of COVID-19, strict epidemic prevention measures were adopted throughout China, leading to a dramatic decrease in traffic volume and industrial activities. Affected by the decrease in the number of vehicles on the road, non-essential industrial productivity and associated pollutant emissions, most of the air pollutants (e.g., PM2.5, PM10, NO, NO2, SO2 and VOCs) dropped to a lower level during the lockdown period (especially during the full-lockdown period). However, O3 increased compared to that during the same period in 2019 in many urban areas of China. To figure out the reasons for this obvious increase in O3, the characteristics of O3 precursors (NOx, VOCs) during the pre-lockdown, full-lockdown and partial-lockdown periods in Changzhou were analyzed. Although this study was conducted in a single city of China, the representativeness of Changzhou guaranteed the applicability of the results to the YRD region. Results suggested that the decrease in human activities during the full-lockdown period significantly suppressed the emissions of NOx and VOCs, which further led to a dramatic drop in the concentrations of most VOCs, especially aromatics. As a result, the ratios dropped from 1.84 during the pre-lockdown period to 0.79 during the full-lockdown period. By deweathered calculation, we found that meteorology constrained O3 concentration by 3.9 ppbv during the full-lockdown period in 2019 but exhibited negligible influence on that during the same period in 2020. However, compared to the full-lockdown period in 2019, changes in precursor emissions led to a 1.46 ppbv increase in O3 concentrations during the same period in 2020. To verify this result, a box model was used to simulate the formation of O3. Results show that the AOC level during full lockdown was comparable to that during the pre-lockdown period, but the formation rate of O3 was much higher during the full-lockdown period. By scenario analysis, we found the decrease in NOx and VOCs in the full-lockdown period dragged the formation of O3 from a VOC-sensitive regime to the junction of a VOC- and NOx-limited regime, and the average simulated mean O3 in the full-lockdown period could be 2.4 ppbv higher than that in the pre-lockdown period. Although the deweathered model and OBM show differences in the emission-derived change in O3, the results together point out that the inapposite reduction in NOx and VOCs was the key reason for the obvious increase in O3 during the full-lockdown period in 2020. Overall, the outbreak of COVID-19 has caused devastation across the world. However, it provided an opportunity for an extreme experiment to investigate the O3 formation under strict emission control policies and provided insights into the policy formulation for diminishing O3 pollution in the YRD region. The data indicate that the concentrations of VOCs and NOx have changed dramatically during the pandemic, a common situation also found in other Chinese cities, and led to a switch of O3 formation sensitivity. These results have a clear indication that, in the future, more efforts should be devoted to the reduction ratio of anthropogenic VOCs and NOx.
The source code of the OBM model is available on GitHub (https://github.com/AirChem/F0AM; Wolfe et al., 2016).
The data used for MK and OBM analysis are available by contacting the corresponding author.
The supplement related to this article is available online at: https://doi.org/10.5194/acp-22-4853-2022-supplement.
KZ designed the study, performed OBM analysis, wrote the paper and coordinated the co-authors' contributions. ZL analyzed the data and wrote the paper. XZ, QL, AJ, WT, LH, YW and JdG contributed to data analysis and interpretation of results. LL reviewed the paper and provided comments for improving the paper.
The contact author has declared that neither they nor their co-authors have any competing interests.
Publisher's note: Copernicus Publications remains neutral with regard to jurisdictional claims in published maps and institutional affiliations.
We are grateful to Stuart K. Grange for many helpful suggestions on the machine-learning analysis. We would also like to thank the handling editor and three anonymous reviewers for their constructive comments that have significantly improved the quality of this paper.
This study was financially sponsored by the National Natural Science Foundation of China (grant nos. 42075144, 41875161 and 42005112).
This paper was edited by Andrea Pozzer and reviewed by three anonymous referees.
Alhathloul, S. H., Khan, A. A., and Mishra, A. K.: Trend analysis and change point detection of annual and seasonal horizontal visibility trends in Saudi Arabia, Theor. Appl. Climatol., 144, 127–146, https://doi.org/10.1007/s00704-021-03533-z, 2021.
Atkinson, R. and Arey, J.: Atmospheric degradation of volatile organic compounds, Chem. Rev., 103, 4605–4638, https://doi.org/10.1021/cr0206420, 2003.
Jensen, A., Liu, Z. Q., Tan, W., Dix, B., Chen, T. S., Koss, A., Zhu, L., Li, Li., and Gouw, J.: Measurements of volatile organic compounds during the COVID-19 Lockdown in Changzhou, China, Geophys. Res. Lett., 48, 20, https://doi.org/10.1029/2021GL095560, 2021.
Carter, W.: Updated maximum incremental reactivity scale and hydrocarbon bin reactivities for regulatory applications, California Air Resources Board Contract, 339, 2009.
Cheng, Z., Zhang, J., Zhou, J., Sun, J., Zhou, W., Chen, C., Zheng, J., and Wang, T.: Air pollutant emission inventory and distribution characteristics in Changzhou, The Administration and Technique of Environmental Monitoring, 28, 24–28, 2016 (in Chinese).
Fan, L., Fu, S., Wang, X., Fu, Q., Jia, H., Xu, H., Qin, G., Hu, X., and Cheng, J.: Spatiotemporal variations of ambient air pollutants and meteorological influences over typical urban agglomerations in China during the COVID-19 lockdown, J. Environ. Sci. (China), 106, 26–38, https://doi.org/10.1016/j.jes.2021.01.006, 2021.
Fu, X., Wang, S., Zhao, B., Xing, J., Cheng, Z., Liu, H., and Hao, J.: Emission inventory of primary pollutants and chemical speciation in 2010 for the Yangtze River Delta region, China, Atmos. Environ., 70, 39–50, https://doi.org/10.1016/j.atmosenv.2012.12.034, 2013.
Gao, C., Li, S., Liu, M., Zhang, F., Achal, V., Tu, Y., Zhang, S., and Cai, C.: Impact of the COVID-19 pandemic on air pollution in Chinese megacities from the perspective of traffic volume and meteorological factors, Sci. Total Environ., 773, 145545, https://doi.org/10.1016/j.scitotenv.2021.145545, 2021.
Geyer, A., Alicke, B., Konrad, S., Schmitz, T., Stutz, J., and Platt, U.: Chemistry and oxidation capacity of the nitrate radical in the continental boundary layer near Berlin, J. Geophys. Res.-Atmos., 106, 8013–8025, https://doi.org/10.1029/2000JD900681, 2001.
Grange, S. and Carslaw, D.: Using meteorological normalisation to detect interventions in air quality time series, Sci. Total Environ., 653, 578–588, https://doi.org/10.1016/j.scitotenv.2018.10.344, 2019.
Huang, L., Liu, Z., Li, H., Wang, Y., Li, Y., Zhu, Y., Ooi, M. C. G., An, J., Shang, Y., Zhang, D., Chan, A., and Li, L.: The silver lining of COVID-19: Estimation of short-term health impacts due to Lockdown in the Yangtze River Delta region, China, GeoHealth, 4, e2020GH000272, https://doi.org/10.1029/2020GH000272, 2020.
Inomata, S., Tanimoto, H., Kameyama, S., Tsunogai, U., Irie, H., Kanaya, Y., and Wang, Z.: Technical Note: Determination of formaldehyde mixing ratios in air with PTR-MS: laboratory experiments and field measurements, Atmos. Chem. Phys., 8, 273–284, https://doi.org/10.5194/acp-8-273-2008, 2008.
Li, L., An, J., Huang, L., Yan, R., Huang, C., and Yarwood, G.: Ozone source apportionment over the Yangtze River Delta region, China: Investigation of regional transport, sectoral contributions and seasonal differences, Atmos. Environ., 202, 269–280, https://doi.org/10.1016/j.atmosenv.2019.01.028, 2019.
Li, L., Li, Q., Huang, L., Wang, Q., Zhu, A., Xu, J., Liu, Z., Li, H., Shi, L., Li, R., Azari, M., Wang, Y., Zhang, X., Liu, Z., Zhu, Y., Zhang, K., Xue, S., Ooi, M. C. G., Zhang, D., and Chan, A.: Air quality changes during the COVID-19 lockdown over the Yangtze River Delta Region: An insight into the impact of human activity pattern changes on air pollution variation, Sci. Total Environ., 732, 139282, https://doi.org/10.1016/j.scitotenv.2020.139282, 2020.
Li, R., Zhao, Y., Fu, H., Chen, J., Peng, M., and Wang, C.: Substantial changes in gaseous pollutants and chemical compositions in fine particles in the North China Plain during the COVID-19 lockdown period: anthropogenic vs. meteorological influences, Atmos. Chem. Phys., 21, 8677–8692, https://doi.org/10.5194/acp-21-8677-2021, 2021.
Liu, Z., Wang, Y., Gu, D., Zhao, C., Huey, L. G., Stickel, R., Liao, J., Shao, M., Zhu, T., Zeng, L., Amoroso, A., Costabile, F., Chang, C.-C., and Liu, S.-C.: Summertime photochemistry during CAREBeijing-2007: ROx budgets and O3 formation, Atmos. Chem. Phys., 12, 7737–7752, https://doi.org/10.5194/acp-12-7737-2012, 2012.
Maji, S., Beig, G., and Yadav, R.: Winter VOCs and OVOCs measured with PTR-MS at an urban site of India: Role of emissions, meteorology and photochemical sources, Environ. Pollut., 258, 113651, https://doi.org/10.1016/j.envpol.2019.113651, 2020.
Pathakoti, M., Santhoshi, T., Aarathi, M., Mahalakshmi, D. V., Kanchana, A. L., Srinivasulu, J., Shekhar, R. S. S., Soni, V. K., Sai, S. M. V. R., and Raja, P. T: Assessment of spatio-temporal climatological trends of ozone over the Indian region using machine learning, Spat. Stat., 43, 100513, https://doi.org/10.1016/j.spasta.2021.100513, 2021.
Sen, P. K.: Estimates of the regression coefficient based on Kendall's tau, J. Am. Stat. Assoc., 63, 1379–1389, 1968.
Shen, L., Zhao, T., Wang, H., Liu, J., Bai, Y., Kong, S., Zheng, H., Zhu, Y., and Shu, Z.: Importance of meteorology in air pollution events during the city lockdown for COVID-19 in Hubei Province, Central China, Sci. Total Environ., 754, 142227, https://doi.org/10.1016/j.scitotenv.2020.142227, 2021.
Shi, X., Ge, Y., Zheng, J., Ma, Y., Ren, X., and Zhang, Y.: Budget of nitrous acid and its impacts on atmospheric oxidative capacity at an urban site in the central Yangtze River Delta region of China, Atmos. Environ., 238, 117725, https://doi.org/10.1016/j.atmosenv.2020.117725, 2020.
Sun, K., Zhou, J., Ding, H., Chen, X., Liu, Z., and Xue, P.: Anthropogenic source VOCs emission inventory of Changzhou city, Environmental Monitoring and Forewarning, 11, 57–62, 2019 (in Chinese).
Tan, Z., Lu, K., Jiang, M., Su, R., Wang, H., Lou, S., Fu, Q., Zhai, C., Tan, Q., Yue, D., Chen, D., Wang, Z., Xie, S., Zeng, L., and Zhang, Y.: Daytime atmospheric oxidation capacity in four Chinese megacities during the photochemically polluted season: a case study based on box model simulation, Atmos. Chem. Phys., 19, 3493–3513, https://doi.org/10.5194/acp-19-3493-2019, 2019.
Valach, A. C., Langford, B., Nemitz, E., MacKenzie, A. R., and Hewitt, C. N.: Seasonal and diurnal trends in concentrations and fluxes of volatile organic compounds in central London, Atmos. Chem. Phys., 15, 7777–7796, https://doi.org/10.5194/acp-15-7777-2015, 2015.
Venter, Z. S., Aunan, K., Chowdhury, S., and Lelieveld, J.: COVID-19 lockdowns cause global air pollution declines, P. Natl. Acad. Sci. USA, 117, 18984–18990, https://doi.org/10.1073/pnas.2006853117, 2020.
Warneke, C., Veres, P., Holloway, J. S., Stutz, J., Tsai, C., Alvarez, S., Rappenglueck, B., Fehsenfeld, F. C., Graus, M., Gilman, J. B., and de Gouw, J. A.: Airborne formaldehyde measurements using PTR-MS: calibration, humidity dependence, inter-comparison and initial results, Atmos. Meas. Tech., 4, 2345–2358, https://doi.org/10.5194/amt-4-2345-2011, 2011.
Wolfe, G. M., Marvin, M. R., Roberts, S. J., Travis, K. R., and Liao, J.: The Framework for 0-D Atmospheric Modeling (F0AM) v3.1, Geosci. Model Dev., 9, 3309–3319, https://doi.org/10.5194/gmd-9-3309-2016, 2016 (code available at: https://github.com/AirChem/F0AM, last access: 7 March 2022).
Xu, L., Zhang, J., Sun, X., Xu, S., Shan, M., Yuan, Q., Liu, L., Du, Z., Liu, D., Xu, D., Song, C., Liu, B., Lu, G., Shi, Z., and Li, W.: Variation in concentration and sources of black carbon in a megacity of China during the COVID-19 pandemic, Geophys. Res. Lett., 47, e2020GL090444, https://doi.org/10.1029/2020GL090444, 2020.
Zhang, D., Cong, Z., and Ni, G.: Comparison of three Mann-Kendall methods based on the China's meteorological data, Advances in Water Science, 24, 490–496, 2013 (in Chinese).
Zhang, K., Li, L., Huang, L., Wang, Y., Huo, J., Duan, Y., Wang, Y., and Fu, Q.: The impact of volatile organic compounds on ozone formation in the suburban area of Shanghai, Atmos. Environ., 232, 117511, https://doi.org/10.1016/j.atmosenv.2020.117511, 2020a.
Zhang, K., Xu, J., Huang, Q., Zhou, L., Fu, Q., Duan, Y., and Xiu, G.: Precursors and potential sources of ground-level ozone in suburban Shanghai, Front. Env. Sci. Eng., 14, 96, https://doi.org/10.1007/s11783-020-1271-8, 2020b.
Zhang, K., Huang, L., Li, Q., Huo, J., Duan, Y., Wang, Y., Yaluk, E., Wang, Y., Fu, Q., and Li, L.: Explicit modeling of isoprene chemical processing in polluted air masses in suburban areas of the Yangtze River Delta region: radical cycling and formation of ozone and formaldehyde, Atmos. Chem. Phys., 21, 5905–5917, https://doi.org/10.5194/acp-21-5905-2021, 2021.
Zhang, P., Chen, T., Liu, J., Chu, B., Ma, Q., Ma, J., and He, H.: Impacts of mixed gaseous and particulate pollutants on secondary particle formation during ozonolysis of butyl vinyl ether, Environ. Sci. Technol., 54, 3909–3919, https://doi.org/10/gpd9p2, 2020.
Zheng, H., Kong, S., Chen, N., Yan, Y., Liu, D., Zhu, B., Xu, K., Cao, W., Ding, Q., Lan, B., Zhang, Z., Zheng, M., Fan, Z., Cheng, Y., Zheng, S., Yao, L., Bai, Y., Zhao, T., and Qi, S.: Significant changes in the chemical compositions and sources of PM2.5 Wuhan since the city lockdown as COVID-19, Sci. Total Environ., 739, 140000, https://doi.org/10.1016/j.scitotenv.2020.140000, 2020.
Zhu, J., Wang, S., Wang, H., Jing, S., Lou, S., Saiz-Lopez, A., and Zhou, B.: Observationally constrained modeling of atmospheric oxidation capacity and photochemical reactivity in Shanghai, China, Atmos. Chem. Phys., 20, 1217–1232, https://doi.org/10.5194/acp-20-1217-2020, 2020.