the Creative Commons Attribution 4.0 License.
the Creative Commons Attribution 4.0 License.
 | 11 Mar 2022
Amplified role of potential HONO sources in O3 formation in North China Plain during autumn haze aggravating processes
Jingwei Zhang
Chaofan Lian
Yitian Guo
Haiyan Ran
Yusheng Zhang
Feixue Zheng
Xiaolong Fan
Kaspar R. Daellenbach
Yongchun Liu
Markku Kulmala
Co-occurrences of high concentrations of PM2.5 and ozone (O3) have been frequently observed in haze-aggravating processes in the North China Plain (NCP) over the past few years. Higher O3 concentrations on hazy days were hypothesized to be related to nitrous acid (HONO), but the key sources of HONO enhancing O3 during haze-aggravating processes remain unclear. We added six potential HONO sources, i.e., four ground-based (traffic, soil, and indoor emissions, and the NO2 heterogeneous reaction on ground surface (Hetground)) sources, and two aerosol-related (the NO2 heterogeneous reaction on aerosol surfaces (Hetaerosol) and nitrate photolysis (Photnitrate)) sources into the WRF-Chem model and designed 23 simulation scenarios to explore the unclear key sources. The results indicate that ground-based HONO sources producing HONO enhancements showed a rapid decrease with height, while the NO + OH reaction and aerosol-related HONO sources decreased slowly with height. Photnitrate contributions to HONO concentrations were enhanced with aggravated pollution levels. The enhancement of HONO due to Photnitrate on hazy days was about 10 times greater than on clean days and Photnitrate dominated daytime HONO sources (∼ 30 %–70 % when the ratio of the photolysis frequency of nitrate (Jnitrate) to gas nitric acid () equals 30) at higher layers (>800 m). Compared with that on clean days, the Photnitrate contribution to the enhanced daily maximum 8 h averaged (DMA8) O3 was increased by over 1 magnitude during the haze-aggravating process. Photnitrate contributed only ∼ 5 % of the surface HONO in the daytime with a ratio of 30 but contributed ∼ 30 %–50 % of the enhanced O3 near the surface in NCP on hazy days. Surface O3 was dominated by volatile organic compound-sensitive chemistry, while O3 at higher altitudes (>800 m) was dominated by NOx-sensitive chemistry. Photnitrate had a limited impact on nitrate concentrations (<15 %) even with a ratio of 120. These results suggest the potential but significant impact of Photnitrate on O3 formation, and that more comprehensive studies on Photnitrate in the atmosphere are still needed.
- Article
(7295 KB) - Full-text XML
-
Supplement
(1837 KB) - BibTeX
- EndNote


Nitrous acid (HONO) is an important source of the hydroxyl radical (OH) through its photolysis (Reaction R1), and contributes ∼ 20 %–80 % of primary OH production (Alicke et al., 2002; Hendrick et al., 2014; Kim et al., 2014).
Although 40 years have passed since the first detection of HONO in the atmosphere (Perner and Platt, 1979), the sources of HONO (especially daytime) and the dynamic parameters of HONO formation mechanisms are still not well understood (Ge et al., 2021). Current air quality models with the default gas-phase reaction (the reverse reaction of Reaction R1) always significantly underestimate HONO observations, resulting in low atmospheric oxidation capacity and in underestimation of secondary pollutants such as ozone (O3) (Li et al., 2010, 2011; Sarwar et al., 2008; Zhang et al., 2016, 2019a).
HONO sources can be generally classified into three categories, i.e., direct emissions and homogeneous and heterogeneous reactions. Direction emissions are mainly from traffic (Kramer et al., 2020; Kurtenbach et al., 2001; Liao et al., 2021), soil (Kubota and Asami, 1985; Oswald et al., 2013; Wu et al., 2019; Xue et al., 2021), biomass burning (Cui et al., 2021; Rondon and Sanhueza, 1989; Theys et al., 2020), and indoor combustion processes (Klosterkother et al., 2021; Liu et al., 2019; Pitts et al., 1985). The reaction of nitric oxide (NO) with OH (Pagsberg et al., 1997; Stuhl and Niki, 1972) is usually thought to be the dominant homogeneous reaction and is significant during daytime, but may be neglected at night due to low OH concentrations, other minor homogeneous HONO sources including nucleation of NO2, H2O, and NH3 (Zhang and Tao, 2010), via the photolysis of ortho-nitrophenols (Bejan et al., 2006; Chen et al., 2021; Lee et al., 2016), via the electronically excited NO2 and H2O (Crowley and Carl, 1997; Dillon and Crowley, 2018; Li et al., 2008) and via HO2•H2O + NO2 reaction (Li et al., 2015, 2014; Ye et al., 2015). The heterogeneous reactions mainly include nitrogen dioxide (NO2) hydrolysis and reduction reactions on various humid surfaces (Finlayson-Pitts et al., 2003; Ge et al., 2019; Gómez Alvarez et al., 2014; Ma et al., 2013; Marion et al., 2021; Sakamaki et al., 1983; Tang et al., 2017; W. Yang et al., 2021) and nitrate photolysis (Photnitrate) (Romer et al., 2018; Ye et al., 2016a, b; Zhou et al., 2003), and are usually considered the main contributors to HONO concentrations in the atmosphere.
Among these potential HONO sources, the photolysis of nitrate to produce HONO in the atmosphere has received extensive attention over the past few years, and the Photnitrate frequency (Jnitrate) is still debated (Gen et al.., 2022). In laboratory studies, some researchers (Bao et al., 2018; Ye et al., 2016a, 2017) showed that Photnitrate was an important HONO source, the measured Jnitrate was 1–3 orders larger than the gas nitric acid (HNO3) photolysis frequency () and could reach up to 10−4 s−1. Furthermore, a number of substances including humic acid (Yang et al., 2018), sulfate (Bao et al., 2020), and TiO2 (Xu et al., 2021) might enhance the reaction significantly; while Shi et al. (2021) found that the ratio was <10 when using suspended submicron particulate sodium and ammonium nitrate rather than PM2.5 samples. In field studies combined with model simulations, Kasibhatla et al. (2018) compared NOx observations from the Cape Verde Atmospheric Observatory with GEOS-Chem (Goddard Earth Observing System-Chemistry) model simulations and reported a ratio of 25–50; Romer et al. (2018) reported a ratio of <30 based on observations of NOx (= NO + NO2) and HNO3 over the Yellow Sea and a box model simulation, while larger ratios (e.g., 300) were inconsistent with the observed NOx to HNO3 ratios. Adopting a ratio of ∼ 120 could greatly improve daytime surface HONO simulations (contributed ∼ 30 %–40 % of noontime HONO) by using the Community Multiscale Air Quality model (CMAQ) in the Pearl River Delta (Fu et al., 2019) or a box model in the Yangtze River Delta (Shi et al., 2020), whereas a ratio of 30 produced negligible HONO in clean periods (∼ 2 %) and slightly higher HONO in heavy haze periods (∼ 8 %) in the North China Plain (NCP) by using a box model (Xue et al., 2020) and ∼ 1 % by using CMAQ in urban Beijing (Zhang et al., 2021). Recently, Zheng et al. (2020) evaluated the effect of three ratios (1, 10, and 100) on heterogeneous sulfate formation by using CMAQ and large uncertainties of simulated sulfate concentrations were reported. The most widely adopted ratios were 1–30 or 100–120 with large uncertainties, and thus more efforts are needed to better understand the Photnitrate impact on atmospheric oxidation capacity and on concentrations of HONO and other secondary pollutants.
A number of potential HONO sources (e.g., direct emissions, NO2 heterogeneous reactions, and Photnitrate) have been coupled into several air quality models (An et al., 2013; Fu et al., 2019; Guo et al., 2020; Li et al., 2010, 2011; Sarwar et al., 2008; Tang et al., 2015; Xu et al., 2006; Zhang et al., 2019a, b, 2021, 2022; J. Zhang et al. 2020) to improve HONO simulations. The improved HONO sources can produce more OH, which is favorable for the formation of O3 (Fu et al., 2019; Guo et al., 2020; Li et al., 2010; Xing et al., 2019; Zhang et al., 2016, 2019a, 2022). O3 can directly damage plants and threaten human health (Avnery et al., 2011a, b; Feng et al., 2015, 2019, 2022; Mills et al., 2007, 2018; Richards et al., 1958; Selin et al., 2009; Wilkinson et al., 2012; Zhao et al., 2021), and an increasing trend of O3 concentrations in China has been widely reported in recent years (S. Chen et al., 2020; Li et al., 2020; Lu et al., 2020; Ma et al., 2016; Maji and Namdeo, 2021), making O3 pollution a severe concern. A co-occurrence of high PM2.5 and O3 concentrations has been frequently reported in China over the past few years, with researchers speculating a significant role of HONO in producing O3 enhancements (Feng et al., 2021; Fu et al., 2019; Tie et al., 2019; K. Yang et al., 2021). Nevertheless, current knowledge on the HONO difference in O3 formation during clean and hazy days is still unclear, especially the relative contribution of each potential HONO source to O3 enhancements during haze-aggravating processes with a co-occurrence of high PM2.5 and O3 concentrations.
In this study, time series of pollutants including HONO, O3, and nitrate were collected in NCP during 11–31 October 2018, in which high concentrations of PM2.5 accompanied by high O3 concentrations were found at least twice during haze events. The specific role of each potential HONO source in O3 formation is explored during these haze events by coupling the potential HONO sources into the Weather Research and Forecasting model with Chemistry (WRF-Chem, Grell et al., 2005). The relative contribution of each potential HONO source to surface-averaged and vertically averaged concentrations of HONO and O3 are quantified and the uncertainty in key potential HONO sources (e.g., Jnitrate) is discussed, in order to find the key HONO sources resulting in O3 enhancements in NCP at different pollution levels (especially during haze-aggravating processes).
2.1 Observation data
The field observation was carried out during 11–31 October 2018, and the observation site was located on the west campus of Beijing University of Chemical Technology (BUCT, 116∘18′37′′ E, 39∘56′56′′ N) in Beijing. BUCT is an urban site close to the third ring road of Beijing, with extensive human activities, including vehicle emissions. Instruments were set up on the fifth floor of the main teaching building. HONO was measured with a home-made water-based long-path absorption photometer (Y. Chen et al., 2020). A dual-channel absorption system was deployed to subtract the potential interferences, e.g., NO2 hydrolysis. A set of on-line commercial analyzers (Thermo 48i, 42i, 49i, 43i) was used for measurements of CO, NOx, O3, and SO2. Specifically, the 42i used a molybdenum NO2-to-NO converter, and there would be an NO2 overestimation for the conversion of HONO, HNO3, or other NOy. Considering the relatively lower concentration compared with NO2, the impact would be minor. The chemical composition of PM2.5 was analyzed with a Time-of-Flight Aerosol Chemical Speciation Monitor (ToF-ACSM, Aerodyne). ToF-ACSM was developed by Fröhlich et al. (2013) for non-refractory PM2.5 measurement. Details on its usage can be found in Liu et al. (2020), where ionization efficiency calibration of nitrate was performed using 300 nm dry NH4NO3 every month during the observation period. An online single-photon ionization time-of-flight mass spectrometer (SPI-ToF-MS, Hexin) was used for the detection of a large variety of volatile organic compounds (VOCs) (Gao et al., 2013). Surface observations of O3, NO2, PM2.5, and PM10 at 95 sites in NCP were obtained from https://quotsoft.net/air/ (last access: 3 March 2022), issued by the China Ministry of Ecology and Environment; surface meteorological observations at 284 sites in NCP were taken from the National Climatic Data Center, China Meteorological Administration (Fig. 1).

Figure 1Domains of WRF-Chem used in this study (a), and the locations of one HONO observation site (orange dot in urban Beijing), 95 environmental monitoring (PM2.5, NO2 and O3) sites (dark pink dots), and 284 meteorological observation sites (black dots) in domain 2 (b).
Vertical HONO observations were not available during the period 11–31 October 2018 at the BUCT site, and we therefore used the observed vertical HONO concentrations from Meng et al. (2020) in urban Beijing in December 2016 to evaluate our simulation of vertical HONO concentrations, which were also used by Zhang et al. (2021) in their CMAQ evaluation.
2.2 Model description
The improved WRF-Chem model (version 3.7.1), which included six potential HONO sources, i.e., traffic (Etraffic), soil (Esoil), and indoor (Eindoor) emissions, Photnitrate in the atmosphere, and NO2 heterogeneous reactions on aerosol (Hetaerosol) and ground (Hetground) surfaces (Zhang et al., 2019a), was used in this study. Photnitrate was newly added in WRF-Chem (Reaction R2) following the work of Fu et al. (2019), Ye et al. (2017), and Zhou et al. (2003):
For Hetaerosol and Hetground, laboratory studies suggest that these heterogeneous reactions of NO2 to HONO are of first order in NO2 (Aumont et al., 2003; Finlayson-Pitts et al., 2003; Saliba et al., 2000):
The first-order rate constants for aerosol (ka) and ground (kg) surface reactions are calculated as:
where is the mean molecular speed of NO2, is the surface-to-volume ratio for aerosols, γ is the reactive uptake coefficient of aerosols, f is the proportion of deposited NO2 reaching the surface in participating HONO formation, vd is the dry deposition velocity of NO2, and H is the first model layer height above the ground (∼ 35 m). It should be noted that not 100 % (50 % is commonly accepted) of the participating NO2 could be converted to HONO in Reactions (R3) and (R4), and thus ka and kg were multiplied by 0.5 in the final calculation of HONO heterogeneous formation via NO2.
The two factors γ and f were improved from previous studies (Li et al., 2010; Liu et al., 2014; Zhang et al., 2019a) and calculated by:
where SR denotes solar radiation (W m−2), α is an adjusted parameter and set as 100 (W m−2), and thus γ and f become continuous functions during the whole day (γ and f enhanced by 10 times and reached 5 × 10⁻⁵ and 0.8 when SR reached 900 W m−2 at noontime, respectively).
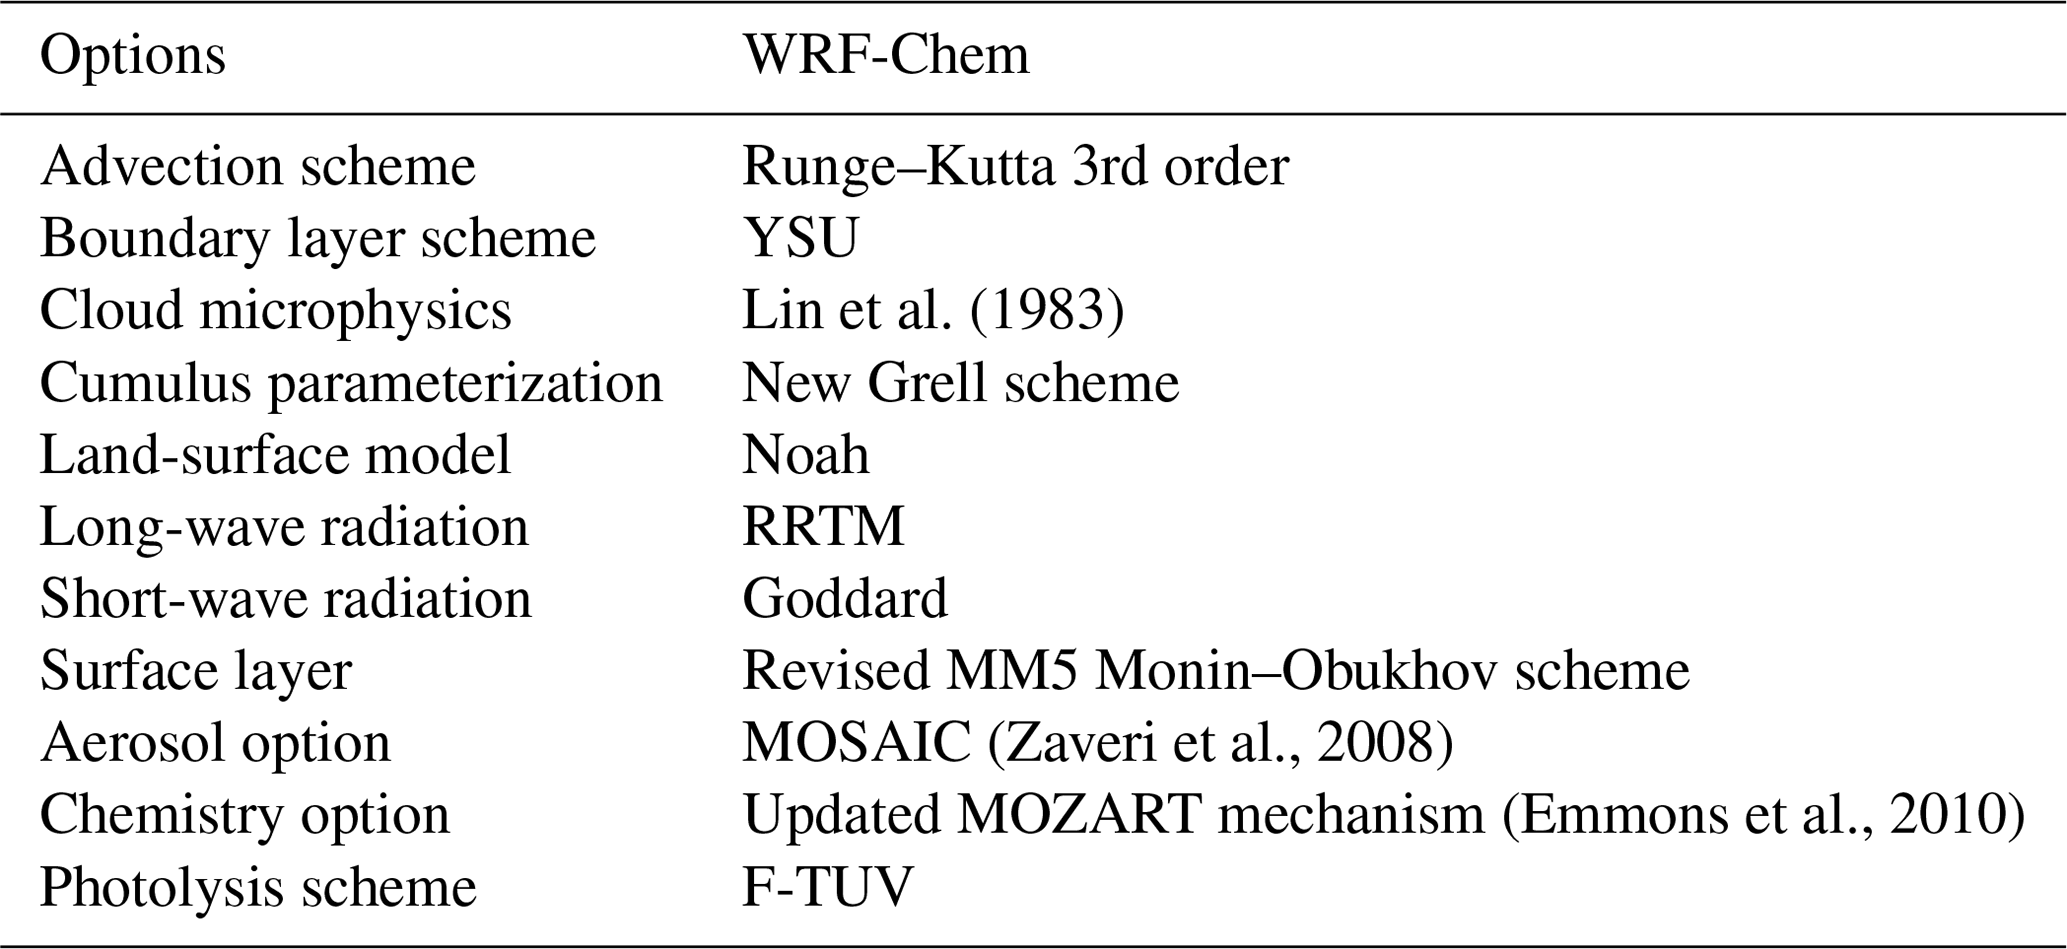
The physical and chemical schemes used in this study are given in Table 1. Two domains were adopted, domain one contains 82 × 64 grid cells with a horizontal resolution of 81 km, and domain two contains 51 × 51 grid cells with a horizontal resolution of 27 km (Fig. 1), both with 17 vertical layers encompassing from the surface to 100 hPa. The observational sites are shown in the right panel of Fig. 1, including one HONO observation site (the orange dot in urban Beijing), 95 observation sites of PM2.5, NO2, and O3 (pink dots), and 284 meteorological monitoring sites (black dots).
Table 1Physical and chemical options in WRF-Chem used in this study.
The anthropogenic emissions in East Asia in 2010 were taken from the MIX emission inventory (Li et al., 2017) (http://www.meicmodel.org/, last access: 3 March 2022), including both gaseous and aerosol species, i.e., SO2, NOx, CO, VOCs, NH3, PM10, PM2.5, BC, OC, and CO2, and were provided monthly by five sectors (power, industry, residential, transportation, and agriculture) at a resolution of 0.25∘ × 0.25∘. VOC emissions were speciated into model-ready inputs according to the MOZART chemical mechanism to build the WRF-Chem emission files. The anthropogenic emissions in China were replaced by employing the MEIC 2016 (the Multi-resolution Emission Inventory for China) developed by Tsinghua University. The NH3 emissions in China were from Dong et al. (2010), biomass burning emissions were from Huang et al. (2012), and biogenic emissions were calculated using the Model of Emissions of Gases and Aerosols from Nature (MEGAN) (Guenther et al., 2012). Due to the sharp reduction in anthropogenic emissions in recent years, the default emission inventory was systematically overestimated in autumn of 2018, especially for SO2 and PM2.5 concentrations. Based on the comparison of simulations and observations (the urban Beijing site plus the other 95 pollutant-monitoring sites in NCP), we cut off 80 % of SO2 emissions, 50 % of NH3 emissions, 30 % of toluene emissions, and 50 % of PM2.5 and PM10 emissions. The cut-off emissions are largely close to the emission reductions in east China during the period 2013–2017 (Zhang and Geng, 2019). The revised emissions significantly improved regional PM2.5 simulations in NCP (Fig. S1), and the simulations of gases and PM2.5 in urban Beijing (Fig. S2).
The National Centers for Environmental Prediction (NCEP) 1∘ × 1∘ final reanalysis data (FNL) (https://rda.ucar.edu/datasets/ds083.2/, last access: 3 March 2022, National Centers for Environmental Prediction et al., 2000) were used in this study to obtain the meteorological initial and boundary conditions every 6 h. The global simulations of MOZART-4 (https://www.acom.ucar.edu/wrf-chem/mozart.shtml, last access: 3 March 2022) were used as the chemical initial and boundary conditions (every 6 h).
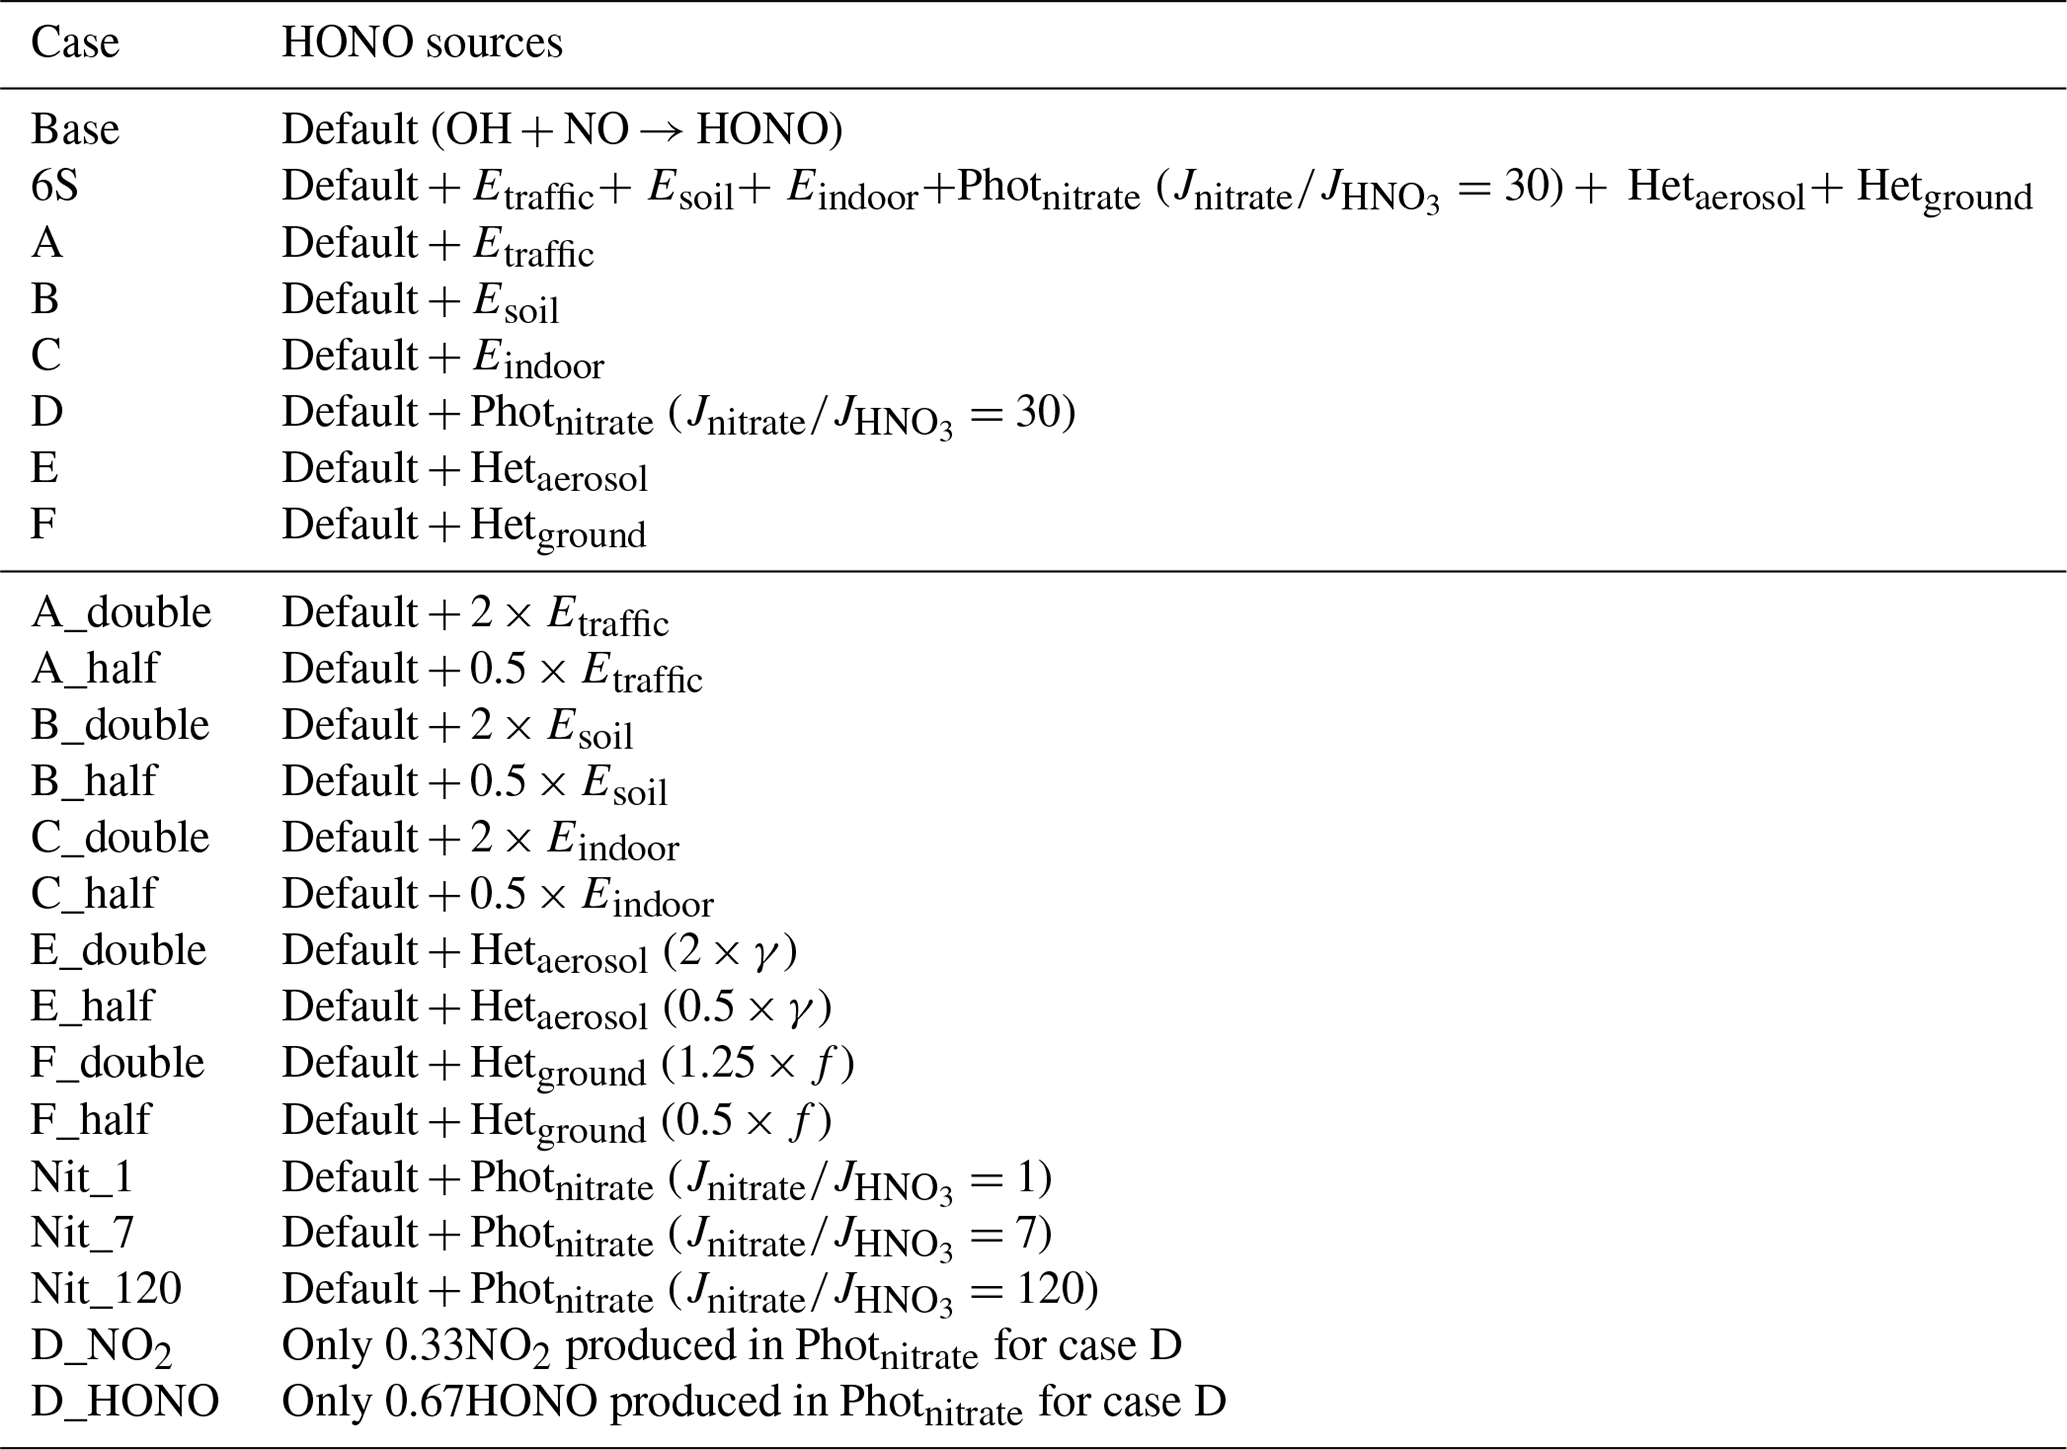
In total, 23 simulation scenarios were performed in this study (Table 2), in which the base case only considered the default homogeneous reaction (OH + NO → HONO), case 6S contained six potential HONO sources while cases A, B, C, D, E, and F contained each of the six potential HONO sources, respectively. The other 15 cases (A_double, A_half, … , Nit_120, D_NO2, and D_HONO) were used to evaluate the uncertainties of the six potential HONO sources (Table 2). All of the cases were simulated with a spin-up of 7 d. Jnitrate and denote the photolysis frequency of nitrate and gas nitric acid in the atmosphere, respectively. The enhancement factor for F_double was 1.25 instead of 2.0 to avoid the production rate of HONO from NO2 reaching the surface exceeding 100 %. The 0.33NO2 in D_NO2 or 0.67HONO in D_HONO referred to the assumed Photnitrate products in Reaction (R2).
3.1 Comparison of simulations and observations
3.1.1 Meteorological factors
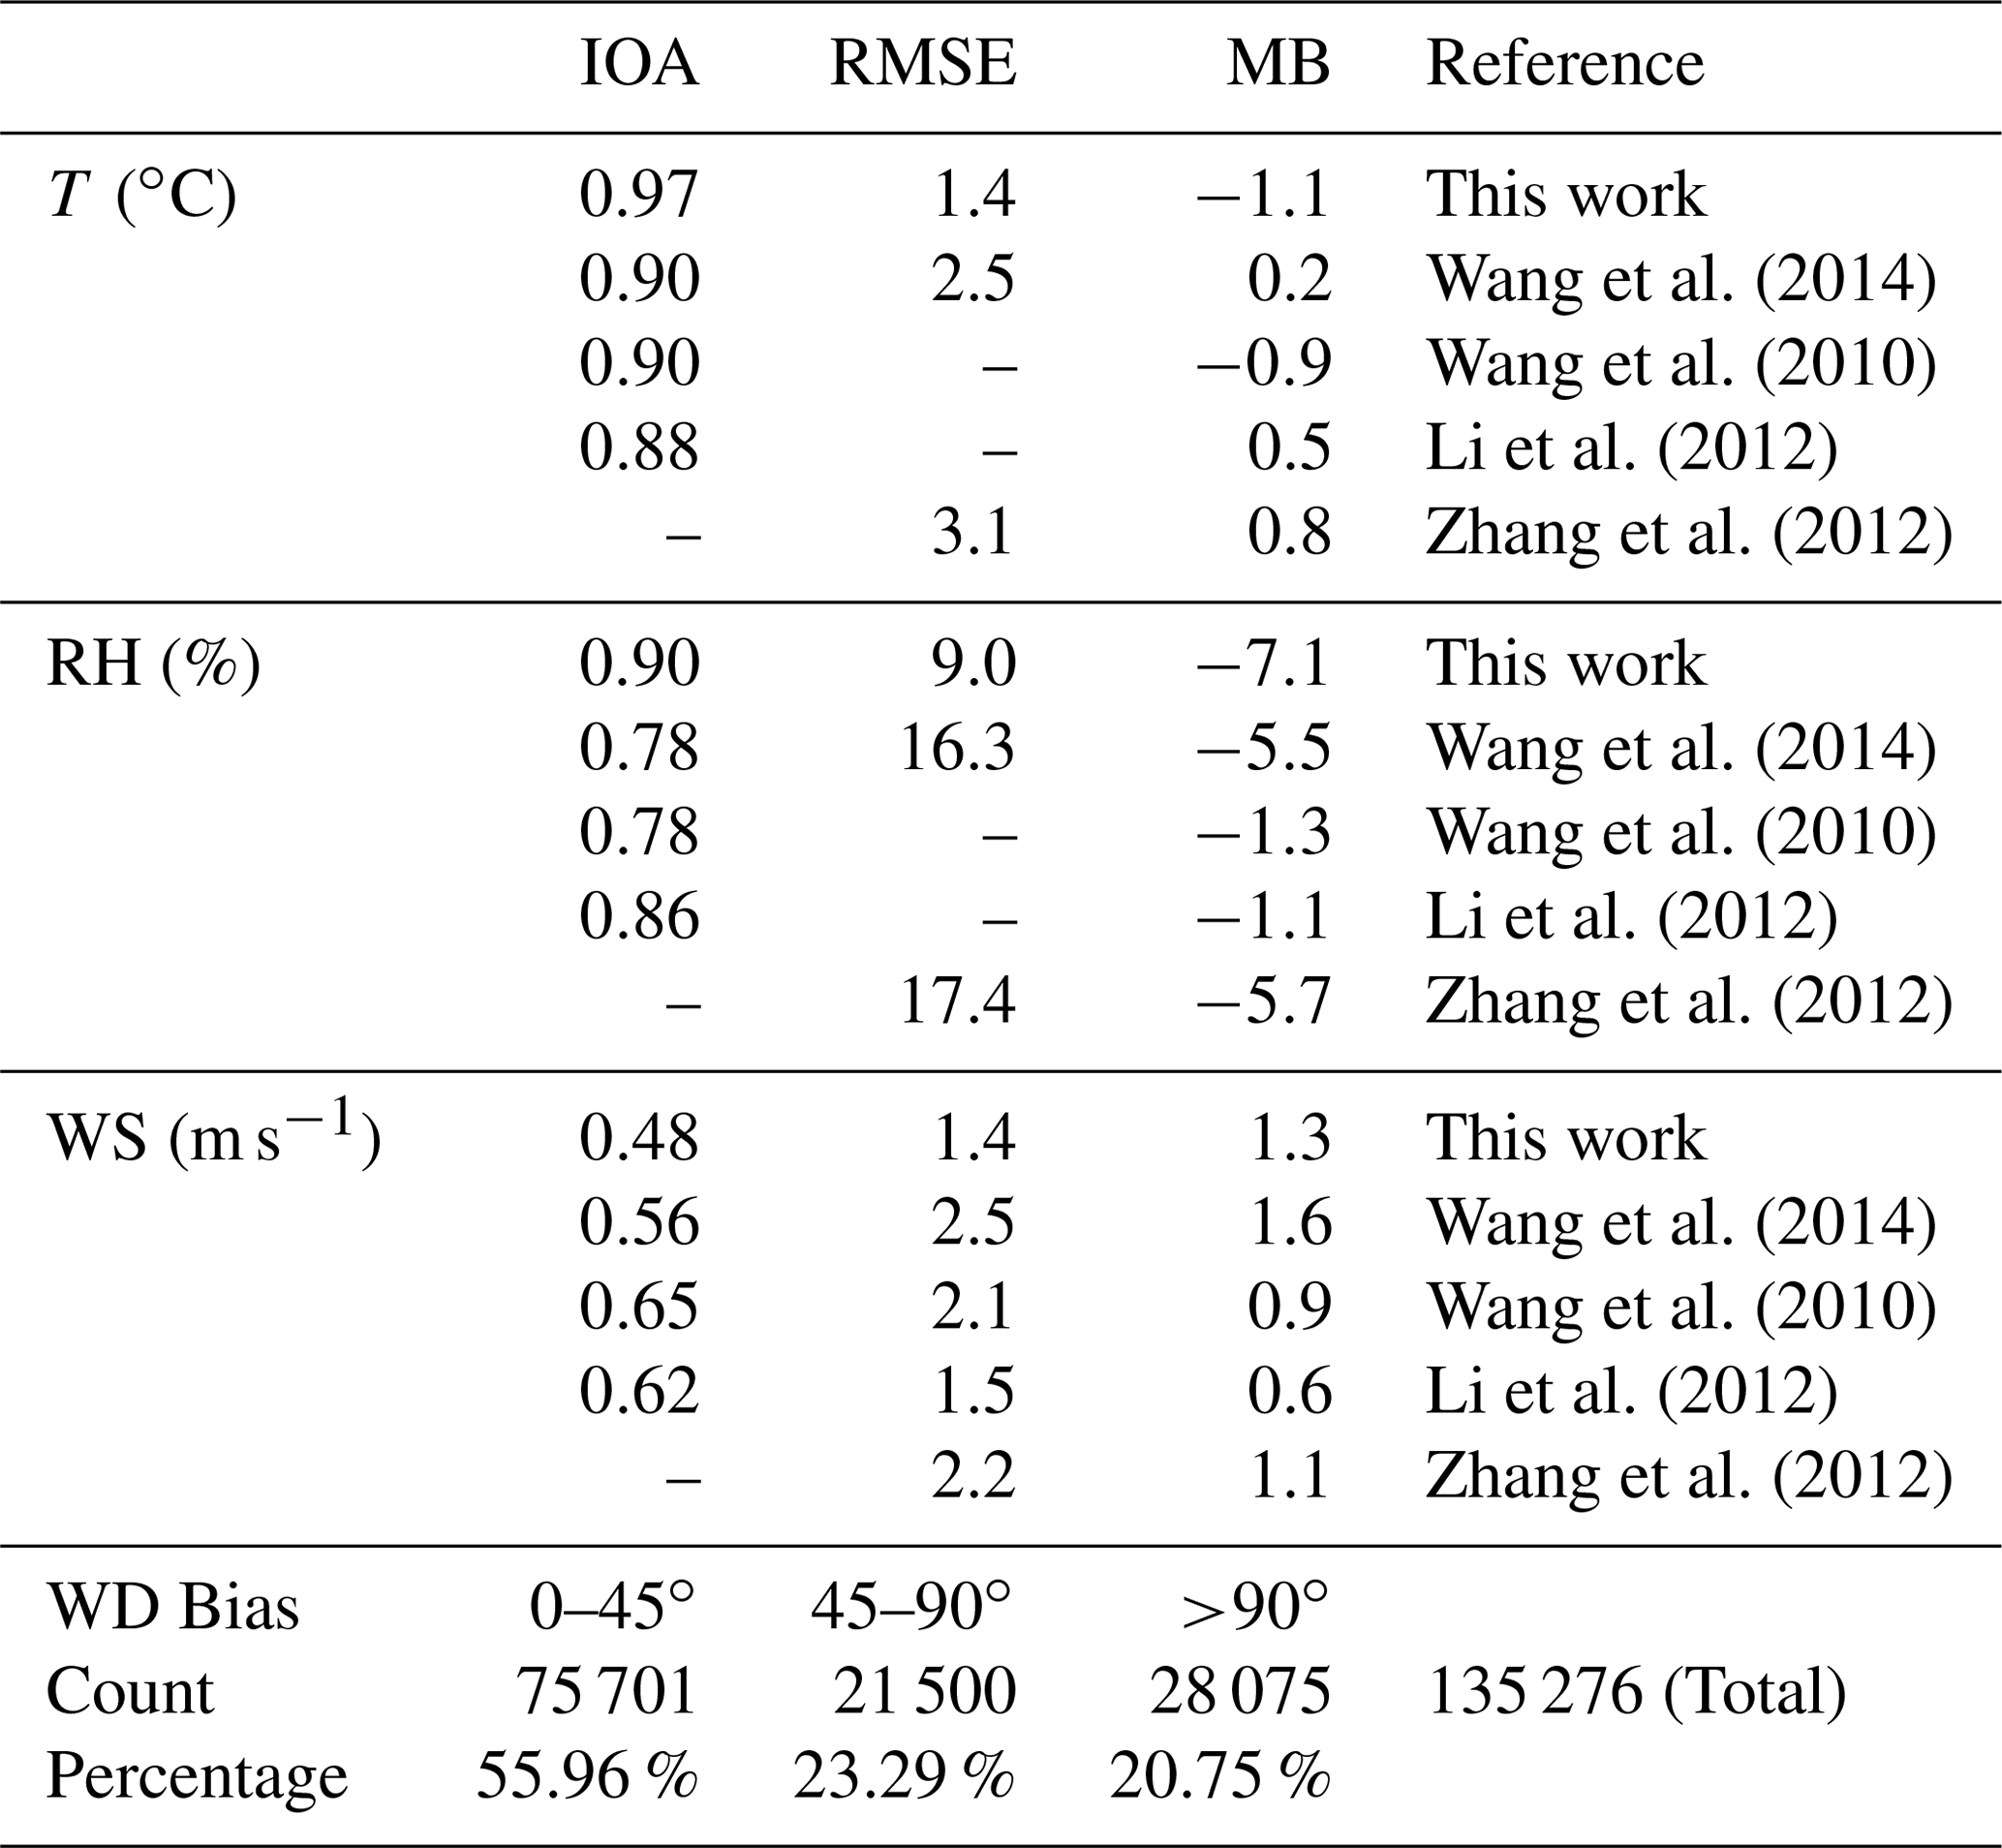
The statistical metrics of simulated meteorological parameters at 284 sites in NCP including air temperature (T), relative humidity (RH), and wind speed (WS) were comparable with the modeling results reported by other researchers (Table 3). The simulated wind direction (WD) bias within 45∘ accounted for ∼ 56 %, and the bias within 90∘ accounted for ∼ 80 %, suggesting that the simulated WD captured the main observed WD.
Table 3Performance metrics (index of agreement (IOA), RMSE, and MB (mean bias)) of WRF-Chem simulated air temperature, relative humidity, wind speed, and direction at 284 meteorological sites in the North China Plain during 11–31 October 2018. The definitions of the metrics used in this study are given in Sect. S1.
3.1.2 Pollutant concentrations at the BUCT site
Time series of the observational data at the BUCT site are shown in Fig. 2, the gray-shaded periods stand for three haze-aggravating processes, while the cyan-shaded period denotes typical clean days. The largest hourly observations of O3 (∼ 50–75 ppb) and PM2.5 (∼ 100–200 µg m−3) were both relatively higher on hazy days than on clean days, especially for the first two haze events (the O3 concentrations in the third haze event were relatively lower due to the higher NOx concentrations in the urban area).

Figure 2Comparison of simulated (Base and 6S cases) and observed hourly concentrations of PM2.5, nitrate, NO2, HONO, and O3 (a–e), and the hourly enhanced concentrations of O3 (ΔO3) (f) caused by the six potential HONO sources (6S minus Base) at the BUCT site during 11–31 October 2018.
The observed PM2.5 and nitrate trends at the BUCT site were well simulated (Fig. 2a and b), and NO2 simulations generally agreed with the observations (Fig. 2c). The promotion effect of the six potential HONO sources on the formation of secondary aerosols leads to an increase in concentrations of PM2.5 and nitrate for case 6S, despite nitrate consumption through Photnitrate (Li et al., 2010; Qu et al., 2019; Fu et al., 2019; Zhang et al., 2019a, 2021); detailed nitrate variation caused by each of the six potential HONO sources in case 6S is presented in Fig. S3. The overestimation of nitrate could be partially caused by the uncertainties in the anthropogenic emission inventory, e.g., the overestimation of NOx emissions (Fig. 2c). The inadequate understanding of the nitrate formation mechanism could also be related to nitrate simulation bias, which was also found in some related studies using CMAQ (Fu et al., 2019; Zhang et al., 2021).
Hourly and diurnal HONO simulations at the BUCT site (Figs. 2d and 3a) were significantly improved in the 6S case (mean of 1.47 ppb) compared with the base case (mean of 0.05 ppb). The normalized mean bias (NMB) was remarkably reduced to −14.22 % (6S) from −97.11 % (Base), and the index of agreement (IOA) was improved significantly to 0.80 (6S) from 0.45 (Base) (Fig. 2d). The underestimation of the simulated HONO (6S) on 15 and 22 October was mainly caused by the earlier scavenging of pollutants at the BUCT site in the model used (Fig. 2a and d).
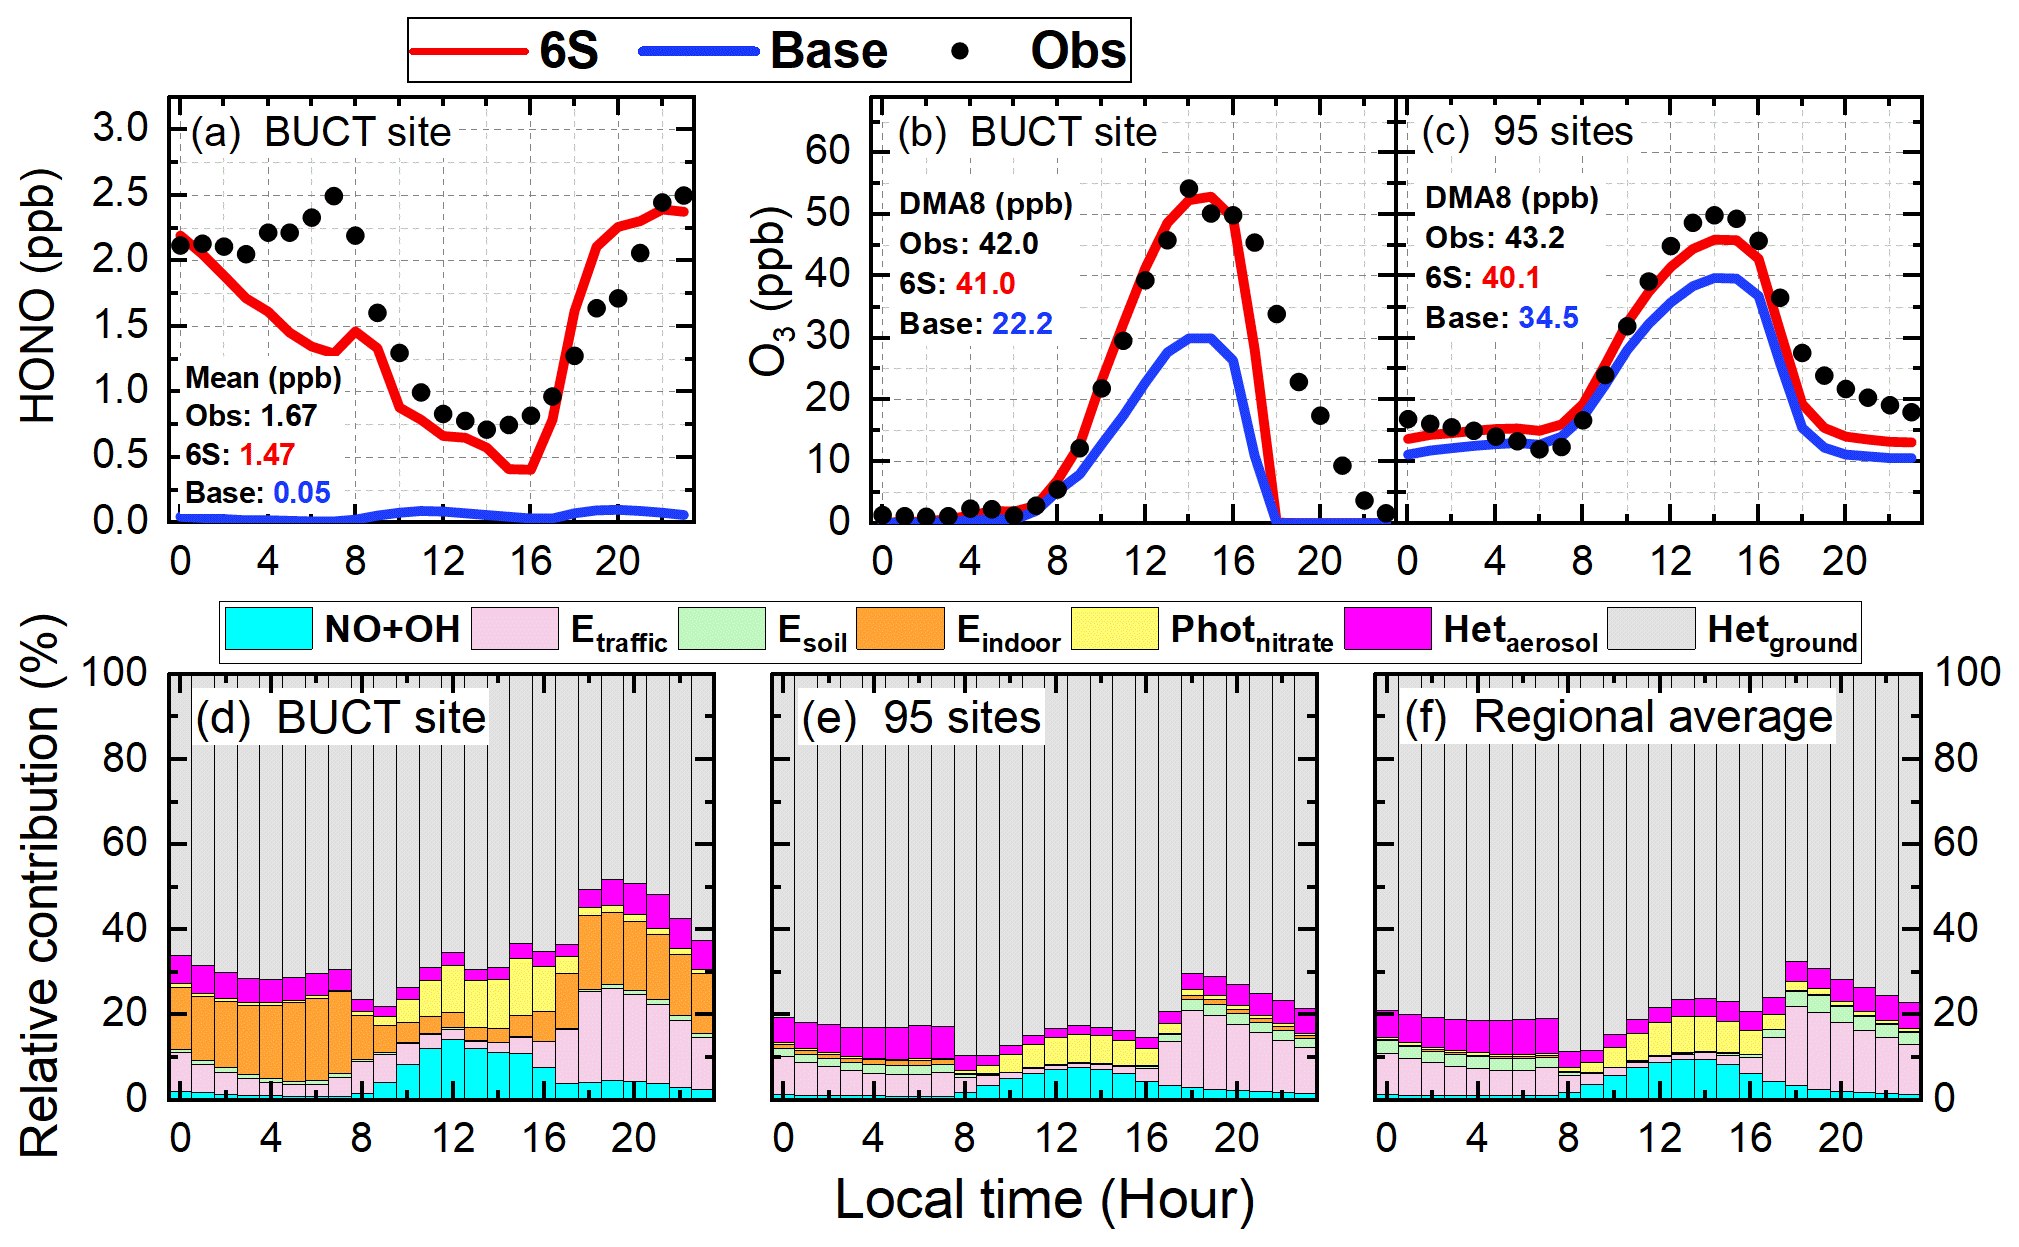
Figure 3Comparison of diurnal mean simulations (Base and 6S cases) and observations of HONO during the study period (a) and O3 during the first two haze events at the BUCT site (b) and O3 averages at the 95 NCP monitoring sites during the study period (c); the relative contributions of each of the six potential HONO sources and the reaction of OH with NO to surface HONO concentrations for the 6S case at the BUCT site (d), at the 95 monitoring sites (e), and in the whole NCP region (f). The calculated 24 h mean HONO concentrations and DMA8 O3 concentrations are given in panels a–c.
As for O3, noticeable improvements were found at the BUCT site after considering the six potential HONO sources, especially on hazy days (Fig. 2e and f). The mean bias (MB) was improved to −3.61 ppb (6S) from −7.09 ppb (Base), and the IOA was improved to 0.86 (6S) from 0.78 (Base) (Fig. 2e). In particular, the 6S case significantly enhanced daytime hourly O3 by 15–35 ppb compared with the base case, and the simulated O3 was very close to the observations on hazy days (Fig. 2e). Larger daytime O3 enhancements were accompanied by higher PM2.5 concentrations during haze-aggravating processes, while on clean days the daytime-enhanced O3 due to the potential HONO sources was mostly <5 ppb (Fig. 2e and f). The diurnal O3 pattern during the first two haze-aggravating processes is presented in Fig. 3b. Significant improvements in daily maximum 8 h (10:00–17:59) averaged (DMA8) O3 (18.8 ppb) occurred at the BUCT site after considering the six potential HONO sources, and the NMB of DMA8 O3 was remarkably improved to −2.38 % (6S) from −47.14 % (Base).
The relative contribution of each HONO source near the surface at the BUCT site for the 6S case is shown in Fig. 3d. Briefly, Hetground was the largest source during daytime and nighttime (∼ 50 %–70 %), consistent with the results of Zhang et al. (2021). Photnitrate () and the NO + OH reaction contributed similarly ∼ 1 %–12 % during daytime. The contribution of Etraffic was significant during nighttime (∼ 10 %–20 %) but small during daytime (<5 %). The contribution of Hetaerosol to HONO concentrations was minor (∼ 2 %–3 %) during daytime and ∼ 6 %–10 % at nighttime. Esoil could be neglected while the contribution of Eindoor was close to that of Etraffic in urban Beijing. The relative contribution of the potential HONO sources in this study was comparable to the results reported by Fu et al. (2019) when using CMAQ, except for the contribution of Photnitrate due to the different ratios (30 in our study and ∼ 120 in Fu et al., 2019).
3.1.3 Pollutant concentrations in NCP
The 95-site-averaged hourly simulations and observations of O3, NO2, and PM2.5 during the study period are shown in Fig. 4. The six potential HONO sources significantly improved hourly O3 simulations, remarkably enhanced the daily maximum O3 by ∼ 5–10 ppb during 11–25 October, and by ∼ 2–4 ppb during 26–31 October (Fig. 4a and b). The simulations of NO2 agreed well with the observations, and the mean concentrations were 22.55 (Base), 21.62 (6S), and 20.74 (Obs) ppb (Fig. 4c). The PM2.5 simulations generally followed the observed PM2.5 trend but were overestimated by ∼ 8 µg m−3, with averaged concentrations of 49.94 (Base), 53.30 (6S), and 45.31 (Obs) µg m−3 (Fig. 4d), respectively.
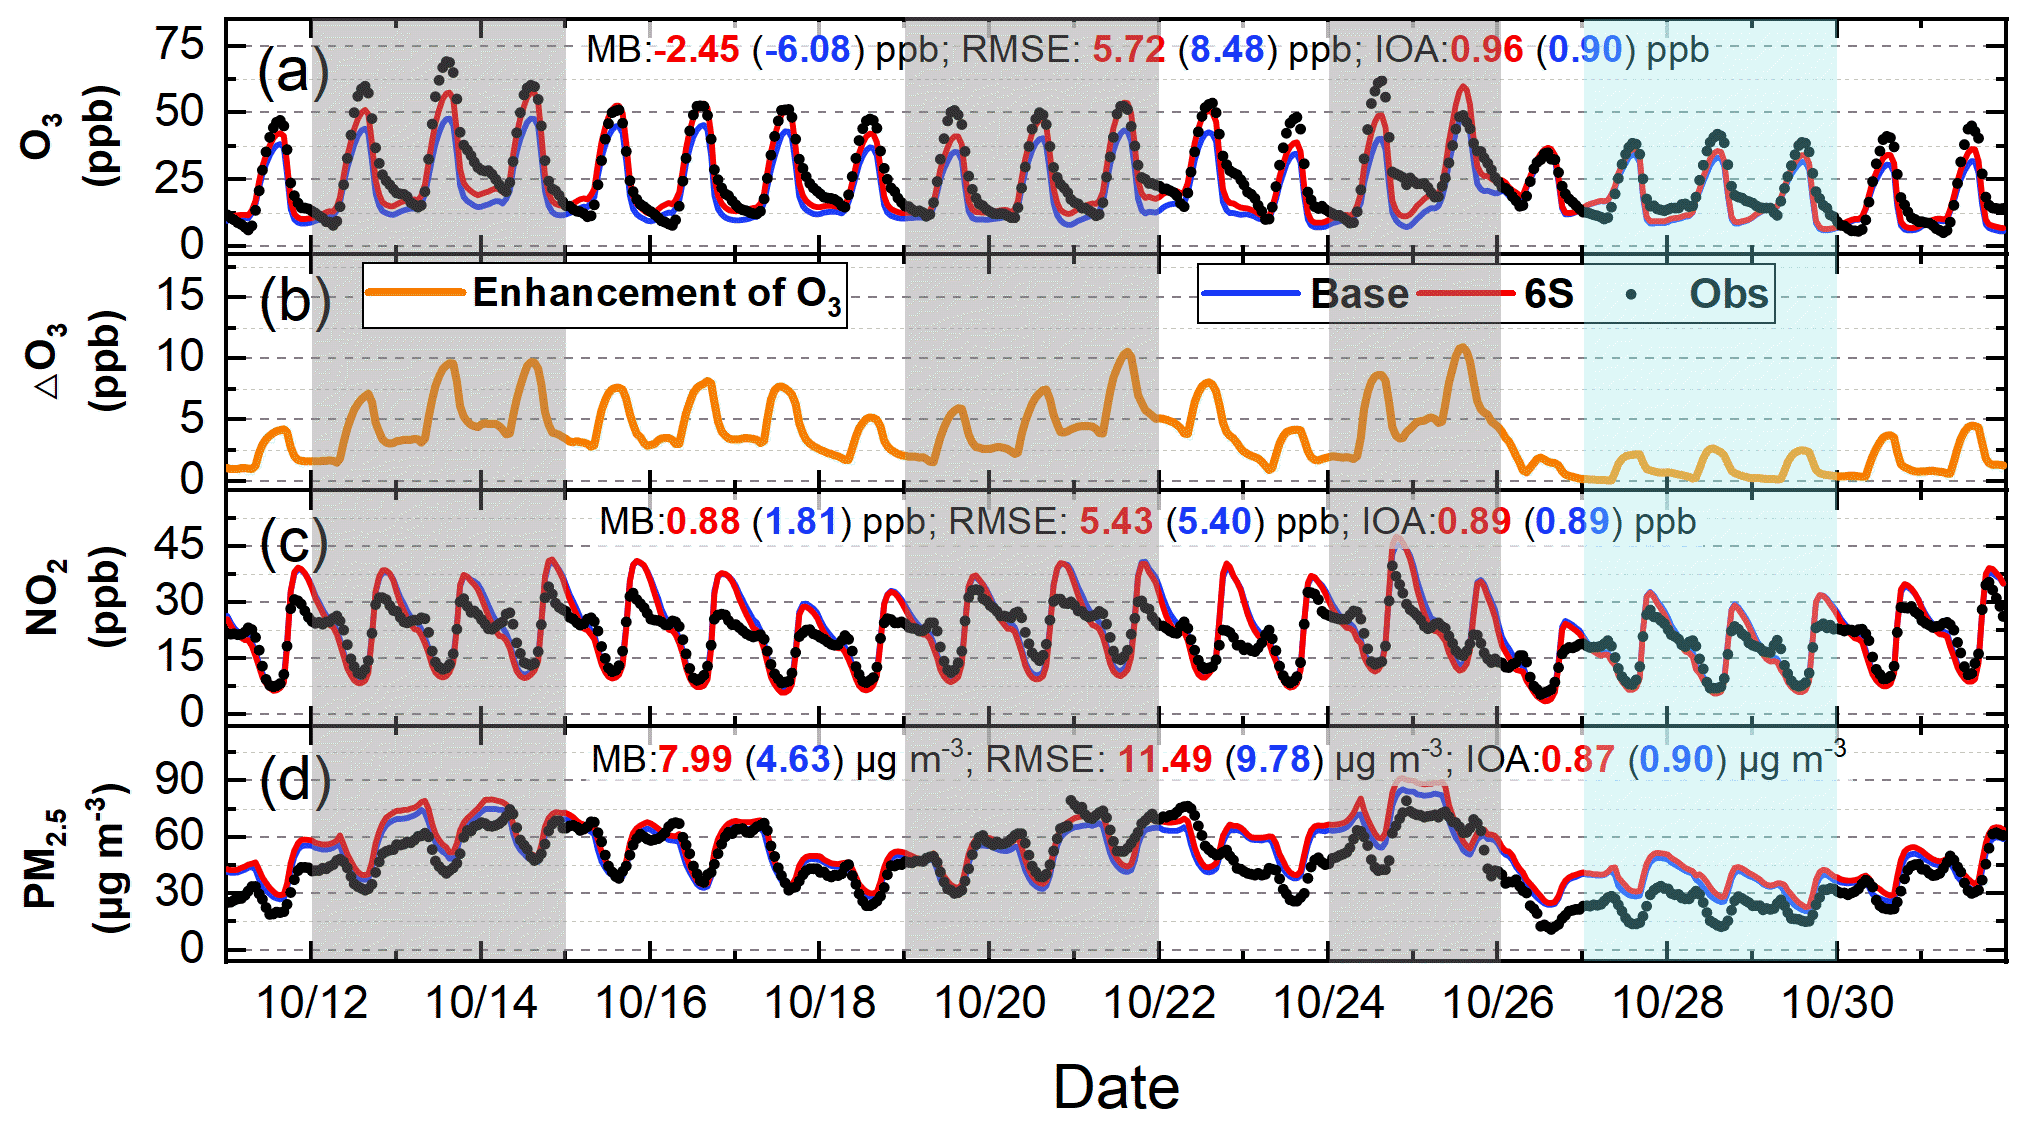
Figure 4Comparison of 95-site-averaged hourly simulations (Base and 6S cases) and observations of O3 (a), NO2 (c), PM2.5 (d), and O3 enhancements due to the six potential HONO sources (6S minus Base case) (b) in the North China Plain during 11–31 October 2018.
The 95-site-averaged diurnal simulations and observations of O3 are presented in Fig. 3c. O3 simulations showed a remarkable improvement when the six potential HONO sources were considered. The six potential HONO sources produced a mean enhancement of 5.7 ppb in DMA8 O3 and improved the NMB to −7.16 % from −20.32 % at the 95 sites in NCP. The 95-site-averaged diurnal simulations and observations of NO2 and PM2.5 during the study period are demonstrated in Fig. S4. NO2 simulations generally followed the observed trend but were underestimated from 04:00 to 16:00 and overestimated after 18:00 (Fig. S4a), PM2.5 simulations agreed with the observed diurnal pattern but were overestimated for both cases during the whole day (Fig. S4b).
The relative contribution of each HONO source near the surface at the 95 NCP sites for the 6S case is shown in Fig. 3e. Hetground was the dominant source during daytime and nighttime (∼ 70 %–80 %). Photnitrate () and the NO + OH reaction nearly equaled and contributed ∼ 2 %–8 % during daytime (∼ 5 % on average). The contribution of Etraffic was significant during nighttime (∼ 10 %–15 %) but small during daytime (<3 %). The contribution of Hetaerosol to HONO concentrations was <3 % during daytime and <10 % at nighttime. Esoil contributed ∼ 3 % at nighttime but could be neglected at daytime. The contribution of Eindoor was too small to be noticed at the 95 NCP sites, implying that this source was noticeable only in megacities. The relative contribution of each HONO source in the whole NCP region (all grid cells in domain two except for the seas) is presented in Fig. 3f. The results were quite similar to those of the 95 sites (Fig. 3e), which were representative for the whole NCP region. To further understand the role of potential HONO sources in haze-aggravating processes in regional O3 concentrations, the 95-site-averaged surface/vertical HONO concentrations and their impacts during a typical haze event (19–21 October) and a clean period (27–29 October) were analyzed and are presented in the following sections.
3.2 Spatial distribution of enhanced DMA8 O3 by potential HONO sources
3.2.1 General patterns of enhanced DMA8 O3
Figure S5 shows surface-averaged and zonal-averaged DMA8 O3 enhancements due to the six potential HONO sources in NCP during the study period (11–31 October) and three haze events (12–14, 18–21, and 24–25 October). The overall surface DMA8 O3 enhancement decreased gradually from south (6–10 ppb) to north (2–6 ppb) (Fig. S5a) and could reach 10–20 ppb under unfavorable meteorological conditions during haze events (Fig. S5b–d). For the first two haze events, the anti-cyclone in the Shandong peninsula carried pollutants being transported from the southeastern NCP to the western (108–112∘ E) and northern (39–41∘ N) NCP, and the six potential HONO sources led to a DMA8 O3 enhancement of 10–20 (Fig. S5b) and 10–15 ppb (Fig. S5c) in Beijing, respectively. For the third haze event, two air masses converged to form a transport channel from south to north. The O3 enhancement caused by the six potential HONO sources reached 10–18 ppb in the southern NCP and decreased to 6–10 ppb in the northern NCP along the transport channel. Vertically, the DMA8 O3 enhancements were 2–8 ppb during the whole period (Fig. S5e) and increased to 6–12 ppb in these haze events (Fig. S5f–h). The enhanced O3 near the surface (0–100 m) was slightly smaller than that at higher altitude (Fig. S5f–h), due mainly to the stronger titration of O3 by NO near the surface. These results demonstrate that the six potential HONO sources significantly enhanced surface and vertical O3 concentrations in NCP, especially during haze events.
3.2.2 Enhanced DMA8 O3 during a typical haze-aggravating process and a clean period
Figure 5 demonstrates surface-averaged and zonally averaged DMA8 O3 enhancements due to the six potential HONO sources in NCP during a typical haze-aggravating process (19–21 October 2018) and a clean period (27–29 October 2018). The increasing trend of DMA8 O3 enhancements can be clearly seen from 19 to 21 October near the surface and in the vertical direction. During the haze-aggravating process, the surface DMA8 O3 enhancements were ∼ 2–10 ppb (19 October), ∼ 6–12 ppb (20 October), and ∼ 8–15 ppb (21 October), respectively; the vertical DMA8 O3 enhancements were ∼ 4–7 ppb (19 October), ∼ 6–10 ppb (20 October), and ∼ 8–15 ppb (21 October), respectively. While during clean days, the surface/vertical DMA8 O3 enhancements were usually <4 ppb. The six potential HONO sources significantly enhanced surface and vertical O3 concentrations in NCP during haze-aggravating processes. The detailed role of the potential HONO sources in vertical HONO concentrations and their impacts are presented in the next section.
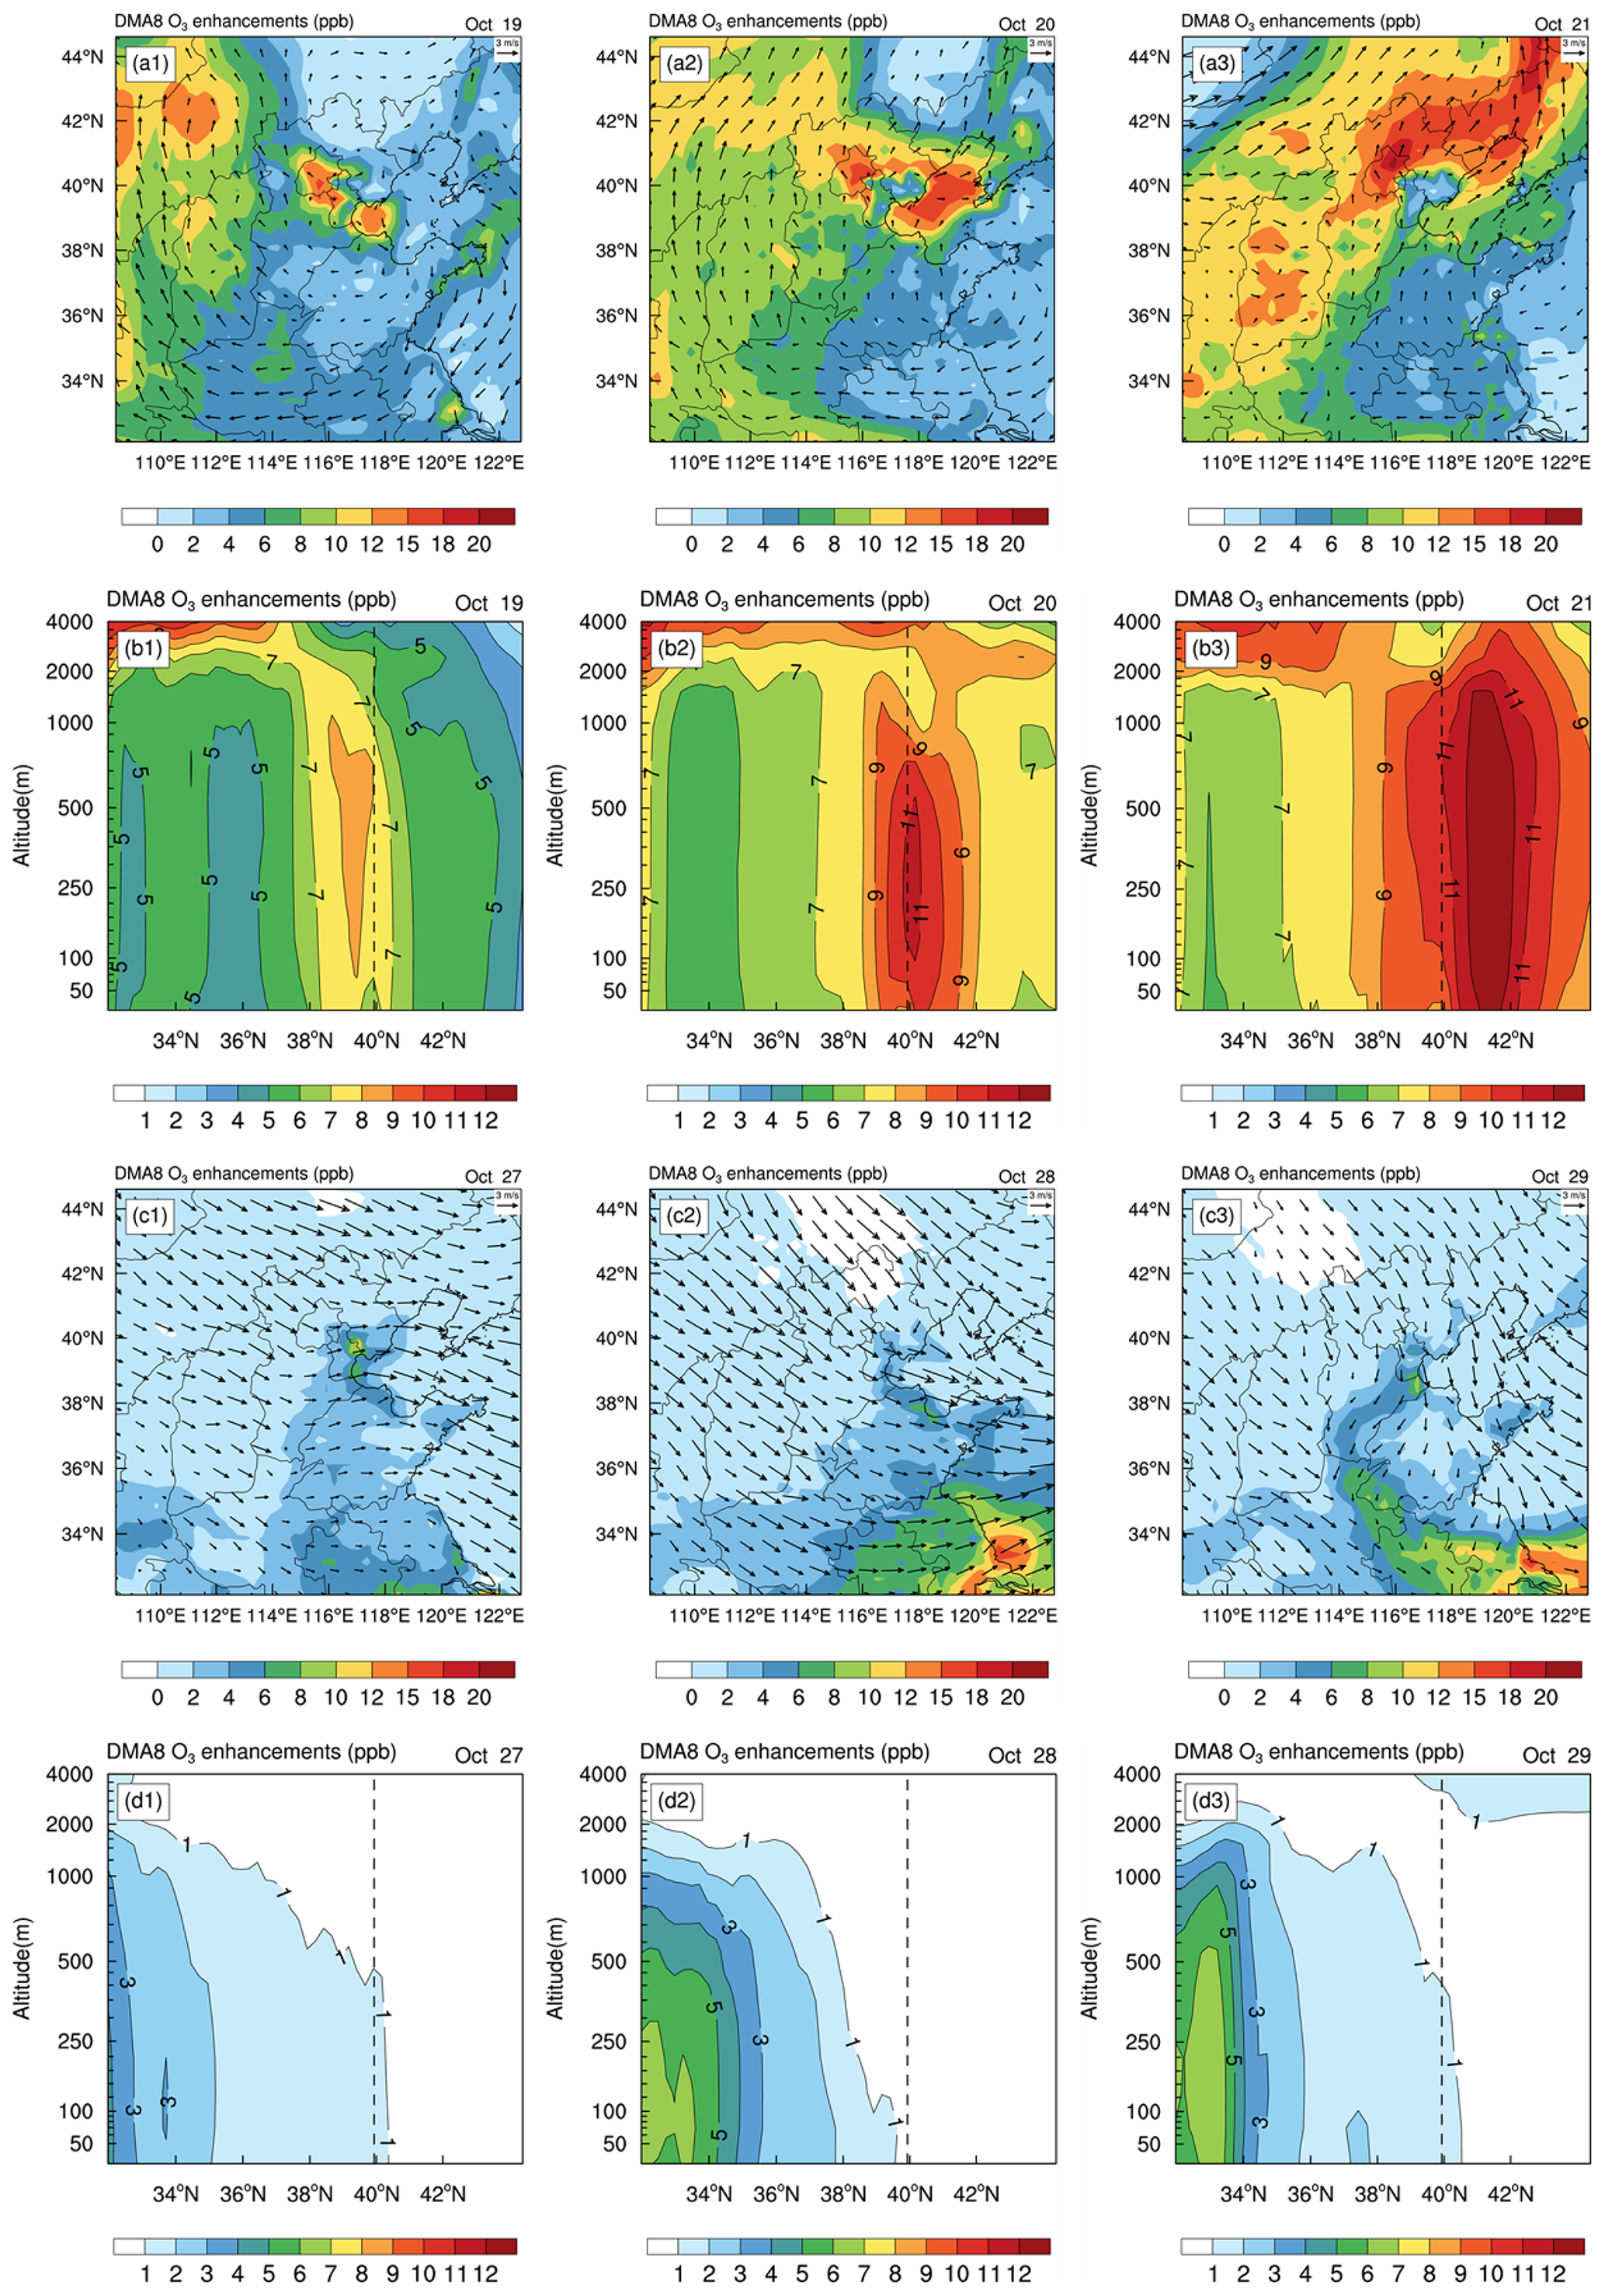
Figure 5Surface-averaged (a1–a3, c1–c3) and zonal-averaged (b1–b3, d1–d3) DMA8 O3 enhancements due to the six potential HONO sources in the North China Plain during a typical haze-aggravating process (19–21 October 2018) and a clean period (27–29 October 2018). The dashed line denotes the latitude of the BUCT site.
3.3 Vertical variations of the six potential HONO sources and their impacts
3.3.1 Six potential HONO sources and their impacts on HONO concentrations
A number of studies have conducted vertical HONO observations abroad (Kleffmann et al., 2003; Ryan et al., 2018; Sörgel et al., 2011; VandenBoer et al., 2013; Villena et al., 2011; Wang et al., 2020; Wong et al., 2011, 2012; Zhang et al., 2009) and in China (Meng et al., 2020; Wang et al., 2019; Xing et al., 2021; Zhu et al., 2011). A decreasing trend of HONO with height was mostly observed in these studies, and our simulations also reproduced this vertical variation and were comparable to another model simulation by Zhang et al. (2021), who used CMAQ (Fig. S6). For an in-depth understanding of the role of each HONO source considered in HONO concentrations at different heights, we assessed the contributions of each potential HONO source to HONO concentrations at different heights (Fig. 6) during 11–31 October 2018.
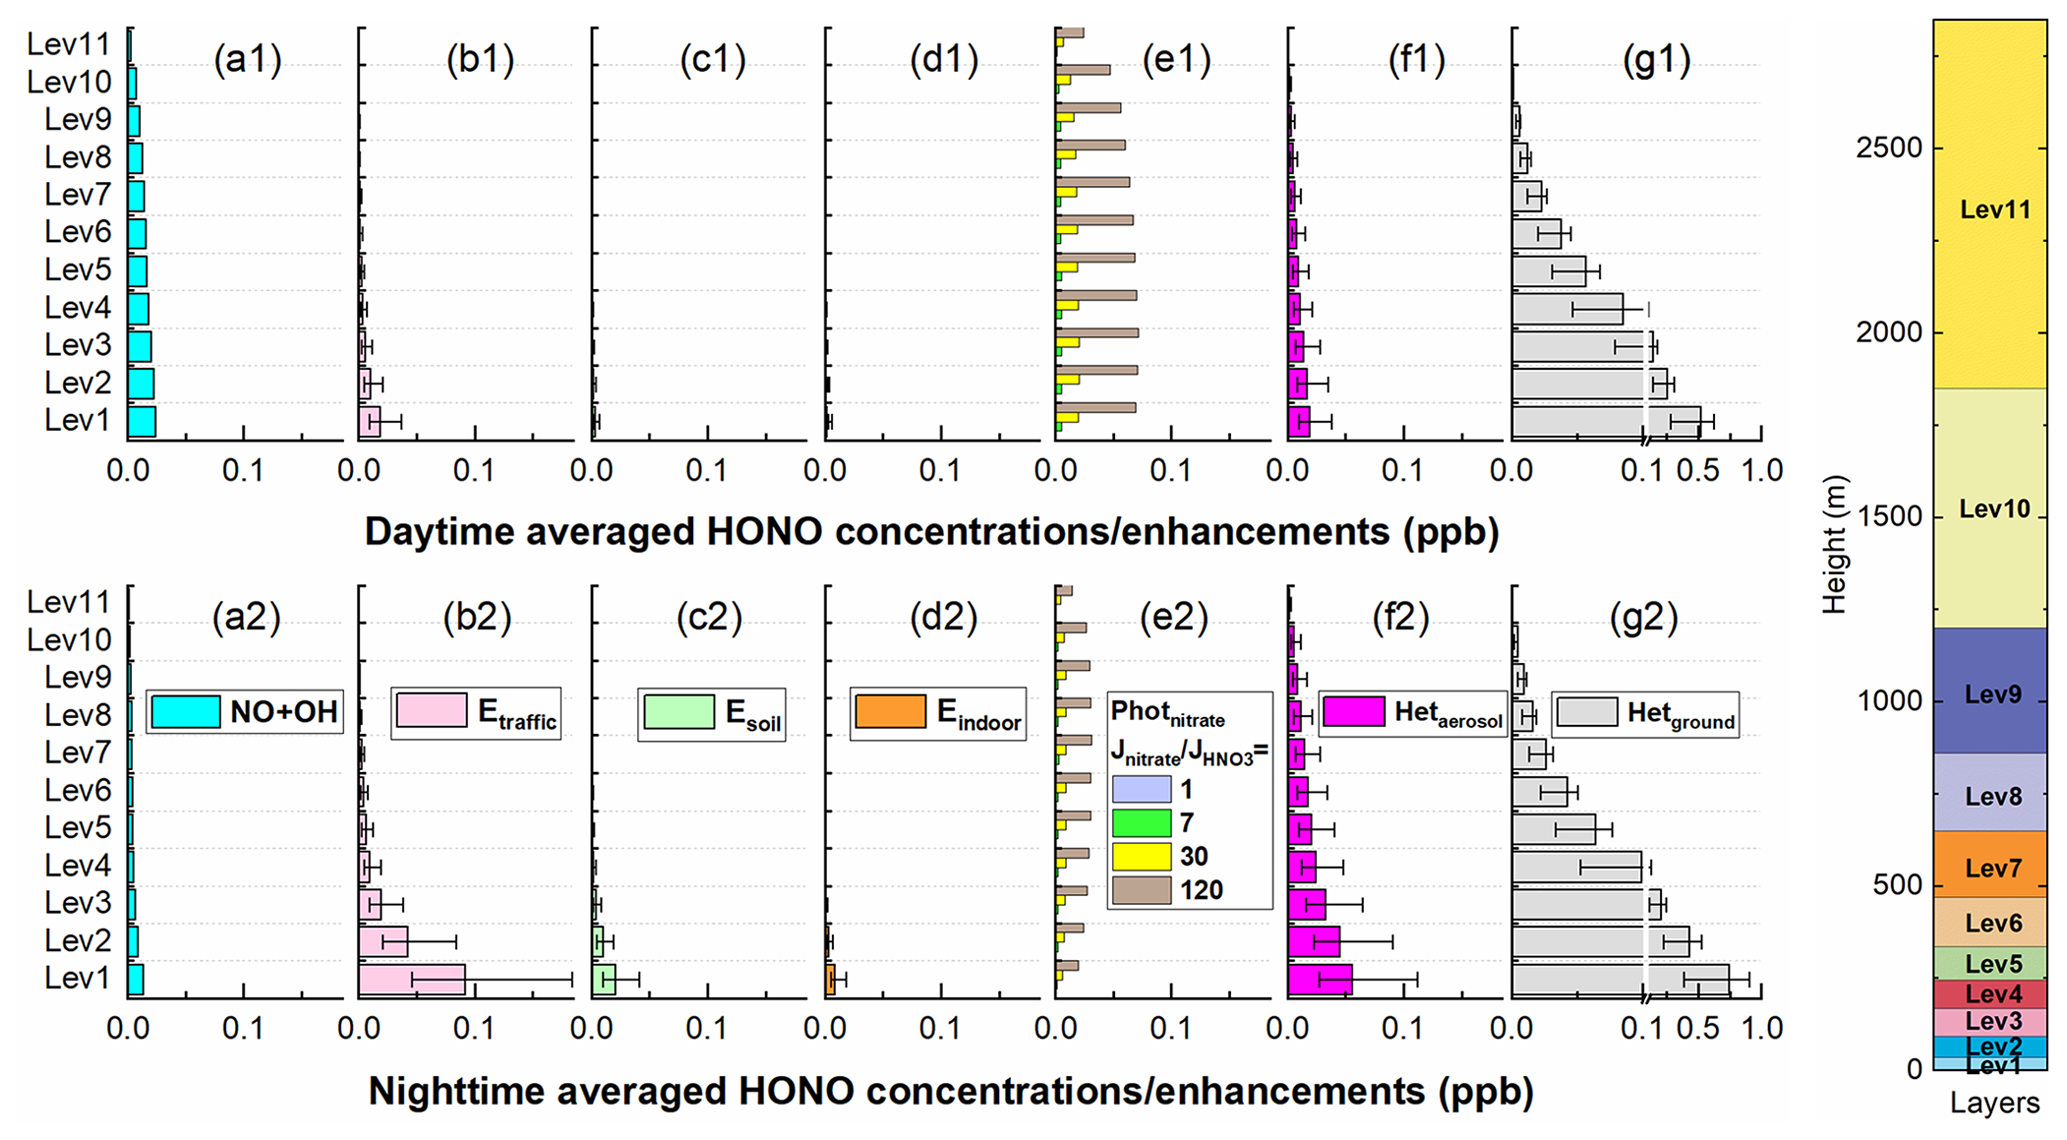
Figure 6The 95-site-averaged daytime/nighttime HONO concentrations/enhancements at different heights for the NO + OH reaction (a1 and a2) and each of the six potential HONO sources (b1–g1 and b2–g2) during 11–31 October 2018. The error bar denotes the uncertainties of each potential HONO source in HONO concentrations (Table 2). The right panel denotes the approximate height of each vertical layer above the ground.
Generally, the impacts of ground-based potential HONO sources (Etraffic, Esoil, Eindoor, and Hetground) on HONO concentrations decreased rapidly with height, while the NO + OH reaction and aerosol-related HONO sources (Photnitrate and Hetaerosol) decreased slowly with height (Fig. 6). During daytime the NO + OH reaction, Photnitrate, and Hetground were the three main HONO sources, while during nighttime Etraffic, Hetaerosol, and Hetground were the three main contributors to HONO concentrations (Fig. 6). The HONO concentrations via the NO + OH reaction and Photnitrate were higher during daytime. The impact of Esoil in the NCP was small; nevertheless, Xue et al. (2021) found strong soil HONO emissions in NCP agricultural fields after fertilization, suggesting that this source may have a significant enhancement on regional HONO and secondary pollutants in crop-growing seasons.
The comparison of HONO concentrations/enhancements during a haze-aggravating process and a clean period is shown in Figs. 7 and 8. Generally, daytime HONO concentrations increased during haze-aggravating processes and were higher than concentrations on clean days. Hetground was the dominant source of the surface HONO on both hazy and clean days and contributed 80 %–90 % of daytime averaged HONO concentrations (Fig. 8); however, this reaction occurred only on the ground surface, thus its relative contribution decreased with height, especially during haze-aggravating processes (Fig. 8). Although the contribution of the NO + OH reaction to daytime HONO was small near the surface, its relative contribution to HONO increased with height, especially on clean days (Fig. 8). As for Photnitrate, a much larger enhancement was found on hazy days compared with clean days. On clean days the daytime enhanced HONO by Photnitrate was only 1–3 ppt in general, and its contribution to daytime HONO was usually <10 %. During the haze-aggravating process, however, the enhanced HONO concentration by Photnitrate was about 10 times higher than that on clean days and Photnitrate became the dominant HONO source (∼ 30 %–70 %) at higher altitude, and both HONO concentrations and contributions by Photnitrate increased with the air pollution aggravation (Figs. 7a–c, 8a–c). The contributions of direct emission sources were small and decreased when PM2.5 increased, compared with the heterogeneous reactions. Higher concentrations of NO2, nitrate, and PM2.5 favored heterogeneous formation of HONO, while direct emission sources were relatively invariable under different pollution levels.

Figure 7The 95-NCP-site-averaged daytime HONO concentrations at different heights when the NO + OH reaction and the six potential HONO sources were included for a typical haze-aggravating process during 19–21 October (a–c) and a clean period during 27–29 October 2018 (d–f). The numbers in black in the first column of each graph are for Photnitrate, and the numbers in gray in the second column are for Hetground.
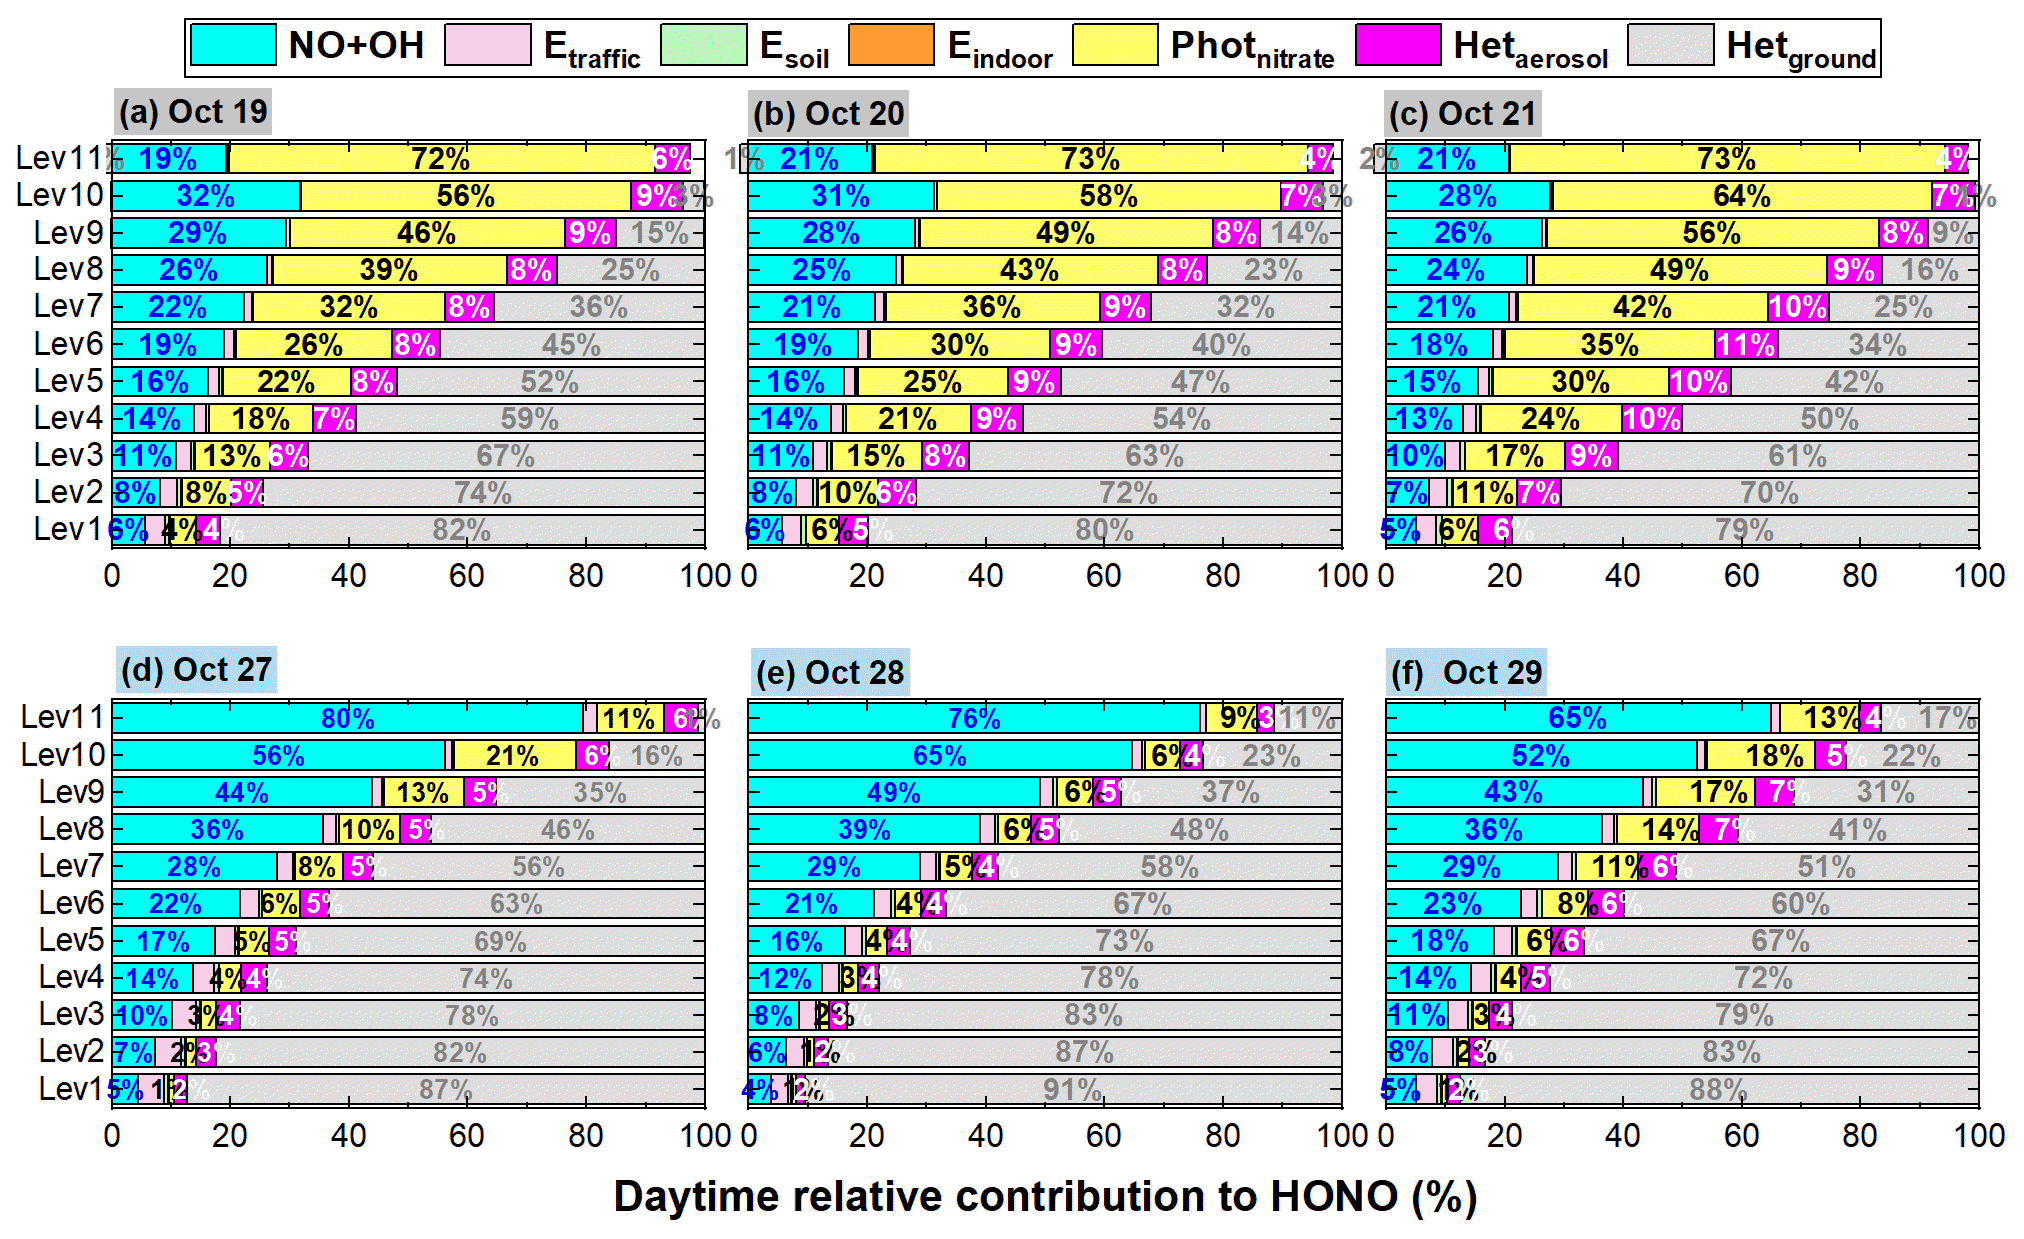
Figure 8The 95-NCP-site-averaged relative contributions of the NO + OH reaction and each of the six potential HONO sources to daytime HONO concentrations at different heights for a typical haze-aggravating process during 19–21 October (a–c) and a clean period during 27–29 October 2018 (d–f). The numbers in blue in the first column of each graph are for the NO + OH reaction, the numbers in black in the second column are for Photnitrate, the numbers in white in the third column are for Hetaerosol, and the numbers in gray in the fourth column are for Hetground).
Our results show that nitrate concentrations increased with the haze-aggravating processes (Fig. 2b), and as a positive feedback effect, the elevated nitrate could in turn enhance HONO formation and further enhance the atmospheric oxidation capacity during daytime. Considering Jnitrate is still unclear, sensitivity tests were conducted and are presented in the discussion section.
3.3.2 Enhanced OH and its production rate
Figure 9 demonstrates daytime variations in OH production (P(OH)) and loss (L(OH)) rates near the surface and in the vertically averaged layer (from the ground to a height of 2.5 km) at the 95 NCP sites for the Base and 6S cases during 11–31 October 2018. A significant enhancement of (OH) can be found near the surface and vertically; the six potential HONO sources accelerated OH production and loss rates remarkably near the surface and noticeably in the vertical layers considered.
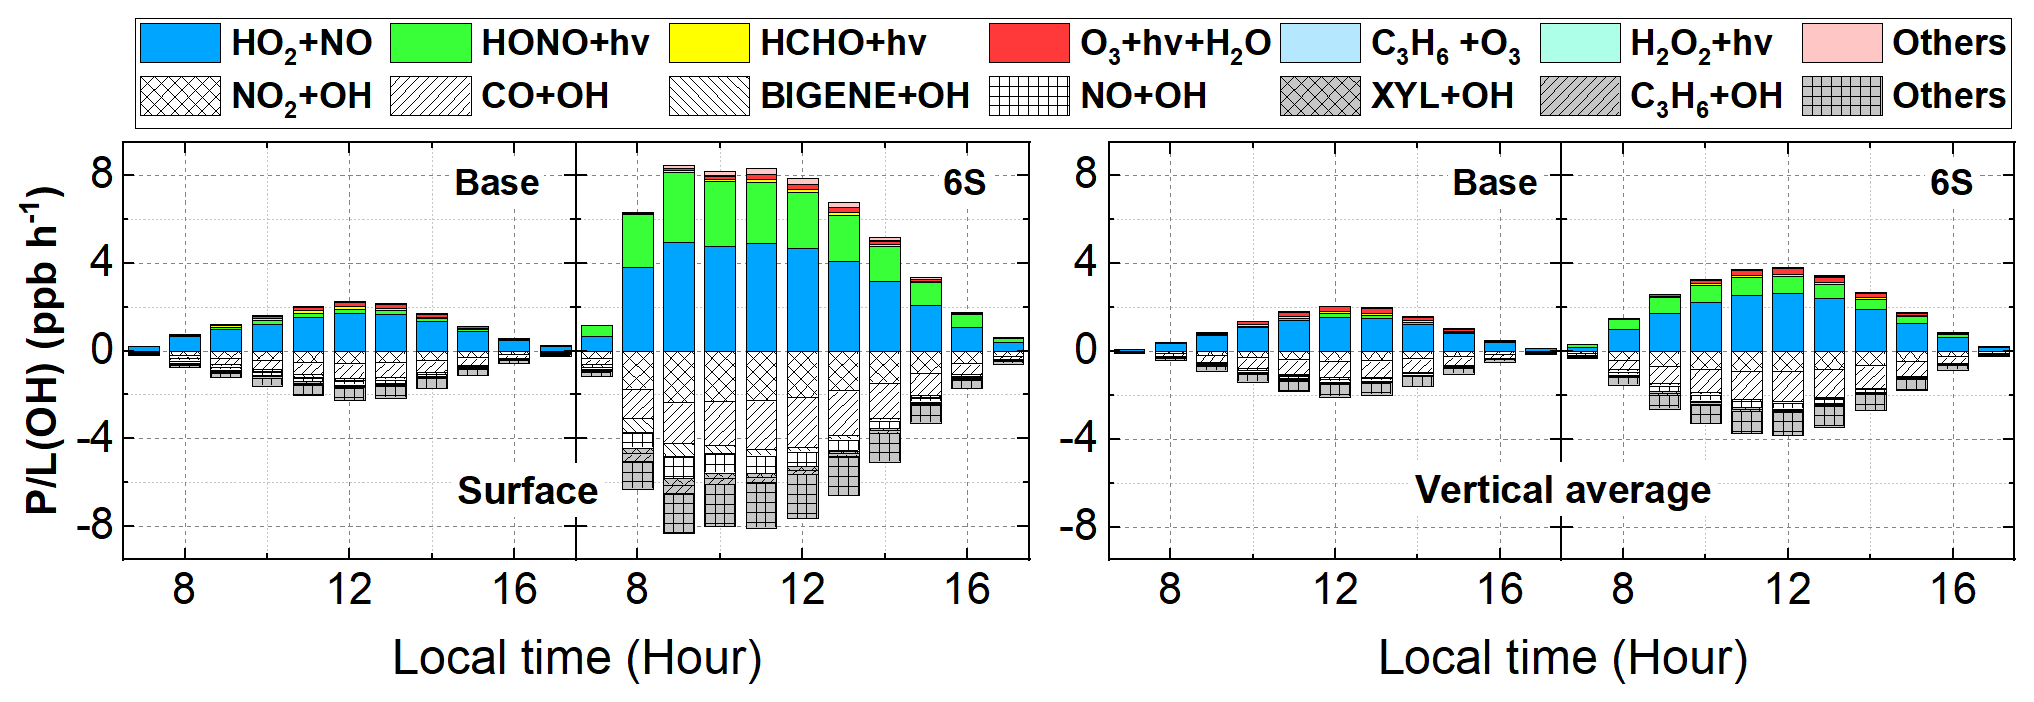
Figure 9Diurnal mean variations in OH production (P(OH)) and loss (L(OH)) rates including major production and loss reactions near the surface and in the vertically averaged layer (from the ground to a height of 2.5 km) at the 95 NCP sites for the Base and 6S cases during 11–31 October 2018.
Near the surface, daytime P(OH) and L(OH) were significantly enhanced by ∼ 320 % for the 6S case (mean was 5.27 ppb h−1) compared with the base case (mean was 1.26 ppb h−1). For the base case, the daytime P(OH) via the photolysis of HONO and O3 was 0.09 and 0.09 ppb h−1, respectively, while the daytime L(OH) via the NO + OH reaction was 0.11 ppb h−1, and the net contribution of HONO photolysis to P(OH) was −0.02 ppb h−1. After adding the six potential HONO sources in case 6S, the daytime P(OH) via the photolysis of HONO and O3 was 1.81 and 0.10 ppb h−1, respectively, the daytime L(OH) via the NO + OH reaction was 0.48 ppb h−1, and the net contribution of HONO photolysis to P(OH) reached 1.33 ppb h−1. HONO photolysis was the main source of the primary formation of OH, while the secondary formed OH via the reaction of HO2+NO (3.14 ppb h−1) was the dominant source of the total OH formation.
Vertically, daytime P(OH) or L(OH) was enhanced by ∼ 105 % for the 6S case (mean was 2.21 ppb h−1) compared with the base case (mean was 1.08 ppb h−1). For the base case, the daytime P(OH) via the photolysis of HONO and O3 was 0.06 and 0.10 ppb h−1, respectively, while the daytime L(OH) via the NO + OH reaction was 0.07 ppb h−1, and the net contribution of HONO photolysis to P(OH) was −0.01 ppb h−1. After coupling the six potential HONO sources in case 6S, the daytime P(OH) via the photolysis of HONO and O3 and via the HO2 + NO reaction was 0.48, 0.12 and 1.52 ppb h−1, respectively, the daytime L(OH) via the NO + OH reaction was 0.15 ppb h−1, and the net contribution of HONO photolysis to P(OH) was 0.33 ppb h−1.
Figure 10 shows the linear relationships between daytime-averaged P(OH) and PM2.5 concentrations and between daytime-averaged OH and PM2.5 concentrations from the ground to a height of 2.5 km at the 95 NCP sites during 11–31 October 2018. Both P(OH) for the two cases (Base and 6S) and the enhanced P(OH) due to the six potential HONO sources showed a strong positive correlation (r>0.8) with PM2.5 concentrations at the 95 NCP sites, because Hetaerosol, Hetground, and Photnitrate were significantly increased with the elevated pollution level. The enhanced P(OH) for the 6S case reached 0.043 ppb h−1 per 1 µg m−3 of a PM2.5 enhancement. Similarly, a high positive correlation (r>0.6) was found between OH and PM2.5 concentrations; the OH concentrations and enhancements due to the six potential HONO sources were both higher on hazy days than those on clean days, and the enhancement of OH reached 3.62 × 10⁴ molec cm−3 per 1 µg m−3 of PM2.5 for case 6S. These results are consistent with a recent field study reported by Slater et al. (2020), who found that the OH observed in haze events was elevated in central Beijing during November–December 2016. Furthermore, two observations confirmed the key role of HONO in producing primary OH despite the relatively lower photolysis frequency in haze-aggravating processes (Slater et al., 2020; Tan et al., 2018), consistent with our simulations (Fig. S7 shows the relationship between surface PM2.5 and photolysis frequencies of NO2, HONO, and HNO3 in this study).

Figure 10The linear relationships between daytime-averaged P(OH) and PM2.5 concentrations (a) and between daytime-averaged OH and PM2.5 concentrations (b) from the ground to a height of 2.5 km at the 95 NCP sites during 11–31 October 2018.
Figures 11 and 12 show detailed comparisons of P(OH) and OH enhancements during a haze-aggravating process and a clean period. It can be seen that both P(OH) and OH were enhanced on hazy days compared with clean days, and P(OH) and OH increased with the aggravated haze pollution. Among the six potential HONO sources, Hetground was the largest contributor to the enhanced P(OH) and OH near the surface, but its contribution was relatively stable under different pollution levels and was rapidly reduced with height on both hazy and clean days; the contribution induced by Photnitrate was remarkably increased in haze-aggravating processes and was about 10 times higher than that on clean days; Hetaerosol also increased with the pollution levels but with relatively small values, while the impact of other three direct emission sources of HONO was quite small.

Figure 11The 95-NCP-site-averaged daytime P(OH) for the base case and the enhancements due to the six potential HONO sources for a typical haze-aggravating process during 19–21 October (a–c) and a clean period during 27–29 October 2018 (d–f). The numbers in black in the first column of each graph are for Photnitrate, and the numbers in gray in the second column are for Hetground.
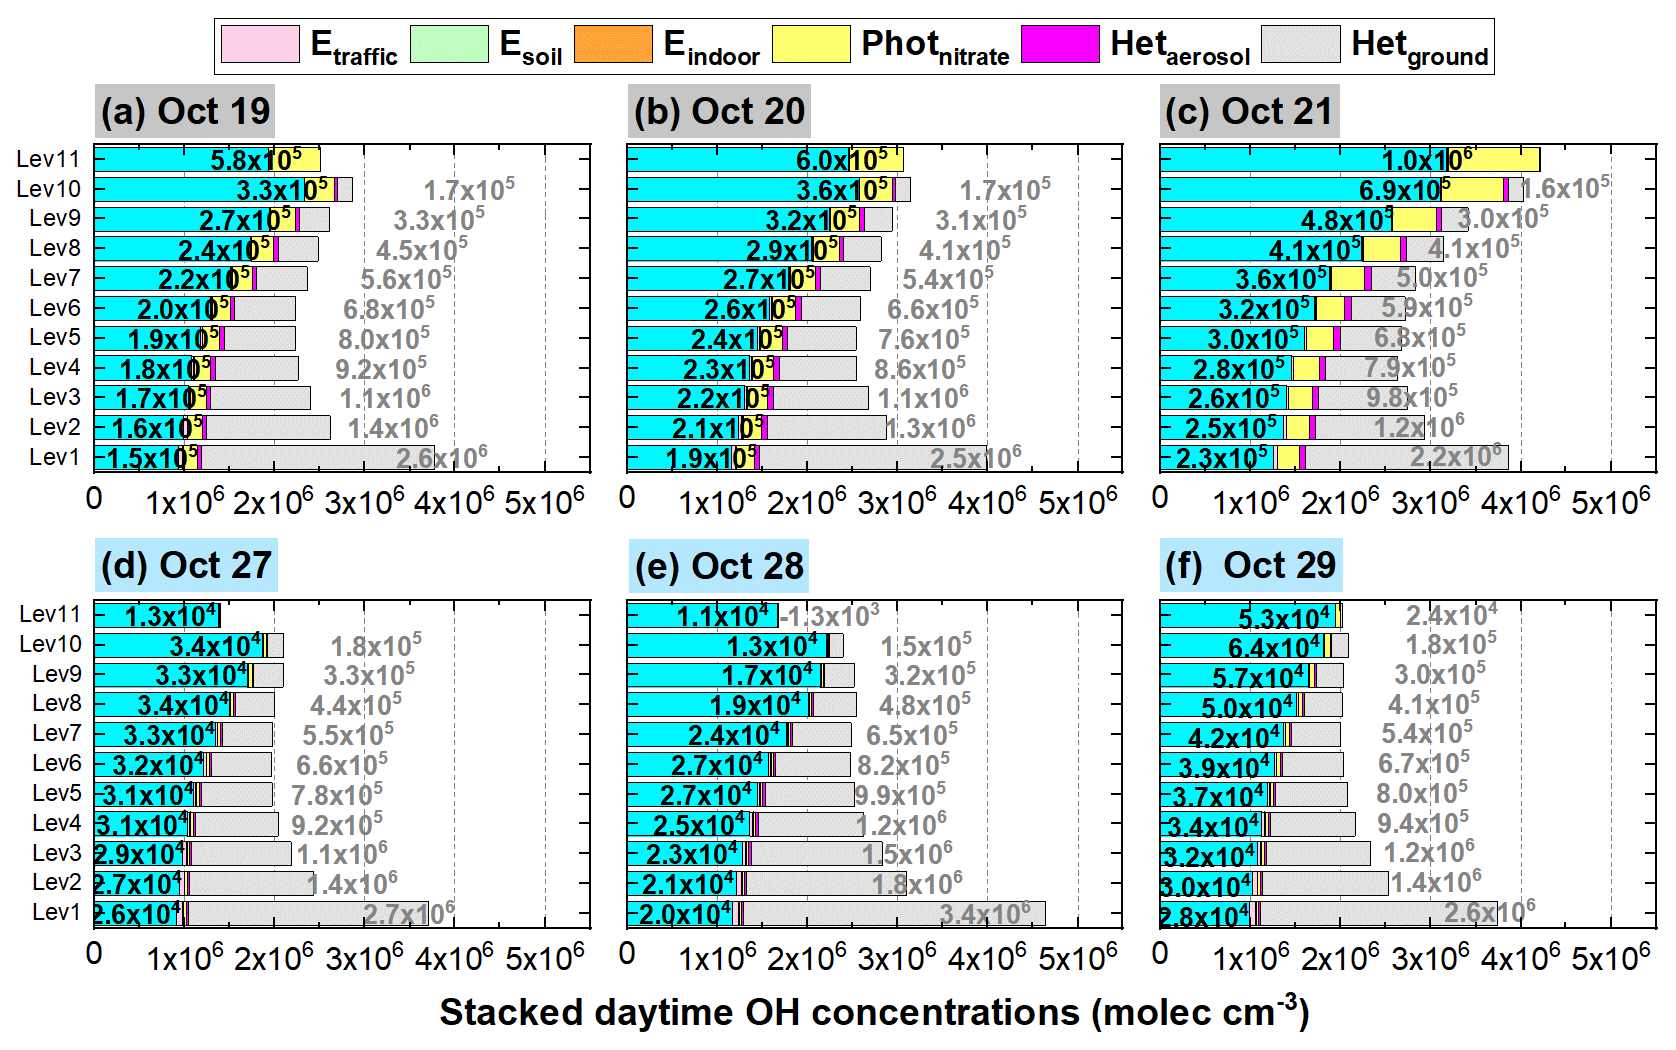
Figure 12The 95-NCP-site-averaged daytime OH concentrations for the base case and the enhancements due to the six potential HONO sources for a typical haze-aggravating process during 19–21 October (a–c) and a clean period during 27–29 October 2018 (d–f). The numbers in black in the first column of each graph are for Photnitrate, and the numbers in gray in the second column are for Hetground.
3.4 Enhanced DMA8 O3
Figure 13 demonstrates the linear relationship between DMA8 O3 enhancements and daytime PM2.5 concentrations in each vertical layer and the averaged vertical layer for the 11 layers considered at the 95 NCP sites during 11–31 October 2018. A good correlation (r>0.8) between DMA8 O3 enhancements and daytime PM2.5 concentrations in the vertical averaged layer (similar reasons for the strong positive correlation between the enhanced P(OH) and PM2.5 concentrations shown above) suggests that the enhanced O3 due to the six potential HONO sources was larger on polluted days and increased during the haze-aggravating processes. The enhanced DMA8 O3 was <2 ppb when PM2.5 was <20 µg m−3 and was >10 ppb when PM2.5 was >60 µg m−3 on average, with a mean DMA8 O3 enhancement of 0.24 ppb per 1 µg m−3 of PM2.5.
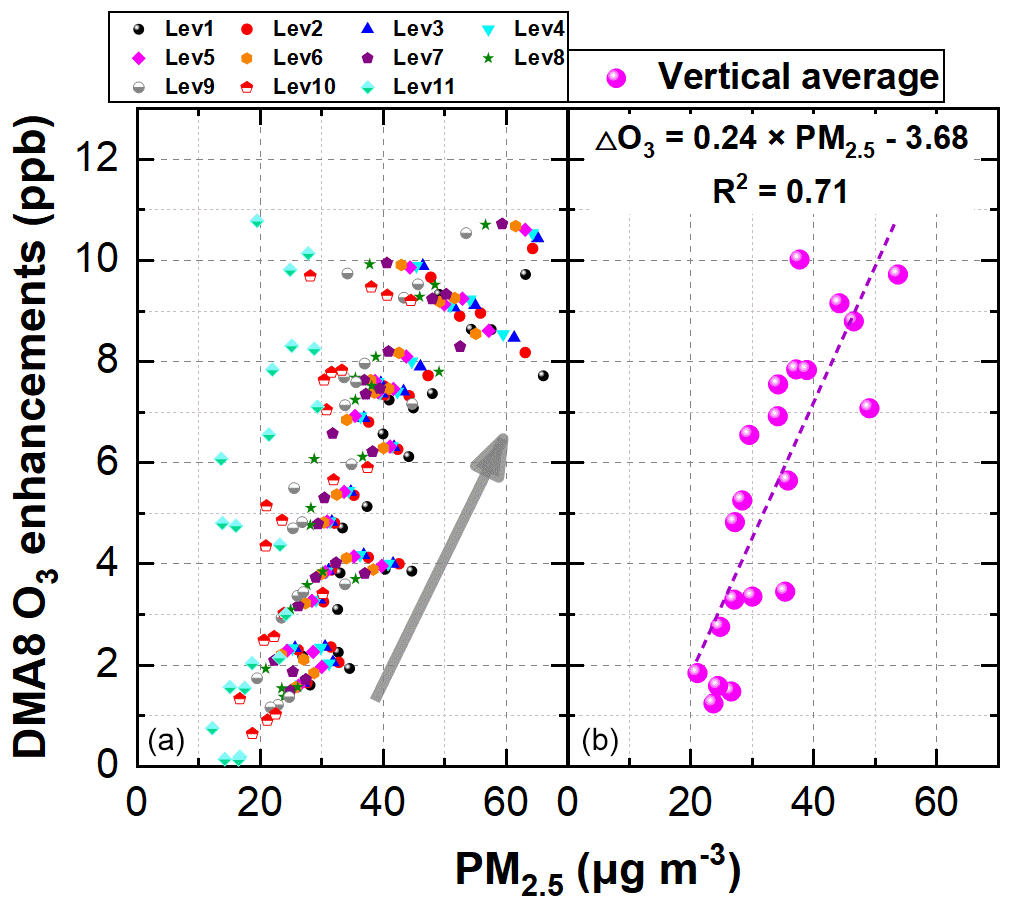
Figure 13The linear relationship between DMA8 O3 enhancements and daytime PM2.5 concentrations in each vertical layer (a) and the averaged vertical layer for the 11 layers considered (b) at the 95 NCP sites during 11–31 October 2018.
Figure 14 shows the 95-NCP-site-averaged DMA8 O3 enhancements due to the six potential HONO sources for a typical haze-aggravating process during 19–21 October and a clean period during 27–29 October 2018. A significant enhancement of DMA8 O3 can be found during the haze-aggravating process compared with that during clean days. The enhanced DMA8 O3 was ∼ 5.5 ppb (19 October), ∼ 7 ppb (20 October), and ∼ 10 ppb (21 October), during the haze-aggravating process, while it was usually ∼ 2 ppb on clean days.
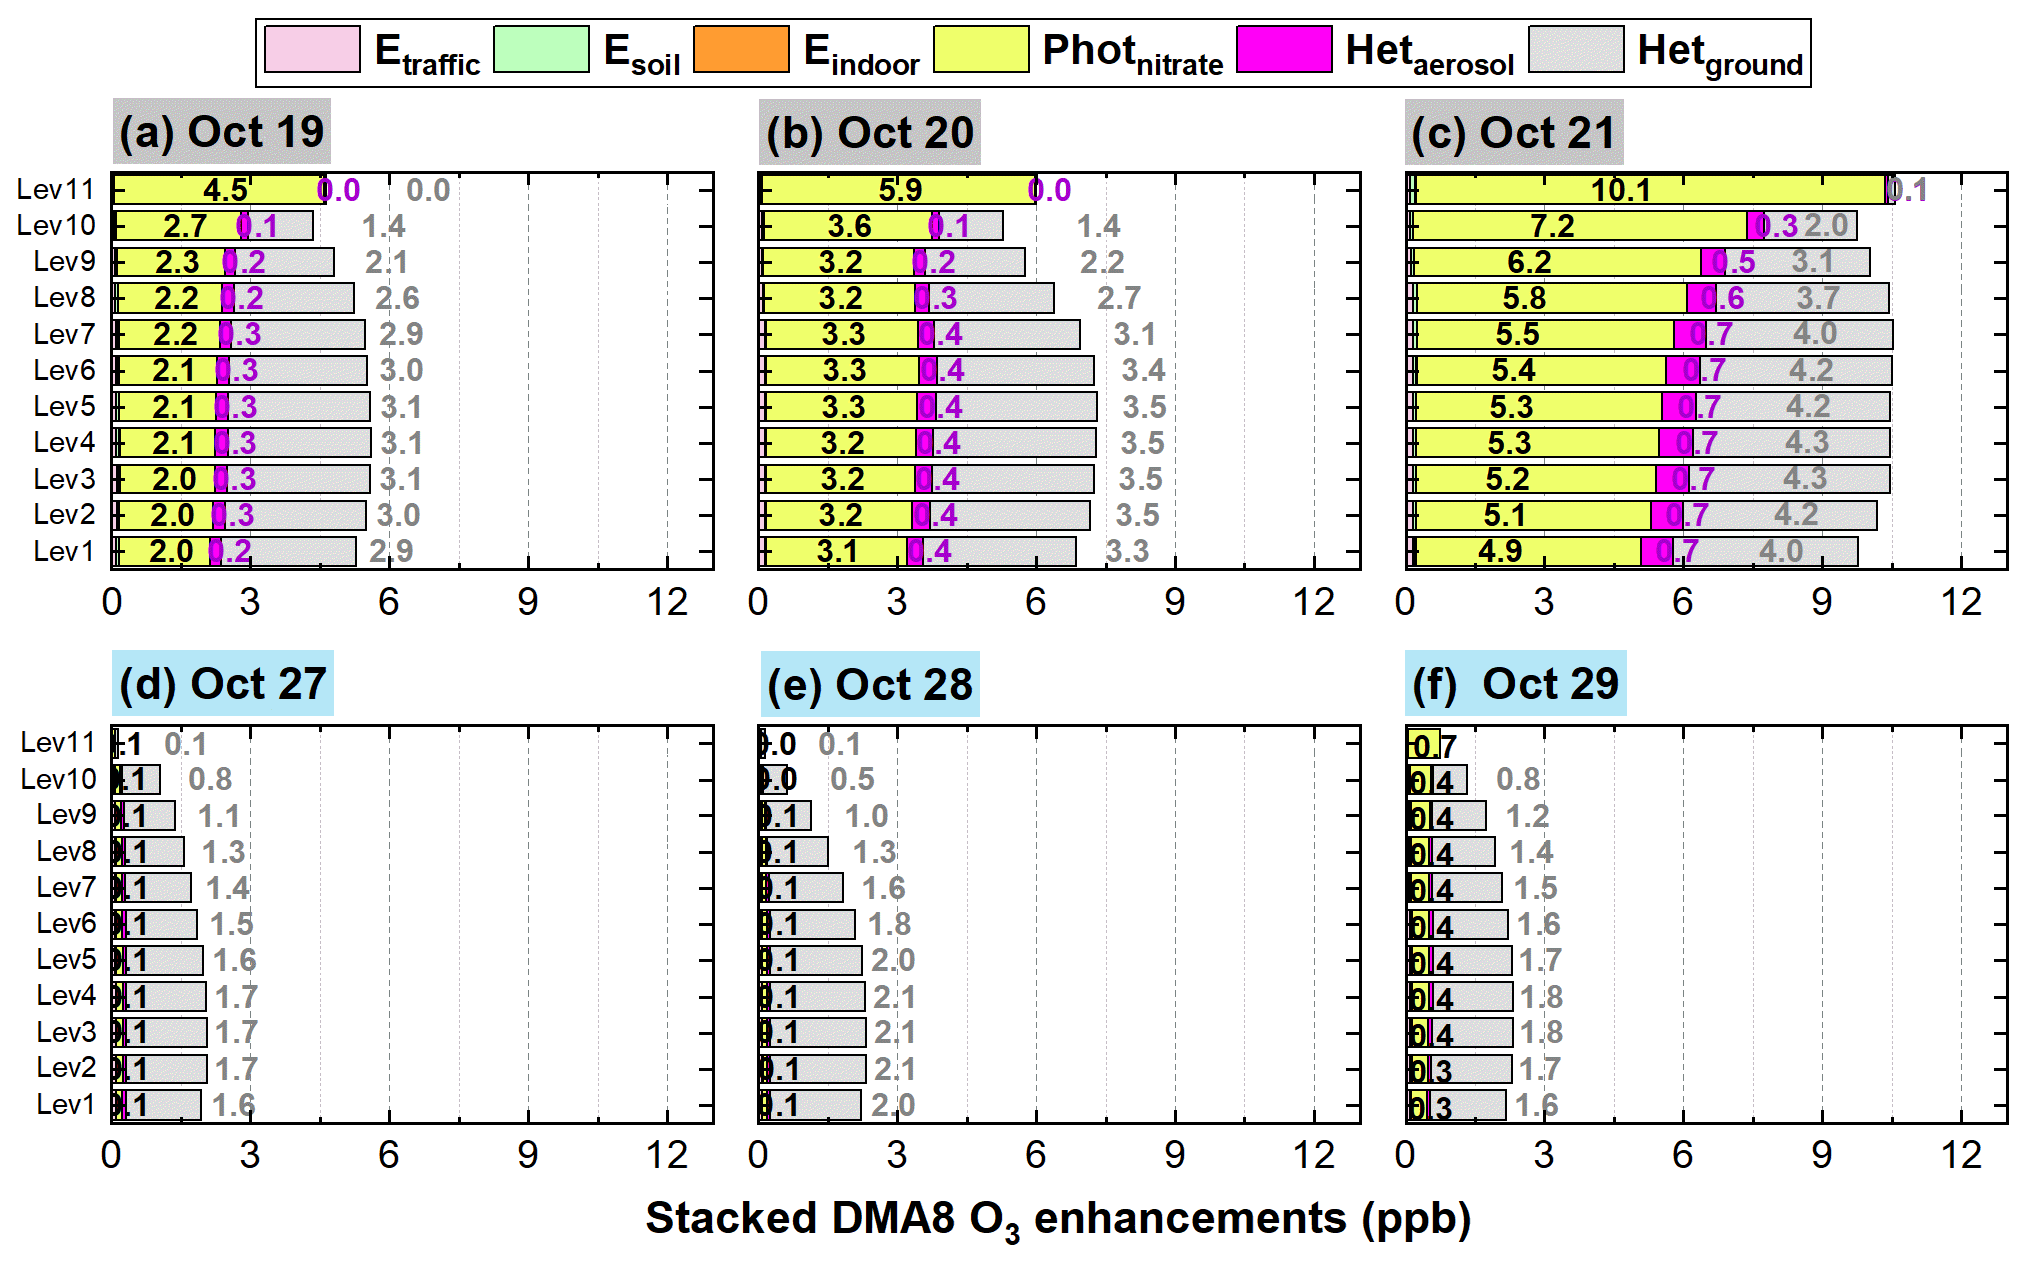
Figure 14The 95-NCP-site-averaged DMA8 O3 enhancements due to the six potential HONO sources for a typical haze-aggravating process during 19–21 October (a–c) and a clean period during 27–29 October 2018 (d–f). The numbers in black in each graph are for Photnitrate, the numbers in purple are for Hetaerosol, and the numbers in gray are for Hetground.
On clean days, Hetground was the dominant contributor (∼ 1.5–2 ppb) to the enhanced DMA8 O3 among the six potential HONO sources; the contribution of Photnitrate to the enhanced DMA8 O3 was ∼ 0.1–0.4 ppb, while that of the other four sources was minor. In the comparison between the haze-aggravating process (19–21 October) and clean days, the DMA8 O3 enhancements induced by Hetground were doubled and reached ∼ 3–4 ppb; the contribution of Photnitrate to the enhanced DMA8 O3 substantially increased and reached ∼ 2–4.5 ppb (19 October), ∼ 3–6 ppb (20 October),and ∼ 5–10 ppb (21 October). Hetaerosol showed an increasing contribution to the enhanced DMA8 O3 during the haze-aggravating process (∼ 0.3 ppb on 19 October, ∼ 0.4 ppb on 20 October, and ∼ 0.7 ppb on 21 October), while the impacts of the other three direct emission sources (Etraffic, Esoil, and Eindoor) on the enhanced DMA8 O3 were minor.
3.5 Vertical variations of O3-NOx-VOC sensitivity
Based on the results presented in the previous section, Photnitrate significantly enhanced the DMA8 O3 10-fold in the vertical layers considered (especially at elevated heights) during polluted events, although previous studies have not fully discussed this. To better understand its role in vertical O3 formation, the O3-NOx-VOC sensitivity was analyzed by using the P(H2O2)(HNO3) ratio proposed by Sillman (1995), which is more suitable than the concentration ratio of H2OHNO3 because of the large dry deposition velocity of the two gases in the troposphere (Sillman, 1995). A transition point of P(H2O2)(HNO3)=0.35 was suggested by Sillman (1995); when P(H2O2)(HNO3) was <0.35, O3 shows VOC-sensitive chemistry (increasing VOC concentrations can significantly elevate O3 levels) and when P(H2O2)(HNO3) was >0.35, O3 tends to NOx-sensitive chemistry (increasing NOx concentrations can significantly elevate O3 levels).
Figure 15 demonstrates the 95-NCP-site-averaged P(H2O2)(HNO3) ratio at each vertical layer for the 6S case for a typical haze-aggravating process during 19–21 October and a clean period during 27–29 October 2018. A clearly opposite O3 sensitivity appeared between the lower layers (VOC sensitive) and the higher layers (NOx sensitive) on both clean and hazy days, and the transition point usually appeared at the eighth layer (∼ 600–800 m).
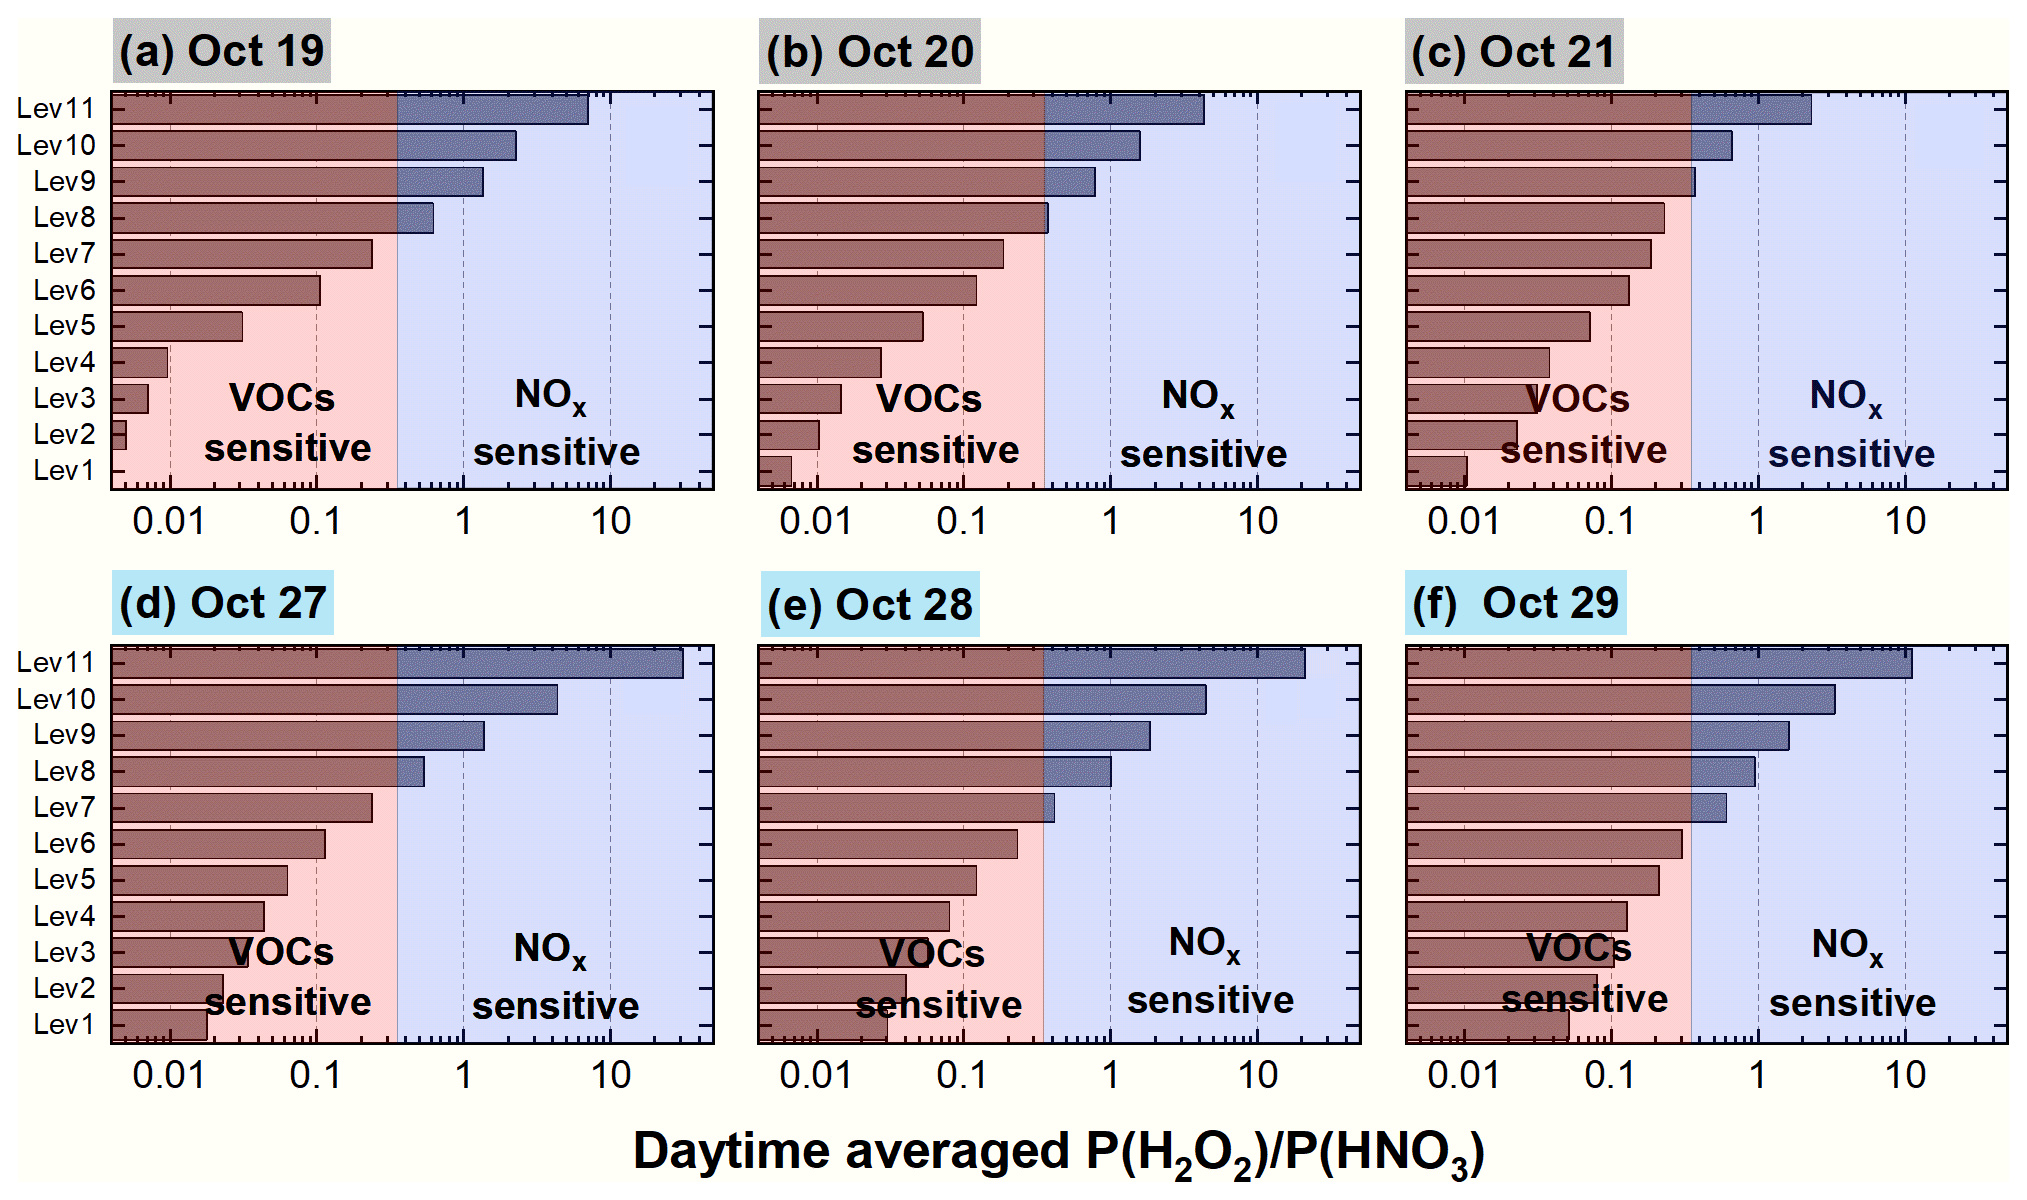
Figure 15The 95-NCP-site-averaged P(H2O2)(HNO3) ratio at each vertical layer for the 6S case for a typical haze-aggravating process during 19–21 October (a–c) and a clean period during 27–29 October 2018 (d–f).
The Photnitrate reaction is assumed to produce HONO and NOx (Zhou et al., 2003; Romer et al., 2018; Gen et al., 2022). This reaction not only enhances OH concentrations via HONO photolysis, but also directly releases NOx back into the troposphere. Considering the NOx-sensitive O3 chemistry at higher layers (>800 m), elevating OH and NOx concentrations are both favorable for O3 formation, especially in haze-aggravating processes with abundant nitrate (detailed vertically enhanced O3 production/loss rates induced by Photnitrate are shown in Fig. S8).
The specific role of the HONO or NO2 produced via the Photnitrate reaction (Reaction R2) in DMA8 O3 enhancements was further analyzed and is shown in Fig. 16. The produced NO2 and HONO jointly promoted O3 formation and increased DMA8 O3 concentrations. From the surface to ∼ 1200 m (Level 9), the DMA8 O3 enhancements for case D_HONO was ∼ 5 times those for case D_NO2, while at ∼ 2000 m (Level 11) the DMA8 O3 enhancements for case D_HONO was ∼ 2 times those for case D_NO2. A balance exists between the propagation of the free radical interconversion cycle and the rate of termination of the cycle for the O3 formation chemistry (Gligorovski et al., 2015). Considering the 0.67 and 0.33 yields (ratio of 2) for the two products, we could conclude that the impact of produced HONO on O3 enhancements was larger than that of produced NO2 near the surface, while at higher altitude (>2000 m) the impacts of the two products were similar.
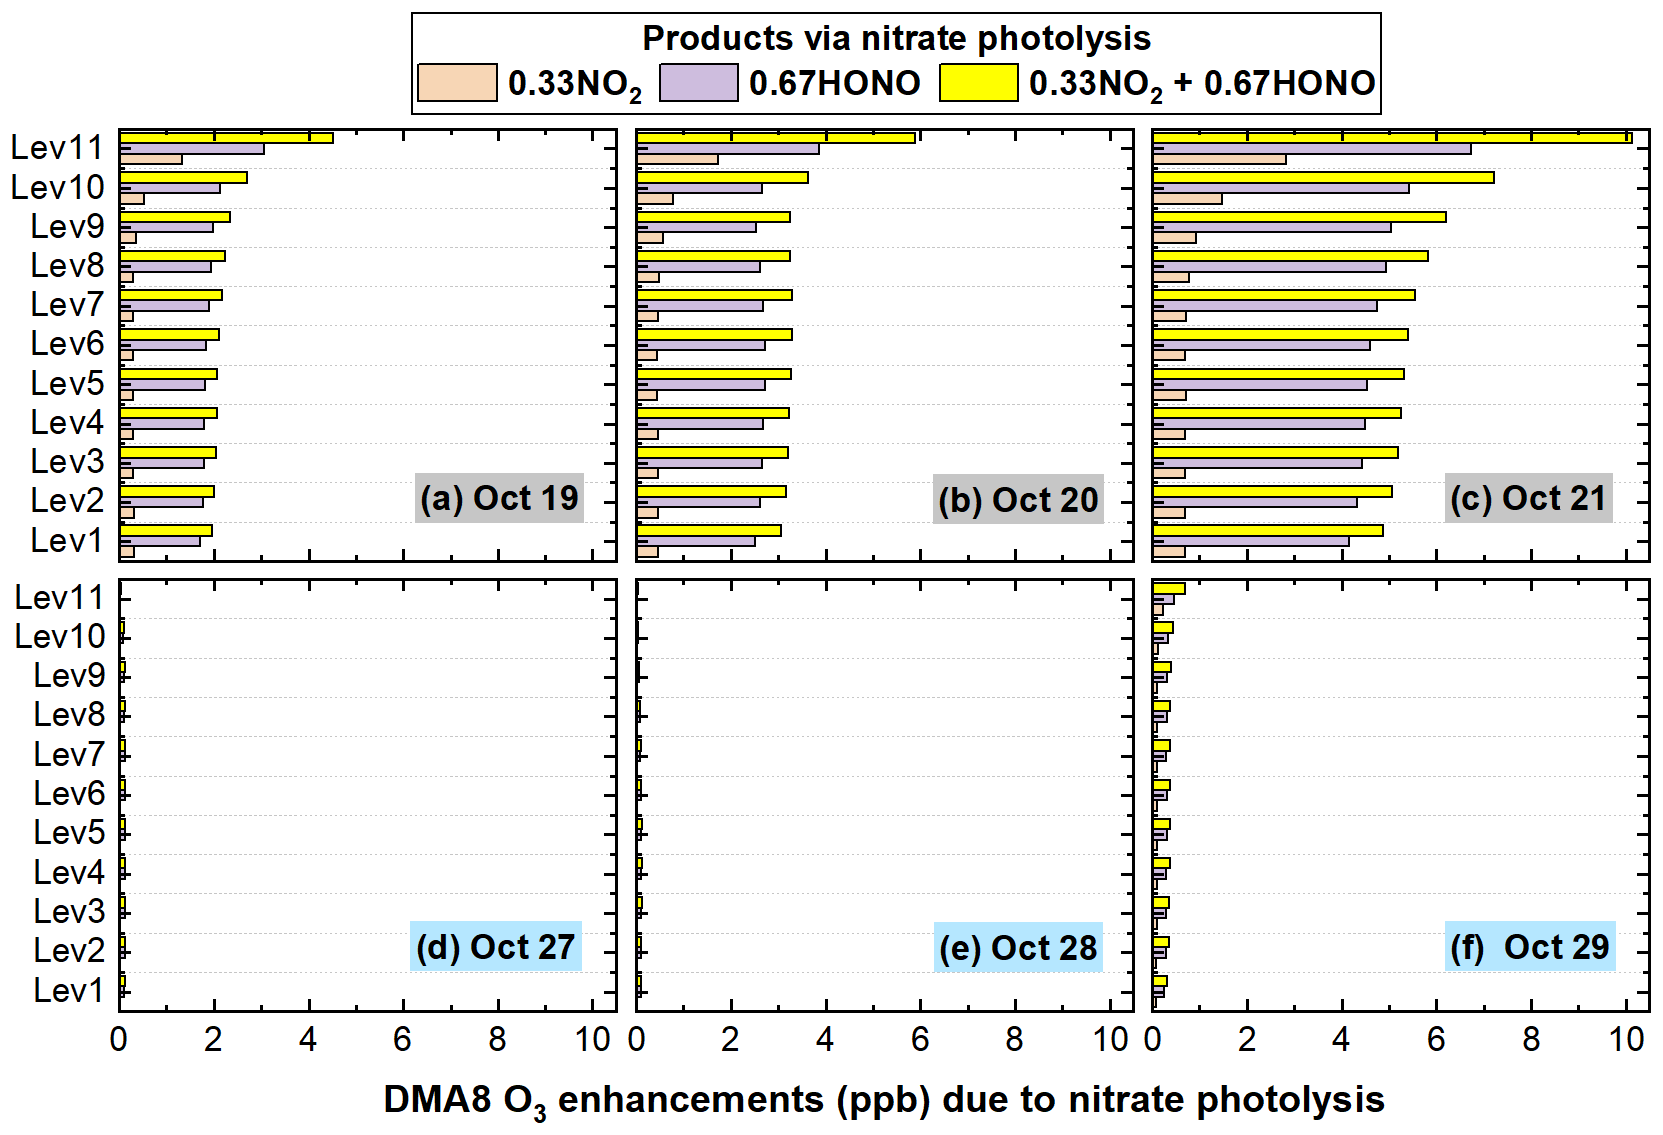
Figure 16The 95-NCP-site-averaged DMA8 O3 enhancements due to nitrate photolysis with three product scenarios (cases D_NO2, D_HONO and D) for a typical haze-aggravating process during 19–21 October (a–c) and a clean period during 27–29 October 2018 (d–f).
4.1 Vertical variations of potential HONO sources
The relative contribution of potential HONO sources near the surface, corresponding to the first model layer (0 to ∼ 35 m) in our simulation, was quantified in previous modeling studies (Fu et al., 2019; Xue et al., 2020; Zhang et al., 2021); however, for those potential HONO sources, their relative contributions to HONO concentrations near and above the surface should be different. Based on our results (Figs. 7 and 8), the effects of aerosol-related HONO sources would be severely underestimated on hazy days when only focused on surface HONO, especially for Photnitrate. Near the surface in NCP, the daytime contribution of Photnitrate to HONO concentrations on hazy days was only ∼ 4 %–6 %, but this source contributed ∼ 35 %–50 % of the enhanced DMA8 O3 (Fig. 14a–c); above the eighth layer (∼ 800 m), this source contributed ∼ 50 %–70 % of HONO concentrations and ∼ 50 %–95 % of the enhanced DMA8 O3 (Fig. 14a–c).
A recent observation in urban Beijing reported vertical HONO concentrations from three heights above the ground and found that extremely high HONO concentrations occurred at 120 m (∼ 5 ppb) and 240 m (∼ 3 ppb) rather than near the surface (∼ 1.2 ppb) during 12:00 on a typical hazy day (W. Q. Zhang et al., 2020). The observation was unusual at noontime under strong convection conditions, inconsistent with those during most of the previous observations indicating a HONO decreasing trend with height, especially with the observational results of Zhu et al. (2011) and Meng et al. (2020) as well as the simulated results of Zhang et al. (2021) and our results in Fig. S6 at the same observational site. The contributions of different HONO sources at each layer were analyzed by using a box model, but ∼ 80 %–90 % of the noontime HONO at higher layers could not be explained by the known HONO formation mechanisms (W. Q. Zhang et al., 2020). The box model neglected the vertical convection, and thus the ground-related HONO sources had no contribution to HONO concentrations at the higher layers; therefore, their HONO simulations were actually underestimated compared with our results and those from the studies by Wong et al. (2011) and Zhang et al. (2021).
4.2 Uncertainties of ratios and their impacts
4.2.1 Uncertainties of ratios in DMA8 O3 enhancements
Based on our results, Hetground and Photnitrate were the two major contributors to the enhanced DMA8 O3, especially for Photnitrate on hazy days with higher PM2.5 concentrations. The uncertainties of Photnitrate (four ratios) in O3 enhancements were analyzed and are shown in Fig. 17 (The uncertainties of Hetground are presented in Sect. S2). During the haze-aggravating process, the enhanced DMA8 O3 near the surface increased from ∼ 0.3 to ∼ 0.5 ppb, from ∼ 0.9 to ∼ 2 ppb, from ∼ 2 to ∼ 6 ppb, and from ∼ 5 to ∼ 12 ppb, with the ratio being 1, 7, 30, and 120, respectively, and the enhanced O3 increased with altitude. On clean days, the impact of Photnitrate on O3 enhancements was small (<1 ppb) even with a ratio of 120.
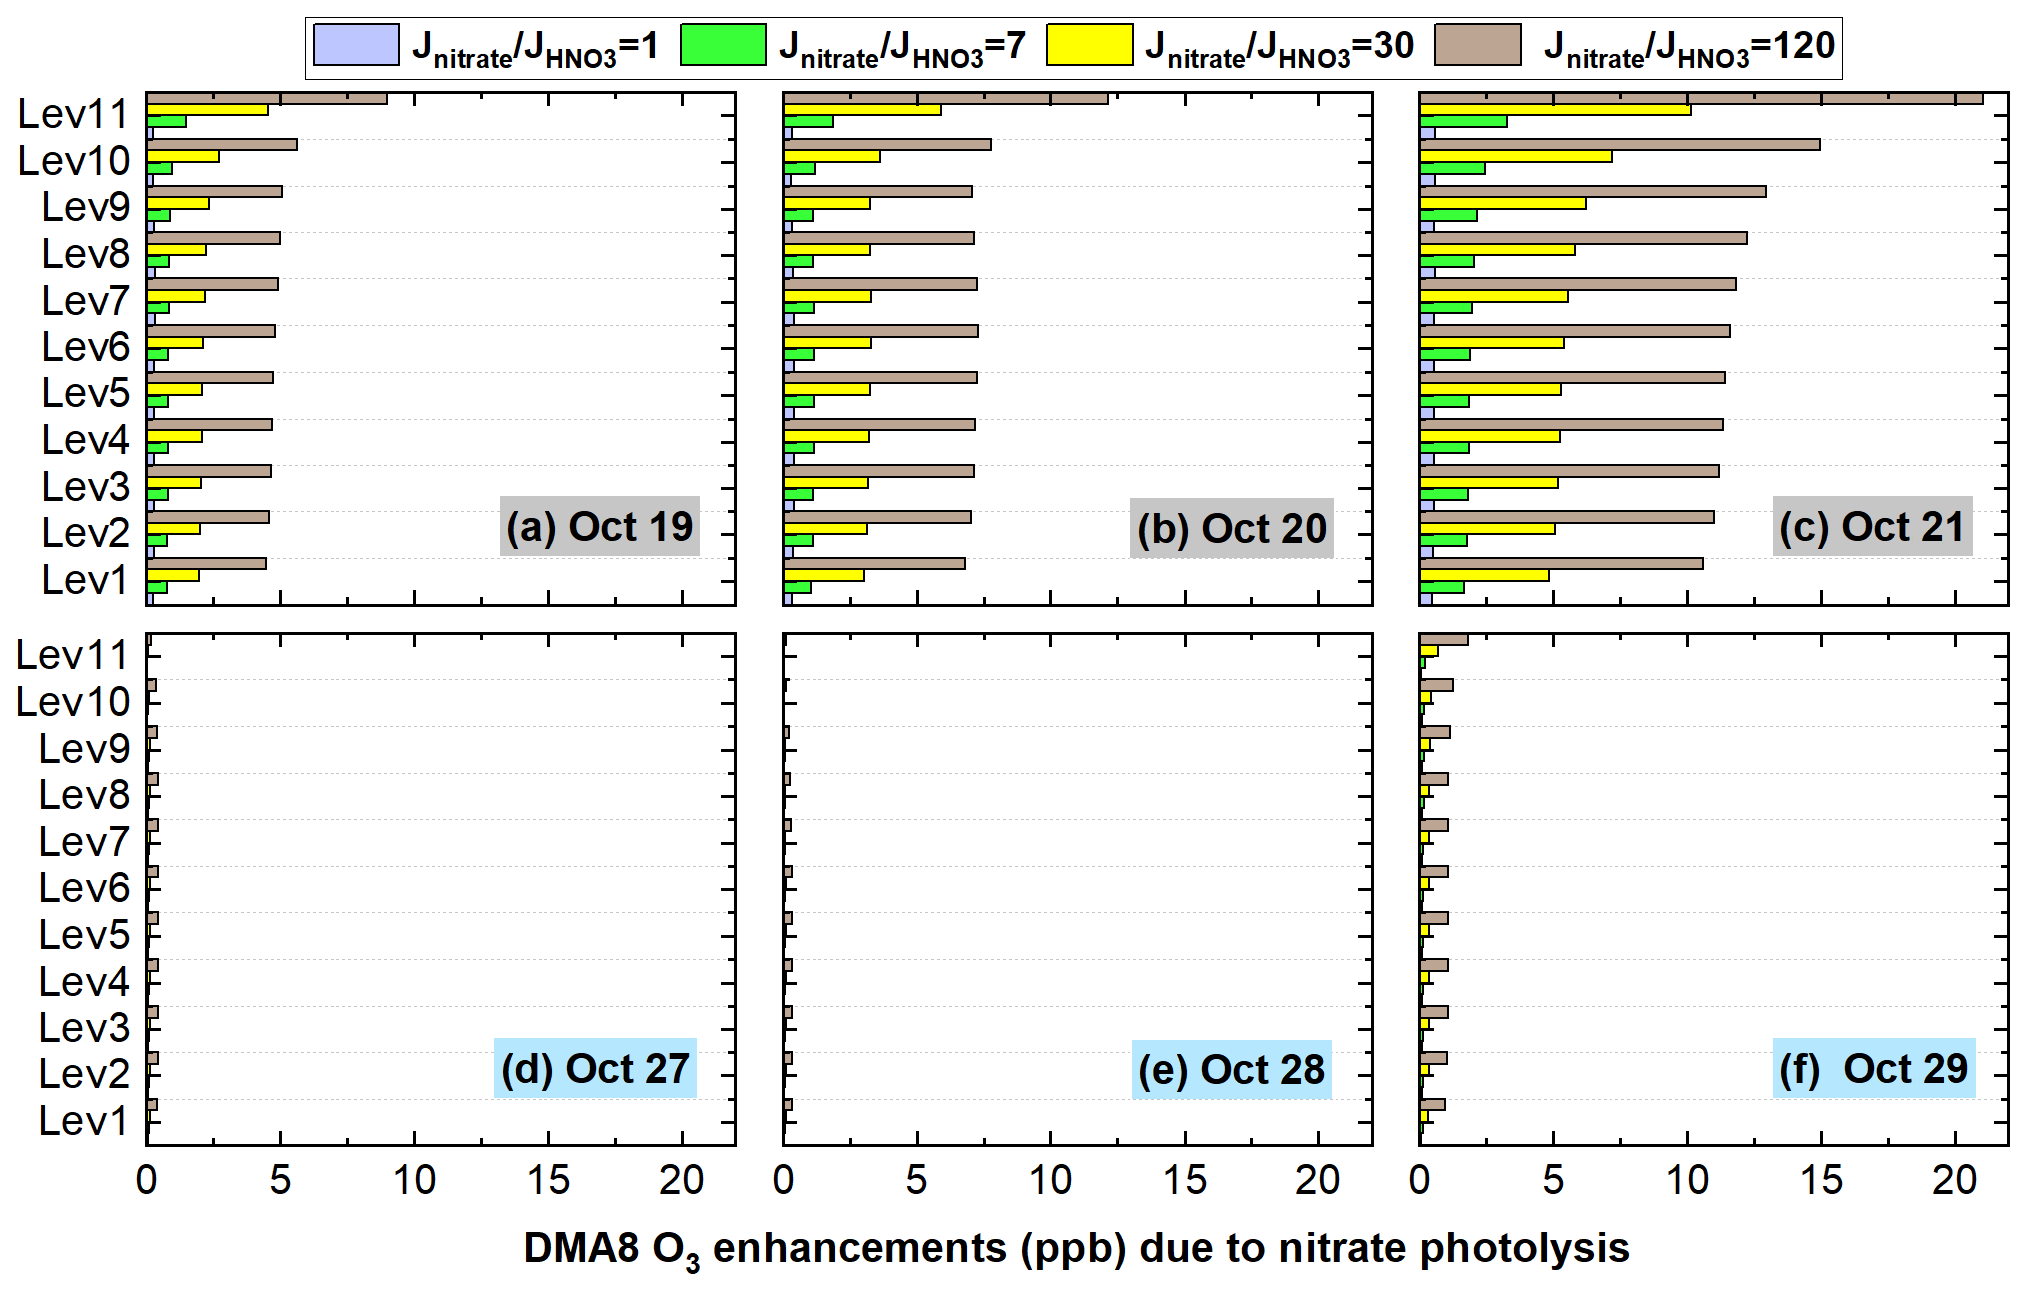
Figure 17The 95-NCP-site-averaged DMA8 O3 enhancement induced by nitrate photolysis with four ratios (1, 7, 30, and 120) for a typical haze-aggravating process during 19–21 October (a–c) and a clean period during 27–29 October 2018 (d–f).
4.2.2 Uncertainties of ratios in nitrate concentrations
We found considerable enhancements in O3 concentrations induced by Photnitrate, yet it is still unclear that to what extent Photnitrate could influence nitrate concentrations. The overall nitrate concentrations for the base case and the nitrate enhancements induced by the potential HONO sources decreased with rising altitude except for Photnitrate (Fig. S9a). Hetground enhanced nitrate concentrations by ∼ 1.5 µg m−3 near the surface and the enhancements decreased to <0.5 µg m−3 above the eighth model layer (∼ 800 m); the nitrate enhancements due to Hetaerosol and Etraffic near the surface were ∼ 0.2 and ∼ 0.1 µg m−3, respectively, and were <0.1 and <0.04 µg m−3 above the sixth model layer (∼ 500 m). For Photnitrate, the overall impact of four ratios on nitrate concentrations is shown in Fig. S9b; a smaller ratio of 1 or 7 had a limited impact on nitrate concentrations of ∼ 0–0.05 µg m−3, a ratio of 30 slightly decreased nitrate concentrations by ∼ 0.2 µg m−3, while the ratio of 120 decreased vertical nitrate concentrations by ∼ 0.3–0.8 µg m−3. The relative nitrate changes caused by Photnitrate were calculated by the differences between four cases of added Photnitrate (cases Nit_1, Nit_7, D, and Nit_120) and the base case (Fig. S9c). The vertical nitrate concentrations were reduced by ∼ 0 %–0.4 % (), ∼ 0 %–2 % (7), ∼ 2 %–5 % (30), and ∼ 10 %–14 % (120) at the 95 NCP sites, meaning that the Photnitrate impact on vertical nitrate concentrations is limited (<5 %) when adopting a relatively small ratio (<30) (Fig. S9c).
Romer et al. (2018) found a ratio of 10 or 30 had a much larger effect on HONO than on HNO3, and Photnitrate accounted for an average of 40 % of the total production of HONO, and only 10 % of HNO3 loss with a ratio of 10 (Fig. 5 in Romer et al., 2018), consistent with our study. From the production rate of gas HNO3 () in Fig. S10, we find that an increase in the ratio for Photnitrate simultaneously enhances the HNO3 production rate, and is favorable for nitrate formation via the reaction between HNO3 and NH3. Nitrate consumption is mitigated by the faster nitrate formation, and this is the main reason for less perturbation of the nitrate budget influenced by Photnitrate.
Figure 18 shows the detailed relative changes of nitrate caused by Photnitrate during a typical haze-aggravating process and a clean period (corresponding concentrations are shown in Fig. S11). The percentage nitrate reduction was usually smaller on hazy days than on clean days, mainly due to the slightly weaker photolysis frequency during pollution events (Fig. S7). The nitrate reduction was <5 % when adopting a ratio of 30 on both clean and hazy days and was <15 % in most cases even when the ratio reached 120.
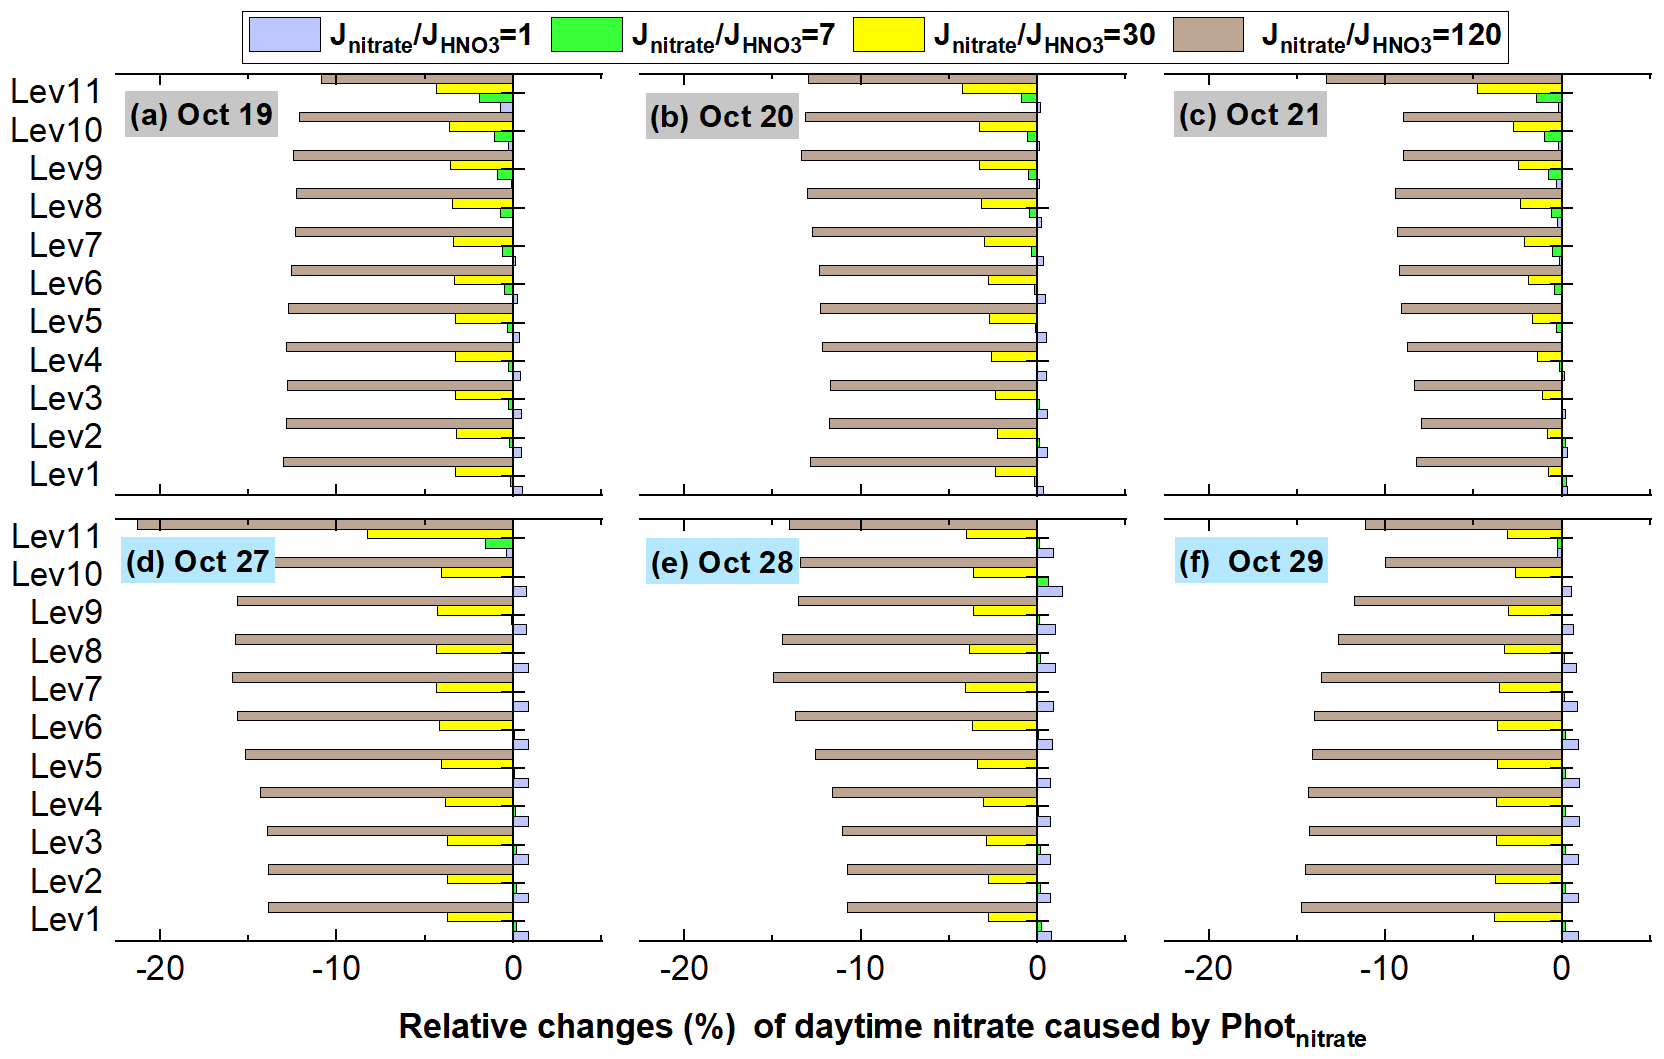
Figure 18The 95-NCP-site-averaged relative changes of nitrate with four ratios (1, 7, 30, and 120) compared with the base case for a typical haze-aggravating process during 19–21 October (a–c) and a clean period during 27–29 October 2018 (d–f).
4.2.3 Possible ranges of the ratio
From the above discussion, we find that the enhanced OH and O3 due to Photnitrate are significant during haze-aggravating processes, and the exact value of the ratio requires more study.
Figure 19 shows the diurnal patterns of surface-averaged and vertically averaged simulations of the Photnitrate frequency with four different ratios at the 95 NCP sites during the study period. The Photnitrate frequency at 12:00 was 3.7 × 10⁻⁷, 2.6 × 10⁻⁶, 1.1 × 10⁻⁵, and 4.5 × 10⁻⁵ s−1 when adopting a ratio of 1, 7, 30, and 120, respectively. The corresponding vertically averaged Photnitrate frequency was slightly larger (∼ 10 %) and was 4.2 × 10⁻⁷, 2.9 × 10⁻⁶, 1.3 × 10⁻⁵, and 5.0 × 10⁻⁵ s−1, respectively. Adopting a ratio of 30 in the 6S case, with the corresponding Jnitrate of 1.1–1.3 × 10⁻⁵ s−1, produced ∼ 30 %–50 % of the enhanced O3 near the surface on hazy days (Fig. 14), and ∼ 70 %–90 % of the enhanced O3 at higher layers (>800 m).
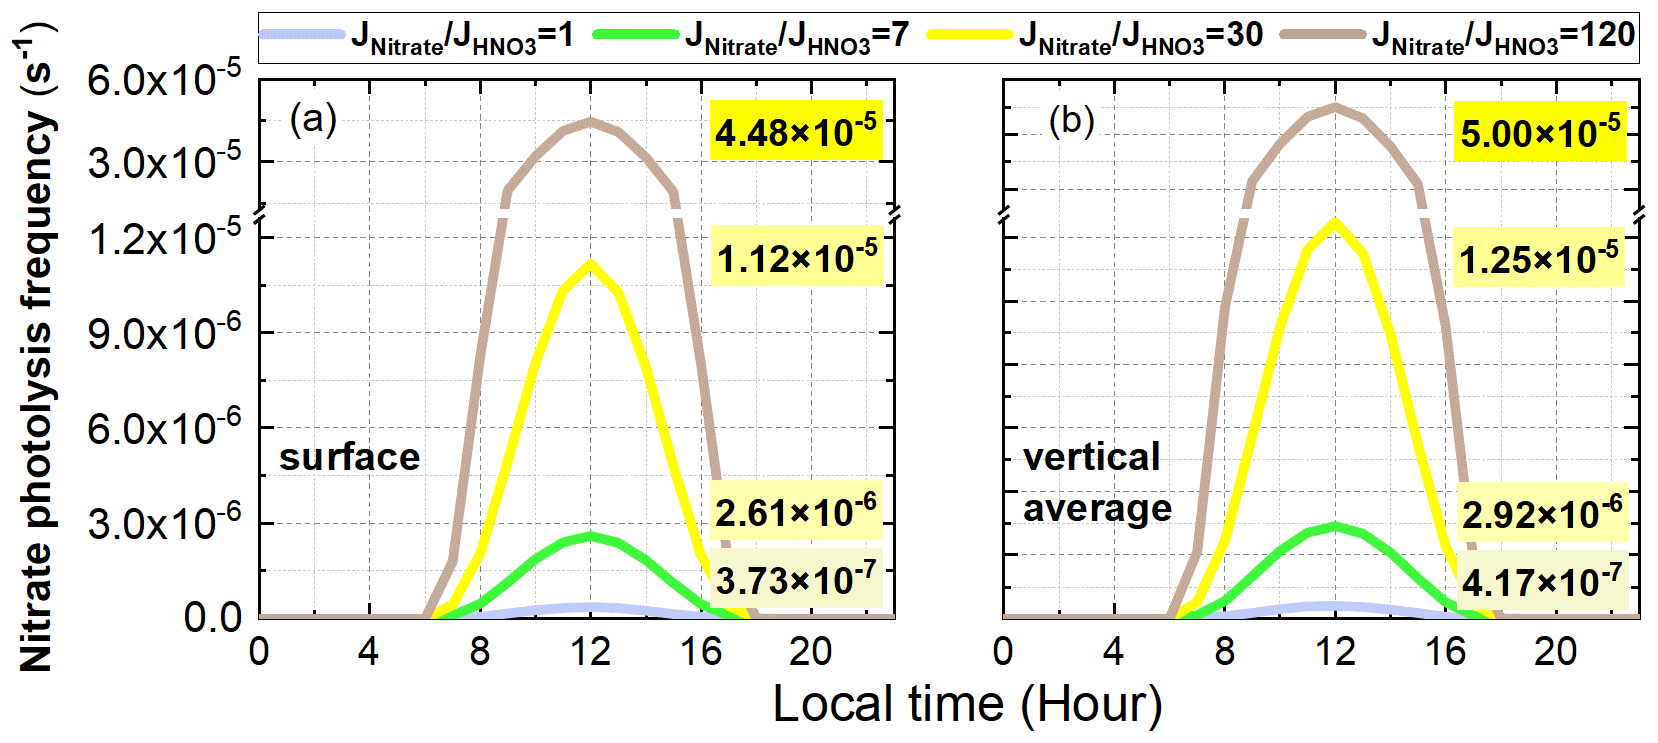
Figure 19Diurnal patterns of surface-averaged (a) and vertically averaged (b) simulations of the nitrate photolysis frequency with four different ratios (1, 7, 30, 120) at the 95 NCP sites during the study period. The nitrate photolysis frequencies at 12:00 are shown in each graph.
The reported values of Jnitrate from previous studies are summarized in Table 4. The experimental Jnitrate values have been controversial over the past two decades and are still being debated. In our simulations for the 6S case, Photnitrate contributed from ∼ 1 % (clean days) to ∼ 5 % (hazy days) to surface HONO during daytime when using the ratio of 30 in NCP, consistent with <8 % at a rural site in NCP reported by Xue et al. (2020) and ∼ 1 % in urban Beijing reported by Zhang et al. (2021) using the same ratio; however, the increasing contribution of Photnitrate to HONO concentrations with rising altitude based on our simulations (Figs. 7 and 8) has not been discussed in previous research. Furthermore, we found that the overall Photnitrate impact on OH and O3 would be severely underestimated if the Photnitrate contribution to vertical HONO was excluded.
Table 4Summary of studies on the nitrate photolysis frequency (Jnitrate) ( denotes the photolysis frequency of gas HNO3).
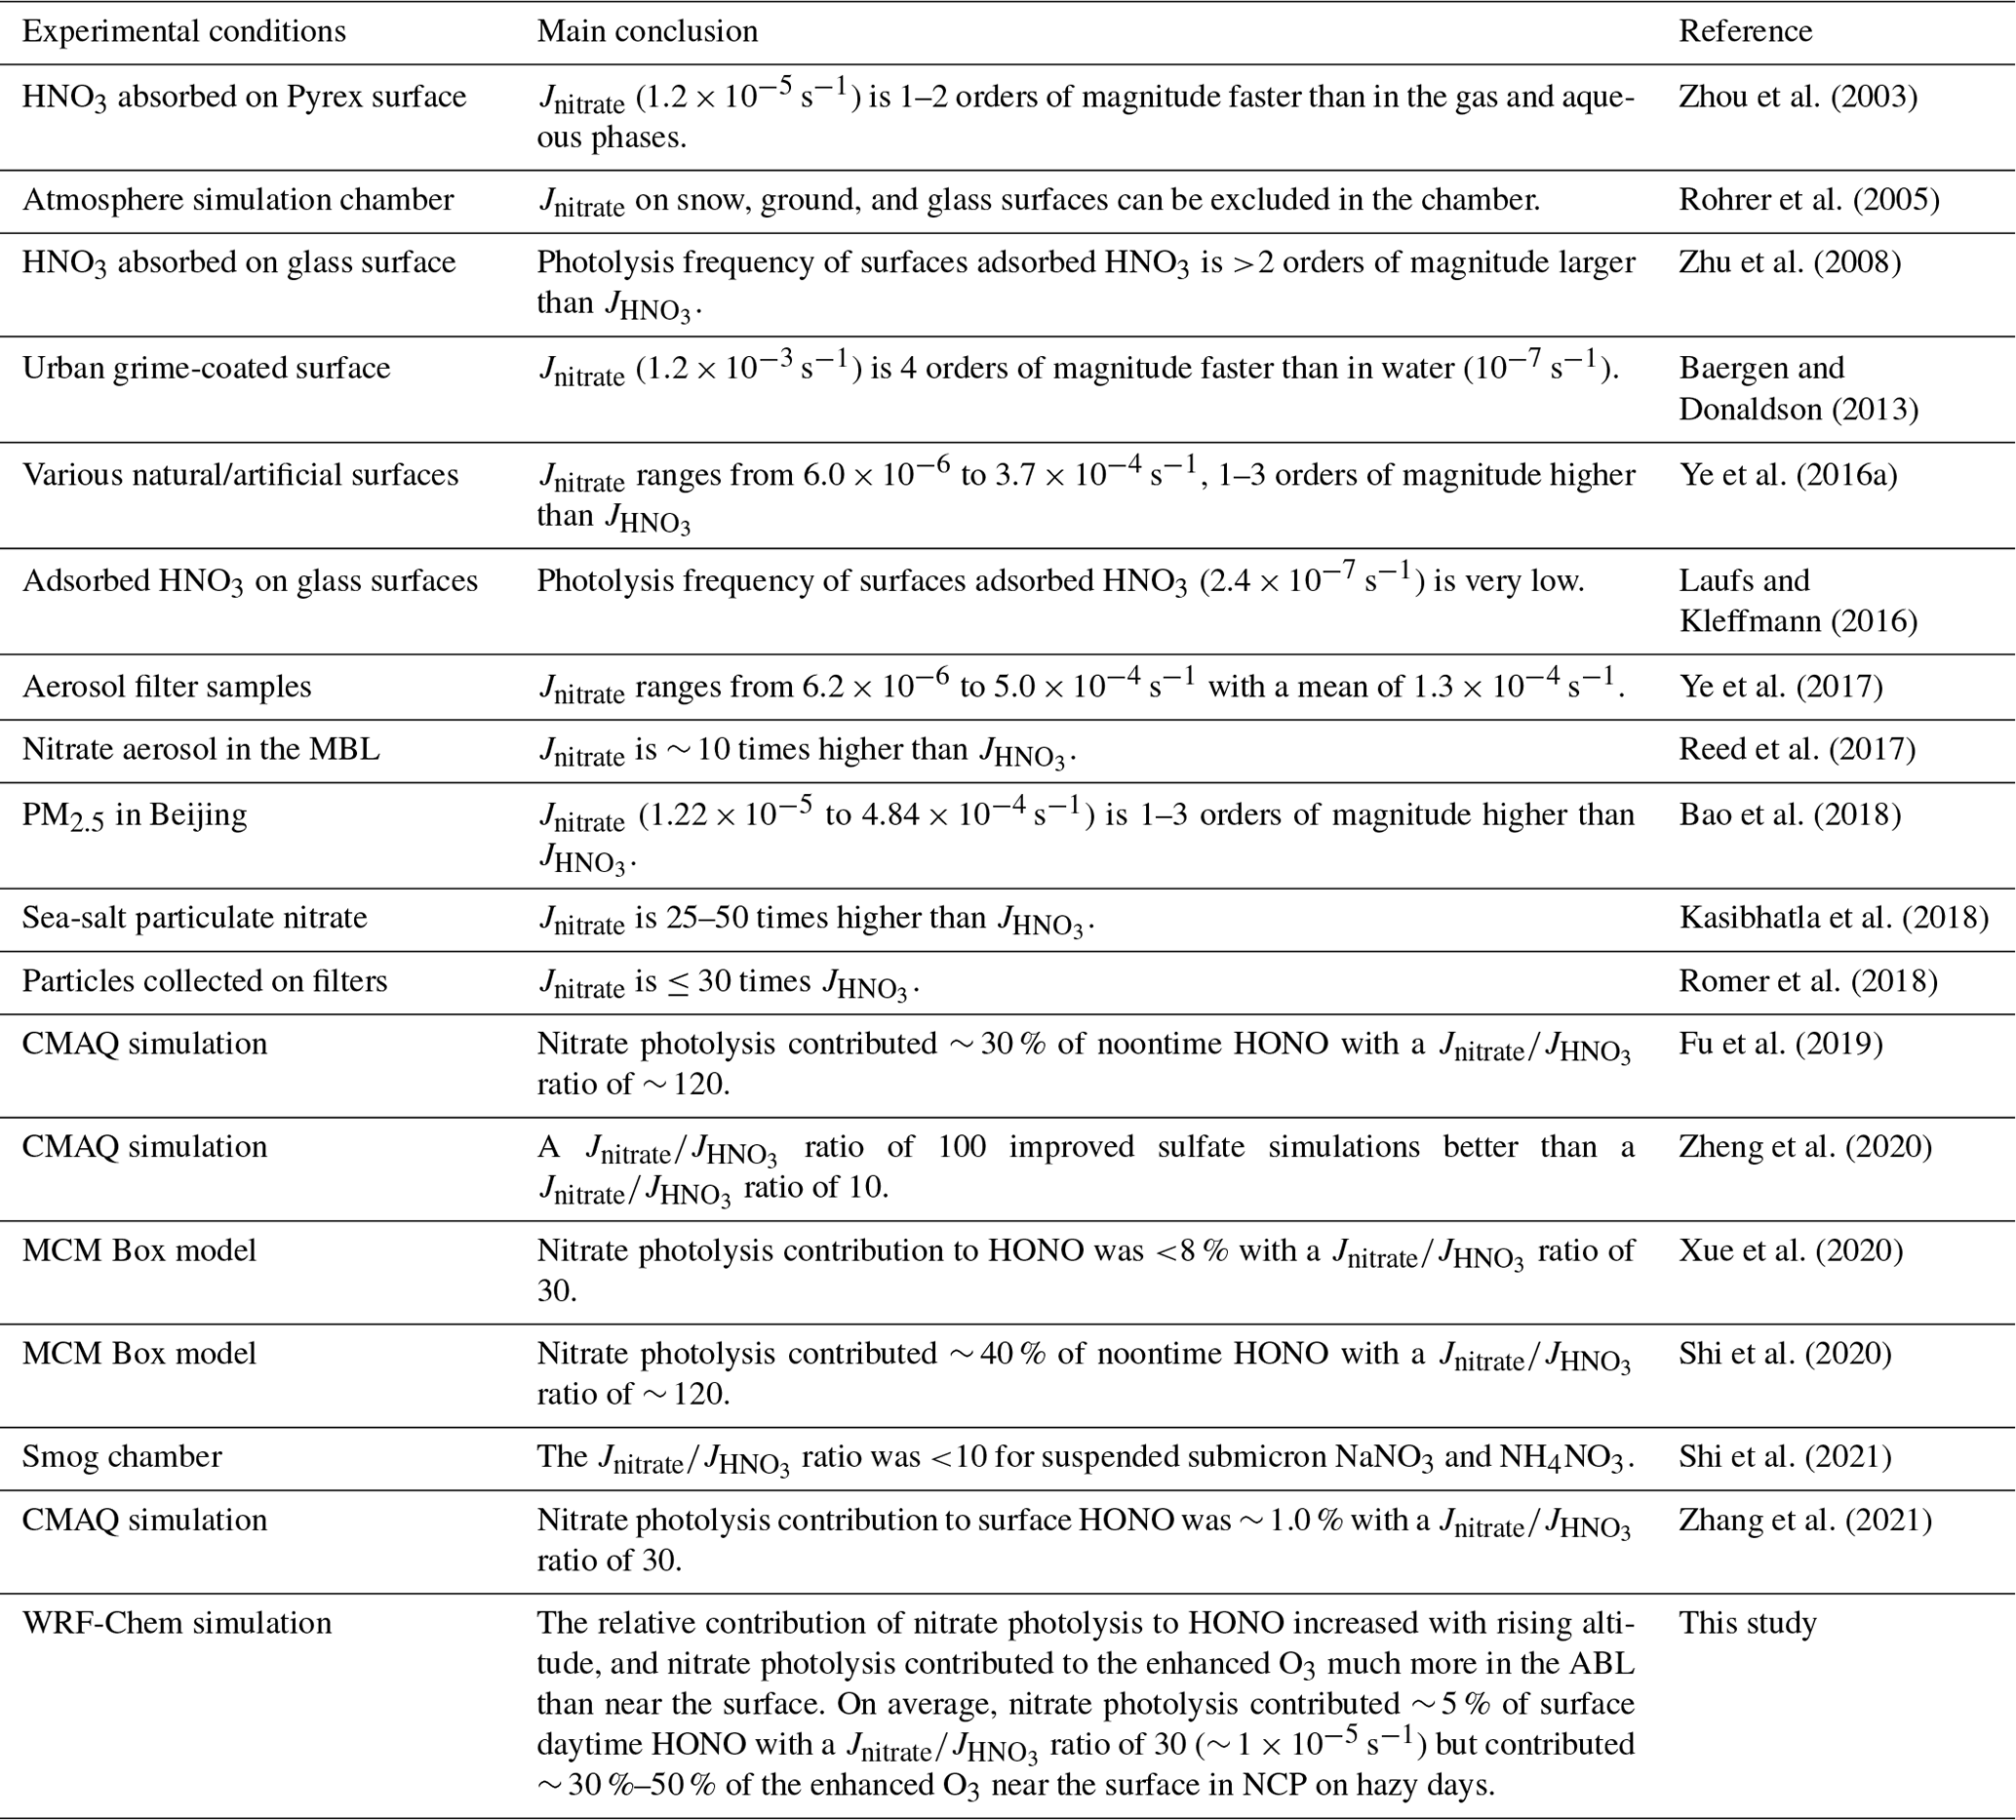
MBL: marine boundary layer; ABL: atmospheric boundary layer.
A larger ratio of 120 for Photnitrate (4.5–5.0 × 10⁻⁵ s−1 at 12:00) produced ∼ 25 %–30 % of noontime HONO in NCP in our study (Fig. S12), comparable to 30 %–40 % in previous modeling studies (Fu et al., 2019; Shi et al., 2020) when using the ratio of 118.57 (8.3 × 10 × 10−7). In haze-aggravating processes, the contribution of Photnitrate () to the DMA8 O3 enhancements reached ∼ 5–10 ppb near the surface and ∼ 8–20 ppb above the 10th model layer (Fig. 17), these enhancements were extremely large. In a previous modeling study by Fu et al. (2020), the daytime surface O3 simulations were systematically overestimated by ∼ 5 ppb in NCP in winter (Fig. S4 in Fu et al., 2020); the inclusion of Photnitrate () in their study might have caused the overestimation. From the above, a ratio of 120 or a Jnitrate value of ∼ 4–5 × 10⁻⁵ s−1 is possibly overestimated. When adopting the maximum Jnitrate value of 10−4 s−1 reported by Ye et al. (2016a) and Bao et al. (2018), we reasonably speculate that O3 simulations will be significantly overestimated, especially at higher altitude with NOx-sensitive O3 chemistry (Fig. 15).
Romer et al. (2018) and Kasibhatla et al. (2018) suggested that a ratio of 30 or smaller would be more suitable, being about the minimum value reported by Ye et al. (2016a) and Bao et al. (2018). This ratio has shown significant influence on the O3 simulations in haze-aggravating processes in this study. The lack of photo-catalyzer in suspended submicron particulate sodium and ammonium nitrate may cause a lower ratio (<10), as reported by Shi et al. (2021), and thus more chamber experiments need to be conducted by using the particles collected in the real atmosphere. Choosing a larger Jnitrate value might cover up other ground-based unknown HONO sources, creating an illusion of good model simulations of daytime HONO, but resulting in an overestimation of O3 concentrations. Considering the uncertainties of NOx or VOC emissions, which also significantly impact O3 simulations, more studies are needed to find the exact value of Jnitrate in the real atmosphere.
4.3 Interactions between heterogeneous HONO sources
Form the comparison of nitrate budget induced by the six potential HONO sources in Figs. S3 and S9, we find that Hetground led to a significant increase in nitrate concentrations. In the real atmosphere, the NO2 heterogeneous reactions and the Photnitrate reaction occur simultaneously, whereas the sensitivity tests considered only one specific HONO source for each case and neglected their interactions, leading to the underestimation of the Photnitrate impact to some extent. When this is taken into consideration, the Photnitrate impact on atmospheric oxidants and secondary pollutants would be even larger, especially during the haze-aggravating process.
Photnitrate would in turn change NOx concentrations to some extent. From the 95-site-averaged NO2 concentrations shown in Fig. 20, we find that Photnitrate slightly increased NO2 concentrations on hazy days. The elevated NO2 concentration could enhance HONO formation via the NO2 heterogeneous reactions; nevertheless, due to the high background NO2 concentrations in NCP (up to ∼ 40 ppb at nighttime), the increment of NO2 and the enhanced HONO formation from NO2 caused by Photnitrate were small (<10 %), but might have a larger impact on NOx budgets in clean regions. From the above, a positive feedback relationship between the NO2 heterogeneous reactions and the Photnitrate reaction was found, and these multi-processes worsen the air quality during haze-aggravating processes.
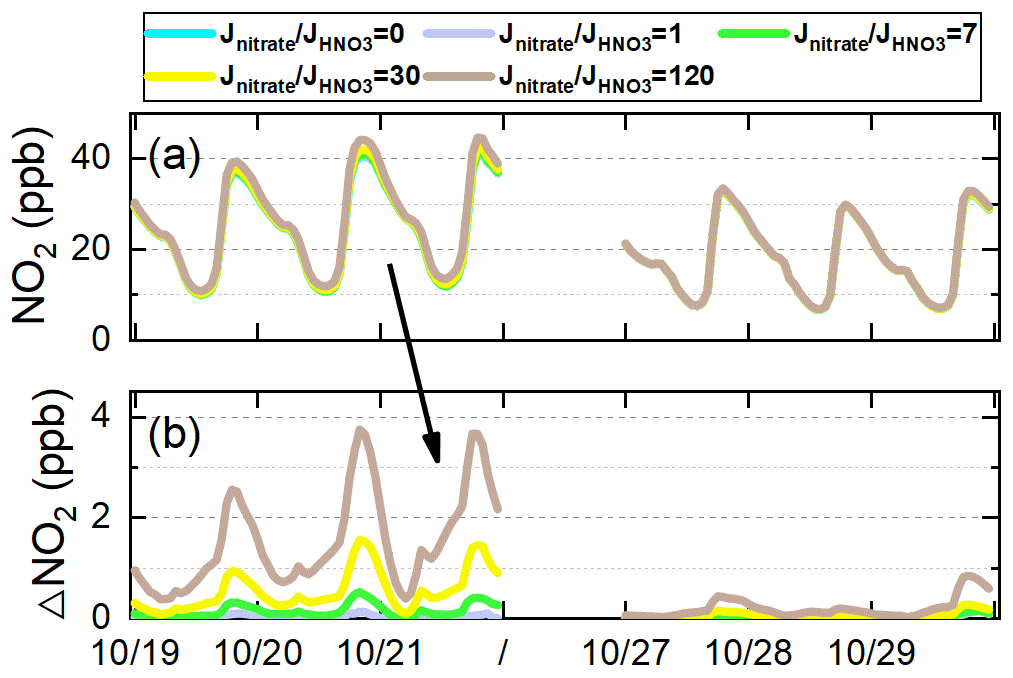
Figure 20Comparison of 95-site-averaged simulations of NO2 concentrations for the base case and four cases with different ratios (1, 7, 30, and 120) (a), and the corresponding NO2 variations (b) compared with the base case in the North China Plain during 11–31 October 2018.
In this study, three direct emission sources, the improved NO2 heterogeneous reactions on aerosol and ground surfaces, and particulate nitrate photolysis in the atmosphere were included in the WRF-Chem model to explore the key HONO sources producing O3 enhancements during typical autumn haze-aggravating processes with co-occurrence of high PM2.5 and O3 in NCP. The six potential HONO sources produced a significant enhancement in surface HONO simulations and improved the mean HONO concentration at the BUCT site to 1.47 ppb from 0.05 ppb (improved the NMB to −14.22 % from −97.11 % and the IOA to 0.80 from 0.45). The improved HONO significantly enhanced the atmospheric oxidation capacity near the surface and at elevated heights, especially on hazy days, resulting in rapid formation of and significant improvements in O3 during haze-aggravating processes in NCP. Although the photolysis frequency is usually lower during hazy days, higher concentrations of NO2, PM2.5, and nitrate favored HONO formation via heterogeneous reactions, leading to stronger atmospheric oxidation capacity. The major results include:
-
For the surface HONO in NCP, Hetground was the largest source during daytime and nighttime (∼ 50 %–80 %); the contribution of Photnitrate () to surface HONO concentrations was close to that of the NO + OH reaction during daytime (∼ 1 %–12 %) and was ∼ 5 % for daytime average; the contribution of Etraffic was important during nighttime (∼ 10 %–20 %) but small during daytime (<5 %); the contribution of Hetaerosol was minor (∼ 2 %–3 %) in the daytime and <10 % at nighttime; the contribution of Esoil was <3 %, and Eindoor could be neglected. Vertically, the HONO enhancements due to ground-based potential HONO sources (Etraffic, Esoil, Eindoor, and Hetground) decreased rapidly with height, while the NO + OH reaction and aerosol-related HONO sources (Photnitrate and Hetaerosol) decreased with height much slower. The enhanced HONO due to Photnitrate on hazy days was about 10 times larger than on clean days and became the dominant HONO source (∼ 30 %–70 % when ) at higher layers, and both HONO concentrations and Photnitrate contributions increased with the aggravated pollution levels.
-
Near the surface, daytime OH production/loss rates were significantly enhanced by ∼ 320 % for the 6S case (mean of 5.27 ppb h−1) compared with the base case (mean of 1.26 ppb h−1); vertically, daytime OH production/loss rates were enhanced by ∼ 105 % for the 6S case (mean of 2.21 ppb h−1) compared with the base case (mean of 1.08 ppb h−1). The enhanced OH production rate and OH due to the six potential HONO sources both showed a strong positive correlation with PM2.5 concentrations at the 95 NCP sites, with a slope of 0.043 ppb h−1 per 1 µg m−3 of PM2.5 and 3.62 × 10⁴ molec cm−3 per 1 µg m−3 of PM2.5 from the surface to the height of 2.5 km for case 6S, respectively. The atmospheric oxidation capacity (e.g., OH) was enhanced in the haze-aggravating process.
-
A strong positive correlation (r>0.8) between enhanced O3 by the six potential HONO sources and PM2.5 concentrations was found in NCP, and nitrate photolysis was the largest contributor to the enhanced DMA8 O3 on hazy days. Vertically, the enhanced DMA8 O3 was <2 ppb when PM2.5 was <20 µg m−3, and it was >10 ppb when PM2.5 was >60 µg m−3 on average, with a slope of 0.24 ppb DMA8 O3 enhancement per 1 µg m−3 of PM2.5. The surface-enhanced DMA8 O3 was ∼ 5.5 ppb (19 October), ∼ 7 ppb (20 October), and ∼ 10 ppb (21 October) during a typical haze-aggravating process, while it was usually ∼ 2 ppb on clean days. The contribution of Photnitrate to the enhanced DMA8 O3 was increased by over 1 magnitude during the haze-aggravating process (up to 5–10 ppb) compared with that on clean days (∼ 0.1–0.5 ppb), and reached ∼ 2–4.5 ppb (19 October), ∼ 3–6 ppb (20 October), and ∼ 5–10 ppb (21 October) during a typical haze-aggravating process vertically.
-
Surface O3 was controlled by VOC-sensitive chemistry, while O3 at higher altitude (>800 m) was controlled by NOx-sensitive chemistry in NCP during autumn. The nitrate photolysis reaction enhanced OH and NOx concentrations, and both favored O3 formation at high altitude, especially in haze-aggravating processes with abundant nitrate. The produced HONO rather than the produced NO2 through nitrate photolysis had a stronger promotion of O3 formation near the surface, but the impacts of the two products on O3 enhancements were similar at higher altitude (∼ 2000 m).
-
Nitrate photolysis only contributed ∼ 5 % of the surface HONO in the daytime with a ratio of 30 (∼ 1 × 10⁻⁵ s−1) but contributed ∼ 30 %–50 % of the enhanced O3 near the surface in NCP on hazy days. The photolysis of nitrate had a limited impact on nitrate concentrations (reduced by <5 % with , and <15 % even with a ratio of 120), due mainly to the simultaneously enhanced atmospheric oxidants favoring the formation of HNO3 and nitrate. Choosing a larger Jnitrate value might cover up other ground-based unknown HONO sources, but overestimate vertical sources of HONO as well as NOx and O3 concentrations; thus, more studies are needed to find the exact value of Jnitrate in the real atmosphere.
Data are available upon reasonable request to the corresponding authors. The code of the WRF-Chem model can be achieved from https://www2.acom.ucar.edu/wrf-chem (last access: 4 March 2022, NCAR/UCAR, 2022).
The supplement related to this article is available online at: https://doi.org/10.5194/acp-22-3275-2022-supplement.
JZ, CL, JA, MG, and WW conceived and designed the research. JZ performed WRF-Chem simulations and wrote the paper. JZ, CL, YG, and HR performed data analyses and produced the figures. CL, YZ, FZ, XF, CY, KRD, YL, and MK conducted the field observations. WW, JA, MG, YL, and MK reviewed the article.
The contact author has declared that neither they nor their co-authors have any competing interests.
Publisher's note: Copernicus Publications remains neutral with regard to jurisdictional claims in published maps and institutional affiliations.
This research was partially supported by the National Natural Science Foundation of China (Grant No. 92044302, 42075108, 42107124, 42075110, 41822703, 91544221, 91844301), Beijing National Laboratory for Molecular Sciences (BNLMS-CXXM-202011) and the China Postdoctoral Science Foundation (grant no. 2019M660764).
This research has been supported by the National Natural Science Foundation of China (grant nos. 92044302, 42075108, 42107124, 42075110, 41822703, 91544221, and 91844301), the Beijing National Laboratory for Molecular Sciences (grant no. BNLMS-CXXM-202011), and the China Postdoctoral Science Foundation (grant no. 2019M660764).
This paper was edited by Ivan Kourtchev and reviewed by three anonymous referees.
Alicke, B., Platt, U., and Stutz, J.: Impact of nitrous acid photolysis on the total hydroxyl radical budget during the Limitation of Oxidant Production/Pianura Padana Produzione di Ozono study in Milan, J. Geophys. Res.-Atmos., 107, 8196, https://doi.org/10.1029/2000jd000075, 2002.
An, J. L., Li, Y., Chen, Y., Li, J., Qu, Y., and Tang, Y. J.: Enhancements of major aerosol components due to additional HONO sources in the North China Plain and implications for visibility and haze, Adv. Atmos. Sci., 30, 57–66, https://doi.org/10.1007/s00376-012-2016-9, 2013.
Aumont, B., Chervier, F., and Laval, S.: Contribution of HONO sources to the NOHOO3 chemistry in the polluted boundary layer, Atmos. Environ., 37, 487–498, https://doi.org/10.1016/S1352-2310(02)00920-2, 2003.
Avnery, S., Mauzerall, D. L., Liu, J., and Horowitz, L. W.: Global crop yield reductions due to surface ozone exposure: 1. Year 2000 crop production losses and economic damage, Atmos. Environ., 45, 2284–2296, https://doi.org/10.1016/j.atmosenv.2011.01.002, 2011a.
Avnery, S., Mauzerall, D. L., Liu, J., and Horowitz, L. W.: Global crop yield reductions due to surface ozone exposure: 2. Year 2030 potential crop production losses and economic damage under two scenarios of O3 pollution, Atmos. Environ., 45, 2297–2309, https://doi.org/10.1016/j.atmosenv.2010.11.045, 2011b.
Baergen, A. M. and Donaldson, D. J.: Photochemical renoxification of nitric acid on real urban grime, Environ. Sci. Technol., 47, 815–820, https://doi.org/10.1021/es3037862, 2013.
Bao, F., Li, M., Zhang, Y., Chen, C., and Zhao, J.: Photochemical Aging of Beijing Urban PM2.5: HONO Production, Environ. Sci. Technol., 52, 6309–6316, https://doi.org/10.1021/acs.est.8b00538, 2018.
Bao, F. X., Jiang, H. Y., Zhang, Y., Li, M., Ye, C. X., Wang, W. G., Ge, M. F., Chen, C. C., and Zhao, J. C.: The Key Role of Sulfate in the Photochemical Renoxification on Real PM2.5, Environ. Sci. Technol., 54, 3121–3128, https://doi.org/10.1021/acs.est.9b06764, 2020.
Bejan, I., Abd-el-Aal, Y., Barnes, I., Benter, T., Bohn, B., Wiesen, P., and Kleffmann, J.: The photolysis of ortho-nitrophenols: a new gas phase source of HONO, Phys. Chem. Chem. Phys., 8, 2028–2035, https://doi.org/10.1039/b516590c, 2006.
Chen, S., Wang, H., Lu, K., Zeng, L., Hu, M., and Zhang, Y.: The trend of surface ozone in Beijing from 2013 to 2019: Indications of the persisting strong atmospheric oxidation capacity, Atmos. Environ., 242, 117801, https://doi.org/10.1016/j.atmosenv.2020.117801, 2020.
Chen, Y., Wang, W. G., Lian, C. F., Peng, C., Zhang, W. Y., Li, J. L., Liu, M. Y., Shi, B., Wang, X. F., and Ge, M. F.: Evaluation and impact factors of indoor and outdoor gas-phase nitrous acid under different environmental conditions, J. Environ. Sci., 95, 165–171, https://doi.org/10.1016/j.jes.2020.03.048, 2020.
Chen, Y., Zheng, P., Wang, Z., Pu, W., Tan, Y., Yu, C., Xia, M., Wang, W., Guo, J., Huang, D., Yan, C., Nie, W., Ling, Z., Chen, Q., Lee, S., and Wang, T.: Secondary formation and impacts of gaseous nitro-phenolic compounds in the continental outflow observed at a background site in south China, Environ. Sci. Technol., https://doi.org/10.1021/acs.est.1c04596, 2021.
Crowley, J. N. and Carl, S. A.: OH formation in the photoexcitation of NO2 beyond the dissociation threshold in the presence of water vapor, J. Phys. Chem. A, 101, 4178–4184, https://doi.org/10.1021/jp970319e, 1997.
Cui, L., Li, R., Fu, H., Meng, Y., Zhao, Y., Li, Q., and Chen, J.: Nitrous acid emission from open burning of major crop residues in mainland China, Atmos. Environ., 244, 117950, https://doi.org/10.1016/j.atmosenv.2020.117950, 2021.
Dillon, T. J. and Crowley, J. N.: Reactive quenching of electronically excited NO and NO by H2O as potential sources of atmospheric HOx radicals, Atmos. Chem. Phys., 18, 14005–14015, https://doi.org/10.5194/acp-18-14005-2018, 2018.
Dong, W., Xing, J., and Wang, S.: Temporal and spatial distribution of anthropogenic ammonia emissions in China: 1994–2006, Environmental Sciences, 31, 1457–1463, 2010 (in Chinese).
Emmons, L. K., Walters, S., Hess, P. G., Lamarque, J.-F., Pfister, G. G., Fillmore, D., Granier, C., Guenther, A., Kinnison, D., Laepple, T., Orlando, J., Tie, X., Tyndall, G., Wiedinmyer, C., Baughcum, S. L., and Kloster, S.: Description and evaluation of the Model for Ozone and Related chemical Tracers, version 4 (MOZART-4), Geosci. Model Dev., 3, 43–67, https://doi.org/10.5194/gmd-3-43-2010, 2010.
Feng, T., Zhao, S., Bei, N., Liu, S., and Li, G.: Increasing atmospheric oxidizing capacity weakens emission mitigation effort in Beijing during autumn haze events, Chemosphere, 281, 130855, https://doi.org/10.1016/j.chemosphere.2021.130855, 2021.
Feng, Z., Hu, E., Wang, X., Jiang, L., and Liu, X.: Ground-level O3 pollution and its impacts on food crops in China: a review, Environ. Pollut., 199, 42–48, https://doi.org/10.1016/j.envpol.2015.01.016, 2015.
Feng, Z., De Marco, A., Anav, A., Gualtieri, M., Sicard, P., Tian, H., Fornasier, F., Tao, F., Guo, A., and Paoletti, E.: Economic losses due to ozone impacts on human health, forest productivity and crop yield across China, Environ. Int., 131, 104966, https://doi.org/10.1016/j.envint.2019.104966, 2019.
Feng, Z., Xu, Y., Kobayashi, K., Dai, L., Zhang, T., Agathokleous, E., Calatayud, V., Paoletti, E., Mukherjee, A., Agrawal, M., Park, R. J., Oak, Y. J., and Yue, X.: Ozone pollution threatens the production of major staple crops in East Asia, Nat. Food, 3, 47–56, https://doi.org/10.1038/s43016-021-00422-6, 2022.
Finlayson-Pitts, B. J., Wingen, L. M., Sumner, A. L., Syomin, D., and Ramazan, K. A.: The heterogeneous hydrolysis of NO2 in laboratory systems and in outdoor and indoor atmospheres: An integrated mechanism, Phys. Chem. Chem. Phys., 5, 223–242, https://doi.org/10.1039/b208564j, 2003.
Fröhlich, R., Cubison, M. J., Slowik, J. G., Bukowiecki, N., Prévôt, A. S. H., Baltensperger, U., Schneider, J., Kimmel, J. R., Gonin, M., Rohner, U., Worsnop, D. R., and Jayne, J. T.: The ToF-ACSM: a portable aerosol chemical speciation monitor with TOFMS detection, Atmos. Meas. Tech., 6, 3225–3241, https://doi.org/10.5194/amt-6-3225-2013, 2013.
Fu, X., Wang, T., Zhang, L., Li, Q., Wang, Z., Xia, M., Yun, H., Wang, W., Yu, C., Yue, D., Zhou, Y., Zheng, J., and Han, R.: The significant contribution of HONO to secondary pollutants during a severe winter pollution event in southern China, Atmos. Chem. Phys., 19, 1–14, https://doi.org/10.5194/acp-19-1-2019, 2019.
Fu, X., Wang, T., Gao, J., Wang, P., Liu, Y.M., Wang, S. X., Zhao, B., and Xue, L. K.: Persistent Heavy Winter Nitrate Pollution Driven by Increased Photochemical Oxidants in Northern China, Environ. Sci. Technol., 54, 3881–3889, https://doi.org/10.1021/acs.est.9b07248, 2020.
Gao, W., Tan, G., Hong, Y., Li, M., Nian, H., Guo, C., Huang, Z., Fu, Z., Dong, J., and Xu, X.: Development of portable single photon ionization time-of-flight mass spectrometer combined with membrane inlet, Int. J. Mass Spectrom., 334, 8–12, https://doi.org/10.1016/j.ijms.2012.09.003, 2013.
Ge, M., Tong, S., Wang, W., Zhang, W., Chen, M., Peng, C., Li, J., Zhou, L., Chen, Y., and Liu, M.: Important Oxidants and Their Impact on the Environmental Effects of Aerosols, J. Phys. Chem. A, 125, 3813–3825, https://doi.org/10.1021/acs.jpca.0c10236, 2021.
Ge, S., Wang, G., Zhang, S., Li, D., Xie, Y., Wu, C., Yuan, Q., Chen, J., and Zhang, H.: Abundant NH3 in China Enhances Atmospheric HONO Production by Promoting the Heterogeneous Reaction of SO2 with NO2, Environ. Sci. Technol., 53, 14339–14347, https://doi.org/10.1021/acs.est.9b04196, 2019.
Gen, M., Liang, Z., Zhang, R., Go Mabato, B. R., and Chan, C. K.: Particulate nitrate photolysis in the atmosphere, Environ. Sci. Atmos., https://doi.org/10.1039/d1ea00087j, 2022.
Gligorovski, S., Strekowski, R., Barbati, S., and Vione, D.: Environmental Implications of Hydroxyl Radicals (•OH), Chem. Rev., 115, 13051–13092, https://doi.org/10.1021/cr500310b, 2015.
Gómez Alvarez, E., Sörgel, M., Gligorovski, S., Bassil, S., Bartolomei, V., Coulomb, B., Zetzsch, C., and Wortham, H.: Light-induced nitrous acid (HONO) production from NO2 heterogeneous reactions on household chemicals, Atmos. Environ., 95, 391–399, https://doi.org/10.1016/j.atmosenv.2014.06.034, 2014.
Grell, G. A., Peckham, S. E., Schmitz, R., McKeen, S. A., Frost, G., Skamarock, W. C., and Eder, B.: Fully coupled “online” chemistry within the WRF model, Atmos. Environ., 39, 6957–6975, https://doi.org/10.1016/j.atmosenv.2005.04.027, 2005.
Guenther, A. B., Jiang, X., Heald, C. L., Sakulyanontvittaya, T., Duhl, T., Emmons, L. K., and Wang, X.: The Model of Emissions of Gases and Aerosols from Nature version 2.1 (MEGAN2.1): an extended and updated framework for modeling biogenic emissions, Geosci. Model Dev., 5, 1471–1492, https://doi.org/10.5194/gmd-5-1471-2012, 2012.
Guo, Y., Zhang, J., An, J., Qu, Y., Liu, X., Sun, Y., and Chen, Y.: Effect of vertical parameterization of a missing daytime source of HONO on concentrations of HONO, O3 and secondary organic aerosols in eastern China, Atmos. Environ., 226, 117208, https://doi.org/10.1016/j.atmosenv.2019.117208, 2020.
Hendrick, F., Müller, J.-F., Clémer, K., Wang, P., De Mazière, M., Fayt, C., Gielen, C., Hermans, C., Ma, J. Z., Pinardi, G., Stavrakou, T., Vlemmix, T., and Van Roozendael, M.: Four years of ground-based MAX-DOAS observations of HONO and NO2 in the Beijing area, Atmos. Chem. Phys., 14, 765–781, https://doi.org/10.5194/acp-14-765-2014, 2014.
Huang, X., Li, M. M., Li, J. F., and Song, Y.: A high-resolution emission inventory of crop burning in fields in China based on MODIS Thermal Anomalies/Fire products, Atmos. Environ., 50, 9–15, https://doi.org/10.1016/j.atmosenv.2012.01.017, 2012.
Kasibhatla, P., Sherwen, T., Evans, M. J., Carpenter, L. J., Reed, C., Alexander, B., Chen, Q., Sulprizio, M. P., Lee, J. D., Read, K. A., Bloss, W., Crilley, L. R., Keene, W. C., Pszenny, A. A. P., and Hodzic, A.: Global impact of nitrate photolysis in sea-salt aerosol on NOx, OH, and O3 in the marine boundary layer, Atmos. Chem. Phys., 18, 11185–11203, https://doi.org/10.5194/acp-18-11185-2018, 2018.
Kim, S., VandenBoer, T. C., Young, C. J., Riedel, T. P., Thornton, J. A., Swarthout, B., Sive, B., Lerner, B., Gilman, J. B., Warneke, C., Roberts, J. M., Guenther, A., Wagner, N. L., Dube, W. P., Williams, E., and Brown, S. S.: The primary and recycling sources of OH during the NACHTT-2011 campaign: HONO as an important OH primary source in the wintertime, J. Geophys. Res.-Atmos., 119, 6886–6896, https://doi.org/10.1002/2013jd019784, 2014.
Kleffmann, J., Kurtenbach, R., Lorzer, J., Wiesen, P., Kalthoff, N., Vogel, B., and Vogel, H.: Measured and simulated vertical profiles of nitrous acid – Part I: Field measurements, Atmos. Environ., 37, 2949–2955, https://doi.org/10.1016/S1352-2310(03)00242-5, 2003.
Klosterkother, A., Kurtenbach, R., Wiesen, P., and Kleffmann, J.: Determination of the emission indices for NO, NO2, HONO, HCHO, CO, and particles emitted from candles, Indoor Air, 31, 116–127, https://doi.org/10.1111/ina.12714, 2021.
Kramer, L. J., Crilley, L. R., Adams, T. J., Ball, S. M., Pope, F. D., and Bloss, W. J.: Nitrous acid (HONO) emissions under real-world driving conditions from vehicles in a UK road tunnel, Atmos. Chem. Phys., 20, 5231–5248, https://doi.org/10.5194/acp-20-5231-2020, 2020.
Kubota, M. and Asami, T.: Volatilization of Nitrous-Acid from Upland Soils, J. Soil Sci. Plant Nutr., 31, 27–34, https://doi.org/10.1080/17470765.1985.10555214, 1985.
Kurtenbach, R., Becker, K. H., Gomes, J. A. G., Kleffmann, J., Lorzer, J. C., Spittler, M., Wiesen, P., Ackermann, R., Geyer, A., and Platt, U.: Investigations of emissions and heterogeneous formation of HONO in a road traffic tunnel, Atmos. Environ., 35, 3385–3394, https://doi.org/10.1016/S1352-2310(01)00138-8, 2001.
Laufs, S. and Kleffmann, J.: Investigations on HONO formation from photolysis of adsorbed HNO3 on quartz glass surfaces, Phys. Chem. Chem. Phys., 18, 9616–9625, https://doi.org/10.1039/c6cp00436a, 2016.
Lee, J. D., Whalley, L. K., Heard, D. E., Stone, D., Dunmore, R. E., Hamilton, J. F., Young, D. E., Allan, J. D., Laufs, S., and Kleffmann, J.: Detailed budget analysis of HONO in central London reveals a missing daytime source, Atmos. Chem. Phys., 16, 2747–2764, https://doi.org/10.5194/acp-16-2747-2016, 2016.
Li, G., Lei, W., Zavala, M., Volkamer, R., Dusanter, S., Stevens, P., and Molina, L. T.: Impacts of HONO sources on the photochemistry in Mexico City during the MCMA-2006/MILAGO Campaign, Atmos. Chem. Phys., 10, 6551–6567, https://doi.org/10.5194/acp-10-6551-2010, 2010.
Li, K., Jacob, D. J., Shen, L., Lu, X., De Smedt, I., and Liao, H.: Increases in surface ozone pollution in China from 2013 to 2019: anthropogenic and meteorological influences, Atmos. Chem. Phys., 20, 11423–11433, https://doi.org/10.5194/acp-20-11423-2020, 2020.
Li, L., Chen, C. H., Huang, C., Huang, H. Y., Zhang, G. F., Wang, Y. J., Wang, H. L., Lou, S. R., Qiao, L. P., Zhou, M., Chen, M. H., Chen, Y. R., Streets, D. G., Fu, J. S., and Jang, C. J.: Process analysis of regional ozone formation over the Yangtze River Delta, China using the Community Multi-scale Air Quality modeling system, Atmos. Chem. Phys., 12, 10971–10987, https://doi.org/10.5194/acp-12-10971-2012, 2012.
Li, M., Zhang, Q., Kurokawa, J.-I., Woo, J.-H., He, K., Lu, Z., Ohara, T., Song, Y., Streets, D. G., Carmichael, G. R., Cheng, Y., Hong, C., Huo, H., Jiang, X., Kang, S., Liu, F., Su, H., and Zheng, B.: MIX: a mosaic Asian anthropogenic emission inventory under the international collaboration framework of the MICS-Asia and HTAP, Atmos. Chem. Phys., 17, 935–963, https://doi.org/10.5194/acp-17-935-2017, 2017.
Li, S., Matthews, J., and Sinha, A.: Atmospheric hydroxyl radical production from electronically excited NO2 and H2O, Science, 319, 1657–1660, https://doi.org/10.1126/science.1151443, 2008.
Li, X., Rohrer, F., Hofzumahaus, A., Brauers, T., Haseler, R., Bohn, B., Broch, S., Fuchs, H., Gomm, S., Holland, F., Jager, J., Kaiser, J., Keutsch, F. N., Lohse, I., Lu, K., Tillmann, R., Wegener, R., Wolfe, G. M., Mentel, T. F., Kiendler-Scharr, A., and Wahner, A.: Missing gas-phase source of HONO inferred from Zeppelin measurements in the troposphere, Science, 344, 292–296, https://doi.org/10.1126/science.1248999, 2014.
Li, X., Rohrer, F., Hofzumahaus, A., Brauers, T., Häseler, R., Bohn, B., Broch, S., Fuchs, H., Gomm, S., and Holland, F.: Response to Comment on “Missing gas-phase source of HONO inferred from Zeppelin measurements in the troposphere”, Science, 348, 1326–1326, https://doi.org/10.1126/science.aab1122, 2015.
Li, Y., An, J. L., Min, M., Zhang, W., Wang, F., and Xie, P. H.: Impacts of HONO sources on the air quality in Beijing, Tianjin and Hebei Province of China, Atmos. Environ., 45, 4735–4744, https://doi.org/10.1016/j.atmosenv.2011.04.086, 2011.
Liao, S., Zhang, J., Yu, F., Zhu, M., Liu, J., Ou, J., Dong, H., Sha, Q., Zhong, Z., Xie, Y., Luo, H., Zhang, L., and Zheng, J.: High Gaseous Nitrous Acid (HONO) Emissions from Light-Duty Diesel Vehicles, Environ. Sci. Technol., 55, 200–208, https://doi.org/10.1021/acs.est.0c05599, 2021.
Lin, Y. L., Farley, R. D., and Orville, H. D.: Bulk Parameterization of the Snow Field in a Cloud Model, J. Clim. Appl. Meteorol., 22, 1065–1092, https://doi.org/10.1175/1520-0450(1983)022<1065:Bpotsf>2.0.Co;2, 1983.
Liu, J., Li, S., Zeng, J., Mekic, M., Yu, Z., Zhou, W., Loisel, G., Gandolfo, A., Song, W., Wang, X., Zhou, Z., Herrmann, H., Li, X., and Gligorovski, S.: Assessing indoor gas phase oxidation capacity through real-time measurements of HONO and NOx in Guangzhou, China, Environ. Sci.: Processes Impacts, 21, 1393–1402, https://doi.org/10.1039/c9em00194h, 2019.
Liu, Y., Zhang, Y., Lian, C., Yan, C., Feng, Z., Zheng, F., Fan, X., Chen, Y., Wang, W., Chu, B., Wang, Y., Cai, J., Du, W., Daellenbach, K. R., Kangasluoma, J., Bianchi, F., Kujansuu, J., Petäjä, T., Wang, X., Hu, B., Wang, Y., Ge, M., He, H., and Kulmala, M.: The promotion effect of nitrous acid on aerosol formation in wintertime in Beijing: the possible contribution of traffic-related emissions, Atmos. Chem. Phys., 20, 13023–13040, https://doi.org/10.5194/acp-20-13023-2020, 2020.
Liu, Z., Wang, Y., Costabile, F., Amoroso, A., Zhao, C., Huey, L. G., Stickel, R., Liao, J., and Zhu, T.: Evidence of aerosols as a media for rapid daytime HONO production over China, Environ. Sci. Technol., 48, 14386–14391, https://doi.org/10.1021/es504163z, 2014.
Lu, X., Zhang, L., Wang, X. L., Gao, M., Li, K., Zhang, Y. Z., Yue, X., and Zhang, Y. H.: Rapid Increases in Warm-Season Surface Ozone and Resulting Health Impact in China Since 2013, Environ. Sci. Technol. Lett., 7, 240–247, https://doi.org/10.1021/acs.estlett.0c00171, 2020.
Ma, J., Liu, Y., Han, C., Ma, Q., Liu, C., and He, H.: Review of heterogeneous photochemical reactions of NOy on aerosol – A possible daytime source of nitrous acid (HONO) in the atmosphere, J. Environ. Sci., 25, 326–334, https://doi.org/10.1016/s1001-0742(12)60093-x, 2013.
Ma, Z., Xu, J., Quan, W., Zhang, Z., Lin, W., and Xu, X.: Significant increase of surface ozone at a rural site, north of eastern China, Atmos. Chem. Phys., 16, 3969–3977, https://doi.org/10.5194/acp-16-3969-2016, 2016.
Maji, K. J. and Namdeo, A.: Continuous increases of surface ozone and associated premature mortality growth in China during 2015–2019, Environ. Pollut., 269, 116183, https://doi.org/10.1016/j.envpol.2020.116183, 2021.
Marion, A., Morin, J., Gandolfo, A., Ormeno, E., D'Anna, B., and Wortham, H.: Nitrous acid formation on Zea mays leaves by heterogeneous reaction of nitrogen dioxide in the laboratory, Environ. Res., 193, 110543, https://doi.org/10.1016/j.envres.2020.110543, 2021.
Meng, F., Qin, M., Tang, K., Duan, J., Fang, W., Liang, S., Ye, K., Xie, P., Sun, Y., Xie, C., Ye, C., Fu, P., Liu, J., and Liu, W.: High-resolution vertical distribution and sources of HONO and NO2 in the nocturnal boundary layer in urban Beijing, China, Atmos. Chem. Phys., 20, 5071–5092, https://doi.org/10.5194/acp-20-5071-2020, 2020.
Mills, G., Buse, A., Gimeno, B., Bermejo, V., Holland, M., Emberson, L., and Pleijel, H.: A synthesis of AOT40-based response functions and critical levels of ozone for agricultural and horticultural crops, Atmos. Environ., 41, 2630–2643, https://doi.org/10.1016/j.atmosenv.2006.11.016, 2007.
Mills, G., Sharps, K., Simpson, D., Pleijel, H., Broberg, M., Uddling, J., Jaramillo, F., Davies, W. J., Dentener, F., Van den Berg, M., Agrawal, M., Agrawal, S. B., Ainsworth, E. A., Buker, P., Emberson, L., Feng, Z., Harmens, H., Hayes, F., Kobayashi, K., Paoletti, E., and Van Dingenen, R.: Ozone pollution will compromise efforts to increase global wheat production, Glob. Change Biol., 24, 3560–3574, https://doi.org/10.1111/gcb.14157, 2018.
National Centers for Environmental Prediction, National Weather Service, NOAA, and U.S. Department of Commerce: NCEP FNL Operational Model Global Tropospheric Analyses, Continuing From July 1999, Research Data Archive at the National Center for Atmospheric Research, Computational and Information Systems Laboratory, Boulder [data set], https://doi.org/10.5065/D6M043C6, 2000.
NCAR/UCAR: WRF-Chem, NCAR/UCAR [code], https://www2.acom.ucar.edu/wrf-chem, last access: 4 March 2022.
Oswald, R., Behrendt, T., Ermel, M., Wu, D., Su, H., Cheng, Y., Breuninger, C., Moravek, A., Mougin, E., Delon, C., Loubet, B., Pommerening-Roser, A., Sörgel, M., Pöschl, U., Hoffmann, T., Andreae, M. O., Meixner, F. X., and Trebs, I.: HONO emissions from soil bacteria as a major source of atmospheric reactive nitrogen, Science, 341, 1233–1235, https://doi.org/10.1126/science.1242266, 2013.
Pagsberg, P., Bjergbakke, E., Ratajczak, E., and Sillesen, A.: Kinetics of the gas phase reaction OH + NO (+M) → HONO (+M) and the determination of the UV absorption cross sections of HONO, Chem. Phys. Lett., 272, 383–390, https://doi.org/10.1016/S0009-2614(97)00576-9, 1997.
Perner, D. and Platt, U.: Detection of nitrous acid in the atmospeere by differential optical absorption, Geophys. Res. Lett., 6, 917–920, https://doi.org/10.1029/GL006i012p00917, 1979.
Pitts, J. N., Wallington, T. J., Biermann, H. W., and Winer, A. M.: Identification and Measurement of Nitrous-Acid in an Indoor Environment, Atmos. Environ., 19, 763–767, https://doi.org/10.1016/0004-6981(85)90064-2, 1985.
Qu, Y., Chen, Y., Liu, X., Zhang, J., Guo, Y., and An, J.: Seasonal effects of additional HONO sources and the heterogeneous reactions of N2O5 on nitrate in the North China Plain, Sci. Total Environ., 690, 97–107, https://doi.org/10.1016/j.scitotenv.2019.06.436, 2019.
Reed, C., Evans, M. J., Crilley, L. R., Bloss, W. J., Sherwen, T., Read, K. A., Lee, J. D., and Carpenter, L. J.: Evidence for renoxification in the tropical marine boundary layer, Atmos. Chem. Phys., 17, 4081–4092, https://doi.org/10.5194/acp-17-4081-2017, 2017.
Richards, B. L., Middleton, J. T., and Hewitt, W. B.: Air Pollution With Relation to Agronomic Crops: V. Oxidant Stipple of Grape, Agron. J., 50, 559–561, 1958.
Rohrer, F., Bohn, B., Brauers, T., Brüning, D., Johnen, F.-J., Wahner, A., and Kleffmann, J.: Characterisation of the photolytic HONO-source in the atmosphere simulation chamber SAPHIR, Atmos. Chem. Phys., 5, 2189–2201, https://doi.org/10.5194/acp-5-2189-2005, 2005.
Romer, P. S., Wooldridge, P. J., Crounse, J. D., Kim, M. J., Wennberg, P. O., Dibb, J. E., Scheuer, E., Blake, D. R., Meinardi, S., Brosius, A. L., Thames, A. B., Miller, D. O., Brune, W. H., Hall, S. R., Ryerson, T. B., and Cohen, R. C.: Constraints on Aerosol Nitrate Photolysis as a Potential Source of HONO and NOx, Environ. Sci. Technol., 52, 13738–13746, https://doi.org/10.1021/acs.est.8b03861, 2018.
Rondon, A. and Sanhueza, E.: High HONO atmospheric concentrations during vegetation burning in the tropical savannah, Tellus B, 41, 474–477, https://doi.org/10.1111/j.1600-0889.1989.tb00323.x, 1989.
Ryan, R. G., Rhodes, S., Tully, M., Wilson, S., Jones, N., Frieß, U., and Schofield, R.: Daytime HONO, NO2 and aerosol distributions from MAX-DOAS observations in Melbourne, Atmos. Chem. Phys., 18, 13969–13985, https://doi.org/10.5194/acp-18-13969-2018, 2018.
Sakamaki, F., Hatakeyama, S., and Akimoto, H.: Formation of Nitrous-Acid and Nitric-Oxide in the Heterogeneous Dark Reaction of Nitrogen-Dioxide and Water-Vapor in a Smog Chamber, Int. J. Chem. Kinet., 15, 1013–1029, https://doi.org/10.1002/kin.550151006, 1983.
Saliba, N. A., Mochida, M., and Finlayson-Pitts, B. J.: Laboratory studies of sources of HONO in polluted urban atmospheres, Geophys. Res. Lett., 27, 3229–3232, https://doi.org/10.1029/2000gl011724, 2000.
Sarwar, G., Roselle, S. J., Mathur, R., Appel, W., Dennis, R. L., and Vogel, B.: A comparison of CMAQ HONO predictions with observations from the northeast oxidant and particle study, Atmos. Environ., 42, 5760–5770, https://doi.org/10.1016/j.atmosenv.2007.12.065, 2008.
Selin, N. E., Wu, S., Nam, K. M., Reilly, J. M., Paltsev, S., Prinn, R. G., and Webster, M. D.: Global health and economic impacts of future ozone pollution, Environ. Res. Lett., 4, 044014, https://doi.org/10.1088/1748-9326/4/4/044014, 2009.
Shi, Q., Tao, Y., Krechmer, J. E., Heald, C. L., Murphy, J. G., Kroll, J. H., and Ye, Q.: Laboratory Investigation of Renoxification from the Photolysis of Inorganic Particulate Nitrate, Environ. Sci. Technol., 55, 854–861, https://doi.org/10.1021/acs.est.0c06049, 2021.
Shi, X., Ge, Y., Zheng, J., Ma, Y., Ren, X., and Zhang, Y.: Budget of nitrous acid and its impacts on atmospheric oxidative capacity at an urban site in the central Yangtze River Delta region of China, Atmos. Environ., 238, 117725, https://doi.org/10.1016/j.atmosenv.2020.117725, 2020.
Sillman, S.: The use of NOy, H2O2, and HNO3 as indicators for ozone-NOx-hydrocarbon sensitivity in urban locations, J. Geophys. Res.-Atmos., 100, 14175–14188, https://doi.org/10.1029/94JD02953, 1995.
Slater, E. J., Whalley, L. K., Woodward-Massey, R., Ye, C., Lee, J. D., Squires, F., Hopkins, J. R., Dunmore, R. E., Shaw, M., Hamilton, J. F., Lewis, A. C., Crilley, L. R., Kramer, L., Bloss, W., Vu, T., Sun, Y., Xu, W., Yue, S., Ren, L., Acton, W. J. F., Hewitt, C. N., Wang, X., Fu, P., and Heard, D. E.: Elevated levels of OH observed in haze events during wintertime in central Beijing, Atmos. Chem. Phys., 20, 14847–14871, https://doi.org/10.5194/acp-20-14847-2020, 2020.
Sörgel, M., Trebs, I., Serafimovich, A., Moravek, A., Held, A., and Zetzsch, C.: Simultaneous HONO measurements in and above a forest canopy: influence of turbulent exchange on mixing ratio differences, Atmos. Chem. Phys., 11, 841–855, https://doi.org/10.5194/acp-11-841-2011, 2011.
Stuhl, F. and Niki, H.: Flash Photochemical Study of the Reaction OH + NO + M Using Resonance Fluorescent Detection of OH, J. Chem. Phys., 57, 3677–3679, https://doi.org/10.1063/1.1678826, 1972.
Tan, Z., Rohrer, F., Lu, K., Ma, X., Bohn, B., Broch, S., Dong, H., Fuchs, H., Gkatzelis, G. I., Hofzumahaus, A., Holland, F., Li, X., Liu, Y., Liu, Y., Novelli, A., Shao, M., Wang, H., Wu, Y., Zeng, L., Hu, M., Kiendler-Scharr, A., Wahner, A., and Zhang, Y.: Wintertime photochemistry in Beijing: observations of ROx radical concentrations in the North China Plain during the BEST-ONE campaign, Atmos. Chem. Phys., 18, 12391–12411, https://doi.org/10.5194/acp-18-12391-2018, 2018.
Tang, M., Huang, X., Lu, K., Ge, M., Li, Y., Cheng, P., Zhu, T., Ding, A., Zhang, Y., Gligorovski, S., Song, W., Ding, X., Bi, X., and Wang, X.: Heterogeneous reactions of mineral dust aerosol: implications for tropospheric oxidation capacity, Atmos. Chem. Phys., 17, 11727–11777, https://doi.org/10.5194/acp-17-11727-2017, 2017.
Tang, Y., An, J., Wang, F., Li, Y., Qu, Y., Chen, Y., and Lin, J.: Impacts of an unknown daytime HONO source on the mixing ratio and budget of HONO, and hydroxyl, hydroperoxyl, and organic peroxy radicals, in the coastal regions of China, Atmos. Chem. Phys., 15, 9381–9398, https://doi.org/10.5194/acp-15-9381-2015, 2015.
Theys, N., Volkamer, R., Mueller, J. F., Zarzana, K. J., Kille, N., Clarisse, L., De Smedt, I., Lerot, C., Finkenzeller, H., Hendrick, F., Koenig, T. K., Lee, C. F., Knote, C., Yu, H., and Van Roozendael, M.: Global nitrous acid emissions and levels of regional oxidants enhanced by wildfires, Nat. Geosci., 13, 681–686, https://doi.org/10.1038/s41561-020-0637-7, 2020.
Tie, X., Long, X., Li, G., Zhao, S., Cao, J., and Xu, J.: Ozone enhancement due to the photodissociation of nitrous acid in eastern China, Atmos. Chem. Phys., 19, 11267–11278, https://doi.org/10.5194/acp-19-11267-2019, 2019.
VandenBoer, T. C., Brown, S. S., Murphy, J. G., Keene, W. C., Young, C. J., Pszenny, A. A. P., Kim, S., Warneke, C., de Gouw, J. A., Maben, J. R., Wagner, N. L., Riedel, T. P., Thornton, J. A., Wolfe, D. E., Dube, W. P., Ozturk, F., Brock, C. A., Grossberg, N., Lefer, B., Lerner, B., Middlebrook, A. M., and Roberts, J. M.: Understanding the role of the ground surface in HONO vertical structure: High resolution vertical profiles during NACHTT-11, J. Geophys. Res.-Atmos., 118, 10155–10171, https://doi.org/10.1002/jgrd.50721, 2013.
Villena, G., Kleffmann, J., Kurtenbach, R., Wiesen, P., Lissi, E., Rubio, M.A., Croxatto, G., and Rappenglück, B.: Vertical gradients of HONO, NOx and O3 in Santiago de Chile, Atmos. Environ., 45, 3867–3873, https://doi.org/10.1016/j.atmosenv.2011.01.073, 2011.
Wang, F., An, J. L., Li, Y., Tang, Y. J., Lin, J., Qu, Y., Chen, Y., Zhang, B., and Zhai, J.: Impacts of uncertainty in AVOC emissions on the summer ROx budget and ozone production rate in the three most rapidly-developing economic growth regions of China, Adv. Atmos. Sci., 31, 1331–1342, https://doi.org/10.1007/s00376-014-3251-z, 2014.
Wang, X., Zhang, Y., Hu, Y., Zhou, W., Lu, K., Zhong, L., Zeng, L., Shao, M., Hu, M., and Russell, A. G.: Process analysis and sensitivity study of regional ozone formation over the Pearl River Delta, China, during the PRIDE-PRD2004 campaign using the Community Multiscale Air Quality modeling system, Atmos. Chem. Phys., 10, 4423–4437, https://doi.org/10.5194/acp-10-4423-2010, 2010.
Wang, Y., Dörner, S., Donner, S., Böhnke, S., De Smedt, I., Dickerson, R. R., Dong, Z., He, H., Li, Z., Li, Z., Li, D., Liu, D., Ren, X., Theys, N., Wang, Y., Wang, Y., Wang, Z., Xu, H., Xu, J., and Wagner, T.: Vertical profiles of NO2, SO2, HONO, HCHO, CHOCHO and aerosols derived from MAX-DOAS measurements at a rural site in the central western North China Plain and their relation to emission sources and effects of regional transport, Atmos. Chem. Phys., 19, 5417–5449, https://doi.org/10.5194/acp-19-5417-2019, 2019.
Wang, Y., Apituley, A., Bais, A., Beirle, S., Benavent, N., Borovski, A., Bruchkouski, I., Chan, K. L., Donner, S., Drosoglou, T., Finkenzeller, H., Friedrich, M. M., Frieß, U., Garcia-Nieto, D., Gómez-Martín, L., Hendrick, F., Hilboll, A., Jin, J., Johnston, P., Koenig, T. K., Kreher, K., Kumar, V., Kyuberis, A., Lampel, J., Liu, C., Liu, H., Ma, J., Polyansky, O. L., Postylyakov, O., Querel, R., Saiz-Lopez, A., Schmitt, S., Tian, X., Tirpitz, J.-L., Van Roozendael, M., Volkamer, R., Wang, Z., Xie, P., Xing, C., Xu, J., Yela, M., Zhang, C., and Wagner, T.: Inter-comparison of MAX-DOAS measurements of tropospheric HONO slant column densities and vertical profiles during the CINDI-2 campaign, Atmos. Meas. Tech., 13, 5087–5116, https://doi.org/10.5194/amt-13-5087-2020, 2020.
Wilkinson, S., Mills, G., Illidge, R., and Davies, W. J.: How is ozone pollution reducing our food supply?, J. Exp. Bot., 63, 527–536, https://doi.org/10.1093/jxb/err317, 2012.
Wong, K. W., Oh, H.-J., Lefer, B. L., Rappenglück, B., and Stutz, J.: Vertical profiles of nitrous acid in the nocturnal urban atmosphere of Houston, TX, Atmos. Chem. Phys., 11, 3595–3609, https://doi.org/10.5194/acp-11-3595-2011, 2011.
Wong, K. W., Tsai, C., Lefer, B., Haman, C., Grossberg, N., Brune, W. H., Ren, X., Luke, W., and Stutz, J.: Daytime HONO vertical gradients during SHARP 2009 in Houston, TX, Atmos. Chem. Phys., 12, 635–652, https://doi.org/10.5194/acp-12-635-2012, 2012.
Wu, D., Horn, M. A., Behrendt, T., Muller, S., Li, J., Cole, J. A., Xie, B., Ju, X., Li, G., Ermel, M., Oswald, R., Fröhlich-Nowoisky, J., Hoor, P., Hu, C., Liu, M., Andreae, M. O., Pöschl, U., Cheng, Y., Su, H., Trebs, I., Weber, B., and Sorgel, M.: Soil HONO emissions at high moisture content are driven by microbial nitrate reduction to nitrite: tackling the HONO puzzle, ISME J., 13, 1688–1699, https://doi.org/10.1038/s41396-019-0379-y, 2019.
Xing, C., Liu, C., Hu, Q., Fu, Q., Wang, S., Lin, H., Zhu, Y., Wang, S., Wang, W., and Javed, Z.: Vertical distributions of wintertime atmospheric nitrogenous compounds and the corresponding OH radicals production in Leshan, southwest China, J. Environ. Sci., 105, 44–55, https://doi.org/10.1016/j.jes.2020.11.019, 2021.
Xing, L., Wu, J., Elser, M., Tong, S., Liu, S., Li, X., Liu, L., Cao, J., Zhou, J., El-Haddad, I., Huang, R., Ge, M., Tie, X., Prévôt, A. S. H., and Li, G.: Wintertime secondary organic aerosol formation in Beijing–Tianjin–Hebei (BTH): contributions of HONO sources and heterogeneous reactions, Atmos. Chem. Phys., 19, 2343–2359, https://doi.org/10.5194/acp-19-2343-2019, 2019.
Xu, J., Zhang, Y. H., and Wang, W.: Numerical study on the impacts of heterogeneous reactions on ozone formation in the Beijing urban area, Adv. Atmos. Sci., 23, 605–614, https://doi.org/10.1007/s00376-006-0605-1, 2006.
Xu, W., Yang, W., Han, C., Yang, H., and Xue, X.: Significant influences of TiO2 crystal structures on NO2 and HONO emissions from the nitrates photolysis, J. Environ. Sci., 102, 198–206, https://doi.org/10.1016/j.jes.2020.09.016, 2021.
Xue, C., Zhang, C., Ye, C., Liu, P., Catoire, V., Krysztofiak, G., Chen, H., Ren, Y., Zhao, X., Wang, J., Zhang, F., Zhang, C., Zhang, J., An, J., Wang, T., Chen, J., Kleffmann, J., Mellouki, A., and Mu, Y.: HONO Budget and Its Role in Nitrate Formation in the Rural North China Plain, Environ. Sci. Technol., 54, 11048–11057, https://doi.org/10.1021/acs.est.0c01832, 2020.
Xue, C. Y., Ye, C., Zhang, C. L., Catoire, V., Liu, P. F., Gu, R. R., Zhang, J. W., Ma, Z. B., Zhao, X. X., Zhang, W. Q., Ren, Y. G., Krysztofiak, G., Tong, S. R., Xue, L. K., An, J. L., Ge, M. F., Mellouki, A., and Mu, Y. J.: Evidence for Strong HONO Emission from Fertilized Agricultural Fields and its Remarkable Impact on Regional O3 Pollution in the Summer North China Plain, ACS Earth Space Chem., 5, 340–347, https://doi.org/10.1021/acsearthspacechem.0c00314, 2021.
Yang, K., Kong, L., Tong, S., Shen, J., Chen, L., Jin, S., Wang, C., Sha, F., and Wang, L.: Double High-Level Ozone and PM2.5 Co-Pollution Episodes in Shanghai, China: Pollution Characteristics and Significant Role of Daytime HONO, Atmosphere, 12, 557, https://doi.org/10.3390/atmos12050557, 2021.
Yang, W., Han, C., Yang, H., and Xue, X.: Significant HONO formation by the photolysis of nitrates in the presence of humic acids, Environ. Pollut., 243, 679–686, https://doi.org/10.1016/j.envpol.2018.09.039, 2018.
Yang, W., Han, C., Zhang, T., Tang, N., Yang, H., and Xue, X.: Heterogeneous photochemical uptake of NO2 on the soil surface as an important ground-level HONO source, Environ. Pollut., 271, 116289, https://doi.org/10.1016/j.envpol.2020.116289, 2021.
Ye, C., Zhou, X., Pu, D., Stutz, J., Festa, J., Spolaor, M., Cantrell, C., Mauldin, R. L., Weinheimer, A., and Haggerty, J.: Comment on “Missing gas-phase source of HONO inferred from Zeppelin measurements in the troposphere”, Science, 348, 1326, https://doi.org/10.1126/science.aaa1992, 2015.
Ye, C., Gao, H., Zhang, N., and Zhou, X.: Photolysis of Nitric Acid and Nitrate on Natural and Artificial Surfaces, Environ. Sci. Technol., 50, 3530–3536, https://doi.org/10.1021/acs.est.5b05032, 2016a.
Ye, C., Zhou, X., Pu, D., Stutz, J., Festa, J., Spolaor, M., Tsai, C., Cantrell, C., Mauldin, R. L., Campos, T., Weinheimer, A., Hornbrook, R. S., Apel, E. C., Guenther, A., Kaser, L., Yuan, B., Karl, T., Haggerty, J., Hall, S., Ullmann, K., Smith, J. N., Ortega, J., and Knote, C.: Rapid cycling of reactive nitrogen in the marine boundary layer, Nature, 532, 489–491, https://doi.org/10.1038/nature17195, 2016b.
Ye, C., Zhang, N., Gao, H., and Zhou, X.: Photolysis of Particulate Nitrate as a Source of HONO and NOx, Environ. Sci. Technol., 51, 6849–6856, https://doi.org/10.1021/acs.est.7b00387, 2017.
Zaveri, R. A., Easter, R. C., Fast, J. D., and Peters, L. K.: Model for Simulating Aerosol Interactions and Chemistry (MOSAIC), J. Geophys. Res.-Atmos., 113, D13204, https://doi.org/10.1029/2007jd008782, 2008.
Zhang, B. Q. and Tao, F. M.: Direct homogeneous nucleation of NO2, H2O, and NH3 for the production of ammonium nitrate particles and HONO gas, Chem. Phys. Lett., 489, 143–147, https://doi.org/10.1016/j.cplett.2010.02.059, 2010.
Zhang, H. L., Li, J. Y., Ying, Q., Yu, J. Z., Wu, D., Cheng, Y., He, K. B., and Jiang, J. K.: Source apportionment of PM2.5 nitrate and sulfate in China using a source-oriented chemical transport model, Atmos. Environ., 62, 228–242, https://doi.org/10.1016/j.atmosenv.2012.08.014, 2012.
Zhang, J., An, J., Qu, Y., Liu, X., and Chen, Y.: Impacts of potential HONO sources on the concentrations of oxidants and secondary organic aerosols in the Beijing-Tianjin-Hebei region of China, Sci. Total Environ., 647, 836–852, https://doi.org/10.1016/j.scitotenv.2018.08.030, 2019a.
Zhang, J., Chen, J., Xue, C., Chen, H., Zhang, Q., Liu, X., Mu, Y., Guo, Y., Wang, D., Chen, Y., Li, J., Qu, Y., and An, J.: Impacts of six potential HONO sources on HOx budgets and SOA formation during a wintertime heavy haze period in the North China Plain, Sci. Total Environ., 681, 110–123, https://doi.org/10.1016/j.scitotenv.2019.05.100, 2019b.
Zhang, J., Guo, Y., Qu, Y., Chen, Y., Yu, R., Xue, C., Yang, R., Zhang, Q., Liu, X., Mu, Y., Wang, J., Ye, C., Zhao, H., Sun, Q., Wang, Z., and An, J.: Effect of potential HONO sources on peroxyacetyl nitrate (PAN) formation in eastern China in winter, J. Environ. Sci., 94, 81–87, https://doi.org/10.1016/j.jes.2020.03.039, 2020.
Zhang, J., Ran, H., Guo, Y., Xue, C., Liu, X., Qu, Y., Sun, Y., Zhang, Q., Mu, Y., Chen, Y., Wang, J., and An, J.: High crop yield losses induced by potential HONO sources – A modelling study in the North China Plain, Sci. Total Environ., 803, 149929, https://doi.org/10.1016/j.scitotenv.2021.149929, 2022.
Zhang, L., Wang, T., Zhang, Q., Zheng, J. Y., Xu, Z., and Lv, M. Y.: Potential sources of nitrous acid (HONO) and their impacts on ozone: A WRF-Chem study in a polluted subtropical region, J. Geophys. Res.-Atmos., 121, 3645–3662, https://doi.org/10.1002/2015jd024468, 2016.
Zhang, N., Zhou, X. L., Shepson, P. B., Gao, H. L., Alaghmand, M., and Stirm, B.: Aircraft measurement of HONO vertical profiles over a forested region, Geophys. Res. Lett., 36, L15820, https://doi.org/10.1029/2009gl038999, 2009.
Zhang, Q. and Geng, G.: Impact of clean air action on PM2.5 pollution in China, Sci. China Earth Sci., 62, 1845–1846, https://doi.org/10.1007/s11430-019-9531-4, 2019.
Zhang, S., Sarwar, G., Xing, J., Chu, B., Xue, C., Sarav, A., Ding, D., Zheng, H., Mu, Y., Duan, F., Ma, T., and He, H.: Improving the representation of HONO chemistry in CMAQ and examining its impact on haze over China, Atmos. Chem. Phys., 21, 15809–15826, https://doi.org/10.5194/acp-21-15809-2021, 2021.
Zhang, W. Q., Tong, S. R., Jia, C. H., Wang, L. L., Liu, B. X., Tang, G. Q., Ji, D. S., Hu, B., Liu, Z. R., Li, W. R., Wang, Z., Liu, Y., Wang, Y. S., and Ge, M. F.: Different HONO Sources for Three Layers at the Urban Area of Beijing, Environ. Sci. Technol., 54, 12870–12880, https://doi.org/10.1021/acs.est.0c02146, 2020.
Zhao, H., Zhang, Y., Qi, Q., and Zhang, H.: Evaluating the Impacts of Ground-Level O3 on Crops in China, Curr. Pollut. Rep., 7, 565–578, https://doi.org/10.1007/s40726-021-00201-8, 2021.
Zheng, H., Song, S., Sarwar, G., Gen, M., Wang, S., Ding, D., Chang, X., Zhang, S., Xing, J., Sun, Y., Ji, D., Chan, C.K., Gao, J., and McElroy, M. B.: Contribution of Particulate Nitrate Photolysis to Heterogeneous Sulfate Formation for Winter Haze in China, Environ. Sci. Technol. Lett., 7, 632–638, https://doi.org/10.1021/acs.estlett.0c00368, 2020.
Zhou, X., Gao, H., He, Y., Huang, G., Bertman, S. B., Civerolo, K., and Schwab, J.: Nitric acid photolysis on surfaces in low-NOx environments: Significant atmospheric implications, Geophys. Res. Lett., 30, 2217, https://doi.org/10.1029/2003GL018620, 2003.
Zhu, C., Xiang, B., Zhu, L., and Cole, R.: Determination of absorption cross sections of surface-adsorbed HNO3 in the 290–330 nm region by Brewster angle cavity ring-down spectroscopy, Chem. Phys. Lett., 458, 373–377, https://doi.org/10.1016/j.cplett.2008.04.125, 2008.
Zhu, Y. W., Liu, W. Q., Fang, J., Xie, P. H., Dou, K., Qin, M., and Si, F. Q.: Monitoring and Analysis of Vertical Profile of Atmospheric HONO, NO2 in Boundary Layer of Beijing, Spectrosc. Spect. Anal., 31, 1078–1082, 2011 (in Chinese).