the Creative Commons Attribution 4.0 License.
the Creative Commons Attribution 4.0 License.
 | 16 Dec 2022
Equilibrium climate sensitivity increases with aerosol concentration due to changes in precipitation efficiency
How Earth's climate reacts to anthropogenic forcing is one of the most burning questions faced by today's scientific community. A leading source of uncertainty in estimating this sensitivity is related to the response of clouds. Under the canonical climate-change perspective of forcings and feedbacks, the effect of anthropogenic aerosols on clouds is categorized under the forcing component, while the modifications of the radiative properties of clouds due to climate change are considered in the feedback component. Each of these components contributes the largest portion of uncertainty to its relevant category and is largely studied separately from the other. In this paper, using idealized cloud-resolving radiative–convective-equilibrium simulations, with a slab ocean model, we show that aerosol–cloud interactions could affect cloud feedback. Specifically, we show that equilibrium climate sensitivity increases under high aerosol concentration due to an increase in the short-wave cloud feedback. The short-wave cloud feedback is enhanced under high-aerosol conditions due to a stronger increase in the precipitation efficiency with warming, which can be explained by higher sensitivity of the droplet size and the cloud water content to the CO2 concentration rise. These results indicate a possible connection between cloud feedback and aerosol–cloud interactions.
- Article
(3410 KB) - Full-text XML
- BibTeX
- EndNote


Estimating Earth's equilibrium climate sensitivity (ECS), defined as the steady-state global-mean temperature increase for a doubling of CO2, is considered to be a first-order, fundamental milestone on the way to understanding and predicting anthropogenically driven climate change (Sherwood et al., 2020). Decades of research have tried to accurately quantify ECS, with only limited success. The most probable current ECS estimates are in the range of 2.3–4.5 K (Sherwood et al., 2020). The largest source of uncertainty in estimating ECS is related to the response of clouds to the externally forced warming and the feedback of these changes on the climate system (Sherwood et al., 2020; Ceppi et al., 2017; Schneider et al., 2017). Clouds strongly modulate Earth's radiation budget by reflecting the incoming short-wave radiation from the sun and by absorbing and re-emitting the terrestrial long-wave radiation (Loeb et al., 2018). Thus, changes in the cloud macro-physical properties (such as coverage and vertical extent) and micro-physical properties (such as liquid/ice partition and hydrometeors size) due to anthropogenically driven climate change could significantly alter the climate system's response (Gettelman and Sherwood, 2016; Nuijens and Siebesma, 2019; Schneider et al., 2017).
An important factor in determining cloud feedback magnitude is the sensitivity of the precipitation efficiency (ϵ) (Lutsko and Cronin, 2018; Lutsko et al., 2021; Li et al., 2022). ϵ quantifies the fraction of condensed water in a cloud to reach the surface as precipitation. Using idealized cloud-resolving simulations, it was shown that ϵ is expected to increase with temperature (Lutsko and Cronin, 2018). The increase in ϵ with warming was shown to be mostly driven by an increase in the efficiency with which cloud condensate is converted into precipitation, while changes in the evaporation of falling precipitation were shown to play a smaller role (Lutsko and Cronin, 2018).
An increase in ϵ with warming represents more efficient depletion of the water from the clouds, thus affecting the radiation budget. On the one hand, increase in ϵ with warming was suggested to reduce the anvil cloud coverage and hence increase the outgoing long-wave radiation (Lindzen et al., 2001; Mauritsen and Stevens, 2015), thus producing negative feedback. On the other hand, however, it was recently shown that the long-wave effect of an ϵ increase is over-compensated for by changes in the short-wave flux (Li et al., 2019); i.e. a large reduction in the cloud optical depth, driving a reduction in the short-wave cooling effect of clouds, dominates the response.
The efficiency with which cloud condensate is converted into precipitation is closely linked to the micro-physical properties of the clouds. The autoconversion of cloud droplets into rain becomes significant when liquid water amount and/or droplet radii reach a critical threshold (Freud and Rosenfeld, 2012). An important factor influencing the droplet radii (and also the liquid water amount, to some degree) is the amount of available cloud condensation nuclei (CCN). Generally, an increase in aerosol concentration drives an increase in CCN concentration, which results in more numerous and smaller droplets in the cloud (Twomey, 1974; Warner and Twomey, 1967). The smaller droplets require longer time (or equivalently larger vertical distance) in the clouds to grow by diffusion to the critical size enabling precipitation, thus delaying the initial warm-rain formation (Rosenfeld, 2000; Dagan et al., 2015b). In addition, aerosols were suggested to enhance the vertical velocities and the cloud top heights of deep convective clouds (due to the so-called invigoration mechanism; Abbott and Cronin, 2021; Koren et al., 2005; Rosenfeld et al., 2008), which in turn can result in precipitation enhancement (Koren et al., 2012). Therefore, aerosols could affect ϵ (Khain, 2009).
In addition to the effect on rain, aerosols could modify the radiative properties of clouds by modifying the droplet concentration and size distribution (Twomey, 1974) and by affecting the clouds' macro-physical properties (Albrecht, 1989; Bellouin et al., 2019). These changes to the radiative properties of clouds result in radiative forcing that could affect the sea surface temperature (SST; Bellouin et al., 2019). Using cloud-resolving radiative–convective-equilibrium simulations with interactive SST, Khairoutdinov and Yang (2013) showed that the surface temperature decreases by 1.5 K with each 10-fold increase in aerosol concentration, an effect quite comparable to a 2.1–2.3 K SST warming obtained in a simulation with given (low-)aerosol conditions but doubled CO2 concentration.
It has been suggested that cloud feedback and aerosol forcing are not independent of each other (Mülmenstädt and Feingold, 2018; Igel and van den Heever, 2021). In addition, the strong links between ϵ and cloud feedback and between ϵ and aerosol concentration merit a dedicated study on the potential mutual CO2 and aerosol effect on clouds and thus also on ECS, which is the aim of the current study.
2.1 Model description and experimental design
The model used herein is the System of Atmospheric Modeling (SAM; Khairoutdinov and Randall, 2003) version 6.11.7. Subgrid-scale fluxes are parameterized using Smagorinsky's eddy diffusivity model, and gravity waves are damped at the top of the domain. The microphysics scheme used is the two-moment bulk microphysics of Morrison et al. (2005). The cloud droplet number concentration (CDNC) source assumes that the number of activated CCN depends on the super-saturation (S – which is estimated diagnostically in the model as the model assumes saturation adjustment) according to a power law: CDNC = NaSk, where Na is the prescribed concentration of CCN active at 1 % super-saturation, and k is a constant (set in this study to 0.4 – a typical value for maritime conditions). Changes in Na serve as a proxy for the change in aerosol concentration. Three levels of Na are considered here, covering an extreme range of conditions – 20, 200 and 2000 cm−3. While this wide range of conditions is unlikely to exist at any given geographical location, they are used here in order to cover the range of possible conditions at different locations and to maximize the effect for establishing better physical understanding. The activation of CCN at the cloud base is parameterized following Twomey (1959), using the vertical velocity and CCN spectrum parameters. The model is configured to pass cloud water and ice-crystal effective radii from the microphysics scheme to the radiation scheme; thus, the Twomey effect (Twomey, 1977) of both liquid and ice is considered. Direct interactions between aerosols and radiation are not considered here.
The simulations are conducted in a radiative–convective-equilibrium (RCE) mode and generally follow the RCEMIP (RCE Model Intercomparison Project; Wing et al., 2018) small-domain instructions (but with interactive SST and changes in the CO2 and aerosol concentration). The simulations were performed on a square, doubly periodic domain. In this case, we want to avoid the effect of convective self-aggregation on ϵ; thus, the domain size is set to 96×96 km2, which was shown to be small enough to prevent convective self-aggregation (Muller and Held, 2012; Lutsko and Cronin, 2018; Yanase et al., 2020). The horizontal grid spacing is set to 1 km, and 68 vertical levels are used, between 25 m and 31 km, with vertical grid spacing increasing from 50 m near the surface to roughly 1 km at the domain top. We note that while shallow clouds are present in the simulations, the grid spacing used here is too coarse for a full representation of these clouds. A time step of 10 s is used, and radiative fluxes are calculated every 5 min using the CAM radiation scheme (Collins et al., 2006). The output resolution for all fields is 1 h (3-D fields are saved as snapshots, while domain statistics are saved as hourly averages). The incoming solar radiation is fixed at 551.58 W m−2, with a zenith angle of 42.05∘ (Wing et al., 2018), producing a net insolation close to the tropical-mean value. Convection is initialized with a small thermal noise added near the surface at the beginning of the simulation. The initial conditions for the simulations are as in Wing et al. (2018).
Greenhouse gases are varied for three different levels: pre-industrial level (280 ppm; 1× CO2), 2 times the pre-industrial level (2× CO2) and 4 times the pre-industrial level (4× CO2). As in the case of the aerosol concentrations, the large range of CO2 conditions covered here are used to examine the clouds' sensitivity to greenhouse gas concentrations under a wide range of conditions. Nine different simulations, with all possible combinations of Na and CO2 concentrations, were conducted. The O3 vertical profile is similar to Wing et al. (2018) and represents a typical tropical atmosphere. The effect of other trace gases (such as CH4 and N2O) is neglected for simplicity.
In all simulations, the SST is interactive and predicted by a slab ocean model (SOM). The SOM's mixed layer depth is set to 5 m, which represented a compromise between a relatively deep layer (≥ 10 m), which reduces SST noise (Khairoutdinov and Yang, 2013), and a relatively shallow layer (≪ 1 m), which requires a shorter computation time for equilibrium (Romps, 2020). As in Romps (2020), the SOM is cooled at a rate of 112 W m−2 in order to ensure that the simulations with 1× CO2 are kept at around the initial SST of 300 K (Fig. 1). Each simulation was run for 1800 d, which is sufficient for reaching close to equilibrium (the surface energy imbalance is ≤ 0.1 W m−2 in all simulations during the last 150 d). The last 150 d of each run is used for statistical sampling (grey shading in Fig. 1).
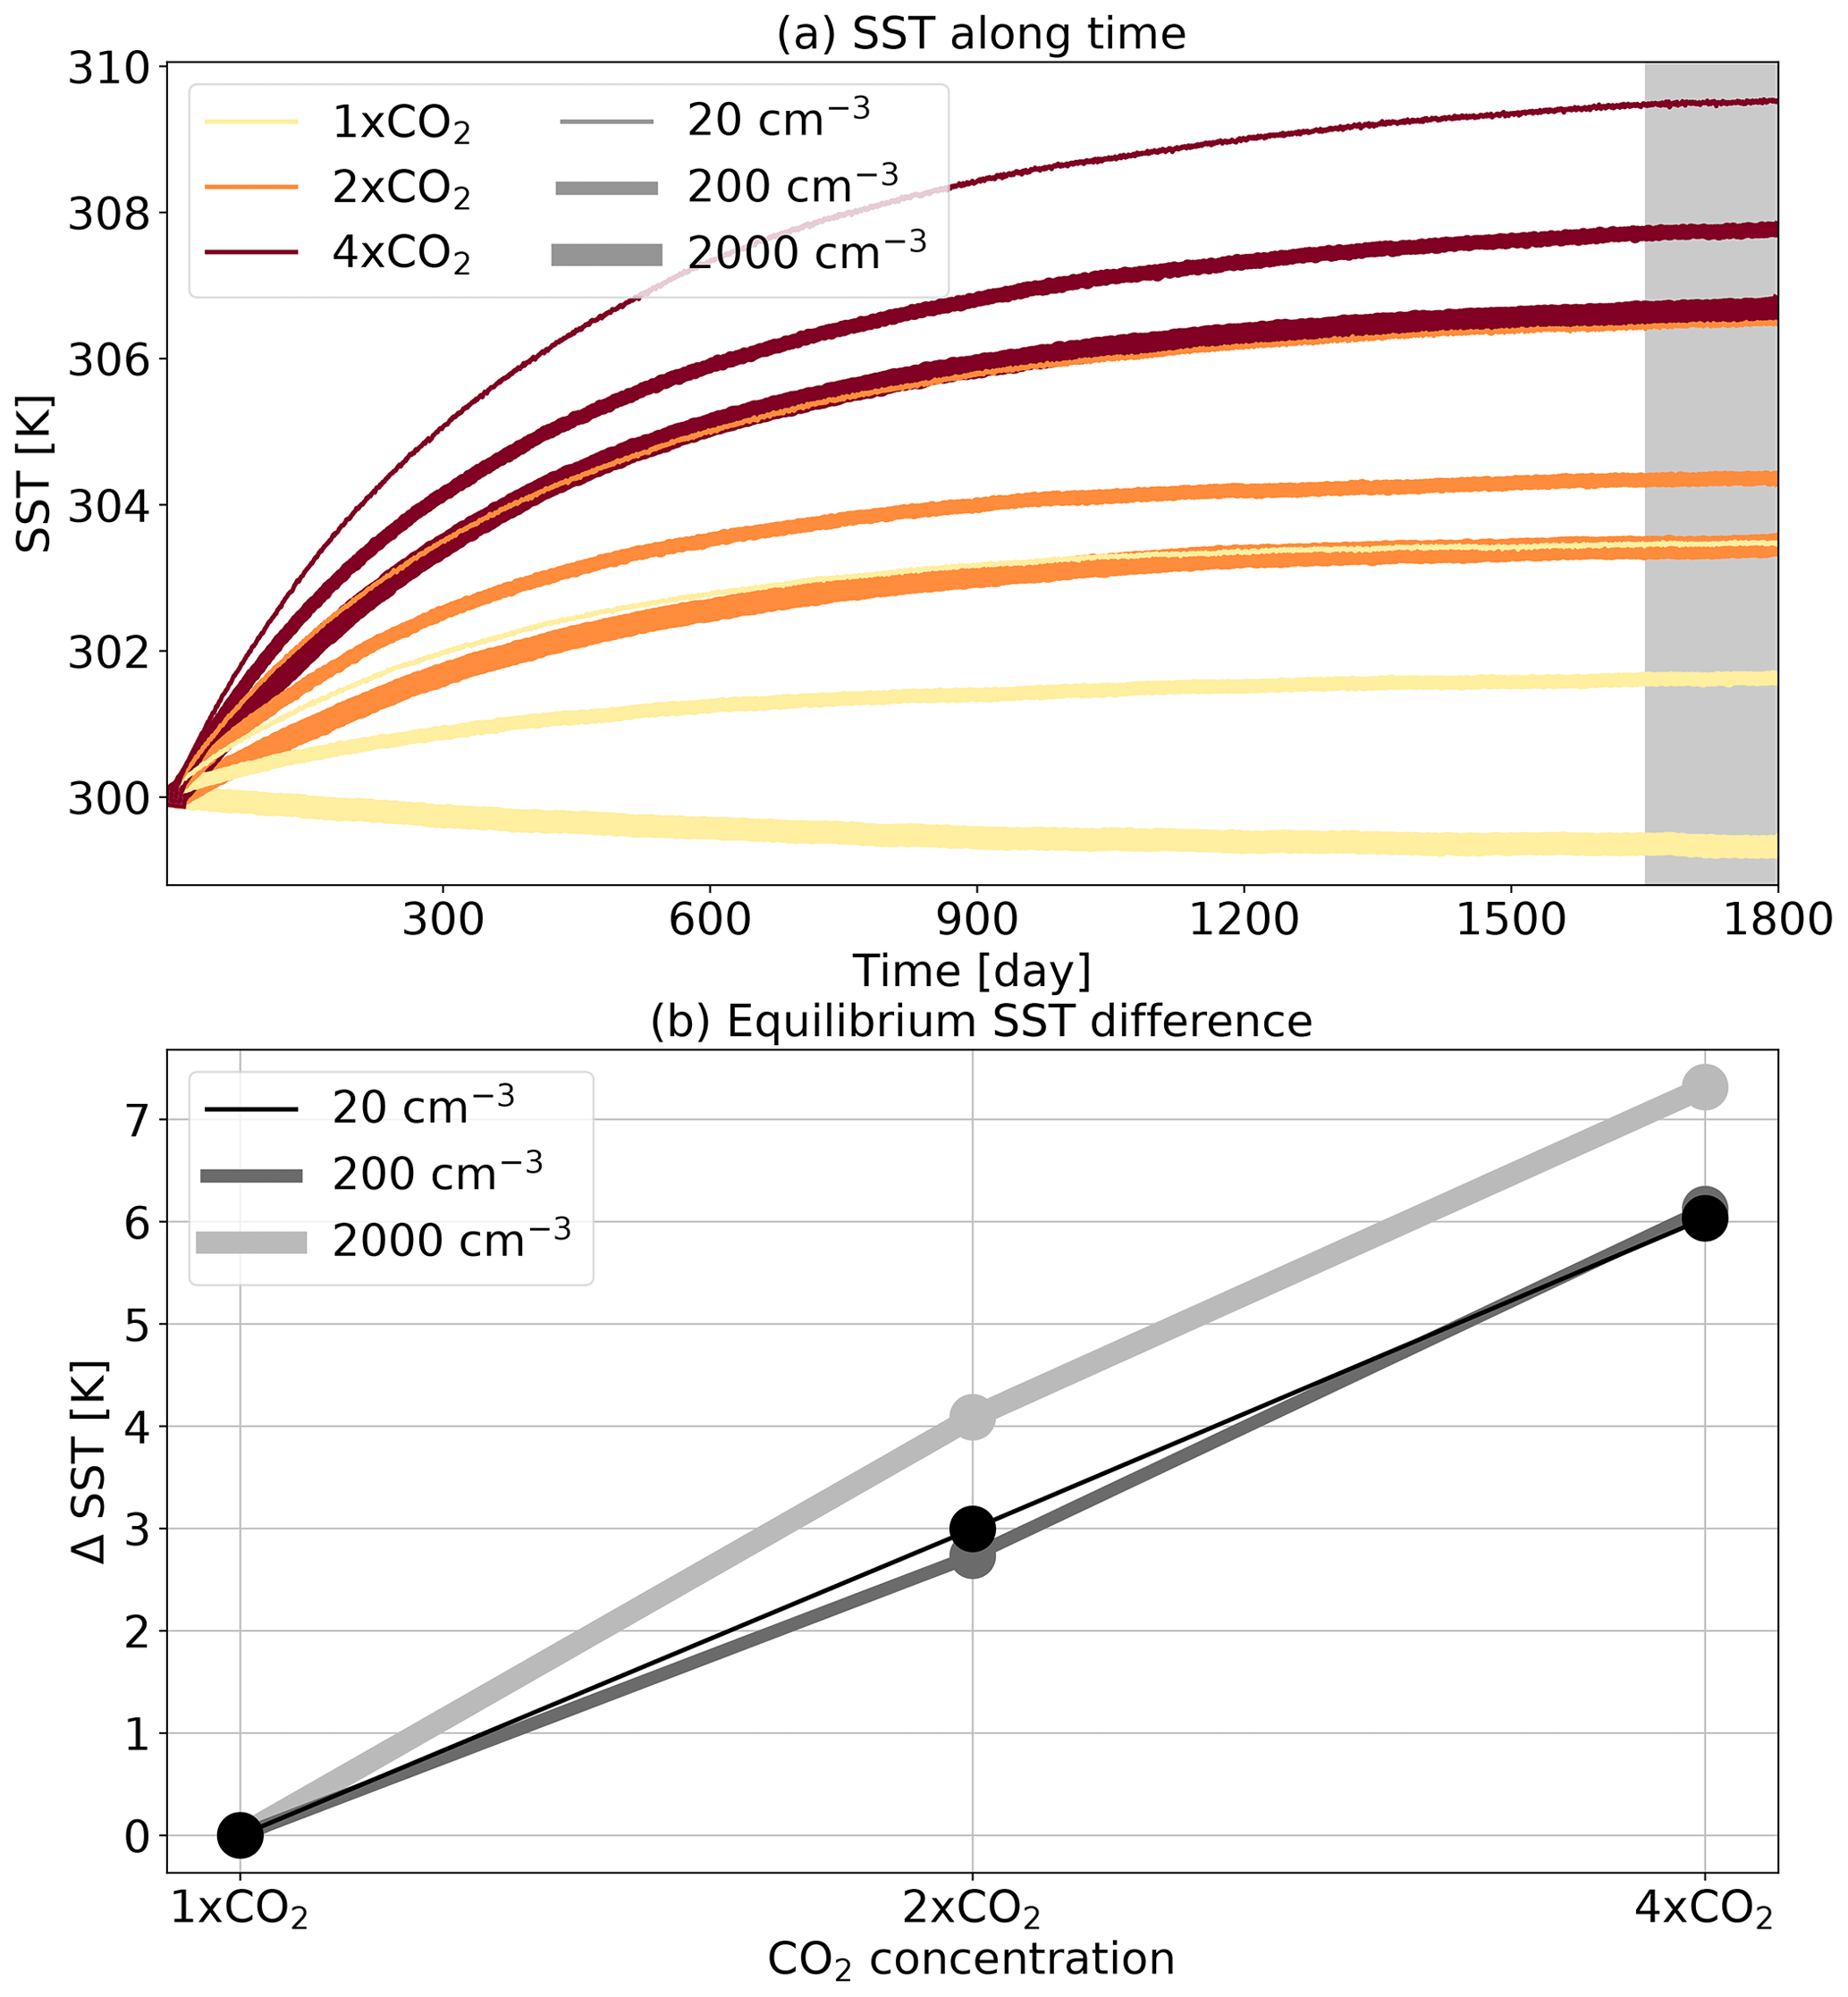
Figure 1(a) The sea surface temperature (SST) along time for the different simulations conducted under different aerosol and CO2 concentrations. The shaded grey area is referred to as equilibrium conditions. (b) Change in equilibrium SST due to a change in CO2 concentration (compared to the 1× CO2 case of each aerosol concentration), for the different aerosol concentrations (the different curves).
Figure 1 presents the SST of the different simulations along time (panel a) and the change in the equilibrium SST with the CO2 concentration for the different Na cases (panel b). As expected, the equilibrium SST (grey shading in Fig. 1a) increases with the CO2 concentration and decreases with Na concentration. However, the rate of increase in equilibrium SST with CO2 concentration increases under extremely high Na concentrations (2000 cm−3), compared with the low and medium Na concentrations (20 and 200 cm−3, respectively; Fig. 1b). Calculating the average ECS based on the three combinations available for each Na condition (2× CO2 − 1× CO2, 4× CO2 − 2× CO2 and (4× CO2 − 1× CO) demonstrates that it increases with Na from 3.0 K at the lowest Na to 3.7 K at the highest Na (i.e. a 23 % increase; Table 1).
Table 1Average equilibrium climate sensitivity (ECS), cloud feedback parameter (λcloud), hydrological sensitivity (η) and change in precipitation efficiency (Δϵ) of the three combinations available for each Na condition (2× CO2 − 1× CO2, 4× CO2 − 2× CO2 and 4× CO2 − 1× CO2). For the calculation of the average ECS, the difference between 4× CO2 and 1× CO2 is divided by 2. The rest of the quantities are normalized by the SST change between the relevant simulations. Please refer to the text for the definitions of these quantities.
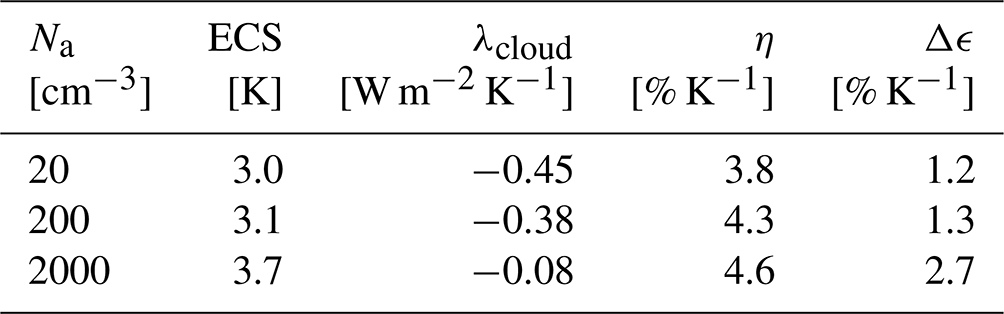
Figure 2 presents the time- and domain-mean vertical profiles of temperature and water vapour mixing ratio (qv) in the different simulations (panels a and b) and their difference from the simulation with the lowest Na and CO2 concentrations (panels c and d). It demonstrates, as expected, that the vertical profile of air temperature is set by the surface temperature (increases with CO2 concentrations and decreases with Na) with an amplification of the change at the upper troposphere, as the profiles follow the moist adiabatic lapse rate. It also shows that qv increases with the temperature, as expected (Held and Soden, 2006).
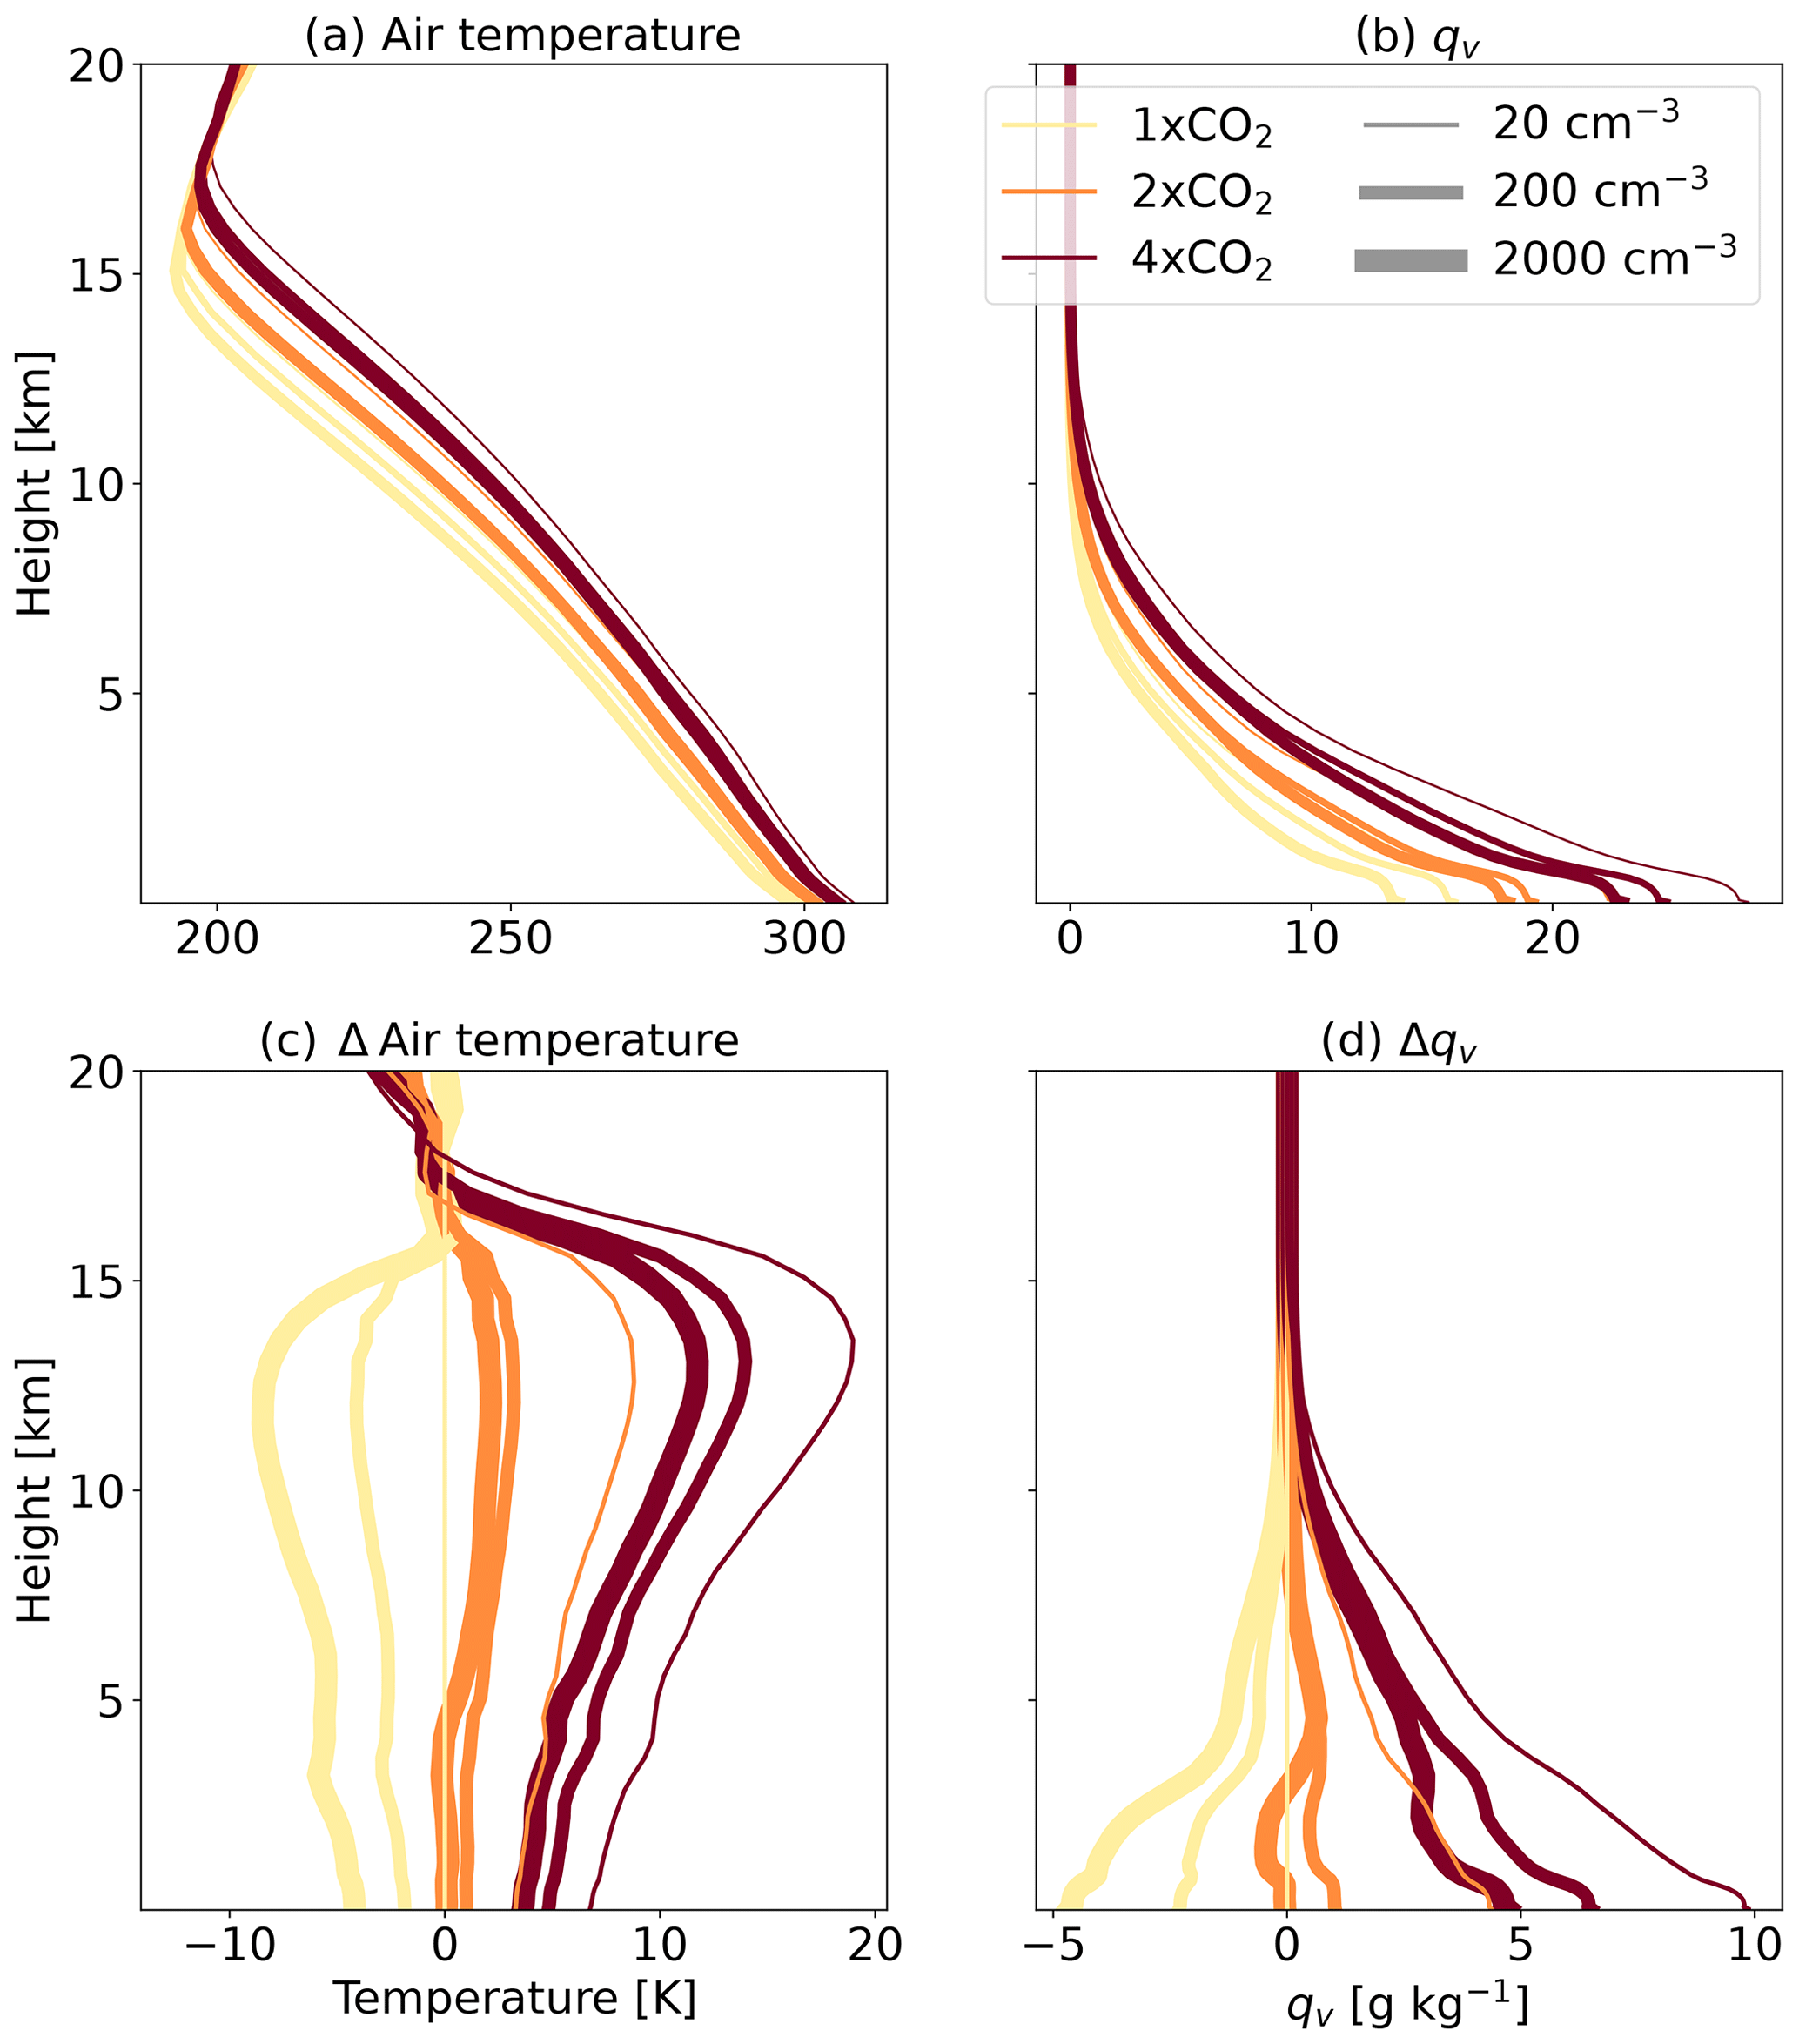
Figure 2Time- and domain-mean vertical profiles of air temperature and water vapour mixing ratio (qv) in the different simulations (a, b) and how they differ from the simulation with the lowest Na and CO2 concentrations (c, d).
In order to understand the increase in ECS with Na, we next examine the top-of-atmosphere (TOA) energy budget. Figure 3 presents the change in the net short-wave and long-wave TOA energy gain (RSW and RLW, respectively) with the CO2 concentration for the different Na conditions. In addition, Fig. 3 presents the change in the cloud radiative effect (CRE) with increasing the CO2 concentration, where CRE is computed by subtracting the clear-sky from the all-sky TOA radiative fluxes (R−Rclear-sky), again for the short wave and long wave separately (CRESW and CRELW, respectively). Figure 3a and b demonstrate that under equilibrium conditions RSW increases, while RLW decreases with the CO2 concentration. However, the rate of change in both RSW and RLW is much faster under the high-Na conditions than under the low- and medium-Na conditions. The trend in CRESW under the different Na conditions (Fig. 3c) resembles the trend in RSW, suggesting that the clouds' response dominates the changes in the TOA short-wave fluxes. CRELW, on the other hand, decreases at a similar rate with CO2 concentration for the different Na conditions (Fig. 3d). Thus, the different decrease rates in RLW with CO2 concentration for the different Na conditions (Fig. 3b) must be driven by clear-sky changes (specifically, the plank, the lapse rate and the water vapour feedbacks; see Fig. 2 above).
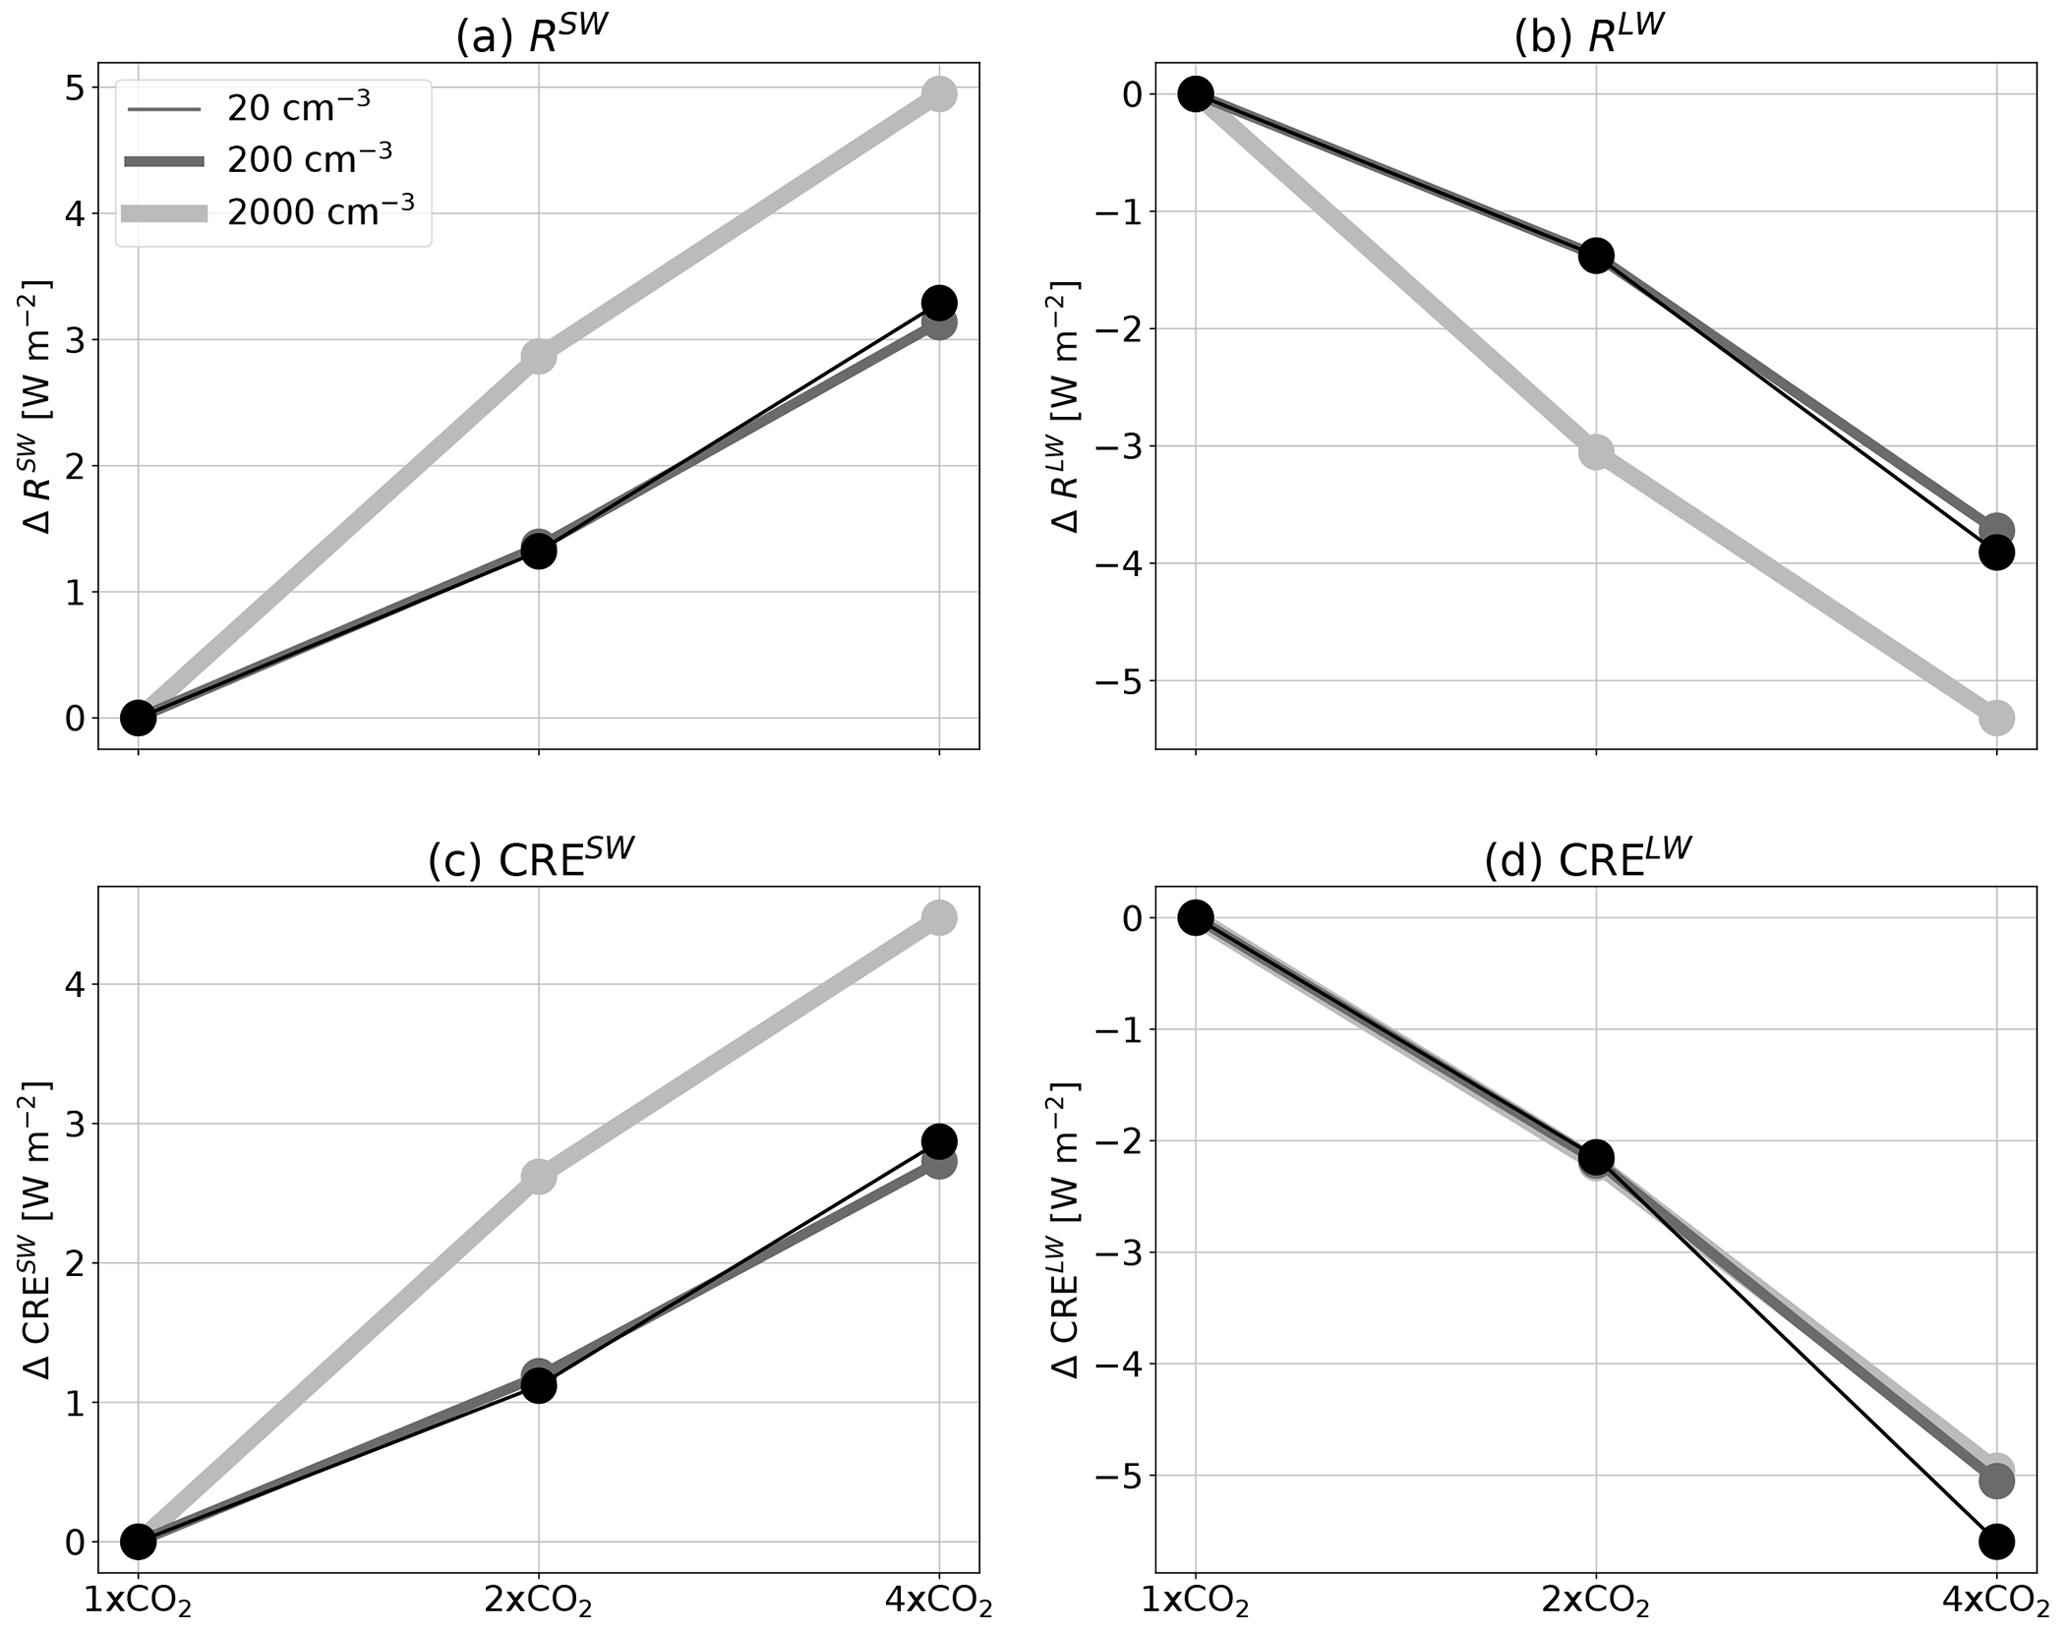
Figure 3The change in the net top-of-atmosphere energy gain (R) in the short wave (a) and in the long wave (b) and the change in the cloud radiative effect (CRE) in the short wave (c) and in the long wave (d), due to a change in the CO2 concentration (compared to the 1× CO2 case of each aerosol concentration), for the different aerosol concentrations (the different curves).
In Table 1 above, we estimate the average cloud radiative feedback (λcloud) as the change in CRE with increasing surface temperature, i.e. λcloud= dCRE dT, for the different Na conditions. The table shows that λcloud becomes less negative with the increase in Na, leading to higher climate sensitivity. The differences in the values of λcloud between the different Na conditions are mostly derived from the short-wave part of the spectrum (Fig. 3).
Thus far, we have seen that the ECS increases with Na (Fig. 1 and Table 1) and that this increase can be explained by changes in λcloud (Table 1) and specifically in CRESW (Fig. 3). To understand the changes in the cloud properties driving the changes in λcloud, and hence also in ECS, under the different Na conditions, in Fig. 4 we present the change in cloud liquid water path (CWP), ice water path (IWP), rainwater path (RWP) and cloud fraction (CF) with increasing CO2 concentrations for the different Na conditions. The figure shows that the CWP decreases with the CO2 concentrations at a much faster rate (about 3 times faster) under the highest-Na conditions compared to the low- and medium-Na conditions (Fig. 4a). The changes in the IWP, on the other hand, are about an order of magnitude smaller than the changes in CWP and are not consistent in sign for the different Na conditions (Fig. 4b). The RWP increases with the CO2 concentrations at a slightly faster rate (about 20 % faster) under the highest-Na conditions compared to the low- and medium-Na conditions (however the response is non-monotonic with Na; Fig. 4c). The CF decreases with the CO2 concentrations at a similar rate for the different Na conditions (about 1.5 % decrease in CF for each doubling of the CO2 concentrations; Fig. 4d).
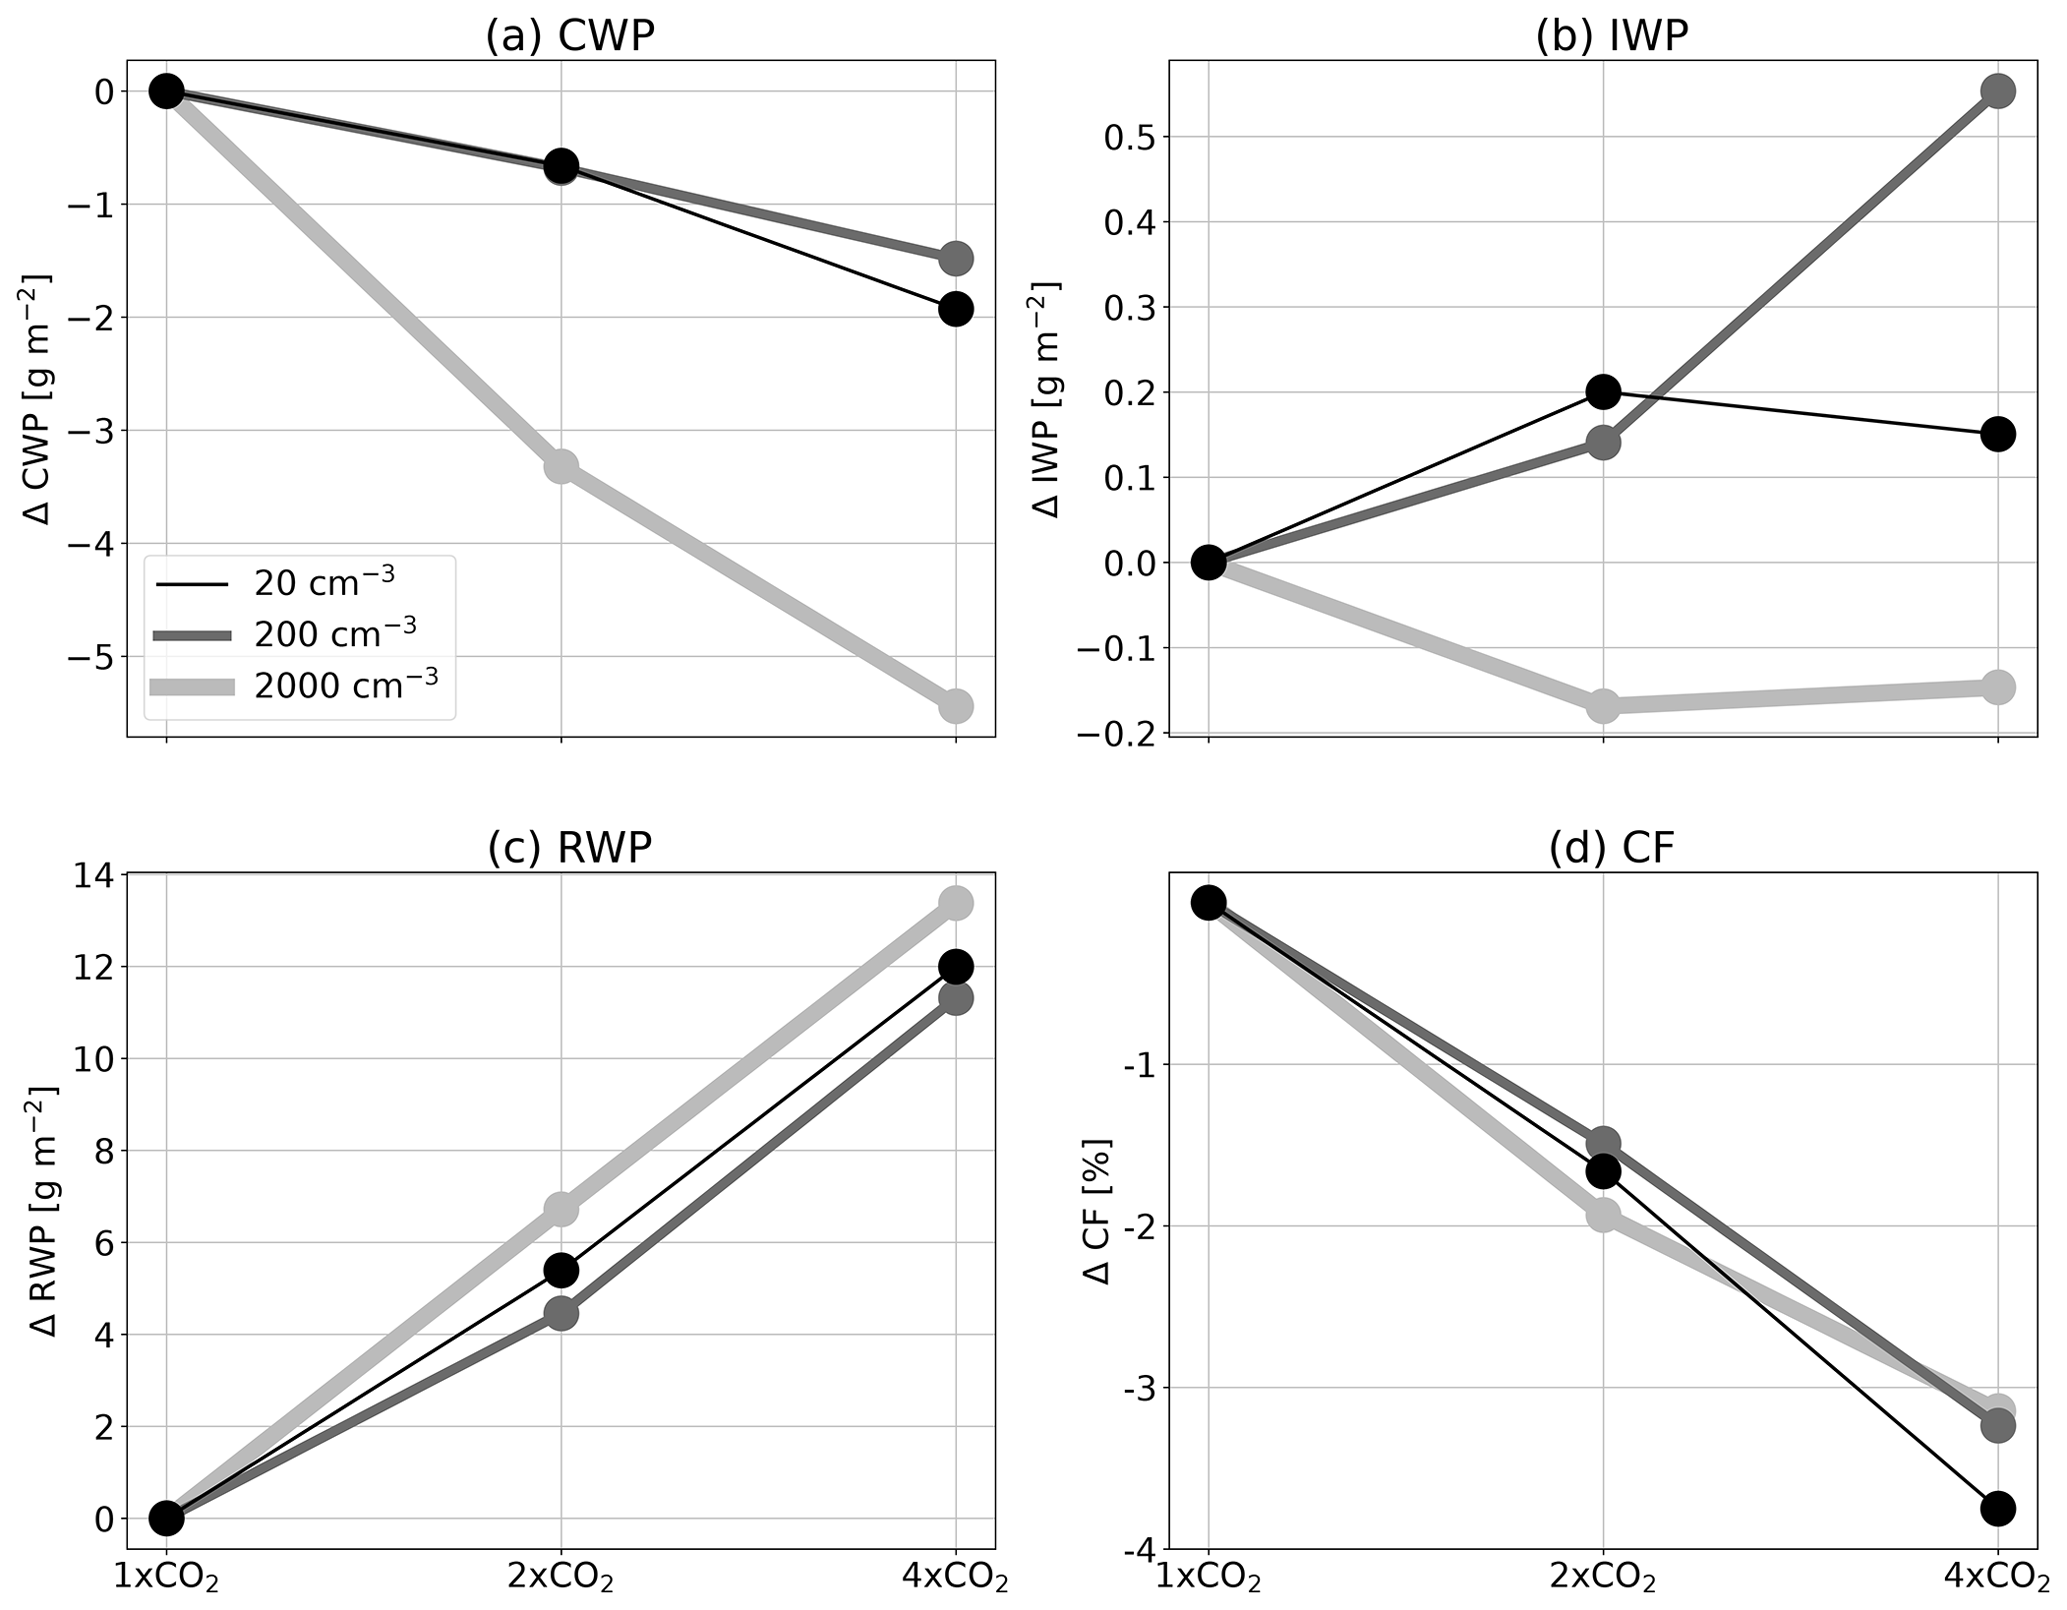
Figure 4The change in (a) cloud liquid water path (CWP), (b) ice water path (IWP), (c) rainwater path (RWP) and (d) cloud fraction (CF) due to a change in the CO2 concentration (compared to the 1× CO2 case of each aerosol concentration), for the different aerosol concentrations (the different curves).
The faster decrease in CWP with CO2 concentrations under high-Na conditions drives the faster increase in CRESW as the clouds become less opaque in the short wave. We note that the difference in CRESW trend under different Na conditions could not be explained by the minor differences in the CF trends. In addition, the small differences in the IWP between the different Na conditions are consistent with the small differences in the CRELW seen above. The general increase in RWP with CO2 concentrations is consistent with an increase in precipitation efficiency with warming (Lutsko and Cronin, 2018), as elaborated below.
Figure 4 suggests that the largest difference in the cloud response to CO2 under different Na conditions is due to changes in CWP. The higher sensitivity of CWP to CO2 concentration under higher-Na conditions can explain the higher λcloud and thus also the larger ECS. Hence, the question arises: what causes the faster reduction in CWP with CO2 concentration under high-Na conditions? A major sink for CWP is via precipitation. Hence, in Fig. 5 we present the change in the mean surface precipitation rate, the hydrological sensitivity (η – the rate of change in the surface precipitation per 1 K increase in surface temperature) and the precipitation efficiency (ϵ – calculated following Li et al., 2022, as the ratio of surface precipitation to condensed water path, i.e. CWP + IWP + RWP). Please note that the precipitation efficiency definition used here, following Li et al. (2022), is slightly different from the definition used in Lutsko and Cronin (2018). However, the two different definitions were shown to be tightly correlated (Li et al., 2022); thus, the exact definition used is not expected to change the main conclusions. In addition, the use of this definition will enable easier comparison with observations and global climate models in the future.

Figure 5The change in (a) surface precipitation, (b) hydrological sensitivity (η) and (c) precipitation efficiency (ϵ) due to a change in the CO2 concentration (compared to the 1× CO2 case of each aerosol concentration), for the different aerosol concentrations (the different curves).
As expected, Fig. 5 demonstrates that the surface precipitation increases with CO2 (i.e. η is positive), and so does ϵ (Lutsko and Cronin, 2018). This is true for all Na conditions. However, the rates of increase in surface precipitation and ϵ with CO2 concentration are higher under the highest-Na conditions (see also Table 1). We note that the larger rate of increase in surface precipitation under the highest-Na conditions is not solely due to the higher surface temperature increase, as η also increases with Na.
The much larger (more than double; Table 1) rate of increase in ϵ with the CO2 concentration under the highest-Na conditions represents more efficient depletion of the cloud water from the atmosphere, leading to a faster reduction in CWP with CO2 concentration (Fig. 4), which in turn leads to higher λcloud and ECS. The faster increase in RWP with CO2 concentration under the highest-Na conditions presented in Fig. 4c is consistent with this explanation.
The last open question is why ϵ increases faster with CO2 concentration under the highest-Na conditions. The increase in ϵ with warming was shown to be mostly driven by an increase in the efficiency with which cloud condensate is converted into precipitation (Lutsko and Cronin, 2018). As mentioned in the introduction, the conversion of cloud condensate into precipitation (or autoconversion of cloud droplets) becomes significant only when liquid water amount and/or droplet radii reach a critical threshold (Freud and Rosenfeld, 2012). To understand the faster ϵ increases with CO2 concentration under the highest-Na conditions, we present the histograms over the domain and time (during the last 150 d of the simulations based on 3-D output in 1 h resolution) of liquid cloud droplet mixing ratio (qc; Fig. 6) and mean cloud droplet radii (; Fig. 7) around the height of the maximum in cloud droplet effective radii (1950 m) and its mean sensitivity to doubling of CO2 concentration for each Na condition.
Figure 6 demonstrates that the cut-off of the qc distribution (the mixing ratio for which the probability density function starts to decrease sharply) increases with the CO2 concentration and decreases with the aerosol concentration. However, the sensitivity of the relatively large qc to CO2 concentration is significantly larger under high aerosol concentrations compared to the lower aerosol concentrations (Fig. 6b). The larger relative increase in high qc promotes the autoconversion process and hence enhances ϵ, more so under high aerosol concentrations than under low aerosol concentrations.
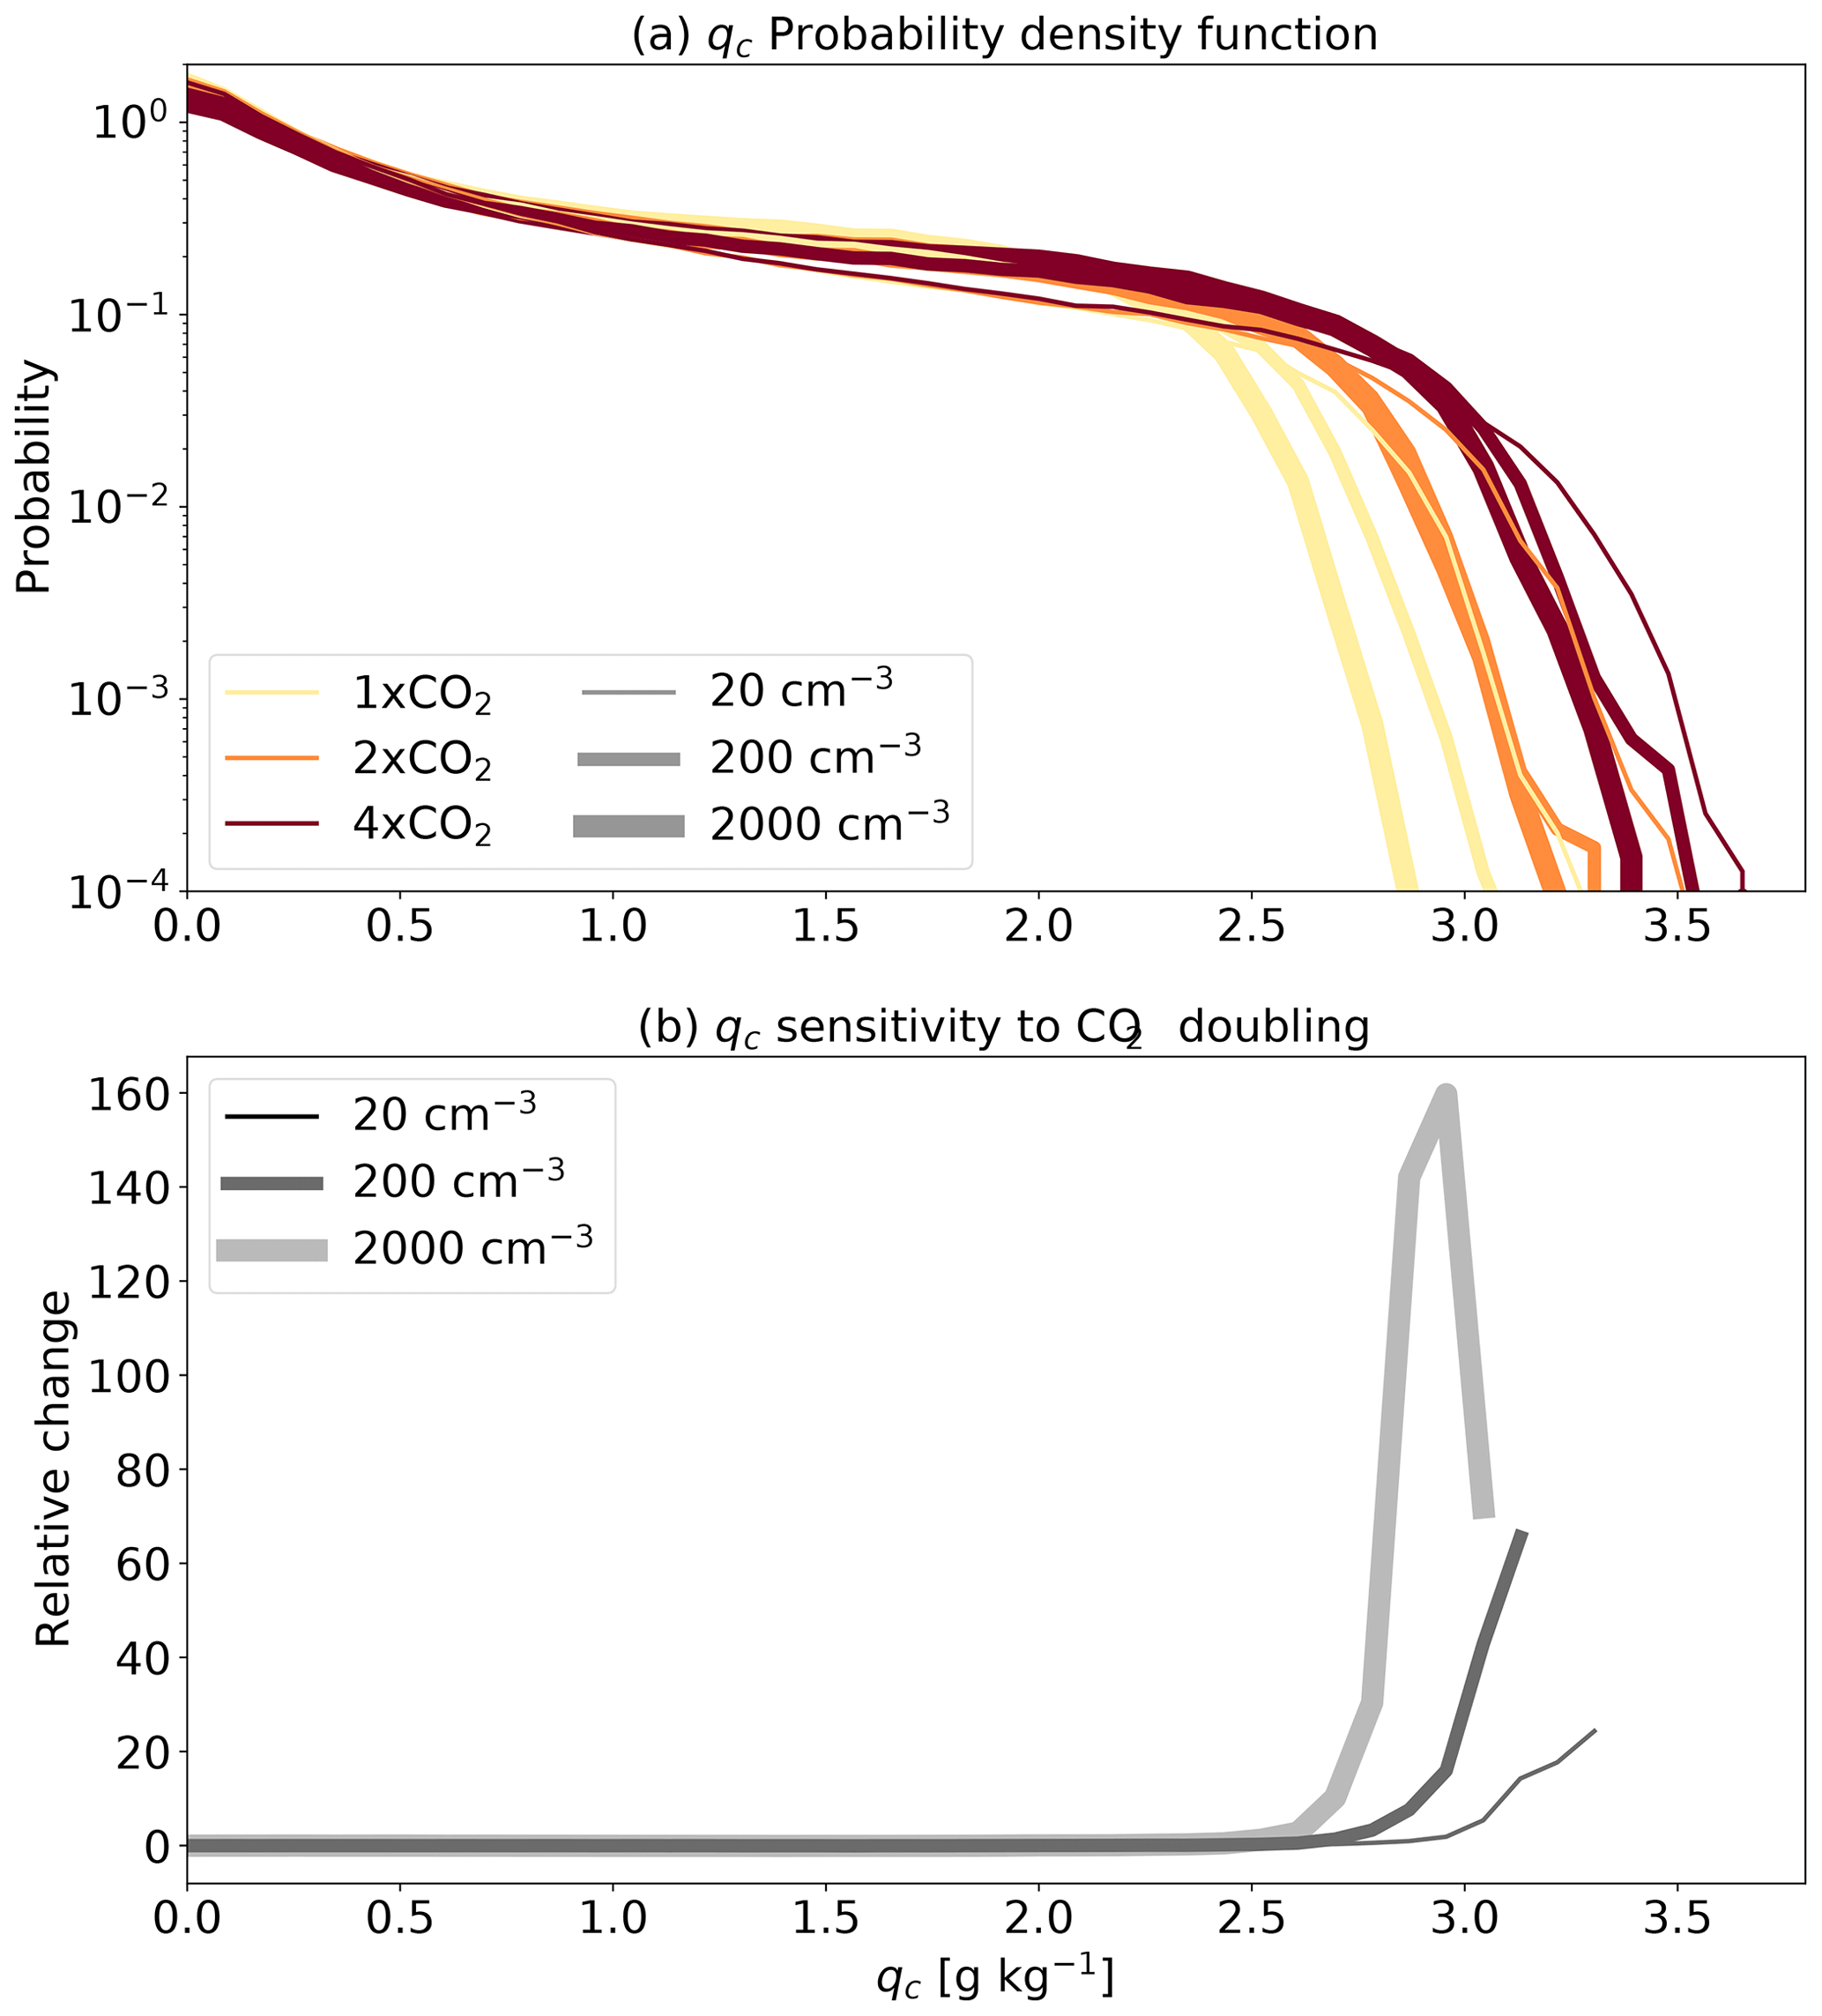
Figure 6Probability density functions (PDFs) of the cloud droplet mixing ratio (qc) for the different simulations (a) and the mean sensitivity of the qc PDF to a doubling of the CO2 concentration based on the three combinations available for each Na condition (2× CO2 − 1× CO2, 4× CO2 − 2× CO2 and (4× CO2 − 1× CO2) ) (b), calculated for the heights around which the cloud droplet effective radii reach a maximum (1950 m) and using 3-D files output every hour of the last 150 d of the simulations. Note the logarithmic scales for the y axes of (a).

Figure 7Probability density functions (PDFs) of cloud droplet mean radii () for the different simulations (a) and the mean sensitivity of the PDF to a doubling of the CO2 concentration based on the three combinations available for each Na condition (2× CO2 − 1× CO2, 4× CO2 − 2× CO2 and (4× CO2 − 1× CO2) ) (b), calculated for the heights around which the cloud droplet effective radii reach a maximum (1950 m) and using 3-D files output every hour of the last 150 d of the simulations. Note the logarithmic scales for the y axes of (a).
Figure 7 demonstrates, in line with expectations, that Na has a strong effect on . In addition, it shows that under all Na conditions, increases with the CO2 concentration. This could be explained by the increase in the availability of water vapour (Fig. 2), which, for given Na conditions, enables larger diffusional growth of the droplets. This trend could also be understood from the increase in qc with warming (Fig. 6; Lutsko and Cronin, 2018), which under given Na conditions implies larger . Here again, the highest-Na conditions demonstrate the largest sensitivity of to CO2 concentration, especially on the right-hand side of the distribution (Fig. 7b). This could be explained by the fact that under these high-Na conditions, the cloud droplet growth is primarily limited by the availability of water vapour, as a large number of droplets compete for the available water vapour (Koren et al., 2014; Dagan et al., 2015a; Reutter et al., 2009). Thus, an increase in the availability of water vapour with CO2 concentration (Fig. 2) under polluted conditions results in a larger increase in compared with clean conditions. However, the reasons behind this trend, as well as behind the larger increase in qc in high-Na simulations, deserve further exploration in the future. Similarly to the qc case, the larger relative increase in the relatively large droplets promotes the autoconversion process and hence enhances ϵ, more so under high aerosol concentrations than under lower aerosol concentrations.
The role of clouds in climate change is manifested by two pathways: (1) effects of anthropogenic aerosol on clouds and (2) feedback that clouds exert on the changing climate. These two pathways are usually studied separately, and even by different scientific communities. In this paper, we demonstrate that the two pathways are closely linked to each other and should be examined concurrently.
Using long, idealized RCE simulations over a small domain with a slab ocean model, we demonstrate that the ECS, i.e. the increase in surface temperature under equilibrium conditions due to doubling of the CO2 concentration, increases with the aerosol concentration. The ECS increase is explained by a faster increase in precipitation efficiency with warming under high aerosol concentrations, which represents a more efficient depletion of the water from the cloud and thus is manifested as an increase in the cloud feedback parameter. The precipitation efficiency increases faster under high aerosol concentration due to a higher sensitivity of the relatively high liquid water mixing ratios and the relatively large mean droplet sizes to a CO2 concentration increase. We note that the increase in the total (short wave plus long wave) cloud feedback parameter with the increase in precipitation efficiency is a result of a stronger short-wave effect (Li et al., 2019) than a long-wave effect (Lindzen et al., 2001) in the simulations presented here. Future work should examine the robustness of this trend in different models and with different microphysical and radiative schemes. Moreover, the response of precipitation to changes in aerosol concentration might be microphysical-representation-dependent (White et al., 2017) and hence should be examined in the future under different microphysical schemes (conceivably in a multi-model intercomparison project focusing on aerosol effect on RCE simulations).
The results presented here are based on idealized simulations over a small domain. Under more realistic conditions, other processes, not included here, that could affect the precipitation efficiency and hence the general trend will be introduced. In particular, convective self-aggregation could be of interest as, while it is inhibited in the small domain used here, it was shown to affect precipitation efficiency (Lutsko et al., 2021) and to be affected by aerosols (Nishant et al., 2019). Other processes that should be accounted for in future research include the presence of large-scale circulation and direct aerosol radiative effects (Dagan et al., 2019; Dingley et al., 2021). In addition, the results presented here suggest that the sensitivity of ECS to aerosol loading might not be linear (Table 1). Hence, the dynamical aerosol range present at different geographical locations would affect the total ECS trend.
The results presented here suggest a possible connection between cloud feedback and aerosol–cloud interactions. The regulation of aerosol emissions is known to be more effective than the effort to reduce greenhouse gas emissions. This, together with the short lifetime of aerosols in the atmosphere, has resulted in a reduction in the value of the global-mean aerosol effective radiative forcing in recent years (Quaas et al., 2022). If the conclusions of this paper hold under higher levels of complexity (e.g. large-scale circulation, convective self-aggregation, etc.) this might mean that the reduction in global aerosol emissions could lead to a reduction in ECS, which could compensate, at least partially, for the reduction in the negative forcing induced by aerosols (Quaas et al., 2022; Bellouin et al., 2019), thus providing yet additional motivation for reducing aerosol emissions globally.
SAM is publicly available at http://rossby.msrc.sunysb.edu/~marat/SAM/ (Khairoutdinov, 2022).
The data presented in this study are publicly available at https://doi.org/10.5281/zenodo.7306706 (Dagan, 2022).
The author has declared that there are no competing interests.
Publisher’s note: Copernicus Publications remains neutral with regard to jurisdictional claims in published maps and institutional affiliations.
This research has been supported by the Israel Science Foundation (grant no. 1419/21).
This paper was edited by Anne Perring and reviewed by two anonymous referees.
Abbott, T. H. and Cronin, T. W.: Aerosol invigoration of atmospheric convection through increases in humidity, Science, 371, 83–85, 2021.
Albrecht, B. A.: Aerosols, cloud microphysics, and fractional cloudiness, Science, 245, 1227, https://doi.org/10.1126/science.245.4923.1227, 1989.
Bellouin, N., Quaas, J., Gryspeerdt, E., Kinne, S., Stier, P., Watson-Parris, D., Boucher, O., Carslaw, K., Christensen, M., and Daniau, A.-L.: Bounding aerosol radiative forcing of climate change, Rev. Geophys., 58, e2019RG000660, https://doi.org/10.1029/2019RG000660, 2019.
Ceppi, P., Brient, F., Zelinka, M. D., and Hartmann, D. L.: Cloud feedback mechanisms and their representation in global climate models, WIREs Climate Change, 8, e465, https://doi.org/10.1002/wcc.465, 2017.
Collins, W. D., Rasch, P. J., Boville, B. A., Hack, J. J., McCaa, J. R., Williamson, D. L., Briegleb, B. P., Bitz, C. M., Lin, S.-J., and Zhang, M.: The formulation and atmospheric simulation of the Community Atmosphere Model version 3 (CAM3), J. Climate, 19, 2144–2161, 2006.
Dagan, G.: Data for the paper: Equilibrium climate sensitivity increases with aerosol concentration due to changes in precipitation efficiency, Zenodo [data set], https://doi.org/10.5281/zenodo.7306706, 2022.
Dagan, G., Koren, I., and Altaratz, O.: Competition between core and periphery-based processes in warm convective clouds – from invigoration to suppression, Atmos. Chem. Phys., 15, 2749–2760, https://doi.org/10.5194/acp-15-2749-2015, 2015a.
Dagan, G., Koren, I., and Altaratz, O.: Aerosol effects on the timing of warm rain processes, Geophys. Res. Lett., 42, 4590–4598, https://doi.org/10.1002/2015GL063839, 2015b.
Dagan, G., Stier, P., and Watson-Parris, D.: Contrasting response of precipitation to aerosol perturbation in the tropics and extra-tropics explained by energy budget considerations, Geophys. Res. Lett., 46, 7828–7837, https://doi.org/10.1029/2019GL083479, 2019.
Dingley, B., Dagan, G., and Stier, P.: Forcing convection to aggregate using diabatic heating perturbations, J. Adv. Model. Earth Sy., 13, e2021MS002579, https://doi.org/10.1029/2021MS002579, 2021.
Freud, E. and Rosenfeld, D.: Linear relation between convective cloud drop number concentration and depth for rain initiation, J. Geophys. Res.-Atmos., 117, D02207, https://doi.org/10.1029/2011JD016457, 2012.
Gettelman, A. and Sherwood, S.: Processes Responsible for Cloud Feedback, Current Climate Change Reports, 2, 179–189, 2016.
Held, I. M. and Soden, B. J.: Robust responses of the hydrological cycle to global warming, J. Climate, 19, 5686–5699, 2006.
Igel, A. L. and van den Heever, S. C.: Invigoration or Enervation of Convective Clouds by Aerosols?, Geophys. Res. Lett., 48, e2021GL093804, https://doi.org/10.1029/2021GL093804, 2021.
Khain, A. P.: Notes on state-of-the-art investigations of aerosol effects on precipitation: a critical review, Environ. Res. Lett., 4, 015004, https://doi.org/10.1088/1748-9326/4/1/015004, 2009.
Khairoutdinov, M.: System for Atmospheric Modeling code, [code], http://rossby.msrc.sunysb.edu/~marat/SAM/, last access: 14 December 2022.
Khairoutdinov, M. F. and Randall, D. A.: Cloud resolving modeling of the ARM summer 1997 IOP: Model formulation, results, uncertainties, and sensitivities, J. Atmos. Sci., 60, 607–625, https://doi.org/10.1175/1520-0469(2003)060<0607:CRMOTA>2.0.CO;2, 2003.
Khairoutdinov, M. F. and Yang, C.-E.: Cloud-resolving modelling of aerosol indirect effects in idealised radiative-convective equilibrium with interactive and fixed sea surface temperature, Atmos. Chem. Phys., 13, 4133–4144, https://doi.org/10.5194/acp-13-4133-2013, 2013.
Koren, I., Kaufman, Y. J., Rosenfeld, D., Remer, L. A., and Rudich, Y.: Aerosol invigoration and restructuring of Atlantic convective clouds, Geophys. Res. Lett., 32, https://doi.org/10.1029/2005GL023187, 2005.
Koren, I., Altaratz, O., Remer, L. A., Feingold, G., Martins, J. V., and Heiblum, R. H.: Aerosol-induced intensification of rain from the tropics to the mid-latitudes, Nat. Geosci., 5, 118–122, https://doi.org/10.1038/ngeo1364, 2012.
Koren, I., Dagan, G., and Altaratz, O.: From aerosol-limited to invigoration of warm convective clouds, Science, 344, 1143–1146, 2014.
Li, R., Storelvmo, T., Fedorov, A. V., and Choi, Y.-S.: A positive IRIS feedback: Insights from climate simulations with temperature-sensitive cloud–rain conversion, J. Climate, 32, 5305–5324, 2019.
Li, R. L., Studholme, J. H., Fedorov, A. V., and Storelvmo, T.: Precipitation efficiency constraint on climate change, Nat. Clim. Change, 12, 642–648, 2022.
Lindzen, R. S., Chou, M.-D., and Hou, A. Y.: Does the earth have an adaptive infrared iris?, B. Am. Meteorol. Soc., 82, 417–432, 2001.
Loeb, N. G., Doelling, D. R., Wang, H., Su, W., Nguyen, C., Corbett, J. G., Liang, L., Mitrescu, C., Rose, F. G., and Kato, S.: Clouds and the earth's radiant energy system (CERES) energy balanced and filled (EBAF) top-of-atmosphere (TOA) edition-4.0 data product, J. Climate, 31, 895–918, 2018.
Lutsko, N. J. and Cronin, T. W.: Increase in precipitation efficiency with surface warming in radiative-convective equilibrium, J. Adv. Model. Earth Sy., 10, 2992–3010, 2018.
Lutsko, N., Sherwood, S. C., and Zhao, M.: Precipitation efficiency and climate sensitivity (invited chapter for the AGU geophysical monograph series “clouds and climate”), ESS Open Archive, https://doi.org/10.1002/essoar.10507822.1, 2021.
Mauritsen, T. and Stevens, B.: Missing iris effect as a possible cause of muted hydrological change and high climate sensitivity in models, Nat. Geosci., 8, 346–351, https://doi.org/10.1038/ngeo2414, 2015.
Morrison, H., Curry, J., and Khvorostyanov, V.: A new double-moment microphysics parameterization for application in cloud and climate models. Part I: Description, J. Atmos. Sci., 62, 1665–1677, 2005.
Muller, C. J. and Held, I. M.: Detailed investigation of the self-aggregation of convection in cloud-resolving simulations, J. Atmos. Sci., 69, 2551–2565, 2012.
Mülmenstädt, J. and Feingold, G.: The Radiative Forcing of Aerosol–Cloud Interactions in Liquid Clouds: Wrestling and Embracing Uncertainty, Current Climate Change Reports, 4, 23–40, 2018.
Nishant, N., Sherwood, S. C., and Geoffroy, O.: Aerosol-induced modification of organised convection and top-of-atmosphere radiation, npj Climate and Atmospheric Science, 2, 1–10, 2019.
Nuijens, L. and Siebesma, A. P.: Boundary Layer Clouds and Convection over Subtropical Oceans in our Current and in a Warmer Climate, Current Climate Change Reports, 5, 80–94, https://doi.org/10.1007/s40641-019-00126-x, 2019.
Quaas, J., Jia, H., Smith, C., Albright, A. L., Aas, W., Bellouin, N., Boucher, O., Doutriaux-Boucher, M., Forster, P. M., Grosvenor, D., Jenkins, S., Klimont, Z., Loeb, N. G., Ma, X., Naik, V., Paulot, F., Stier, P., Wild, M., Myhre, G., and Schulz, M.: Robust evidence for reversal of the trend in aerosol effective climate forcing, Atmos. Chem. Phys., 22, 12221–12239, https://doi.org/10.5194/acp-22-12221-2022, 2022.
Reutter, P., Su, H., Trentmann, J., Simmel, M., Rose, D., Gunthe, S. S., Wernli, H., Andreae, M. O., and Pöschl, U.: Aerosol- and updraft-limited regimes of cloud droplet formation: influence of particle number, size and hygroscopicity on the activation of cloud condensation nuclei (CCN), Atmos. Chem. Phys., 9, 7067–7080, https://doi.org/10.5194/acp-9-7067-2009, 2009.
Romps, D. M.: Climate sensitivity and the direct effect of carbon dioxide in a limited-area cloud-resolving model, J. Climate, 33, 3413–3429, 2020.
Rosenfeld, D.: Suppression of rain and snow by urban and industrial air pollution, Science, 287, 1793–1796, https://doi.org/10.1126/science.287.5459.1793, 2000.
Rosenfeld, D., Lohmann, U., Raga, G. B., O'Dowd, C. D., Kulmala, M., Fuzzi, S., Reissell, A., and Andreae, M. O.: Flood or drought: How do aerosols affect precipitation?, Science, 321, 1309–1313, https://doi.org/10.1126/science.1160606, 2008.
Schneider, T., Teixeira, J., Bretherton, C. S., Brient, F., Pressel, K. G., Schär, C., and Siebesma, A. P.: Climate goals and computing the future of clouds, Nat. Clim. Change, 7, 3–5, 2017.
Sherwood, S., Webb, M. J., Annan, J. D., Armour, K., Forster, P. M., Hargreaves, J. C., Hegerl, G., Klein, S. A., Marvel, K. D., and Rohling, E. J.: An assessment of Earth's climate sensitivity using multiple lines of evidence, Rev. Geophys., 58, e2019RG000678, https://doi.org/10.1029/2019RG000678, 2020.
Twomey, S.: The nuclei of natural cloud formation part II: The supersaturation in natural clouds and the variation of cloud droplet concentration, Geofisica pura e applicata, 43, 243–249, 1959.
Twomey, S.: Pollution and the planetary albedo, Atmos. Environ., 8, 1251–1256, 1974.
Twomey, S.: The influence of pollution on the shortwave albedo of clouds, J. Atmos. Sci., 34, 1149–1152, 1977.
Warner, J. and Twomey, S.: The production of cloud nuclei by cane fires and the effect on cloud droplet concentration, J. Atmos. Sci., 24, 704–706, 1967.
White, B., Gryspeerdt, E., Stier, P., Morrison, H., Thompson, G., and Kipling, Z.: Uncertainty from the choice of microphysics scheme in convection-permitting models significantly exceeds aerosol effects, Atmos. Chem. Phys., 17, 12145–12175, https://doi.org/10.5194/acp-17-12145-2017, 2017.
Wing, A. A., Reed, K. A., Satoh, M., Stevens, B., Bony, S., and Ohno, T.: Radiative–convective equilibrium model intercomparison project, Geosci. Model Dev., 11, 793–813, https://doi.org/10.5194/gmd-11-793-2018, 2018.
Yanase, T., Nishizawa, S., Miura, H., Takemi, T., and Tomita, H.: New critical length for the onset of self-aggregation of moist convection, Geophys. Res. Lett., 47, e2020GL088763, https://doi.org/10.1029/2020GL088763, 2020.