the Creative Commons Attribution 4.0 License.
the Creative Commons Attribution 4.0 License.
 | 01 Dec 2022
Atmospheric particle abundance and sea salt aerosol observations in the springtime Arctic: a focus on blowing snow and leads
Qianjie Chen
Jessica A. Mirrielees
Sham Thanekar
Nicole A. Loeb
Rachel M. Kirpes
Lucia M. Upchurch
Anna J. Barget
Nurun Nahar Lata
Angela R. W. Raso
Stephen M. McNamara
Swarup China
Patricia K. Quinn
Andrew P. Ault
Aaron Kennedy
Paul B. Shepson
Jose D. Fuentes
Sea salt aerosols play an important role in the radiation budget and atmospheric composition over the Arctic, where the climate is rapidly changing. Previous observational studies have shown that Arctic sea ice leads are an important source of sea salt aerosols, and modeling efforts have also proposed blowing snow sublimation as a source. In this study, size-resolved atmospheric particle number concentrations and chemical composition were measured at the Arctic coastal tundra site of Utqiaġvik, Alaska, during spring (3 April–7 May 2016). Blowing snow conditions were observed during 25 % of the 5-week study period and were overpredicted by a commonly used blowing snow parameterization based solely on wind speed and temperature. Throughout the study, open leads were present locally. During periods when blowing snow was observed, significant increases in the number concentrations of 0.01–0.06 µm particles (factor of 6, on average) and 0.06–0.3 µm particles (67 %, on average) and a significant decrease (82 %, on average) in 1–4 µm particles were observed compared to low wind speed periods. These size distribution changes were likely caused by the generation of ultrafine particles from leads and/or blowing snow, with scavenging of supermicron particles by blowing snow. At elevated wind speeds, both submicron and supermicron sodium and chloride mass concentrations were enhanced, consistent with wind-dependent local sea salt aerosol production. At moderate wind speeds below the threshold for blowing snow as well as during observed blowing snow, individual sea spray aerosol particles were measured. These individual salt particles were enriched in calcium relative to sodium in seawater due to the binding of this divalent cation with organic matter in the sea surface microlayer and subsequent enrichment during seawater bubble bursting. The chemical composition of the surface snowpack also showed contributions from sea spray aerosol deposition. Overall, these results show the contribution of sea spray aerosol production from leads on both aerosols and the surface snowpack. Therefore, if blowing snow sublimation contributed to the observed sea salt aerosol, the snow being sublimated would have been impacted by sea spray aerosol deposition rather than upward brine migration through the snowpack. Sea spray aerosol production from leads is expected to increase, with thinning and fracturing of sea ice in the rapidly warming Arctic.
- Article
(3031 KB) - Full-text XML
-
Supplement
(1258 KB) - BibTeX
- EndNote


The Arctic is warming twice as fast as the rest of the Earth (Cohen et al., 2014). Climate models have identified the important roles of tropospheric aerosols and ozone in the rapid warming of the Arctic (Shindell et al., 2006; Shindell, 2007; Shindell and Faluvegi, 2009; Najafi et al., 2015; Breider et al., 2017). Emissions of sea salt aerosols (SSA) from leads (fractures in the sea ice) over the Arctic have been observed over many decades across all seasons (Radke et al., 1976; Nilsson et al., 2001; Leck et al., 2002; May et al., 2016; Kirpes et al., 2019). SSA directly scatter solar radiation (Murphy et al., 1998), serve as cloud condensation nuclei (Collins et al., 2013; Quinn et al., 2017; Fossum et al., 2020), and serve as a source of reactive halogens (e.g., Fan and Jacob, 1992; Peterson et al., 2017; McNamara et al., 2019). Recent modeling studies hypothesize that blowing snow could also inject large amounts of SSA into the polar atmospheric boundary layer (Yang et al., 2008, 2019; Huang and Jaeglé, 2017; Huang et al., 2018). While recent Antarctic ground-based observations have implicated blowing snow as a source of SSA (Giordano et al., 2018; Hara et al., 2018; Frey et al., 2020), in situ observations are lacking in the Arctic. At the Hudson Bay, Canada, in March 2008, an eddy covariance particle flux experiment over sea ice reported emissions of 0.3–2 µm particles (aerodynamic diameter) during elevated wind speeds of ∼ 10 m s−1 (Whitehead et al., 2012). These particle emissions were attributed to particle resuspension from the sea ice surface, but no chemical measurements were conducted for confirmation (Whitehead et al., 2012). An improved understanding of the contribution of sea ice leads and blowing snow to the SSA burden in the Arctic will improve prediction of the radiation budget in the changing Arctic climate (Struthers et al., 2011; Browse et al., 2014). It will also provide an assessment of the use of ice core sea salt as a proxy for historical sea ice extent (Levine et al., 2014; Rhodes et al., 2017).
Leads are an important source of Arctic SSA (Scott and Levin, 1972; Radke et al., 1976; Leck and Bigg, 1999; Nilsson et al., 2001; Leck et al., 2002; Leck and Svensson, 2015; May et al., 2016; Kirpes et al., 2019). Aerosol particles produced from seawater bubble bursting often contain both inorganic salts and organic species and are therefore referred to as sea spray aerosols (Quinn et al., 2015). Sea spray aerosol emissions from the open ocean and leads depend strongly on the wind speed magnitude (Nilsson et al., 2001; Monahan and O'Muircheartaigh, 1980). The emissions are also affected by seawater temperature, salinity, ocean depth, surface fetch, surface-active substances, and atmospheric stability (Lewis and Schwartz, 2004; Grythe et al., 2014). In particular, through experiments using Arctic Ocean water at temperatures from 2 to 5 ∘C, Zábori et al. (2012) found that the number concentration of sea spray aerosols > 0.01 µm increased by 22 %–33 % per 1 ∘C of water temperature decrease. Nilsson et al. (2001) reported eddy covariance flux measurements over the Arctic Ocean during summer and found that the sea spray aerosol emission flux over the open leads increased by a factor of 5 when the 10 m wind speed increased from 2 to 9 m s−1. The sea spray aerosol number flux over the open leads was observed to peak at 1–3 µm (optical diameter) and extended into the submicron range (Nilsson et al., 2001). At low wind speeds, lead-based bubble bursting source mechanisms may be important but are not well understood (Willis et al., 2018). In addition to wind-driven formation, bubbles are suggested to form from gas release during melting of nearby ice (Nilsson et al., 2001), respiration of algae and phytoplankton (Johnson and Wangersky, 1987), and bubble formation below the sea surface driven by sea–air heat exchange (Norris et al., 2011). Recently, May et al. (2016) analyzed 3 years of particulate inorganic ion concentrations at Utqiaġvik (Barrow), Alaska. They found year-round enhancements in supermicron sea salt mass concentrations but negligible changes in submicron sea salt mass concentrations in the presence of nearby leads when the 10 m wind speed exceeded 4 m s−1 (May et al., 2016). Through single-particle analysis of aerosol samples collected at 1.5 m above the snowpack near Utqiaġvik when the 10 m wind speeds were greater than 4 m s−1, Kirpes et al. (2019) observed sea spray aerosols produced locally from open sea ice leads as the dominant aerosol source in the coastal Alaskan Arctic during winter. However, the contributions of leads to the Arctic SSA budget are not well-constrained, in part due to the lack of resolution of leads in most numerical models (Wang et al., 2016) and the spatially heterogeneous nature of Arctic sea ice leads (Wernecke and Kaleschke, 2015).
Sublimation of blowing snow could potentially serve as a source of SSA in the polar regions (Yang et al., 2008; Huang and Jaeglé, 2017; Giordano et al., 2018; Frey et al., 2020). In the modeling parameterization proposed by Yang et al. (2008), aerosol particles produced from blowing snow sublimation are assumed to contain only salts and not organics and are therefore referred to as sea salt aerosol. During windy conditions, falling or previously fallen snowflakes can bounce and then shatter into smaller snow crystals (Mellor, 1965; Sato et al., 2008; Comola et al., 2017). The physical and chemical properties of the snowpack change in time through metamorphism, compaction, and interactions with the atmosphere (Bartels-Rausch et al., 2014; Wolff et al., 2022; Domine, 2022). During blowing snow periods, snow grains can be lifted up into the saltation layer (typically <100 mm above the surface; Gromke et al., 2014) through aerodynamic entrainment by turbulent flow (Doorschot and Lehning, 2002) or splash entrainment by collisions of particles (Comola and Lehning, 2017). Then the snow crystals follow parabolic trajectories in the saltation layer, impact the surface, and produce smaller snow crystals (Doorschot and Lehning, 2002; Comola et al., 2017). The snow crystals in the saltation layer can be transported higher up into the atmosphere by turbulent eddies (Xiao et al., 2000; Gordon and Taylor, 2009). The blowing snow particle size distribution (f(dBLSN)), both within and above the saltation layer, has been observed to follow a two-parameter gamma probability density function (Eq. 1), with an average diameter ranging from 73 to 262 µm (Antarctica: Frey et al., 2020; Budd, 1966; Nishimura and Nemoto, 2005; Churchill, Canada: Gordon and Taylor, 2009; French Alps: Nishimura et al., 2014; Wyoming, US: Schmidt, 1981, 1982). The f(dBLSN) is defined as
where dBLSN is the blowing snow particle diameter, α is the shape parameter (from 2 to 12) that describes the skewness of the distribution, β is the scale parameter (from 20 to 100 µm), and Γ is the gamma function (Frey et al., 2020). The average blowing snow particle diameter is αβ.
In numerical models, blowing snow is generally initiated when the wind speed is higher than an air-temperature-dependent threshold (≈ 7 m s−1 at −27 ∘C), estimated based on observations of drifting and blowing snow over the Canadian Prairies (Li and Pomeroy, 1997). The blowing snow particles are predicted to sublimate to produce water vapor (Déry et al., 1998) and SSA in the atmosphere (Yang et al., 2008), with the sublimation flux as a function of relative humidity, heat conductivity, and vapor diffusion (Déry and Yau, 2001). The mass production rate of SSA, assumed to consist solely of salts and no organics, from blowing snow sublimation is predicted to depend on the snow particle sublimation rate and snow salinity (Yang et al., 2008). The size distribution of SSA generated from blowing snow sublimation is estimated from the blowing snow particle size, snow salinity (ς), number of SSA produced per blowing snow particle (Np), and percentage of water loss from the blowing snow particles (Yang et al., 2008, 2019). Assuming complete loss of water from the blowing snow particles, the diameter of dry SSA particles (ddry) from blowing snow sublimation is predicted to follow Eq. (2) (Yang et al., 2019):
where ρice=917 kg m−3 and ρNaCl=2160 kg m−3 are the density of ice and NaCl, respectively. Previous modeling studies assumed blowing snow particle size to follow a two-parameter gamma probability density function (Eq. 1) with an average diameter of 75–140 µm, snow salinity on the order of 0.01–10 practical salinity units (psu; g salt kg−1 kg seawater), 1–10 SSA particles produced per blowing snow particle, and complete loss of water from the blowing snow particles (Levine et al., 2014; Rhodes et al., 2017; Huang and Jaeglé, 2017; Huang et al., 2018; Yang et al., 2008, 2010, 2019). However, this does not consider the chemical complexity of snow composition (Macdonald et al., 2018; Mori et al., 2019; Grannas et al., 2007; Krnavek et al., 2012), including the presence of organics, dust, nitrate, sulfate, and soot, and requires many assumptions. In particular, by assuming only sea salt in blowing snow particles, the size and mass of particles produced from blowing snow sublimation could be underestimated. The wind-blown snow flux is also highly uncertain and difficult to quantify as it is a complex interaction of wind (speed, direction, gusts, lulls) and snow surface and subsurface conditions (snow grain size, bonding, hardness, layering) (Sturm and Stuefer, 2013). Thus, large uncertainties exist for modeling SSA production from blowing snow sublimation, primarily due to a lack of observations for model evaluation.
Both blowing snow and leads are proposed to be important sources of SSA in the Arctic, yet observational data are limited to inform modeling studies. In this study at a coastal Arctic site during spring, leads were omnipresent, and blowing snow was episodic. Blowing snow was identified by the local airport and ceilometer measurements and compared to that predicted by the blowing snow parameterization used in previous atmospheric chemistry modeling studies (e.g., Yang et al., 2008, 2019; Huang and Jaeglé, 2017; Huang et al., 2018). Size-resolved aerosol number concentrations from 0.01 to 10 µm were measured, and uniquely, both bulk (submicron and supermicron) and single-particle composition were measured. In this work, we refer to “sea salt aerosol” when referring to ion chromatography results that only measured inorganic salts, and we refer to “sea spray aerosol” when referring to microscopy results that showed individual particles with composition consistent with those formed from seawater bubble bursting (Ault et al., 2013). We compare ambient particle abundance and chemical composition observed for different wind speed conditions and discuss the influences of episodic blowing snow and omnipresent leads.
2.1 Site description and meteorological conditions
This study covers the period between 3 April and 7 May 2016 during the Photochemical Halogen and Ozone Experiment: Mass Exchange in the Lower Troposphere (PHOXMELT), which was conducted at a coastal tundra site near Utqiaġvik, Alaska (71.275∘ N, 156.641∘ W), about 5 km from the Arctic Ocean. The sampling site was snow-covered throughout the whole study period. Figure 1 shows an example satellite image of the North Slope of Alaska (including the location of Utqiaġvik) as well as the bordering Chukchi and Beaufort seas on 6 April 2016. This period was characterized as a clean period not affected by local anthropogenic pollution based on concurrent nitrogen oxides (NOx) and wind direction measurements (McNamara et al., 2019). The wind direction was generally between 0 and 100∘, indicating air masses coming from the Beaufort Sea (Fig. 1).

Figure 1Image of the North Slope of Alaska and Beaufort and Chukchi seas on 6 April 2016 from the Terra satellite Moderate Resolution Imaging Spectroradiometer (MODIS). The dark regions and cracks correspond to leads surrounded by sea ice. The inset plot depicts the percentage distribution of observed wind speeds and directions, measured at a 9.7 m height at the Utqiaġvik tundra site from 3 April to 7 May 2016. This figure is modified from NASA Worldview (https://worldview.earthdata.nasa.gov/, last access: 24 November 2022).
Two three-dimensional sonic anemometers (model CSAT3, Campbell Scientific Inc., Logan, UT) were installed at 1.3 and 9.7 m above the ground, respectively, to measure the air temperature (T) and wind speed components (u is zonal wind speed, v is meridional wind speed, and w is vertical wind speed) at 10 Hz. The 30 min average friction velocity () was calculated from the turbulence data, where u′, v′, and w′ are deviations from the mean wind speed. Relative humidity with respect to liquid water (RHaq) was obtained from the RH sensors at 1.5 and 10.4 m above the ground, respectively. We converted RHaq to relative humidity with respect to ice (RHice) via Eq. (3), following the Clausius–Clapeyron equation (Seinfeld and Pandis, 2016):
where Lv (= 2.50 × 10⁶ J kg−1 at 0 ∘C) and Ls (= 2.85 × 10⁶ J kg−1) are the latent heats of vaporization and sublimation, respectively, Rv (= 461.5 J kg−1 K−1) is the gas constant for water vapor, and T0=273.15 K. The threshold wind speed (Ut; m s−1) for blowing snow to occur was calculated in Eq. (4), as defined by Li and Pomeroy (1997):
where T (∘C) is the air temperature measured at 1.3 m, to be consistent with Li and Pomeroy (1997), who used air temperature at 2 m. The standard error of Ut reported by Li and Pomeroy (1997) was 1.97 m s−1.
We define blowing snow (BLSN) wind periods as when the wind speed recorded at 9.7 m above the surface (U9.7 m) exceeded Ut (i.e., U9.7 m≥Ut) (Table 1), to be consistent with Li and Pomeroy (1997), who used 10 m wind speed (U10m)≥Ut. The non-blowing snow (NBLSN) wind periods include two sub-categories: moderate wind periods, 4 m s, and low wind periods, U9.7 m<4 m s−1 (Table 1). The wind speed of 4 m s−1 is generally considered to be the onset wind speed for sea spray aerosol production over the open ocean (Monahan and O'Muircheartaigh, 1986). As such, May et al. (2016) previously used 4 m s−1 as the threshold wind speed to separate moderate wind and low wind categories when analyzing SSA abundances at Utqiaġvik, Alaska.
Table 1Definitions of observed blowing snow (BLSN), falsely predicted BLSN, moderate wind speed, and low wind speed periods. The BLSN wind and non-blowing snow (NBLSN) wind periods are separated based on the comparison of measured 9.7 m wind speed (U9.7 m) with a calculated threshold blowing snow wind speed (Ut) (Li and Pomeroy, 1997). Time covered is the percentage of time classified in each period during the study.
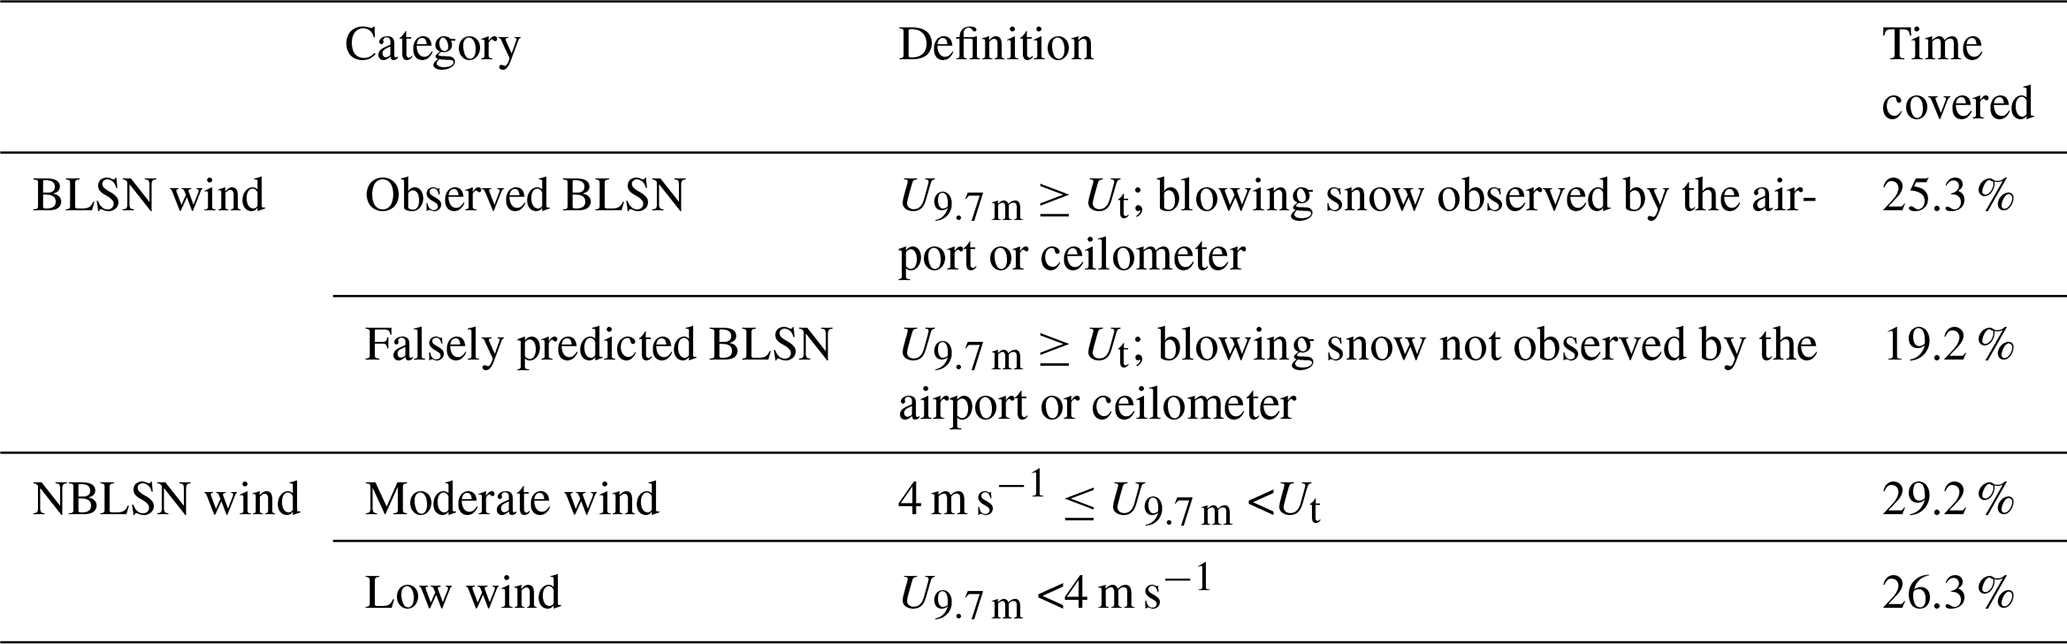
Blowing snow observations occurred at two nearby stations during the study period. Hourly blowing snow events were reported from the Wiley Post-Will Rogers Memorial Airport (71.285∘ N, 156.769∘ W) (automated monitoring station; https://www.wunderground.com/history/daily/us/ak/utqiagvik/PABR, last access: 24 November 2022) located at ∼ 5 km northwest of our field study site. These observations follow the criteria that snow is lofted by the wind to a height of > 1.8 m and horizontal visibility is < 11 km (Federal Meteorological Handbook, 2019). Note that the airport did not report blowing snow events when it was snowing simultaneously. Blowing snow events were also identified from ceilometer measurements at the Department of Energy Atmospheric Radiation Measurement (DOE ARM) Observatory (71.323∘ N, 156.608∘ W) located 5.8 km north of our sampling site across flat tundra. These events were identified by meeting both of the following criteria (Gossart et al., 2017; Loeb and Kennedy, 2021): (1) backscatter in the lowest usable bin (about 10–20 m above the ground) was larger than the clear-sky threshold and decreased with height; (2) U10m≥Ut and 2 m visibility <7.5 km. Note that the ceilometer observations only identified deep blowing snow events (> 10–20 m above the ground). Within the BLSN wind periods, we define “observed BLSN” periods as when blowing snow was observed by either the airport or the ceilometer; “falsely predicted BLSN” periods correspond to times when BLSN was not observed but was predicted based on U9.7 m≥Ut (Table 1). The meteorological conditions for our field site, the airport site, and the ARM site were statistically similar (generally within 0.3 m s−1 difference for wind speed, 1 ∘C for air temperature, and 1 % for relative humidity), as shown in Fig. S7.
2.2 Aerosol size distribution and chemical composition
Size-resolved particle number concentrations from 0.010 to 0.420 µm (electrical mobility diameter, dm, 13 size bins) were measured using a scanning mobility particle sizer spectrometer (SMPS; NanoScan SMPS Model 3910, TSI Inc., Shoreview, MN) from 4 April to 7 May (Fig. S1). The SMPS sampled air at the flow rate of 0.75 L min−1 through 3 m-long, 0.64 cm inner diameter copper tubing that was placed at 3 m above the ground. For the SMPS particle diameter range, the sampling line loss was estimated to range from 4 % for 0.420 µm particles to 25 % for 0.010 µm particles (Willeke and Baron, 1992). An optical particle sizer spectrometer (OPS; model 3330, TSI Inc., Shoreview, MN) measured the size range of 0.3–10 µm (optical diameter, do, 16 size bins) from 18 April to 7 May (Fig. S1). The OPS sampled air at the flow rate of 1.0 L min−1 through 3.5 m-long, 0.64 cm inner diameter copper tubing that was placed at 3 m above the ground. For the OPS particle diameter range, the sampling line loss was estimated to increase from 1 % for 0.3 µm particles, 25 % for 5.3 µm particles, to 63 % for 10 µm particles (Willeke and Baron, 1992). Particles with diameters larger than 5.3 µm were not used for this data analysis because of the lower concentration and limited statistics. Size-dependent sampling line losses were not corrected in the data presented, which focuses on relative changes at a given size during different time periods. Short increases in total SMPS particle concentrations greater than 500 particles per cubic centimeter lasting for less than 20 min were likely associated with local combustion emissions and were therefore removed from the data analysis. In particular, spikes in total SMPS particle concentrations (> 2000 particles per cubic centimeter) were observed frequently on 24 April due to nearby generator use; therefore, this day was also removed from the data analysis (Fig. S1). The average total SMPS particle concentration, with these spikes removed, during the focus period was 200 ± 80 particles per cubic centimeter. At the National Oceanic and Atmospheric Administration (NOAA) Barrow Observatory (71.323∘ N, 156.611∘ W), located adjacent to the DOE ARM Observatory, total particle (> 0.014 µm) number concentrations were measured by a condensation particle counter (CPC) at 11 m above the ground during our study period (https://gml.noaa.gov/obop/brw/, last access: 24 November 2022). The CPC total particle number concentrations were ∼ 10 % higher than that from SMPS, due to the wider size range, and showed a correlation coefficient of R2=0.88 (CPC total particle number concentrations vs. SMPS total particle number concentrations), showing agreement in temporal variability (Figs. S1 and S2).
For bulk inorganic ion analysis, submicron (aerodynamic diameter da<1.1 µm) and supermicron (da from 1.1 to 10 µm) particles were collected on Millipore Fluoropore filters (pore size of 1.0 µm) using a Berner-type multijet cascade impactor sampling at 30 L min−1 from 10 m above the ground at the NOAA Barrow Observatory (Quinn et al., 2002). Note that the cascade impactor size cut is 1.1 µm, and thus we define submicron particles as da<1.1 µm and supermicron particles as da=1.1–10 µm in this study. Daily submicron particle samples were collected, while supermicron particles were collected over 6–7 d each during the study period. To extract particles from the filters, the filters were wetted with 1 mL of spectral-grade methanol, followed by adding 5 mL of distilled deionized water to the solution and sonicating for 30 min. The extracted particles were analyzed for bulk inorganic ion (Cl−, Br−, NO, SO, Na+, NH, K+, Mg2+, Ca2+) concentrations using ion chromatography, following the method of Quinn et al. (2002). The limits of detection (LODs) were 0.0002 µg m−3 for submicron and supermicron Na+ and Cl− concentrations and 0.0001 µg m−3 for submicron and supermicron Br−, NO, SO, NH, K+, Mg2+, and Ca2+ concentrations. In total, 33 submicron samples (3 April–7 May 2016) and 4 supermicron samples (7 April–4 May 2016) were collected and analyzed for this study.
For two observed BLSN periods (6 April 07:00–19:00 Alaska Daylight Time (AKDT) and 6 April 19:00–7 April 07:00) and two moderate wind periods (15 April 19:00–16 April 07:00 and 16 April 08:00–20:00), particles were collected using a microanalysis particle sampler (MPS, California Measurements) sampling at 2 L min−1 (including 1 L min−1 of HEPA-filtered dilution flow) with 0.48 cm inner diameter copper tubing at 3 m above the ground. The MPS was loaded with transmission electron microscopy (TEM) grids (copper Type-B Formvar grids, Ted Pella Inc) to collect particles on stage 3 (da 0.07–0.40 µm) and with aluminum foil on stage 2 (da 0.40–2.8 µm). However, insufficient particle loading on stage 2 inhibited computer-controlled scanning electron microscopy with energy-dispersive X-ray spectroscopy (CCSEM-EDX) analysis of the 6 April 19:00–7 April 07:00 sample. In total, 6985 individual particles (2854 particles on stage 3 and 4131 particles on stage 2) were analyzed by CCSEM-EDX using a FEI Quanta environmental SEM with a field emission gun operating at 20 keV and a high-angle annular dark field transmission detector. The X-ray spectra detected by an EDX spectrometer (EDAX, Inc) provided the relative abundance of elements C, N, O, Na, Mg, Al, Si, P, S, Cl, K, Ca, Ti, Fe, Ni, and Zn present in the individual particles. Note that C and O cannot be quantified in particles on the TEM grids (stage 3), and Al cannot be quantified in particles on the aluminum foil (stage 2). Converting EDX peaks to atomic percentage (i.e., mole %) is a standard procedure done with EDX software with methods that have been used for decades (Goldstein et al., 2012; Fletcher et al., 2011; Laskin et al., 2002; Laskin and Cowin, 2001; Ault et al., 2012; Ault and Axson, 2017). This software accounts for sensitivity when converting from peak area to percentage while also considering other factors such as the bremsstrahlung background.
The K-means clustering of the individual stage-3 particle EDX spectra (Ault et al., 2012) resulted in 50 clusters, which were grouped into seven particle types, including fresh sea spray aerosol, partially aged sea spray aerosol, fly ash, organic + sulfate aerosols, mineral dust, soot, and potassium + sulfur, based on elemental composition, morphology, and comparison of cluster EDX spectra with particle classes in previous EDX studies (Kirpes et al., 2018; Bondy et al., 2018). The K-means clustering of the individual stage-2 particle EDX spectra resulted in 10 clusters, which were grouped into three particle types: fresh sea spray aerosol, potassium chloride, and mineral dust. Elements with a higher atomic number (Z) than Al (e.g., Na, Cl) appear brighter on the Al tape (stage 2), while the dominant elements in organic particles (C, O) have a lower Z than Al and appear darker. The CCSEM analysis can only focus on either brighter particles than the Al background or darker particles, and given the focus of this study, we analyzed by focusing on the brighter (sea salt aerosol) particles with CCSEM. As a result, the particle percentages reported for stage 2 represent upper limits. The projected area diameter (dpa) obtained from CCSEM-EDX spectra is often larger than the aerodynamic diameter due to particle deformation and spreading upon impaction and also depends on particle viscosity (Hinds, 2012; Sobanska et al., 2014; Olson et al., 2019). We acknowledge that only four representative time periods were selected for single-particle CCSEM-EDX analysis due to the labor-intensive nature of this analysis, and therefore the single-particle analysis was performed in combination with bulk particle ion composition analysis in this study.
2.3 Tundra surface snowpack
Twenty-one surface snow (top 2 cm) samples were collected at the tundra field study site on a daily basis between 5 April and 7 May 2016 using a polypropylene scoop while wearing disposable polyethylene gloves. Snow samples were stored in a −40 ∘C freezer in both Utqiaġvik and at the University of Michigan and were transported frozen. Snow samples were melted immediately prior to ion chromatography measurements of cations (Dionex ICS-1100; Na+, K+, Mg2+, and Ca2+) and anions (Dionex ICS-2100; Cl−, SO, Br−, and NO). Deterioration of snow samples for ion concentration measurements over the freezer storage period is expected to be negligible (Li, 1993). The 3σ LODs for the measured ions are Cl− (0.03 µM), SO (0.06 µM), Br− (0.01 µM), NO (0.005 µM), Na+ (0.07 µM), K+ (0.08 µM), Mg2+ (0.03 µM), and Ca2+ (0.13 µM).
3.1 Meteorological conditions and blowing snow occurrence
Modeling studies calculate a BLSN wind speed threshold to simulate the occurrence of blowing snow events (Yang et al., 2008, 2019; Huang and Jaeglé, 2017; Huang et al., 2018). However, few observational studies have evaluated the accuracy of this method (Gossart et al., 2017; Frey et al., 2020). Therefore, in this study, we compare the observation of BLSN, using two methods, with this calculation, for the period of 3 April to 7 May 2016 at the coastal field study site near Utqiaġvik, Alaska. As described in Sect. 2, BLSN wind periods were calculated to occur when the measured 9.7 m wind speed (U9.7 m) exceeded the air-temperature-dependent threshold value (Ut≈7 m s−1 at a 1.3 m air temperature (T1.3 m) of −27 ∘C) (Li and Pomeroy, 1997).
Just over half (57 %) of the calculated BLSN wind periods were observed at the airport or by the nearby ceilometer to experience blowing snow, suggesting that the occurrence of blowing snow is not always a function of only wind speed and air temperature and may depend on other factors such as snow size, shape, and density and wind gusts, as previously observed in Antarctica (Gossart et al., 2017) and the Canadian Prairies (Li and Pomeroy, 1997). Among all calculated BLSN wind periods, 47 % of these times were identified as observed blowing snow events by the airport, and 26 % were identified by ceilometer measurements. It should be noted that the airport automated station did not report blowing snow events when it was snowing simultaneously, but this covered only 5 % of the time during calculated BLSN wind periods. In addition, the ceilometer only identified deep blowing snow events (> 10–20 m above the ground), such that these observations could miss shallow blowing snow events. Importantly, blowing snow events were rarely observed by the airport (1 % of the study period) and ceilometer (2 % of the study period) during calculated NBLSN wind periods (when U9.7 m<Ut). Based on these results, using wind speed and temperature as the only criteria for the onset of blowing snow overestimates the occurrence of blowing snow at our coastal Arctic site and suggests likely overestimates in Arctic atmospheric chemistry modeling studies using this parameterization.
Falling and surface snow properties (e.g., size, shape, and density), snow age (metamorphism and dry deposition impacts), and snow surface roughness also affect blowing snow occurrence (Li and Pomeroy, 1997) and likely impacted the occurrence of blowing snow during this study, leading to the parameterization overestimation. Snowfall events were recorded by the airport during the study period (3 April–7 May 2016), as shown in Fig. 2b. The most recent snowfall event before the study period occurred on 26 March. After that, there was no snowfall at the site until 10 April. Note that 61 % of the observed BLSN periods were from 3 to 10 April, indicating an aged (> 8 d) tundra snowpack during the observed BLSN periods. For the rest of the observed BLSN periods (39 %), the tundra snowpack age was <2 d (Fig. 2b). In comparison, to consider the impacts of snow age on blowing snow sublimation, atmospheric chemistry models generally have applied a scaling factor when calculating a blowing snow sublimation flux and assumed a snow age of 1.5–5 d (e.g., Yang et al., 2008; Levine et al., 2014; Huang and Jaeglé, 2017), representing an uncertainty in these models.
The time period of focus herein is divided into four categories (Table 1), including (1) observed BLSN (U9.7 m≥Ut, blowing snow observed by the airport or ceilometer), (2) falsely predicted BLSN (U9.7 m≥Ut, blowing snow not observed by the airport or ceilometer), (3) moderate wind (4 m s), and (4) low wind (U9.7 m<4 m s−1) periods. Sea spray aerosol emissions occur at moderate wind speeds and above, coinciding with BLSN wind speeds. Nilsson et al. (2001) previously observed that the sea spray aerosol emission flux in the summertime Arctic increased by a factor of 157 when the 10 m wind speed increased from 3 to 14 m s−1. During the study herein, the observed BLSN, falsely predicted BLSN, moderate wind, and low wind periods covered 25.3 %, 19.2 %, 29.2 %, and 26.3 %, respectively, of the time (Fig. 2).
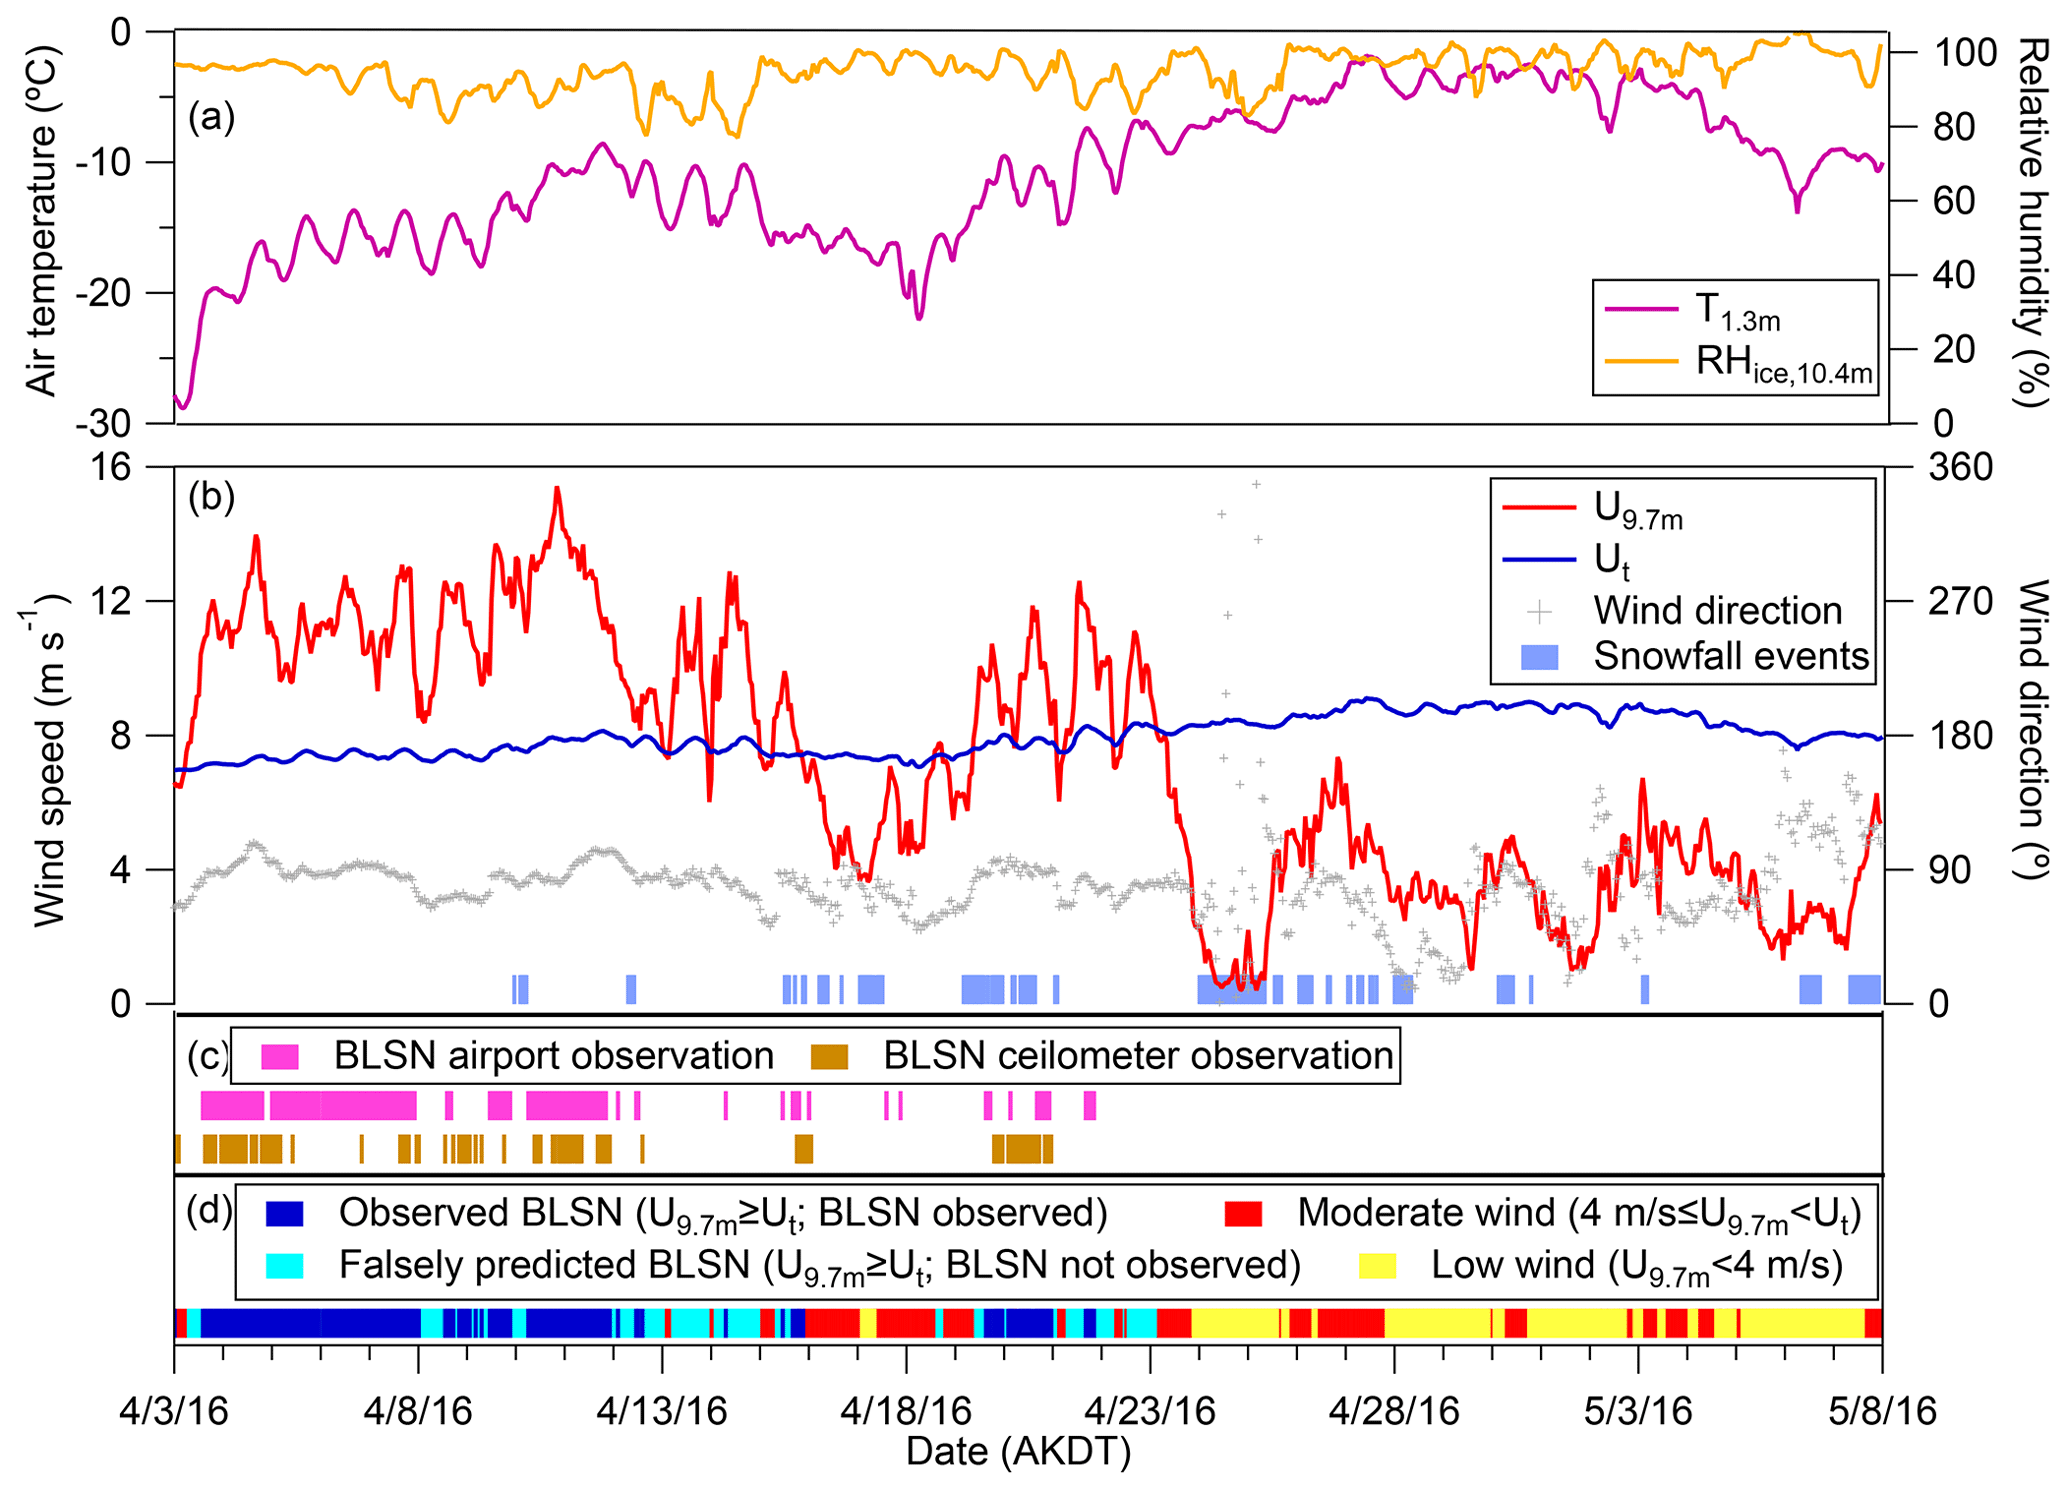
Figure 2Time series of (a) air temperature at 1.3 m (T1.3 m), relative humidity with respect to ice at 10.4 m (RHice,10.4 m), (b) wind speed (U9.7 m) and wind direction at 9.7 m, calculated blowing snow threshold wind speed (Ut), and snowfall events recorded by the Utqiaġvik, Alaska, airport, (c) observations of BLSN at the airport and from the DOE ARM Observatory ceilometer measurements, and (d) observed BLSN (U9.7 m≥Ut and BLSN observed by either the airport or ceilometer), falsely predicted BLSN (U9.7 m≥Ut and BLSN not observed by the airport or ceilometer), moderate wind speed (4 m s), and low wind speed (U9.7 m<4 m s−1) periods.
The meteorological conditions, including air temperature, wind speed, relative humidity, and friction velocity, for the observed BLSN, falsely predicted BLSN, moderate wind, and low wind periods, were compared (Table 2). During the observed BLSN periods, average U9.7 m was 11 ± 2 (1σ) m s−1, and average T1.3 m was −14 ± 3 (1σ) ∘C; this corresponds to a slightly higher wind speed (p<0.05) but slightly lower temperature (p<0.05) than for the falsely predicted BLSN periods (10 ± 1 m s−1, −13 ± 4 ∘C) (Table 2). In comparison, average U9.7 m and T1.3 m were 6 ± 1 m s−1 and −10 ± 6 ∘C, respectively, during moderate wind periods and 3 ± 1 m s−1 and −7 ± 3 ∘C during low wind periods. The friction velocity, u*, a measure of atmospheric shear stress, is an important variable in explaining the occurrence of blowing snow. The saltation process and subsequent lifting of snow particles are initiated by turbulent wind shear stress exerted on the snowpack rather than the magnitude of the wind (Mann et al., 2000). Based on snow drift density observations on Antarctic sea ice during winter, Frey et al. (2020) obtained an average threshold blowing snow friction velocity () of 0.37 (ranging from 0.08 to 0.58 m s−1). In this study, the average u* measured at 1.3 m () was 0.41 ± 0.06 (1σ) m s−1 during the observed BLSN periods (Table 2), consistent with Frey et al. (2020). The relative humidity with respect to ice at 10.4 m (RH ± 4 %) was below saturation during the observed BLSN periods, supporting sublimation of blowing snow upon lofting. The average was 17 % lower during the falsely predicted BLSN periods (0.34 ± 0.06 m s−1) compared to the observed BLSN periods. The average RHice,10.4 m was 90 ± 6 % during falsely predicted BLSN, similar to the observed BLSN periods. Therefore, while elevated u* was observed during calculated BLSN periods (Table 2), the occurrence of blowing snow was not guaranteed, perhaps due to the physical characteristics of the snowpack. However, it is also possible that blowing snow occasionally occurred during these “falsely” predicted BLSN periods but was not observed by the airport (i.e., overlapping with snowfall) or ceilometer (i.e., episodes of drifting snow <10 m deep).
Table 2Meteorological conditions during observed BLSN, falsely predicted BLSN, moderate wind speed, and low wind speed periods. T, U, and u* (average ± 1σ) are air temperature, wind speed, and friction velocity at 1.3 and 9.7 m above the ground, respectively. RHice is the relative humidity with respect to ice at 1.5 m and 10.4 m.

3.2 Particle size distributions
To investigate the impacts of blowing snow and leads on ambient aerosol particles of different sizes, we compare size-resolved particle number concentrations for the different wind speed categories described above. The average size distributions of ambient particle number concentrations measured by the SMPS and OPS near Utqiaġvik are shown in Fig. 3. The particle number concentration peaked at 0.12 µm dm, consistent with previous observations at Utqiaġvik and other Arctic sites during spring (peaking at 0.1–0.2 µm dm; Freud et al., 2017; Croft et al., 2016). For each size bin from 0.01 to 0.06 µm dm (six size bins), the average particle number concentrations during observed BLSN periods were 2–13 times (6 times, on average) higher than low wind periods (all significant at 95 % confidence levels; p<0.05), 2–12 times (5 times, on average) higher than moderate wind periods (p<0.05), and 37 %–126 % higher than falsely predicted BLSN periods (p<0.05). In comparison, for each size bin from 0.06 to 0.3 µm dm (six size bins), the average particle number concentrations during observed BLSN periods ranged from 45 % to 109 % (67 %, on average) higher than low wind periods (p<0.05) and from 17 % to 80 % (31 %, on average) higher than moderate wind periods (p<0.05). Compared to falsely predicted BLSN periods, the average particle number concentrations during observed BLSN periods were between 6 % and 16 % (10 %, on average) higher within 0.06–0.1 µm dm (three size bins) (p<0.05) but were not significantly different from 0.1 to 0.3 µm dm (three size bins) (p> 0.05). Therefore, overall, the number concentrations of 0.01–0.3 µm particles were higher at elevated wind speeds (Table S5).
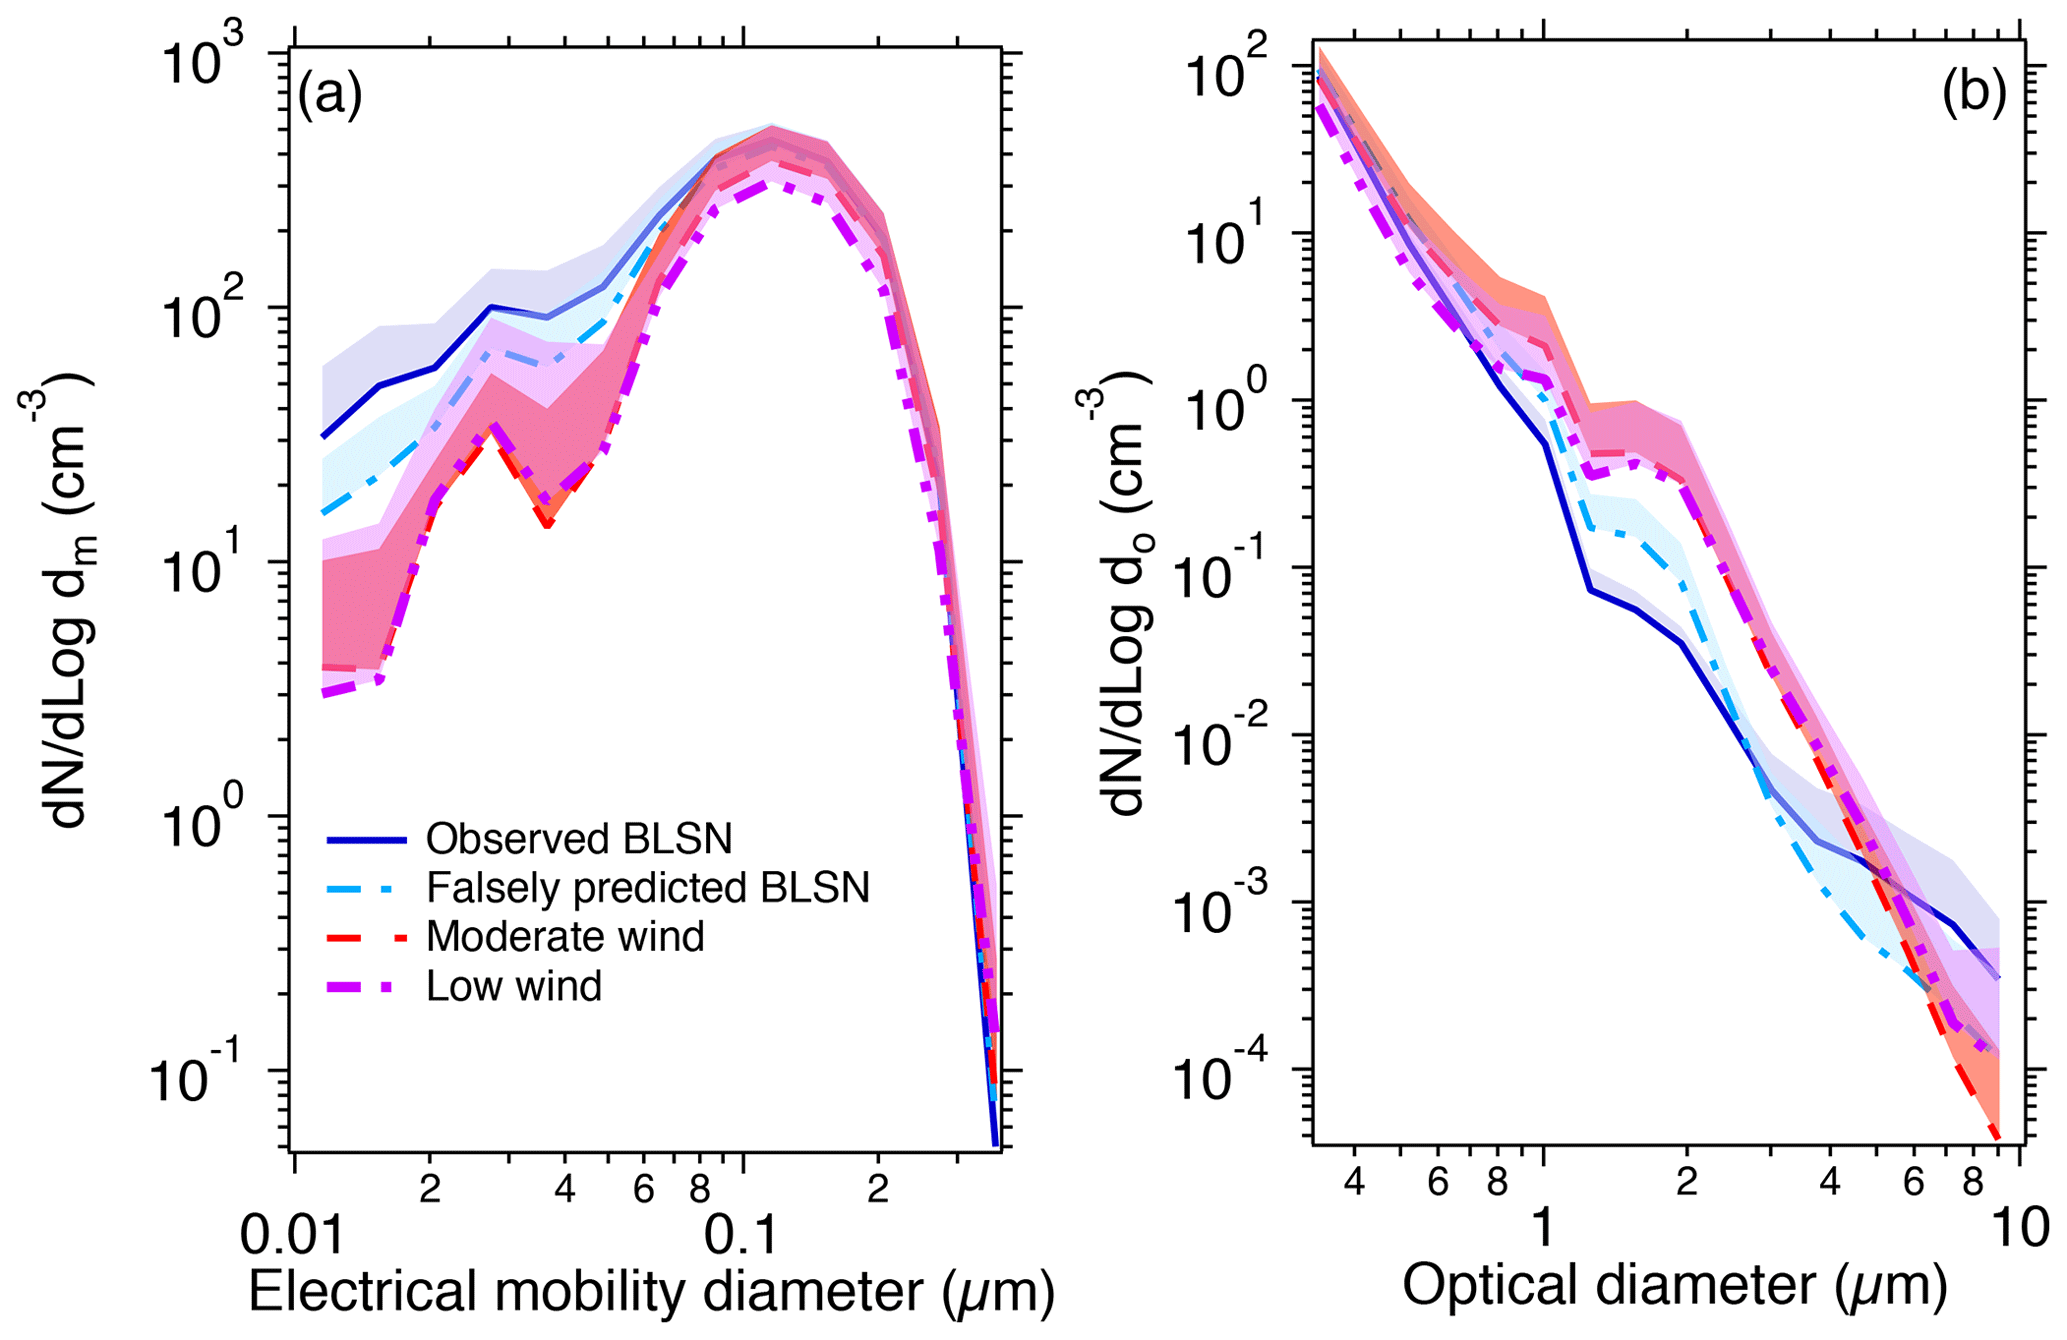
Figure 3Size distributions of particle number concentrations during observed BLSN, falsely predicted BLSN, moderate wind, and low wind periods from (a) SMPS measurements (0.01–0.42 µm electrical mobility diameter; 4 April–7 May) and (b) OPS measurements (0.3–10 µm optical diameter; 18 April–7 May). The shadings are the upper bounds of the standard deviation of dN/dlogdm (or dN dlogdo). Since the y axis is on a log scale, only the upper bound of the standard deviation is shown. Particles larger than ∼ 4 µm were at very low concentrations, and those larger than 5.3 µm experienced more than 25 % sampling line losses, such that particles > 4 µm thus are not used in the discussed data analysis because of the impact of reduced statistics.
Both leads and blowing snow could potentially contribute to the increase in particle number concentrations from 0.01 to 0.3 µm dm during observed BLSN periods. Yang et al. (2008, 2019) proposed that the size and number of SSA produced from blowing snow sublimation depend on the size and salinity of a blowing snow particle, as well as the percentage of water loss per blowing snow particle. If we approximate the salinity of the local tundra surface snowpack based on measured [Na+] and [Cl−] (∼ 0.010 g kg−1) and assume that only one SSA particle is produced from one blowing snow particle (following Yang et al., 2008), blowing snow particles would need to have diameters of ∼ 0.6–19 µm to produce SSA particles with diameters of 0.01–0.3 µm. Using the approximate salinity of the surface snowpack on thin first-year sea ice during springtime over the Beaufort Sea (∼ 3.5 g kg−1; Krnavek et al., 2012), the same calculation yields 0.09–3 µm blowing snow particles sublimating into 0.01–0.3 µm SSA particles. It is unknown whether blowing snow particles of less than 3 µm exist in the atmosphere, as turbulence efficiently removes small crystals in the saltation layer that would otherwise impact the surface to produce smaller fragments (Comola et al., 2017). Previous field studies showed blowing snow particles larger than ∼ 20 µm (lower diameter method detection limit) generally following two-parameter gamma probability density functions (Eq. 1) with average diameters ranging from 73 to 262 µm (Frey et al., 2020; Budd, 1966; Schmidt, 1981, 1982; Nishimura and Nemoto, 2005; Gordon and Taylor, 2009; Nishimura et al., 2014). Modeling studies adapted these empirical functions by using an average blowing snow particle diameter from 75 to 140 µm and extrapolating the blowing snow particle size to <20 µm, but the smallest blowing snow particle diameter considered is not stated (Yang et al., 2008, 2019; Huang and Jaeglé, 2017; Huang et al., 2018).
Some atmospheric chemistry modeling studies have assumed that multiple SSA particles are produced from the sublimation of one larger blowing snow particle (Huang and Jaeglé, 2017; Huang et al., 2018; Yang et al., 2019). For example, assuming five SSA particles are produced from one blowing snow particle (Huang and Jaeglé, 2017; Huang et al., 2018) with salinity of 0.01 g kg−1, blowing snow particles would have diameters of 1–32 µm to produce SSA particles with diameters of 0.01–0.3 µm. If blowing snow contributed to the elevated 0.01–0.3 µm particles observed in this study, this could provide an explanation if particles present on and within a larger (> 20 µm) blowing snow particle do not coagulate during sublimation. Previous atmospheric chemistry modeling studies have assumed that blowing snow particles contain only sea salt, which is not consistent with the fact that the Arctic snowpack contains a variety of chemical components, including organics, dust, nitrate, sulfate, and soot (e.g., Macdonald et al., 2018; Mori et al., 2019; Grannas et al., 2007; Krnavek et al., 2012). Previous measurements of the size distribution of particles present within Utqiaġvik snowmelt showed the dominance of <0.3 µm particles (Nazarenko et al., 2017), similar to the atmospheric particle size distribution. Consistent with this complexity, low-temperature microscopy studies have shown that many particles can reside within the snow grain, at the surface, and at grain boundaries (Domine et al., 2008; Bartels-Rausch et al., 2014; Magono et al., 1979).
During the study period, the prevailing northeasterly and easterly winds were from the direction of the Beaufort Sea, where open leads were omnipresent (Fig. 1). Sea spray aerosols as small as 0.01 µm have been observed to be generated from coastal breaking waves at wind speeds of ∼ 7 m s−1, with 60 %, by number, of the 0.01–8 µm sea spray aerosols smaller than 0.1 µm (Clarke et al., 2006). Nilsson et al. (2001) presented eddy-covariance flux measurements over the Arctic Ocean during summer and found that the emission flux of sea spray aerosols > 0.01 µm (FSSA) from open leads increased by 5 times when the wind speed (U10 m) increased from 2 to 9 m s−1. In this study, the field site was ∼ 7 km downwind of the nearest lead, and this corresponds to an ∼ 10 min travel time for sea spray aerosols during observed and falsely predicted BLSN periods. This is short compared to the typical lifetime of ultrafine aerosols (hours to ∼ 1 d) (Williams et al., 2002). Thus, the 0.01–0.3 µm sea spray aerosol emission flux from leads could be substantially enhanced under the high wind conditions during both the observed (U9.7 m= 11 ± 2 m s−1) and falsely predicted (10 ± 1 m s−1) BLSN periods compared to moderate (6 ± 1 m s−1) and low wind (3 ± 1 m s−1) periods, consistent with the observed increase in particle number concentrations (Fig. 3).
From the OPS measurements of larger particles, for each size bin ranging from 1 to 4 µm do (six size bins), the average particle number concentrations during observed BLSN periods were 67 %–89 % (average 82 %) lower than during moderate wind conditions (p<0.05) and 73 %–89 % (average 82 %) lower than during low wind periods (p<0.05). Compared to falsely predicted BLSN periods, the average particle number concentrations during observed BLSN periods were 57 %–63 % (average 59 %) lower (p<0.05) for 1–2 µm do (three size bins) but not significantly different (p> 0.05) for 2–4 µm do (three size bins). This suggests that supermicron particles may be removed by BLSN. Notably, Pomeroy et al. (1991) suggested that blowing snow can scavenge “micron-sized” SSA via electrophoretic attraction. The scavenging of ambient particles by blowing snow through collisions has not been considered in previous modeling studies (e.g., Huang and Jaeglé, 2017; Huang et al., 2018; Yang et al., 2010, 2019). The collision efficiency between blowing snow and other ambient particles depends on the sizes of these particles (typically on the order of 100 and <10 µm, respectively), with the impact of Brownian motion decreasing with ambient particle size and the contributions of interception and inertial impaction increasing with ambient particle size and mass, respectively (Croft et al., 2009; Seinfeld and Pandis, 2016). Assuming a blowing snow particle diameter on the order of 100 µm, which is the average blowing snow particle diameter observed by Frey et al. (2020) over Antarctic sea ice during winter, the collision efficiency would be lowest with 0.1–1 µm particles and increase for particle diameters both below 0.1 µm (Brownian diffusion) and above 1 µm (interception and inertial impaction) (Croft et al., 2009; Seinfeld and Pandis, 2016). The decrease in the number concentrations of 1–4 µm do particles during observed BLSN periods could be explained by greater scavenging by blowing snow than particle production (from open leads and/or blowing snow) in this size range. The enhancement of 0.01–0.06 µm dm particles during observed BLSN periods (Fig. 3a), as discussed above, suggests more production (by open leads and/or blowing snow) than scavenging (by blowing snow) for these particles.
3.3 Chemical composition of atmospheric particles and tundra snowpack
The production of sea spray aerosols and the presence of blowing snow both increase with wind speed (Monahan and O'Muircheartaigh, 1980; Li and Pomeroy, 1997; Nilsson et al., 2001; Frey et al., 2020). Measurement of the chemical composition of atmospheric particles during different wind conditions aids in source attribution of SSA particles and has been employed in previous Antarctic (Frey et al., 2020; Giordano et al., 2017; Hara et al., 2018; Wagenbach et al., 1998) and Arctic (Hara et al., 2017; Kirpes et al., 2019) studies investigating possible BLSN particle production. Here, we compare bulk (average) submicron (da<1.1 µm) and supermicron (da 1.1–10 µm) atmospheric particle inorganic ion composition during low wind speed conditions (Sect. 3.3.1), moderate wind speed periods (Sect. 3.3.2), and observed and falsely predicted BLSN periods (Sect. 3.3.3). In addition, for selected samples collected during moderate wind and observed BLSN periods, the chemical composition of individual atmospheric particles (da 0.07–0.40 and 0.40–2.80 µm) were measured using CCSEM-EDX, following the previous studies by Kirpes et al. (2018, 2019). As discussed below, the submicron and supermicron particle inorganic ion and single-particle composition shows contribution of local SSA production (primarily da > 0.4 µm) during observed BLSN periods as well as during moderate wind speed periods. Therefore, in Sect. 3.3.4, we use ion and elemental ratios to investigate the likely SSA sources during observed BLSN periods through comparisons to the chemical composition of local tundra surface snowpack (measured in this work) as well as previous measurements of sea ice surface snowpack (Krnavek et al., 2012), blowing snow (Jacobi et al., 2012), frost flowers (Douglas et al., 2012), and seawater (Millero et al., 2008).
3.3.1 Low wind speed periods
During low wind speed conditions (U9.7 m<4 m s−1), blowing snow was neither predicted (Eq. 4) nor observed (Fig. 2), as discussed in Sect 3.1. Open leads are not expected to be an efficient source of sea spray aerosols at such low wind speeds (Nilsson et al., 2001; Held et al., 2011), though there could be minor contributions from non-wave-breaking lead-based bubble bursting sources (Nilsson et al., 2001; Willis et al., 2018). Thus, the atmospheric particle abundance in Utqiaġvik during low wind periods is expected to be most affected by long-range transport of aerosols contributing to springtime Arctic haze (Shaw, 1982; Frossard et al., 2011). During the low wind periods from 3 April to 7 May 2016, the elevated average submicron (da<1.1 µm) particle sulfate concentration (0.7 ± 0.5 µg m−3) (Fig. 4) and the corresponding average non-sea-salt sulfate mole fraction (, Quinn et al., 2002) of 95 ± 2 % are consistent with the springtime Arctic haze observed in Utqiaġvik in previous studies (Quinn et al., 2002, 2007). Unfortunately, available bulk supermicron particle samples primarily corresponded to elevated wind speed periods and did not provide an opportunity for focused low wind speed period investigation.

Figure 4Average (± 1σ) [Na+], [Cl−], and [SO] bulk mass concentrations for daily submicron (<1.1 µm da) particle samples during low wind, moderate wind, falsely predicted BLSN, and observed BLSN periods and for multi-day supermicron (1.1–10 µm da) particles collected on 7–13 April (65 % observed BLSN, 35 % falsely predicted BLSN), 14–20 April (9 % observed BLSN, 29 % falsely predicted BLSN, 58 % moderate wind, 4 % low wind), 21–27 April (3 % observed BLSN, 23 % falsely predicted BLSN, 47 % moderate wind, 27 % low wind), and 28 April–4 May (66 % moderate wind, 34 % low wind). The submicron particle mass concentrations (average ± 1σ) during the four supermicron particle collection periods are also shown for comparison. The corresponding values for these ions as well as [Ca2+], [Mg2+], [NH], [K+], [NO], [Br−], methanesulfonate [CH3SO], and oxalate (C2O) can be found in Tables S1 and S2.
During these low wind speed periods (U9.7 m<4 m s−1), the average submicron particle [Cl−] [Na+] was 0.4 ± 0.2 mol mol−1 (Fig. 5), much lower than that of seawater (1.2 mol mol−1; Millero et al., 2008), consistent with chloride-depleted and aged SSA. At the same location, May et al. (2016) found that submicron particles experienced at least 25 % chloride loss relative to seawater during ∼ 80 % of the year-round low wind speed periods between 2006 and 2009. In this study, the submicron particle [K+] [Na+] (average 0.15 ± 0.08) and [Ca2+] [Na+] (average 0.08 ± 0.03) molar ratios during low wind periods (Table S2) were significantly higher than that of seawater (0.02 for both [K+] [Na+] and [Ca2+] [Na+]; Millero et al., 2008) (Fig. 5), likely due primarily to contributions from long-range transport of biomass burning aerosols and dust (Quinn et al., 2002, 2007; Shaw, 1982; Frossard et al., 2011; Formenti et al., 2003; Ryu et al., 2004).
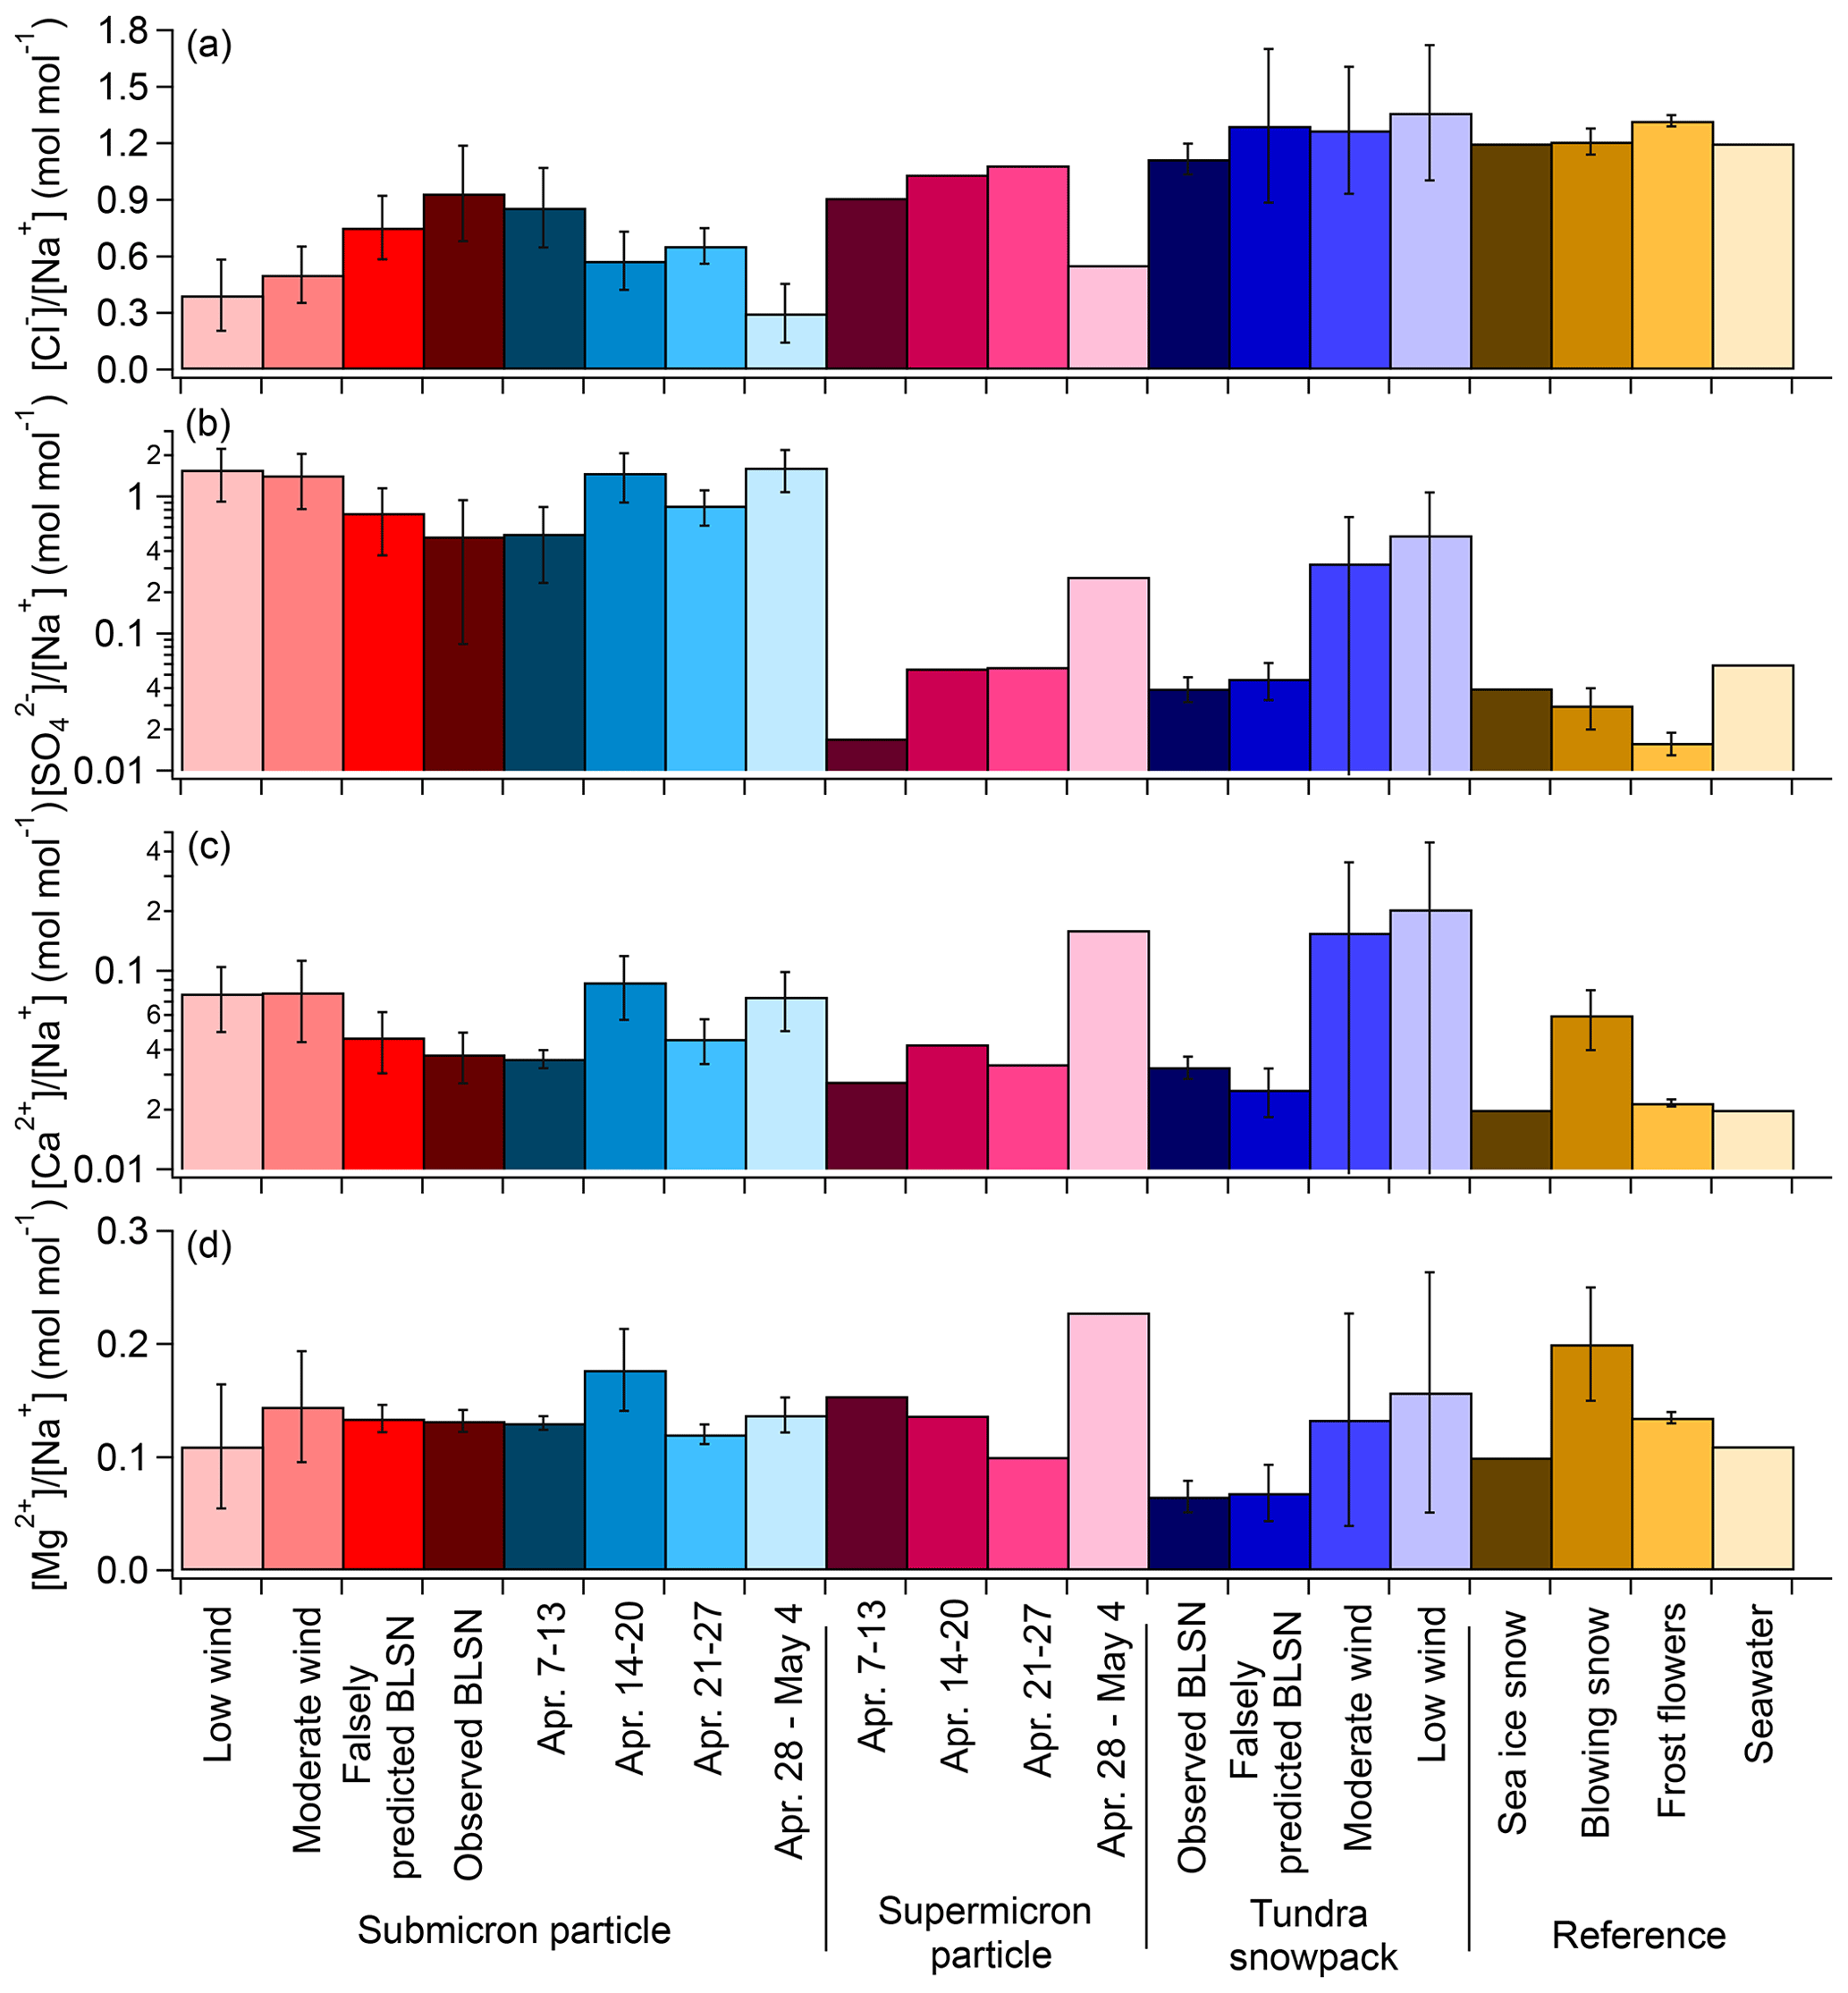
Figure 5Average (± 1σ) [Cl−] [Na+], [SO] [Na+], [Ca2+][Na+], and [Mg2+] [Na+] molar ratios for submicron particles and local tundra surface snowpack for the categories of low wind, moderate wind, falsely predicted BLSN, and observed BLSN periods and for multi-day supermicron particles collected on 7–13 April (65 % observed BLSN, 35 % falsely predicted BLSN), 14–20 April (9 % observed BLSN, 29 % falsely predicted BLSN, 58 % moderate wind, 4 % low wind), 21–27 April (3 % observed BLSN, 23 % falsely predicted BLSN, 47 % moderate wind, 27 % low wind), and 28 April–4 May (66 % moderate wind, 34 % low wind). The submicron particle ion ratios (average ± 1σ) during the four supermicron particle collection periods are shown for comparison. Comparison is also shown to previous measurements of sea ice surface snowpack (Krnavek et al., 2012), blowing snow (Jacobi et al., 2012), frost flowers (Douglas et al., 2012), and seawater (Millero et al., 2008). The corresponding values in this figure can be found in Table S3.
3.3.2 Moderate wind speed periods
To investigate particle sources and aging processes during moderate wind speed (4 m s) periods, individual particles, collected on 15 April 19:00 AKDT–16 April 07:00 (U9.7 m range 6–8 m s−1, average 7 m s−1) and 16 April 08:00–20:00 (U9.7 m range 4–5 m s−1, average 5 m s−1), were analyzed by CCSEM-EDX. For da 0.07–0.4 µm, seven individual particle types, including fresh sea spray aerosols, partially aged sea spray aerosols, organic + sulfate aerosols, mineral dust, soot, potassium + sulfur, and fly ash, were identified from the 573 particles analyzed (Figs. 6 and S4). For the da 0.4–2.8 µm stage, three particle types were identified – fresh sea spray aerosol, potassium chloride, and mineral dust – from the 1223 particles analyzed; the number fractions of these particle types varied little with diameter, so their average percentages (± 95 % confidence intervals) are reported. These individual particle data aid in the interpretation of the submicron (<1.1 µm da) and supermicron (1.1–10 µm da) inorganic ion mass concentration data (Fig. 4; Tables S1 and S2).
Organic + sulfate aerosol particles, consistent with Arctic haze (Kirpes et al., 2018), constituted 38 %–69 %, by number, across the 0.09–0.9 µm dpa range (da 0.07–0.4 µm impactor stage) (Fig. 6a). These organic + sulfate particles are distinct from sea spray aerosol that is internally mixed with Na and Mg as well as K and Ca (Bondy et al., 2017; Ault et al., 2013). Submicron particle organic carbon and sulfate have previously been observed during springtime at Utqiaġvik and attributed to long-range transport of particles and precursors from combustion activities in the Northern Hemisphere, followed by subsequent atmospheric processing, which contribute to Arctic haze (Quinn et al., 2002; Shaw et al., 2010; Frossard et al., 2011; Hiranuma et al., 2013). Previously, Hiranuma et al. (2013) observed ∼ 90 %, by number, of particles smaller than 0.75 µm (dpa) to be organic + sulfate particles during a flight campaign (up to 6 km) over Utqiaġvik in April 2008. This high organic + sulfate aerosol particle number fraction is consistent with high submicron particle non-sea-salt sulfate mass concentrations ([SO] = 0.7 µg m−3, 97 %) measured during 15–16 April. The majority of supermicron particle sulfate during 28 April–4 May (66 % moderate wind) was also non-sea-salt sulfate ( 76 %), further showing the Arctic haze influence.
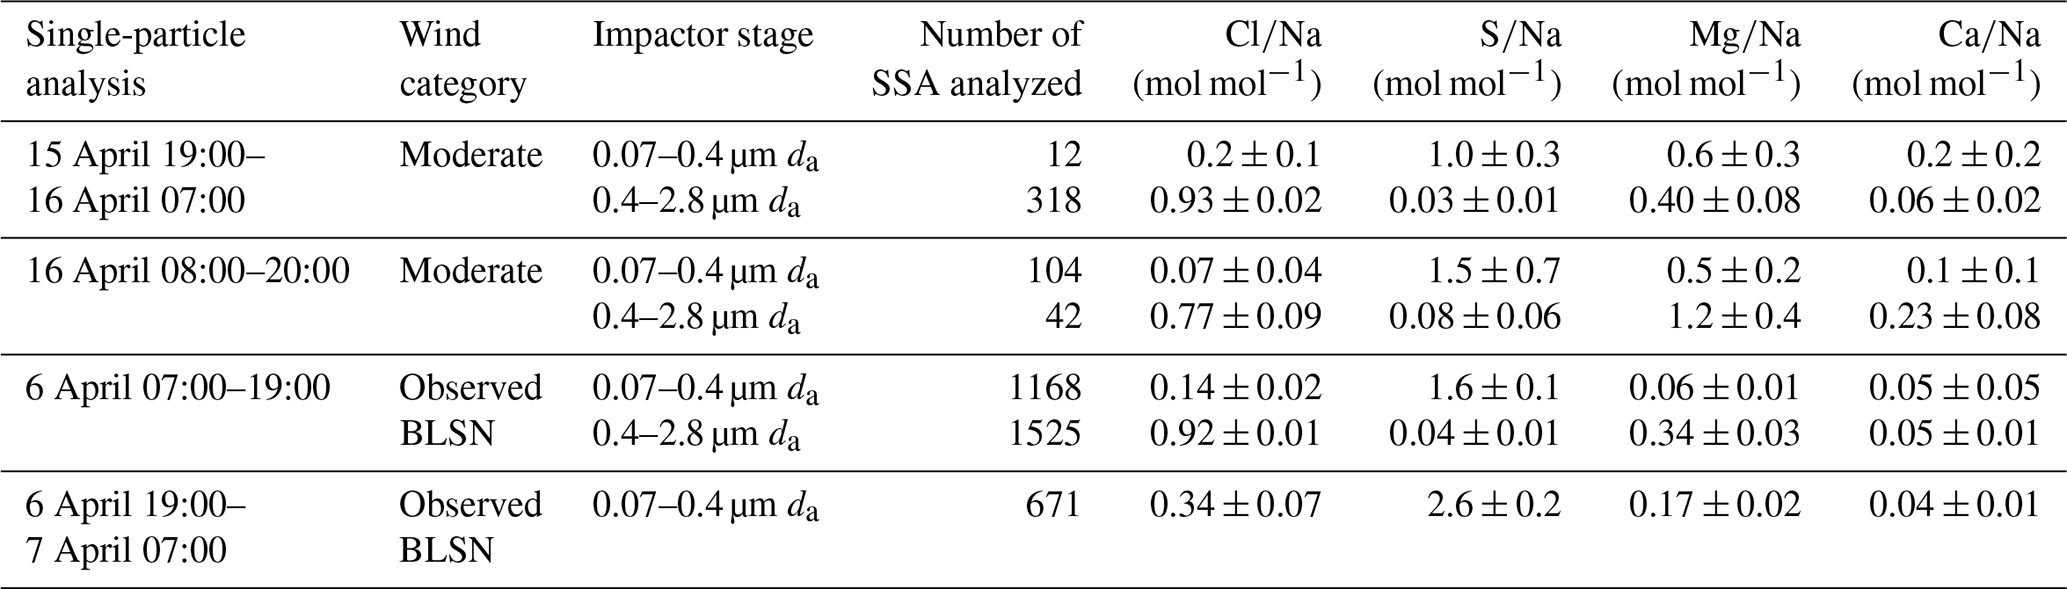
Sea spray aerosol particles comprised 8 %–23 %, by number, across the 0.09–0.9 µm dpa range (da 0.07–0.4 µm) during 15–16 April, with the majority of these individual particles being classified as partially aged (partially chloride-depleted) (Fig. 6a). The average and molar ratios of these individual sea spray aerosol particles were 0.2 ± 0.1 (95 % confidence interval) and 1.0 ± 0.3, respectively, for the 15–16 April sample and 0.07 ± 0.04 and 1.5 ± 0.7, respectively, for the 16 April sample (Table 3). This shows the significant depletion of chlorine and enrichment of sulfur in the measured sea spray aerosol particles, consistent with the expected aging during transport of submicron sea spray aerosol particles (Kirpes et al., 2018). These individual particle results are consistent with the average bulk submicron particle [Cl−] [Na+] and [SO] [Na+] molar ratios of 0.5 ± 0.2 and 1.4 ± 0.6 (chloride depletion and sulfate enrichment relative to seawater) during moderate wind periods (Fig. 5), consistent with previous observations at Utqiaġvik (May et al., 2016).
For the 0.4–2.8 µm da stage, the individual sea spray aerosol particles accounted for 30 ± 9 %, on average by number, during 15–16 April. The average and molar ratios for these sea spray aerosol particles were 0.93 ± 0.02 and 0.03 ± 0.01, respectively, for the 15–16 April sample and 0.77 ± 0.09 and 0.08 ± 0.06, respectively, for the 16 April sample (Table 3). For comparison, the and molar ratios in seawater are 1.16 and 0.06, respectively (Millero et al., 2008). Therefore, the observed ratios demonstrate significantly less chlorine depletion and no significant sulfur enrichment for sea spray aerosol particles collected on the 0.4–2.8 µm da stage, in contrast to the 0.08–0.4 µm da sea spray aerosol particles, discussed above, which were more aged. The composition of the larger particles is consistent with locally produced sea spray aerosols that have undergone minimal atmospheric processing. Additional discussion and comparisons are included in the Supplement (Text S1.1). Note that Mg was enriched (average molar ratios of 0.4–1.2, Table 3), compared to seawater (0.11; Millero et al., 2008), in the individual sea spray aerosol particles on both the 0.07–0.4 µm da and 0.4–2.8 µm da stages. This divalent cation binds with organic matter (exopolymeric substances; Krembs et al., 2002) within the sea surface microlayer, resulting in magnesium-enriched organic coatings on the sea spray aerosol (Jayarathne et al., 2016; Bertram et al., 2018; Kirpes et al., 2019).
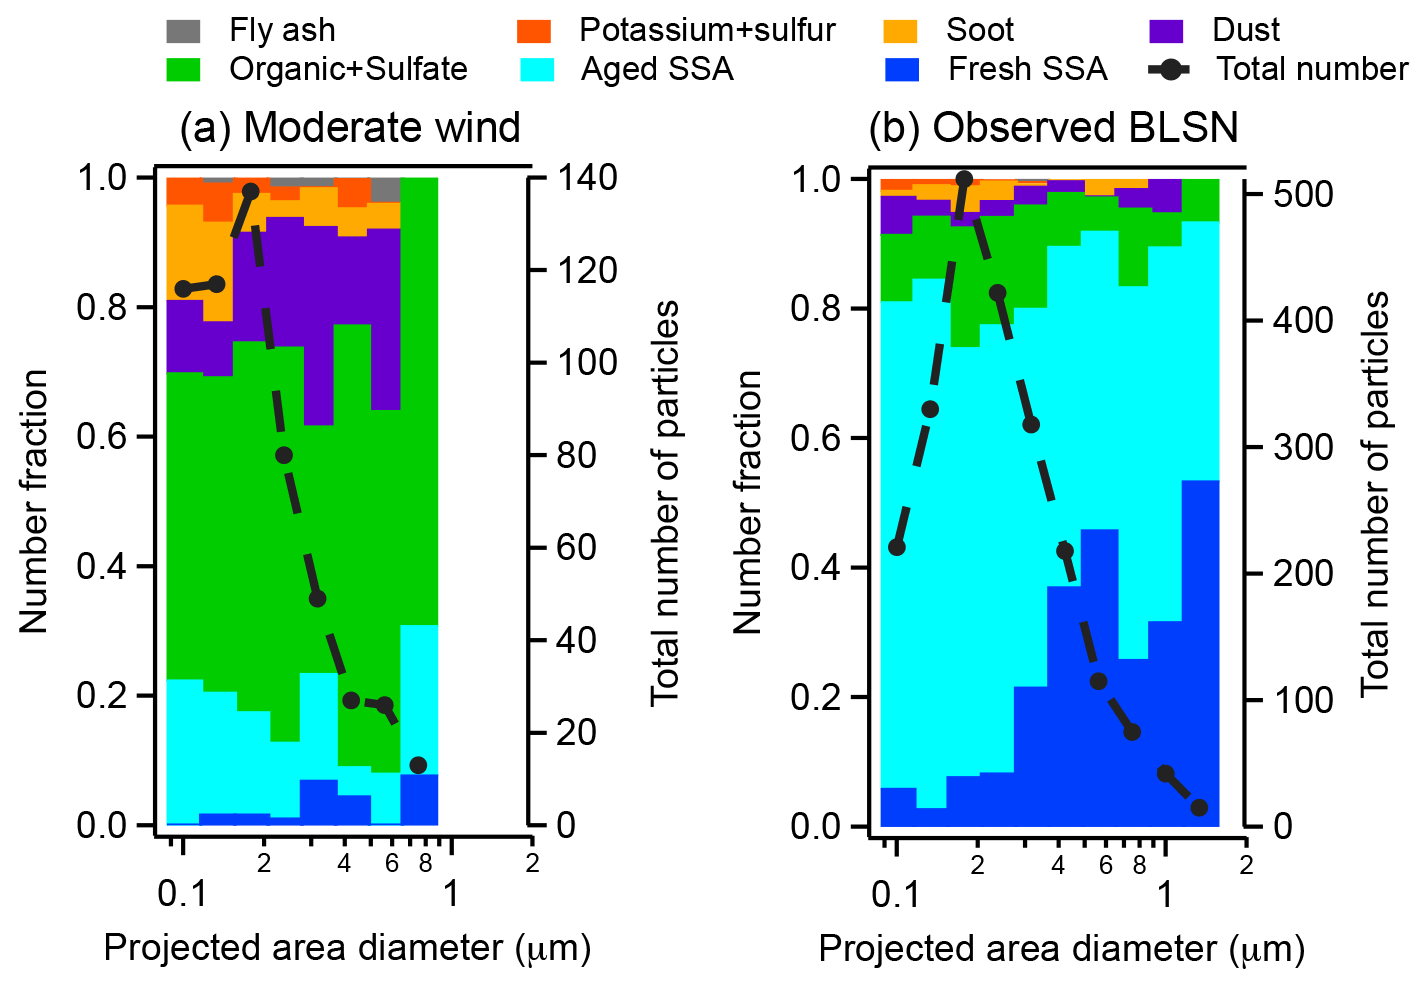
Figure 6Number fractions of seven individual particle types identified by CCSEM-EDX analysis of stage 3 (da 0.07–0.4 µm) samples collected during (a) two moderate wind periods (15 April 19:00–16 April 07:00 AKDT and 16 April 08:00–20:00) and (b) two observed blowing snow periods (6 April 07:00–19:00 and 6 April 19:00–7 April 07:00). Total numbers of particles analyzed by CCSEM-EDX per size bin are also shown. SSA refers to sea spray aerosol. All particles were collected on the 0.07–0.4 µm da impactor stage; projected area diameters measured by SEM are shown. Size-resolved counts of particles analyzed by CCSEM-EDX per sample are shown in Fig. S3, and representative SEM images and EDX spectra of the particle types are provided in Fig. S4.
Table 3Single-particle elemental ratios (average ± 95 % confidence intervals) of sea spray aerosol (SSA) particles identified by CCSEM-EDX during (a) two moderate wind periods (15 April 19:00–16 April 07:00 and 16 April 08:00–20:00) and (b) two observed blowing snow periods (6 April 07:00–19:00 AKDT and 6 April 19:00–7 April 07:00). Wind categories, particle diameters, and numbers of SSA particles analyzed are also shown.
3.3.3 Observed and falsely predicted blowing snow periods
The same seven individual particle types (fresh sea spray aerosols, partially aged sea spray aerosols, organic + sulfate aerosols, mineral dust, soot, potassium + sulfur, and fly ash), observed during the moderate wind speed period, were also present on the 0.07–0.4 µm da impactor stage (2281 particles analyzed) during an observed BLSN period: 6 April 07:00–19:00 AKDT (U9.7 m range 11–13 m s−1, average 12 m s−1) and 6 April 19:00–7 April 07:00) (U9.7 m range 9–12 m s−1, average 11 m s−1) (Fig. 6b). Fresh and partially aged sea spray aerosol particles constituted 74 %–93 %, by number, across the 0.09–1.5 µm dpa range, during this observed BLSN period (Fig. 6b). In comparison, during the moderate wind period examined (15–16 April), fresh and partially aged sea spray aerosol particles comprised only 8 %–23 %, by number, across the 0.09–0.9 µm dpa range (Fig. 6a). In contrast, the number fractions of organic + sulfate aerosol particles were lower during this observed BLSN period (5 %–19 %, by number, across 0.09–1.5 µm dpa; Fig. 6b) compared to that during the moderate wind period of 15–16 April (38 %–69 %, by number, across 0.09–0.9 µm dpa; Fig. 6a). Similar to the moderate wind periods, the majority of submicron particle sulfate during observed and falsely predicted BLSN periods was non-sea-salt sulfate, with an average of 82 ± 9 % and 90 ± 5 %, respectively, indicative of Arctic haze influence. Both the submicron particle total sulfate and non-sea-salt sulfate concentrations were not significantly different (p > 0.05) during observed BLSN periods ([SO] = 0.7 ± 0.2 µg m−3; [SO]nss= 0.6 ± 0.2 µg m−3) and low wind periods ([SO] = 0.7 ± 0.5 µg m−3; [SO]nss= 0.6 ± 0.5 µg m−3) (Fig. 4), suggesting that the contribution of long-range transported secondary sulfate was similar during these two period types.
Observed BLSN periods featured average submicron particle [Na+] of 0.5 ± 0.3 µg m−3, compared to 0.2 ± 0.1 µg m−3 during moderate wind periods and 0.1 ± 0.2 µg m−3 during low wind periods (Fig. 4). Similarly, [Cl−] increased from 0.1 ± 0.1 µg m−3 and 0.1 ± 0.2 µg m−3 during moderate and low wind periods, respectively, to 0.9 ± 0.7 µg m−3 during observed BLSN periods (Fig. 4). This is consistent with a submicron sea salt source during observed BLSN periods. The increased submicron particle [Na+] and [Cl−] concentrations during observed BLSN periods, compared to moderate wind periods (Fig. 4), are consistent with the measured increased relative contribution from individual sea spray aerosol particles.
Among all of the measured individual sea spray aerosol particles collected on the 0.07–0.4 µm da impactor stage during the 6–7 April observed BLSN period, fresh (nascent) sea spray aerosol particles comprised 3 %–11 % and 27 %–57 %, by number, across the 0.1–0.3 µm dpa and 0.3–1.3 µm dpa ranges, respectively (Fig. 6b). For the larger (0.4–2.8 µm da) impactor stage, only results from the 6 April 07:00–19:00 BLSN period are reported (4131 particles analyzed) because the particle loading on the 6 April 19:00–7 April 07:00 substrate was insufficient for CCSEM-EDX analysis, consistent with reduced particle number concentrations in this diameter range during observed BLSN periods (Sect. 3.2). For the 6 April observed BLSN period, fresh sea spray aerosol particles comprised 52 ± 8 %, by number, of the individual particles collected on the 0.4–2.8 µm da impactor stage during the 6 April observed BLSN period compared to 30 ± 9 % observed during the moderate wind period (15–16 April). As discussed in Sect. 3.3.2, these percentages represent upper limits for the fresh sea spray aerosol content for particles collected on the 0.4–2.8 µm da impactor stage due to challenges in detecting organic particles on the aluminum substrate. Together with the trend observed for the 0.07–0.4 µm da impactor stage, this shows an increased relative contribution of locally produced sea spray aerosol with increasing particle diameter, as previously observed by Kirpes et al. (2018).
Aged sea spray aerosol particles (Cl-depleted, S-enriched) (Kirpes et al., 2018) comprised 89 %–97 % and 43 %–73 %, by number, across the 0.1–0.3 µm dpa and 0.3–1.3 µm dpa ranges of the measured individual sea spray aerosol particles during the 6–7 April observed BLSN period. In comparison to this 0.07–0.4 µm da impactor stage, only fresh sea spray aerosol particles were detected on the 0.4–2.8 µm da impactor stage. This size-dependent trend is consistent with increasing aging for smaller sea spray aerosols, due to their smaller Cl reservoir, greater surface area to volume ratio, and longer atmospheric lifetime (Leck et al., 2002; Williams et al., 2002; Bondy et al., 2017; Kirpes et al., 2018).
For the total individual sea spray aerosol particles collected on the 0.07–0.4 µm da impactor stage, the average and molar ratios were 0.14 ± 0.02 and 1.6 ± 0.1, respectively, for the 6 April sample and 0.34 ± 0.07 and 2.6 ± 0.2, respectively, for the 6–7 April sample (Table 3). These ratios are indicative of chloride-depleted and sulfate-enriched aged sea spray aerosol, on average (Kirpes et al., 2018), since the and molar ratios in seawater are 1.16 and 0.06, respectively (Millero et al., 2008). The bulk submicron (da<1.1 µm) particle [Cl−] [Na+] on 6 April was 1.2 mol mol−1, which is higher than that observed for the 0.07–0.4 µm da individual sea spray aerosol (0.14 ± 0.02), suggesting that most of the submicron fresh SSA mass was > 0.4 µm da, as expected based on previous measurements of sea spray aerosol size distributions, including those produced from sea ice leads (Nilsson et al., 2001; Feng et al., 2017). Consistent with a greater local sea salt contribution to the upper submicron range (0.4–1.1 µm da), the bulk submicron particle [SO] [Na+] molar ratio on 6 April (0.2) was lower than that observed for the <0.4 µm (da) individual sea spray aerosol particles ( during 6 April: 1.6 ± 0.1; 6–7 April: 2.6 ± 0.2, Table 3). Therefore, these observations further confirm that the increased submicron SSA mass concentrations during observed BLSN periods were primarily greater than 0.4 µm (da), in terms of both number and mass. In comparison, for the individual sea spray aerosol collected on the 0.4–2.8 µm da impactor stage on 6 April, the average and molar ratios were 0.92 ± 0.01 and 0.04 ± 0.01, respectively. This result further supports the trend of decreased aging and increasing local source contribution with increasing diameter.
Overall, the bulk submicron (da<1.1 µm) mass concentrations showed a higher average [Cl−] [Na+] molar ratio during observed BLSN periods (0.9 ± 0.3), compared to averages during moderate (0.5 ± 0.2) and low (0.4 ± 0.2) wind periods (Fig. 5), is indicative of less chloride depletion and the dominant local sea salt aerosol production, considering the seawater [Cl−] [Na+] molar ratio of 1.2 (Millero et al., 2008). In comparison, the submicron particle [Na+], [Cl−], and [Cl−] [Na+] during falsely predicted BLSN periods were 0.3 ± 0.1 µg m−3, 0.3 ± 0.2 µg m−3, and 0.8 ± 0.2 mol mol−1, respectively, between the values for observed BLSN and moderate wind periods.
The increased [Na+], [Cl−], and [Cl−] [Na+] during BLSN wind periods, compared to NBLSN wind periods, were also observed for supermicron particles (Figs. 4 and 5), consistent with a significant supermicron SSA source during BLSN wind periods. The supermicron particle [Cl−] [Na+] was 0.9 mol mol−1 during 7–13 April (BLSN wind), indicative of limited chloride depletion (seawater [Cl−] [Na+] = 1.2; Millero et al., 2008). Similarly, the supermicron particle [Cl−] [Na+] molar ratios for the 14–20 and 21–27 April samples were 1.0 and 1.1 (Fig. 5), respectively. The minor chloride depletion of all three supermicron particles samples collected during 7–27 April is consistent with the individual particle composition and contribution of local supermicron sea salt aerosol production during the moderate and BLSN wind speeds. Additional discussion and comparisons are included in the Supplement (Text S1.2).
3.3.4 Sea salt aerosol sources during observed blowing snow
The above analysis of submicron and supermicron particle inorganic ion and single-particle composition shows contribution of local SSA production (primarily > 0.4 µm) during observed BLSN periods. Open leads, exposing Arctic Ocean water directly to the atmosphere, have been observed in the field to serve as an efficient source of SSA at high wind speeds (Nilsson et al., 2001; Leck et al., 2002; May et al., 2016; Kirpes et al., 2019). In addition, blowing snow sublimation has been proposed as a potential source of SSA at high wind speeds in the polar regions by modeling (Yang et al., 2008, 2019; Huang et al., 2018) and field (Giordano et al., 2018; Frey et al., 2020) studies. While previously proposed as a source of SSA, frost flowers are mechanically rigid and difficult to break and produce ambient aerosols even under strong winds, as shown in both laboratory (Roscoe et al., 2011; Yang et al., 2017) and field (Domine et al., 2005; Alvarez-Aviles et al., 2008) studies. Here, we follow previous observational studies by using ion and elemental ratios to discern the likely SSA source(s) (Hara et al., 2017; Kirpes et al., 2019; Quinn et al., 2002). As discussed in detail below, both submicron and supermicron inorganic SSA composition is consistent with sea spray aerosol production from open leads, with a higher flux at elevated wind speed (Nilsson et al., 2001).
During observed BLSN periods, the average [Cl−] [Na+] and [K+] [Na+] molar ratios of local tundra surface snowpack were 1.1 ± 0.1 and 0.019 ± 0.004, respectively, similar to those of seawater (1.2 and 0.02, respectively; Millero et al., 2008) (Fig. 5). This is consistent with SSA deposition on the tundra snowpack (Simpson et al., 2005). These observations for the tundra snowpack are also consistent with previous observations for springtime Beaufort Sea first-year sea ice surface snowpack ([Cl−] [Na+] and [K+] [Na+] = 1.2 and 0.02, respectively; Krnavek et al., 2012) and springtime blowing snow collected over tundra near Utqiaġvik (1.21 ± 0.07 and 0.022 ± 0.003, respectively; Jacobi et al., 2012) (Fig. 5). The snowpack over sea ice is influenced by both SSA deposition and upward brine migration (Domine et al., 2004; Peterson et al., 2019). Thus, blowing snow particles lofted from both the local tundra surface snowpack and Beaufort Sea first-year sea ice surface snowpack would be expected to possess [Cl−] [Na+] and [K+] [Na+] signatures similar to those of seawater. In comparison, during observed BLSN, the submicron and supermicron particle [Cl−] [Na+] molar ratios (0.9 ± 0.3 and 0.9, respectively) showed only minor chloride depletion (Fig. 5), consistent with local production. Bulk submicron and supermicron particle [K+] [Na+] molar ratios (0.04 ± 0.01 and 0.03, respectively) during observed BLSN were 60 %–120 % higher than those of seawater and the snowpack (Fig. 5). Individual particle analyses showed that this bulk observation is not consistent with individual SSA particle composition and is due instead to the presence of externally mixed potassium-rich particles, as shown in Fig. 6 and discussed in the Supplement.
The average [Ca2+] [Na+] molar ratio of the springtime Beaufort Sea first-year sea ice surface snowpack (0.02; Krnavek et al., 2012) is similar to that of seawater (0.02; Millero et al., 2008) (Fig. 5). In comparison, the [Ca2+] [Na+] molar ratio of the local tundra surface snowpack during observed BLSN periods was slightly higher (0.033 ± 0.004), with previously collected springtime blowing snow over Utqiaġvik tundra even more enriched in calcium (0.06 ± 0.02; Jacobi et al., 2012). The [Ca2+] [Na+] molar ratio of the local tundra surface snowpack during both observed BLSN and falsely predicted BLSN was significantly different from the moderate wind and low wind periods (Table S3). The tundra snow (this study) and blowing snow (Jacobi et al., 2012) compositions are consistent with the measured submicron particle [Ca2+] [Na+] (0.04 ± 0.01) during observed BLSN periods and supermicron particle [Ca2+] [Na+] (0.03) during observed + falsely predicted BLSN periods (7–13 April). These bulk ratios are consistent with the average molar ratios of 0.04–0.05 in the individual sea spray aerosol particles (0.07–2.8µm da) during the 6–7 April BLSN event (Table 3), when there was little influence from dust particles (Fig. 6 and Sect. S1.1). Similarly to calcium, magnesium enrichment, relative to sodium, was also observed for the submicron particles during observed BLSN, supermicron particles during observed + falsely predicted BLSN (7–13 April), the individual 0.07–0.4 µm da sea spray aerosol particles collected overnight from 6 April 19:00 to 7 April 07:00, and the individual 0.4–2.8 µm da sea spray aerosol particles, collected during 6 April daytime (Fig. 5, Table 3, and Sect. S1.3). Among the seven individual particle sampling periods, only the individual 0.07–0.4 µm da sea spray aerosol particles collected on 6 April showed magnesium depletion, as discussed in Sect. S1.3.
Calcium and magnesium enrichment in the sea spray aerosols is due to binding of the divalent cation with organic matter (exopolymeric substances) (Krembs et al., 2002) in the surface seawater microlayer that leads to organic coatings on sea salt particles during bubble bursting (Jayarathne et al., 2016; Salter et al., 2016; Bertram et al., 2018). Indeed, the individual 0.4–2.8 µm da fresh sea spray aerosol lacking chloride depletion was enriched in carbon (Fig. S5). This has been previously observed for wintertime sea spray aerosols produced from leads near Utqiaġvik (Kirpes et al., 2019). Since sea spray aerosol deposition influences the surface snowpack composition above both sea ice and tundra (Domine et al., 2004; Peterson et al., 2019), the calcium enrichment in the tundra snowpack and blowing snow suggest surface snow influence from sea spray aerosol deposition (Krnavek et al., 2012) and resuspension during BLSN conditions.
The average [SO] [Na+] molar ratio of the local tundra surface snowpack during observed BLSN periods was 0.04 ± 0.01, similar to that of the springtime Beaufort Sea first-year sea ice surface snowpack (0.04; Krnavek et al., 2012) and springtime blowing snow collected over tundra near Utqiaġvik (0.03 ± 0.01; Jacobi et al., 2012) but statistically significantly (p<0.01) lower than that of seawater (0.06; Millero et al., 2008) (Fig. 5). This ratio is similar to the S / Na ratios of the 0.4–2.8 µm da individual sea spray aerosol particles during the observed BLSN period on 6 April (0.04 ± 0.01); however, it is also similar to the ratio (0.03 ± 0.01) measured for the moderate wind speed period on 15–16 April (Table 3). The bulk supermicron particle [SO] [Na+] during observed BLSN (7–13 April) was only 0.017 mol mol−1, but it is not representative of the individual sea salt aerosol particles (Text S1.2). Sulfate depletion can result from mirabilite (Na2SO4 ⋅ 10H2O) precipitation below −6.4 ∘C (Wagenbach et al., 1998; Butler et al., 2016) within brine, which influences the composition of the first-year sea ice snowpack. The air temperature at 1.3 m during observed BLSN periods was −14 ± 3 ∘C (range from −22 to −7 ∘C), supporting mirabilite precipitation. Previously, frost flowers with an average [SO] [Na+] molar ratio of 0.016 ± 0.003 were collected near Utqiaġvik during spring (Douglas et al., 2012). The snowpack (over tundra and Beaufort Sea first-year sea ice) [SO] [Na+] was between that of frost flowers and seawater. Since frost flower and upward brine migration only impact snow above sea ice (Domine et al., 2004), the sulfate signature of the tundra surface snowpack could be due to the transport of nearby (∼ 5 km) coastal sea ice blowing snow to the nearby tundra. Tabler et al. (1990) reported that snow particles can be blown for distances of 3 to 5 km, corresponding to atmospheric residence times of up to 10 min. For the average U9.7 m of 11 m s−1 during observed BLSN (Table 2), snow particle transport for 5 km would correspond to ∼ 7.5 min.
Overall, the observed minor chloride depletion for particles > 0.4 µm da points to the influence of locally produced submicron and supermicron sea salt aerosols during observed BLSN. Individual sea spray aerosol particles < 0.4 µm da were primarily depleted in chloride and enriched in sulfate, consistent with aging during transport and the significant non-sea-salt sulfate mass concentrations. Most notably, calcium enrichment in both submicron and supermicron sea spray aerosol particles, regardless of chloride depletion, is consistent with divalent cation binding with organic coatings obtained during bubble bursting within open leads, with sea spray aerosol deposition on the surface snowpack likely explaining tundra snowpack calcium enrichment. Therefore, the bulk submicron particle mass composition is consistent with sea spray aerosol produced from bubble bursting within open leads. If blowing snow sublimation contributed to the observed SSA population, the snow being sublimated would have been primarily impacted by sea spray aerosol deposition rather than upward brine migration through the snowpack.
This study investigates the impacts of leads and blowing snow on ambient particle number concentrations and chemical composition at a coastal Arctic site (Utqiaġvik, Alaska) during spring 2016. Our unique dataset consists of blowing snow observations by the local airport and ceilometer, size-resolved aerosol number concentrations from 0.01 to 5 µm, and both bulk and single-particle chemical atmospheric particle composition. The observed BLSN periods, when blowing snow was both predicted and observed by either the local airport or ceilometer, covered 25 % of the 5-week study. Only 57 % of predicted BLSN periods, based on wind speed and temperature, were observed by the airport or ceilometer. This suggests that the commonly used parameterization based on data from the Canadian Prairies (Li and Pomeroy, 1997) overestimates the occurrence of blowing snow when simulating it simply based on wind speed and air temperature, as previously observed in Antarctica (Gossart et al., 2017). Therefore, atmospheric chemistry modeling studies using this parameterization in the polar regions likely overestimate the frequency of blowing snow and thus the potential contribution of sea salt aerosols from blowing snow sublimation. Future studies are needed to further investigate blowing snow occurrence and sublimation flux.
The average particle number concentration from 0.01 to 0.06 µm dm was on average 6 times higher during observed BLSN periods, compared to low wind periods, suggesting ultrafine particle production in the presence of blowing snow and elevated wind speeds. Future chemical composition measurements are required to identify the source(s) of these ultrafine particles. Based on previous sea spray aerosol measurements, it is expected that ultrafine sea spray aerosol production from leads would be enhanced under the high wind and low temperature conditions (Clarke et al., 2006; Nilsson et al., 2001; Zábori et al., 2012). Future measurements are needed of size-resolved sea spray aerosol emission fluxes from leads as a function of wind speed and fetch.
The 0.06–0.3 µm dm particle number concentration was on average 67 % higher during observed BLSN periods compared to low wind periods. In this particle size range, a significantly increased relative number contribution from aged (partially chloride-depleted, sulfate-enriched) and fresh/nascent sea spray aerosol was observed during BLSN, with primarily organic + sulfate particles dominating the low wind periods, as expected for Arctic haze influence. The individual submicron sea spray aerosol particles were enriched in calcium relative to seawater during both moderate and observed BLSN conditions, consistent with divalent cation binding with organic matter obtained from the sea surface microlayer during bubble bursting (Kirpes et al., 2019; Salter et al., 2016; Jayarathne et al., 2016; Bertram et al., 2018). These single-particle observations point to the heterogeneity of the aerosol population with multiple contributing particle sources and aging processes that are a challenge to disentangle with bulk aerosol composition data alone. Submicron sulfate mass concentrations were similar across all wind speed conditions, while both sodium and chloride mass concentrations increased with increasing wind speed (low to moderate to falsely predicted and observed BLSN). This is consistent with the previously observed increasing emission flux of sea spray aerosol particles, including from leads, upon increasing wind speeds (Nilsson et al., 2001; Leck et al., 2002; Monahan and O'Muircheartaigh, 1980).
To produce sea salt aerosol particles of 0.01–0.3 µm that were enhanced during BLSN in the current work, small blowing snow particles of 0.6–19 µm are needed when assuming only one sea salt aerosol particle is produced from one blowing snow particle (Yang et al., 2008). Recent atmospheric chemistry modeling studies have assumed that multiple sea salt aerosol particles are produced from the sublimation of one larger blowing snow particle (Huang and Jaeglé, 2017; Huang et al., 2018; Yang et al., 2019), but to our knowledge, there are no experimental studies on this process. In addition, these modeling studies have assumed blowing snow particles contain only sea salt, in contrast to various chemical components in the Arctic snowpack, including organics, dust, nitrate, sulfate, and soot (e.g., Macdonald et al., 2018; Mori et al., 2019; Grannas et al., 2007; Krnavek et al., 2012). Thus, large uncertainties exist when modeling sea salt aerosol production from blowing snow sublimation, and future studies are needed to assess the distribution of the size and number of particles produced during the sublimation of a blowing snow grain.
While 0.4–1.0 µm do particle number concentrations were not enhanced during observed BLSN, differences in particle chemical composition were observed, compared to moderate and low wind periods. Increased submicron particle sodium and chloride mass concentrations were measured for observed BLSN periods, compared to moderate and low wind periods. This is consistent with the observation of the presence of individual 0.4–2.8 µm fresh (nascent) sea spray aerosol particles, further suggesting local submicron sea salt aerosol production. To investigate the source(s) of the sea salt aerosol, inorganic ion ratios were compared to those of local tundra surface snowpack in this study, as well as sea ice surface snowpack, blowing snow, frost flowers, and seawater in previous studies. Measured submicron particle [Cl−] [Na+] molar ratios were similar to those of seawater and the local tundra snowpack as well as previous measurements of the first-year sea ice snowpack (Krnavek et al., 2012) and blowing snow (Jacobi et al., 2012) near Utqiaġvik. Both bulk and single-particle analyses show calcium enrichment relative to seawater, during moderate and observed BLSN periods. This is consistent with open lead production of sea spray aerosols due to the binding of these divalent cations with organic matter obtained from the sea surface microlayer during bubble bursting (Kirpes et al., 2019; Jayarathne et al., 2016). The similar calcium enrichment observed for the local tundra surface snowpack and previous blowing snow (Jacobi et al., 2012) is likely due to the influence of sea spray aerosol deposition on the surface snowpack, as it is not expected for upward brine migration or frost flower influence on the snowpack above the sea ice (Hara et al., 2017). Therefore, the measured submicron aerosol composition is consistent with bubble bursting production within open leads that were observed visually and by satellite throughout the whole study.
In contrast to the enhancements at <0.3 µm dm, the average particle number concentration from 1 to 4 µm do was, on average, 82 % lower during observed BLSN periods than during low wind periods, suggesting scavenging of particles by blowing snow, a process currently missing in global models, including those that incorporate blowing snow sublimation (e.g., Huang et al., 2018; Yang et al., 2019). This decreased number concentration exists despite the increased supermicron sea salt ([Na+] and [Cl−]) mass concentrations observed during the moderate wind and BLSN periods. Only minor chloride depletion, relative to seawater, was measured, indicating local supermicron sea salt aerosol production. Similarly to the submicron particles, the sea spray aerosol enrichment in Ca2+ and Mg2+ is consistent with binding of these divalent cations with organic matter that coated the sea salt particles during bubble bursting at the sea surface microlayer (Kirpes et al., 2019; Jayarathne et al., 2016). Therefore, if blowing snow sublimation contributed to the observed submicron and/or supermicron sea salt aerosol populations, the snow being sublimated would have been impacted by sea spray aerosol deposition rather than upward brine migration through the snowpack. It is important to note that the bulk inorganic ion ratios were not indicative of the individual sea spray aerosol particle composition due to the contribution of externally mixed sulfate haze aerosol. This observation highlights that bulk ratios are not always representative of the individual particle population (Riemer et al., 2019) and that caution must be taken in their interpretation. This further points to the need for individual atmospheric particle measurements in future studies to more accurately assess source contributions.
The thinning and fracturing sea ice across the Arctic Ocean is expected to be increasing sea spray aerosol production from open leads, with implications for aerosol optical depth and aerosol–cloud interactions (Struthers et al., 2011; Browse et al., 2014). An improved understanding of aerosol emissions from leads is therefore critical to future prediction of the Arctic sea spray aerosol burden. Future observational studies are also needed to further investigate the conditions under which blowing snow occurs and its contribution to aerosol production as well as its role in scavenging of supermicron particles. Reduced sea ice extent will provide less sea ice surface area for blowing snow production. However, with decreasing snow depth on Arctic sea ice (Webster et al., 2014), sea ice surface snow salinity is expected to increase, as it depends on both upward brine migration from the sea ice (increasing with decreasing snow depth) and snow surface deposition of sea spray aerosols from nearby open leads (Domine et al., 2004; Peterson et al., 2019).
Data for the blowing snow events reported from the Wiley Post-Will Rogers Memorial Airport are available at https://www.wunderground.com/history/daily/us/ak/utqiagvik/PABR, last access: 24 November 2022. ARM ceilometer data are available at https://doi.org/10.5439/1497398 (ARM, 2010). Submicron and supermicron particle inorganic ion data are available by contacting Patricia K. Quinn (patricia.k.quinn@noaa.gov). Sonic anemometer, SMPS, OPS, CCSEM-EDX, and tundra surface snow ion composition data are available by contacting the corresponding author.
The supplement related to this article is available online at: https://doi.org/10.5194/acp-22-15263-2022-supplement.
QC and KAP prepared the manuscript and led data integration, analysis, and interpretation. PBS, KAP, and JDF designed the PHOXMELT field campaign. QC and KAP conceived this study. JAM and RMK conducted the CCSEM-EDX single-particle analysis and interpretation, with assistance from SC, NNL, and APA. ST and JDF conducted sonic anemometer measurements. ST, ARWR, and SMM conducted SMPS and OPS size-resolved aerosol number concentration measurements. ARWR and SMM collected tundra snow and particle samples and contributed to snow ion concentration measurements, conducted by AJB. NAL and AK provided the ceilometer data analysis and interpretation. LMU and PKQ provided submicron and supermicron particle ion concentration measurements.
The contact author has declared that none of the authors has any competing interests.
Publisher's note: Copernicus Publications remains neutral with regard to jurisdictional claims in published maps and institutional affiliations.
We thank the Ukpeaġvik Iñupiat Corporation – Science and Polar Field Services, as well as Dandan Wei and Jesus Ruiz-Plancarte from Pennsylvania State University, for logistical support during this field campaign. We thank NOAA Barrow Observatory for CPC aerosol number concentration data and DOE ARM Observatory for ceilometer data. CCSEM-EDX analyses were performed at the Environmental Molecular Sciences Laboratory (EMSL), a national scientific user facility located at the Pacific Northwest National Laboratory (PNNL) and sponsored by the Office of Biological and Environmental Research of the US DOE. PNNL is operated for the DOE by Battelle Memorial Institute under contract no. DE-AC06-76RL0 1830. PKQ acknowledges PMEL contribution number 5174.
This research has been supported by the National Science Foundation Office of Polar Programs (grant nos. 1417668, 1417906, 1417914, 2000493, 2000428, and 2000403), the National Aeronautics and Space Administration Earth Science Program (grant no. NNX14AP44G), DOE Atmospheric Systems Research program (grant no. DE-SC0019392), and a Sloan Research Fellowship to KAP. LMU was supported by the Cooperative Institute for Climate, Ocean, and Ecosystem Studies (CIOCES) under NOAA Cooperative Agreement NA20OAR4320271 (contribution no. 2022-1206). QC was supported by the Hong Kong General Research Fund (grant no. 15223221) for efforts during manuscript revisions.
This paper was edited by Roya Bahreini and reviewed by two anonymous referees.
Alvarez-Aviles, L., Simpson, W., Douglas, T., Sturm, M., Perovich, D., and Domine, F.: Frost flower chemical composition during growth and its implications for aerosol production and bromine activation, J. Geophys. Res., 113, D21304, https://doi.org/10.1029/2008JD010277, 2008.
ARM (Atmospheric Radiation Measurement user facility): Ceilometer (CEIL10M). 2016-04-03 to 2016-05-07, North Slope Alaska (NSA) Central Facility, Barrow AK (C1), compiled by: Morris, V. and Ermold, B., ARM Data Center [data set], https://doi.org/10.5439/1497398, 2010.
Ault, A. P. and Axson, J. L.: Atmospheric Aerosol Chemistry: Spectroscopic and Microscopic Advances, Anal. Chem., 89, 430–452, 2017.
Ault, A. P., Peters, T. M., Sawvel, E. J., Casuccio, G. S., Willis, R. D., Norris, G. A., and Grassian, V. H.: Single-particle SEM-EDX analysis of iron-containing coarse particulate matter in an urban environment: sources and distribution of iron within Cleveland, Ohio, Environ. Sci. Technol., 46, 4331–4339, https://doi.org/10.1021/es204006k, 2012.
Ault, A. P., Moffet, R. C., Baltrusaitis, J., Collins, D. B., Ruppel, M. J., Cuadra-Rodriguez, L. A., Zhao, D. F., Guasco, T. L., Ebben, C. J., Geiger, F. M., Bertram, T. H., Prather, K. A., and Grassian, V. H.: Size-Dependent Changes in Sea Spray Aerosol Composition and Properties with Different Seawater Conditions, Environ. Sci. Technol., 47, 5603–5612, https://doi.org/10.1021/Es400416g, 2013.
Bartels-Rausch, T., Jacobi, H.-W., Kahan, T. F., Thomas, J. L., Thomson, E. S., Abbatt, J. P. D., Ammann, M., Blackford, J. R., Bluhm, H., Boxe, C., Domine, F., Frey, M. M., Gladich, I., Guzmán, M. I., Heger, D., Huthwelker, Th., Klán, P., Kuhs, W. F., Kuo, M. H., Maus, S., Moussa, S. G., McNeill, V. F., Newberg, J. T., Pettersson, J. B. C., Roeselová, M., and Sodeau, J. R.: A review of air–ice chemical and physical interactions (AICI): liquids, quasi-liquids, and solids in snow, Atmos. Chem. Phys., 14, 1587–1633, https://doi.org/10.5194/acp-14-1587-2014, 2014.
Bertram, T. H., Cochran, R. E., Grassian, V. H., and Stone, E. A.: Sea spray aerosol chemical composition: elemental and molecular mimics for laboratory studies of heterogeneous and multiphase reactions, Chem. Soc. Rev., 47, 2374–2400, https://doi.org/10.1039/c7cs00008a, 2018.
Bondy, A. L., Wang, B., Laskin, A., Craig, R. L., Nhliziyo, M. V., Bertman, S. B., Pratt, K. A., Shepson, P. B., and Ault, A. P.: Inland Sea Spray Aerosol Transport and Incomplete Chloride Depletion: Varying Degrees of Reactive Processing Observed during SOAS, Environ. Sci. Technol., 51, 9533–9542, https://doi.org/10.1021/acs.est.7b02085, 2017.
Bondy, A. L., Bonanno, D., Moffet, R. C., Wang, B., Laskin, A., and Ault, A. P.: The diverse chemical mixing state of aerosol particles in the southeastern United States, Atmos. Chem. Phys., 18, 12595–12612, https://doi.org/10.5194/acp-18-12595-2018, 2018.
Breider, T. J., Mickley, L. J., Jacob, D. J., Ge, C., Wang, J., Payer Sulprizio, M., Croft, B., Ridley, D. A., McConnell, J. R., Sharma, S., Husain, L., Dutkiewicz, V. A., Eleftheriadis, K., Skov, H., and Hopke, P. K.: Multidecadal trends in aerosol radiative forcing over the Arctic: contribution of changes in anthropogenic aerosol to Arctic warming since 1980, J. Geophys. Res.-Atmos., 122, 3573–3594, https://doi.org/10.1002/2016JD025321, 2017.
Browse, J., Carslaw, K. S., Mann, G. W., Birch, C. E., Arnold, S. R., and Leck, C.: The complex response of Arctic aerosol to sea-ice retreat, Atmos. Chem. Phys., 14, 7543–7557, https://doi.org/10.5194/acp-14-7543-2014, 2014.
Budd, W. F.: The drifting of nonuniform snow particles, in: Studies in Antarctic Meteorology, Antarct. Res. Ser., Vol. 9, edited by: Rubin, M. J., National Academies Press, Washington, D.C., USA, 59–70, https://doi.org/10.1029/AR009p0059, 1966.
Butler, B. M., Papadimitriou, S., Santoro, A., and Kennedy, H.: Mirabilite solubility in equilibrium sea ice brines, Geochim. Cosmochim. Ac., 182, 40–54, https://doi.org/10.1016/j.gca.2016.03.008, 2016.
Clarke, A. D., Owens, S. R., and Zhou, J.: An ultrafine sea-salt flux from breaking waves: Implications for cloud condensation nuclei in the remote marine atmosphere, J. Geophys. Res., 111, D06202, https://doi.org/10.1029/2005JD006565, 2006.
Cohen, J., Screen, J. A., Furtado, J. C., Barlow, M., Whittleston, D., Coumou, D., Francis, J., Dethloff, K., Entekhabi, D., Overland, J., and Jones, J.: Recent Arctic amplification and extreme mid-latitude weather, Nat. Geosci., 7, 627–637, https://doi.org/10.1038/ngeo2234, 2014.
Collins, D. B., Ault, A. P., Moffet, R. C., Ruppel, M. J., Cuadra-Rodriguez, L. A., Guasco, T. L., Corrigan, C. E., Pedler, B. E., Azam, F., Aluwihare, L. I., Bertram, T. H., Roberts, G. C., Grassian, V. H., and Prather, K. A.: Impact of marine biogeochemistry on the chemical mixing state and cloud forming ability of nascent sea spray aerosol, J. Geophys. Res.-Atmos., 118, 8553–8565, https://doi.org/10.1002/jgrd.50598, 2013.
Comola, F. and Lehning, M.: Energy- and momentum-conserving model of splash entrainment in sand and snow saltation, Geophys. Res. Lett., 44, 1601–1609, https://doi.org/10.1002/2016GL071822, 2017.
Comola, F., Kok, J. F., Gaume, J., Paterna, E., and Lehning, M.: Fragmentation of wind-blown snow crystals, Geophys. Res. Lett., 44, 4195–4203, https://doi.org/10.1002/2017GL073039, 2017GL073039, 2017.
Croft, B., Lohmann, U., Martin, R. V., Stier, P., Wurzler, S., Feichter, J., Posselt, R., and Ferrachat, S.: Aerosol size-dependent below-cloud scavenging by rain and snow in the ECHAM5-HAM, Atmos. Chem. Phys., 9, 4653–4675, https://doi.org/10.5194/acp-9-4653-2009, 2009.
Croft, B., Martin, R. V., Leaitch, W. R., Tunved, P., Breider, T. J., D'Andrea, S. D., and Pierce, J. R.: Processes controlling the annual cycle of Arctic aerosol number and size distributions, Atmos. Chem. Phys., 16, 3665–3682, https://doi.org/10.5194/acp-16-3665-2016, 2016.
Déry, S. J. and Yau, M. K.: Simulation of blowing snow in the Canadian Arctic using a double-moment model, Bound. Lay. Meteorol., 99, 297–316, https://doi.org/10.1023/A:1018965008049, 2001.
Déry, S. J., Taylor, P. A., and Xiao, J.: The thermodynamic effects of sublimating, blowing snow in the atmospheric boundary layer, Bound.-Lay. Meteorol., 89, 251–283, https://doi.org/10.1023/A:1001712111718, 1998.
Domine, F., Sparapani, R., Ianniello, A., and Beine, H. J.: The origin of sea salt in snow on Arctic sea ice and in coastal regions, Atmos. Chem. Phys., 4, 2259–2271, https://doi.org/10.5194/acp-4-2259-2004, 2004.
Domine, F., Taillandier, A. S., Simpson, W. R., and Severin, K.: Specific surface area, density and microstructure of frost flowers, Geophys. Res. Lett., 32, L13502, https://doi.org/10.1029/2005GL023245, 2005.
Domine, F., Albert, M., Huthwelker, T., Jacobi, H.-W., Kokhanovsky, A. A., Lehning, M., Picard, G., and Simpson, W. R.: Snow physics as relevant to snow photochemistry, Atmos. Chem. Phys., 8, 171–208, https://doi.org/10.5194/acp-8-171-2008, 2008.
Domine, F.: The chemical composition of snow and glacial ice, in: Advances in Atmospheric Chemistry, Vol. 3, Chemistry in the Cryosphere, World Scientific Publishing Co., Inc., Hackensack, New Jersey, USA, 57–138, https://doi.org/10.1142/9789811230134_0002, 2022.
Doorschot, J. J. J. and Lehning, M.: Equilibrium saltation: mass fluxes, aerodynamic entrainment, and dependence on grain properties, Bound.-Lay. Meteorol., 104, 111–130, https://doi.org/10.1023/A:1015516420286, 2002.
Douglas, T. A., Domine, F., Barret, M., Anastasio, C., Beine, H. J., Bottenheim, J., Grannas, A. M., Houdier, S., Netcheva, S., Rowland, G., Staebler, R., and Steffen, A.: Frost flowers growing in the Arctic ocean-atmosphere-sea ice-snow interface: 1. Chemical composition, J. Geophys. Res., 117, D00R09, https://doi.org/10.1029/2011JD016469, 2012.
Fan, S.-M., and Jacob, D. J.: Surface ozone depletion in Arctic spring sustained by bromine reactions on aerosols, Nature, 359, 522–524, https://doi.org/10.1038/359522a0, 1992.
Federal Meteorological Handbook: No. 1 – Surface weather observations and reports, FCM-H1-2019, Washington, D.C., July 2019, https://www.icams-portal.gov/resources/ofcm/fmh/FMH1/fmh1_2019.pdf (last access: 24 November 2022), 2019.
Feng, L., Shen, H., Zhu, Y., Gao, H., and Yao, X.: Insight into Generation and Evolution of Sea-Salt Aerosols from Field Measurements in Diversified Marine and Coastal Atmospheres, Sci. Rep., 7, 41260, https://doi.org/10.1038/srep41260, 2017.
Fletcher, R. A., Ritchie, N.W.M., Anderson, I.M., and Small, J. A.: Microscopy and microanalysis of individual collected particles, in: Aerosol Measurement, edited by: Kulkarni, P., Baron, P. A., and Willeke, K., John Wiley & Sons, Inc., New York, NY, USA, 179–232, https://doi.org/10.1002/9781118001684.ch10, 2011.
Fossum, K. N., Ovadnevaite, J., Ceburnis, D., Preißler, J., Snider, J. R., Huang, R.-J., Zuend, A., and O'Dowd, C.: Sea-spray regulates sulfate cloud droplet activation over oceans, npj Clim. Atmos. Sci., 3, 14, https://doi.org/10.1038/s41612-020-0116-2, 2020.
Freud, E., Krejci, R., Tunved, P., Leaitch, R., Nguyen, Q. T., Massling, A., Skov, H., and Barrie, L.: Pan-Arctic aerosol number size distributions: seasonality and transport patterns, Atmos. Chem. Phys., 17, 8101–8128, https://doi.org/10.5194/acp-17-8101-2017, 2017.
Frey, M. M., Norris, S. J., Brooks, I. M., Anderson, P. S., Nishimura, K., Yang, X., Jones, A. E., Nerentorp Mastromonaco, M. G., Jones, D. H., and Wolff, E. W.: First direct observation of sea salt aerosol production from blowing snow above sea ice, Atmos. Chem. Phys., 20, 2549–2578, https://doi.org/10.5194/acp-20-2549-2020, 2020.
Formenti, P., Elbert, W., Maenhaut, W., Haywood, J., and Andreae, M. O.: Chemical composition of mineral dust aerosol during the Saharan Dust Experiment (SHADE) airborne campaign in the Cape Verde region, September 2000, J. Geophys. Res., 108, 8576, https://doi.org/10.1029/2002JD002648, 2003.
Frossard, A. A., Shaw, P. M., Russell, L. M., Kroll, J. H., Canagaratna, M. R., Worsnop, D. R., Quinn, P. K., and Bate, T. S.: Springtime Arctic haze contributions of submicron organic particles from European and Asian combustion sources, J. Geophys. Res., 116, D05205, https://doi.org/10.1029/2010JD015178, 2011.
Giordano, M. R., Kalnajs, L. E., Goetz, J. D., Avery, A. M., Katz, E., May, N. W., Leemon, A., Mattson, C., Pratt, K. A., and DeCarlo, P. F.: The importance of blowing snow to halogen-containing aerosol in coastal Antarctica: influence of source region versus wind speed, Atmos. Chem. Phys., 18, 16689–16711, https://doi.org/10.5194/acp-18-16689-2018, 2018.
Goldstein, J., Newbury, D. E., Echlin, P., Joy, D. C., Romig Jr, A. D., Lyman, C. E., Fiori, C., and Lifshin, E.: Scanning electron microscopy and X-ray microanalysis: a text for biologists, materials scientists, and geologists, Springer Science & Business Media, https://doi.org/10.1007/978-1-4613-0491-3, 2012.
Gordon, M. and Taylor, P. A.: Measurements of blowing snow, Part I: Particle shape, size distribution, velocity, and number flux at Churchill, Manitoba, Canada. Cold Reg. Sci. Technol., 55, 63–74, https://doi.org/10.1016/j.coldregions.2008.05.001, 2009.
Gossart, A., Souverijns, N., Gorodetskaya, I. V., Lhermitte, S., Lenaerts, J. T. M., Schween, J. H., Mangold, A., Laffineur, Q., and van Lipzig, N. P. M.: Blowing snow detection from ground-based ceilometers: application to East Antarctica, The Cryosphere, 11, 2755–2772, https://doi.org/10.5194/tc-11-2755-2017, 2017.
Grannas, A. M., Jones, A. E., Dibb, J., Ammann, M., Anastasio, C., Beine, H. J., Bergin, M., Bottenheim, J., Boxe, C. S., Carver, G., Chen, G., Crawford, J. H., Dominé, F., Frey, M. M., Guzmán, M. I., Heard, D. E., Helmig, D., Hoffmann, M. R., Honrath, R. E., Huey, L. G., Hutterli, M., Jacobi, H. W., Klán, P., Lefer, B., McConnell, J., Plane, J., Sander, R., Savarino, J., Shepson, P. B., Simpson, W. R., Sodeau, J. R., von Glasow, R., Weller, R., Wolff, E. W., and Zhu, T.: An overview of snow photochemistry: evidence, mechanisms and impacts, Atmos. Chem. Phys., 7, 4329–4373, https://doi.org/10.5194/acp-7-4329-2007, 2007.
Gromke, C., Horender, S., Walter, B., and Lehning, M.: Snow particle characteristics in the saltation layer, J. Glaciol., 60, 431–439, https://doi.org/10.3189/2014JoG13J079, 2014.
Grythe, H., Ström, J., Krejci, R., Quinn, P., and Stohl, A.: A review of sea-spray aerosol source functions using a large global set of sea salt aerosol concentration measurements, Atmos. Chem. Phys., 14, 1277–1297, https://doi.org/10.5194/acp-14-1277-2014, 2014.
Hara, K., Matoba, S., Hirabayashi, M., and Yamasaki, T.: Frost flowers and sea-salt aerosols over seasonal sea-ice areas in northwestern Greenland during winter–spring, Atmos. Chem. Phys., 17, 8577–8598, https://doi.org/10.5194/acp-17-8577-2017, 2017.
Hara, K., Osada, K., Yabuki, M., Takashima, H., Theys, N., and Yamanouchi, T.: Important contributions of sea-salt aerosols to atmospheric bromine cycle in the Antarctic coasts, Sci. Rep., 8, 13852, https://doi.org/10.1038/s41598-018-32287-4, 2018.
Held, A., Brooks, I. M., Leck, C., and Tjernström, M.: On the potential contribution of open lead particle emissions to the central Arctic aerosol concentration, Atmos. Chem. Phys., 11, 3093–3105, https://doi.org/10.5194/acp-11-3093-2011, 2011.
Hinds, W. C.: Aerosol Technology: Properties, Behavior, and Measurement of Airborne Particles, John Wiley & Sons, Inc., New York, NY, USA, ISBN: 978-1-119-49404-1, 2012.
Hiranuma, N., Brooks, S. D., Moffet, R. C., Glen, A., Laskin, A., Gilles, M. K., Liu, P., Macdonald, A. M., Strapp, J. W., and McFarquhar, G. M.: Chemical characterization of individual particles and residuals of cloud droplets and ice crystals collected on board research aircraft in the ISDAC 2008 study, J. Geophys. Res.-Atmos., 118, 6564–6579, https://doi.org/10.1002/jgrd.50484, 2013.
Huang, J. and Jaeglé, L.: Wintertime enhancements of sea salt aerosol in polar regions consistent with a sea ice source from blowing snow, Atmos. Chem. Phys., 17, 3699–3712, https://doi.org/10.5194/acp-17-3699-2017, 2017.
Huang, J., Jaeglé, L., and Shah, V.: Using CALIOP to constrain blowing snow emissions of sea salt aerosols over Arctic and Antarctic sea ice, Atmos. Chem. Phys., 18, 16253–16269, https://doi.org/10.5194/acp-18-16253-2018, 2018.
Jacobi, H. W., Voisin, D., Jaffrezo, J. L., Cozic, J., and Douglas, T. A.: Chemical composition of the snowpack during the OASIS spring campaign 2009 at Barrow, Alaska, J. Geophys. Res., 117, D00R13, https://doi.org/10.1029/2011jd016654, 2012.
Jayarathne, T., Sultana, C. M., Lee, C., Malfatti, F., Cox, J. L., Pendergraft, M. A., Moore, K. A., Azam, F., Tivanski, A. V., Cappa, C. D., Bertram, T. H., Grassian, V. H., Prather K. A., and Stone, E. A.: Enrichment of saccharides and divalent cations in sea spray aerosol during two phytoplankton blooms, Environ. Sci. Technol., 50, 11511–11520, https://doi.org/10.1021/acs.est.6b02988, 2016.
Johnson, B. D., and Wangersky, P. J.: Microbubbles: stabilization by monolayers of adsorbed particles, J. Geophys. Res., 92, 14641–14647, https://doi.org/10.1029/JC092iC13p14641, 1987.
Kirpes, R. M., Bondy, A. L., Bonanno, D., Moffet, R. C., Wang, B., Laskin, A., Ault, A. P., and Pratt, K. A.: Secondary sulfate is internally mixed with sea spray aerosol and organic aerosol in the winter Arctic, Atmos. Chem. Phys., 18, 3937–3949, https://doi.org/10.5194/acp-18-3937-2018, 2018.
Kirpes, R. M., Bonanno, D., May, N. W., Fraund, M., Barget, A. J., Moffet, R. C., Ault, A. P., and Pratt, K. A.: Wintertime Arctic sea spray aerosol composition controlled by sea ice lead microbiology, ACS Cent. Sci., 5, 1760–1767, https://doi.org/10.1021/acscentsci.9b00541, 2019.
Krembs, C., Eicken, H., Junge, K., and Deming, J. W.: High concentrations of exopolymeric substances in Arctic winter sea ice: implications for the polar ocean carbon cycle and cryoprotection of diatoms, Deep-Sea Res. Pt. I, 49, 2163–2181, https://doi.org/10.1016/S0967-0637(02)00122-X, 2002.
Krnavek, L., Simpson, W. R., Carlson, D., Dominé, F., Douglas, T. A., and Sturm, M.: The chemical composition of surface snow in the Arctic: examining marine, terrestrial, and atmospheric influence, Atmos. Environ., 50, 349–359, https://doi.org/10.1016/j.atmosenv.2011.11.033, 2012.
Laskin, A. and Cowin, J. P.: Automated single particle SEM/EDX analysis of submicrometer particles down to 0.1 µm, Anal. Chem., 73, 1023–1029, 2001.
Laskin, A., Iedema, M. J., and Cowin, J. P.: Quantitative timeresolved monitoring of nitrate formation in sea salt particles using a CCSEM/EDX single particle analysis, Environ. Sci. Tech., 36, 4948–4955, 2002.
Leck, C. and Bigg, E. K.: Aerosol production over remote marine areas – A new route, Geophys. Res. Lett., 23, 3577–3581, https://doi.org/10.1029/1999GL010807, 1999.
Leck, C. and Svensson, E.: Importance of aerosol composition and mixing state for cloud droplet activation over the Arctic pack ice in summer, Atmos. Chem. Phys., 15, 2545–2568, https://doi.org/10.5194/acp-15-2545-2015, 2015.
Leck, C., Norman, M., Bigg, E. K., and Hillamo, R.: Chemical composition and sources of the high Arctic aerosol relevant for fog and cloud formation, J. Geophys. Res., 107, 4135, https://doi.org/10.1029/2001JD001463, 2002.
Levine, J. G., Yang, X., Jones, A. E., and Wolff, E. W.: Sea salt as an ice core proxy for past sea ice extent: A process-based model study, J. Geophys. Res., 119, 5737–5756, https://doi.org/10.1002/2013JD020925, 2014.
Lewis, E. R. and Schwartz, S. E.: Sea Salt Aerosol Production: Mechanisms, Methods, Measurements, and Models: A Critical Review, John Wiley & Sons, Inc., New York, NY, USA., ISBN: 978-0-875-90417-7, 2004.
Li, S. -M.: Particulate and snow nitrite in the spring arctic troposphere, Atmos. Environ., 27, 2959–2967, https://doi.org/10.1016/0960-1686(93)90328-V, 1993.
Li, L. and Pomeroy, J. W.: Estimates of threshold wind speeds for snow transport using meteorological data, J. Appl. Meteorol., 36, 205–213, https://doi.org/10.1175/1520-0450(1997)036<0205:EOTWSF>2.0.CO;2, 1997.
Loeb, N. A. and Kennedy, A.: Blowing snow at McMurdo station, Antarctica during the AWARE Field Campaign: Surface and ceilometer observations, J. Geophys. Res.-Atmos, 126, e2020JD033935, https://doi.org/10.1029/2020JD033935, 2021.
Macdonald, K. M., Sharma, S., Toom, D., Chivulescu, A., Platt, A., Elsasser, M., Huang, L., Leaitch, R., Chellman, N., McConnell, J. R., Bozem, H., Kunkel, D., Lei, Y. D., Jeong, C.-H., Abbatt, J. P. D., and Evans, G. J.: Temporally delineated sources of major chemical species in high Arctic snow, Atmos. Chem. Phys., 18, 3485–3503, https://doi.org/10.5194/acp-18-3485-2018, 2018.
Mann, G., Anderson, P., and Mobbs, S.: Profile measurements of blowing snow at Halley, Antarctica, J. Geophys. Res., 105, 24491–24508, https://doi.org/10.1029/2000JD900247, 2000.
May, N. W., Quinn, P. K., McNamara, S. M., and Pratt, K. A.: Multiyear study of the dependence of sea salt aerosol on wind speed and sea ice conditions in the coastal Arctic, J. Geophys. Res.-Atmos., 121, 9208–9219, https://doi.org/10.1002/2016jd025273, 2016.
McNamara, S. M., Raso, A. R. W., Wang, S., Thanekar, S., Boone, E. J., Kolesar, K. R., Peterson, P. K., Simpson, W. R., Fuentes, J. D., Shepson, P. B., and Pratt, K. A.: Springtime nitrogen oxide-influenced chlorine chemistry in the coastal Arctic, Environ. Sci. Technol., 53, 8057–8067, https://doi.org/10.1021/acs.est.9b01797, 2019.
Mellor, M: Cold Regions Science and Engineering, Part III, Section A3c.: Blowing Snow, US Army Material Command, Cold Regions Research and Engineering Laboratory, Hanover, NH, USA, 79 pp., https://doi.org/10.21236/ad0630328, 1965.
Millero, F. J., Feistel, R., Wright, D. G., and McDougall, T. J.: The composition of Standard Seawater and the definition of the Reference-Composition Salinity Scale, Deep-Sea Res. Pt. I, 55, 50–72, https://doi.org/10.1016/j.dsr.2007.10.001, 2008.
Magono, C., Endoh, T., Ueno, F., Kubota, S., and Itasaka, M.: Direct observations of aerosols attached to falling snow crystals, Tellus, 31, 102–114, https://doi.org/10.3402/tellusa.v31i2.10415, 1979.
Monahan, E. C. and O'Muircheartaigh, I. G.: Optimal power-law description of oceanic whitecap coverage dependence on wind speed, J. Phys. Oceanogr., 10, 2094–2099, https://doi.org/10.1175/1520-0485(1980)010<2094:OPLDOO>2.0.CO;2, 1980.
Monahan, E. C. and O'Muircheartaigh, I. G.: Whitecaps and the passive remote sensing of the ocean surface, Int. J. Remote Sens., 7, 627–642, https://doi.org/10.1080/01431168608954716, 1986.
Mori, T., Goto-Azuma, K., Kondo, Y., Ogawa-Tsukagawa, Y., Miura, K., Hirabayashi, M., Oshima, N., Koike, M., Kupiainen, K., Moteki, N., Ohata, S., Sinha, P. R., Sugiura, K., Aoki, T., Schneebeli, M., Steffen, K., Sato, A., Tsushima, A., Makarov, V., Omiya, S., Sugimoto, A., Takano, S., and Nagatsuka, N.: Black carbon and inorganic aerosols in Arctic snowpack, J. Geophys. Res.-Atmos., 124, 13325–13326, https://doi.org/10.1029/2019JD030623, 2019.
Murphy, D. M., Anderson, J. R., Quinn, P. K., Mclnnes, L. M., Posfai, M., Thomson, D. S., Buseck, P. R.: Influence of seasalt on aerosol radiative properties in the Southern Ocean marine boundary layer, Nature, 392, 62–65, https://doi.org/10.1038/32138, 1998.
Najafi, M. R., Zwiers, F. W., and Gillett N. P.: Attribution of Arctic temperature change to greenhouse-gas and aerosol influences, Nat. Clim. Change, 5, 246–249, https://doi.org/10.1038/NCLIMATE2524, 2015.
Nazarenko, Y., Rangel-Alvarado, R. B., Kos, G., Kurien, U., and Ariya, P. A.: Novel aerosol analysis approach for characterization of nanoparticulate matter in snow, Environ. Sci. Pollut. Res., 24, 4480–4493, https://doi.org/10.1007/s11356-016-8199-3, 2017.
Nilsson, E. D., Rannik, Ü., Swietlicki, E., Leck, C., Aalto, P. P., Zhou, J., and Norman, M.: Turbulent aerosol fluxes over the Arctic Ocean: 2. Wind-driven sources from the sea, J. Geophys. Res., 106, 32139–32154, https://doi.org/10.1029/2000JD900747, 2001.
Nishimura, K., Yokoyama, C., Ito, Y., Nemoto, M., Naaim-Bouvet, F., Bellot, H. and Fujita, K.: Snow particle speeds in drifting snow, J. Geophys. Res.-Atmos., 119, 9901–9913, https://doi.org/10.1002/2014JD021686, 2014.
Nishimura, K. and Nemoto, M.: Blowing snow at Mizuho station, Antarctica, Phil. Trans. R. Soc. A, 363, 1647–1662, https://doi.org/10.1098/rsta.2005.1599, 2005.
Norris, S. J., Brooks, I. M., de Leeuw, G., Sirevaag, A., Leck, C., Brooks, B. J., Birch, C. E., and Tjernström, M.: Measurements of bubble size spectra within leads in the Arctic summer pack ice, Ocean Sci., 7, 129–139, https://doi.org/10.5194/os-7-129-2011, 2011.
Olson, N. E., Lei, Z. Y., Craig, R. L., Zhang, Y., Chen, Y. Z., Lambe, A. T., Zhang, Z. F., Gold, A., Surratt, J. D., and Ault, A. P.: Reactive uptake of isoprene epoxydiols increases the viscosity of the core of phase-separated aerosol particles, ACS Earth Space Chem., 3, 1402–1414, https://doi.org/10.1021/acsearthspacechem.9b00138, 2019.
Peterson, P. K., Pöhler, D., Sihler, H., Zielcke, J., General, S., Frieß, U., Platt, U., Simpson, W. R., Nghiem, S. V., Shepson, P. B., Stirm, B. H., Dhaniyala, S., Wagner, T., Caulton, D. R., Fuentes, J. D., and Pratt, K. A.: Observations of bromine monoxide transport in the Arctic sustained on aerosol particles, Atmos. Chem. Phys., 17, 7567–7579, https://doi.org/10.5194/acp-17-7567-2017, 2017.
Peterson, P. K., Hartwig, M., May, N. W., Schwartz, E., Rigor, I., Ermold, W., Steele, M., Morison, J. H., Nghiem, S., and Pratt, K. A.: Snowpack measurements suggest role for multi-year sea ice regions in Arctic atmospheric bromine and chlorine chemistry, Elem. Sci. Anth., 7, 045007, https://doi.org/10.1525/elementa.352, 2019.
Pomeroy, J. W., Davies, T. D., and Tranter, M.: The impact of blowing snow on snow chemistry, in: Seasonal Snowpacks, NATO ASI Series, edited by: Davies, T. D., Tranter, M., and Jones, H. G., Springer, Berlin, Heidelberg, 71–113, https://doi.org/10.1007/978-3-642-75112-7_4, 1991.
Quinn, P. K., Miller, T. L., Bates, T. S., Ogren, J. A., Andrews, E., and Shaw, G. E.: A 3-year record of simultaneously measured aerosol chemical and optical properties at Barrow, Alaska, J. Geophys. Res.-Atmos., 107, 4130, https://doi.org/10.1029/2001JD001248, 2002.
Quinn, P. K., Shaw, G., Andrews, E., Dutton, E. G., Ruoho-Airola, T., and Gong, S. L.: Arctic haze: current trends and knowledge gaps, Tellus B, 59, 99–114, https://doi.org/10.1111/j.1600- 0889.2006.00238.x, 2007.
Quinn, P. K., Collins, D. B., Grassian, V. H., Prather, K. A., and Bates, T. S.: Chemistry and related properties of freshly emitted sea spray aerosol, Chem. Rev., 115, 4383–4399, https://doi.org/10.1021/cr500713g, 2015.
Quinn, P. K., Coffman, D. J., Johnson, J. E., Upchurch, L. M., and Bates, T. S.: Small fraction of marine cloud condensation nuclei made up of sea spray aerosol, Nat. Geosci., 10, 674–679, https://doi.org/10.1038/ngeo3003, 2017.
Radke, L. F., Hobbs, P. V., and Pinnons, J. E.: Observations of cloud condensation nuclei, sodium-containing particles, ice nuclei and the light-scattering coefficient near Barrow, Alaska, J. Appl. Meteorol., 15, 982–995, https://doi.org/10.1175/1520- 0450(1976)0152.0.Co;2, 1976.
Riemer, N., Ault, A. P., West, M., Craig, R. L., and Curtis, J. H.: Aerosol Mixing State: Measurements, Modeling, and Impacts, Rev. Geophys., 57, 187–249, https://doi.org/10.1029/2018RG000615, 2019.
Rhodes, R. H., Yang, X., Wolff, E. W., McConnell, J. R., and Frey, M. M.: Sea ice as a source of sea salt aerosol to Greenland ice cores: a model-based study, Atmos. Chem. Phys., 17, 9417–9433, https://doi.org/10.5194/acp-17-9417-2017, 2017.
Roscoe, H. K., Brooks, B., Jackson, A. V., Smith, M. H., Walker, S. J., Obbard, R. W., and Wolff, E. W.: Frost flowers in the laboratory: Growth, characteristics, aerosol, and the underlying sea ice, J. Geophys. Res., 116, D12301, https://doi.org/10.1029/2010JD015144, 2011.
Ryu, S. Y., Kim, J. E., Zhuanshi, H., Kim, Y. J., and Kang, G. U.: Chemical composition of post-harvest biomass burning aerosols in Gwangju, Korea, J. Air Waste Manage., 54, 1124–1137, https://doi.org/10.1080/10473289.2004.10471018, 2004.
Salter, M. E., Hamacher-Barth, E., Leck, C., Werner, J., Johnson, C. M., Riipinen, I., Nilsson, E. D., and Zieger, P.: Calcium enrichment in sea spray aerosol particles, Geophys. Res. Lett., 43, 8277–8285, https://doi.org/10.1002/2016GL070275, 2016.
Sato, T., Kosugi, K., Mochizuki, S., and Nemoto, M.: Wind speed dependences of fracture and accumulation of snowflakes on snow surface, Cold Reg. Sci. Technol., 51, 229–239, https://doi.org/10.1016/j.coldregions.2007.05.004, 2008.
Schmidt, R. A.: Estimates of threshold windspeed from particle sizes in blowing snow, Cold Reg. Sci. Technol., 4, 187–193, https://doi.org/10.1016/0165-232x(81)90003-3, 1981.
Schmidt, R. A.: Vertical profiles of wind speed, snow concentration, and humidity in blowing snow, Bound. Lay. Meteorol., 23, 223–246, https://doi.org/10.1007/BF00123299, 1982.
Scott, W. D. and Levin, Z.: Open channels in sea ice (leads) as ion sources, Science, 177, 425–426, https://doi.org/10.1126/science.177.4047.425, 1972.
Seinfeld, J. H. and Pandis, S. N.: Atmospheric chemistry and physics: from air pollution to climate change, 3rd Edition, John Wiley & Sons, Inc., ISBN: 978-1-118-94740-1, 2016.
Shaw, G. E.: Evidence for a central Eurasian source area of Arctic haze in Alaska, Nature, 299, 815–818, https://doi.org/10.1038/299815a0, 1982.
Shaw, P. M., Russell, L. M., Jefferson, A., and Quinn, P. K.: Arctic organic aerosol measurements show particles from mixed combustion in spring haze and from frost flowers in winter, Geophys. Res. Lett., 37, L10803, https://doi.org/10.1029/2010GL042831, 2010.
Shindell, D., Faluvegi, G., Lacis, A., Hansen, J., Ruedy, R., and Aguilar, E.: The role of tropospheric ozone increases in 20th century climate change, J. Geophys. Res., 111, D08302, https://doi.org/10.1029/2005JD006348, 2006.
Shindell, D.: Local and remote contributions to Arctic warming, Geophys. Res. Lett., 34, L14704, https://doi.org/10.1029/2007GL030221, 2007.
Shindell, D. and Faluvegi, G.: Climate response to regional radiative forcing during the twentieth century, Nat. Geosci., 2, 294–300, https://doi.org/10.1038/ngeo473, 2009.
Simpson, W. R., Alvarez-Aviles, L., Douglas, T. A., Sturm, M., and Domine, F.: Halogens in the coastal snow pack near Barrow, Alaska: Evidence for active bromine air-snow chemistry during springtime, Geophys. Res. Lett., 32, L04811, https://doi.org/10.1029/2004GL021748, 2005.
Sobanska, S., Falgayrac, G., Rimetz-Planchon, J., Perdrix, E., Bremard, C., and Barbillat, J.: Resolving the internal structure of individual atmospheric aerosol particle by the combination of Atomic Force Microscopy, ESEM-EDX, Raman and ToF-SIMS imaging, Microchem. J., 114, 89–98, https://doi.org/10.1016/j.microc.2013.12.007, 2014.
Struthers, H., Ekman, A. M. L., Glantz, P., Iversen, T., Kirkevåg, A., Mårtensson, E. M., Seland, Ø., and Nilsson, E. D.: The effect of sea ice loss on sea salt aerosol concentrations and the radiative balance in the Arctic, Atmos. Chem. Phys., 11, 3459–3477, https://doi.org/10.5194/acp-11-3459-2011, 2011.
Sturm, M. and Stuefer, S.: Wind-blown flux rates derived from drifts at arctic snow fences, J. Glaciol., 59, 21–34, https://doi.org/10.3189/2013JoG12J110, 2013.
Tabler, R. D., Pomeroy, J. W., and Santana, B. W.: Drifting snow, in: Cold Regions Hydrology and Hydraulics, Technical Council on Cold Regions Engineering Monograph, edited by: Ryan, W. L. and Crissman, R. D., American Society of Civil Engineers, New York, 95–145, ISBN: 978-0872627734, 1990.
Wagenbach, D., Ducroz, F., Mulvaney, R., Keck, L., Minikin, A., Legrand, M., Hall, J. S., and Wolff, E. W.: Sea-salt aerosol in coastal Antarctic regions, J. Geophys. Res.-Atmos., 103, 10961–10974, https://doi.org/10.1029/97jd01804, 1998.
Wang, Q., Danilov, S., Jung, T., Kaleschke, L., and Wernecke, A.: Sea ice leads in the Arctic Ocean: Model assessment, interannual variability and trends, Geophys. Res. Lett., 43, 7019–7027, https://doi.org/10.1002/2016GL068696, 2016.
Webster, M. A., Rigor, I. G., Nghiem, S. V., Kurtz, N. T., Farrell, S. L., Perovich, D. K., and Sturm, M.: Interdecadal changes in snow depth on Arctic sea ice, J. Geophys. Res.-Ocean., 119, 5395–5406, https://doi.org/10.1002/2014JC009985, 2014.
Wernecke, A. and Kaleschke, L.: Lead detection in Arctic sea ice from CryoSat-2: quality assessment, lead area fraction and width distribution, The Cryosphere, 9, 1955–1968, https://doi.org/10.5194/tc-9-1955-2015, 2015.
Whitehead, J. D., Dorsey, J. R., Gallagher, M. W., Flynn, M. J., McFiggans, G., and Carpenter, L. J.: Particle fluxes and condensational uptake over sea ice during COBRA, J. Geophys. Res., 117, D15202, https://doi.org/10.1029/2012JD017798, 2012.
Willeke, K. and Baron, P. A.: Aerosol Measurement: Principles, Techniques and Applications, Van Nostrand Reinhold Inc., New York, 876 pp., ISBN: 0-442-00486-9, 1992.
Williams, J., de Reus, M., Krejci, R., Fischer, H., and Ström, J.: Application of the variability-size relationship to atmospheric aerosol studies: estimating aerosol lifetimes and ages, Atmos. Chem. Phys., 2, 133–145, https://doi.org/10.5194/acp-2-133-2002, 2002.
Willis, M. D., Leaitch, W. R., and Abbatt, J. P. D.: Processes controlling the composition and abundance of Arctic aerosol, Rev. Geophys., 56, 621–671, https://doi.org/10.1029/2018RG000602, 2018.
Wolff, E. W., Rhodes, R. H., and Legrand, M.: Sea salt in PolarRegions, in: Advances in Atmospheric Chemistry, Vol. 3: Chemistry in the Cryosphere, 365–410, World Scientific Publishing Co., Inc., Hackensack, New Jersey, USA, https://doi.org/10.1142/9789811230134_0007, 2022.
Xiao, J., Bintanja, R., Déry, S. J., Mann, G. W., and Taylor, P. A.: An intercomparison among four models of blowing snow, Bound. Lay. Meteorol., 97, 109–135, https://doi.org/10.1023/A:1002795531073, 2000.
Yang, X., Pyle, J. A., and Cox, R. A.: Sea salt aerosol production and bromine release: Role of snow on sea ice, Geophys. Res. Lett., 35, L16815, https://doi.org/10.1029/2008GL034536, 2008.
Yang, X., Pyle, J. A., Cox, R. A., Theys, N., and Van Roozendael, M.: Snow-sourced bromine and its implications for polar tropospheric ozone, Atmos. Chem. Phys., 10, 7763–7773, https://doi.org/10.5194/acp-10-7763-2010, 2010.
Yang, X., Nedela, V., Runštuk, J., Ondrušková, G., Krausko, J., Vetráková, Ä., and Heger, D.: Evaporating brine from frost flowers with electron microscopy and implications for atmospheric chemistry and sea-salt aerosol formation, Atmos. Chem. Phys., 17, 6291–6303, https://doi.org/10.5194/acp-17-6291-2017, 2017.
Yang, X., Frey, M. M., Rhodes, R. H., Norris, S. J., Brooks, I. M., Anderson, P. S., Nishimura, K., Jones, A. E., and Wolff, E. W.: Sea salt aerosol production via sublimating wind-blown saline snow particles over sea ice: parameterizations and relevant microphysical mechanisms, Atmos. Chem. Phys., 19, 8407–8424, https://doi.org/10.5194/acp-19-8407-2019, 2019.
Zábori, J., Krejci, R., Ekman, A. M. L., Mårtensson, E. M., Ström, J., de Leeuw, G., and Nilsson, E. D.: Wintertime Arctic Ocean sea water properties and primary marine aerosol concentrations, Atmos. Chem. Phys., 12, 10405–10421, https://doi.org/10.5194/acp-12-10405-2012, 2012.