the Creative Commons Attribution 4.0 License.
the Creative Commons Attribution 4.0 License.
 | 28 Nov 2022
Enhanced sulfur in the upper troposphere and lower stratosphere in spring 2020
Laura Tomsche
Andreas Marsing
Tina Jurkat-Witschas
Johannes Lucke
Stefan Kaufmann
Katharina Kaiser
Johannes Schneider
Monika Scheibe
Hans Schlager
Lenard Röder
Horst Fischer
Florian Obersteiner
Andreas Zahn
Martin Zöger
Jos Lelieveld
Christiane Voigt
Sulfur compounds in the upper troposphere and lower stratosphere (UTLS) impact the atmosphere radiation budget, either directly as particles or indirectly as precursor gas for new particle formation. In situ measurements in the UTLS are rare but are important to better understand the impact of the sulfur budget on climate. The BLUESKY mission in May and June 2020 explored an unprecedented situation. (1) The UTLS experienced extraordinary dry conditions in spring 2020 over Europe, in comparison to previous years, and (2) the first lockdown of the COVID-19 pandemic caused major emission reductions from industry, ground, and airborne transportation. With the two research aircraft HALO and Falcon, 20 flights were conducted over central Europe and the North Atlantic to investigate the atmospheric composition with respect to trace gases, aerosol, and clouds. Here, we focus on measurements of sulfur dioxide (SO2) and particulate sulfate (SO) in the altitude range of 8 to 14.5 km which show unexpectedly enhanced mixing ratios of SO2 in the upper troposphere and of SO in the lowermost stratosphere. In the UT, we find SO2 mixing ratios of (0.07±0.01) ppb, caused by the remaining air traffic, and reduced SO2 sinks due to low OH and low cloud fractions and to a minor extent by uplift from boundary layer sources. Particulate sulfate showed elevated mixing ratios of up to 0.33 ppb in the LS. We suggest that the eruption of the volcano Raikoke in June 2019, which emitted about 1 Tg SO2 into the stratosphere in northern midlatitudes, caused these enhancements, in addition to Siberian and Canadian wildfires and other minor volcanic eruptions. Our measurements can help to test models and lead to new insights in the distribution of sulfur compounds in the UTLS, their sources, and sinks. Moreover, these results can contribute to improving simulations of the radiation budget in the UTLS with respect to sulfur effects.
- Article
(4790 KB) - Full-text XML
- BibTeX
- EndNote


The stratospheric aerosol layer changes over time. The aerosol layer becomes more pronounced after volcanic eruptions, with plume injection high into the stratosphere (Kremser et al., 2016). It plays a role in the radiative balance and thus impacts the climate (Solomon et al., 2011). An enhanced aerosol concentration leads to a larger albedo. The geoengineering community investigates the enhancement of the aerosol layer with injections of sulfur compounds into the stratosphere to partly counteract greenhouse gases related global warming (Crutzen, 2006; Schäfer et al., 2015). The stratospheric aerosol layer is often referred to as the “Junge layer” and can extend from the tropopause up to 25 km (Junge et al., 1961). The chemical composition of the stratospheric aerosol layer is dominated by sulfate (SO) particles, which consist mainly of pure sulfuric acid droplets, sulfuric acid with material from ablated meteoroids, or mixed organic–sulfate particles (Murphy et al., 2014; Cziczo et al., 2001; Schneider et al., 2021). During volcanic quiescent periods, precursor gases, like carbonyl sulfide (OCS), and non-volcanic sulfur dioxide (SO2), as well as tropospheric SO particles, preserve the stratospheric layer (Brock et al., 1995). Due to its long lifetime, OCS is vertically uplifted from the tropics into the stratosphere, and there it converts mostly through photodissociation to SO2 (Sheng et al., 2015). The SO2 chemistry and transport depends strongly on the ambient conditions. In the free troposphere and lower stratosphere, SO2 reacts predominantly with hydroxyl (OH) to form sulfuric acid (H2SO4) (English et al., 2011; Stockwell and Calvert, 1983); thus, the lifetime correlates with the OH concentration. At cold temperatures and in the presence of water vapor, the gaseous H2SO4 condenses quickly to particles (Almeida et al., 2013; Kirkby et al., 2011), thereby forming sulfate aerosol. In the boundary layer, pollution could significantly reduce the lifetime to hours (Lee et al., 2011) and, consequently, also the transport of SO2 to higher altitudes. Clouds could also limit the SO2 lifetime to hours or days (Lelieveld, 1993), as the conversion of SO2 to H2SO4 is faster in cloud droplets than in the gas phase (Seinfeld and Pandis, 2006). Nevertheless, SO2 can be transported from the planetary boundary layer (PBL) into the UTLS region via different pathways. Similar to OCS, SO2 can be vertically transported across the tropical tropopause layer (TTL) or by overshooting convection in the tropics (Fueglistaler et al., 2009) or by the transport of SO2 in a warm conveyor belt (WCB) in the midlatitudes (Arnold et al., 1997; Clarisse et al., 2011; Fiedler et al., 2009) or by transport processes connected with the Asian monsoon (Gottschaldt et al., 2017, 2018; Ploeger et al., 2017; Tomsche et al., 2019; Vogel et al., 2019; von Hobe et al., 2021).
An explosive volcanic eruption can inject huge amounts of ash, SO2, and other volcanic gases into the stratosphere and thus enhance the stratospheric aerosol layer (Kremser et al., 2016). In 1991, the volcano Mount Pinatubo (15∘ N) emitted approximately 20 Tg of SO2 and 30 Tg of aerosol (McCormick et al., 1995), which impacted the stratosphere globally. Volcanic eruptions in midlatitudes can also impact the stratosphere, e.g., Mount St. Helens (46∘ N, 0.8 Tg SO2) in 1980, but its impact vanished in about a year (Deshler et al., 2006). One recent midlatitude eruption of similar strength was the volcano Raikoke in June 2019 (48.28∘ N, Kloss et al., 2021; de Leeuw et al., 2021), which emitted approx. 1.4–1.6 Tg SO2. A further important source of stratospheric aerosol is intense wildfires, which can potentially develop pyrocumulonimbus (pyroCb) and thus transport biomass burning emissions into the UTLS (Fromm et al., 2005; Peterson et al., 2018). Moreover, air traffic is another source of particles and precursor gases in the UTLS (Lee et al., 2010; Voigt et al., 2010; Jurkat et al., 2011).
In late spring 2020, the UTLS region was probed over Europe during the BLUESKY mission, the period covered the first weeks of the coronavirus disease 2019 (COVID-19) lockdown in Europe, which caused reductions in emissions from industry, ground, and especially airborne transportation (Voigt et al., 2022). Under these conditions, we found enhanced values of SO2 in the upper troposphere (UT) and of particulate SO in the lowermost stratosphere (LS), which motivated us to investigate these sulfur compounds with respect to their sources and sinks.
In the following, we first present the BLUESKY mission in Sect. 2. In Sect. 3.1 we introduce the airborne measurements and in Sect. 3.2 the trace gas and particulate profiles obtained during BLUESKY and also show tropospherically and stratospherically influenced compounds in tracer–tracer correlations (Sect. 3.3). Afterwards, we focus on the SO2 profile in the UT (Sect. 4) and continue in Sect. 5 with the stratospheric sulfate aerosol. Finally, we summarize our results and give an outlook in Sect. 6.
2.1 BLUESKY mission
The BLUESKY mission was led by the German Aerospace Center (DLR) and the Max Planck Institute for Chemistry, Mainz. Coordinated flights were performed from Oberpfaffenhofen with the High Altitude and Long Range Research Aircraft HALO and the DLR Falcon over Europe and the North Atlantic between 16 May and 9 June 2020. In total 20 flights were performed (Fig. 1). The period covered the first weeks of the COVID-19 lockdown in Europe and thus offered a unique opportunity to investigate an unprecedented situation of reduced anthropogenic emissions from industry, ground, and airborne transportation. The goal of BLUESKY was to explore the changes in the atmospheric composition and gain new insights on how anthropogenic emissions perturb chemical and physical processes in the atmosphere. Both aircraft were equipped with in situ instruments to investigate trace gases, aerosols, and cloud properties. The payload of both aircraft was complementary to obtain a comprehensive data set. In particular, during five days with coordinated flights over Germany (23, 26, and 28 May) and over the North Atlantic (30 May, 2 June), the payload offered the opportunity to probe the air masses in more detail. An overview of the BLUESKY mission is given in Voigt et al. (2022), and further detailed studies are published by Schumann et al. (2021a, b), Reifenberg et al. (2022), Nussbaumer et al. (2022), Hamryszczak et al. (2022), and Krüger et al. (2022). In the present study we will focus on the sulfur compounds in the upper troposphere and lower stratosphere.
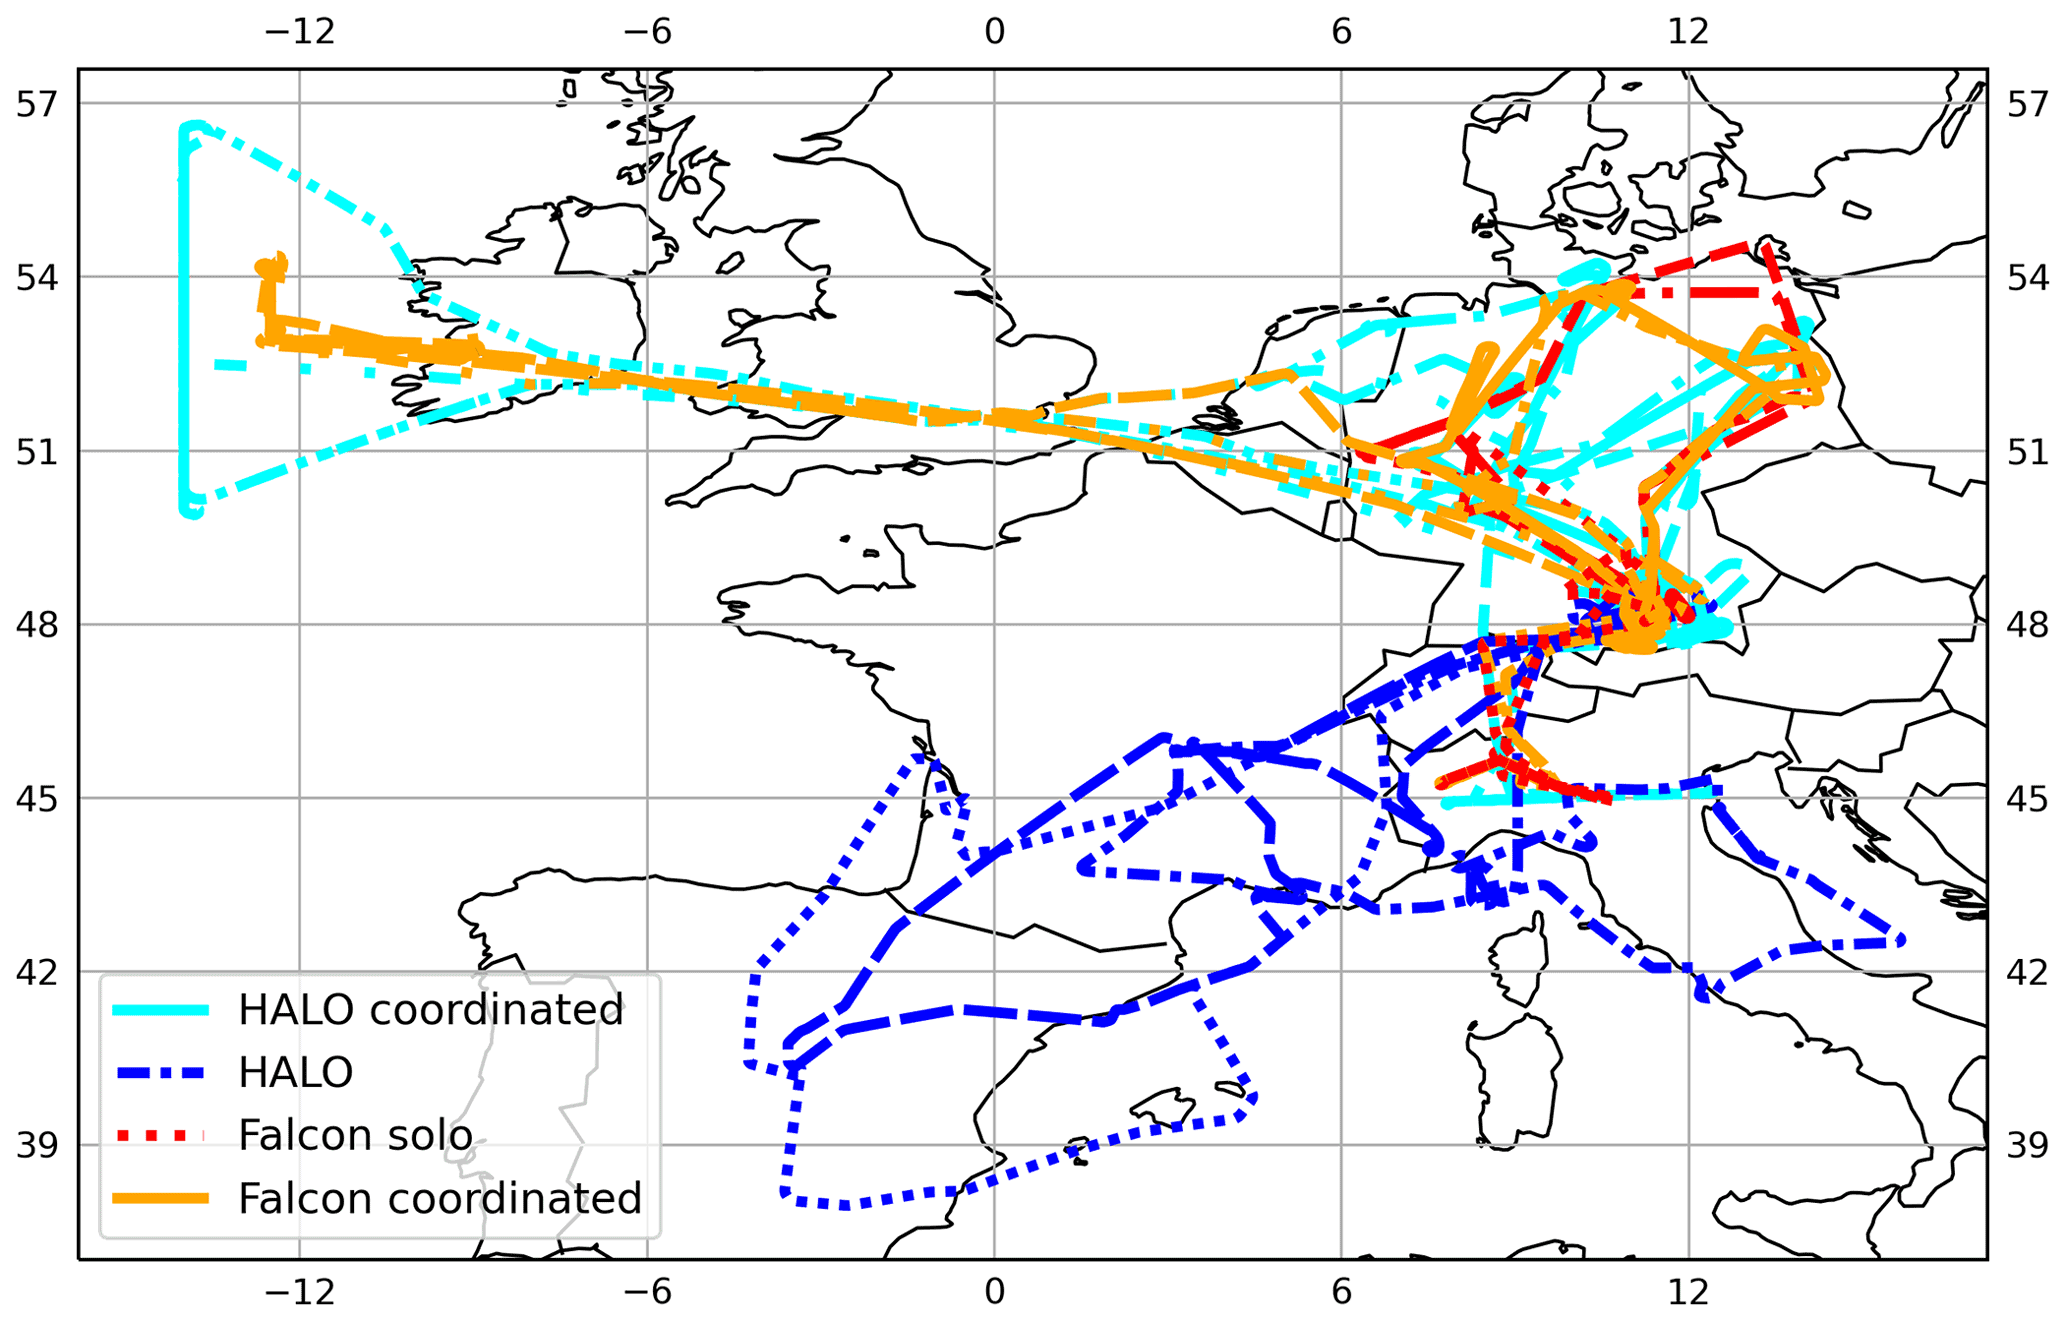
Figure 1Overview of all flight tracks performed by Falcon (red) and HALO (blue) during the BLUESKY mission in May and June 2020 during the COVID-19 lockdown. Coordinated flights (Falcon: orange; HALO: cyan) were performed over Germany on 23, 26, and 28 May and twice (30 May and 2 June) as both aircraft headed towards the North Atlantic, west of Ireland.
2.2 Instrumentation
In the present study several trace gas measurements on board Falcon and also trace gas and particle measurements on board HALO are used. On board Falcon, the atmospheric chemical ionization mass spectrometer AIMS measures gaseous SO2 and nitric acid (HNO3) among other compounds at mixing ratios relevant for the UTLS region by using SF as reagent ion. A more detailed description of the instrument can be found elsewhere (Voigt et al., 2014; Jurkat et al., 2016; Marsing et al., 2019). SO2 is calibrated in-flight using an isotopically labeled calibration gas mixture of the isotope 34SO2, which is heavier than the naturally dominant isotope 32SO2 but has the same chemical behavior (Jurkat et al., 2016). The natural isotopic ratio is = 0.0454, and the mass spectrometer can detect both isotopes separately as they differ in mass by 2 amu (atomic mass units). This has the advantage that the calibration gas can be continuously added to the sampling flow and the system is well conditioned for SO2. A drawback is that the background of the instrument is increased by 5 %, due to impurities of 32SO2 in the calibration gas. The SO2 data are corrected for the instrumental background, which includes a moisture correction, as higher water vapor concentrations lead to cross sensitivities on amu (FSO; Jurkat et al., 2016). With increasing moisture in lower altitudes, a correction is more difficult and reduces the data quality. As the focus of the present study is the UTLS region, we limited our analysis on altitudes above 8 km and thus ensure the data quality. The other trace gas measured by AIMS is HNO3, which is in-flight calibrated using a permeation oven with a solution of HNO3 in water (Jurkat et al., 2014). The data are background corrected including a moisture correction, which is necessary to account for cross sensitivities caused by water vapor (Jurkat et al., 2016). The AIMS measurements were performed with a 1.6 s time resolution and smoothed with a running mean of 20 s. The 1σ detection limit of SO2 varied between 0.006–0.017 ppb. The total uncertainty is on average 22.7 % for SO2 and included the uncertainty of the moisture correction. The 1σ detection limit for HNO3 is in the range of 0.005–0.009 ppb. The HNO3 total uncertainty is on average 16 % (Marsing, 2021). Further measurements on board Falcon included CO and O3. O3 was measured using a UV photometer (Schulte and Schlager, 1996; Ziereis et al., 2000), CO was measured by cavity ring-down spectroscopy (Klausner et al., 2020). The accuracies for CO and O3 are 15 % and 5 %, respectively. Additionally, water vapor (H2O) was measured with the Lyman-alpha absorption instrument integrated in the meteorological sensor system.
On board HALO, the compact time-of-flight aerosol mass spectrometer (C-ToF-AMS) measured the aerosol composition (Drewnick et al., 2005; Schmale et al., 2010; Schulz et al., 2018). Aerosol particles of approximately 50 to 800 nm are analyzed, which then provides quantitative mass concentrations of organic matter, sulfate, nitrate, and ammonium. The instrument is equipped with a constant pressure inlet that ensures a steady mass flow and an operation pressure of the aerodynamic lens for stable in-flight operation (Molleker et al., 2020). Here, we focus on sulfate. For a better comparability of SO with SO2, we calculate mixing ratios (ppb) instead of using concentrations (µg m−3). Additionally, mixing ratios have the advantage of being pressure independent. We assumed that all SO would be evaporated and calculated the volumetric mixing ratio for SO. Above 8 km, the 1σ detection limit is (0.006±0.001) ppb for SO, the accuracy is 30 %, and the precision on average is (0.002±0.001) ppb (Schulz et al., 2018). Additionally, the trace gases CO and O3 on board HALO are considered in the present study for altitudes above 8 km. CO was measured by the TRacer In Situ TDLAS for Atmospheric Research (TRISTAR; Schiller et al., 2008) with a total uncertainty of 3 % for tropospheric measurements (Nussbaumer et al., 2022). Note that due to a small nitrous oxide (N2O) interference the uncertainty in the lower stratosphere is higher (8.5±3.9 ppbv). O3 was measured by the Fast Airborne Ozone instrument FAIRO, which combines the technique of a UV photometer and a chemiluminescence detector (Zahn et al., 2012), and the total uncertainty of O3 was 2 %–2.5 %. Water vapor was measured with the tunable diode laser (TDL) hygrometer SHARC (Sophisticated Hygrometer for Atmospheric ResearCh).
SO2 was sampled on board Falcon, and SO was probed on board HALO. Nevertheless, campaign averaged CO and O3 profiles from both aircraft agree and motivate the combined interpretation of the SO2 and SO distributions during spring 2020 (see Sect. 3.2).
2.3 Trajectory calculations
Back-trajectory calculations were performed using the HYSPLIT atmospheric transport and dispersion model (Stein et al., 2015; Rolph et al., 2017) with the GDAS (Global Data Assimilation System) meteorological data set (Kanamitsu, 1989). For selected cases with either elevated SO2 or SO mixing ratios, 360 h back-trajectory ensembles were calculated. One ensemble consists of 27 single trajectories, which are offset by one meteorological grid point in the horizontal and 0.01σ in the vertical coordinate. With the help of the back trajectories, air mass origins and transport pathways in the atmosphere could be identified.
3.1 Trace gases along flight track
On 2 June 2020, HALO and Falcon took off in Oberpfaffenhofen and headed towards the North Atlantic, west of Ireland, with similar flight tracks, altitude, and similar takeoff time. With a shorter flight range, Falcon landed in Shannon, Ireland, to refuel, while HALO continued its flight. In Fig. 2, flight altitude and in situ measurements are plotted against longitude for comparability from both aircraft for the time between 07:00 and 10:00 UTC. O3 and CO were measured aboard both aircraft. Both trace gases show similar patterns independent of the aircraft. The highest O3 mixing ratios with maxima of 475 ppb (Falcon) and 423 ppb (HALO) were approximately between 6∘ W and 3∘ E, while CO had the lowest mixing ratios of 18 ppb (Falcon) and 28 ppb (HALO). Along the longitudes outside of the pervious mentioned range, the trace gases showed an opposite behaviour: when CO mixing ratios were enhanced with maxima of 110 ppb (Falcon) and 109 ppb (HALO), O3 mixing ratios were low (Falcon: 74 ppb; HALO: 62 ppb). Because CO and O3 from both platforms agree within their uncertainties and reflect the same trends, we assume that both aircraft probed the same air mass. Between 6∘ W and 3∘ E, O3 and HNO3 are positively correlated, as expected, and HNO3 mixing ratios increase up to 1.6 ppb. A similar trend can be observed in the particulate compound SO, which also is enhanced when O3, as a stratospheric tracer, is enhanced. SO ranges from the detection limit to 0.21 ppb. SO2 mixing ratios show a larger variability, but in general they follow CO, which is a tropospheric tracer (Fischer et al., 2000; Hoor et al., 2002). SO2 ranges from the detection limit to 0.15 ppb and experiences one short peak with 0.15 ppb around 6.5∘ W at an altitude of 11.9 km. Other trace gases on board Falcon measured 266 ppb O3, 70 ppb CO, and 0.8 ppb HNO3 during this event, but beside HNO3, which increased slightly, CO and O3 showed no perturbations around this location. An in-depth analysis and discussion on potential explanations for this or similar features is presented in Sect. 4.
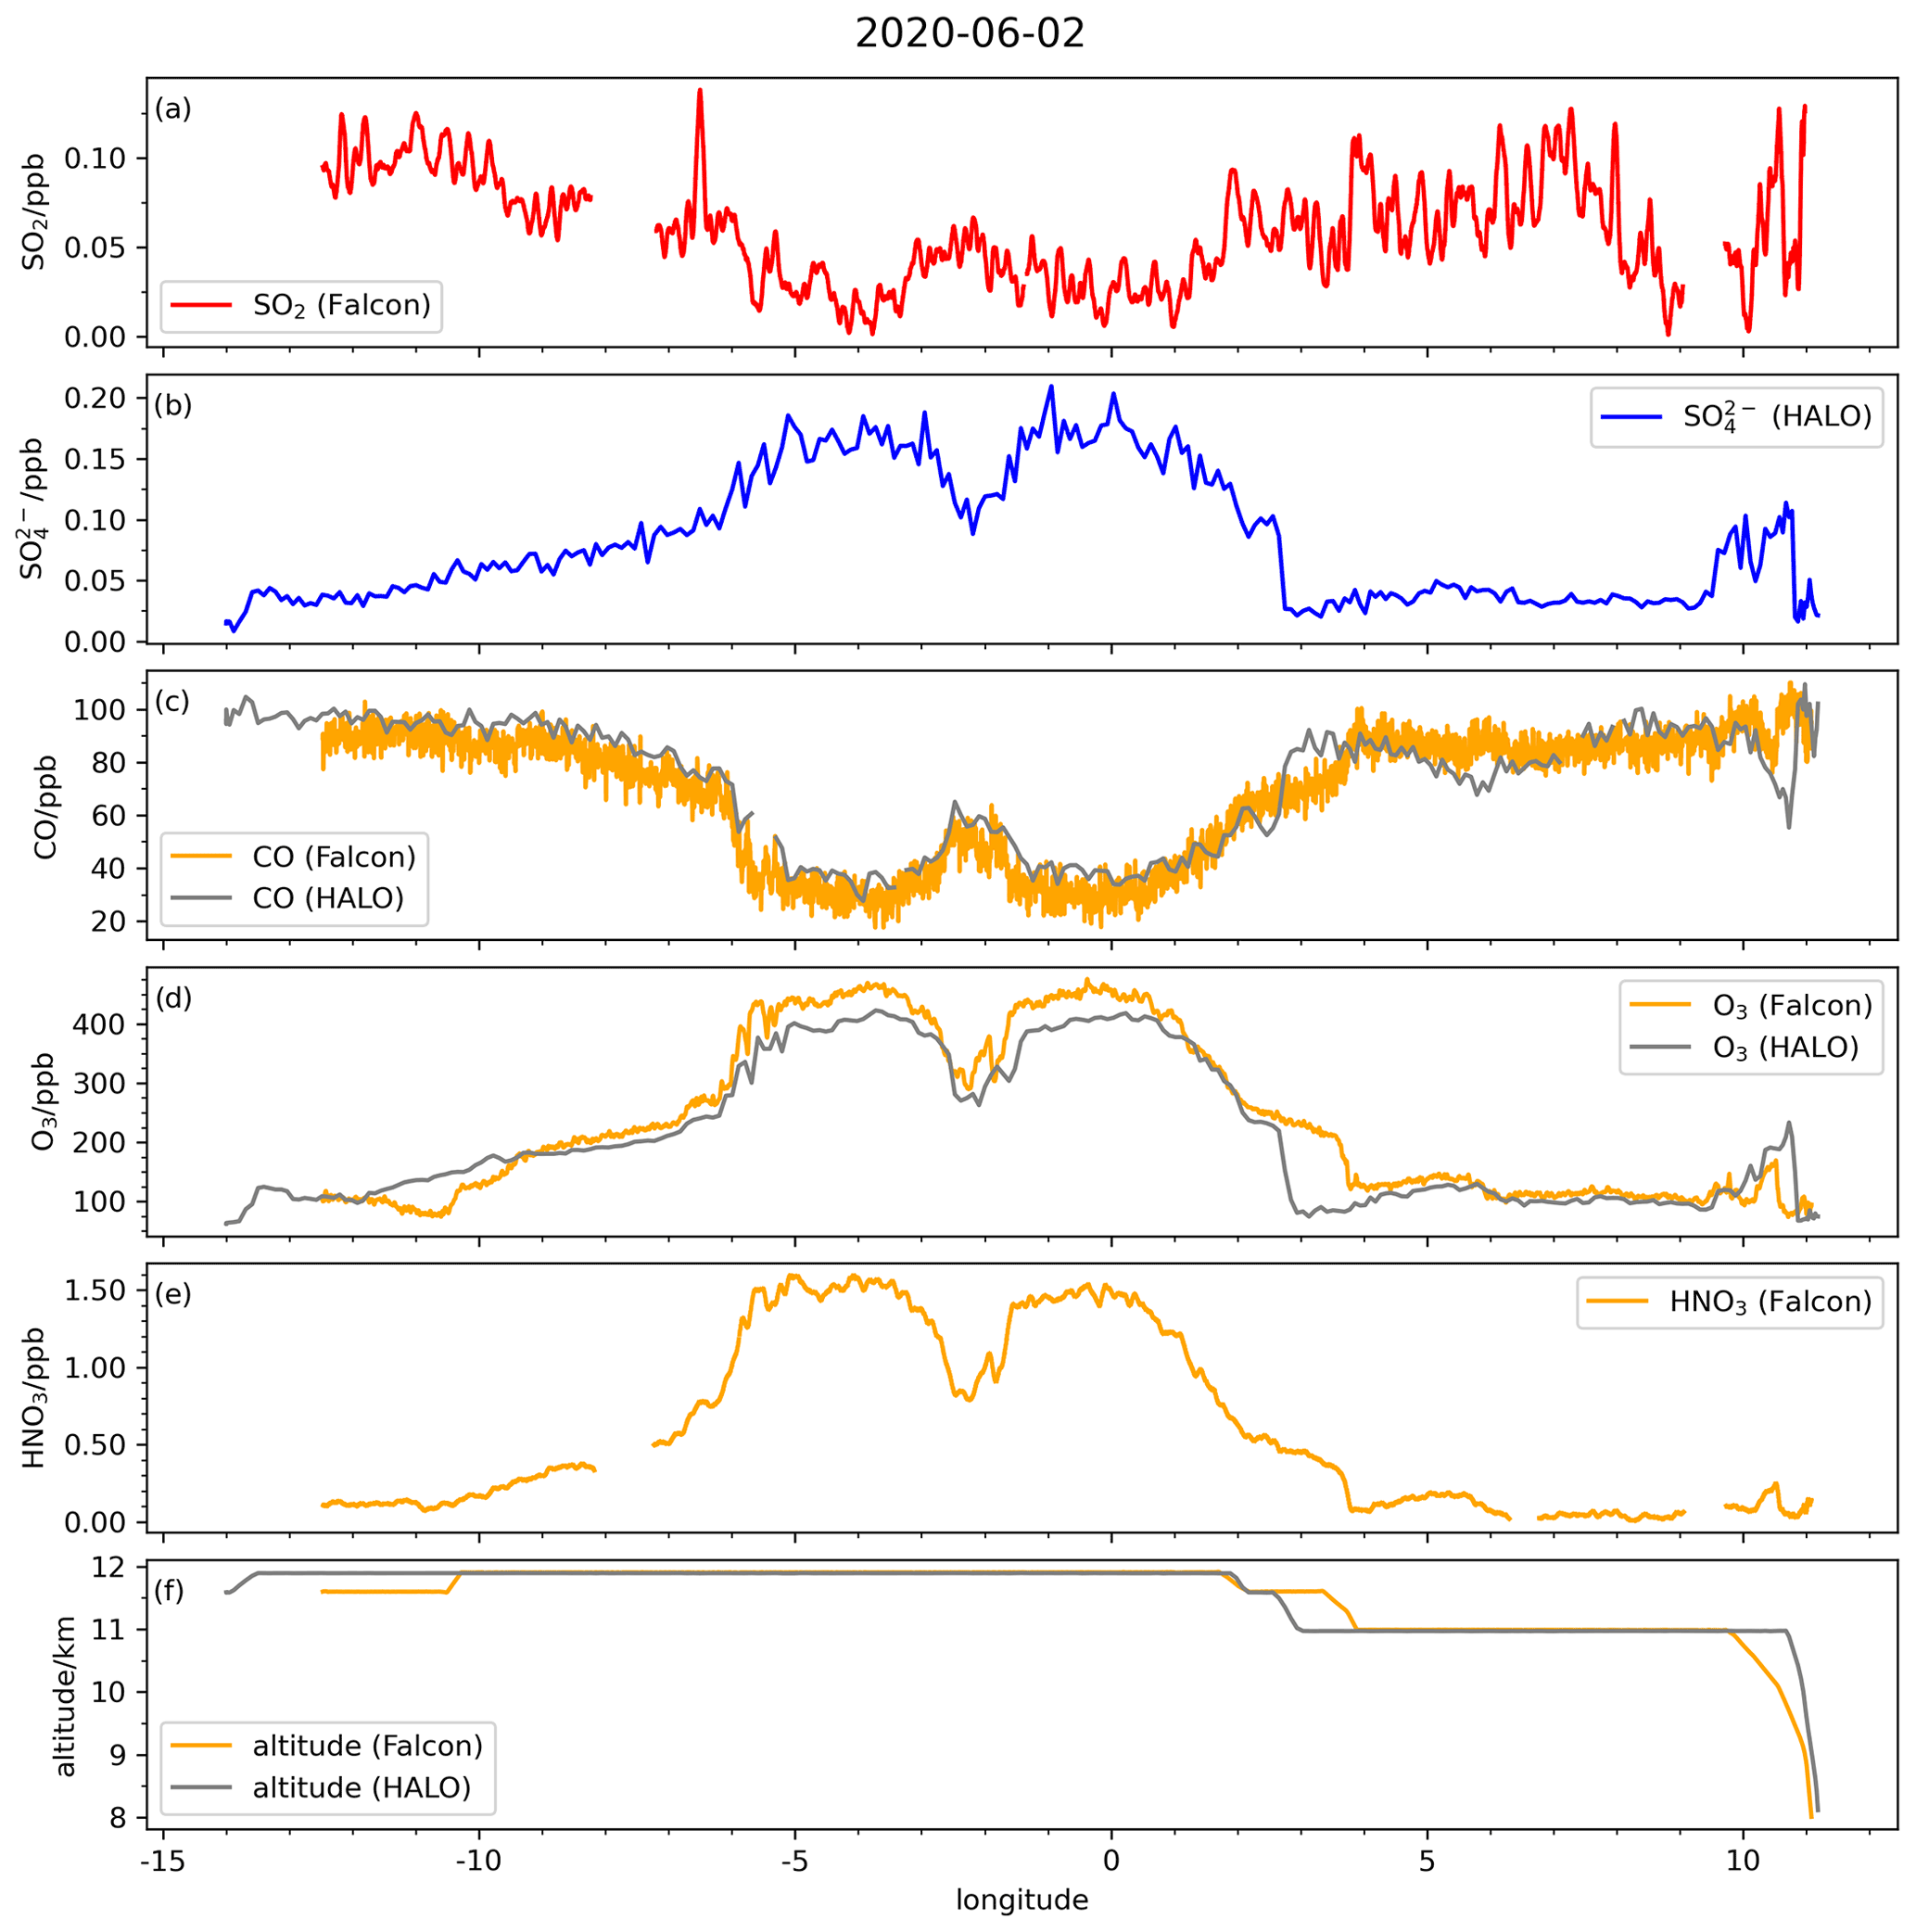
Figure 2On 2 June 2020, HALO and Falcon had similar flight tracks from Oberpfaffenhofen towards the North Atlantic, west of Ireland. The sampling was roughly between 07:00–10:00 UTC. Plotted are (a) SO2, (b) SO, (c) CO, (d) O3, (e) HNO3, and (f) altitude across longitudes 15∘ W–12∘ E.
3.2 SO2 and SO median profiles
Following the case mentioned above, we broaden our analysis to all flights of the whole campaign. In Fig. 3, median, 25th percentile, and 75th percentile profiles of the trace gases and the particulate compounds are displayed with the potential temperature as a vertical axis. The medians, 25th percentiles, and 75th percentiles are calculated for 5 K potential temperature bins from 310 to 355 K for Falcon flights and up to 385 K for HALO flights. The Falcon profile is limited in height due to the maximum flight altitude of approx. 12.5 km in comparison to HALO with a ceiling altitude of 14.5 km. First, we compare the trace gases measured on both aircraft, Falcon and HALO. The stratospheric tracer O3 behaves similarly for both aircraft within the 25th and 75th percentiles with a step around 340 K, while the spread between the percentiles starts to increase already around 330 K. Below this altitude, median O3 mixing ratios reach minima of 41 ppb (Falcon) and 62 ppb (HALO), and above they rise up to 420 ppb (Falcon) and 642 ppb (HALO). The chemical tropopause is marked by strong gradients in several tracers. O3 as a common indicator shows a kink in its median profile at around 140 ppb and 340 K potential temperature, which is within the limits given by Thouret et al. (2006). The dynamical tropopause, displayed as the 2 PVU based on ECMWF/ERA5 data along the Falcon flight tracks (Fig. 3), is around 335 K and thus has a similar height to the chemical tropopause. The tropospheric tracer CO from both platforms has similar profiles with median mixing ratios of 37–112 ppb (Falcon) and 12–96 ppb (HALO). Both CO profiles show a decrease with height and are thus anticorrelated to O3, but they reflect a significant change in the mixing ratios at 340 K, similar to O3. The profiles of the tropospheric tracer H2O also decrease with height, following the CO profile, but with a less pronounced step around the chemical tropopause. The H2O mixing ratios are 26–268 ppm (Falcon) and 3–153 ppm (HALO). Additionally, the median HNO3 profile follows the trend of O3 with low mixing ratios down to 0.3 ppb followed by a steep increase around 340 K and reaches a maximum of 1.4 ppb. Between 330 and 350 K, the stratospheric tracers O3 and HNO3 as well as the tropospheric tracer CO show larger variations between the percentiles, which indicates the mixing layer described by Hoor et al. (2002) over the course of the mission. As shown, the profiles for O3 and CO for HALO and Falcon flight tracks agree well within their 25th and 75th percentiles. Both aircraft probed the atmosphere above Europe and the North Atlantic within the mission period and thus during similar meteorological conditions, even though the days and routes partly differ. This gives us confidence to further investigate and compare measurements of sulfur compounds sampled on both aircraft: SO2 was sampled on Falcon, while SO was probed on HALO. Profiles of SO2 and SO are shown in Fig. 3a and b, respectively. The median SO2 profile decreases with height and median values range from 0.05 to 0.08 ppb, with the lowest mixing ratios above 330 K. The opposite behavior can be observed in the median SO profile, which increases with height. The mixing ratios are lowest at 0.02 ppb and rise up to 0.33 ppb. The profile shows a similar trend in comparison to O3 with a stepwise increase around 340 K. The enhanced SO mixing ratios above the chemical tropopause can be associated with stratospheric sulfate aerosol.
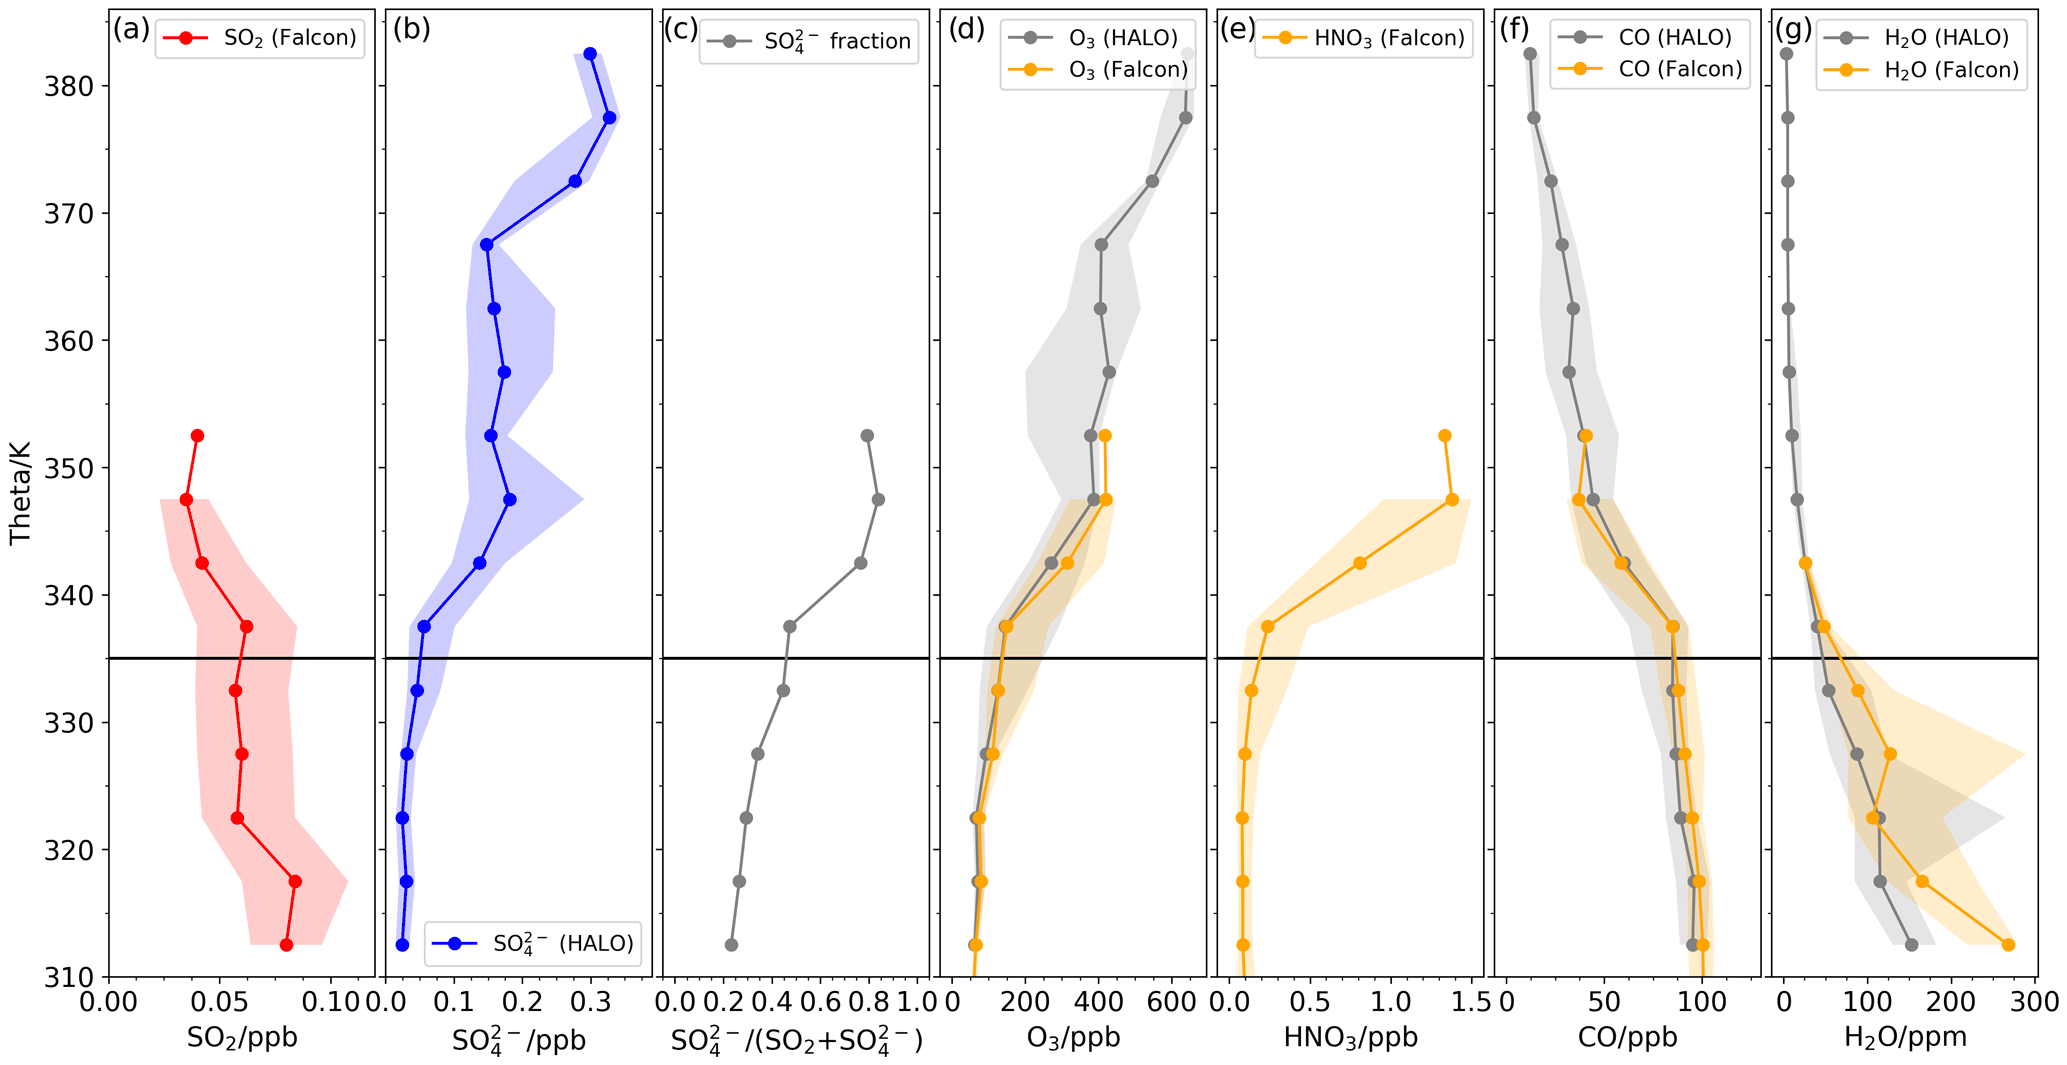
Figure 3Median profiles with 25th and 75th percentiles as shaded areas are shown for trace gases with the potential temperature as vertical axes. The data are calculated for 5 K potential temperature bins. (a) SO2, (b) SO, (c) the ratio, (d) O3, (e) HNO3, (f) CO, and (g) H2O for measurements performed on HALO and Falcon. Additionally, the black line at 335 K roughly indicates the dynamical tropopause (as 2 PVU) based on ECMWF/ERA5 analysis along the Falcon flight tracks.
In Fig. 3c the profile of the ratio of is plotted. The ratio is a measure of the relative contribution from the precursor SO2 to the total sulfur budget. Below the chemical tropopause most of the SO2 is still present as SO2, while above the tropopause SO dominates the ratio. The sum of SO2 and SO for the median profiles is rather stable around 0.10 ppb between 310 and 340 K; above the chemical tropopause the sum increases up to on average 0.20 ppb and is dominated by the enhancement of SO in the range 340–355 K. In the next section we will discuss potential sources explaining the distribution of sulfur compounds in the UTLS.
3.3 Stratospherically and tropospherically influenced air masses
In order to obtain an overview on the distribution of sulfur compounds with respect to the chemical tropopause, Fig. 4 shows tracer–tracer correlations of O3, CO, and HNO3, comparable to previous studies investigating the cross-tropopause exchange and the chemical composition of the tropopause (Fischer et al., 2000; Hoor et al., 2002). In contrast to the median profiles in the previous section, here all available data are plotted, either for HALO (considering SO) or for Falcon (considering SO2). In the correlation plot between O3 and CO color-coded with SO (Fig. 4a) from HALO for the whole altitude range (0–14 km), the stratospheric branch is visible with low CO and high O3 values, while the tropospheric branch is characterized by low O3 and high CO values, similar to, e.g., Fischer et al. (2000). The transition layer is clearly visible; the layer is a mixing layer, influenced by air masses with stratospheric and tropospheric origin (Hoor et al., 2002). Without the exchange processes across the tropopause, we would expect an L-shape profile (Fischer at al., 2000). The mixing layer almost extends over the whole O3 range from 150 to 400 ppb, similar to other mixing layers in the same latitude and season (Hoor et al., 2002; Pan et al., 2004), and is thicker in comparison to a winter polar mixing layer (Fischer et al., 2000). The higher SO mixing ratios are either in the (unmixed) stratospheric branch or partly mixed into in the upper part of the transition layer. With respect to the chemical tropopause, the elevated SO mixing ratios appear only in the stratosphere (O3 ≥ 120 ppb; Thouret et al., 2006). In Fig. 4b the correlation between O3 and CO with and without color-coded SO2 on board Falcon is displayed. A subset of the Falcon flights is missing there due to missing O3 data in the beginning of the campaign. As the Falcon mainly operated up to 12 km, the pure stratospheric branch is hard to identify, while the tropospheric branch is clearly identifiable with the black dots (without SO2). However, within the mixing layer, the stratospheric and tropospheric influences still differ, which is reflected in the SO2 mixing ratios. In order to cover all Falcon flights, we use here HNO3 as a stratospheric tracer. In Fig. 4c, the HNO3 to CO correlation for the measurements on board Falcon is plotted with color-coded SO2, and Fig. 4c includes all Falcon flights; Fig. 4b and c show similar patterns for SO2, with higher mixing ratios towards more tropospheric influence and lower mixing ratios when the stratospheric influence dominates. One SO2 outlier with higher mixing ratios at enhanced HNO3 and reduced CO can be identified (Fig. 4c; grey circle). A possible explanation could be (aged) aircraft plume encounters (as observed, e.g., in Jurkat et al., 2011), as HYSPLIT back-trajectory calculations tend towards long-range transport in the UTLS region for this case (Fig. 5a/b). Generally, the trajectories do not indicate transport from local PBL sources for cases with elevated SO2. In Fig. 5a–h, examples for cases with elevated SO2 are shown, including the case on 2 June 2020 described in Sect. 3.1 (Fig. 5g/h). Additionally, Hamryszczak et al. (2022) found that hydrogen peroxides were scavenged by clouds during BLUESKY in the lower and middle troposphere (0–7 km). As SO2 can easily be scavenged by clouds (Seinfeld and Pandis, 2006), the potential for SO2 being transported from the local PBL to the UT seems unlikely. The tracer–tracer correlation and the relative distribution of SO2 along the transition layer show no direct link to the SO distribution, as they are in different regimes; thus, we assume that they originate from different sources. The back trajectories of SO2 and SO cases support the assumption that the origins differ, especially concerning the different altitude ranges of the trajectories (Fig. 5).
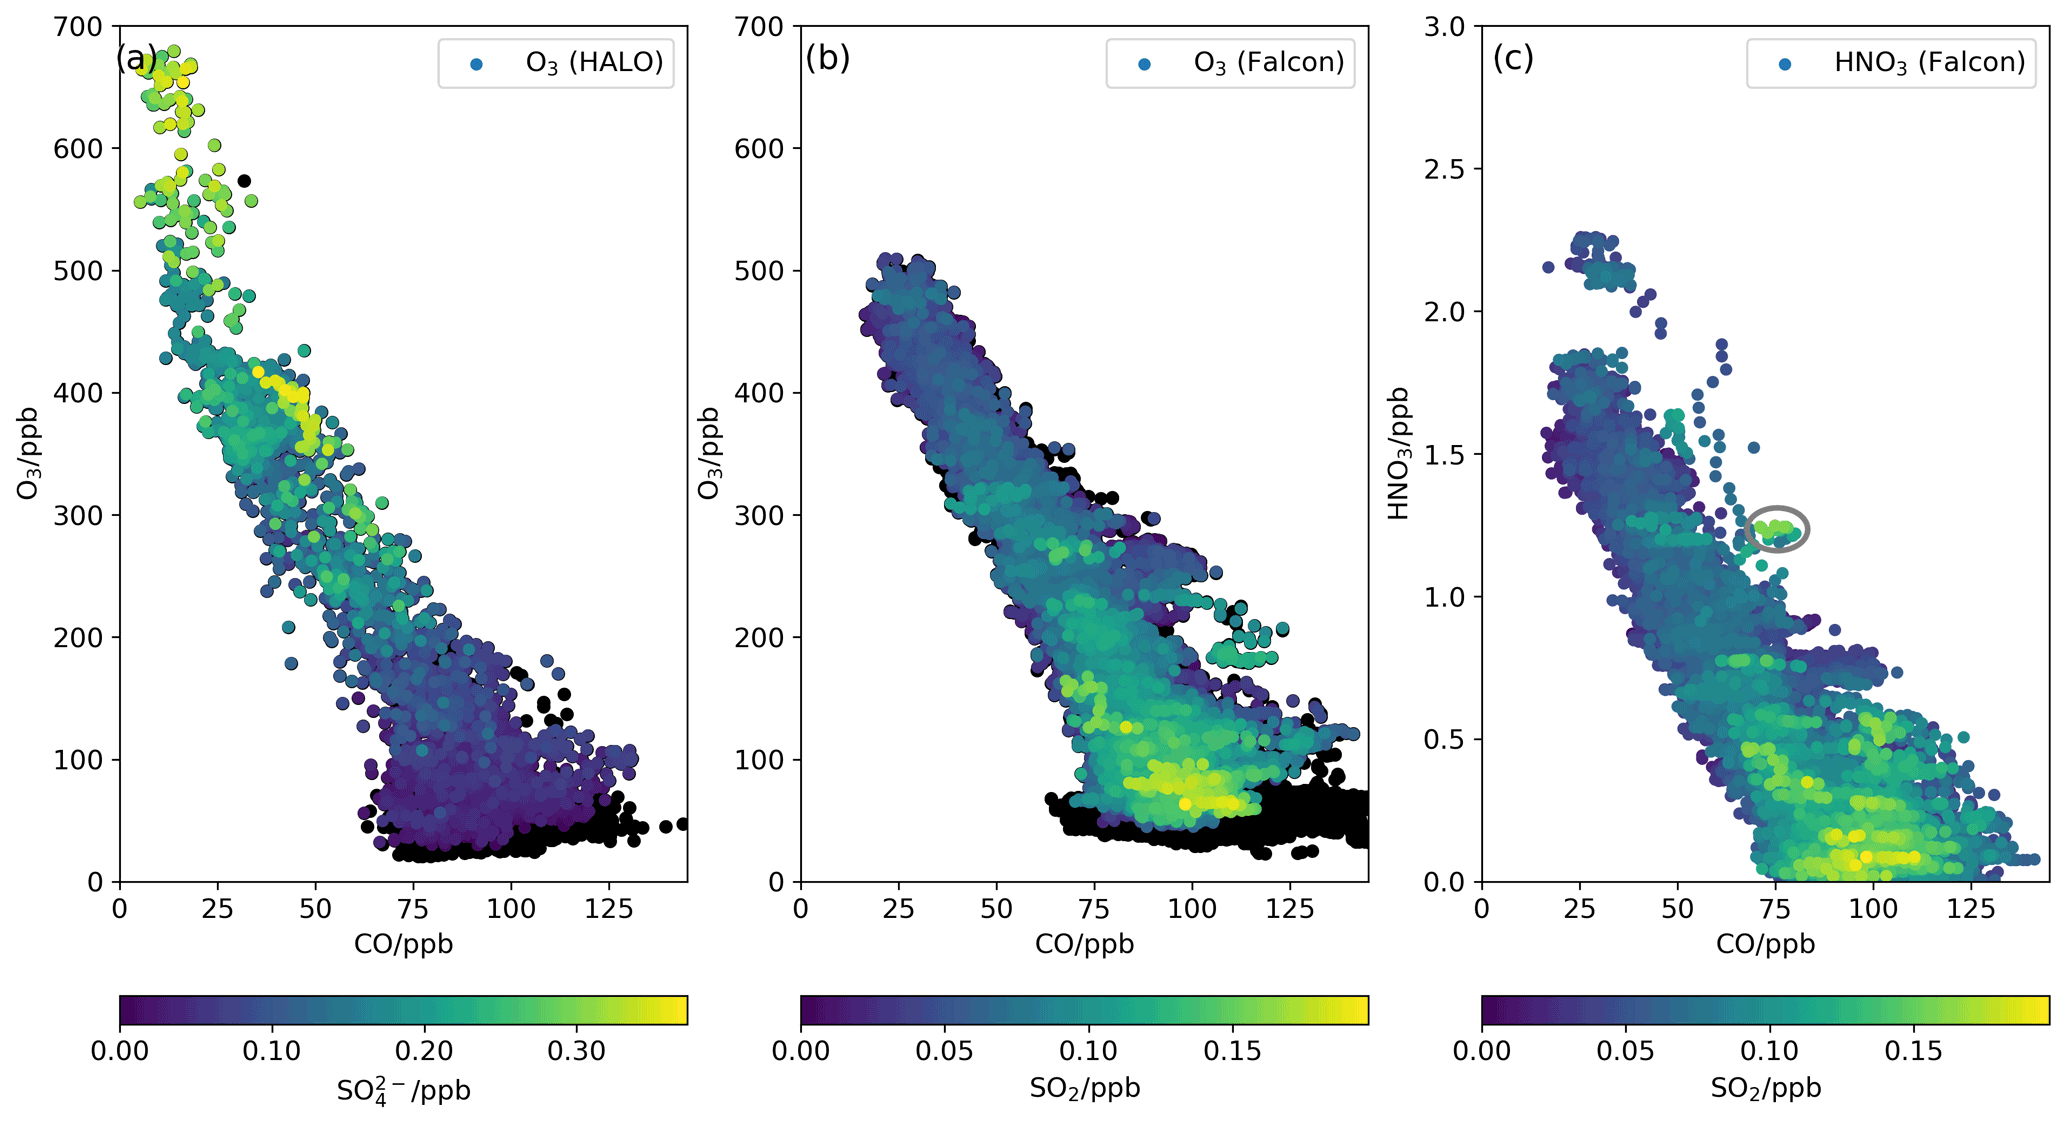
Figure 4Tracer–tracer correlation for (a) 30 s data CO–O3 in black for the whole altitude range and for heights above 8 km, with SO color-coded from HALO flights; (b) CO–O3 in black for the whole altitude range and with color-coded SO2 (above 8 km) from Falcon flights, when O3 was available; and (c) 1 s data CO–HNO3 with color-coded SO2 from Falcon flights. In panel (c) a grey circle marks an outlier with high SO2, CO, and HNO3.
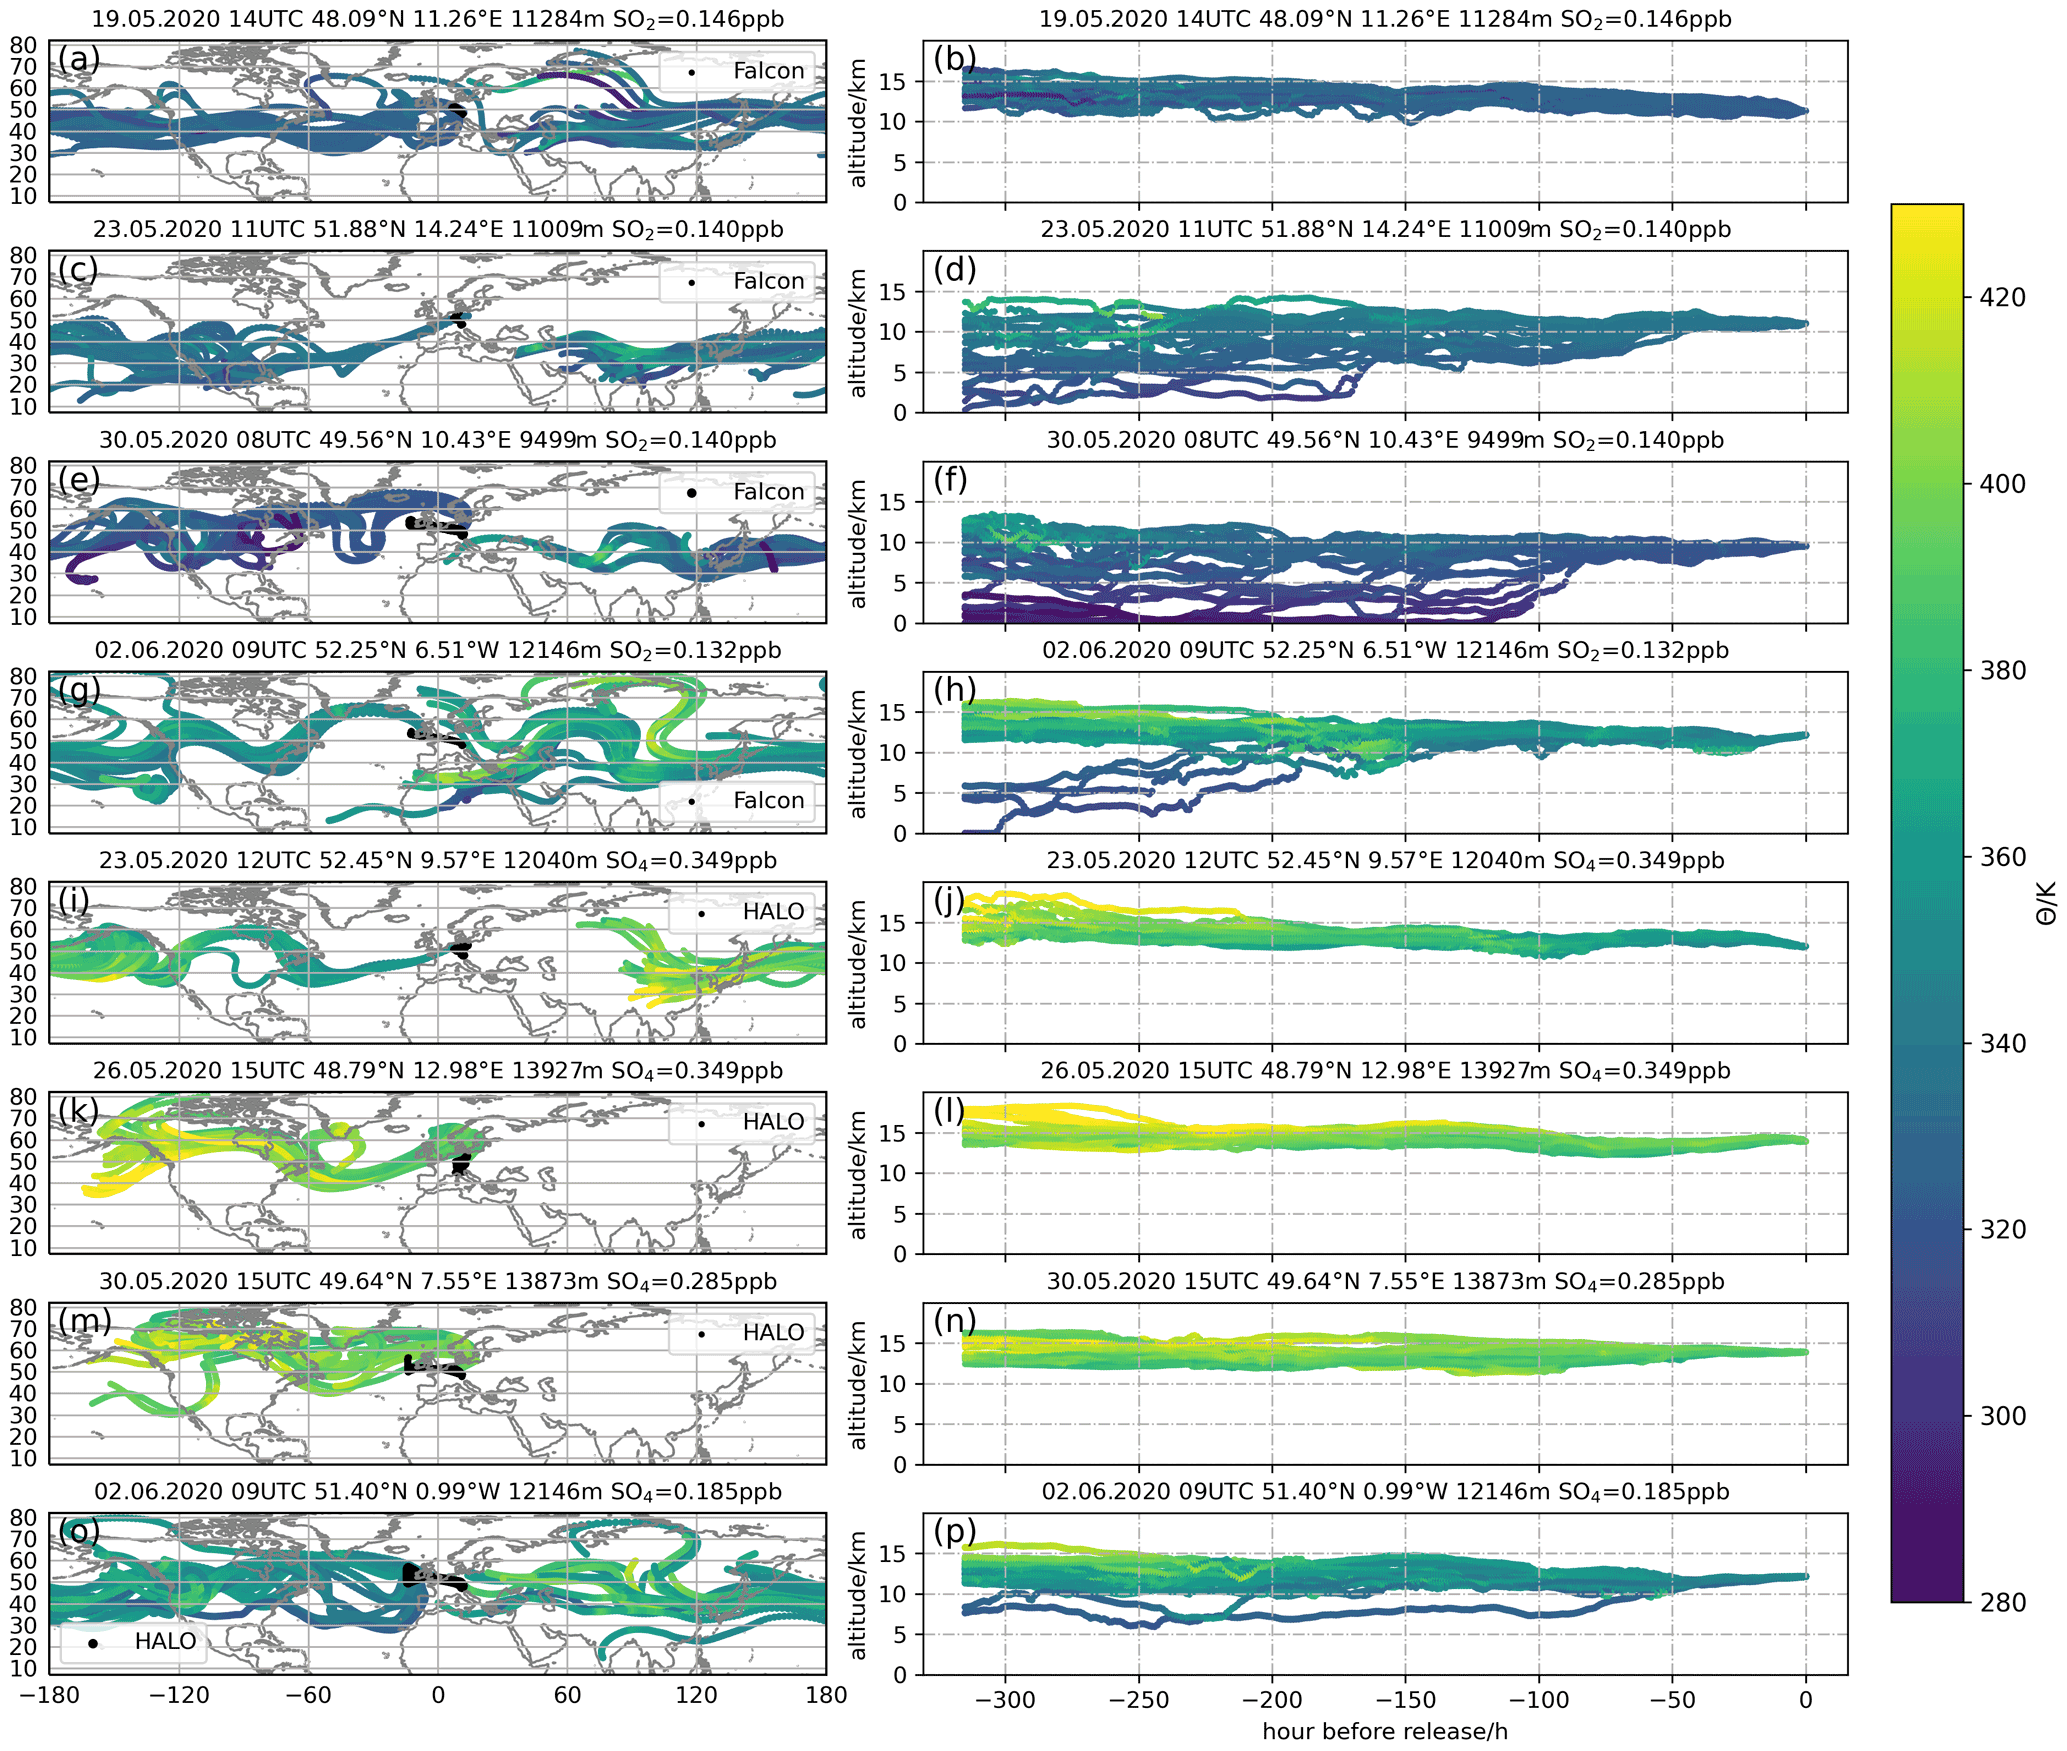
Figure 5HYSPLIT 360 h back trajectories calculated for cases with elevated SO2 (a–h; Falcon) and SO (i–p; HALO) mixing ratios. The release points started in the vicinity of these events. Left column: the flight tracks are in black, and the potential temperature along the trajectories to indicate the transport altitude is color-coded. The right column represents the trajectories as hours before release vs. altitude, also with color-coded potential temperature. The cases of enhanced SO2 were on 19 May 2020 (a, b), 23 May 2020 (c, d), 30 May 2020 (e, f), and 2 June 2020 (g, h). The cases of elevated SO were on 23 May 2020 (i, j), 26 May 2020 (k, l), 30 May 2020 (m, n), and 2 June 2020 (o, p).
In Fig. 6a, the median SO2 profile with shaded 25th and 75th percentiles is plotted against the flight altitude, in order to compare the data with literature values. The SO2 percentiles are calculated for 500 m bins. Similar to Fig. 3b, the median SO2 decreases with height from around 0.08 to 0.04 ppb. Previous in situ SO2 measurements at similar flight altitudes are included in Fig. 6a. Overall, the BLUESKY SO2 measurements are within the range of previous airborne studies, even though all studies are snapshots of the atmosphere of different locations on the Northern Hemisphere, different seasons, and different meteorological situations. Keeping this in mind, we will have a closer look. Williamson et al. (2021) reported low mixing ratios for the remote northern-hemispheric background over the Pacific for the upper troposphere as well as for the lowermost stratosphere during the Atmospheric Tomography Mission (ATom; 2016–2018). Speidel et al. (2007) reported higher SO2 values for the upper-tropospheric background over Europe and the eastern Atlantic in summer 2004. Jurkat et al. (2010) measured the stratospheric background over Europe in autumn 2008 in a similar range to Speidel et al. (2007). Above 12 km the BLUESKY SO2 mixing ratios agree well with the stratospheric background from Jurkat et al. (2010) and the tropospheric background from Speidel et al. (2007). Surprisingly, the BLUESKY SO2 profile slightly exceeds the previous measurements below these altitudes in the upper troposphere. The upper-tropospheric SO2 profile compares better to SO2 mixing ratios, which were associated with the SO2 background in the North Atlantic flight corridor in 1997 or 2010 (Arnold et al., 1997; Jurkat et al., 2010). Arnold et al. (1997) reported SO2 mixing ratios in the range of 0.03–0.3 ppb in October 1993 during POLINAT (Pollution from aircraft emissions in the North Atlantic flight corridor) and Jurkat et al. (2010) measured 0.09 ppb of SO2 during CONCERT in autumn 2008. Due to implementation of SO2 emission control policies, the global SO2 emissions decreased since 1980 (Hoesly et al., 2018; Aas et al., 2019); nevertheless, the sulfur content in kerosene remained unchanged (Lee et al., 2021; Miller et al., 2009); thus, the aviation-based SO2 emissions depend on the air traffic.
In 2020, a 72 % reduction of the air traffic above Europe has been reported due to the COVID-19 lockdown in comparison to the same time period in 2019 (Schumann et al., 2021a, b), hence providing a lower aviation SO2 source with respect to 2019. Compared to 2010, the 3.5 % increase in air traffic per year (Lee et al., 2011) promotes an increase by a factor of 1.5 of the 2010 air traffic for a scenario without COVID-19 restrictions in 2020 and consequently a theoretical increase of 50 % in aviation SO2 emissions for 2020, given that the sulfur content of the kerosene is unchanged (Lee et al., 2021; Miller et al., 2009). In 2020, the remaining air traffic of 28 % (in comparison to 2019) corresponds to roughly 40 % of the 2010 air traffic and might hence in part explain the SO2 mixing rations detected in the upper troposphere, which are still higher than remote background measurements (Williamson et al., 2021).
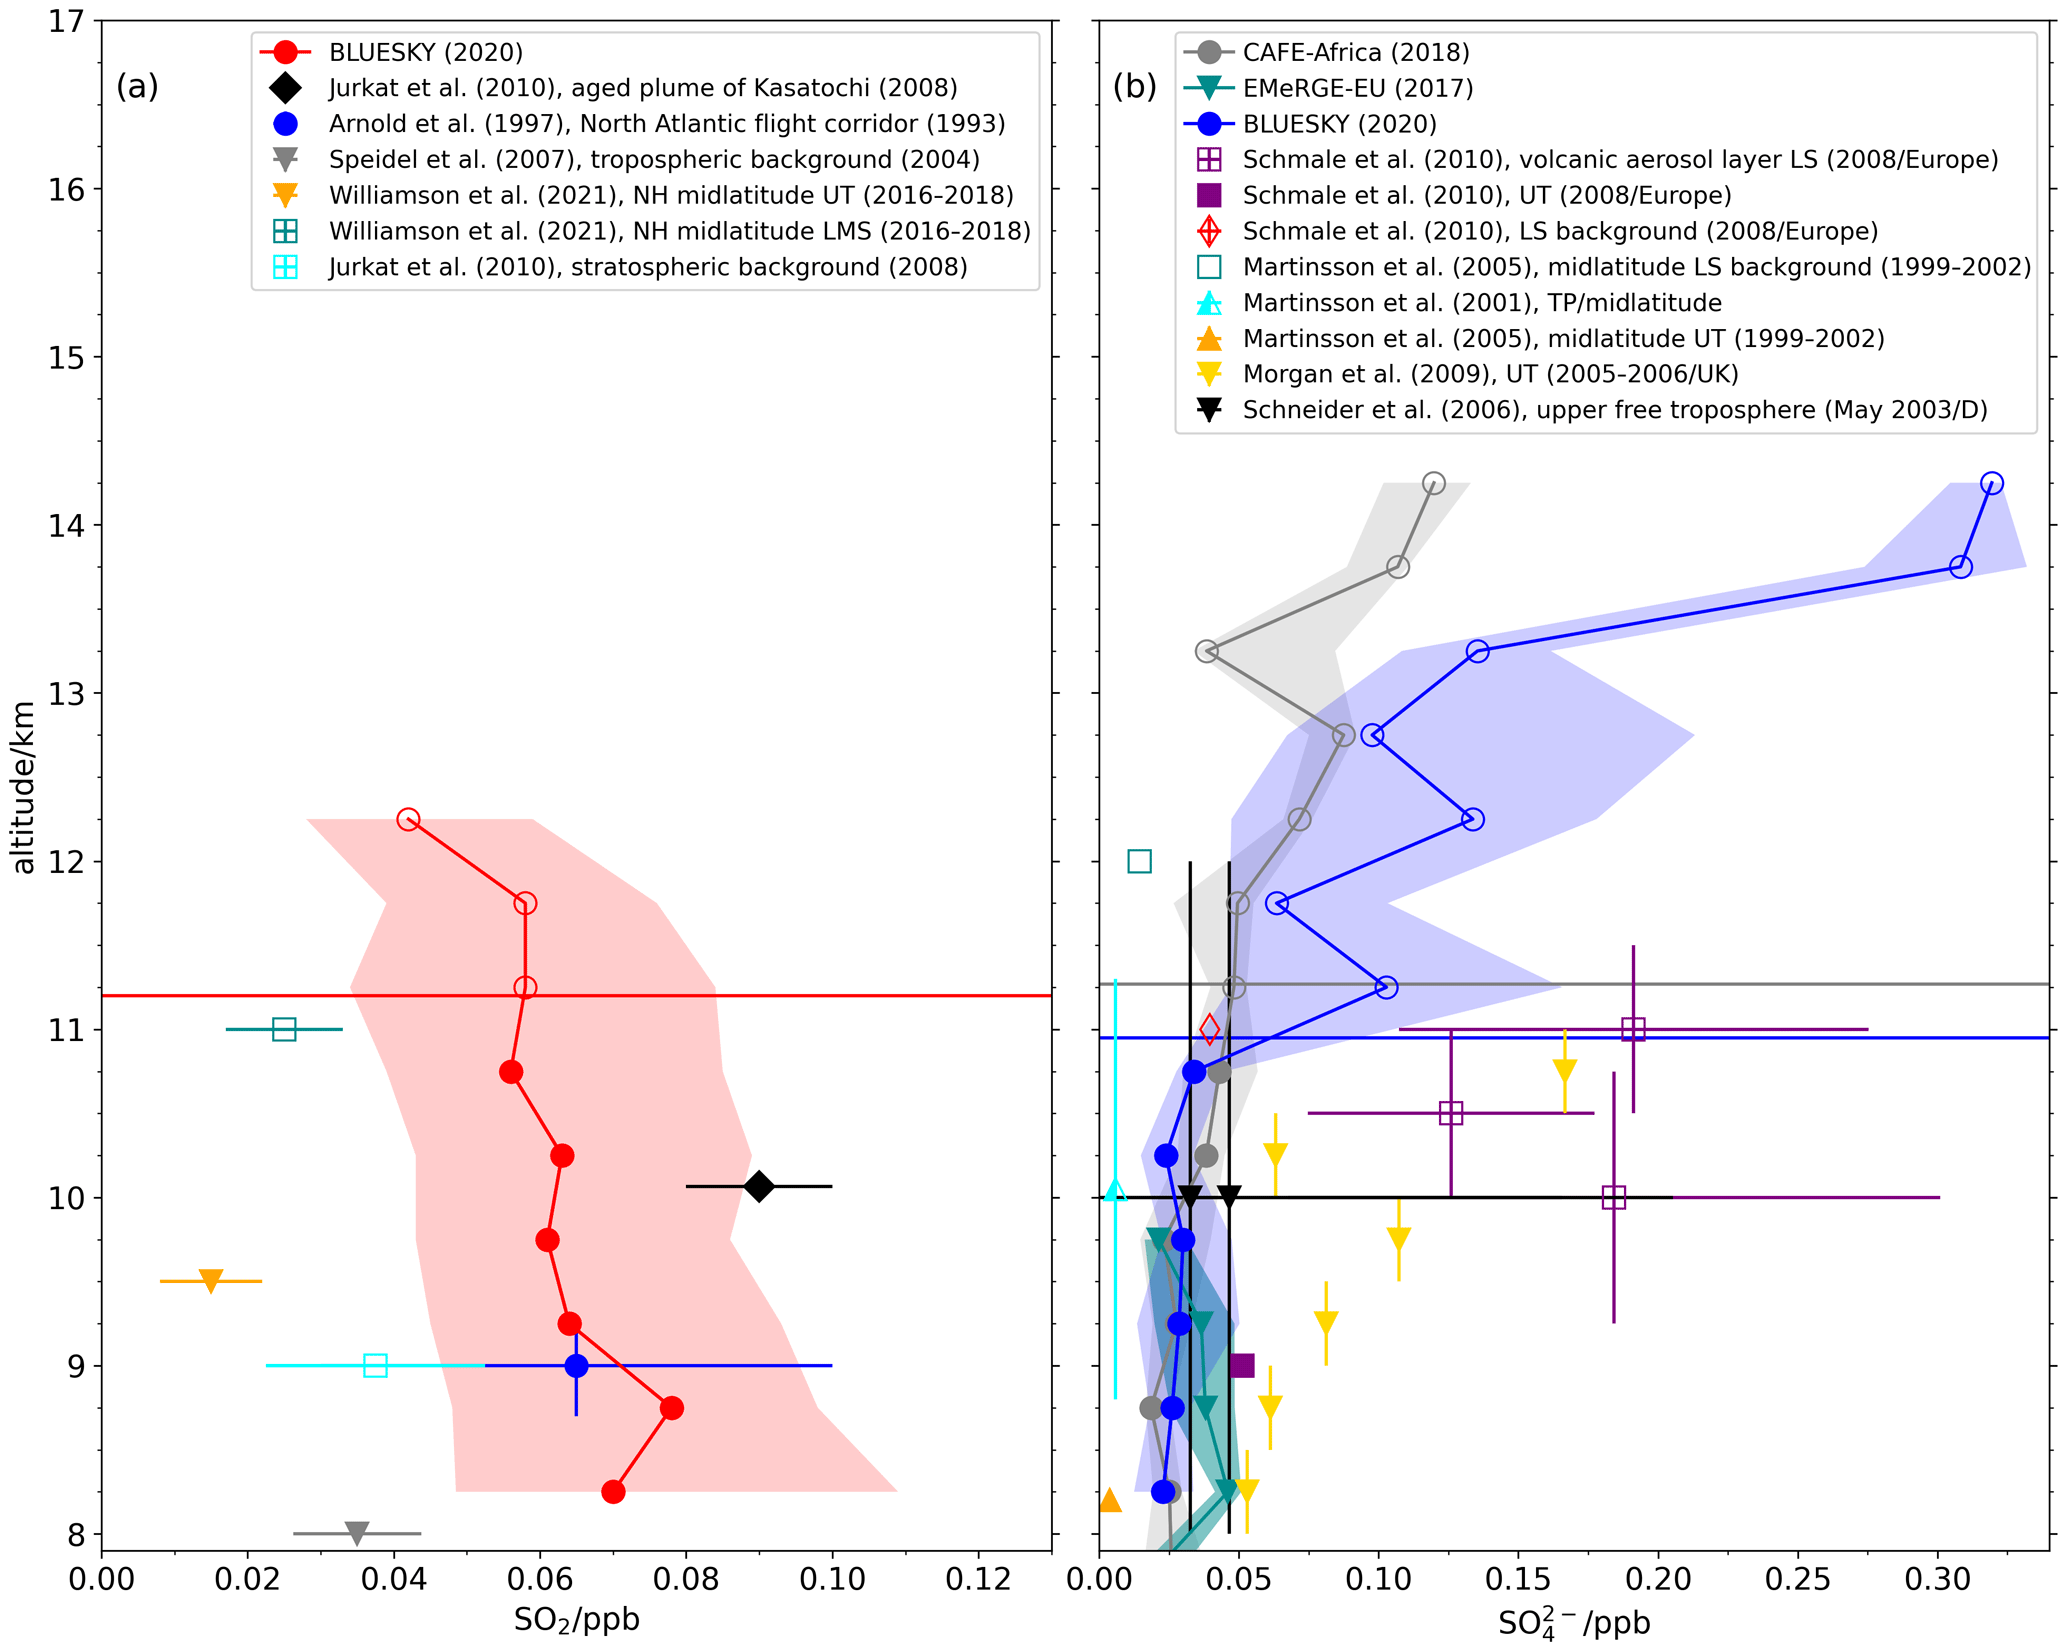
Figure 6Profiles for (a) SO2 and (b) SO for 500 m altitude bins. In panel (a) additional literature SO2 values are shown, while in panel (b) literature values for SO are added, including SO profiles from previous HALO missions with the aerosol mass spectrometer C-ToF-AMS on board: EMeRGe-EU in June/July 2017 (Andrés Hernández et al., 2022) and four flights over Europe of the CAFE-Africa mission in July–September 2018. Full markers are tropospheric origin and open markers are stratospheric origin. Additionally, the dynamical tropopause (∼ 2 PVU) along the Falcon tracks is marked as a red horizontal line in panel (a), and the thermal tropopause is marked as a blue horizontal line for HALO tracks and in grey for CAFE-Africa in panel (b).
In addition, further sources could have contributed to the SO2 budget in the upper troposphere. To analyze the origin of air masses with elevated SO2, HYSPLIT back trajectories are calculated and representative examples are plotted in Fig. 5a–h. SO2 emissions from anthropogenic and natural sources in the PBL can be lifted to the UT via convection or via warm conveyor belts and transported to the measurement region. Arnold et al. (1997) reported an extended layer of enhanced SO2 with maxima of up to 3 ppb in the northeast Atlantic, which was an air mass uplifted and transported from the polluted PBL from the eastern United States. A few cases show trajectories with similar pathways, like the example in Fig. 5e/f. Nevertheless, the PBL contacts are also over the Pacific and East Asia. The latter one suits better to the findings of Fiedler et al. (2009), who observed the uplift of polluted air masses from East Asia via warm conveyor belts and upper-tropospheric long-range transport towards Europe. Further, the Asian monsoon also serves as a vertical transport pathway for emissions from the PBL up to high altitudes, where the air mass can enter the LS and horizontally be transported either eastwards (Vogel et al., 2014, 2016) or can be horizontally transported in the UT (Tomsche et al., 2019) and finally reach Europe. Similar trajectory pathways can be found for the cases in Fig. 5a/b and 5g/h. These trajectories indicate long-range transport in the UT and could have been impacted by the Asian monsoon. Generally, the trajectories with elevated SO2 (Fig. 5a–h) show lower potential temperatures in comparison to the trajectories calculated for elevated SO (Fig. 5i–p). Hence, long-range transport of SO2-enriched PBL air masses could have contributed to the observed BLUESKY SO2 mixing ratios in the UT. In contrast, the trajectories do not indicate local transport from the central European PBL to the UT; hence, the transport of SO2 from wildfires in Germany in May 2020 (European Commission et al., 2021) to the UT seems negligible. Even if the transport of the smoke was via self-lofting (Ohneiser et al., 2021), i.e., absorption of sunlight leads to warming of the ambient air and thus lifting of the smoke, the transport is slow and so SO2 might have already been transformed to SO before reaching the UTLS and does not contribute to the elevated SO2 in the UT. Moreover, the decrease of SO2 in the LS, as expected, does not support transport of SO2 beyond the UT into the LS either via convection or via warm conveyor belts. This can be confirmed by the trajectories for SO as they indicate long-range transport at high altitudes with negligible influence from lower altitudes. The trajectories helped identify potential source regions of SO2.
Beside the sources, also sinks of SO2 can alter the SO2 concentrations in the UTLS. Beside the conversion to H2SO4, leading to sulfate particles, SO2 is removed from the atmosphere by wet and dry deposition. SO2 can be scavenged by clouds, which lead to a significant reduction of the SO2 lifetime (Lelieveld, 1993). Van Heerwaarden et al. (2021) investigated the meteorological situation in spring 2020 and found that a stable high-pressure system over Europe led to a lower cloud fraction in comparison to the mean 2010–2019 period over Europe. This would lead to less cloud processing and reduce SO2 sinks. Furthermore, elevated humidity favors the faster conversion of SO2 to SO3 and sulfate, as water vapor enhances the potential for elevated OH concentrations (Seinfeld and Pandis, 2006). As reported by Schumann et al. (2021a, b) the UTLS was drier in spring 2020 in Europe in comparison to previous years. The median H2O profiles during BLUESKY reach only mixing ratios of up to 268 ppm in the upper troposphere (Fig. 3g), which is still within the range of typical springtime H2O mixing ratios in the upper troposphere (e.g., Hegglin et al., 2009; Kaufmann et al., 2018). But van Heerwaarden et al. (2021) found with respect to humidity and cloud cover that spring 2020 was amongst the springs with the lowest values. Thus, the lower available H2O led to lower OH concentrations during the BLUESKY period, which implies less chemical processing and hence a reduction of SO2 sinks. Less SO2 sinks could lead to an enhanced SO2 lifetime in the UTLS and thus higher SO2 mixing ratios.
In sum, the enhanced SO2 mixing ratios at cruise levels in Europe in spring 2020 can possibly be explained by a non-negligible aviation SO2 contribution, WCB, or convective transport from the boundary layer, followed by long-range transport and the prolonged SO2 lifetime caused by the unusually dry UTLS conditions. Neither the sources nor the sinks could separately explain the SO2 mixing ratios in the UTLS. Beyond that, we are not able to analyze in more detail the different amounts of the aforementioned factors and how they contribute to single flights.
As mentioned in Sect. 3.2, SO has a distinct profile with a steep increase at a potential temperature of 340 K, which refers here to around 11 km with respect to altitude (Fig. 6b). This altitude reflects also the thermal tropopause height during BLUESKY (Fig. 6b). Up to this altitude, the mixing ratio is rather constant, and then it increases. Between 8–11 km O3 mixing ratios are stable, and above O3 increases. The O3 mixing ratio above 120 ppb indicates stratospheric air masses as mentioned above; thus, the higher SO mixing ratios above 11 km can be attributed to the stratosphere and are hence associated with stratospheric aerosol. The layer between 11 and 13.5 km can be influenced from the stratosphere as well as the troposphere, as the data are averaged over a few weeks and varying meteorological conditions, which lead to a broadening of the 25th to 75th percentile range. In Fig. 4a, this layer represents the mixed layer. The SO correlates well with O3 for all flights, similar to the flight on 2 June 2020, presented in Sect. 3.1 (Fig. 2).
Previous studies investigated the sulfate aerosol in the UTLS region in northern-hemispheric midlatitudes (Fig. 6b). The BLUESKY mixing ratios in the UT agree well with the observations by Schneider et al. (2006) during May 2003, which were partly influenced by aircraft exhaust plumes. The BLUESKY mixing ratios are lower than the UT background reported by Schmale et al. (2010). Martinsson et al. (2001, 2005) observed significantly lower SO mixing ratios in the European upper troposphere and tropopause region. The SO profile (Morgan et al., 2009) obtained from April 2005 to September 2006 over the UK shows higher SO concentrations compared to the BLUESKY measurements. Morgan et al. (2009) suggest that the elevated mixing ratios in the UT are the result of regional uplift of polluted air masses during stagnant meteorological conditions over the UK.
Sulfate was measured in two previous HALO missions with the aerosol mass spectrometer C-ToF-AMS in a similar altitude range and region. During EMeRGe-EU, seven research flights were conducted in June/July 2017 above Europe at altitudes up to 10 km (Andrés Hernández et al., 2022). The SO mixing ratio was on average (0.04±0.01) ppb and compares well to the BLUESKY SO mean in the same altitude range below 10 km. The second HALO mission was CAFE-Africa in summer 2018, which reached altitudes up to 14 km. Here, only data obtained over Europe (38–57∘ N and 14∘ W–16∘ E) are used for the comparison, which include two test flights and the ferry flights (27 July, 1 August, 7 August, and 7 September 2018; Voigt et al., 2022). For the CAFE-Africa subset the thermal tropopause was slightly higher than during BLUESKY (Fig. 6b). For the altitude range 8–11 km, the SO mean was (0.03±0.01) ppb, similar to the BLUESKY value. Above 11 km in the lower stratosphere, SO rises to (0.09±0.03) ppb. Considering heights above the tropopause, i.e., with enhanced SO mixing ratios, the stratospheric BLUESKY SO concentrations are a factor of 2 to 3 higher than the observations in summer 2018.
In the following, we investigate the origin of the elevated stratospheric SO mixing ratios during BLUESKY. As mentioned above, we calculated HYSPLIT back trajectories for cases of elevated SO. In Fig. 5i–p, representative examples of trajectories are displayed. The majority indicates long-range transport at high altitudes with potential temperatures between 343 and 465 K. While the lower range of the potential temperature is associated with midlatitude tropopause height, the upper values are clearly associated with the stratosphere. As only few trajectories indicate lower potential temperatures, we assume that the majority of elevated SO is already in the stratosphere 360 h before sampling, and hence influence from the troposphere is negligible. One major source of SO in the stratosphere is volcanic eruptions. One year before BLUESKY, the volcano Raikoke on the Kuril Islands (Russia, 48.29∘ N, 153.25∘ E) in the western Pacific started to erupt on 21 June 2019 and continued for some days; it was categorized as volcanic explosivity index (VEI) ≥ 4. Several explosive eruptions emitted a dense ash and SO2 plume, which rose up to 19 and 20 km on consecutive days (Hedelt et al., 2019), thus also injecting into the stratosphere. Based on TROPOspheric Monitoring Instrument (TROPOMI) analysis, de Leeuw et al. (2021) reported that the eruption released 1.4–1.6 Tg SO2 into the atmosphere and simulated also that approximately 0.9–1.1 Tg SO2 thereof was injected into the stratosphere. Kloss et al. (2021) used satellite-based OMPS-LP (Ozone Mapping and Profiler Suite Limb Profiler) stratospheric aerosol optical depth (sAOD) to investigate the temporal evolution from before the Raikoke eruption until May 2020. Almost 1 year later, the sAOD was still higher than prior to the eruption. This suggests that elevated SO measured in the stratosphere during BLUESKY was partly caused by the Raikoke eruption a year earlier. The eruption of Mount St. Helens in 1980 was of comparable size, midlatitude location, and SO2 emissions (Deshler et al., 2006), and its impact was also visible for almost a year. Still, other sources cannot be completely ruled out. For example, severe wildfires in Alberta, Canada, developed pyrocumulus clouds in June 2019. The biomass burning emissions were uplifted into the lower stratosphere (Osborne et al., 2022). In July 2019, also severe fires in Siberia, Russia, impacted the OMPS-LP sAOD (Kloss et al., 2021). Ohneiser et al. (2021) discussed self-lofting as a potential transport pathway in the UTLS for these Siberian fires in the absence of strong vertical motion in July 2019. The smoke plume could rise and reach the UT and further ascend into the LS. During the slow ascent, the emissions are chemically altered; in the case of SO2, it is transformed to SO. Finally, the SO could have contributed to the enhanced SO in the LS. Further, wildfires in central Europe in May 2020 (European Commission et al., 2021) could also have undergone this self-lofting process as the trajectories do not indicate uplift over Europe and thus might additionally have contributed to elevated SO in the UTLS. In comparison to the Raikoke eruption, these biomass burning contributions are of lower magnitude. Reifenberg et al. (2022) suggest that other small- and medium-sized volcanic eruptions from tropical latitudes could have reached the stratosphere and thus impacted the stratospheric aerosol over Europe. One example is the volcano Taal in the Philippines (14.00∘ N, 120.99∘ E), which erupted on 12 January 2020, and its ash and gas plume rose up to around 10–15 km height (Krippner and Venzke, 2020). The VEI was estimated to 3 and the SO2 emissions estimated to 0.019 Tg (Liu et al., 2020). According to simulations of Reifenberg et al. (2022), the Taal eruption led partly to an increase of SO in the LS during BLUESKY.
The measured SO mixing ratios in the LS agree with other volcano-related in situ studies. The highest mixing ratios are reported by Schmale et al. (2010). They probed layers with enhanced SO in October/November 2008, roughly 3 months after the eruption of Mount Kasatochi (erupted 8 August 2008; 52.18∘ N, 175.51∘ W; 1.5 Tg SO2), with an injection height reaching into the stratosphere, and additionally Mount Okmok (53.40∘ N, 168.17∘ W) erupted on 12 July 2008 (0.2 Tg SO2, Carn et al., 2008). Jurkat et al. (2010) also measured enhanced SO2 concentrations in the stratosphere in the 3-month-old Kasatochi plume during the CONCERT campaign (Voigt et al., 2010). Martinsson et al. (2009) reported that particulate sulfur concentrations shortly after the Kasatochi eruption were 10 times higher than before the eruption, and even 3–4 months after the eruption they were enhanced by a factor of 3. In contrast, during volcanic quiescent periods, like the period between 1997 and 2008 (Deshler, 2008), the SO reduced mixing ratios in the stratosphere, and Martinsson et al. (2005) reported SO mixing ratios of 0.01 ppb for the lower stratosphere for the years 1999–2002.
The enhanced SO2 in the UT as described in Sect. 4 and the longer SO2 lifetime could possibly have a minor effect on the stratospheric sulfate aerosol. In these conditions, the SO2 had more time to be transported into the LS and finally be transformed to SO, adding to the SO mixing ratios. But it seems unlikely, as the trajectories for elevated SO (Fig. 5i–p) stay at high altitudes (and high potential temperatures), and thus mixing from the troposphere into the stratosphere is negligible. A few trajectories indicate a downward transport from higher altitudes and thus an origin deeper in the stratosphere (Fig. 5k/l), which could be a hint for OCS as an SO precursor. OCS is transported within the Brewer–Dobson circulation from the upper stratosphere to the lower stratosphere and is transformed via SO2 to H2SO4. According to Brühl et al. (2012), it is the most important source for maintaining the stratospheric aerosol layer in volcanic quiescent periods, and also for BLUESKY, OCS oxidation adds to the stratospheric SO background to some extent. Further, the Junge layer might also influence the SO mixing ratios in the LS. Even though the Junge layer is most pronounced at higher altitudes (Junge et al., 1961), it could extend further down, or due to the downward transport mentioned above (Fig. 5k/l) SO could be transported downward from the Junge layer into our measurement altitudes and thus contribute to the elevated SO.
We find elevated SO mixing ratios in stratospheric air masses and enhanced SO2 mixing ratios in tropospheric air masses over central Europe and the North Atlantic in spring 2020. The elevated SO2 of 0.06 ppb in the UT agrees with SO2 mixing ratios performed in the background of the North Atlantic flight corridor in 2008 (Jurkat et al., 2010) despite lower air traffic due to COVID-19 restrictions in 2020. The 3.5 % increase in air traffic since 2010 in part compensates for the air traffic reduction in 2020. In addition, exceptional dry weather conditions leading to a low cloud fraction and low OH concentrations in the UTLS in May 2020 (Schumann et al., 2021a, b; Van Heerwaarden et al., 2021) reduced SO2 sinks and increased SO2 lifetime. Back trajectories provided indications of other boundary layer SO2 sources from convective or WCB transport and further long-range transport in the UT, which could have contributed to a small extent.
In the LS, enhanced SO mixing ratios were observed. In comparison to previous studies, the SO mixing ratios were clearly above SO mixing ratios reported during volcanic quiescent periods (e.g., Martinsson et al., 2001, 2005) and agreed with SO mixing ratios in volcanically impacted air masses (e.g., Schmale et al., 2010) measured at altitudes below 12 km. Compared to 2018, stratospheric SO was significantly enhanced in 2020. The eruption of the volcano Raikoke injected 0.9–1.1 Tg of SO2 into the stratosphere (de Leeuw et al., 2021) in June 2019. In May 2020, an enhanced sAOD still was observed by Kloss et al. (2021) in the Northern Hemisphere caused by the Raikoke eruption and to a smaller extent by severe biomass burning events from June/July 2019 in Siberia and Canada. Further, Reifenberg et al. (2022) found that the eruption of the tropical volcano Taal in January 2020 contributed to the enhanced SO in the LS. We suggest these to be the primary sources of the enhanced stratospheric SO concentrations measured during BLUESKY, because back trajectories mainly showed long-range transport in the lower stratosphere.
Overall, the unprecedented BLUESKY mission was conducted during exceptional meteorological conditions and also reduced air traffic; both impacted the SO2 mixing ratios in the UT due to changes in the emissions and also sinks. The enhanced stratospheric sulfate aerosol, which was observed, was likely impacted by the volcano Raikoke and smaller sources.
Together with the observations of other sulfur compounds such as gaseous H2SO4 on HALO, which are still under evaluation, the unique and comprehensive data set of sulfur compounds allows us to test our understanding of the sulfur chemistry in global models (Reifenberg et al., 2022).
In a broader context, the present results give new insights in the sulfur chemistry in the UTLS region with respect to limited sources and sinks. They help to better understand (a) the sensitivity of SO2 to missing sinks and (b) the stratospheric aerosol and its dependence on perturbations and their lasting impacts. Both aspects are important to improve models, especially with respect to simulations of the Earth's radiation budget, because changes in the radiation balance in the UTLS impact feedback processes in the global climate.
Data are available on request at the HALO database at https://halo-db.pa.op.dlr.de/mission/119 (HALO, 2022).
CV, TJW, HS, and JL planned the flight experiment. AM, JL, KK, JS, MS, and LR performed the in-flight measurements. KK and JS provided evaluated particulate data and previous campaign data and supported the analysis. AM provided supporting evaluation and assisted the analysis. FO, AZ, HF, LR, and MZ provided supporting evaluation. SK supported the analysis. LT evaluated and analyzed the data and prepared the manuscript with contributions from CV, AM, TJW, JS, KK, HF, and SK. All co-authors commented on the manuscript.
The contact author has declared that none of the authors has any competing interests.
Publisher’s note: Copernicus Publications remains neutral with regard to jurisdictional claims in published maps and institutional affiliations.
This article is part of the special issue “BLUESKY atmospheric composition measurements by aircraft during the COVID-19 lockdown in spring 2020”. It is not associated with a conference.
The HALO flights during the BLUESKY mission were funded by the Max Planck Society. The authors gratefully acknowledge the NOAA Air Resources Laboratory (ARL) for the provision of the HYSPLIT transport and dispersion model and/or READY website (https://www.ready.noaa.gov, last access: 22 November 2022) used in this publication. The authors thank Andreas Giez, Christian Mallaun, and Vladyslav Nenakhov for providing the water vapor measurement on board HALO and Falcon, as well as Benedikt Steil for providing the ECMWF/ERA5 reanalysis data.
Laura Tomsche is funded by the Deutsche Forschungsgemeinschaft (DFG, German
Research Foundation), grant no. TRR 301 and project ID 428312742.
The article processing charges for this open-access publication were covered by the German Aerospace Center (DLR).
This paper was edited by Joshua Fu and reviewed by Daniele Visioni, Cheng-En Yang, and one anonymous referee.
Aas, W., Mortier, A., Bowersox, V., Cherian, R., Faluvegi, G., Fagerli, H., Hand, J., Klimont, Z., Galy-Lacaux, C., Lehmann, C. M. B., Myhre, C. L., Myhre, G., Olivié, D., Sato, K., Quaas, J., Rao, P. S. P., Schulz, M., Shindell, D., Skeie, R. B., Stein, A., Takemura, T., Tsyro, S., Vet, R., and Xu, X.: Global and regional trends of atmospheric sulfur, Sci. Rep.-UK, 9, 953, https://doi.org/10.1038/s41598-018-37304-0, 2019.
Almeida, J., Schobesberger, S., Kürten, A., Ortega, I. K., Kupiainen-Määttä, O., Praplan, A. P., Adamov, A., Amorim, A., Bianchi, F., Breitenlechner, M., David, A., Dommen, J., Donahue, N. M., Downard, A., Dunne, E., Duplissy, J., Ehrhart, S., Flagan, R. C., Franchin, A., Guida, R., Hakala, J., Hansel, A., Heinritzi, M., Henschel, H., Jokinen, T., Junninen, H., Kajos, M., Kangasluoma, J., Keskinen, H., Kupc, A., Kurtén, T., Kvashin, A. N., Laaksonen, A., Lehtipalo, K., Leiminger, M., Leppä, J., Loukonen, V., Makhmutov, V., Mathot, S., McGrath, M. J., Nieminen, T., Olenius, T., Onnela, A., Petäjä, T., Riccobono, F., Riipinen, I., Rissanen, M., Rondo, L., Ruuskanen, T., Santos, F. D., Sarnela, N., Schallhart, S., Schnitzhofer, R., Seinfeld, J. H., Simon, M., Sipilä, M., Stozhkov, Y., Stratmann, F., Tomé, A., Tröstl, J., Tsagkogeorgas, G., Vaattovaara, P., Viisanen, Y., Virtanen, A., Vrtala, A., Wagner, P. E., Weingartner, E., Wex, H., Williamson, C., Wimmer, D., Ye, P., Yli-Juuti, T., Carslaw, K. S., Kulmala, M., Curtius, J., Baltensperger, U., Worsnop, D. R., Vehkamäki, H., and Kirkby, J.: Molecular understanding of sulphuric acid–amine particle nucleation in the atmosphere, Nature, 502, 359–363, https://doi.org/10.1038/nature12663, 2013.
Andrés Hernández, M. D., Hilboll, A., Ziereis, H., Förster, E., Krüger, O. O., Kaiser, K., Schneider, J., Barnaba, F., Vrekoussis, M., Schmidt, J., Huntrieser, H., Blechschmidt, A.-M., George, M., Nenakhov, V., Harlass, T., Holanda, B. A., Wolf, J., Eirenschmalz, L., Krebsbach, M., Pöhlker, M. L., Kalisz Hedegaard, A. B., Mei, L., Pfeilsticker, K., Liu, Y., Koppmann, R., Schlager, H., Bohn, B., Schumann, U., Richter, A., Schreiner, B., Sauer, D., Baumann, R., Mertens, M., Jöckel, P., Kilian, M., Stratmann, G., Pöhlker, C., Campanelli, M., Pandolfi, M., Sicard, M., Gómez-Amo, J. L., Pujadas, M., Bigge, K., Kluge, F., Schwarz, A., Daskalakis, N., Walter, D., Zahn, A., Pöschl, U., Bönisch, H., Borrmann, S., Platt, U., and Burrows, J. P.: Overview: On the transport and transformation of pollutants in the outflow of major population centres – observational data from the EMeRGe European intensive operational period in summer 2017, Atmos. Chem. Phys., 22, 5877–5924, https://doi.org/10.5194/acp-22-5877-2022, 2022.
Arnold, F., Schneider, J., Gollinger, K., Schlager, H., Schulte, P., Hagen, D. E., Whitefield, P. D., and van Velthoven, P.: Observation of upper tropospheric sulfur dioxide- and acetone-pollution: Potential implications for hydroxyl radicaland aerosol formation, Geophys. Res. Lett., 24, 57–60, https://doi.org/10.1029/96gl03693, 1997.
Brock, C., Hamill, P., Wilson, J., Jonsson, H., and Chan, K.: Particle formation in the upper tropical troposphere: A source of nuclei for the stratospheric aerosol, Science, 270, 1650–1653, 1995.
Brühl, C., Lelieveld, J., Crutzen, P. J., and Tost, H.: The role of carbonyl sulphide as a source of stratospheric sulphate aerosol and its impact on climate, Atmos. Chem. Phys., 12, 1239–1253, https://doi.org/10.5194/acp-12-1239-2012, 2012.
Carn, S., Krotkov, N., Fioletov, V., Yang, K., Krueger, A., and Tarasick, D.: Emission, transport and validation of sulfur dioxide in the 2008 Okmok and Kasatochi eruption clouds, AGU Fall Meeting Abstracts, San Francisco, December 2008, A51J-07, 2008AGUFM.A51J..07C, 2008.
Clarisse, L., Fromm, M., Ngadi, Y., Emmons, L., Clerbaux, C., Hurtmans, D., and Coheur, P.-F.: Intercontinental transport of anthropogenic sulfur dioxide and other pollutants: An infrared remote sensing case study, Geophys. Res. Lett., 38, https://doi.org/10.1029/2011GL048976, 2011.
Crutzen, P. J.: Albedo enhancement by stratospheric sulfur injections: a contribution to resolve a policy dilemma?, Climatic Change, 77, 211–219, https://doi.org/10.1007/s10584-006-9101-y, 2006.
Cziczo, D. J., Thomson, D. S., and Murphy, D. M.: Ablation, Flux, and Atmospheric Implications of Meteors Inferred from Stratospheric Aerosol, Science, 291, 1772–1775, https://doi.org/10.1126/science.1057737, 2001.
de Leeuw, J., Schmidt, A., Witham, C. S., Theys, N., Taylor, I. A., Grainger, R. G., Pope, R. J., Haywood, J., Osborne, M., and Kristiansen, N. I.: The 2019 Raikoke volcanic eruption – Part 1: Dispersion model simulations and satellite retrievals of volcanic sulfur dioxide, Atmos. Chem. Phys., 21, 10851–10879, https://doi.org/10.5194/acp-21-10851-2021, 2021.
Deshler, T.: A review of global stratospheric aerosol: Measurements, importance, life cycle, and local stratospheric aerosol, Atmos. Res., 90, 223–232, 2008.
Deshler, T., Anderson-Sprecher, R., Jäger, H., Barnes, J., Hofmann, D. J., Clemesha, B., Simonich, D., Osborn, M., Grainger, R. G., and Godin-Beekmann, S.: Trends in the nonvolcanic component of stratospheric aerosol over the period 1971–2004, J. Geophys. Res.-Atmos., 111, D01201, https://doi.org/10.1029/2005JD006089, 2006.
Drewnick, F., Hings, S. S., DeCarlo, P., Jayne, J. T., Gonin, M., Fuhrer, K., Weimer, S., Jimenez, J. L., Demerjian, K. L., Borrmann, S., and Worsnop, D. R.: A New Time-of-Flight Aerosol Mass Spectrometer (TOF-AMS) – Instrument Description and First Field Deployment, Aerosol Sci. Tech., 39, 637–658, https://doi.org/10.1080/02786820500182040, 2005.
English, J. M., Toon, O. B., Mills, M. J., and Yu, F.: Microphysical simulations of new particle formation in the upper troposphere and lower stratosphere, Atmos. Chem. Phys., 11, 9303–9322, https://doi.org/10.5194/acp-11-9303-2011, 2011.
European Commission, Joint Research Centre, San-Miguel-Ayanz, J., Durrant, T., Boca, R., Maianti, P., Libertà, G., Artés Vivancos, T., Oom, D., Branco, A., Tomàs. Rigo, D., Ferrari, D., Pfeiffer, H., Grecchi, R., Nuijten, D., Onida, M., and Löffler, P.: Forest Fires in Europe, Middle East and North Africa 2020, Publications Office of the European Union, https://doi.org/10.2760/216446, 2021.
Fiedler, V., Nau, R., Ludmann, S., Arnold, F., Schlager, H., and Stohl, A.: East Asian SO2 pollution plume over Europe – Part 1: Airborne trace gas measurements and source identification by particle dispersion model simulations, Atmos. Chem. Phys., 9, 4717–4728, https://doi.org/10.5194/acp-9-4717-2009, 2009.
Fischer, H., Wienhold, F. G., Hoor, P., Bujok, O., Schiller, C., Siegmund, P., Ambaum, M., Scheeren, H. A., and Lelieveld, J.: Tracer correlations in the northern high latitude lowermost stratosphere: Influence of cross-tropopause mass exchange, Geophys. Res. Lett., 27, 97–100, https://doi.org/10.1029/1999GL010879, 2000.
Fromm, M., Bevilacqua, R., Servranckx, R., Rosen, J., Thayer, J. P., Herman, J., and Larko, D.: Pyro-cumulonimbus injection of smoke to the stratosphere: Observations and impact of a super blowup in northwestern Canada on 3–4 August 1998, J. Geophys. Res.-Atmos., 110, D08205, https://doi.org/10.1029/2004JD005350, 2005.
Fueglistaler, S., Dessler, A. E., Dunkerton, T. J., Folkins, I., Fu, Q., and Mote, P. W.: Tropical tropopause layer, Rev. Geophys., 47, RG1004, https://doi.org/10.1029/2008RG000267, 2009.
Gottschaldt, K.-D., Schlager, H., Baumann, R., Bozem, H., Eyring, V., Hoor, P., Jöckel, P., Jurkat, T., Voigt, C., Zahn, A., and Ziereis, H.: Trace gas composition in the Asian summer monsoon anticyclone: a case study based on aircraft observations and model simulations, Atmos. Chem. Phys., 17, 6091–6111, https://doi.org/10.5194/acp-17-6091-2017, 2017.
Gottschaldt, K.-D., Schlager, H., Baumann, R., Cai, D. S., Eyring, V., Graf, P., Grewe, V., Jöckel, P., Jurkat-Witschas, T., Voigt, C., Zahn, A., and Ziereis, H.: Dynamics and composition of the Asian summer monsoon anticyclone, Atmos. Chem. Phys., 18, 5655–5675, https://doi.org/10.5194/acp-18-5655-2018, 2018.
HALO: Mission: BLUESKY, HALO [data set], available upon request, https://halo-db.pa.op.dlr.de/mission/119, last access: 22 November 2022.
Hamryszczak, Z. T., Pozzer, A., Obersteiner, F., Bohn, B., Steil, B., Lelieveld, J., and Fischer, H.: Distribution of hydrogen peroxide over Europe during the BLUESKY aircraft campaign, Atmos. Chem. Phys., 22, 9483–9497, https://doi.org/10.5194/acp-22-9483-2022, 2022.
Hedelt, P., Efremenko, D. S., Loyola, D. G., Spurr, R., and Clarisse, L.: Sulfur dioxide layer height retrieval from Sentinel-5 Precursor/TROPOMI using FP_ILM, Atmos. Meas. Tech., 12, 5503–5517, https://doi.org/10.5194/amt-12-5503-2019, 2019.
Hegglin, M. I., Boone, C. D., Manney, G. L., and Walker, K. A.: A global view of the extratropical tropopause transition layer from Atmospheric Chemistry Experiment Fourier Transform Spectrometer O3, H2O, and CO, J. Geophys. Res.-Atmos., 114, D00B11, https://doi.org/10.1029/2008JD009984, 2009.
Hoesly, R. M., Smith, S. J., Feng, L., Klimont, Z., Janssens-Maenhout, G., Pitkanen, T., Seibert, J. J., Vu, L., Andres, R. J., Bolt, R. M., Bond, T. C., Dawidowski, L., Kholod, N., Kurokawa, J.-I., Li, M., Liu, L., Lu, Z., Moura, M. C. P., O'Rourke, P. R., and Zhang, Q.: Historical (1750–2014) anthropogenic emissions of reactive gases and aerosols from the Community Emissions Data System (CEDS), Geosci. Model Dev., 11, 369–408, https://doi.org/10.5194/gmd-11-369-2018, 2018.
Hoor, P., Fischer, H., Lange, L., Lelieveld, J., and Brunner, D.: Seasonal variations of a mixing layer in the lowermost stratosphere as identified by the CO-O3 correlation from in situ measurements, J. Geophys. Res.-Atmos., 107, ACL 1-1–ACL 1-11, https://doi.org/10.1029/2000JD000289, 2002.
Junge, C. E., Chagnon, C. W., and Manson, J. E.: Stratospheric aerosols, J. Atmos. Sci., 18, 81–108, 1961.
Jurkat, T., Voigt, C., Arnold, F., Schlager, H., Aufmhoff, H., Schmale, J., Schneider, J., Lichtenstern, M., and Dörnbrack, A.: Airborne stratospheric ITCIMS measurements of SO2, HCl, and HNO3 in the aged plume of volcano Kasatochi, J. Geophys. Res., 115, https://doi.org/10.1029/2010jd013890, 2010.
Jurkat, T., Voigt, C., Arnold, F., Schlager, H., Kleffmann, J., Aufmhoff, H., Schäuble, D., Schaefer, M., and Schumann, U.: Measurements of HONO, NO, NOy and SO2 in aircraft exhaust plumes at cruise, Geophys. Res. Lett., 38, L10807, https://doi.org/10.1029/2011gl046884, 2011.
Jurkat, T., Voigt, C., Kaufmann, S., Zahn, A., Sprenger, M., Hoor, P., Bozem, H., Müller, S., Dörnbrack, A., Schlager, H., Bönisch, H., and Engel, A.: A quantitative analysis of stratospheric HCl, HNO3, and O3 in the tropopause region near the subtropical jet, Geophys. Res. Lett., 41, 3315–3321, https://doi.org/10.1002/2013gl059159, 2014.
Jurkat, T., Kaufmann, S., Voigt, C., Schäuble, D., Jeßberger, P., and Ziereis, H.: The airborne mass spectrometer AIMS – Part 2: Measurements of trace gases with stratospheric or tropospheric origin in the UTLS, Atmos. Meas. Tech., 9, 1907–1923, https://doi.org/10.5194/amt-9-1907-2016, 2016.
Kanamitsu, M.: Description of the NMC Global Data Assimilation and Forecast System, Weather Forecast., 4, 335–342, https://doi.org/10.1175/1520-0434(1989)004<0335:Dotngd>2.0.Co;2, 1989.
Kaufmann, S., Voigt, C., Heller, R., Jurkat-Witschas, T., Krämer, M., Rolf, C., Zöger, M., Giez, A., Buchholz, B., Ebert, V., Thornberry, T., and Schumann, U.: Intercomparison of midlatitude tropospheric and lower-stratospheric water vapor measurements and comparison to ECMWF humidity data, Atmos. Chem. Phys., 18, 16729–16745, https://doi.org/10.5194/acp-18-16729-2018, 2018.
Kirkby, J., Curtius, J., Almeida, J., Schobesberger, S., Kürten, A., Ortega, I. K., Kupiainen-Määttä, O., Praplan, A. P., Adamov, A., Amorim, A., Bianchi, F., Breitenlechner, M., David, A., Dommen, J., Donahue, N. M., Downard, A., Dunne, E., Duplissy, J., Ehrhart, S., Flagan, R and Dunne, E., Duplissy, J., Ehrhart, S., Franchin, A., Gagné, S., Ickes, L., Kürten, A., Kupc, A., Metzger, A., Riccobono, F., Rondo, L., Schobesberger, S., Tsagkogeorgas, G., Wimmer, D., Amorim, A., Bianchi, F., Breitenlechner, M., David, A., Dommen, J., Downard, A., Ehn, M., Flagan, R. C., Haider, S., Hansel, A., Hauser, D., Jud, W., Junninen, H., Kreissl, F., Kvashin, A., Laaksonen, A., Lehtipalo, K., Lima, J., Lovejoy, E. R., Makhmutov, V., Mathot, S., Mikkilä, J., Minginette, P., Mogo, S., Nieminen, T., Onnela, A., Pereira, P., Petäjä, T., Schnitzhofer, R., Seinfeld, J. H., Sipilä, M., Stozhkov, Y., Stratmann, F., Tomé, A., Vanhanen, J., Viisanen, Y., Vrtala, A., Wagner, P. E., Walther, H., Weingartner, E., Wex, H., Winkler, P. M., Carslaw, K. S., Worsnop, D. R., Baltensperger, U., and Kulmala, M.: Role of sulphuric acid, ammonia and galactic cosmic rays in atmospheric aerosol nucleation, Nature, 476, 429–433, https://doi.org/10.1038/nature10343, 2011.
Klausner, T., Mertens, M., Huntrieser, H., Galkowski, M., Kuhlmann, G., Baumann, R., Fiehn, A., Jöckel, P., Pühl, M., and Roiger, A.: Urban greenhouse gas emissions from the Berlin area: A case study using airborne CO2 and CH4 in situ observations in summer 2018, Elementa, 8, 15, https://doi.org/10.1525/elementa.411, 2020.
Kloss, C., Berthet, G., Sellitto, P., Ploeger, F., Taha, G., Tidiga, M., Eremenko, M., Bossolasco, A., Jégou, F., Renard, J.-B., and Legras, B.: Stratospheric aerosol layer perturbation caused by the 2019 Raikoke and Ulawun eruptions and their radiative forcing, Atmos. Chem. Phys., 21, 535–560, https://doi.org/10.5194/acp-21-535-2021, 2021.
Kremser, S., Thomason, L. W., von Hobe, M., Hermann, M., Deshler, T., Anderson-Sprecher, R., Jäger, H., Barnes, J., Hofmann, D. J., Clemesha, B., Simonich, D., Osborn, M., Grainger, R. G., Godin-Beekmann, S., Timmreck, C., Toohey, M., Stenke, A., Schwarz, J. P., and Weigel, R.: Stratospheric aerosol – Observations, processes, and impact on climate, J. Rev. Geophys., 54, 278–335, 2016.
Krippner, J. B. and Venzke, E. (Eds.): Global Volcanism Program, Report on Taal (Philippines) Bulletin of the Global Volcanism Network, 45-6, https://doi.org/10.5479/si.GVP.BGVN202006-273070, 2020.
Krüger, O. O., Holanda, B. A., Chowdhury, S., Pozzer, A., Walter, D., Pöhlker, C., Andrés Hernández, M. D., Burrows, J. P., Voigt, C., Lelieveld, J., Quaas, J., Pöschl, U., and Pöhlker, M. L.: Black carbon aerosol reductions during COVID-19 confinement quantified by aircraft measurements over Europe, Atmos. Chem. Phys., 22, 8683–8699, https://doi.org/10.5194/acp-22-8683-2022, 2022.
Lee, C., Martin, R. V., van Donkelaar, A., Lee, H., Dickerson, R. R., Hains, J. C., Krotkov, N., Richter, A., Vinnikov, K., and Schwab, J. J.: SO2 emissions and lifetimes: Estimates from inverse modeling using in situ and global, space-based (SCIAMACHY and OMI) observations, J. Geophys. Res.-Atmos., 116, D06304, https://doi.org/10.1029/2010JD014758, 2011.
Lee, D. S., Fahey, D. W., Skowron, A., Allen, M. R., Burkhardt, U., Chen, Q., Doherty, S. J., Freeman, S., Forster, P. M., and Fuglestvedt, J.: The contribution of global aviation to anthropogenic climate forcing for 2000 to 2018, J Atmos. Environ., 244, 117834, https://doi.org/10.1016/j.atmosenv.2020.117834, 2021.
Lee, D. S., Pitari, G., Grewe, V., Gierens, K., Penner, J. E., Petzold, A., Prather, M. J., Schumann, U., Bais, A., and Berntsen, T.: Transport impacts on atmosphere and climate: Aviation, J. Atmos. Environ., 44, 4678–4734, 2010.
Lelieveld, J.: Multi-phase processes in the atmospheric sulfur cycle, in: Interactions of C, N, P and S biogeochemical cycles and global change, edited by: Wollast, R., Mackenzie, F. T., and Chou, L., Springer, 305–331, https://doi.org/10.1007/978-3-642-76064-8_13, 1993.
Liu, F., Xing, C., Li, J., Wang, B., Chai, J., Gao, C., Huang, G., Liu, J., and Chen, D.: Could the Recent Taal Volcano Eruption Trigger an El Niño and Lead to Eurasian Warming?, Adv. Atmos. Sci., 37, 663–670, https://doi.org/10.1007/s00376-020-2041-z, 2020.
Marsing, A.: Chlorine Partitioning in the Lowermost Arctic Stratosphere During Winter-an Aircraft in Situ Measurement Perspective, Dissertation, Johannes Gutenberg-Universität Mainz, Mainz, 104 pp., https://doi.org/10.25358/openscience-6263, 2021.
Marsing, A., Jurkat-Witschas, T., Grooß, J.-U., Kaufmann, S., Heller, R., Engel, A., Hoor, P., Krause, J., and Voigt, C.: Chlorine partitioning in the lowermost Arctic vortex during the cold winter 2015/2016, Atmos. Chem. Phys., 19, 10757–10772, https://doi.org/10.5194/acp-19-10757-2019, 2019.
Martinsson, B. G., Papaspiropoulos, G., Heintzenberg, J., and Hermann, M. J. G. R. L.: Fine mode participate sulphur in the tropopause region measured from intercontinental flights (CARIBIC), Geophys. Res. Lett., 28, 1175–1178, 2001.
Martinsson, B. G., Nguyen, H. N., Brenninkmeijer, C. A. M., Zahn, A., Heintzenberg, J., Hermann, M., and van Velthoven, P. F. J.: Characteristics and origin of lowermost stratospheric aerosol at northern midlatitudes under volcanically quiescent conditions based on CARIBIC observations, J. Geophys. Res.-Atmos., 110, D12201, https://doi.org/10.1029/2004JD005644, 2005.
Martinsson, B. G., Brenninkmeijer, C. A. M., Carn, S. A., Hermann, M., Heue, K.-P., van Velthoven, P. F. J., and Zahn, A.: Influence of the 2008 Kasatochi volcanic eruption on sulfurous and carbonaceous aerosol constituents in the lower stratosphere, Geophys. Res. Lett., 36, L12813, https://doi.org/10.1029/2009GL038735, 2009.
McCormick, M. P., Thomason, L. W., and Trepte, C. R.: Atmospheric effects of the Mt Pinatubo eruption, Nature, 373, 399–404, 1995.
Miller, M., Brook, P., and Eyers, C.: Reduction of Sulphur Limits in Aviation Fuel Standards (SULPHUR), European Aviation Safety Agency (EASA), https://www.easa.europa.eu/sites/default/files/dfu/2009-SULPHUR-Reduction of sulphur limits in aviation fuel standards-Final Report.pdf (last access: 11 February 2022), 2009.
Molleker, S., Helleis, F., Klimach, T., Appel, O., Clemen, H.-C., Dragoneas, A., Gurk, C., Hünig, A., Köllner, F., Rubach, F., Schulz, C., Schneider, J., and Borrmann, S.: Application of an O-ring pinch device as a constant-pressure inlet (CPI) for airborne sampling, Atmos. Meas. Tech., 13, 3651–3660, https://doi.org/10.5194/amt-13-3651-2020, 2020.
Morgan, W. T., Allan, J. D., Bower, K. N., Capes, G., Crosier, J., Williams, P. I., and Coe, H.: Vertical distribution of sub-micron aerosol chemical composition from North-Western Europe and the North-East Atlantic, Atmos. Chem. Phys., 9, 5389–5401, https://doi.org/10.5194/acp-9-5389-2009, 2009.
Murphy, D., Froyd, K., Schwarz, J., and Wilson, J.: Observations of the chemical composition of stratospheric aerosol particles, Q. J. Roy. Meteor. Soc., 140, 1269–1278, 2014.
Nussbaumer, C. M., Pozzer, A., Tadic, I., Röder, L., Obersteiner, F., Harder, H., Lelieveld, J., and Fischer, H.: Tropospheric ozone production and chemical regime analysis during the COVID-19 lockdown over Europe, Atmos. Chem. Phys., 22, 6151–6165, https://doi.org/10.5194/acp-22-6151-2022, 2022.
Ohneiser, K., Ansmann, A., Chudnovsky, A., Engelmann, R., Ritter, C., Veselovskii, I., Baars, H., Gebauer, H., Griesche, H., Radenz, M., Hofer, J., Althausen, D., Dahlke, S., and Maturilli, M.: The unexpected smoke layer in the High Arctic winter stratosphere during MOSAiC 2019–2020 , Atmos. Chem. Phys., 21, 15783–15808, https://doi.org/10.5194/acp-21-15783-2021, 2021.
Osborne, M. J., de Leeuw, J., Witham, C., Schmidt, A., Beckett, F., Kristiansen, N., Buxmann, J., Saint, C., Welton, E. J., Fochesatto, J., Gomes, A. R., Bundke, U., Petzold, A., Marenco, F., and Haywood, J.: The 2019 Raikoke volcanic eruption – Part 2: Particle-phase dispersion and concurrent wildfire smoke emissions, Atmos. Chem. Phys., 22, 2975–2997, https://doi.org/10.5194/acp-22-2975-2022, 2022.
Pan, L. L., Randel, W. J., Gary, B. L., Mahoney, M. J., and Hintsa, E. J.: Definitions and sharpness of the extratropical tropopause: A trace gas perspective, J. Geophys. Res.-Atmos., 109, https://doi.org/10.1029/2004JD004982, 2004.
Peterson, D. A., Campbell, J. R., Hyer, E. J., Fromm, M. D., Kablick, G. P., Cossuth, J. H., and DeLand, M. T.: Wildfire-driven thunderstorms cause a volcano-like stratospheric injection of smoke, npj Climate and Atmospheric Science, 1, 30, https://doi.org/10.1038/s41612-018-0039-3, 2018.
Ploeger, F., Konopka, P., Walker, K., and Riese, M.: Quantifying pollution transport from the Asian monsoon anticyclone into the lower stratosphere, Atmos. Chem. Phys., 17, 7055-7066, 10.5194/acp-17-7055-2017, 2017.
Reifenberg, S. F., Martin, A., Kohl, M., Bacer, S., Hamryszczak, Z., Tadic, I., Röder, L., Crowley, D. J., Fischer, H., Kaiser, K., Schneider, J., Dörich, R., Crowley, J. N., Tomsche, L., Marsing, A., Voigt, C., Zahn, A., Pöhlker, C., Holanda, B. A., Krüger, O., Pöschl, U., Pöhlker, M., Jöckel, P., Dorf, M., Schumann, U., Williams, J., Bohn, B., Curtius, J., Harder, H., Schlager, H., Lelieveld, J., and Pozzer, A.: Numerical simulation of the impact of COVID-19 lockdown on tropospheric composition and aerosol radiative forcing in Europe, Atmos. Chem. Phys., 22, 10901–10917, https://doi.org/10.5194/acp-22-10901-2022, 2022.
Rolph, G., Stein, A., and Stunder, B.: Real-time Environmental Applications and Display sYstem: READY, Environ. Modell. Softw., 95, 210–228, https://doi.org/10.1016/j.envsoft.2017.06.025, 2017.
Schäfer, S., Lawrence, M., Stelzer, H., Born, W., Low, S., Aaheim, A., Adriázola, P., Betz, G., Boucher, O., Carius, A., Devine-Right, P., Gullberg, A. T., Haszeldine, S., Haywood, J., Houghton, K., Ibarrola, R., Irvine, P., Kristjansson, J.-E., Lenton, T., Link, J. S. A., Maas, A., Meyer, L., Muri, H., Oschlies, A., Proelß, A., Rayner, T., Rickels, W., Ruthner, L., Scheffran, J., Schmidt, H., Schulz, M., Scott, V., Shackley, S., Tänzler, D., Watson, M., and Vaughan, N.: The European transdisciplinary assessment of climate engineering (EuTRACE): Removing greenhouse gases from the atmosphere and reflecting sunlight away from Earth, Institute for Advanced Sustainability Studies Potsdam (IASS) e.V, https://hdl.handle.net/11858/00-001M-0000-002D-E568-C (last access: 23 November 2022), 2015.
Schiller, C. L., Bozem, H., Gurk, C., Parchatka, U., Königstedt, R., Harris, G. W., Lelieveld, J., and Fischer, H.: Applications of quantum cascade lasers for sensitive trace gas measurements of CO, CH4, N2O and HCHO, Appl. Phys. B, 92, 419–430, https://doi.org/10.1007/s00340-008-3125-0, 2008.
Schmale, J., Schneider, J., Jurkat, T., Voigt, C., Kalesse, H., Rautenhaus, M., Lichtenstern, M., Schlager, H., Ancellet, G., Arnold, F., Gerding, M., Mattis, I., Wendisch, M., and Borrmann, S.: Aerosol layers from the 2008 eruptions of Mount Okmok and Mount Kasatochi: In situ upper troposphere and lower stratosphere measurements of sulfate and organics over Europe, J. Geophys. Res., 115, D00L07, https://doi.org/10.1029/2009jd013628, 2010.
Schneider, J., Hings, S. S., Hock, N. B., Weimer, S., Borrmann, S., Fiebig, M., Petzold, A., Busen, R., and Kärcher, B.: Aircraft-based operation of an aerosol mass spectrometer: Measurements of tropospheric aerosol composition, J. Aerosol Sci., 37, 839–857, https://doi.org/10.1016/j.jaerosci.2005.07.002, 2006.
Schneider, J., Weigel, R., Klimach, T., Dragoneas, A., Appel, O., Hünig, A., Molleker, S., Köllner, F., Clemen, H.-C., Eppers, O., Hoppe, P., Hoor, P., Mahnke, C., Krämer, M., Rolf, C., Grooß, J.-U., Zahn, A., Obersteiner, F., Ravegnani, F., Ulanovsky, A., Schlager, H., Scheibe, M., Diskin, G. S., DiGangi, J. P., Nowak, J. B., Zöger, M., and Borrmann, S.: Aircraft-based observation of meteoric material in lower-stratospheric aerosol particles between 15 and 68∘ N, Atmos. Chem. Phys., 21, 989–1013, https://doi.org/10.5194/acp-21-989-2021, 2021.
Schulte, P. and Schlager, H.: In-flight measurements of cruise altitude nitric oxide emission indices of commercial jet aircraft, Geophys. Res. Lett., 23, 165–168, https://doi.org/10.1029/95GL03691, 1996.
Schulz, C., Schneider, J., Amorim Holanda, B., Appel, O., Costa, A., de Sá, S. S., Dreiling, V., Fütterer, D., Jurkat-Witschas, T., Klimach, T., Knote, C., Krämer, M., Martin, S. T., Mertes, S., Pöhlker, M. L., Sauer, D., Voigt, C., Walser, A., Weinzierl, B., Ziereis, H., Zöger, M., Andreae, M. O., Artaxo, P., Machado, L. A. T., Pöschl, U., Wendisch, M., and Borrmann, S.: Aircraft-based observations of isoprene-epoxydiol-derived secondary organic aerosol (IEPOX-SOA) in the tropical upper troposphere over the Amazon region, Atmos. Chem. Phys., 18, 14979–15001, https://doi.org/10.5194/acp-18-14979-2018, 2018.
Schumann, U., Bugliaro, L., Dörnbrack, A., Baumann, R., and Voigt, C.: Aviation Contrail Cirrus and Radiative Forcing Over Europe During 6 Months of COVID-19, Geophys. Res. Lett., 48, e2021GL092771, https://doi.org/10.1029/2021GL092771, 2021a.
Schumann, U., Poll, I., Teoh, R., Koelle, R., Spinielli, E., Molloy, J., Koudis, G. S., Baumann, R., Bugliaro, L., Stettler, M., and Voigt, C.: Air traffic and contrail changes over Europe during COVID-19: a model study, Atmos. Chem. Phys., 21, 7429–7450, https://doi.org/10.5194/acp-21-7429-2021, 2021b.
Seinfeld, J. H. and Pandis, S. N.: Atmospheric chemistry and physics: from air pollution to climate change, 2nd Edn., John Wiley & Sons, Inc., Hoboken, New Jersey, 2006.
Sheng, J.-X., Weisenstein, D. K., Luo, B.-P., Rozanov, E., Stenke, A., Anet, J., Bingemer, H., and Peter, T.: Global atmospheric sulfur budget under volcanically quiescent conditions: Aerosol-chemistry-climate model predictions and validation, J. Geophys. Res.-Atmos., 120, 256–276, https://doi.org/10.1002/2014JD021985, 2015.
Solomon, S., Daniel, J. S., Neely III, R. R., Vernier, J. P., Dutton, E. G., and Thomason, L. W.: The persistently variable “background” stratospheric aerosol layer and global climate change, Science, 333, 866–870, https://doi.org/10.1126/science.1206027, 2011.
Speidel, M., Nau, R., Arnold, F., Schlager, H., and Stohl, A.: Sulfur dioxide measurements in the lower, middle and upper troposphere: Deployment of an aircraft-based chemical ionization mass spectrometer with permanent in-flight calibration, Atmos. Environ., 41, 2427–2437, https://doi.org/10.1016/j.atmosenv.2006.07.047, 2007.
Stein, A. F., Draxler, R. R., Rolph, G. D., Stunder, B. J., Cohen, M. D., and Ngan, F.: NOAA's HYSPLIT atmospheric transport and dispersion modeling system, B. Am. Meteorol. Soc., 96, 2059–2077, 2015.
Stockwell, W. R. and Calvert, J. G.: The mechanism of the HO-SO2 reaction, Atmos. Environ., 17, 2231–2235, https://doi.org/10.1016/0004-6981(83)90220-2, 1983.
Thouret, V., Cammas, J.-P., Sauvage, B., Athier, G., Zbinden, R., Nédélec, P., Simon, P., and Karcher, F.: Tropopause referenced ozone climatology and inter-annual variability (1994–2003) from the MOZAIC programme, Atmos. Chem. Phys., 6, 1033–1051, https://doi.org/10.5194/acp-6-1033-2006, 2006.
Tomsche, L., Pozzer, A., Ojha, N., Parchatka, U., Lelieveld, J., and Fischer, H.: Upper tropospheric CH4 and CO affected by the South Asian summer monsoon during the Oxidation Mechanism Observations mission, Atmos. Chem. Phys., 19, 1915–1939, https://doi.org/10.5194/acp-19-1915-2019, 2019.
van Heerwaarden, C. C., Mol, W. B., Veerman, M. A., Benedict, I., Heusinkveld, B. G., Knap, W. H., Kazadzis, S., Kouremeti, N., and Fiedler, S.: Record high solar irradiance in Western Europe during first COVID-19 lockdown largely due to unusual weather, Commun. Earth Environ., 2, 37, https://doi.org/10.1038/s43247-021-00110-0, 2021.
Vogel, B., Günther, G., Müller, R., Grooß, J.-U., Hoor, P., Krämer, M., Müller, S., Zahn, A., and Riese, M.: Fast transport from Southeast Asia boundary layer sources to northern Europe: rapid uplift in typhoons and eastward eddy shedding of the Asian monsoon anticyclone, Atmos. Chem. Phys., 14, 12745–12762, https://doi.org/10.5194/acp-14-12745-2014, 2014.
Vogel, B., Günther, G., Müller, R., Grooß, J.-U., Afchine, A., Bozem, H., Hoor, P., Krämer, M., Müller, S., Riese, M., Rolf, C., Spelten, N., Stiller, G. P., Ungermann, J., and Zahn, A.: Long-range transport pathways of tropospheric source gases originating in Asia into the northern lower stratosphere during the Asian monsoon season 2012, Atmos. Chem. Phys., 16, 15301–15325, https://doi.org/10.5194/acp-16-15301-2016, 2016.
Vogel, B., Müller, R., Günther, G., Spang, R., Hanumanthu, S., Li, D., Riese, M., and Stiller, G. P.: Lagrangian simulations of the transport of young air masses to the top of the Asian monsoon anticyclone and into the tropical pipe, Atmos. Chem. Phys., 19, 6007–6034, https://doi.org/10.5194/acp-19-6007-2019, 2019.
Voigt, C., Schumann, U., Jurkat, T., Schäuble, D., Schlager, H., Petzold, A., Gayet, J.-F., Krämer, M., Schneider, J., Borrmann, S., Schmale, J., Jessberger, P., Hamburger, T., Lichtenstern, M., Scheibe, M., Gourbeyre, C., Meyer, J., Kübbeler, M., Frey, W., Kalesse, H., Butler, T., Lawrence, M. G., Holzäpfel, F., Arnold, F., Wendisch, M., Döpelheuer, A., Gottschaldt, K., Baumann, R., Zöger, M., Sölch, I., Rautenhaus, M., and Dörnbrack, A.: In-situ observations of young contrails – overview and selected results from the CONCERT campaign, Atmos. Chem. Phys., 10, 9039–9056, https://doi.org/10.5194/acp-10-9039-2010, 2010.
Voigt, C., Jessberger, P., Jurkat, T., Kaufmann, S., Baumann, R., Schlager, H., Bobrowski, N., Giuffrida, G., and Salerno, G.: Evolution of CO2, SO2, HCl, and HNO3 in the volcanic plumes from Etna, Geophys. Res. Lett., 41, 2196–2203, https://doi.org/10.1002/2013gl058974, 2014.
Voigt, C., Lelieveld, J., Schlager, H., Schneider, J., Curtius, J., Meerkötter, R., Sauer, D., Bugliaro, L., Bohn, B., Crowley, J. N., Erbertseder, T., Groß, S., Hahn, V., Li, Q., Mertens, M., Pöhlker, M. L., Pozzer, A., Schumann, U., Tomsche, L., Williams, J., Zahn, A., Andreae, M., Borrmann, S., Bräuer, T., Dörich, R., Dörnbrack, A., Edtbauer, A., Ernle, L., Fischer, H., Giez, A., Granzin, M., Grewe, V., Harder, H., Heinritzi, M., Holanda, B. A., Jöckel, P., Kaiser, K., Krüger, O. O., Lucke, J., Marsing, A., Martin, A., Matthes, S., Pöhlker, C., Pöschl, U., Reifenberg, S., Ringsdorf, A., Scheibe, M., Tadic, I., Zauner-Wieczorek, M., Henke, R., and Rapp, M.: Cleaner skies during the COVID-19 lockdown, B. Am. Meteorol. Soc., 103, E1796–E1827, https://doi.org/10.1175/bams-d-21-0012.1, 2022.
von Hobe, M., Ploeger, F., Konopka, P., Kloss, C., Ulanowski, A., Yushkov, V., Ravegnani, F., Volk, C. M., Pan, L. L., Honomichl, S. B., Tilmes, S., Kinnison, D. E., Garcia, R. R., and Wright, J. S.: Upward transport into and within the Asian monsoon anticyclone as inferred from StratoClim trace gas observations, Atmos. Chem. Phys., 21, 1267–1285, https://doi.org/10.5194/acp-21-1267-2021, 2021.
Williamson, C. J., Kupc, A., Rollins, A., Kazil, J., Froyd, K. D., Ray, E. A., Murphy, D. M., Schill, G. P., Peischl, J., Thompson, C., Bourgeois, I., Ryerson, T. B., Diskin, G. S., DiGangi, J. P., Blake, D. R., Bui, T. P. V., Dollner, M., Weinzierl, B., and Brock, C. A.: Large hemispheric difference in nucleation mode aerosol concentrations in the lowermost stratosphere at mid- and high latitudes, Atmos. Chem. Phys., 21, 9065–9088, https://doi.org/10.5194/acp-21-9065-2021, 2021.
Zahn, A., Weppner, J., Widmann, H., Schlote-Holubek, K., Burger, B., Kühner, T., and Franke, H.: A fast and precise chemiluminescence ozone detector for eddy flux and airborne application, Atmos. Meas. Tech., 5, 363–375, https://doi.org/10.5194/amt-5-363-2012, 2012.
Ziereis, H., Schlager, H., Schulte, P., van Velthoven, P. F. J., and Slemr, F.: Distributions of NO, NOx, and NOy in the upper troposphere and lower stratosphere between 28∘ and 61∘ N during POLINAT 2, J. Geophys. Res.-Atmos., 105, 3653–3664, https://doi.org/10.1029/1999JD900870, 2000.