the Creative Commons Attribution 4.0 License.
the Creative Commons Attribution 4.0 License.
 | 09 Nov 2022
Assimilation of S5P/TROPOMI carbon monoxide data with the global CAMS near-real-time system
Ilse Aben
Melanie Ades
Tobias Borsdorff
Johannes Flemming
Luke Jones
Jochen Landgraf
Bavo Langerock
Philippe Nedelec
Mark Parrington
Roberto Ribas
The Tropospheric Monitoring Instrument (TROPOMI) on the Copernicus Sentinel 5 Precursor (S5P) satellite, launched in October 2017, provides a wealth of atmospheric composition data, including total columns of carbon monoxide (TCCO) at high horizontal resolution (5.5 km × 7 km). Near-real-time TROPOMI TCCO data have been monitored in the global data assimilation system of the Copernicus Atmosphere Monitoring Service (CAMS) since November 2018 to assess the quality of the data. The CAMS system already routinely assimilates TCCO data from the Measurement of Pollution in the Troposphere (MOPITT) instrument and the Infrared Atmospheric Sounding Interferometer (IASI) outside the polar regions.
The assimilation of TROPOMI TCCO data in the CAMS system was tested for the period 6 July to 31 December 2021, i.e. after the TROPOMI algorithm update to version 02.02.00 in July 2021. By assimilating TROPOMI TCCO observations, the CAMS CO columns increase by on average 8 %, resulting in an improved fit to independent observations (IAGOS aircraft profiles and NDACC Fourier transform infrared (FTIR) tropospheric and total-column CO data) compared to a version of the CAMS system where only TCCO from MOPITT and IASI is assimilated. The largest absolute and relative changes from the assimilation of TROPOMI CO are found in the lower and middle troposphere, i.e. that part of the atmosphere that is not already well constrained by the assimilated TIR MOPITT and IASI data. The largest impact near the surface comes from clear-sky TROPOMI data over land, and additional vertical information comes from the retrievals of measurements in cloudy conditions.
July and August 2021 saw record numbers of boreal wildfires over North America and Russia, leading to large amounts of CO being released into the atmosphere. The paper assesses the impact of TROPOMI CO assimilation on selected CO plumes more closely. While the CO column can be well constrained by the assimilation of TROPOMI CO data, and the fit to individual IAGOS CO profiles in the lower and middle troposphere is considerably improved, the TROPOMI CO columns do not provide further constraints on individual plumes that are transported across continents and oceans at altitudes above 500 hPa.
- Article
(7072 KB) - Full-text XML
-
Supplement
(2888 KB) - BibTeX
- EndNote


The Copernicus Atmosphere Monitoring Service (CAMS; Peuch et al., 2022), implemented by the European Centre for Medium-Range Weather Forecasts (ECMWF) as part of the European Union's Copernicus Programme, produces daily global near-real-time (NRT) forecasts of atmospheric composition up to 5 d ahead. To improve the quality of the CAMS forecasts, the initial conditions for some of the chemical species, including carbon monoxide (CO), nitrogen dioxide (NO2), ozone (O3), and sulfur dioxide (SO2), and for aerosols are provided by assimilating satellite retrievals of atmospheric composition using ECMWF's 4-dimensional variations (4D-Var) data assimilation system (Rémy et al., 2019; Inness et al., 2019b, c, 2015b; Benedetti et al., 2009). The CAMS global NRT system is constantly advanced and improved through updates to the chemical scheme and the numerical weather prediction (NWP) model and by including additional satellite retrievals from new satellite instruments as they become available, as documented in Inness et al. (2019c).
A wealth of new atmospheric composition data became available with the launch of the Sentinel 5-Precursor (S5P) satellite in October 2017. S5P carries the TROPOspheric Monitoring Instrument (TROPOMI), which provides high-resolution spectral measurements in the ultraviolet (UV), visible (Vis), near-infrared (NIR), and shortwave infrared (SWIR) part of the spectrum. This wide spectral range allows for the retrieval of several atmospheric pollutant species, including O3, NO2, SO2, and formaldehyde (HCHO) from the UV–Vis spectrum and CO and methane (CH4) from the SWIR part of the spectrum (Veefkind et al., 2012). These species are all forecast by the CAMS global system, making TROPOMI the perfect instrument to provide observations for the CAMS NRT analysis at unprecedented horizontal resolution of about 5.5 km × 3.5 km for the species retrieved in the UV–Vis and 5.5 km × 7 km for CO and CH4 retrieved from the SWIR. TROPOMI S5P has been operational since April 2018, and TROPOMI NRT CO data have been routinely monitored in the CAMS global NRT system since November 2018.
Carbon monoxide has natural and anthropogenic sources (Seinfeld and Pandis, 2006; Kanakidou and Crutzen, 1999). Its main sources are incomplete fossil fuel and biomass burning (Worden et al., 2013), which lead to enhanced surface concentrations and in situ production via the oxidation of CH4, isoprene, and other organic trace gases. Combustion and chemical in situ sources can produce similar amounts of CO on the global scale (Gaubert et al., 2016) but vary in space and time because of the changing distribution of anthropogenic and wildfire CO emissions, as well as of the biogenic isoprene emissions. In seasonal means, the largest CO concentrations are found over the industrial regions of Asia, North America, and Europe and over the tropical biomass burning areas. However, in areas with large biogenic emissions (e.g. tropical forests), oxidation of biogenic volatile organic compounds (VOCs) contributes strongly to the production of CO (Griffin et al., 2007). Hudman et al. (2008) found that over the eastern United States during summer the biogenic sources of CO were higher than the anthropogenic ones. Boreal and austral wildfires can also lead to increased CO abundances outside the tropics. Tropical and extratropical wildfires show large inter-annual variability, leading to pronounced CO anomalies in certain years (Flemming and Inness, 2021; Inness et al., 2015a). The main loss process for CO is the reaction with the hydroxyl radical (OH). CO surface concentrations are higher during local winter than during the summer months because of the shorter CO lifetime in summer due to higher OH concentrations and more intense mixing processes. Tropical biomass burning is most intense during the dry season (December–April in the Northern Hemisphere (NH) tropics, July–October in the Southern Hemisphere (SH) tropics). CO has a lifetime of several weeks and can serve as a tracer for regional and inter-continental transport of polluted air. CO is an indirect short-lived climate forcer because it is an important precursor for tropospheric ozone (Szopa et al., 2021, Sect. 6.3.3.2) and because it impacts OH, which controls the lifetime of CH4.
Before new data can be assimilated in the CAMS NRT analysis, the quality of the data in relation to the current system must be established. This is usually done by including the data passively in the data assimilation system, so that statistics of the differences between the observations and collocated model fields can be calculated without the data influencing the analysis and subsequent forecast (Inness et al., 2019c; Garrigues et al., 2022). We call this “monitoring” of the observations. The model fields are interpolated in time and space to the location of the observations, and the model equivalents of the observations are calculated, for example, by applying the averaging kernels of the observations to the model fields. Temporal and spatial statistics of the differences between the model fields and the observations can then be analysed.
The differences between the observations and the model equivalents are called departures. We distinguish between first-guess departures (observations minus model first-guess field) and analysis departures (observations minus analysed field). The first-guess field is the model forecast from the previous analysis, i.e. before the fields are changed by the analysis increments. Long-term monitoring of the departures can disclose errors and biases in the satellite data products, as well as errors or biases in the model. Because the departures are usually small, they show up changes more clearly than when looking at the absolute model fields or observation values. A sudden jump on a global scale, which is larger than the instrument noise, can be an indication of problems in the observations or the model. The advantage of using an assimilation system to monitor satellite data is that it provides continuous global coverage and allows us to build up global and regional statistics quickly. If the monitoring results show the data to be of good quality, i.e. departures are stable, there are no sudden jumps, and the biases with respect to the model are not too large, assimilation tests with the data begin, followed by the operational use of the data in the CAMS global NRT system.
Initial work about the use of early TROPOMI CO data in the CAMS system was reported in an ECMWF technical memorandum (Inness et al., 2019a). The current work makes use of a longer time series and a more mature retrieval version of TROPOMI CO data. It documents the preparation of the global CAMS NRT system for the routine NRT assimilation of TROPOMI total-column CO (TCCO) data, by presenting results from assimilation tests with the NRT TROPOMI TCCO data for the period 6 July to 31 December 2021. The paper is structured in the following way. Section 2 describes the CAMS model and data assimilation system as well as the NRT TROPOMI TCCO data product and how the data are included in the global CAMS system. Section 3 shows results from assimilation tests with the TROPOMI TCCO data and validation with independent observations. Section 4 gives the conclusions. Results from long-term monitoring of TROPOMI CO data with the CAMS system are given in the Supplement.
2.1 CAMS system and CO analysis
2.1.1 CAMS model and data assimilation system
The CAMS model and data assimilation system is a specific configuration based on ECMWF's Integrated Forecasting System (IFS). The chemical mechanism of the IFS versions used between 2018 and 2021 is an extended version of the Carbon Bond Mechanism 5 (CB05; Huijnen et al., 2010), as implemented in Chemical Transport Model (CTM) Transport Model 5 (TM5). It is documented in Flemming et al. (2015, 2017), and more recent updates are given in Inness et al. (2019b) and Huijnen et al. (2019). CB05 is a tropospheric chemistry scheme with 57 species and 131 reactions. The horizontal resolution of the CAMS model is approximately 40 km (T511 linear spectral truncation and grid), i.e. coarser than the resolution of the TROPOMI data.
The NRT global CAMS system has used CAMS_GLOB_ANT anthropogenic emissions (Granier et al., 2019) since July 2019 and used MACCity anthropogenic emissions (Granier et al., 2011) before then. Biomass burning emissions have come from the Global Fire Assimilation System V1.4 (GFAS; Kaiser et al., 2012) since October 2020 and were GFAS V1.2 before. Biogenic emissions are from CAMS_GLOB_BIO from July 2019 onwards, based on the Model of Emissions of Gases and Aerosols from Nature (MEGAN; Guenther et al., 2006), and from MEGAN_MACC, a different application of the MEGAN model, before then (see also Table S1 in the Supplement for CAMS model changes).
The IFS uses an incremental four-dimensional variational (4D-Var) data assimilation system going back to Courtier et al. (1994). In the current CAMS 4D-Var setup, a cost function that measures the differences between the model fields and the observations is minimized to obtain the best possible forecast through the length of the assimilation window by adjusting the initial conditions. Several atmospheric composition fields, including CO, are included in the control vector and minimized together with the meteorological control variables. The data assimilation methodology for the atmospheric composition fields remains unchanged compared to the one described in Inness et al. (2015b), but the background errors for CO were updated in July 2019 (Fig. 1). CAMS uses 12 h assimilation windows from 03:00 to 15:00 and 15:00 to 03:00 UTC and two minimizations at spectral truncations T95 (∼210 km) and T159 (∼110 km).
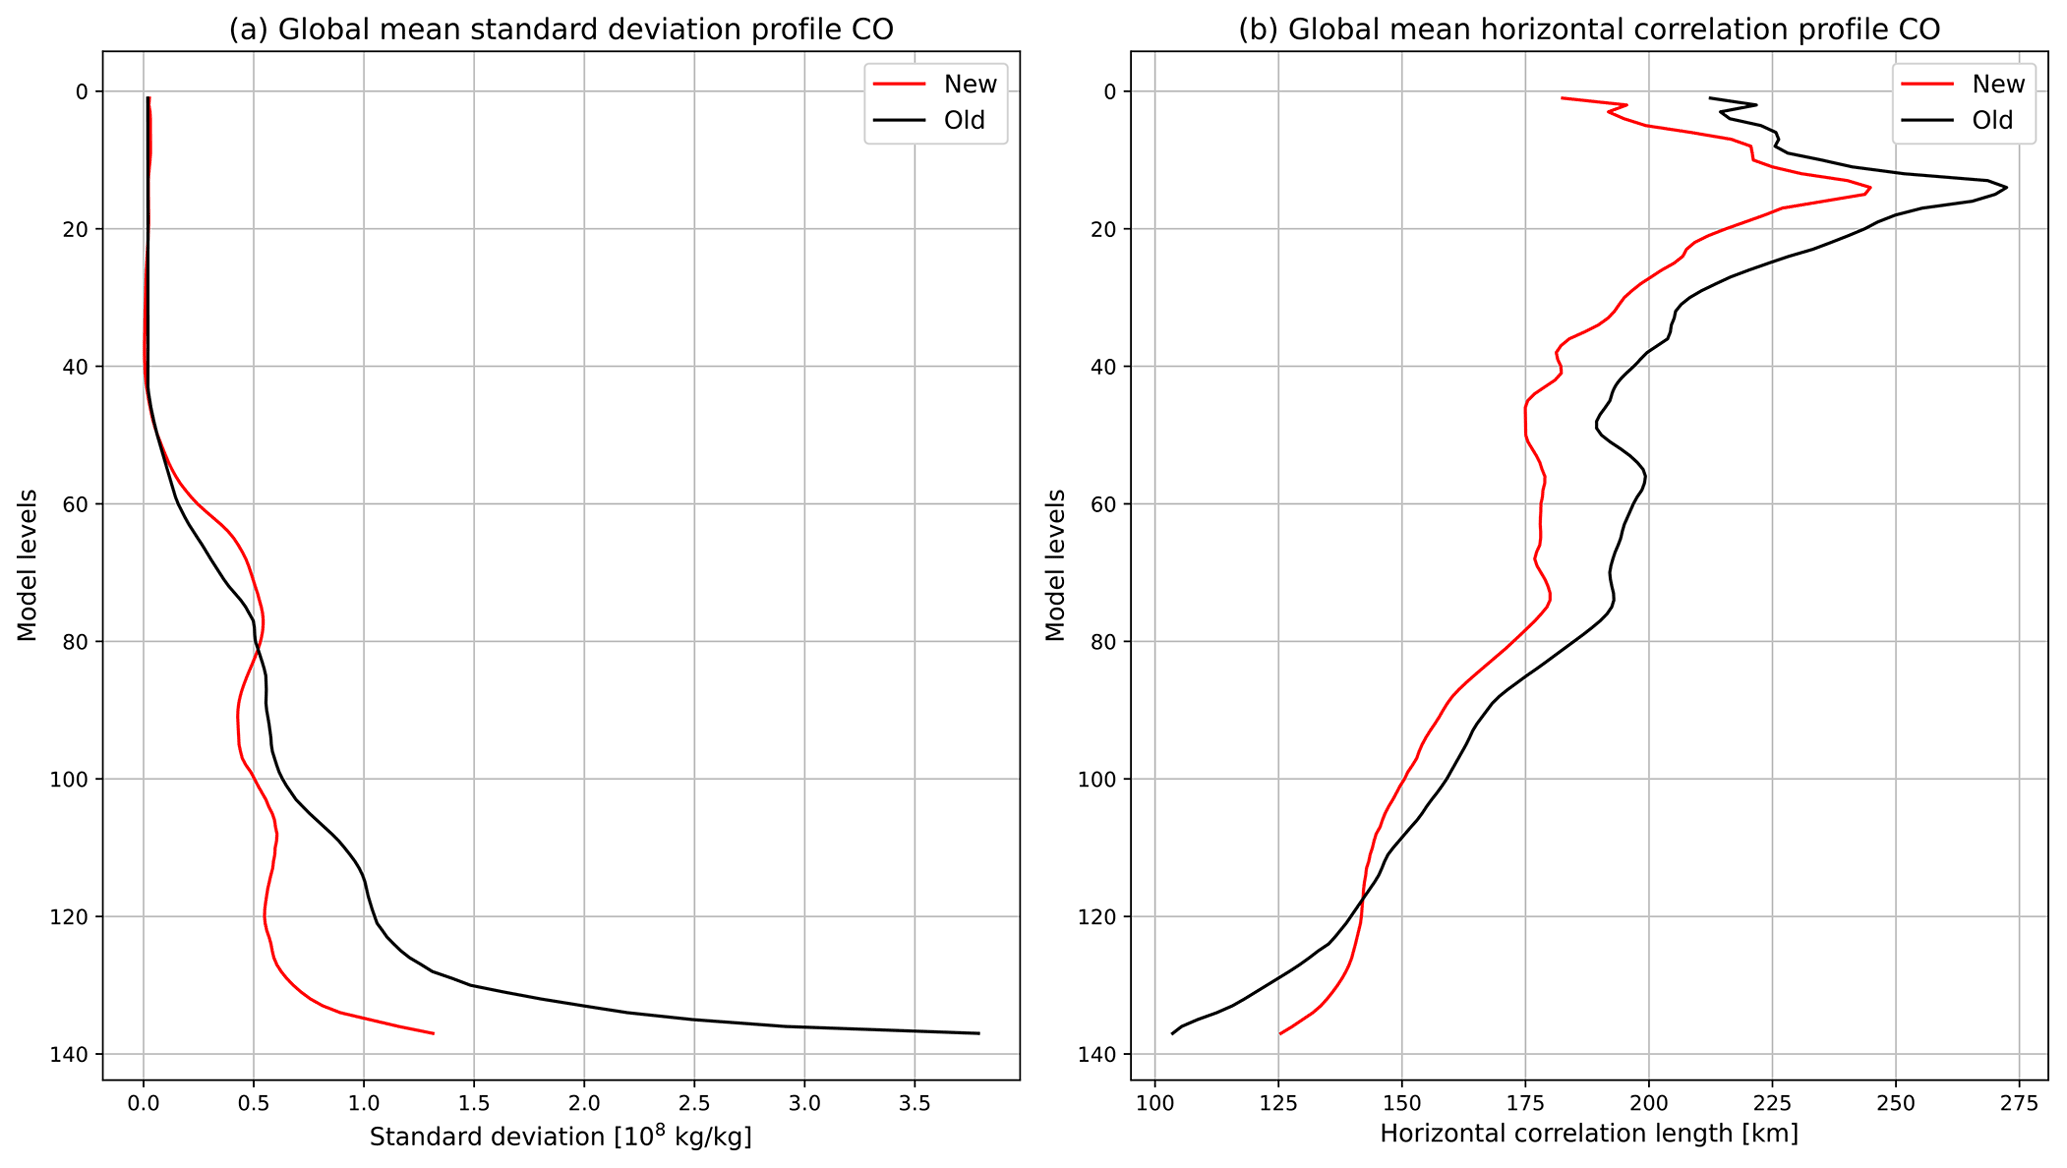
Figure 1Profiles of globally averaged CO (a) background error standard deviation and (b) horizontal background error correlation profiles used from CY46R1 to CY47R2 (black, OLDBGE) and in CY47R3 (red, NEWBGE). Model level 137 is the surface, model level 1 the top of the atmosphere, and model level 60 around 100 hPa.
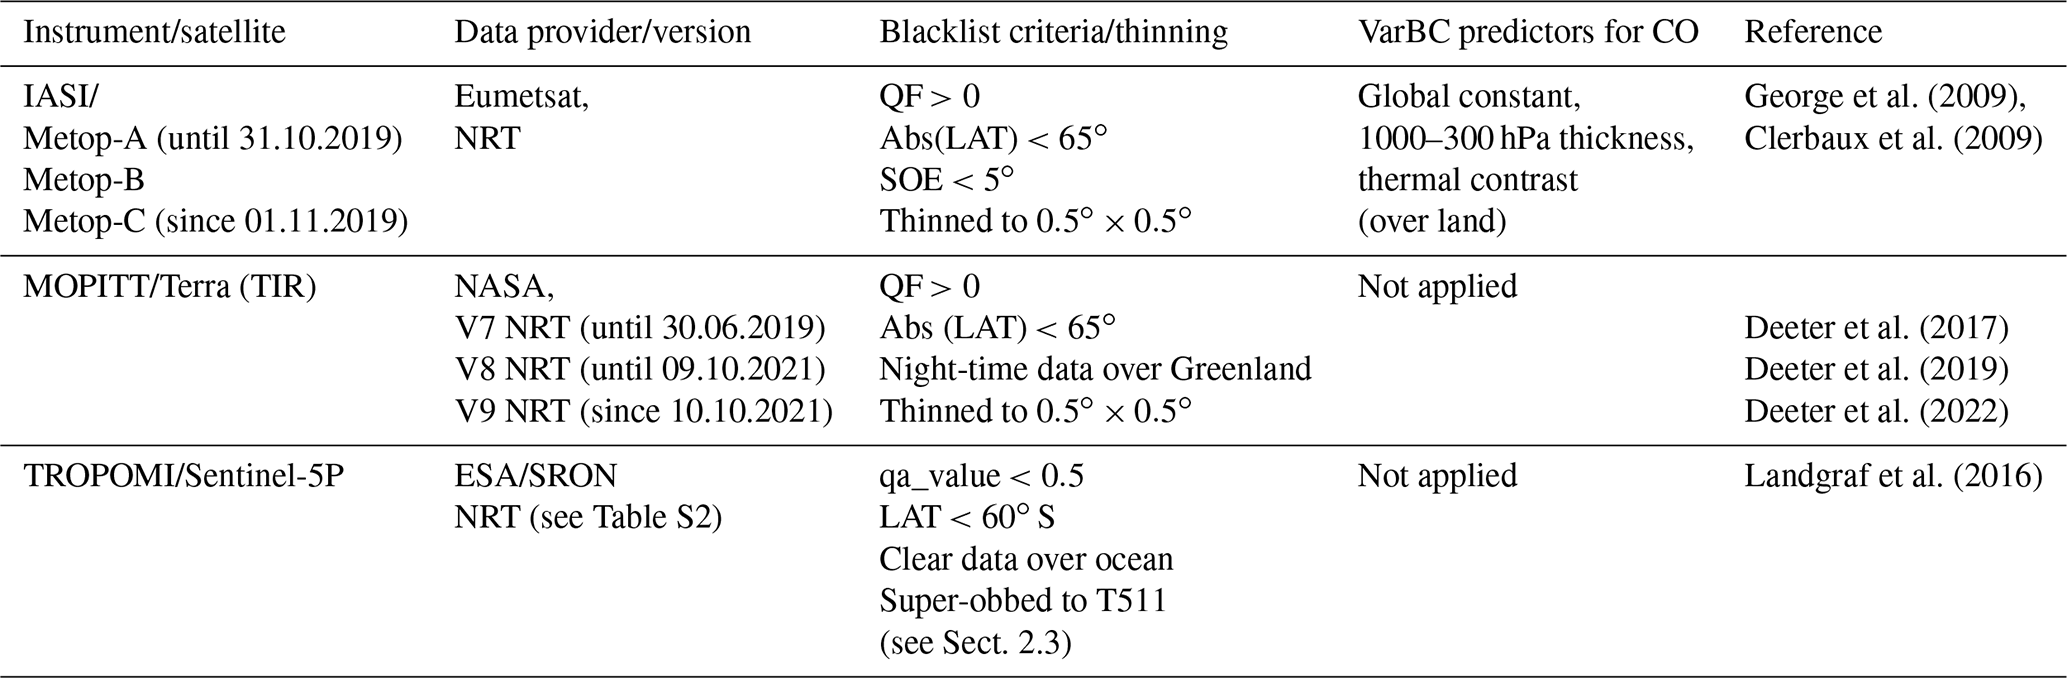
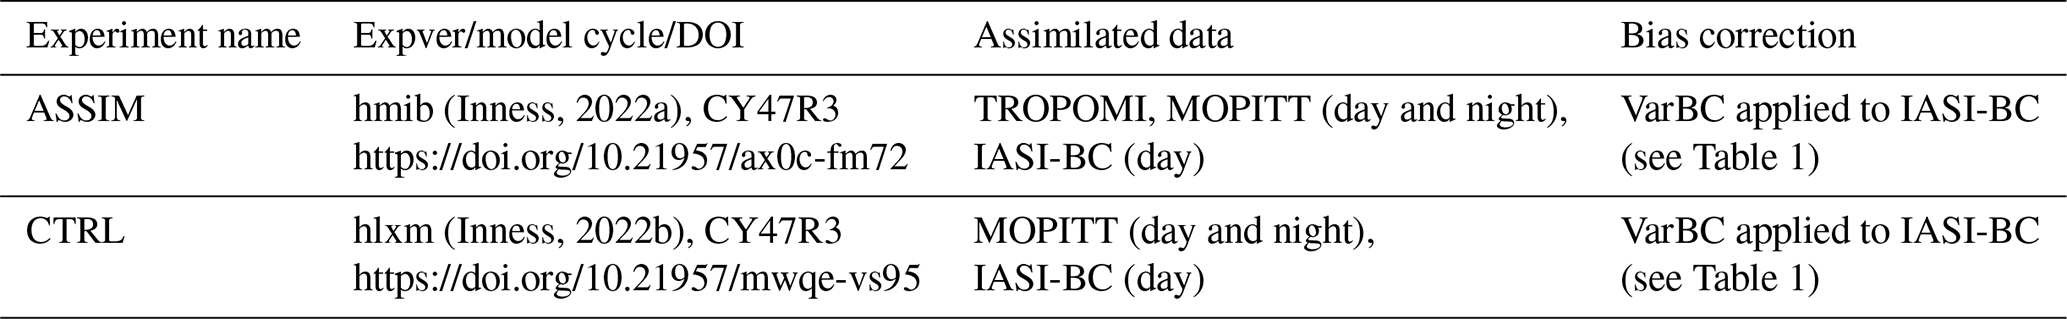
TCCO products from IASI and MOPITT instruments are routinely assimilated in the CAMS NRT system (see Table 1). The MOPITT data used by CAMS are the NRT thermal infrared (TIR) MOPITT retrievals from the 4.7 µm band (Deeter et al., 2017, 2019, 2022). IASI TCCO is retrieved from the same band (spectral range 2143–2181.25 cm−1), and the data used during the period covered in this paper are produced by Eumetsat using LATMOS/ULB's Fast Optimal Retrievals on Layers for IASI (FORLI, v20151001) algorithm, documented in George et al. (2009) and Clerbaux et al. (2009). The TIR retrievals have the largest sensitivity to CO in the mid-troposphere (Deeter et al., 2013; George et al., 2015). In the CAMS system, IASI and MOPITT TCCO data are thinned to a horizontal resolution of by randomly selecting one observation in each grid cell.
Table 1Satellite TCCO data products used or monitored in the global CAMS NRT system since November 2018. VarBC stands for variational bias correction, LAT denotes latitude, SOE solar elevation, QF the overall quality flags given by the data providers (QF =0 for good data), and qa_value a quality assurance flag given in the TROPOMI data.
The observation operator for TCCO in the CAMS system applies the averaging kernels of the observations to the model fields and calculates the model equivalent at the observation location and time, giving departures between the observations and the model as
Here, d is the departure between observation and model equivalent in observation space, y the TCCO retrieval, and the observation operator to calculate the model equivalent of the observations from the 137 model level fields (xm). The TCCO retrievals can be written using the averaging kernel A, that relates the true vertical CO profile xt to the retrieved total columns
where xap is an a priori profile used in the retrieval of y and ε an error term for measurement errors and errors in the forward model. In the observation operator we apply the averaging kernels A to the model profiles, xm, to smooth the model profiles according to the sensitivity of the retrievals. This means Eq. (1) can be written as
where H is an operator to calculate CO layers from the model profiles on the vertical grid of the a priori profile. Using this observation operator, we remove the explicit influence of the a priori profile in the calculation of the departures, but knowledge of the a priori profile is still needed in the observation operator calculations for IASI and MOPITT TCCO retrievals. Also, the impact of the a priori profile remains implicitly through the dependence of the retrieval y and the retrieval error on the a priori profile, since a badly chosen a priori profile will generally lead to larger retrieval errors and larger departures.
A variational bias correction (VarBC) scheme (Dee and Uppala, 2009), where biases are estimated during the analysis by including bias parameters in the control vector, is used for the TCCO IASI data. In this scheme, the bias corrections are continuously adjusted to optimize the consistency with all information used in the analysis. VarBC is applied to the IASI TCCO data, with three predictors: (1) the thickness of the 1000–300 hPa layer, (2) the thermal contrast between the surface temperature and the temperature of the lowest model level over land, and (3) a global constant. The thickness parameter was chosen to allow for latitudinal variations of the bias correction. MOPITT TCCO data are used to “anchor” the bias correction, i.e. are assimilated without bias correction. Experience has shown that it is important to anchor the variational bias correction scheme, to avoid drifts in the model fields (Inness et al., 2013). MOPITT is used as the anchor because it was the first instrument assimilated in the early CAMS system, and the assimilation of IASI CO was added later. To prepare the CAMS system for the eventual loss of the MOPITT instrument, and because IASI and CAMS CO show good agreement (see Figs. 7 and 8 below) in the next CAMS model upgrade (planned for Q2/2023), the VarBC settings will be changed to use IASI-C as anchor and to bias-correct MOPITT and IASI-B CO.
The CAMS NRT model and data assimilation system is continually improved as the NWP model and the chemical scheme are further developed, and new satellite data are added. Table S1 lists the model upgrades that were implemented since the monitoring of TROPOMI CO data began in the CAMS NRT system in November 2018. The change to model CY46R1 on 9 July 2019 had a big impact on the CO analysis field and led to increased negative biases (see Fig. 3 below), likely to be linked to a change of the emission inventories.
In the CAMS 4D-Var data assimilation system, the background error covariance matrix is given in a wavelet formulation (Fisher, 2004, 2006). This allows for both spatial and spectral variations of the background error covariances. The background errors for CO used in model cycles CY46R1-CY47R2 (OLDBGE) were calculated using the National Meteorological Center (NMC) method (Parrish and Derber, 1992). For this, 150 d of 2 d IFS forecasts (using a 137 L configuration of CY45R1) were run, and differences between pairs of 24 and 48 h forecast fields were calculated whose statistical characteristics serve as a proxy for the background errors. For model CY47R3, new CO background errors were calculated (NEWBGE), again with the NMC method but with a newer model configuration (CY47R1), again using 150 d of 2 d forecasts. By updating the background errors, we remain consistent with the model as it evolves. The 150 d covered the end of NH winter, spring, and the beginning of NH summer and thus accounts for some seasonal differences in CO distributions. For future recalculation of the background errors, it is planned to use a sample composed of a NH summer and winter period to better account for the seasonal differences in CO, including its lifetime and changes in CO emissions, that might affect the background errors.
Figure 1 shows the globally averaged vertical CO background error standard deviation profiles and the horizontal correlation profiles from NEWBGE and OLDBGE. NEWBGE standard deviation values are smaller than OLDBGE ones in the troposphere below model level 80 (about 260 hPa) and larger between model levels 80 and 65 (about 260–130 hPa). This means that tropospheric CO increments will be smaller with NEWBGE (assuming the data and all other model settings are the same), as the background is penalized less in the 4D-Var analysis with NEWBGE than with OLDBGE. The global mean horizontal correlations are longer for NEWBGE than OLDBGE in the boundary layer (below model level 120, about 920 hPa) but shorter above. The horizontal correlations are longest over the continents at the surface, in the tropics in the free troposphere, and in mid-latitudes around 200 hPa (not shown). The CO background errors are univariate; i.e. the error covariance matrix between CO and other chemical species or dynamical fields is diagonal. They are also constant in time, and globally averaged vertical background error standard deviation profiles are used in the 4D-Var procedure. Work is ongoing to allow for the use of seasonally and geographically varying background standard deviation profiles for the CAMS atmospheric composition fields. This should improve the characterization of background errors that are likely to vary with season and region due to factors such as CO emissions, lifetime, and tropopause height.
2.1.2 Quality of CAMS CO analysis fields
CAMS NRT data are routinely validated, and validation reports are produced every 3 months (https://atmosphere.copernicus.eu/global-services, last access: 28 October 2022, for example, Errera et al., 2021). These reports show that the seasonality of the CO field is reproduced well by the global CAMS NRT system, i.e. currently still without the assimilation of TROPOMI data, when compared with independent data. However, the CAMS CO data generally have a negative bias. Compared to IAGOS (In-service Aircraft for a Global Observing System; https://www.iagos.org/, last access: 28 October 2022) aircraft CO data (Nedelec et al., 2015) the NRT CAMS data show the largest underestimations in the lower troposphere, while upper layers show a better agreement. On average, the modified normalized mean biases (MNMBs) with respect to IAGOS CO range between −10 % and 5 %, while correlations are mostly between 40 % and 60 % (e.g. Errera et al., 2021). Figure 2 shows profiles of seasonal mean relative differences between CAMS profiles and IAGOS (calibrated level 2) CO profiles at Frankfurt Airport and averaged over airports in the eastern United States. These airports were chosen because they had the best data coverage for the period discussed here. Figure 2 shows that the largest relative errors are found in the lower troposphere, with negative biases between −15 % and −25 % in all seasons. Differences above 700 hPa vary between −5 % and −15 %. Comparisons with IAGOS cruise level data given in the CAMS validation reports showed mostly negative biases for CAMS data in September, October, and November (SON) and March, April, and May (MAM) 2021 and no systematic biases in June, July, and August (JJA) 2021 and December, January, and February (DJF) 2020/2021 when positive and negative biases within ±20 % were found in most regions (Errera et al., 2021).
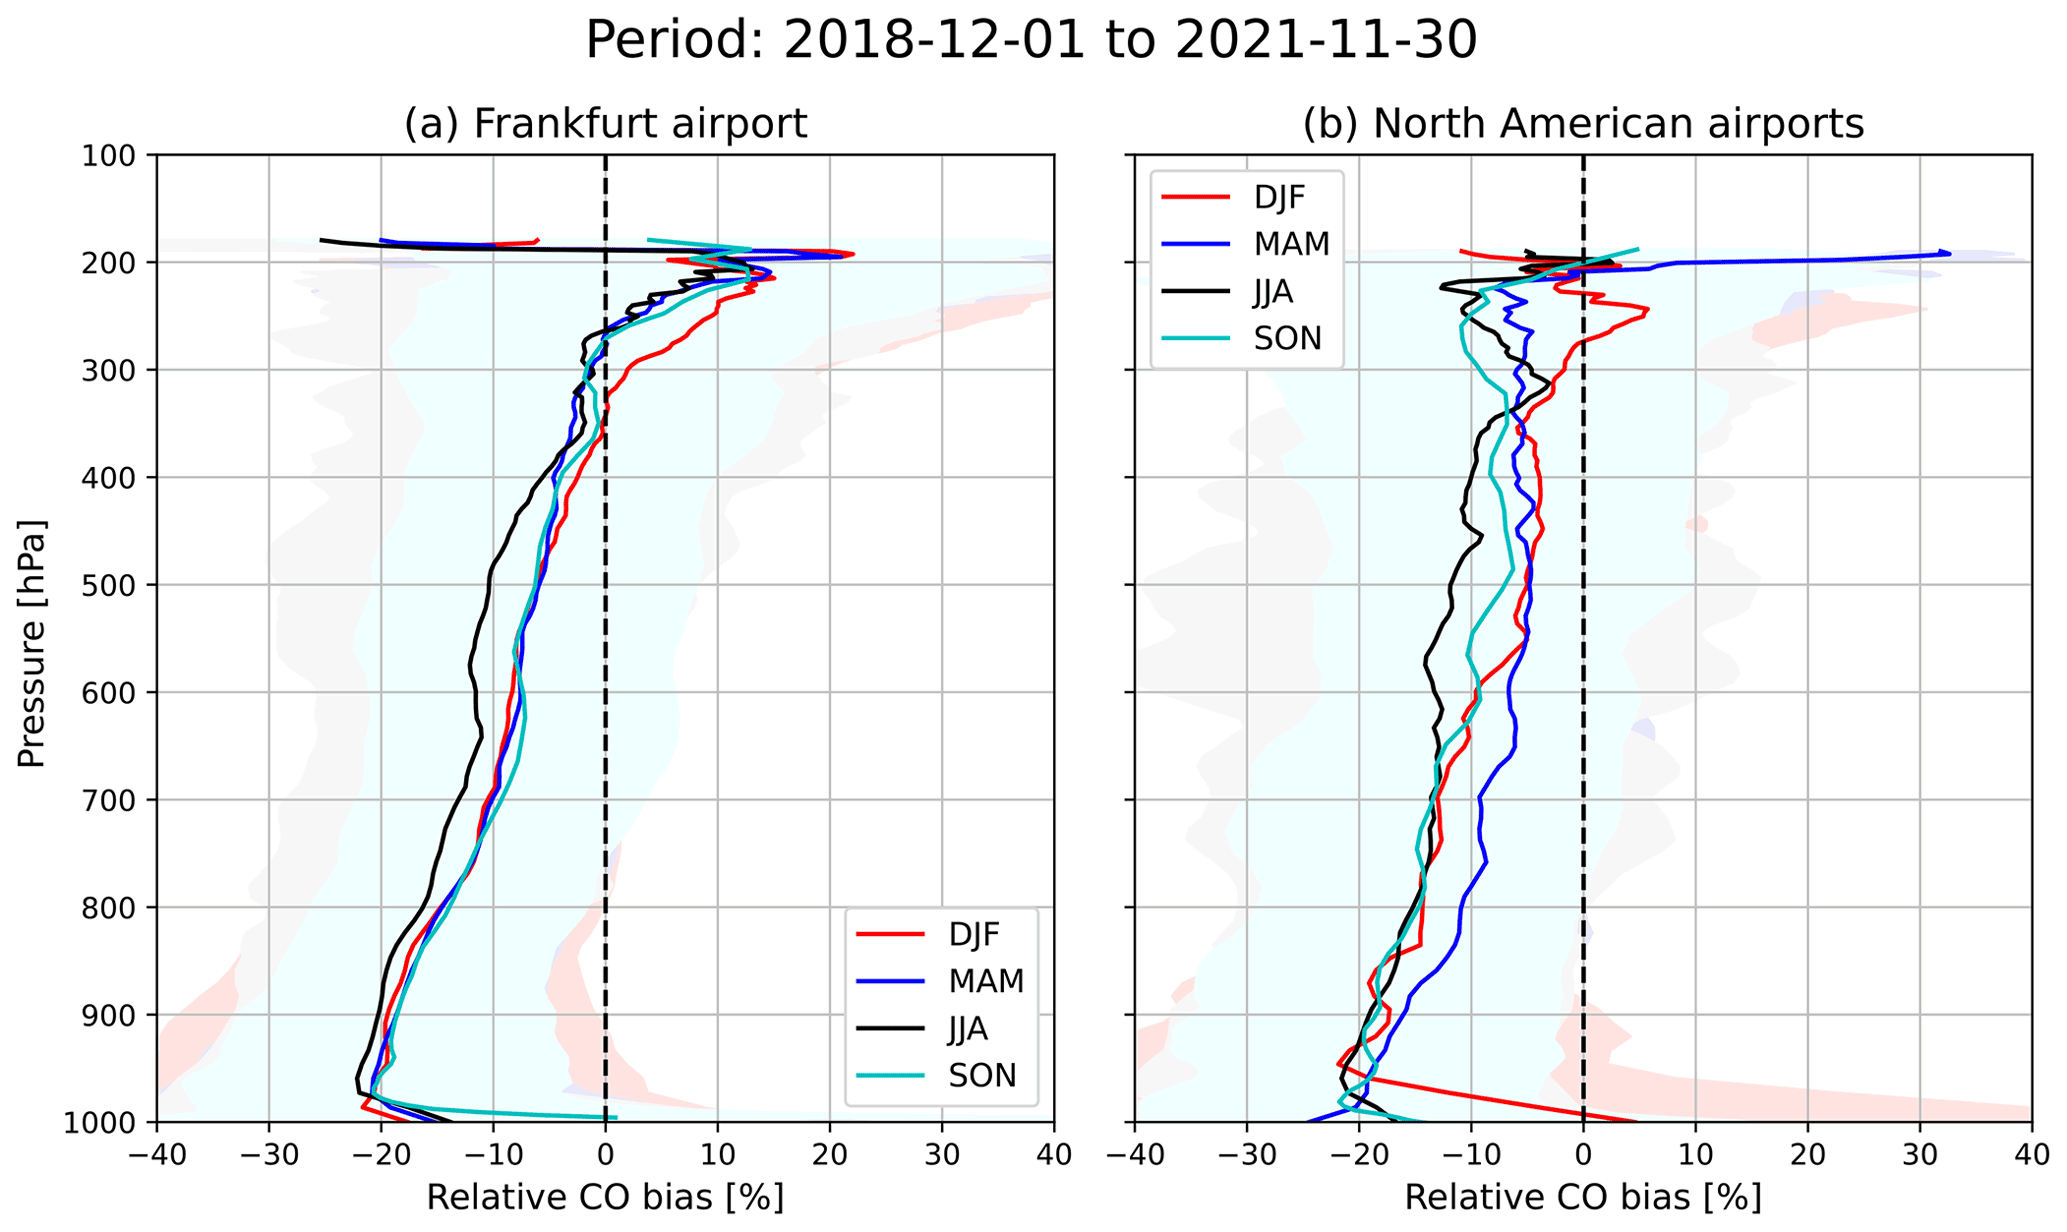
Figure 2Seasonal mean relative CO biases (%) from the CAMS NRT analysis against IAGOS aircraft data at (a) Frankfurt Airport and (b) averaged over North American airports. Shown are for December, January, and February (DJF), March, April, and May (MAM), June, July, and August (JJA), and September, October, and November (SON) during the period 1 December 2018 to 30 November 2021. The shaded areas denote ±1 standard deviation.
Errera et al. (2021) document that biases against GAW CO surface observations are within −8 % for European GAW stations and Asian stations and around −16 % for stations located in the Southern Hemisphere. Their comparisons with EEA AirBase surface observations in Europe show high temporal correlations, small biases over Belgium, Germany, Austria, and Switzerland, and larger negative biases over Spain (−30 %), Estonia (−30 %), Poland (−50 %), the Czech Republic (−60 %), and Bulgaria (−65 %).
Compared to NDACC FTIR tropospheric column CO data (Fig. 3) the CAMS NRT system underestimates the tropospheric CO column in the Northern Hemisphere (NH). This negative bias increased in July 2019 after the CAMS model upgrade to CY46R1 to between −3 % to −15 % for most stations and is larger than the reported 3 % measurement uncertainty. Compared with MOPITT and IASI TCCO data, the CAMS validation reports (e.g. Errera et al., 2021) find negative biases of up to −20 % and −30 % respectively. These also increased after the CAMS model upgrade to CY46R1 in July 2019. The negative CO bias of the CAMS model is even more pronounced in experiments without CO data assimilation (Errera et al., 2021).
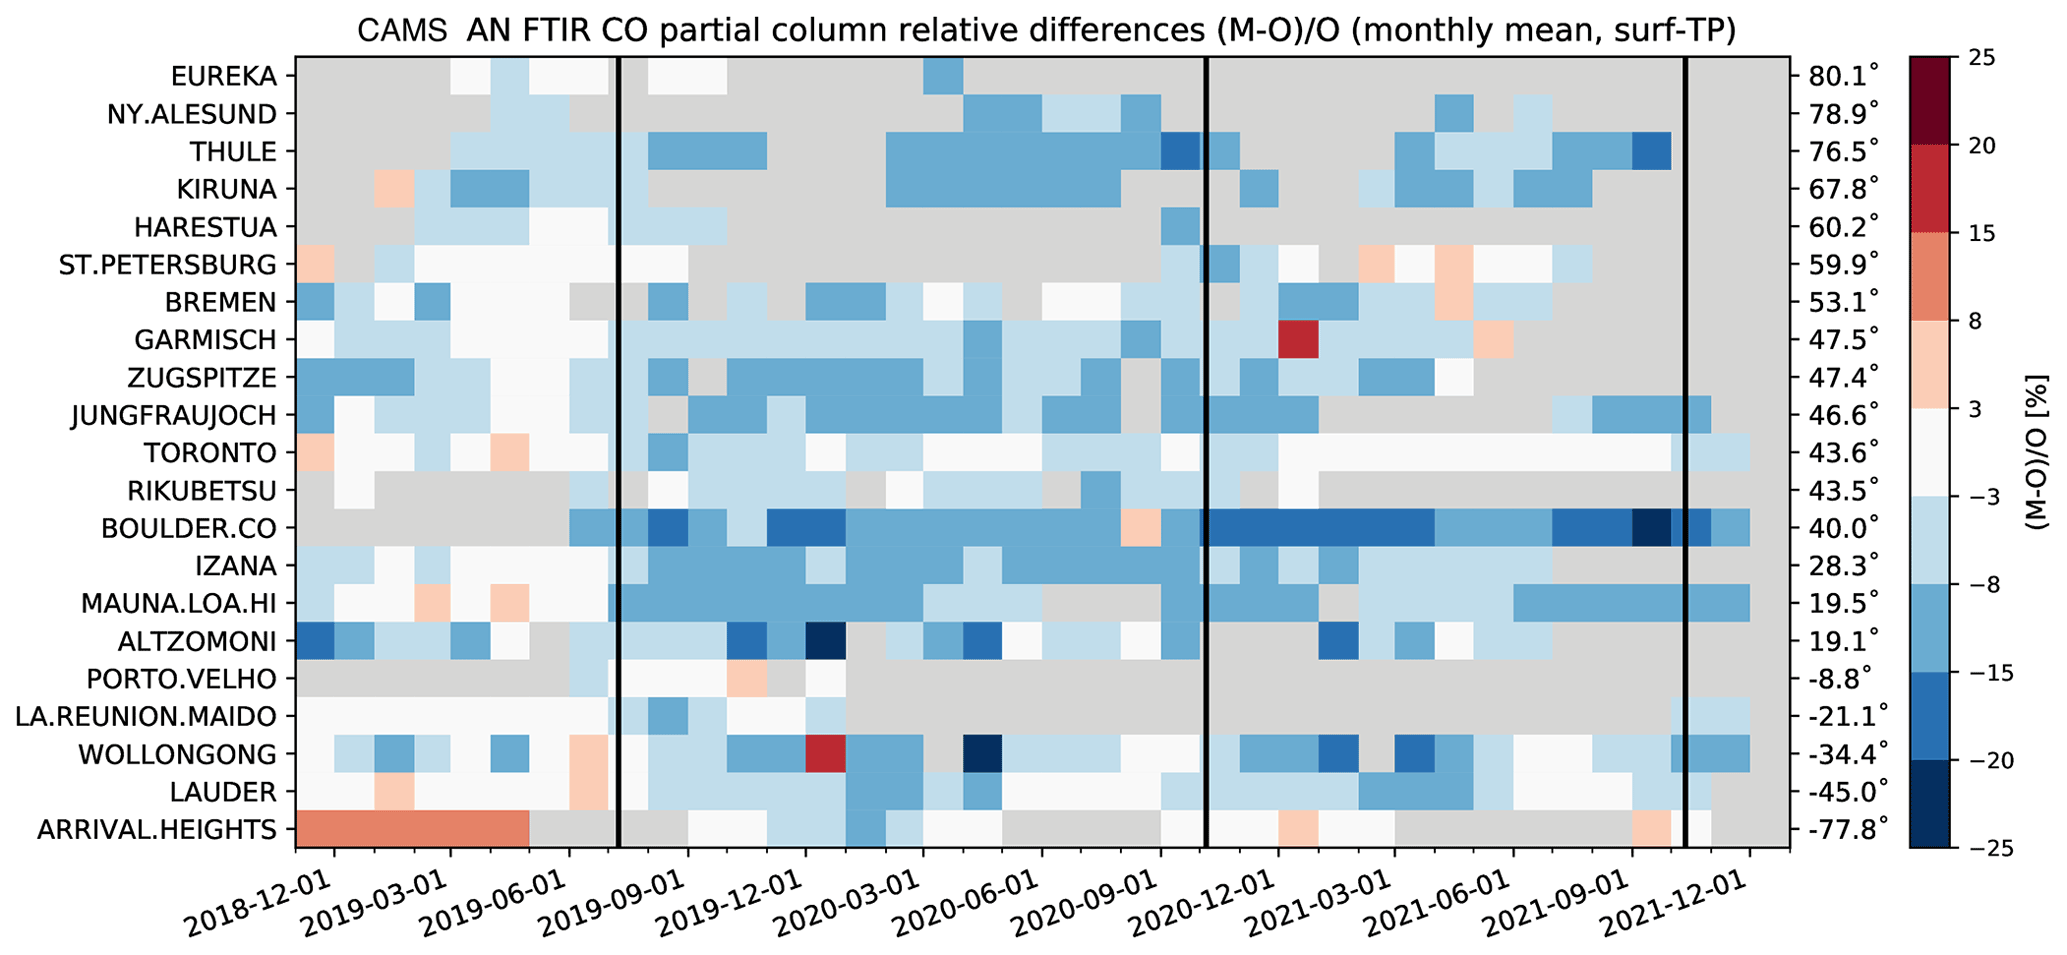
Figure 3Time series of monthly mean relative bias (%) for CAMS CO against NDACC FTIR tropospheric columns. The overall uncertainty for NDACC tropospheric columns is approximately 3 %. The stations are sorted by latitude (Northern to Southern Hemisphere). Periods without data are shaded in grey. The FTIR averaging kernels were applied in the comparisons.
2.2 TROPOMI TCCO data
The monitoring of TROPOMI TCCO data in the global CAMS NRT system began on 19 November 2018. TROPOMI has a local overpass time of 13:30 UTC, a spatial resolution of 5.5 km × 7 km in nadir (7 km × 7 km before 6 August 2019) for data retrieved from the SWIR band, and a swath of 2600 km, and it provides daily global coverage with 14 orbits per day. For the work in this paper, we use NRT TROPOMI TCCO data produced with a retrieval algorithm developed by SRON, the Netherlands Institute for Space Research, and provided by ESA/Eumetsat for the period 19 November 2018 to 31 December 2021. These NRT data are usually available with 3 h of the observations being taken. Information about updates to the TROPOMI CO retrieval algorithm since November 2018 is given in Table S2.
The TROPOMI TCCO retrieval is documented in Landgraf et al. (2016). The retrieval works in the 2.3 µm spectral range of the SWIR part of the solar spectrum (2315–2338 nm) and retrieves the TCCO values for clear-sky and cloudy conditions over land and for cloudy conditions over ocean. Under clear-sky conditions over oceans, the SWIR signal is too low due to the dark sea surface to give a meaningful retrieval. While TIR measurements like MOPITT and IASI are mostly sensitive to CO in the mid-troposphere (Deeter et al., 2013), TROPOMI SWIR measurements are sensitive to the integrated amount of CO along the light path (Landgraf et al., 2016), including the contribution of the planetary boundary layer, making them particularly suitable for detecting surface sources of CO. Martínez-Alonso et al. (2020, their Fig. 1) show examples of TROPOMI and MOPITT averaging kernels that illustrate the different sensitivities of the TROPOMI and MOPITT retrievals. Since the update to v01.03.02 on 3 July 2019 the NRT TROPOMI data are of the same quality as the offline retrieval.
The operational TROPOMI CO retrieval deploys a profile scaling approach described in detail by Borsdorff et al. (2014), where a CO reference profile is scaled to fit the TROPOMI reflectance measurements. For this, global, monthly averaged () vertical CO a priori profiles from the chemical transport model TM5 (Krol et al., 2005) are used. The forward calculation of the measurement accounts for light scattering by clouds and aerosols in the atmosphere and thus simultaneously retrieves trace gas columns and effective parameters describing the cloud contamination of the measurements (height scattering layer, scattering optical thickness) as demonstrated by Vidot et al. (2012). The TROPOMI TCCO datasets contain total-column averaging kernels for individual measurements that describe the vertical sensitivity of the retrieved CO columns. The CO retrieval under clear-sky atmospheric conditions shows a good sensitivity throughout the atmosphere, with minor variations due to the observation geometry of the satellite. Retrievals from cloudy measurements exhibit a reduced vertical sensitivity caused by shielding of the cloud in the observation geometry of the satellite. Figure 4 shows examples of TROPOMI averaging kernels for clear-sky and cloudy data over land as well as for cloudy data over sea for the NH, tropics, and SH averaged over the period 19 November 2018 to 31 December 2021 and illustrates the different vertical sensitivities.
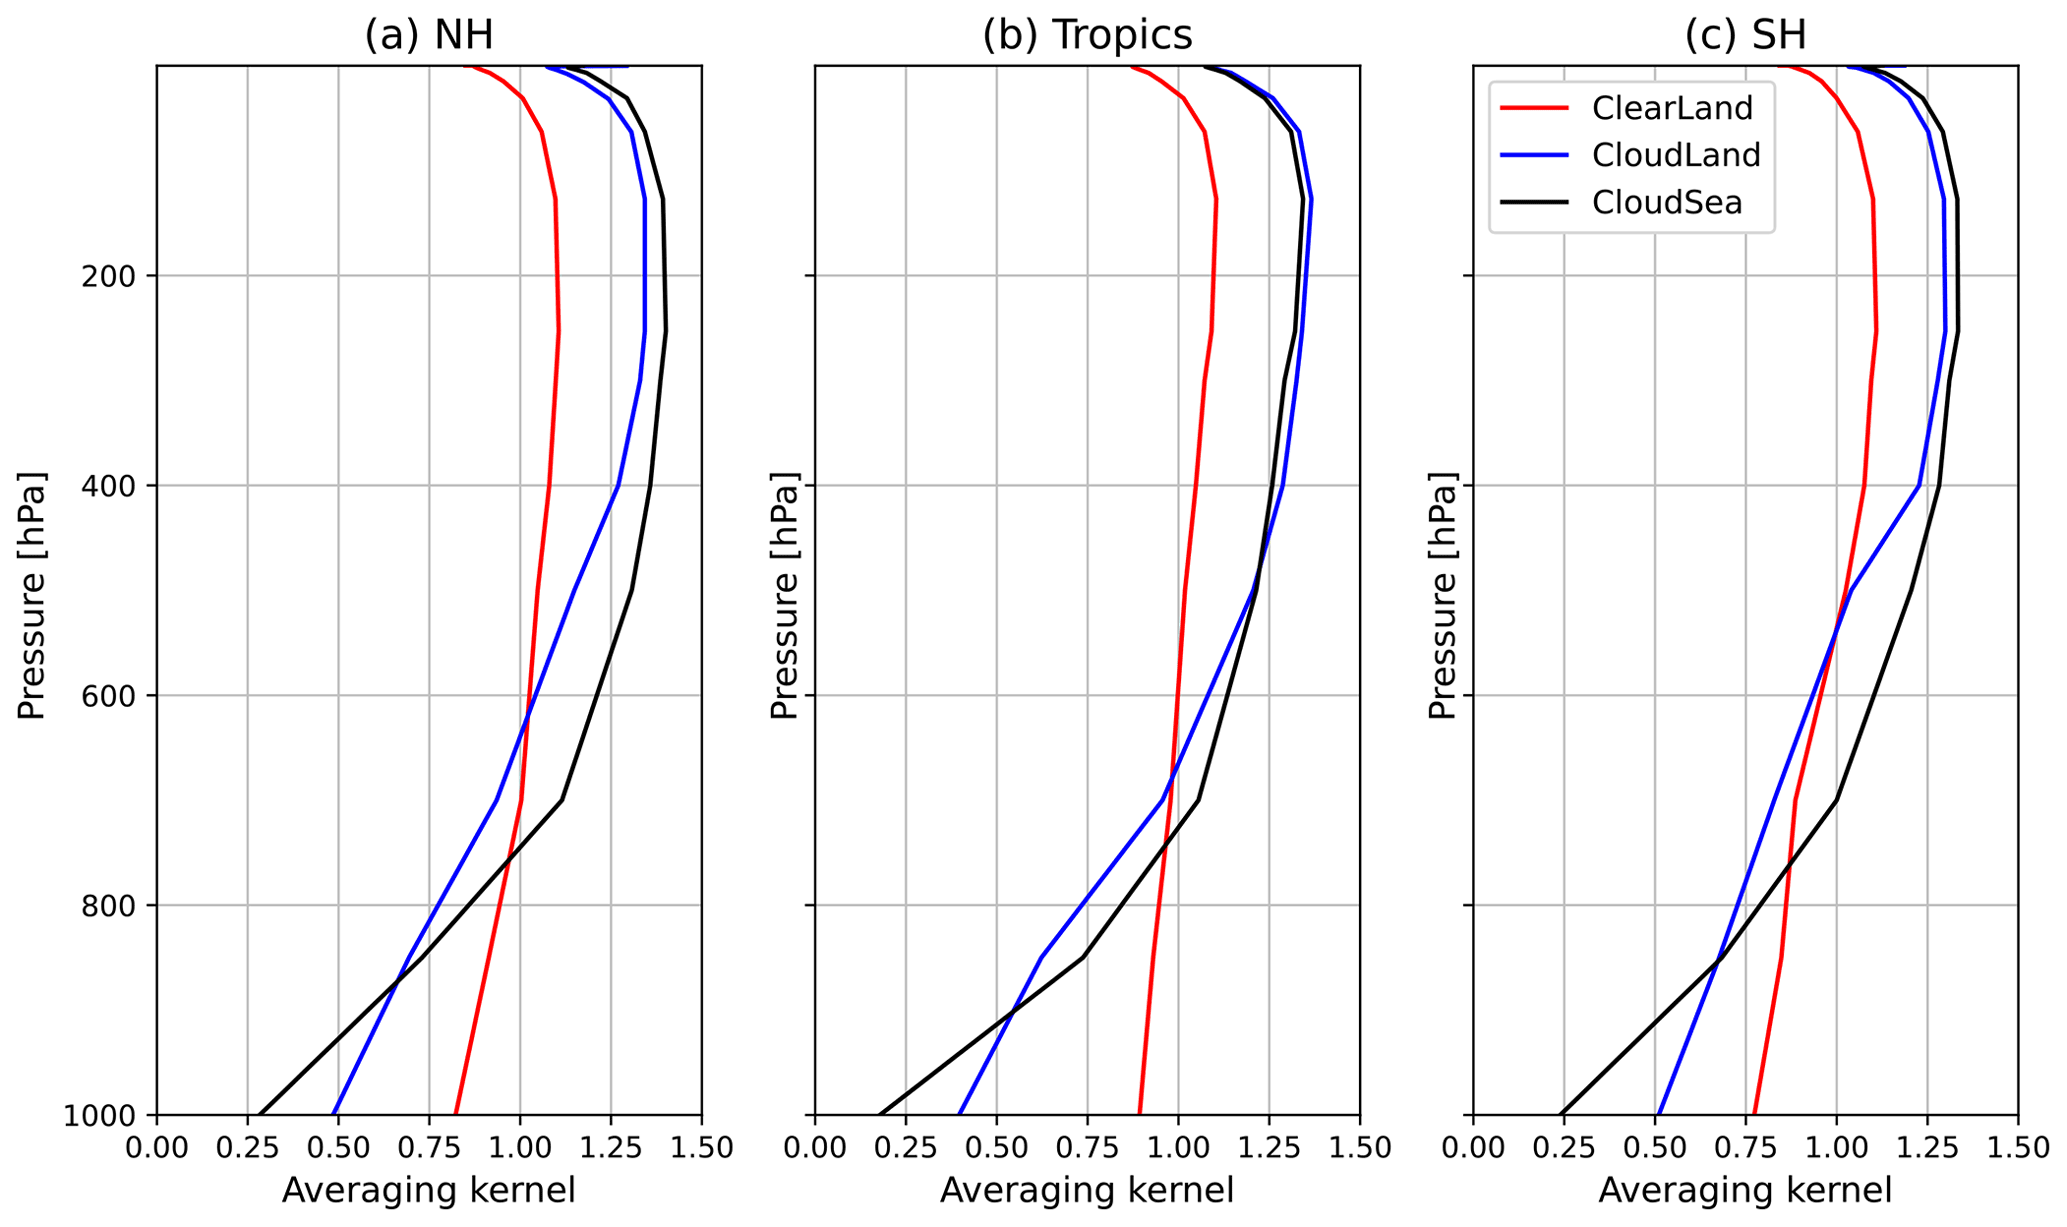
Figure 4TROPOMI averaging kernels (means for period 19 November 2018 to 31 December 2021) averaged over (a) NH, (b) tropics, and (c) SH for clear data over land (red), cloudy data over land (blue), and cloudy data over sea (black).
Because the TROPOMI CO retrieval is based on the profile scaling inversion (Borsdorff et al., 2014), the total-column averaging kernel AS5p cannot smooth the vertical CO a priori profile that is used for scaling within the inversion, and the validation equation (Eq. 2) simplifies to , where xtrue is the true CO profile. This means that the CAMS model equivalent of the TROPOMI observations can be calculated as
where xmod is the CAMS model profile on the vertical grid of the TROPOMI a priori, AS5P the TROPOMI total-column averaging kernel, and xS5P the resulting CAMS CO column smoothed by the TROPOMI total averaging kernel AS5P.
As recommended in the TROPOMI readme file (https://sentinels.copernicus.eu/documents/247904/3541451/ Sentinel–5P-Carbon-Monoxide-Level-2-Product-Readme-File, last access: 2 March 2022), we only use data with quality assurance values (qa_values) >0.5. This filters out the two most westward pixels (because of unresolved calibration issues) and observations with solar zenith angle (SZA) (where the retrieval is most sensitive to radiometric and retrieval errors due to the long light path through the atmosphere). Furthermore, we separate the data into clear-sky (i.e. clear-sky and clear-sky equivalent) and cloudy pixels. Clear-sky and cloudy data are used over land, while only cloudy data are used over oceans, as in the SWIR clear-sky observations over water have signal intensities that are too low to be meaningful.
First TROPOMI total-column CO (TCCO) data produced with the operational algorithm by SRON showed good agreement with the CAMS NRT CO analysis (Borsdorff et al., 2018), with a mean difference between TROPOMI and CAMS of 3.2±5.5 % and a correlation coefficient of 0.97 for a period in November 2017. Martínez-Alonso et al. (2020) compared TROPOMI TCCO (offline and reprocessed) data for the period November 2017 to March 2019 with MOPITT data and with data from the airborne ATom (Atmospheric Tomography mission) campaign and found that over land, TROPOMI CO had a small negative bias compared to MOPITT TIR data ( %), while they were biased slightly high over water (2.98±15.71 %). Compared to ATom data (over water), there was also a positive bias of 3.25±11.46 %. Sha et al. (2021) reported a bias of 2.45±3.38 % against unscaled XCO from the Total Carbon Column Observing Network (TCCON) for the period from the start of the TROPOMI mission to 30 September 2020 using the latest offline and reprocessed versions available at the time. While most stations showed positive biases, negative biases were found for urban stations (e.g. Xianghe, JPL, and Pasadena). Sha et al. (2021) found differences of on average 6.5±3.54 % against NDACC CO columns. All these differences are within the TROPOMI mission requirements on accuracy (<15 %) and precision (<10 %).
The routine quarterly TROPOMI validation reports available from https://mpc-vdaf.tropomi.eu/ (last access: 22 August 2022; Lambert et al., 2022) show that the S5P L2_CO (NRT or RPRO concatenated with OFFL) carbon monoxide total-column data are in good overall agreement with co-located measurements from the NDACC, TCCON, and Collaborative Carbon Column Observing Network (COCCON) FTIR monitoring networks. They find on average a positive bias of approximately +10 % (NRT, before July 2019) or +6.5 % (OFFL and NRTI after July 2019). The validation reports found no latitudinal dependence of the bias and a slight increase of the bias during local winter. Biases at most individual NDACC stations were well below 10 % but slightly larger at mountain stations and also at Eureka (Arctic) and Arrival Height (Antarctica). The biases increased with SZA by about 10 % between 10 and 80∘. The processor update to version 02.02.00 on in July 2021 included a change in spectroscopic parameters, and preliminary results using rapid delivery NDACC data indicate that the bias is reduced to 2.9 % (Lambert et al., 2022). An upper boundary of the random uncertainty of the TROPOMI offline CO data is 5 %, according to the validation reports. Individual TROPOMI CO data show stripes of erroneous CO values <5 % in flight direction, probably associated with calibration issues. A destriping algorithm has been included for offline TROPOMI data with the upgrade to v02.02.02 in July 2021, but this is not applied to the NRT data. TROPOMI also suffers from instrumental effects in the area of the South Atlantic Anomaly (SAA).
According to the TROPOMI product readme file (https://sentinels.copernicus.eu/documents/247904/3541451/ Sentinel-5P-Carbon-Monoxide-Level-2-Product-Readme-File.pdf/f8942626-ffb6-4951-90fc-a16b6589e39e?t=1639982223246, last access: 27 April 2022) and the validation reports, the TROPOMI NRT CO product (which is used in the global CAMS system and in this paper) had an additional positive bias of 3 %–4 % before July 2019, but since processor version 01.03.02, the same configuration settings are used for the NRT and offline data processing streams, and therefore the data products are of the same quality. However, there is no noticeable change in CAMS TROPOMI monitoring time series (Fig. S4) related to the switch to the offline algorithm for NRT data, and in the time series of analysis departures this change is masked by the CAMS model change to CY46R1 that happened a few days afterwards.
2.3 TROPOMI super-observations for use in CAMS system and monitoring of TROPOMI CO in the NRT CAMS system
Because the horizontal resolution of the TROPOMI TCCO data (5.5 km × 7 km) is higher than the model resolution of T511 (about 40 km × 40 km), the TROPOMI data are not spatially representative for the model grid boxes. To overcome this representativeness error, the data are converted into so-called “super-observations” before they are included in the CAMS system. For this, the data are averaged to the T511 resolution of the model. Our method to create super-observations simply calculates the averages of the observations in a grid box and hence differs from a method described by Miyazaki et al. (2012), who also weigh the individual observations depending on the data coverage and take error correlations among the data into account. We average the data separately for different surface types (e.g. land, ocean, ice) and for clear and cloudy data, and the observation errors and averaging kernels of the data are averaged in the same way as the observations. This averaging reduces the random errors in the data and also the representativeness errors due to unresolved small-scale features that are seen in TROPOMI data but not resolved in the model.
TROPOMI CO data have been monitored passively in the CAMS system since November 2018, and results are shown in the Supplement (Figs. S1 to S4). In the global mean, CAMS TCCO analysis values are about 10 % lower than TROPOMI TCCO when only IASI and MOPITT TIR TCCO data are assimilated (averaged over the period November 2018 to December 2021), with the largest relative differences (11 %–14 %) found in the polar latitude bands, i.e. the areas where no satellite CO retrievals are assimilated in the global CAMS system. Differences between TROPOMI and CAMS are reduced, but not eliminated, after the upgrade of the TROPOMI retrieval to v02.02.00 in July 2021 (Fig. S4), in line with the smaller positive TROPOMI bias reported in validation reports against NDACC observations (Lambert et al., 2022).
3.1 Results from single-observation experiments
Before carrying out longer assimilation experiments with the TROPOMI TCCO data, we look at the results of single-observation experiments with the data to illustrate the different impacts clear and cloudy data have in the analysis, and to highlight the importance of using the averaging kernels in the observation operators. We carry out three single-observation experiments. In each one, we place a single TROPOMI observation with a prescribed TCCO value of 4.3×10¹⁸ molec. cm−2 and observation error of 10 % at (50∘ N, 10∘ E) but vary the averaging kernels of the observations, so they are representative of mid-level cloudy conditions, clear-sky conditions, and clear-sky equivalent conditions (i.e. low thin clouds) over land (see Fig. 5). The resulting analysis increment profiles show that the clear-sky and clear-sky equivalent observations have a large impact in the troposphere below 550 hPa, including in the boundary layer. The impact of the cloudy data is reduced in the lower troposphere, i.e. below the clouds, where the averaging kernel values are smaller, and is larger above 500 hPa. If the averaging kernels were not used in the observation operator, for example, the model equivalents of the observations were calculated as simple vertical integrals, all three experiments would give the same analysis profiles. This illustrates the importance of taking the averaging kernels into account when comparing model data with satellite retrievals.
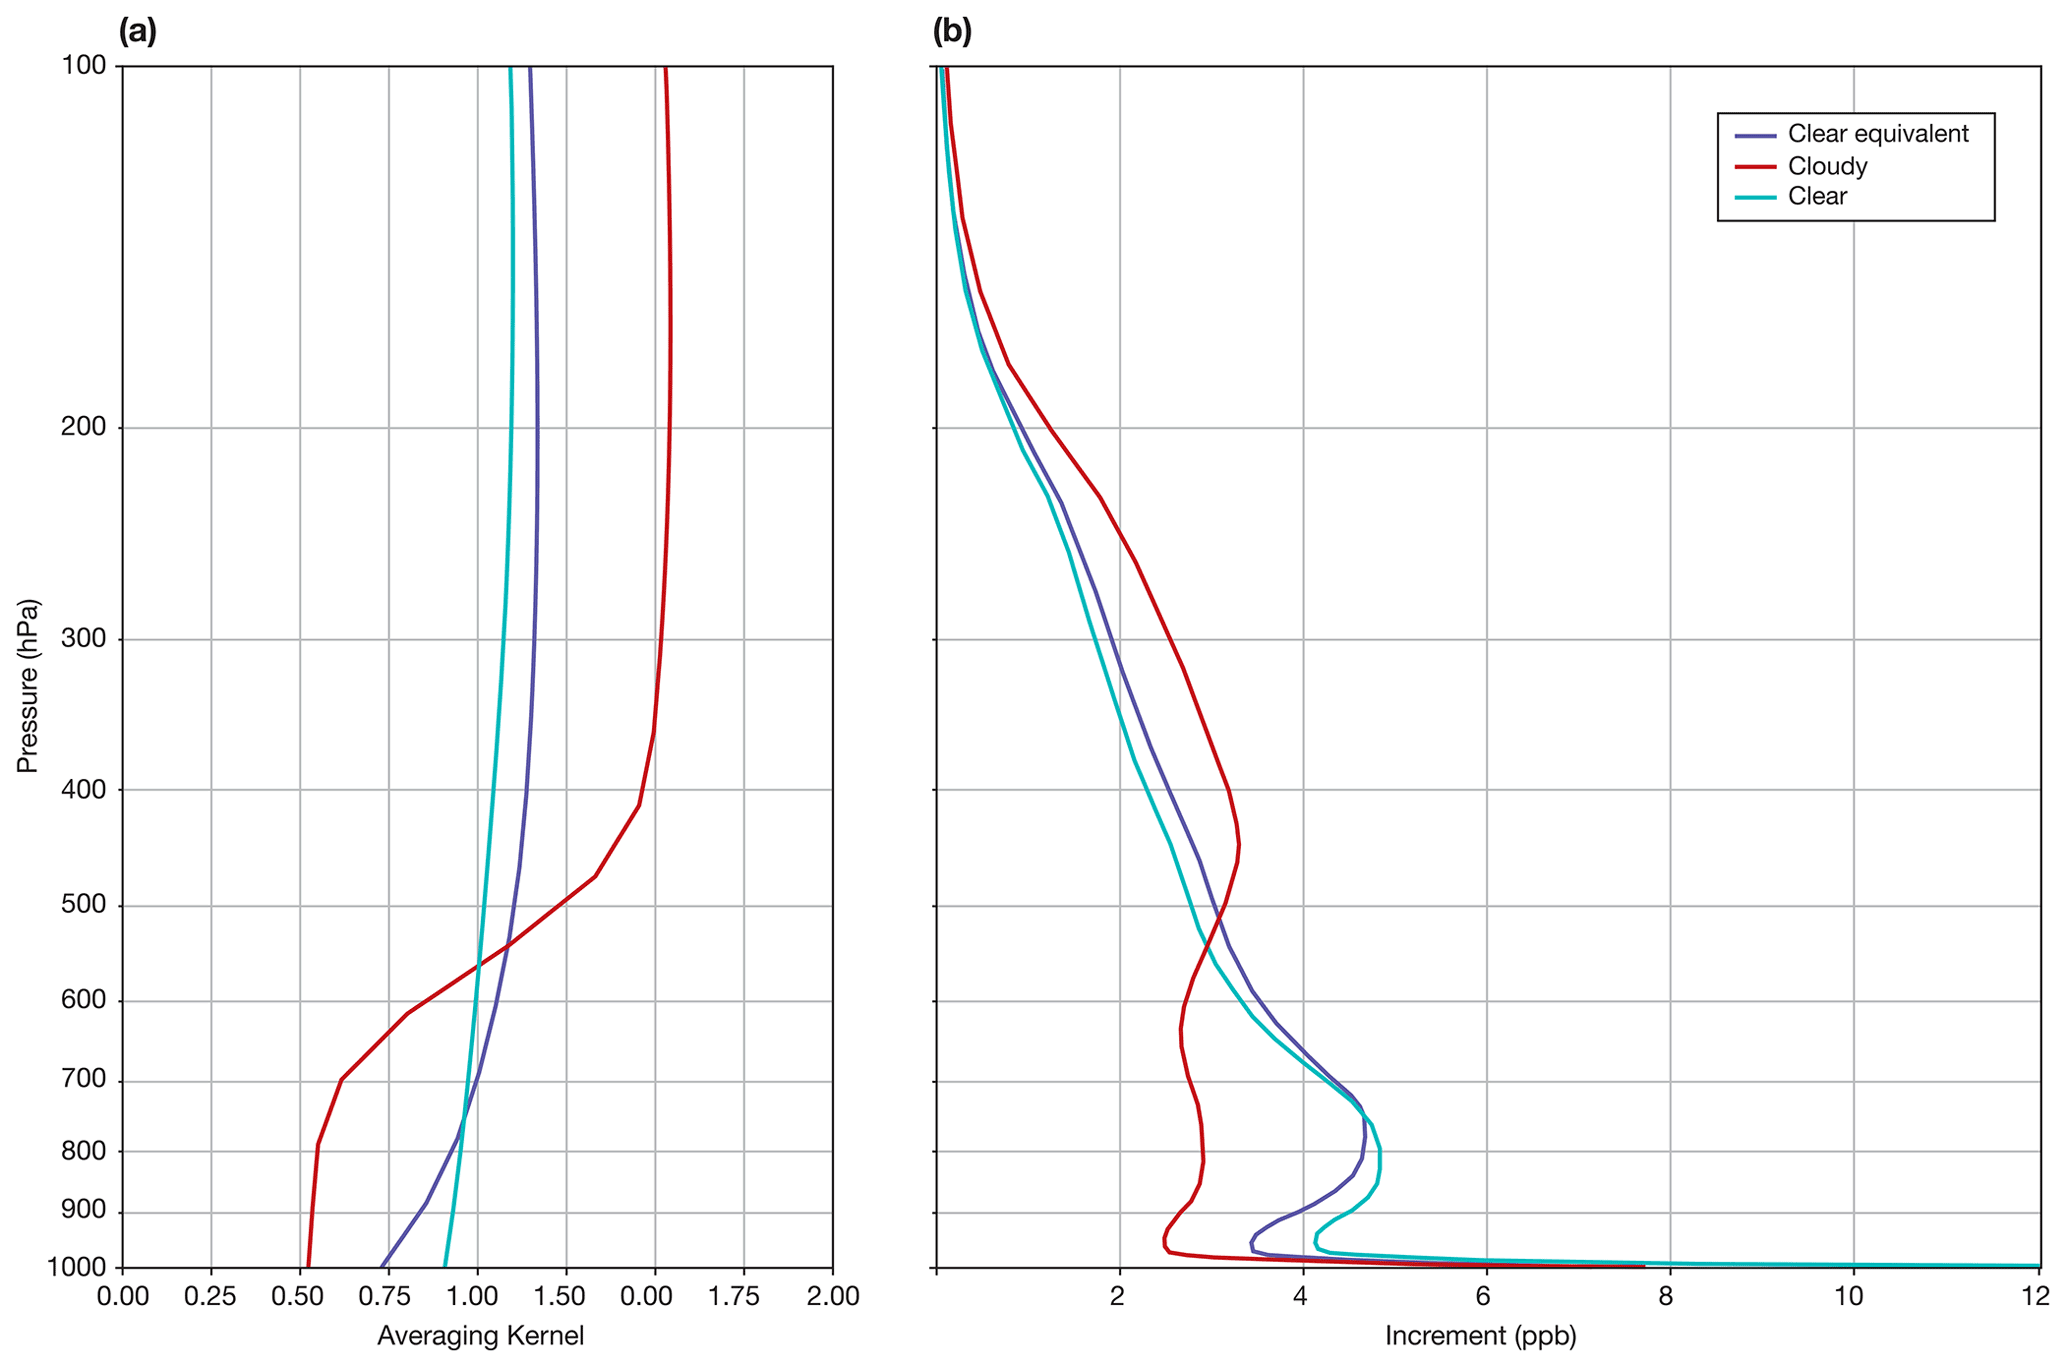
Figure 5(a) TROPOMI total-column averaging kernels representative of cloudy (red), clear-sky (cyan), and clear-sky equivalent (i.e. low thin clouds) conditions (blue) over land. (b) Analysis increments obtained in single-observation experiments with the CAMS system using observations with these averaging kernels and a prescribed TCCO value of 4.3×10¹⁸ molec. cm−2 and observation error of 10 % located at (50∘ N, 10∘ E).
3.2 Results from assimilation experiments for the period 6 July to 31 December 2021
Assimilation tests with the CAMS system were carried out with the TROPOMI TCCO data for the period 6 July to 31 December 2021, i.e. after the TROPOMI algorithm upgrade to v02.02.00 (see Table S2), which reduced the positive TROPOMI CO bias against independent observations and led to smaller differences between TROPOMI and CAMS (see Fig. S4). In the assimilation experiment (ASSIM; see Table 2) TROPOMI data were used if they had qa_values >0.5 between 90∘ N and 60∘ S, i.e. not over Antarctica where comparison with NDACC data showed larger biases in the TROPOMI validation reports (https://mpc-vdaf.tropomi.eu/, last access: 31 October 2022). Over oceans, only cloudy data were used. We also produced a control experiment (CTRL; see Table 2) where TROPOMI data were included passively and not assimilated. The differences between ASSIM and CTRL allow us to assess the impact of the TROPOMI TCCO data on the CAMS CO analysis. The model cycle used for the experiments was CY47R3, meaning that the CTRL setup corresponds to the operational CAMS NRT configuration that was operational from October 2021. The TROPOMI data in both experiments were super-obbed to the model resolution of T511, as described in Sect. 2.3. In ASSIM, TROPOMI TCCO was used without bias correction because the TROPOMI SWIR retrieval has different sensitivity to CO in the atmosphere than the IASI and MOPITT TIR retrievals, and it would not make sense to anchor a bias correction for TROPOMI to MOPITT or IASI.
Table 2Experiments used for the TROPOMI assimilation tests for the period 6 July to 31 December 2021.
3.2.1 Differences between assimilation and control experiments
Figure 6a shows a map of the relative differences between TCCO fields from ASSIM and CTRL averaged over the period 1 August to 30 December 2021 and illustrates that the assimilation of TROPOMI TCCO data leads to increased CO columns in the analysis. The largest relative increase is found at high latitudes north of 70∘ N (25 %–30 %), over North America (10 %–20 %), and over oceans (10 %–20 %) in the tropics. Such increases are expected if the CAMS analysis is influenced by the TROPOMI data, considering the positive TROPOMI analysis departures seen in the monitoring plot (Fig. S2) and the generally negative bias of the CAMS CO fields reported in comparison with independent observations. The large differences north of 70∘ N are in the area where no IASI or MOPITT TCCO data are assimilated; i.e. no TCCO data at all are assimilated here in CTRL. Figure 6b shows a cross section of the zonal mean absolute differences between ASSIM and CTRL for the same period and illustrates that CO is increased most at the surface and in the lower troposphere in the NH, with differences north of 60∘ N extending throughout the troposphere, as well as in the upper troposphere in the tropics. Cross sections and maps of analysis increments (not shown) illustrate that the increased CO in the upper troposphere is a direct result of the TROPOMI assimilation, rather than a result of convective transport redistributing CO in the vertical, with the largest impact over Africa, South America, and the Maritime Continent. Figure 6c shows the time evolution of the zonal mean relative differences between ASSIM and CTRL and illustrates that the largest differences are found in July and August, i.e. at a time when large boreal wildfires burned in Siberia and North America (see also Sect. 3.2.4 below).
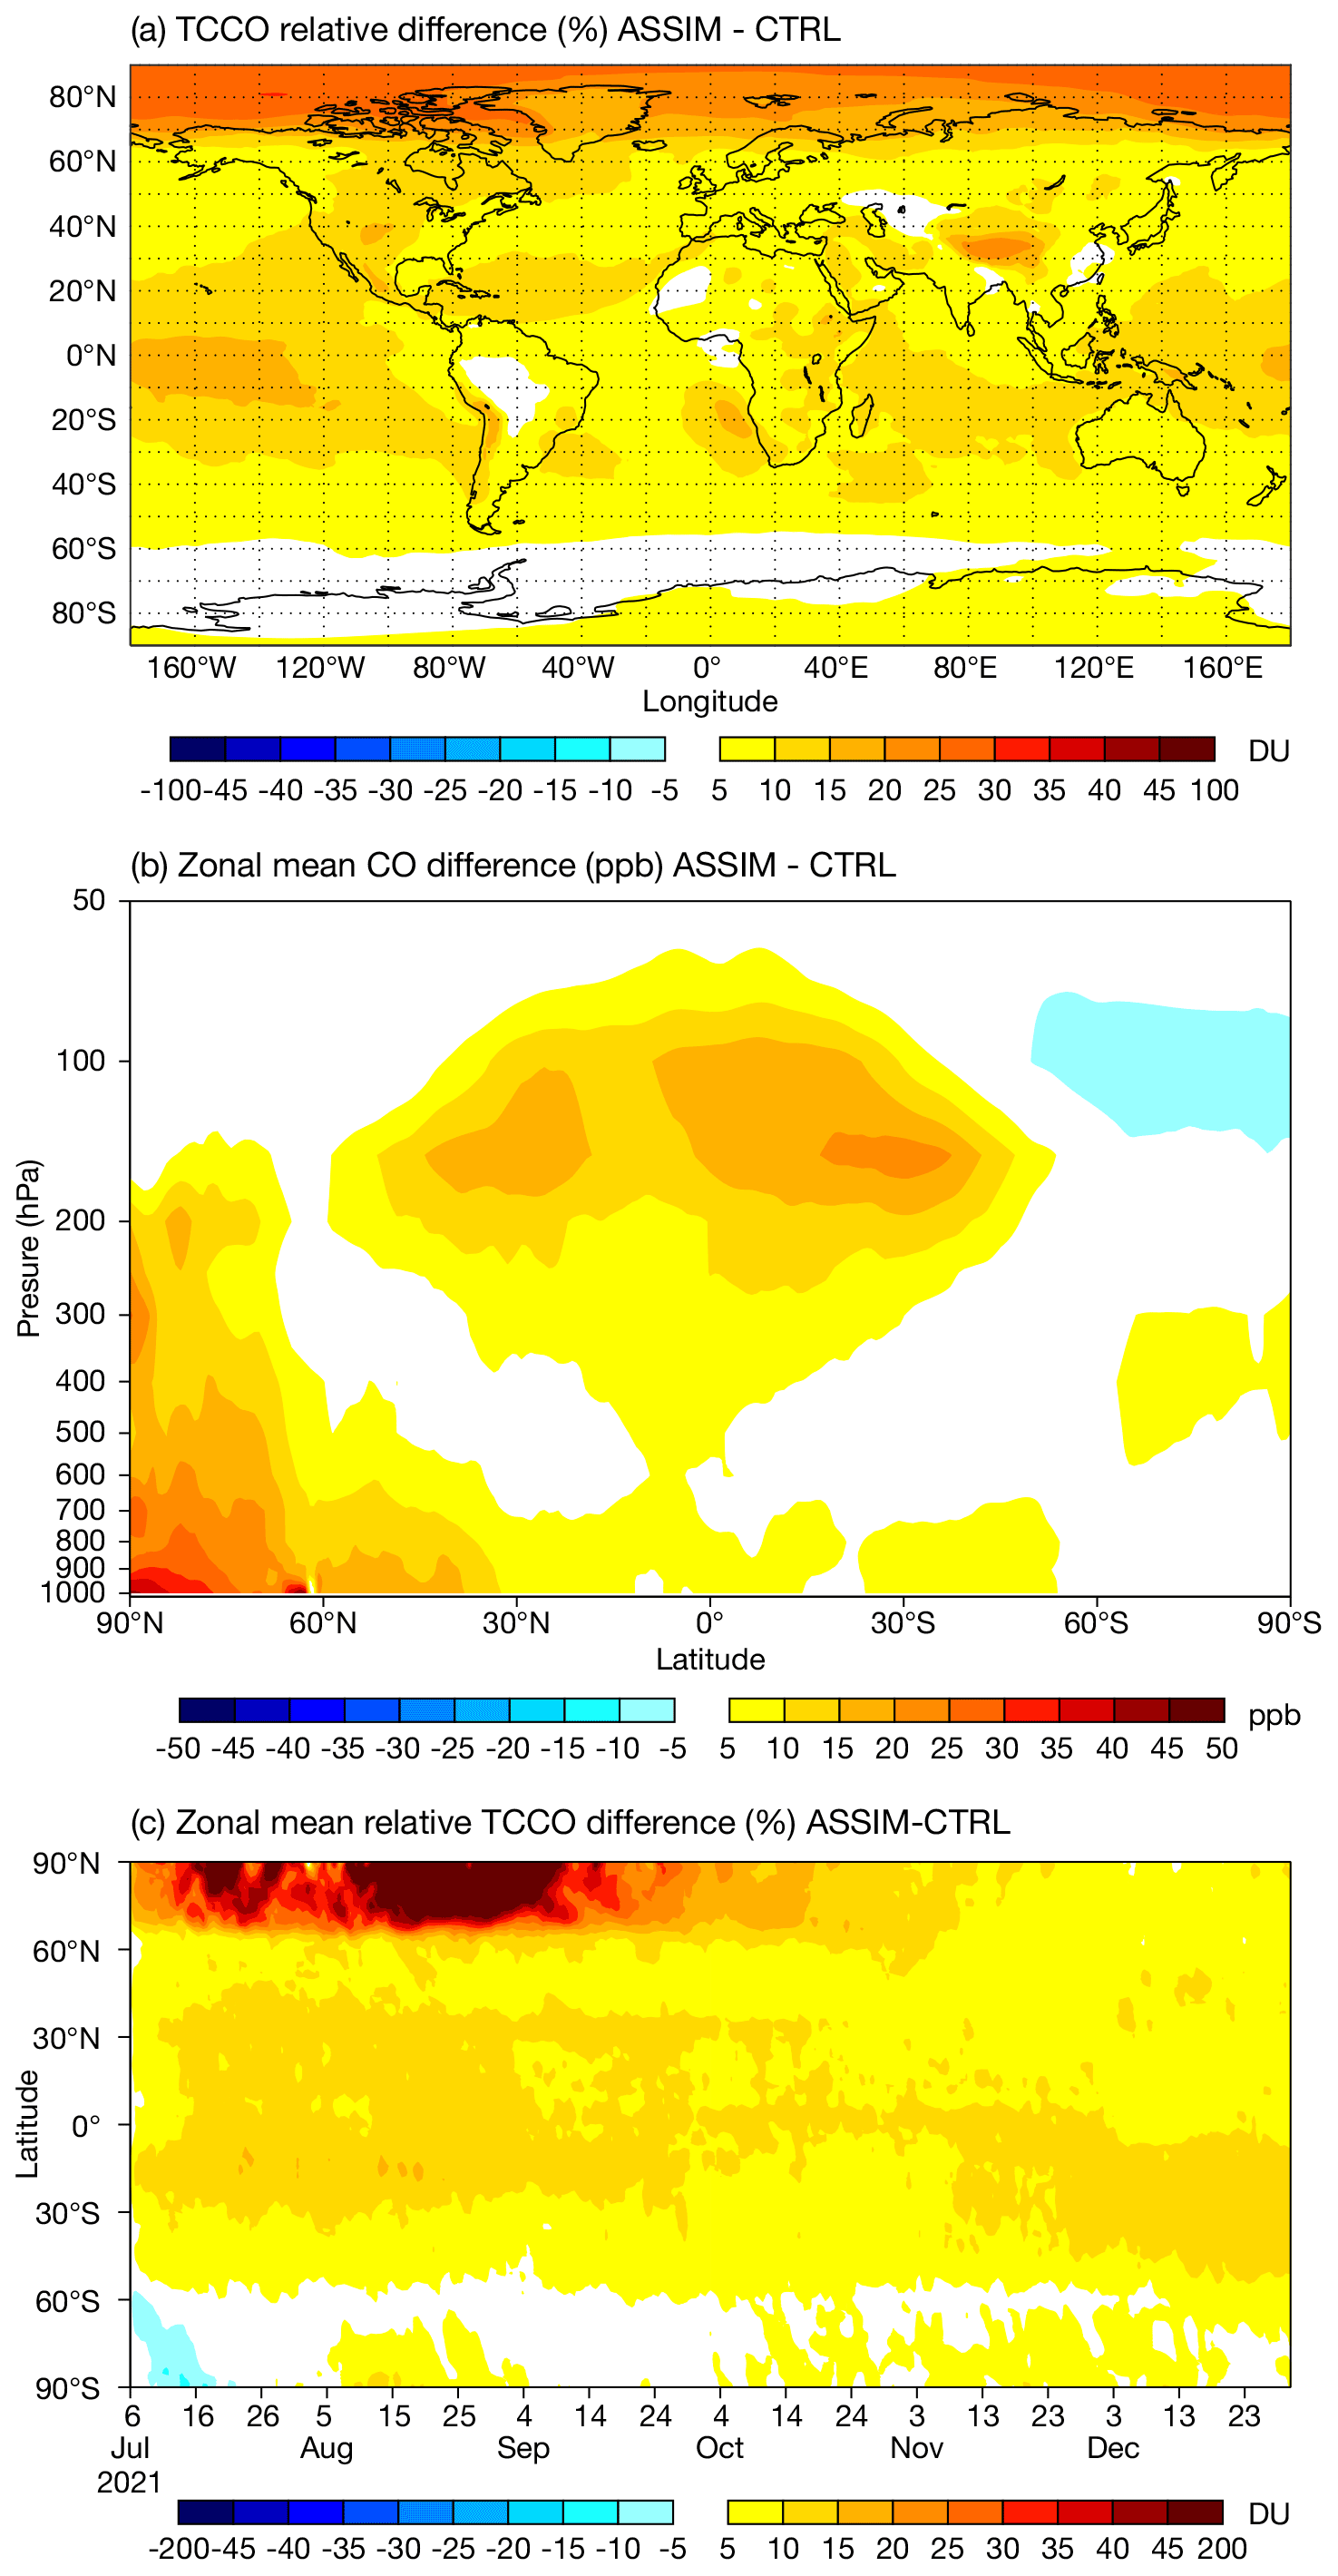
Figure 6(a) Relative TCCO difference in 1018 molec. cm−2, (b) zonal mean cross section of CO difference in parts per billion (ppb) from ASSIM minus CTRL averaged over the period August to December 2021, and (c) time series of daily zonal mean TCCO relative differences (%) for the period 6 July to 30 December 2021.
3.2.2 Instrument-specific analysis departures
Next, we look at the fit of the CO analysis to the assimilated CO data in ASSIM and CTRL. Figure 7 shows box plots of averaged global mean analysis departures from CTRL and ASSIM. In CTRL, TROPOMI analysis departures vary between 7.3 % to 9.1 %, for the different data types. Analysis departures for MOPITT (0.6 %), IASI-B (1.5 %) and IASI-C (1.3 %) are much smaller because these data are assimilated, and the analysis is influenced by the data. MOPITT has the smallest analysis departures because the data are assimilated without bias correction. In ASSIM, the analysis is influenced by the TROPOMI data in addition to MOPITT and IASI-BC, so that TROPOMI analysis departures are much reduced and now lie between 0.3 % and 0.8 % for the various data types. IASI-BC analysis departures are also reduced slightly, illustrating that the assimilation of TROPOMI CO improves the fit of the CAMS analysis to the IASI-BC data globally. MOPITT departures are increased in ASSIM because MOPITT TCCO values are generally lower than TROPOMI and IASI values, and by assimilating TROPOMI (without bias correction) in addition to the other data products, the TCCO analysis values are increased (Fig. 6), and the fit to MOPITT is degraded.
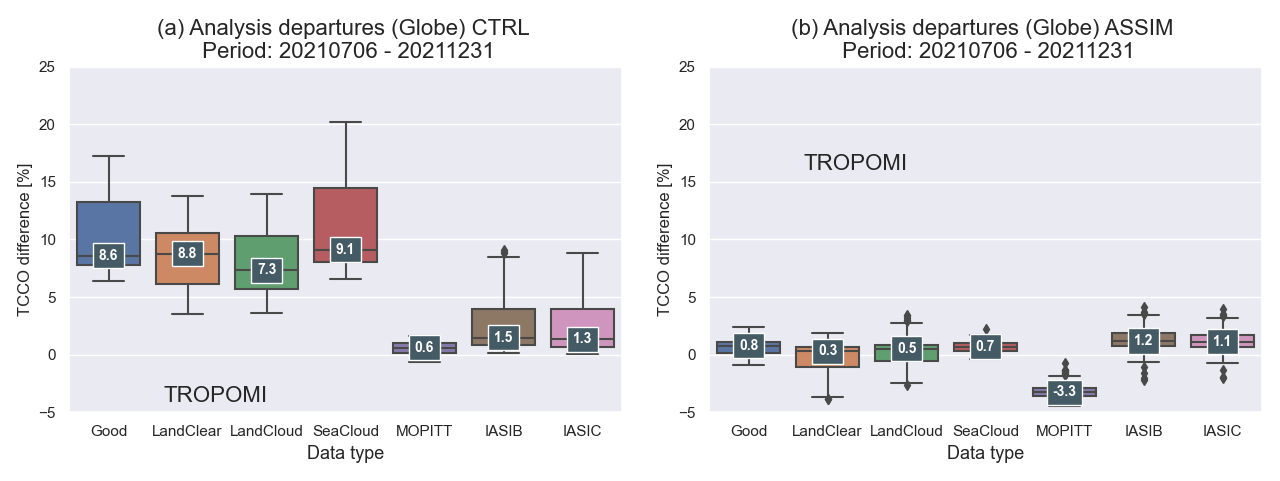
Figure 7Global mean analysis departures in percent for TROPOMI data (Good, LandClear, LandCloud, SeaCloud) and daytime MOPITT and IASI-BC data averaged over the period 6 July to 31 December 2021 for (a) CTRL and (b) ASSIM.
Figure 8 shows time series of daily mean analysis departures from the four instruments averaged over the area between 60∘ N and 60∘ S, i.e. excluding the polar regions where the NRT MOPITT product does not provide data. The analysis in ASSIM is influenced strongly by the TROPOMI data (Fig. 8a), and TROPOMI analysis and first-guess departures are much reduced in ASSIM compared to CTRL. IASI-BC analysis departures are also reduced in ASSIM during July and August and of similar size to the ones in CTRL for the rest of the time series. MOPITT departures in ASSIM are more negative than in CTRL (as already seen in Fig. 7b).
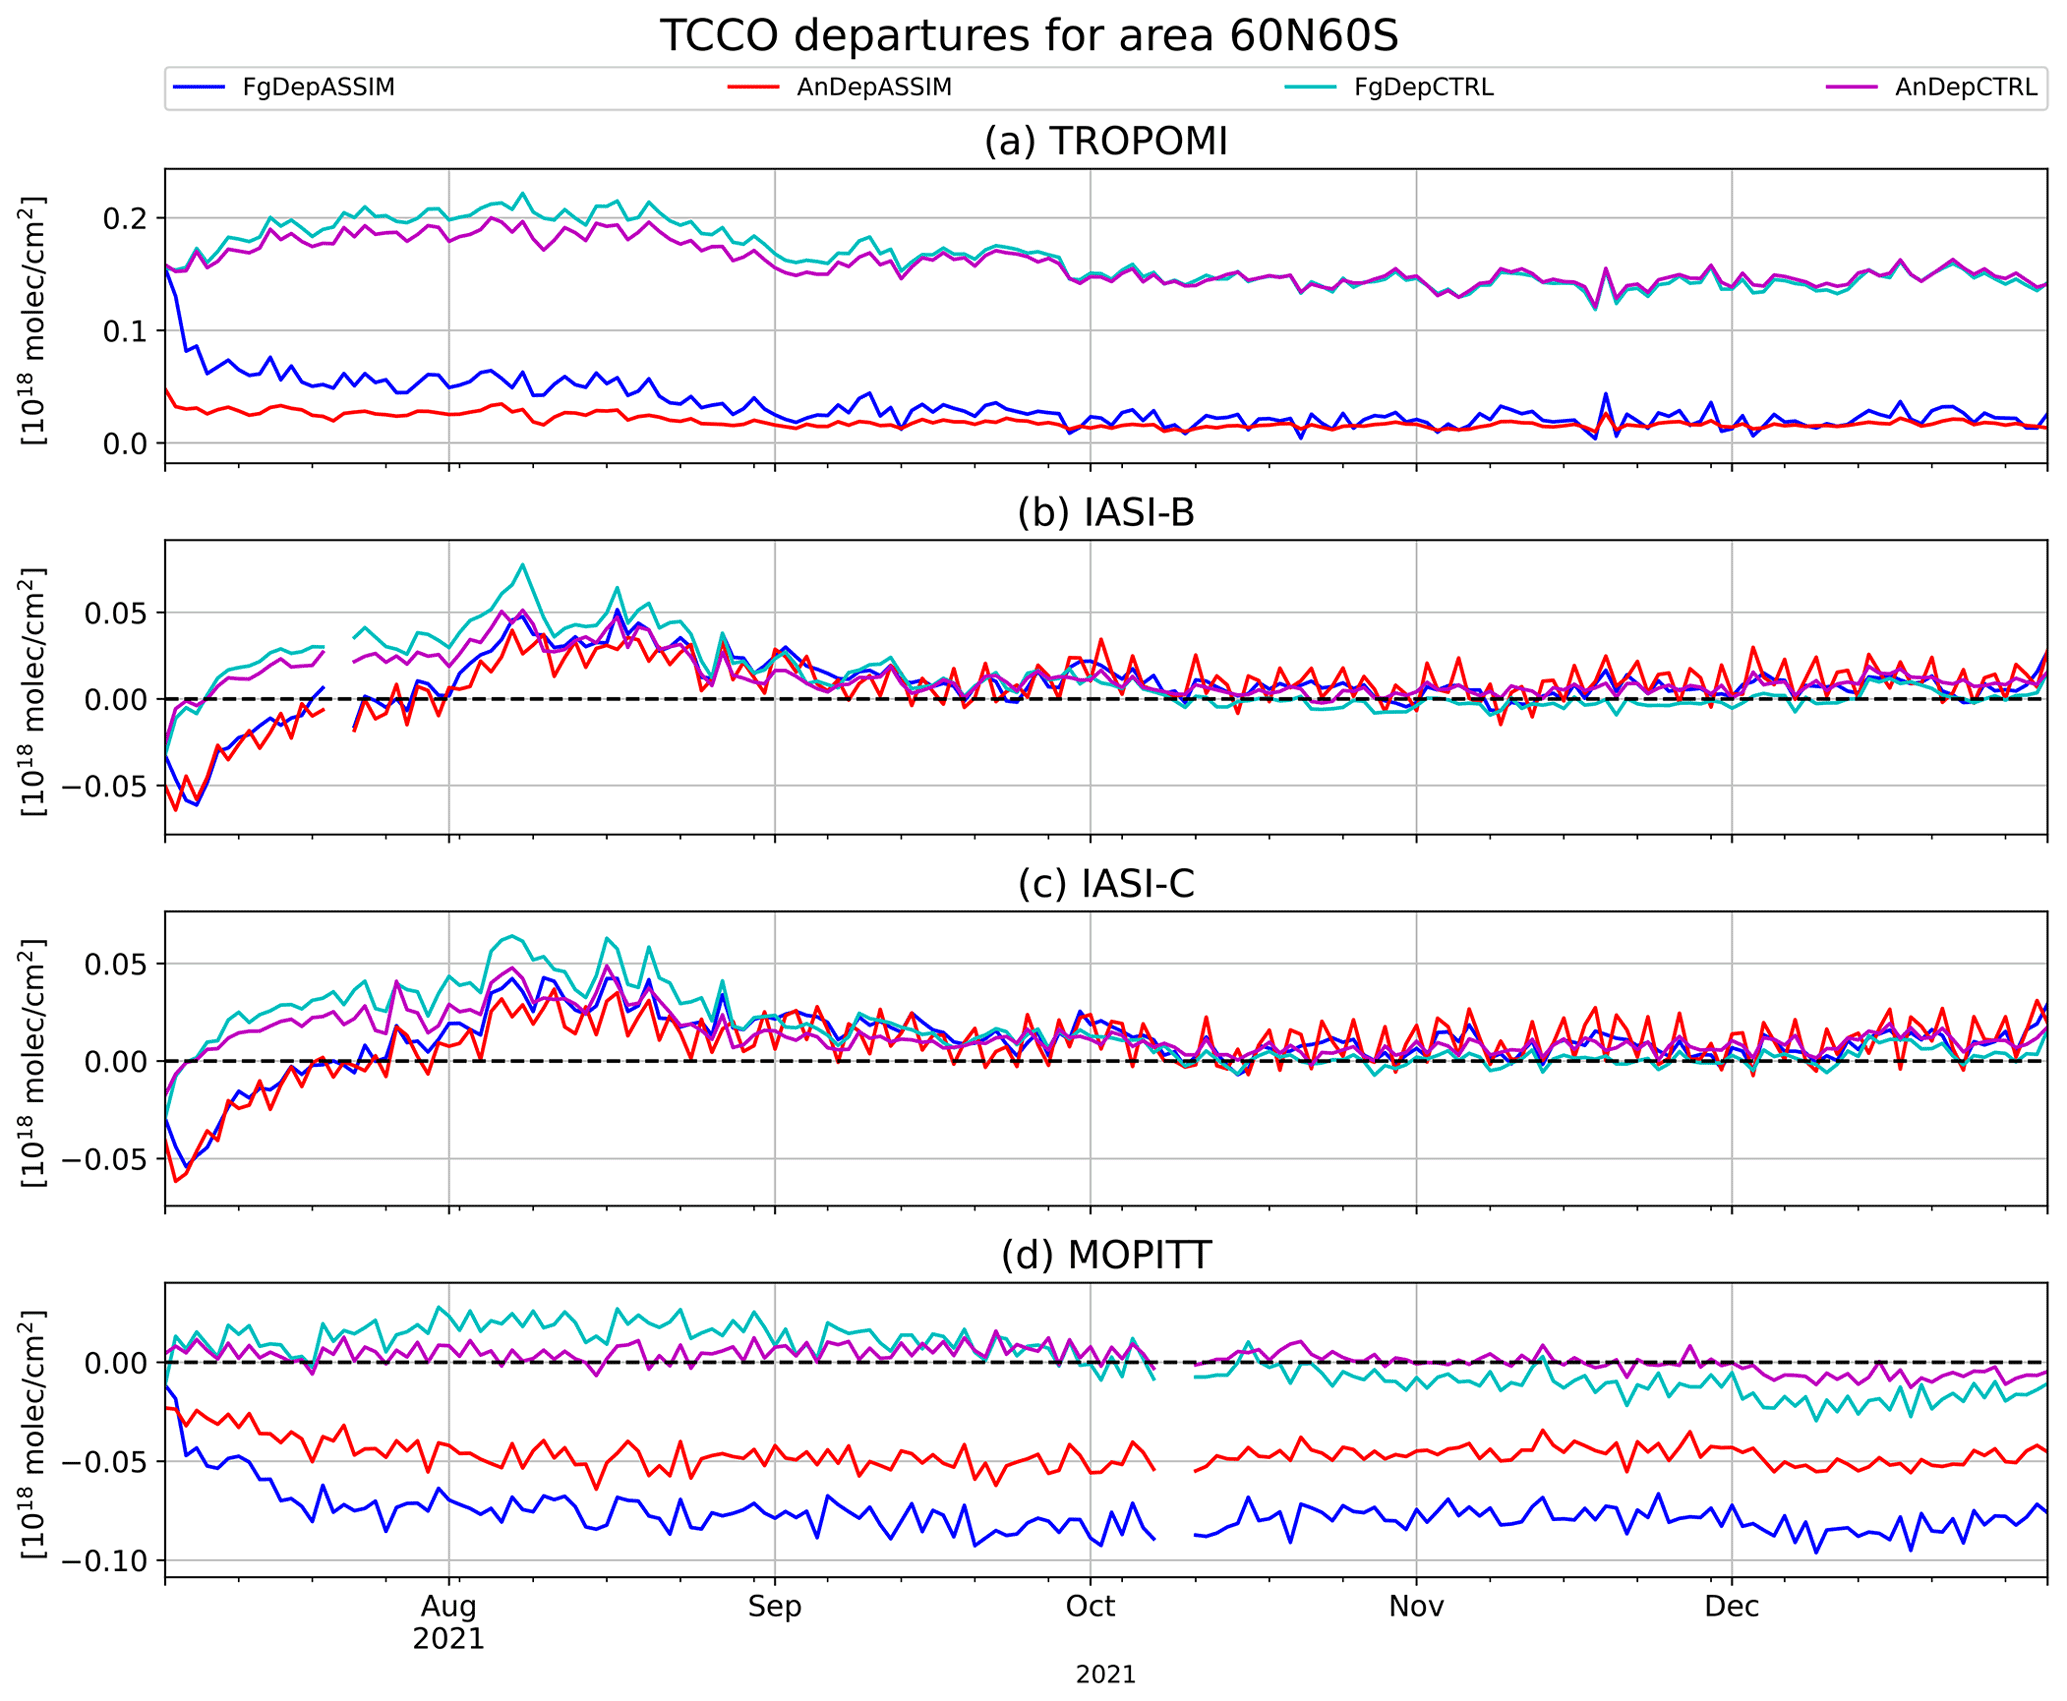
Figure 8Time series from 6 July to 31 December 2021 of daily mean TCCO first-guess and analysis departures from ASSIM and CTRL for (a) TROPOMI, (b) IASI-B, (c) IASI-C and (d) MOPITT for all “good data” averaged between 60∘ N and 60∘ S in 1018 molec. cm−2. Analysis departures (abbreviated as AnDep) from ASSIM are in red and for CTRL in magenta. First-guess departures (abbreviated as FgDep) from ASSIM are in blue and for CTRL in cyan.
The increased MOPITT departures in ASSIM (Figs. 7 and 8) do not imply that there are problems with the MOPITT dataset. MOPITT data have been extensively validated (e.g. Deeter et al., 2019, show that MOPITT V8 products generally have biases of less than about 5 %) and are used with good results in the CAMS reanalysis, where their assimilation leads to a CO analysis that agrees well with independent observations (Inness et al., 2019b; Wagner et al., 2021). The underlying problem is the current negative CO bias of the CAMS model, which increased with the implementation of model cycle CY46R1 in July 2019. The CAMS CO analysis in ASSIM is improved when TROPOMI data are assimilated as TROPOMI has a small positive bias with respect to observations (see Sect. 2.2), which compensates for the negative bias of the underlying CAMS model and gives an analysis that agrees better with independent observations than if MOPITT is used as the main instrument. There are differences between the CO retrievals from TROPOMI, MOPITT, and IASI, whose investigation is beyond the scope of this paper. A study by George et al. (2015) using older versions of the MOPITT and IASI retrievals showed that using the same a priori profile in the MOPITT and IASI retrievals led to better agreement between the datasets in source regions and during periods of low sensitivity but that differences between the retrievals remained. They attributed these to differences in time and location of the observations, differences in the vertical sensitivity of the instruments, and differences in auxiliary parameters used in the retrievals (such as temperature, humidity, and cloud cover). MOPITT is likely still to be the instrument of choice for a future CAMS2 reanalysis because of the long dataset going back to 2000 and the long-term stability (Deeter et al., 2019).
Figure 9 takes a closer look at the analysis departures in the Arctic from IASI-B and IASI-C. Here we see a much improved fit in July and August when the high CO columns retrieved by IASI-BC, which are the result of strong boreal wildfires in Siberia and North America, are not well captured in CTRL (see also Sect. 3.2.4). The improved fit to IASI-BC in ASSIM continues throughout September and October, i.e. while TROPOMI data are available for assimilation north of 60∘ N. The departures are more similar in both experiments after November, when no TROPOMI data are available for assimilation in this latitude band. Examples of the impact of boreal wildfires in August 2021 on the CAMS TCCO analysis are discussed in Sect. 3.2.4 below.

Figure 9Time series from 6 July to 31 December 2021 of daily mean TCCO first-guess and analysis departures from (a) IASI-B and (b) IASI-C and TCCO values from observations, analysis, and first-guess departures for (c) IASI-B and (d) IASI-C in 1018 molec. cm−2 for all “good data” averaged over the area between 90 and 60∘ N. Analysis values and departures (abbreviated AnDep) from ASSIM are in red and for CTRL in magenta. First-guess values and departures (abbreviated FgDep) from ASSIM are in blue and for CTRL in cyan. IASI TCCO values are in green. IASI data are not assimilated north of 65∘ N.
3.2.3 Evaluation against independent observations
To assess the quality of the TROPOMI analysis, we compare the TCCO fields from ASSIM and CTRL with independent observations, i.e. observations that were not used in the analysis. Figure 10 shows comparison against NDACC FTIR data at all available stations. The negative CO total-column and tropospheric column biases seen in CTRL are much reduced in ASSIM everywhere, except at the Antarctic station of Arrivals Heights, where ASSIM shows a larger positive bias which increases with time. As no TROPOMI CO data are assimilated south of 60∘ S in ASSIM, but the assimilation leads to increased CO values elsewhere, this increase over Antarctica must be the result of transport into the Antarctic region. Stratospheric CO in ASSIM has a reduced bias in the SH but larger positive biases in the NH and tropics than in CTRL. As the CAMS system only uses a tropospheric chemistry scheme, we do not assess the changes to stratospheric CO any further. Figure 11 shows the mean biases and standard deviation values at each NDACC station for the period 6 July to 31 December 2021 and confirms the strong reduction of the total and tropospheric column CO biases in ASSIM. This suggests that large parts of the TROPOMI TCCO analysis departures shown in Figs. S3 and S4 are the result of a low bias of the CAMS model, rather than a high bias of the TROPOMI TCCO product.
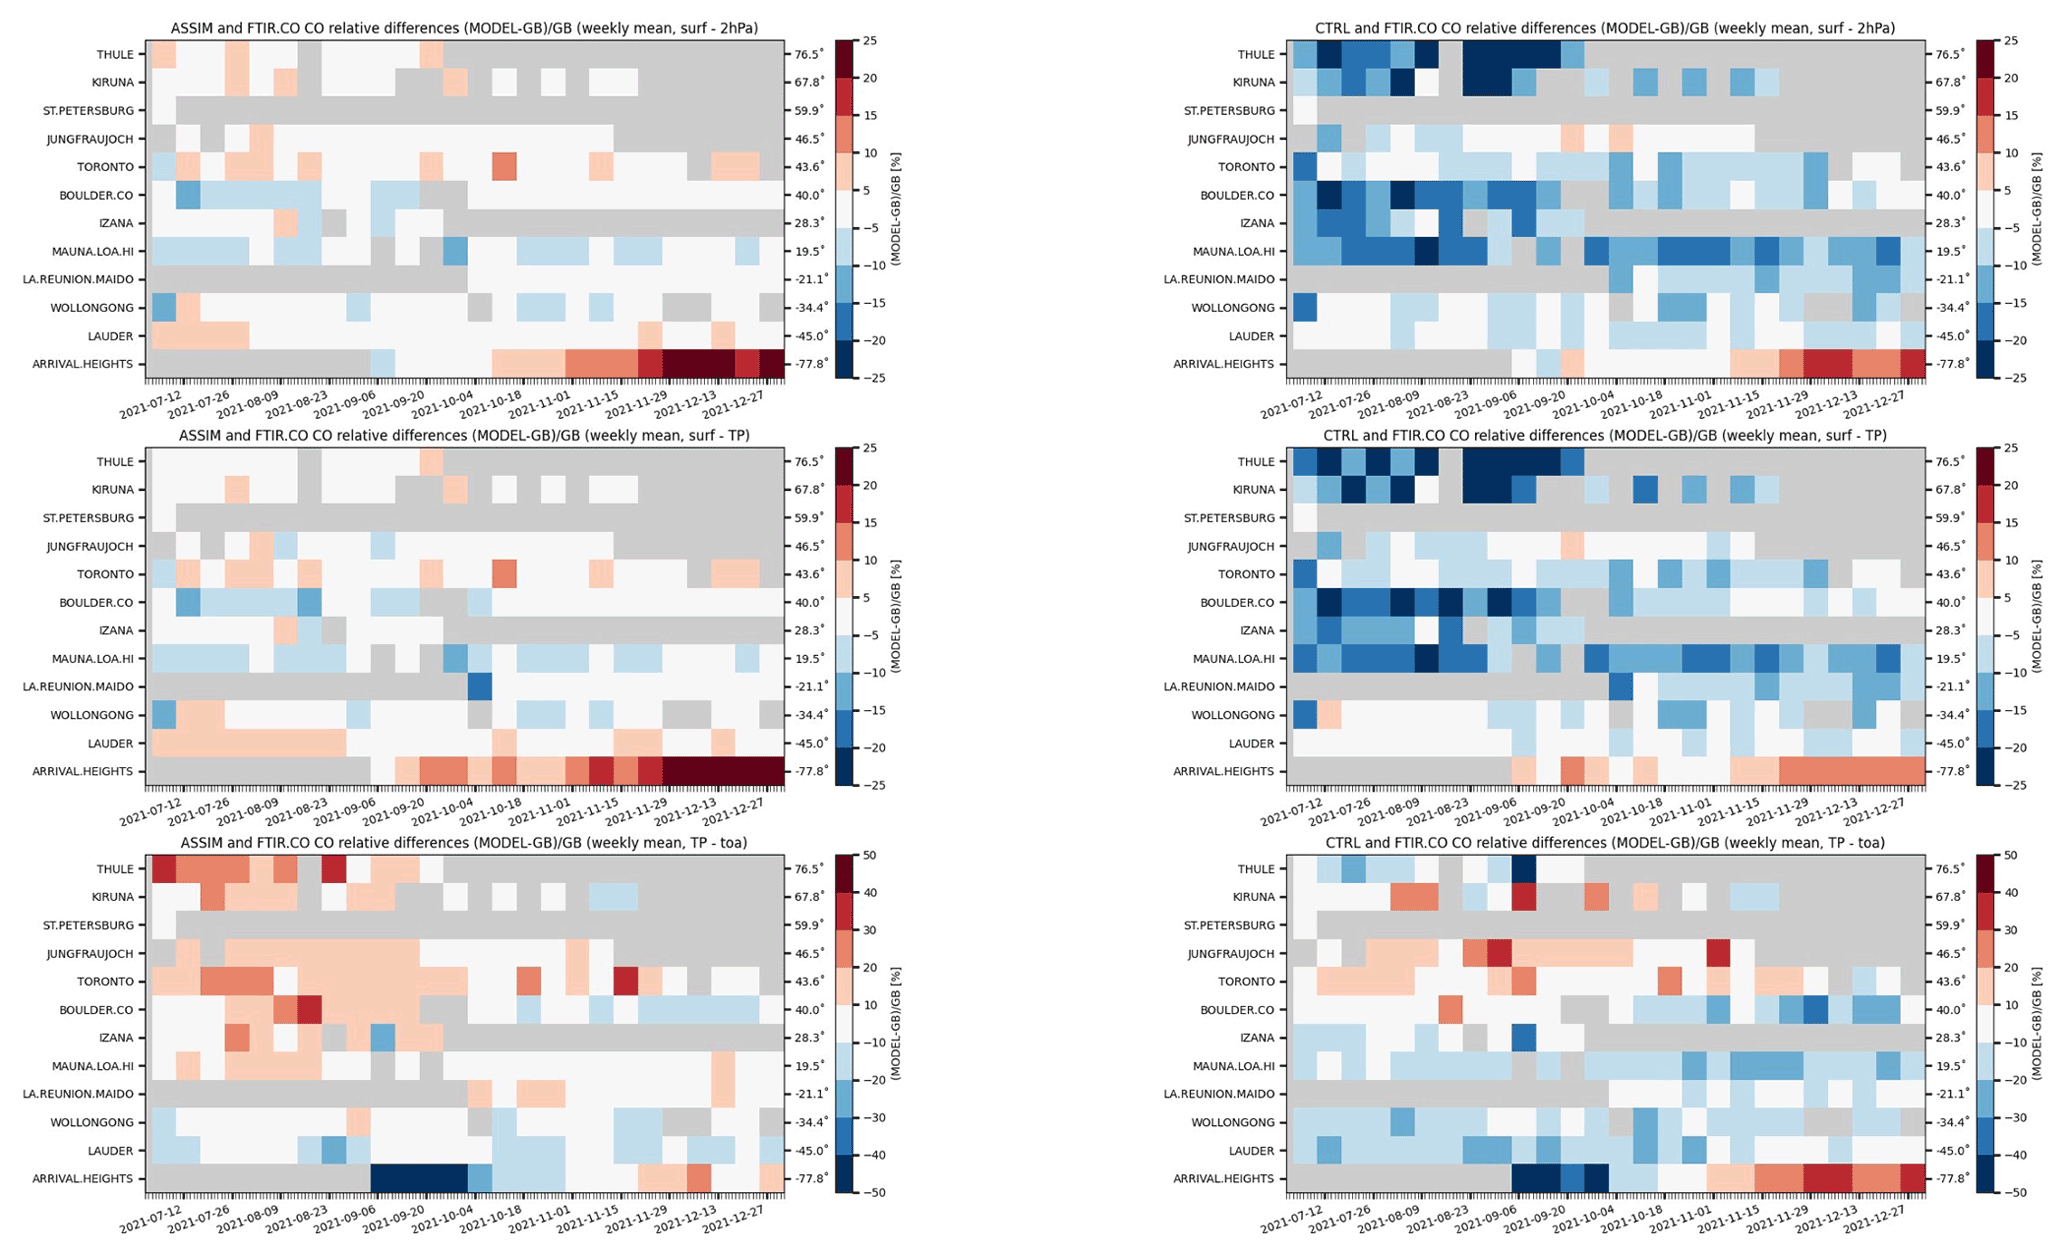
Figure 10Time series of relative mean bias for total-column CO (row 1), tropospheric CO columns (row 2) and stratospheric column (row 3) in percent from ASSIM (left column) and CTRL (right column) against NDACC FTIR data for the period 6 July to 31 December 2021. The overall uncertainty for NDACC tropospheric columns is approximately 3 %. The stations are sorted by latitude (Northern to Southern Hemisphere). Periods without data are shaded in grey.
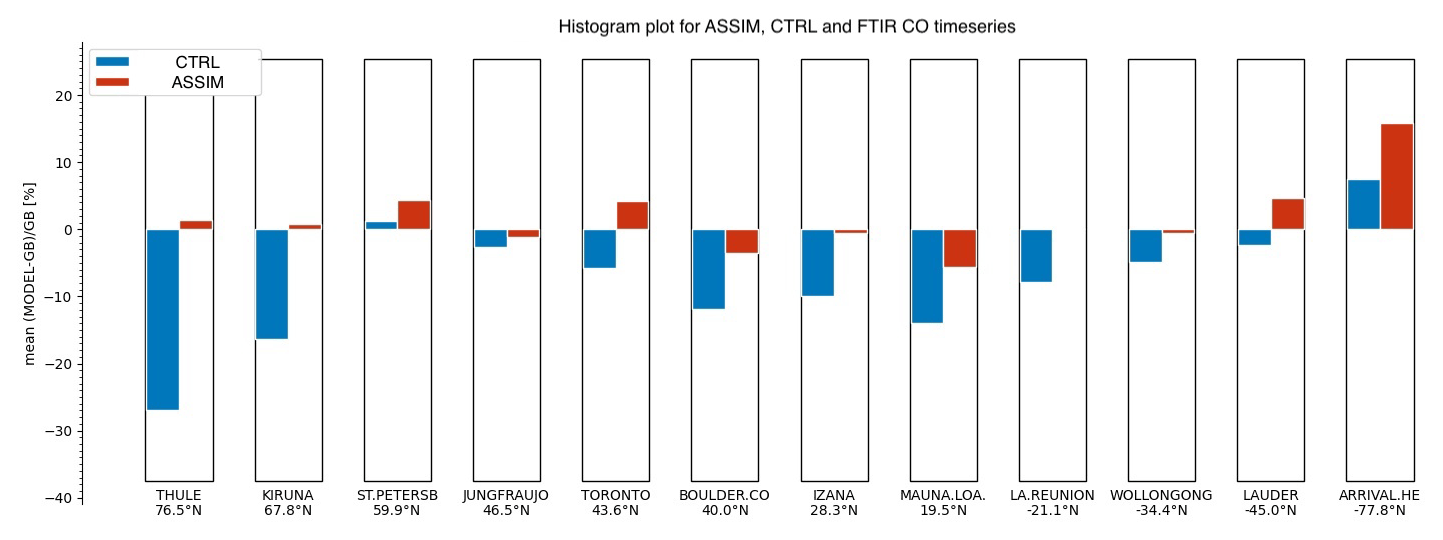
Figure 11Histogram plot of relative differences in percent against NDACC FTIR data tropospheric column CO from ASSIM (red) and CTRL (blue) for the period 6 July to 31 December 2021. Note that St. Petersburg only had one profile on 7 July 2021.
Figure 12 shows comparisons of tropospheric CO profiles from ASSIM and CTRL with IAGOS aircraft data at various airports averaged over the period July to December 2021, and Fig. 13 shows time series of the monthly mean MNMB against IAGOS CO for layers in the upper troposphere, mid-troposphere, and lower troposphere. We see a clear improvement in ASSIM with reduced biases, particularly in the lower and mid-troposphere at Frankfurt and North American and Middle Eastern airports. Here, the assimilation of the SWIR TROPOMI TCCO retrievals provides additional information to the CAMS system that is already constrained by the TIR MOPITT and IASI TCCO data in CTRL. At the West African airports, the improvement is largest above 800 hPa. Here, the number of clear data is smaller than in the other areas, reducing the sensitivity of TROPOMI to near-surface CO. The reduced bias at the West African airports in the upper troposphere confirms that the increase in CO seen in ASSIM in the upper tropical troposphere in Fig. 6b is a good result.
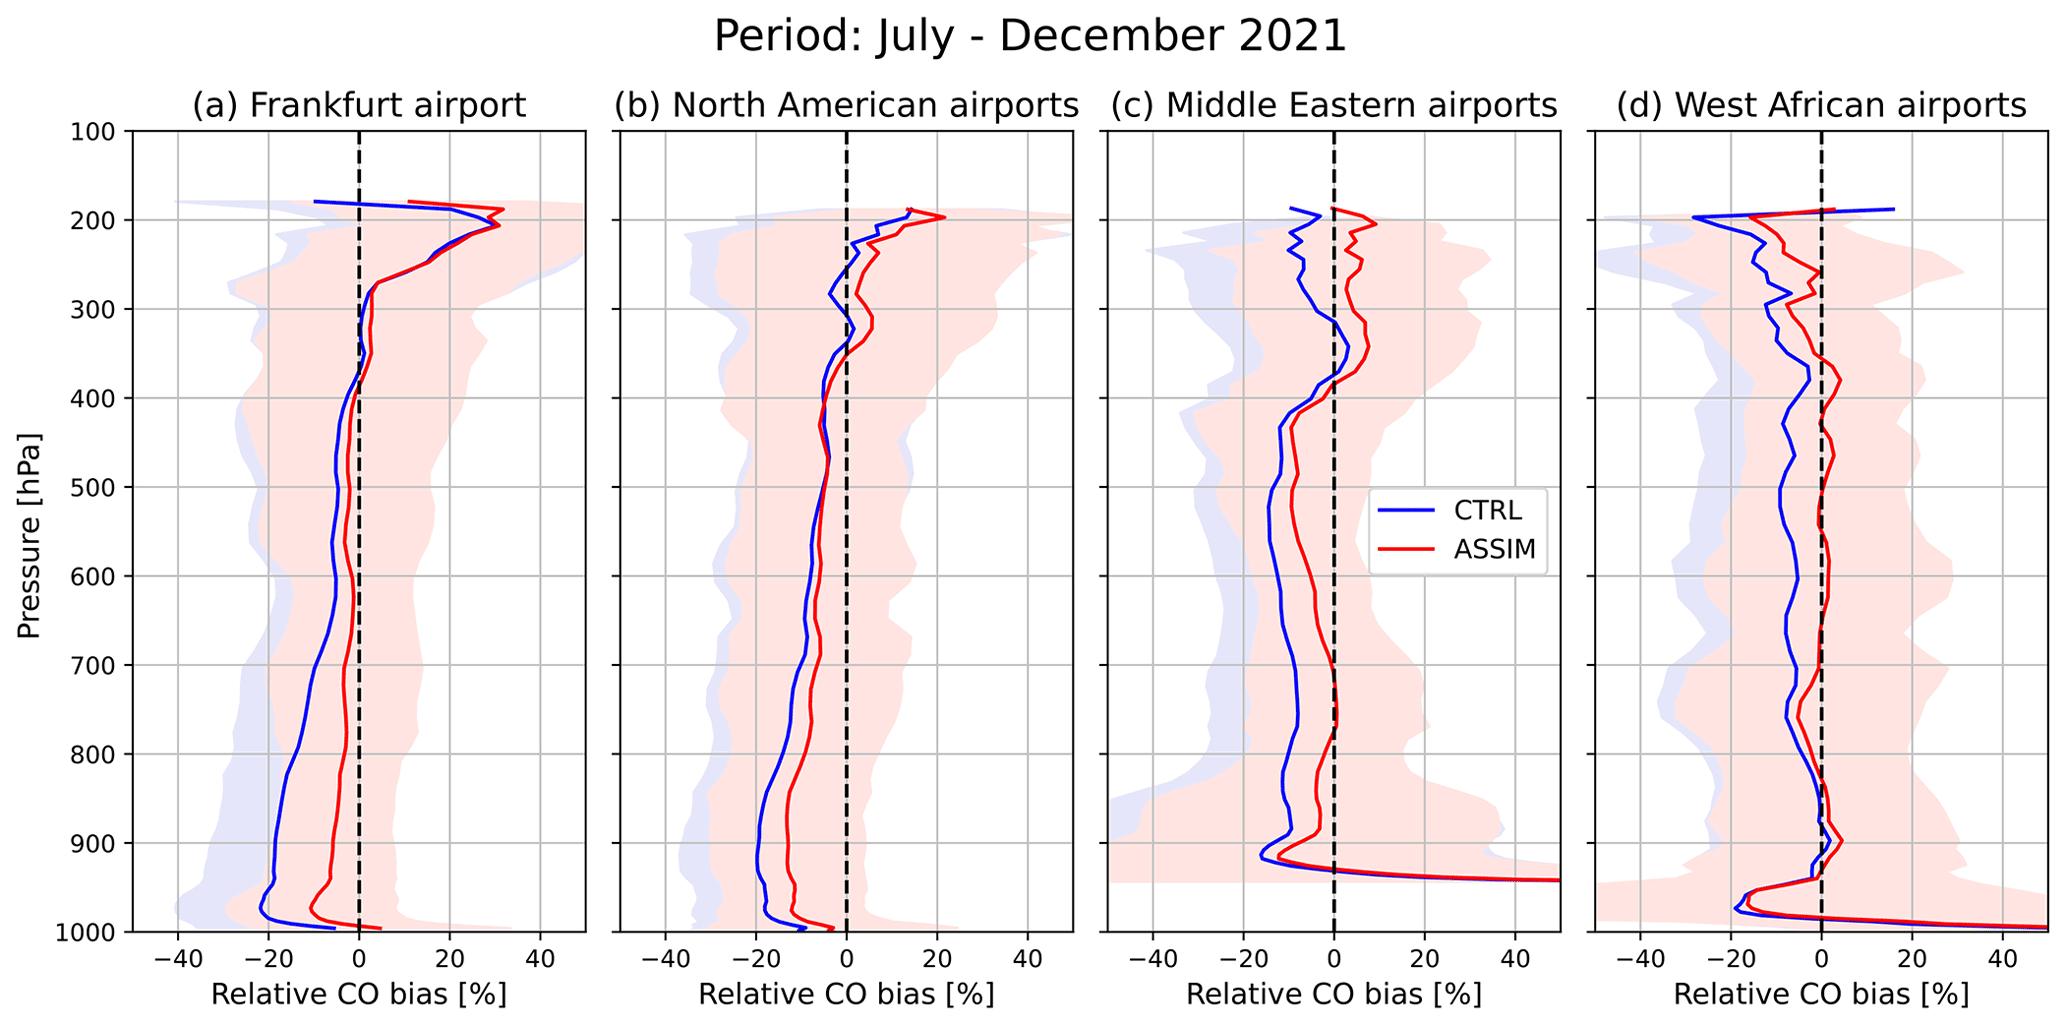
Figure 12Relative differences in percent of CO profiles from ASSIM (red) and CTRL (blue) against IAGOS aircraft data at (a) Frankfurt Airport and averaged over (b) North American, (c) Middle Eastern, and (d) West African airports averaged over the period July to December 2021. The shaded areas denote ±1 standard deviation.
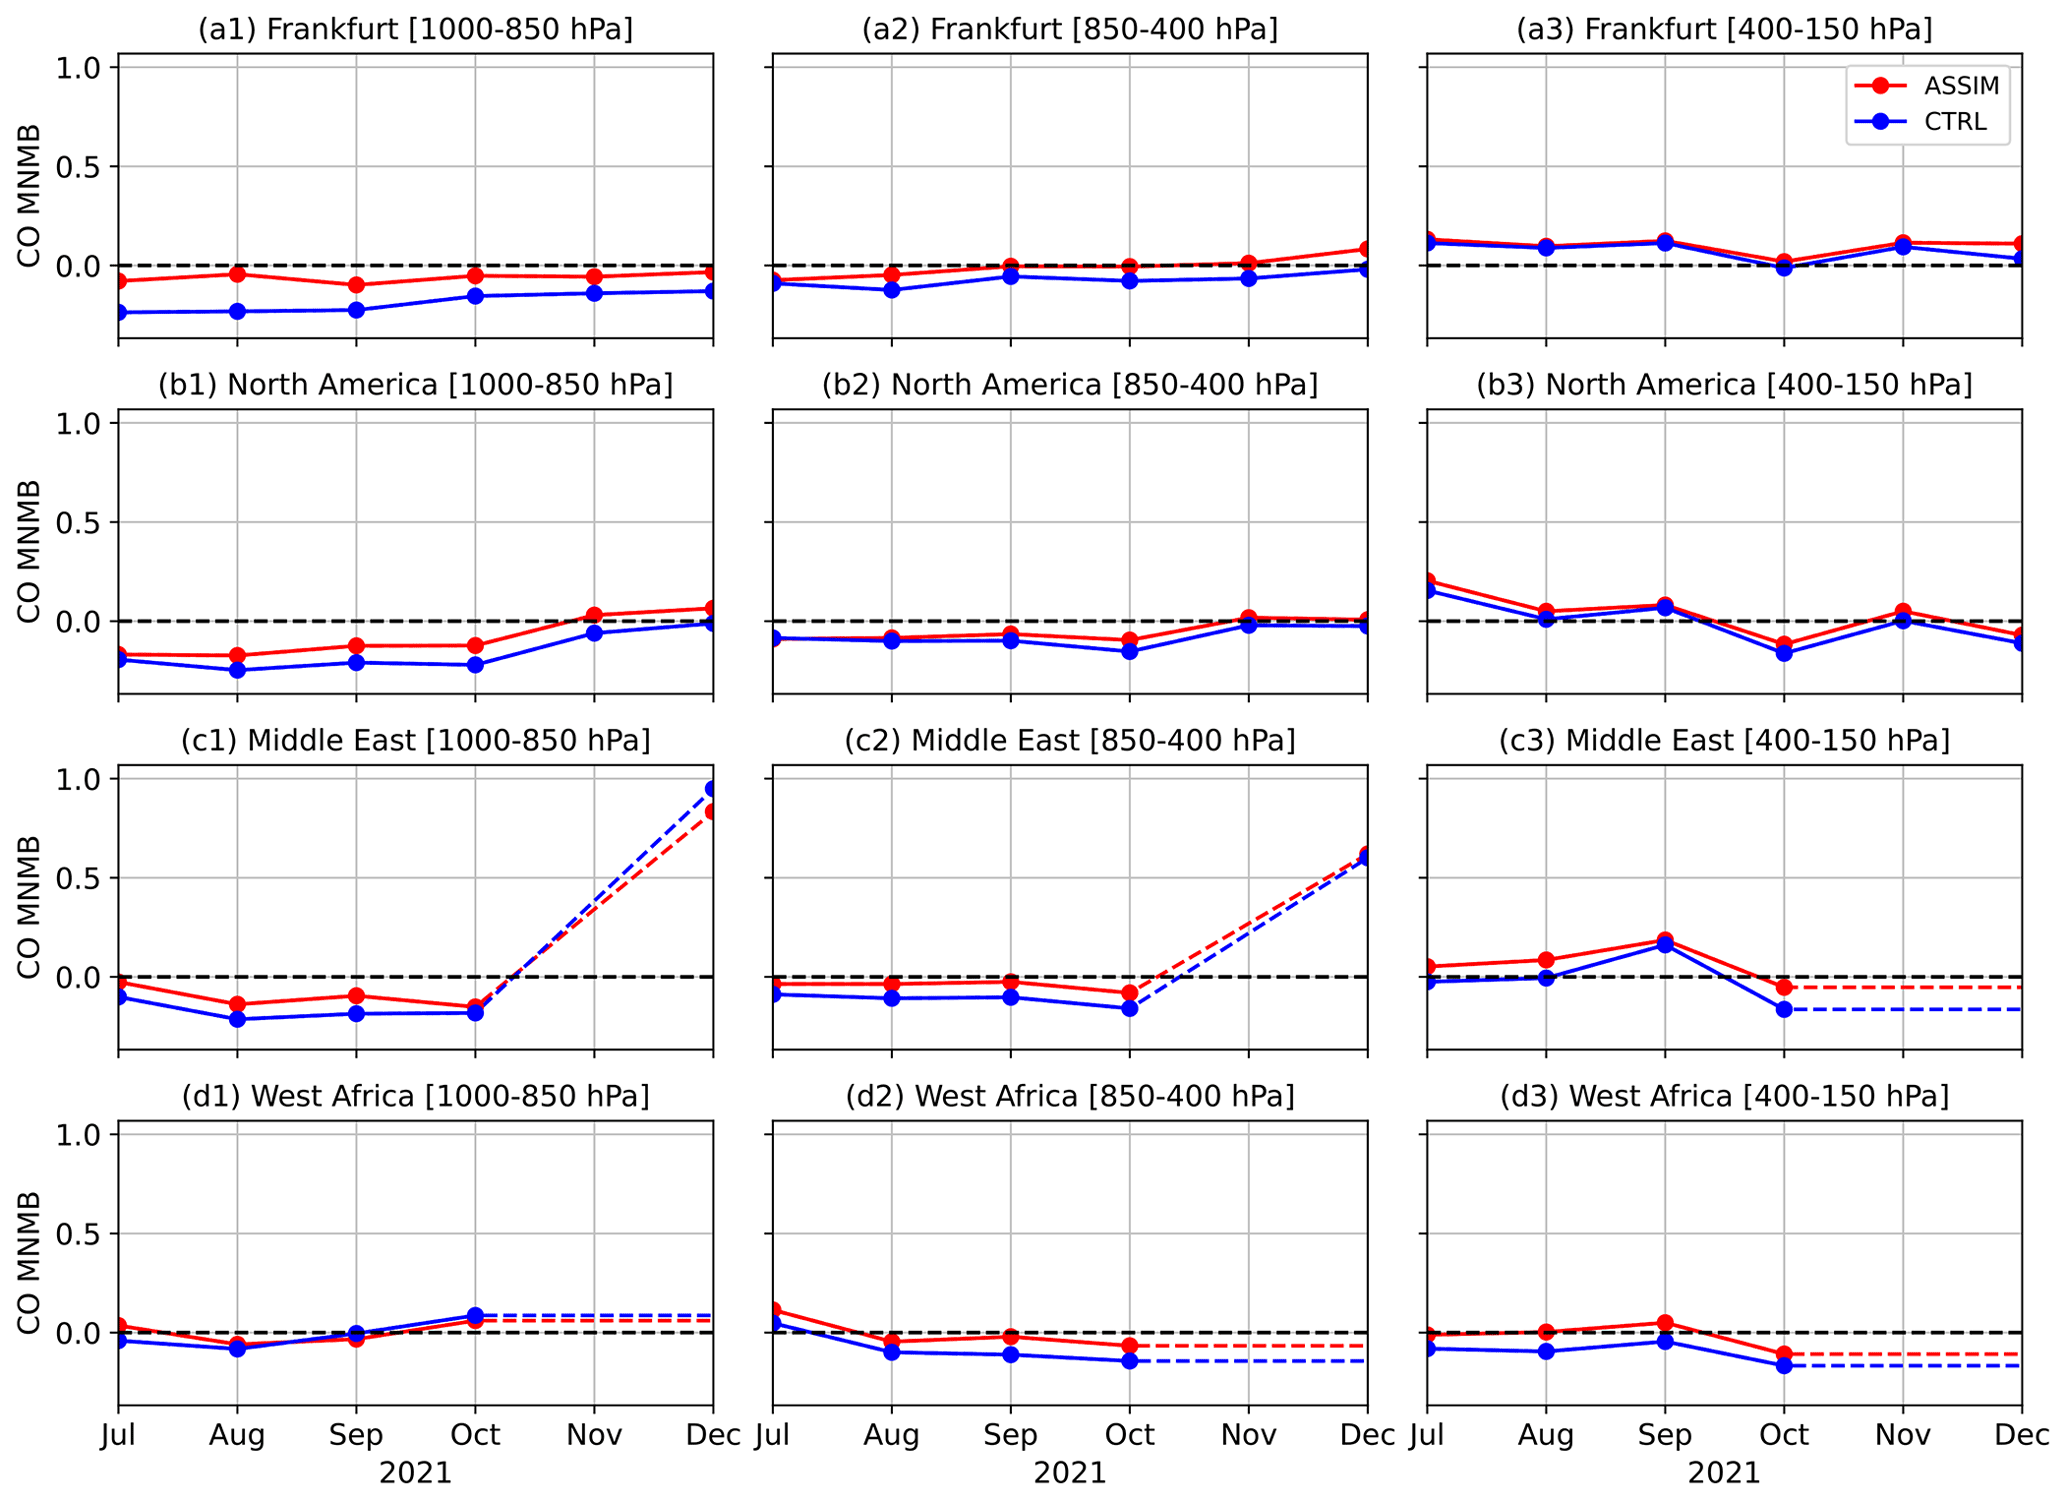
Figure 13Time series of monthly mean modified normalized mean bias (MNMB) against IAGOS data for the period July to December 2021 at (a) Frankfurt Airport and (b) North American, (c) Middle Eastern, and (d) West African airports for the layers (1) 1000–850 hPa, (2) 850–400 hPa, and (3) 400–150 hPa. Only one profile of calibrated IAGOS data was available at Middle Eastern airports in December 2021.
The comparisons against independent CO observations in this section show that the assimilation of NRT TROPOMI CO data in the CAMS global system reduces the negative bias of the CAMS CO analysis in the troposphere and has the largest impact in the lower and free troposphere. This is because the SWIR TROPOMI CO retrieval is sensitive to the CO column, including contributions from the boundary layer, especially for clear data. It therefore provides additional information for the CAMS CO analysis, which is already constrained by the assimilation of TIR MOPITT and IASI CO retrievals that are most sensitive to CO in the mid-troposphere.
3.2.4 Boreal wildfires July and August 2021
Increased flammability and wildfire risk, due to high temperatures and drought conditions, were manifested by the development of large-scale and persistent wildfires between June and August 2021 in the boreal regions of North America, particularly in the western United States and Canada, and Eurasia, particularly in the Sakha Republic of Russia. To illustrate the increased emissions from these fires, Fig. 14 shows that daily total biomass burning emissions of CO for Canada, the United States, and Siberia in July and August 2021 from the Global Fire Assimilation System (GFAS; Kaiser et al., 2012) were persistently above the typical daily values based on the 2003–2020 data in July and August 2021. The annual total biomass burning CO emissions for 2021 of 46 Tg (Siberia), 17 Tg (Canada), and 9 Tg (United States) were considerably larger than the multi-year mean (2003–2020). GFAS uses fire radiative power observations from the two Moderate Resolution Imaging Spectrometer (MODIS) instruments on the NASA Terra and Aqua satellites to produce daily global estimates of emissions from biomass burning, with a spatial resolution of 10 km × 10 km, and is one of the emission input datasets for the CAMS system (see Sect. 2.1). GFAS emission estimates are likely to be an underestimation of the real biomass burning emissions, and uncertainties (which are also valid for other biomass burning emission datasets) arise from (1) the detection limit of the sensors for observing smaller fires or low temperature fires (such as in peatlands) and (2) the knowledge of fuel types (i.e. vegetation types and peat) and associated emission factors – particularly in Eurasia/Siberia.
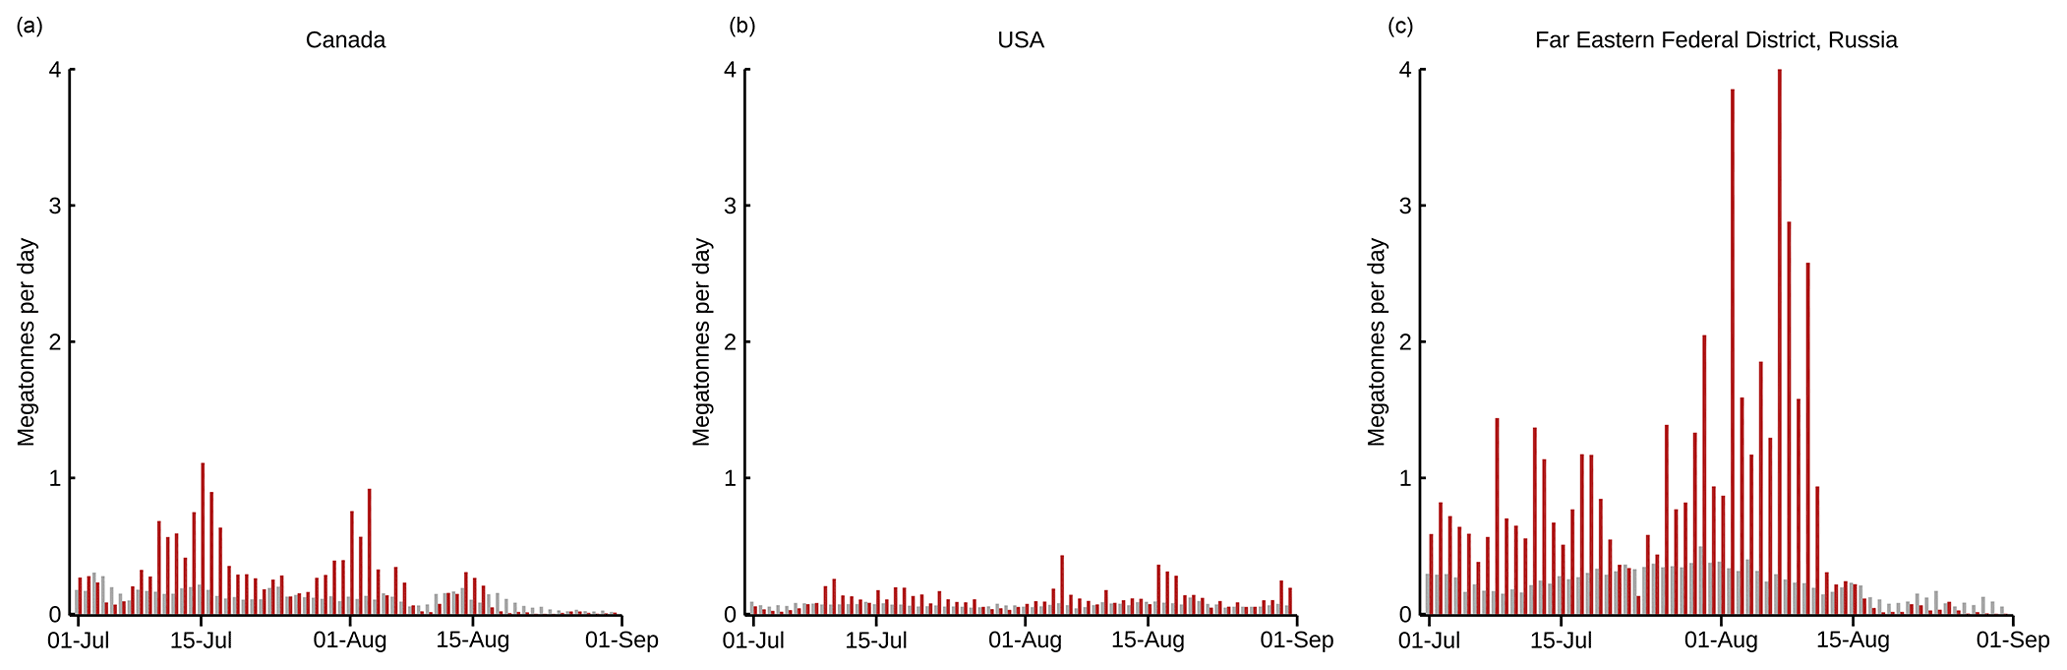
Figure 14GFAS v1.2 daily total CO biomass burning emissions in megatonnes per day for Canada (a), the United States (b), and eastern Russia (c) in July and August 2021 (red bars show 2021, and grey bars show 2003–2020 mean).
The CAMS global NRT forecasts captured the transport of smoke from the persistent large-scale Siberian and North American wildfires. In July and August 2021, thick smoke from the North American wildfires was transported eastwards across North America in several episodes. It was observed at many Aeronet sites (not shown) and led at times to severely degraded air quality as far away as the north-eastern US coast, with haze clearly apparent in New York City. Satellite images, Aeronet observations, and CAMS forecasts showed that smoke from some of the North American fires was transported further across the North Atlantic Ocean, passing Greenland, and reached Europe. A concern with such high amounts of smoke crossing Greenland is the potential deposition of black carbon to the ice sheet, and previous studies have shown smoke particles from Canadian wildfires in the snowpack (Thomas et al., 2017). A very high number of wildfires also burned in eastern Russia through July and early August, with the worst affected area the Sakha Republic. In terms of the total estimated wildfire carbon emissions for June–August in the Sakha Republic, a new record in the GFAS period was set in early August 2021, when the cumulative daily total emissions for 2021 were already larger than annual total of the previous record year 2020. CO from these fires was transported north across the Arctic Ocean as far as the North Pole. Figure S5 shows maps of daily TCCO from ASSIM from 4 to 23 August 2021, depicting CO from the strong fires in eastern Russia, the North American fires, and several of the episodes of CO transport from North America eastwards over the Atlantic and from Siberia over the North Pole. Note that on 6 August 2021 some of the highest CO columns globally were found over the normally clean North Pole.
We assess how far the TROPOMI CO assimilation can improve the representation of such plumes in the CAMS system. Total-column CO values are clearly improved in the Arctic in August 2021 in ASSIM, as can be seen in Fig. 15, which shows average TCCO fields from TROPOMI and IASI-C. The highest CO columns are found over Siberia as well as over North America, the North Pacific, the North Atlantic, and the Arctic Ocean. The same was seen for IASI-B (not shown). These high values are better captured in ASSIM than in CTRL, as seen by the smaller IASI-C analysis departures in ASSIM in Fig. 15, in the area north of 65∘ N where IASI data are not assimilated. This better agreement was also seen in Sect. 3.2.2 in the time series of departures averaged over the Arctic latitudes (Fig. 9).
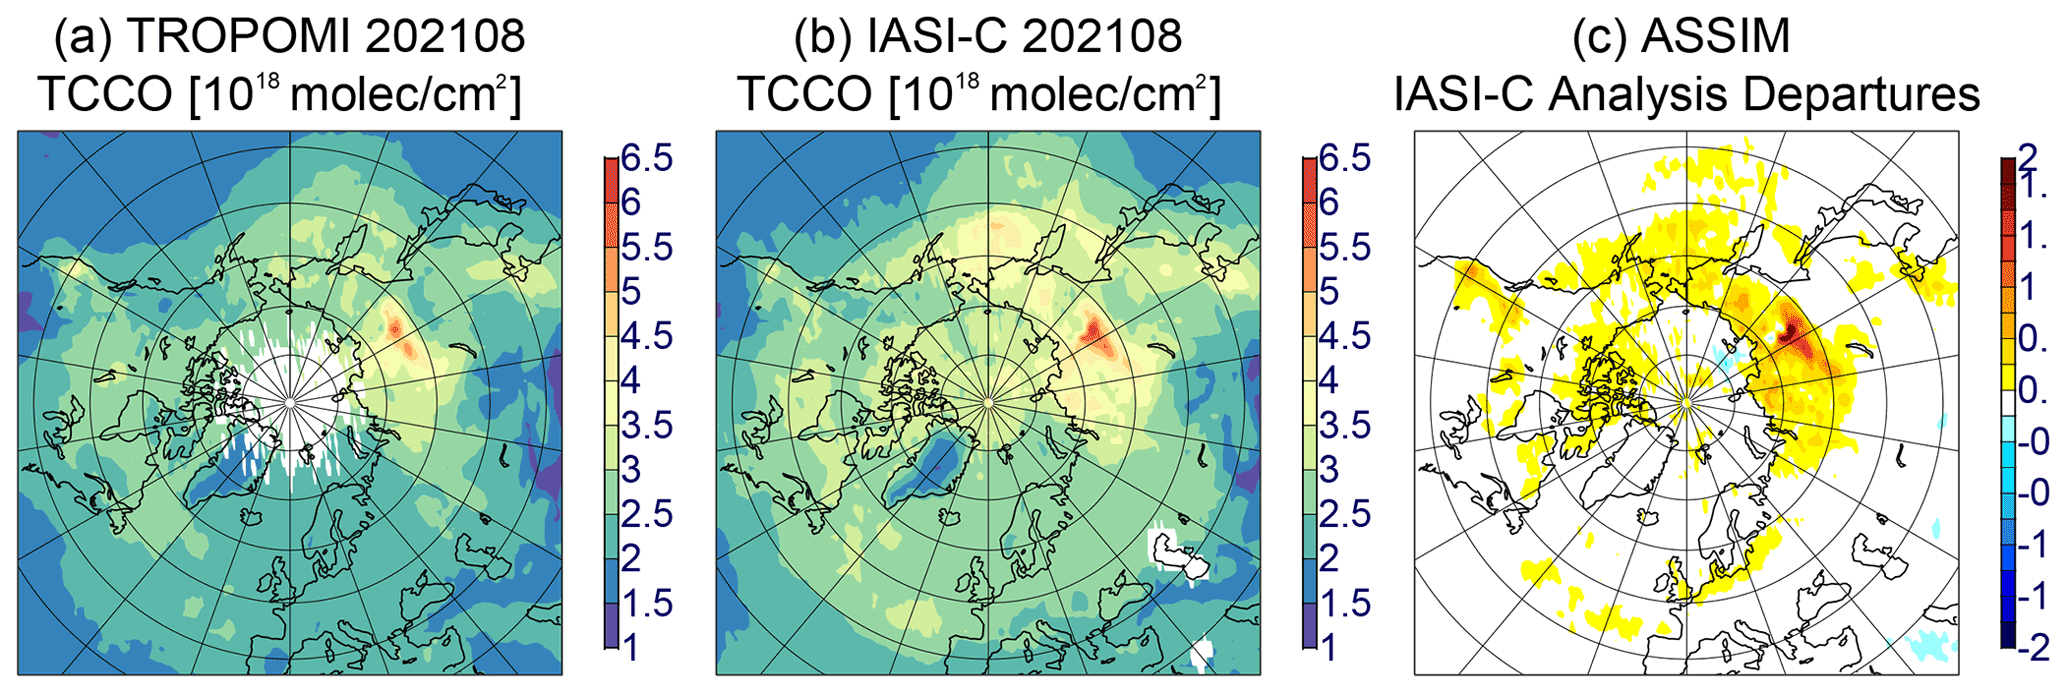
Figure 15August 2021 monthly mean (a) TROPOMI TCCO field, (b) IASI-C TCCO field, (c) IASI-C analysis departures from ASSIM, and (d) IASI-C analysis departures from CTRL in 1018 molec. cm−2.
The differences between CAMS CO fields in CTRL and the satellite observations can have many reasons and cannot purely be traced back to shortcomings in the biomass burning emissions. Underestimation of CO is a common problem with many atmospheric chemistry models (e.g. Gaubert et al., 2020) and not just the IFS. Other studies have related it to possible overestimation of the hydroxyl radical OH (Strode et al., 2015) as the reaction with OH is the main removal of CO, underestimation of anthropogenic emissions and of non-methane volatile organic compounds (NMVOCs) from traffic emissions (Stein et al., 2014), or underestimation of secondary CO sources from the oxidation of methane and NMVOCs (Gaubert et al., 2016). Problems with the deposition fluxes could also play a role. Further work is needed to investigate the reason for the negative CO bias in the CAMS model, not only for the Arctic in this case, but also in general.
Some IAGOS flights in August 2021 intersected parts of the CO plumes that were transported eastwards over North America and further over the Atlantic. Figure 16 shows CO profiles at Boston and New York airports on 6 August which crossed such a plume, visible in the CO values greater than 150 ppb above 500 hPa. The subsequent profile at New York (Fig. 16c) on 7 August still showed the remnants of the plume, with values greater than 100 ppb between 450 and 350 hPa. Both ASSIM and CTRL have elevated CO values above 500 hPa at both airports on 6 August but do not quite reach the values seen in the observations. The vertical structure of the CO profile is reproduced better in ASSIM than in CTRL, but the largest improvement is found in the lower troposphere in all three cases, and the actual impact at the plume altitude is smaller.
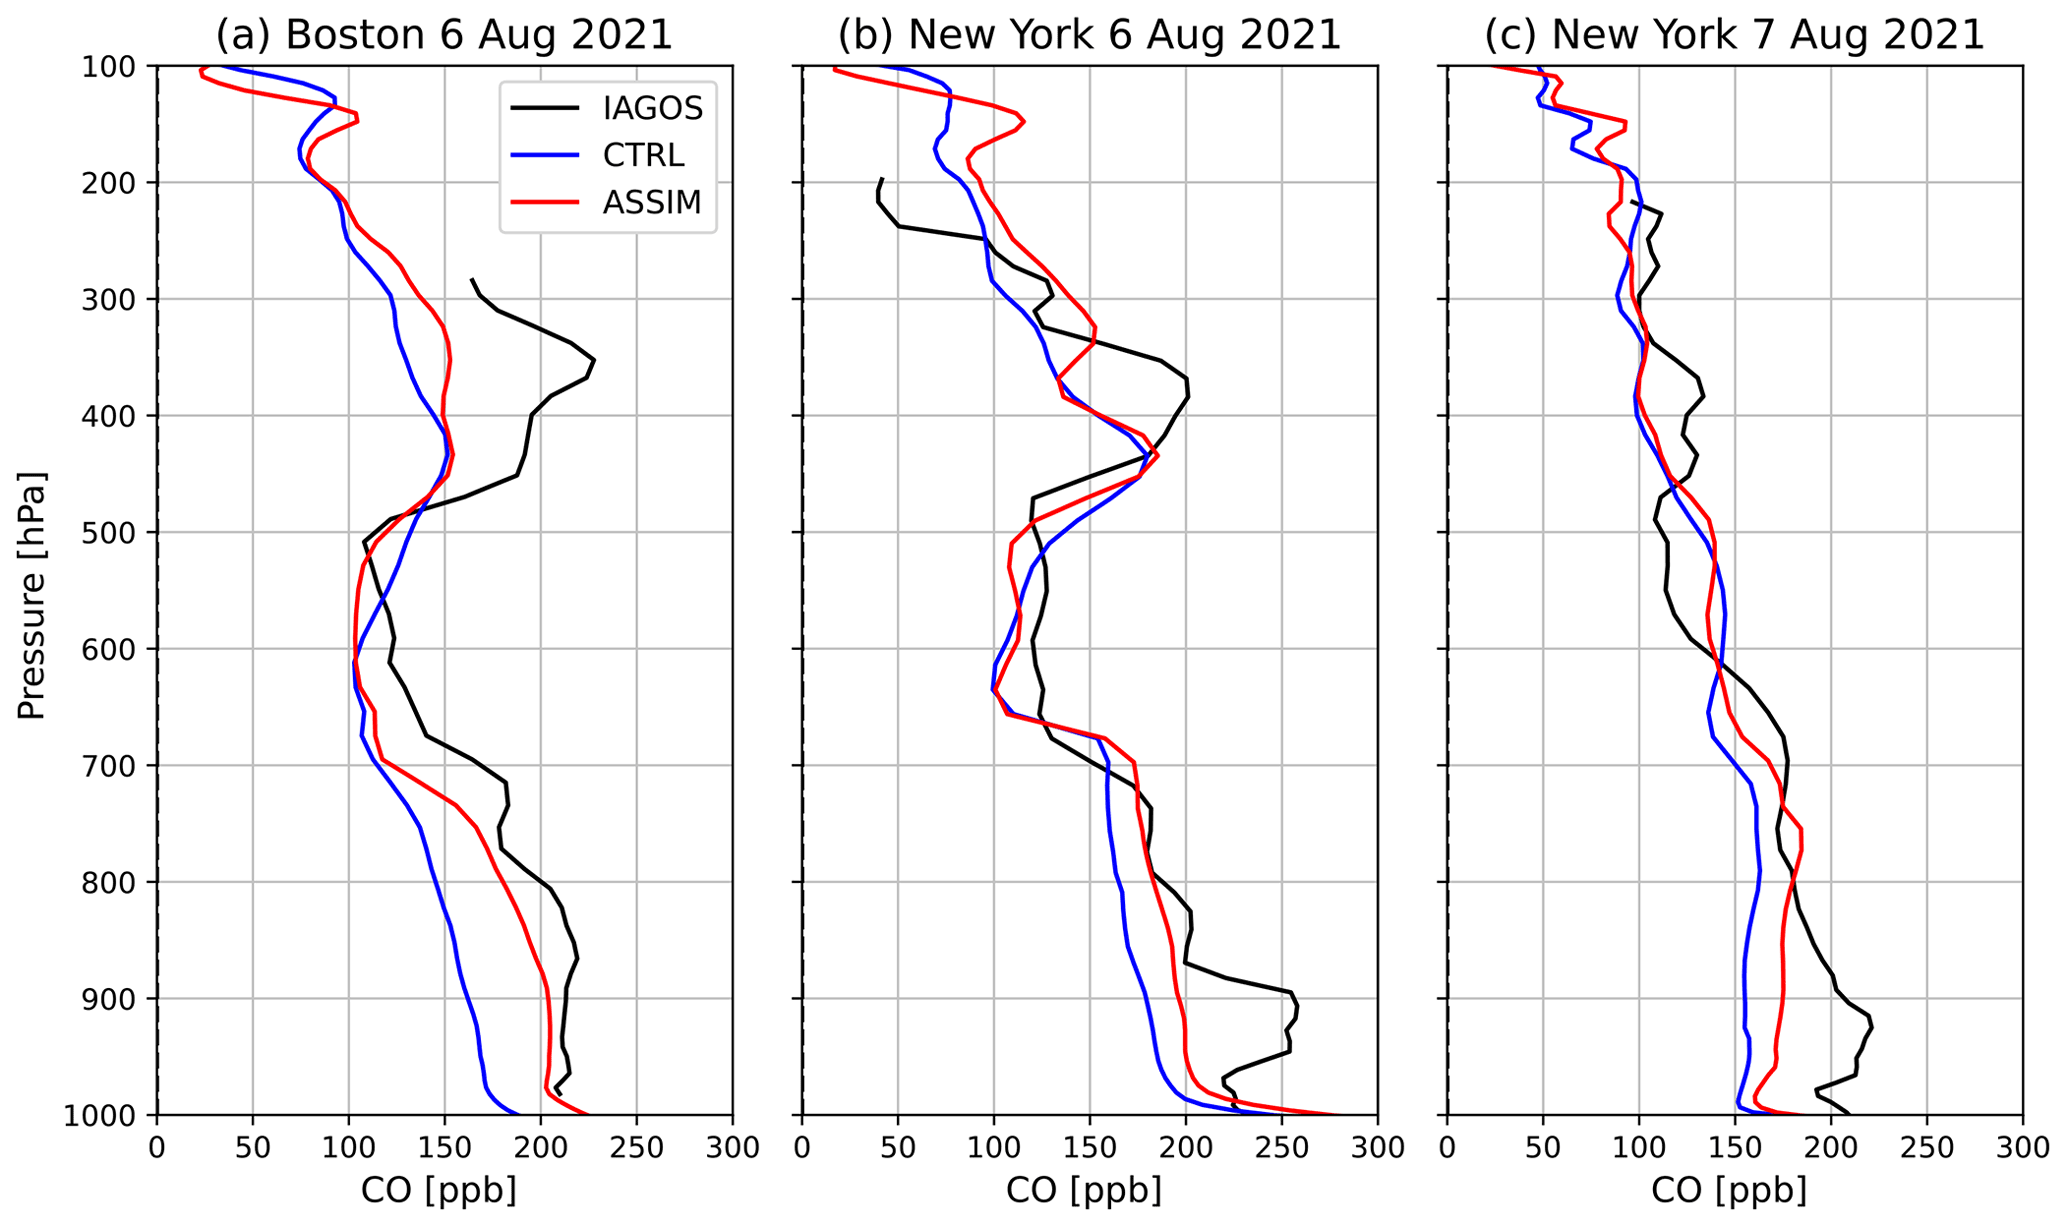
Figure 16CO profiles in parts per billion (ppb) from IAGOS data (black), ASSIM (red), and CTRL (blue) at (a) Boston on 6 August, (b) New York on 6 August, and (c) New York on 7 August 2021.
Smoke plumes from the North American wildfires reached Europe on 7, 9, and 11 August 2021 and again between 19 and 21 August and were visible in IAGOS aircraft CO profiles at Frankfurt Airport (Figs. S6 and S7). Figure 17 shows weekly averaged CO profiles at Frankfurt Airport between 26 July and 29 August 2021 and illustrates clearly the improved fit to the IAGOS profiles below about 500 hPa in ASSIM. The figure also shows that the high CO values seen in IAGOS profiles between 500 and 400 hPa in the week 2–8 August are not quite captured in either model run, while the weekly mean profile of ASSIM for the week 16–22 August agrees well with the IAGOS profiles at all altitudes. A closer look at the daily IASI CO profiles in Figs. S6 and S7 shows elevated CO values above 500 hPa on 7 and 9 August, with maximum values located around 400 hPa and exceeding 300 and 250 ppb, respectively. On 11 August the plume was located at lower altitude (between 600 and 500 hPa) and only had values of about 180 ppb. ASSIM and CTRL show elevated CO values above 500 hPa on 7 August, but maximum CO values remain below 200 ppb. On 9 August, the plume is located at higher altitude in ASSIM and CTRL than in the observations. The weaker plume on 11 August is captured to some extent in ASSIM but does again not reach the values seen in the observations. On 19–21 August 2021 ASSIM and CTRL both show elevated CO values in the upper troposphere, with larger values in ASSIM, but the maximum values of about 180 ppb seen in the observations above 300 hPa are not quite reached. On 20 August both ASSIM and CTRL still show the plume, while the observations do not show it anymore. This might be because of a horizontal or temporal mismatch of the plume location in the model and observations.
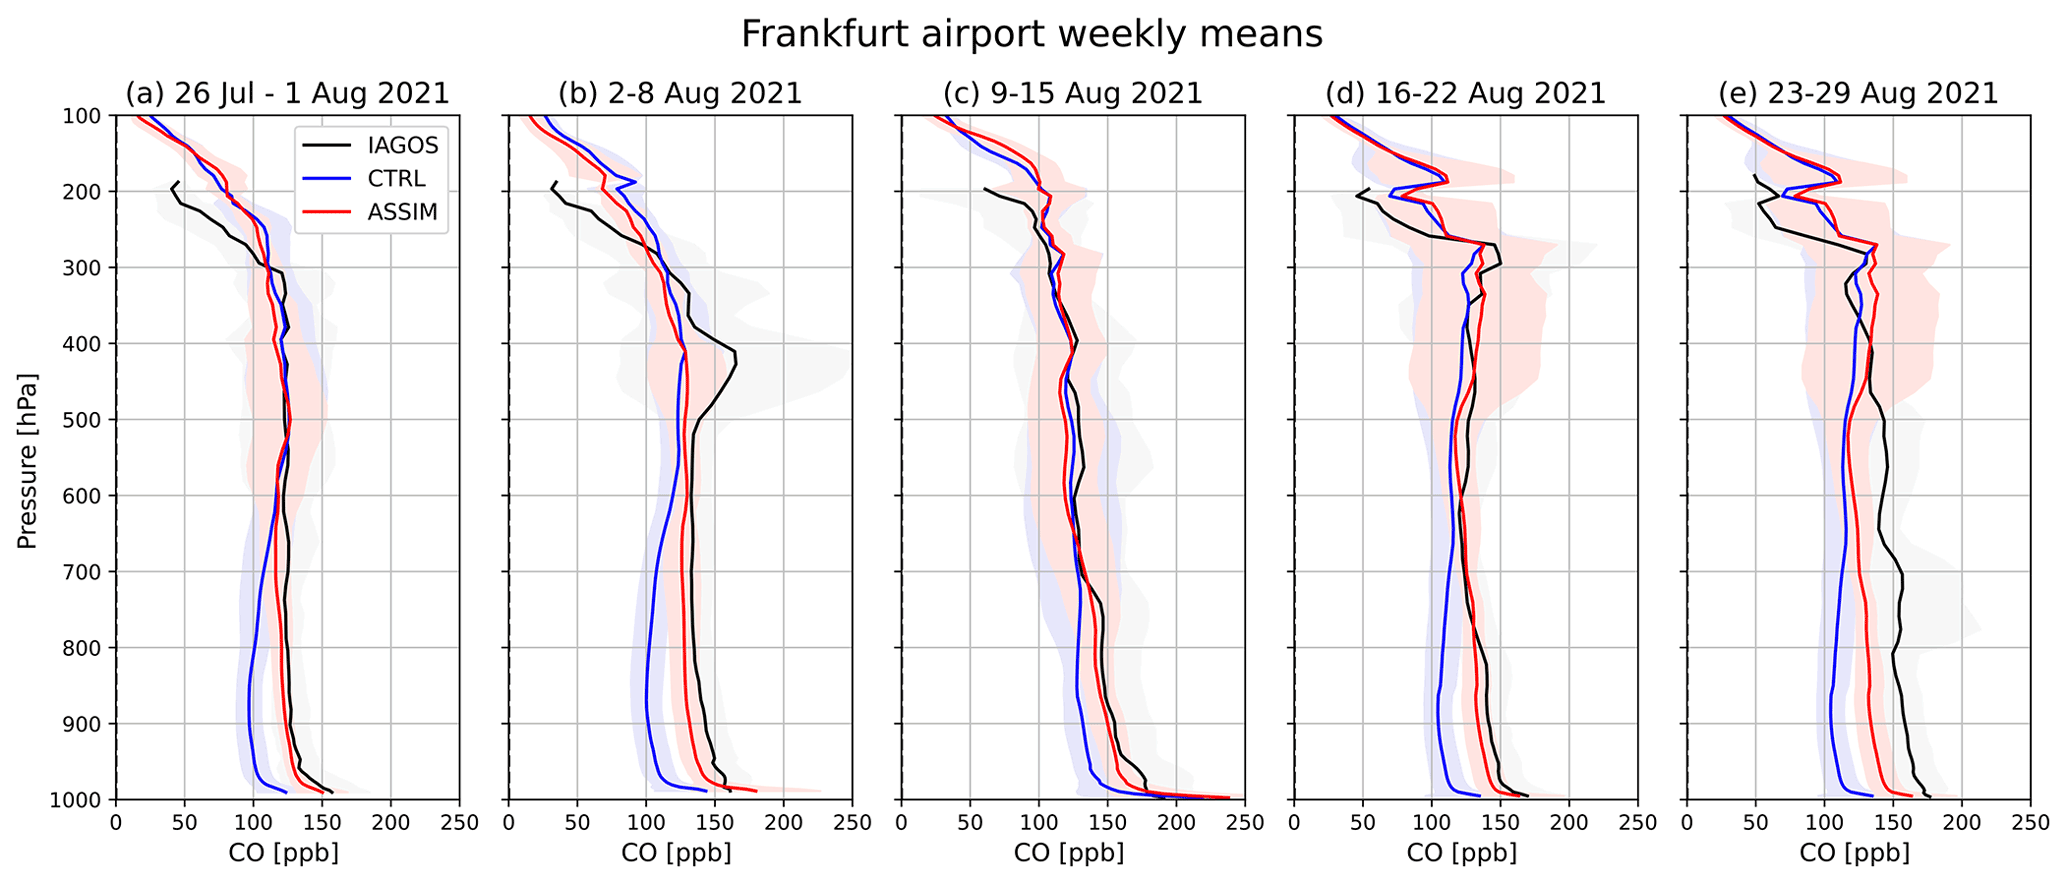
Figure 17Weekly mean CO profiles in parts per billion (ppb) from IAGOS data (black), ASSIM (red), and CTRL (blue) at Frankfurt for the weeks commencing (a) 26 July, (b) 2 August, (c) 9 August, (d) 16 August, and (e) 23 August 2021.
The comparison with IAGOS data for these case studies shows that the largest improvement from the assimilation of TROPOMI CO data in ASSIM is found in the lower and mid-troposphere, i.e. below the altitude of the smoke plumes. In the upper troposphere, the CAMS analysis is already constrained by the assimilated TIR MOPITT and IASI data, and the additional impact from the TROPOMI data is smaller. While TROPOMI is very successful in correcting the total CO column, it cannot completely correct such deficiencies in the CAMS vertical CO profiles, suggesting that modelling aspects such as transport and accurate emission estimates remain essential to capture such events in the absence of vertically higher-resolved satellite data for use in the assimilation.
Operational near-real-time TROPOMI total-column CO data have been monitored passively in the CAMS global data assimilation system, which assimilates IASI and MOPITT TIR TCCO data, since November 2018. In the global mean, CAMS TCCO analysis values are about 10 % lower than TROPOMI TCCO (averaged over the period November 2018 to December 2021), with the smallest relative differences found for clear-sky data in the tropics (6.6 %) and the largest relative differences (11 %–14 %) found in the polar latitude bands, i.e. the areas where no satellite CO retrievals are assimilated in the global CAMS system. Differences between TROPOMI and CAMS are reduced after the TROPOMI algorithm upgrade to v02.02.00 in July 2021, making assimilation tests with the TROPOMI CO data possible.
The TROPOMI SWIR CO retrieval under clear-sky atmospheric conditions shows a good sensitivity throughout the atmosphere, including contributions from near-surface CO. Retrievals from cloudy measurements exhibit a reduced sensitivity in the lower troposphere, caused by shielding of the clouds in the observation geometry of the satellite. Therefore, the retrieved TROPOMI TCCO values have contributions from different parts of the CO profile to the total column for clear and cloudy data, and it is important to take the TROPOMI averaging kernels into account when comparing CAMS and TROPOMI data. By doing this, the CAMS CO column smoothed by the TROPOMI total averaging kernels can be compared with the TROPOMI TCCO values in a like-with-like manner. The CAMS system applies the TROPOMI averaging kernels in the observation operator when assimilating the data. Single-observation experiments show that the assimilation of clear-sky TROPOMI data has a larger impact in the lower troposphere and at the surface, while cloudy data have a larger impact on changing the CAMS field in the free and upper troposphere because of the different vertical sensitivities of the clear-sky and cloudy observations, as given by their averaging kernels.
The assimilation of TROPOMI CO improves the fit to the also assimilated IASI-BC TCCO data but degrades the fit to MOPITT TCCO. The NRT MOPITT CO columns have lower values than IASI and TROPOMI data, and by adding TROPOMI to the assimilation system the impact of the MOPITT data is reduced, and the analysis draws less strongly to those data. This does not imply that there is a problem with the NRT MOPITT CO data but rather illustrates that there are differences between the assimilated satellite retrievals (possibly due to differences in a priori profiles, vertical sensitivity of the instruments, or auxiliary parameters used in the retrievals). The underlying problem is a negative CO bias of the CAMS model, which is seen in comparison with independent observations (e.g. NDACC FTIR and IAGOS) and which is better corrected when TROPOMI data are used in addition to MOPITT and IASI.
When TROPOMI data are assimilated in the CAMS system, they lead to increased CO analysis values and an improved fit to independent observations. The impact of the TROPOMI assimilation is large, with TCCO changes of over 50 % in the CAMS analysis at high northern latitudes during July and August 2021 when exceptionally strong boreal wildfires led to unprecedented amounts of CO being released into the atmosphere. The TROPOMI CO assimilation also has a large impact on the vertical distribution of CO in the CAMS analysis and leads to increased CO analysis values at the surface and in the troposphere in the NH and in the upper troposphere in the tropics. It improves the fit to IAGOS aircraft data, with the largest absolute and relative CO increase found in the lower and the free troposphere, where the global CAMS NRT system is known to have a negative bias. Here, the assimilation of TROPOMI CO data improves the fit to IAGOS aircraft profiles in Europe (Frankfurt Airport) and at North American, West African, and Middle Eastern airports. Furthermore, comparison with NDACC FTIR data and tropospheric and total-column CO data also shows reduced negative biases when TROPOMI CO data are assimilated.
TROPOMI monitoring time series show increased CO columns due to boreal wildfires during NH summers 2019, 2020, and 2021 and due to the 2019/2020 Australian bushfires in the SH. In particular, the NH summer of 2021 saw strong wildfires in North America and Russia that released record amounts of CO into the atmosphere. Plumes of smoke from the Siberian fires were transported to polar latitudes, leading to some of the highest CO columns globally on 6 August at the normally clean North Pole, and from North America eastwards over the North Atlantic, reaching as far as Europe. These transport events were clearly visible in the CAMS CO analysis fields. The assimilation of TROPOMI CO improved the fit to IASI TCCO data in the Arctic during the period of intense burning in July and August 2021, by increasing the CAMS TCCO analysis values. Some plumes of high CO in the upper troposphere were intersected by IAGOS aircraft at Boston, New York, and Frankfurt Airport. These plumes were also captured in the CAMS CO analysis, but the upper-level CO maxima were usually smaller than in the IAGOS observations. At these altitudes, the assimilation of TROPOMI did not change the CAMS CO field much, compared to a model run that already assimilated MOPITT and IASI TCCO. While the CO column can be well constrained, TROPOMI CO data do not provide further constraints on individual plumes that are transported across continents or oceans at altitudes above 500 hPa. Modelling aspects such as transport and accurate emission estimates remain essential to successfully capture such events. Furthermore, the total-column TROPOMI data do not have the vertical resolution to introduce such fine-scale structures in the CAMS analysis. For this, data with higher vertical resolution would be needed.
One shortcoming of the current CAMS system is a low CO bias in the free troposphere. This is a common problem with many atmospheric chemistry models (e.g. Gaubert et al., 2020) and not just the IFS. Further work is needed to understand the reason for this bias and to improve the model. While the negative bias increased with the change to model version CY46R1 and the change to the CAMS_GLOB emission inventory in July 2019, negative biases were seen before then and might not purely be a result of underestimated anthropogenic emissions. Factors such as the distribution of the hydroxyl radical OH, secondary CO sources from the oxidation of methane and NMVOCs, and deposition processes might also be important. CAMS is in the process of developing an inversion prototype using ECMWF's 4D-Var system (McNorton et al., 2022), which should help to address shortcomings in emission inventories, but work on modelling aspects is also needed.
The results of this paper illustrate that the use of TROPOMI TCCO data in the global CAMS system is beneficial, and consequently the TROPOMI CO assimilation will be activated in the next operational upgrade (CY48R1) of the CAMS global system which is scheduled for Q2/2023. The TROPOMI CO data, retrieved from the SWIR part of the solar spectrum, are sensitive to CO throughout the troposphere, including contributions from the surface, while the TCCO data that are already assimilated by CAMS (i.e. TIR MOPITT and IASI TCCO) have the largest sensitivity in the mid-troposphere. TROPOMI therefore brings additional information on the vertical CO distribution into the CAMS analysis in parts of the column where CO is not already well constrained by the assimilation of TIR MOPITT and IASI TCCO retrievals. The largest contribution from near-surface CO is found for clear-sky TROPOMI CO retrievals, while the impact in the lower troposphere is reduced for cloudy scenes.
The output from the two experiments used in this study is available from https://apps.ecmwf.int/research-experiments/expver/ (last access: 26 December 2021; registration required) using the following DOIs: hmib (Inness, 2022a) – https://doi.org/10.21957/ax0c-fm72 and hlxm (Inness, 2022b) – https://doi.org/10.21957/mwqe-vs95.
The supplement related to this article is available online at: https://doi.org/10.5194/acp-22-14355-2022-supplement.
AI carried out the experiments described in the paper and the validation of the resulting analysis fields and wrote the manuscript. RR set up the S5P processing chain at ECMWF, which included coding and testing the BUFR converter needed to ingest the TROPOMI TCCO data in the ECMWF data system. JF helped with the development of the IFS chemistry module. MP contributed to the section on wildfires and produced Fig. 14. MA worked on the development of the CAMS background errors. LJ wrote and maintains the profile_browse software used to process the IAGOS data at ECMWF. BL carried out the validation with NDACC FTIR data and produced Figs. 3, 10, 11. TB and JL developed the TROPOMI TCCO retrieval, and IA is the TROPOMI co-principal investigator. All co-authors gave useful comments during the writing of the paper. PN is the IAGOS CO data provider (PI).
At least one of the (co-)authors is a member of the editorial board of Atmospheric Chemistry and Physics. The peer-review process was guided by an independent editor, and the authors also have no other competing interests to declare.
Publisher’s note: Copernicus Publications remains neutral with regard to jurisdictional claims in published maps and institutional affiliations.
The Copernicus Atmosphere Monitoring Service is operated by the European Centre for Medium-Range Weather Forecasts on behalf of the European Commission as part of the Copernicus programme (https://www.copernicus.eu/en, last access: 31 October 2022). Tobias Borsdorff acknowledges funding from the TROPOMI national programme through NSO. Thanks are expressed to Sebastien Massart for his PyWave tool that helped to analyse the background error matrices and Mohamed Dahoui for help with obstat. MOZAIC/CARIBIC/IAGOS data were created with support from the European Commission, national agencies in Germany (BMBF), France (MESR), and the UK (NERC), and the IAGOS member institutions (https://www.iagos.org/organisation/members/, last access: 31 October 2022). The participating airlines (Lufthansa, Air France, Austrian, China Airlines, Hawaiian Airlines, Iberia, Cathay Pacific, Air Namibia, and Sabena) supported IAGOS by carrying the measurement equipment free of charge since 1994. The data are available at http://www.iagos.fr (last access: 31 October 2022) thanks to additional support from AERIS. The NDACC FTIR data used in this publication were obtained from NDACC PIs (Arrival Heights (NIWA): Smale, Daniel; Boulder (NCAR): Hannigan, James; Garmisch (KIT/IMK-IFU): Sussmann, Ralf; Izaña (KIT): Schneider, Matthias; Jungfraujoch (ULG): Mahieu, Emmanuel; Kiruna (KIT): Blumenstock, Thomas; La Réunion (BIRA.IASB): De Mazière, Martine; Lauder (NIWA): Smale, Daniel; Mauna Loa (NCAR): Hannigan, James; St. Petersburg (SPBU): Makarova, Maria; Thule (NCAR): Hannigan, James; Toronto (UTORONTO): Strong, Kimberly; Wollongong (UOW): Jones, Nicholas; Zugspitze (KIT/IMK-IFU): Sussmann, Ralf) as part of the Network for the Detection of Atmospheric Composition Change (NDACC) and are available through the NDACC website at http://www.ndacc.org (last access: 31 October 2022). The National Center for Atmospheric Research is sponsored by the National Science Foundation. The NCAR Fourier transform spectroscopy (FTS) observation programmes at Thule, GR, Boulder, CO, and Mauna Loa, HI, are supported under contract by the National Aeronautics and Space Administration (NASA). We wish to thank the Danish Meteorological Institute for support at the Thule site and NOAA for support of the MLO site. The NDACC FTIR stations (Bremen, Garmisch, Izaña, and Ny-Ålesund) have been supported by the German Bundesministerium für Wirtschaft und Energie (BMWi) via DLR under grants 50EE1711A, 50EE1711B, and 50EE1711D. The multi-decadal FTIR monitoring programme of ULiège at the Jungfraujoch station has been primarily supported by the F.R.S.-FNRS (Brussels, Belgium) and by the GAW-CH programme of MeteoSwiss. The International Foundation High Altitude Research Stations Jungfraujoch and Gornergrat (HFSJG, Bern) supported the facilities needed to perform the FTIR observations.
This work is supported by the Copernicus Atmosphere Monitoring Service (CAMS) programme managed by ECMWF on behalf of the European Commission.
This paper was edited by Jianzhong Ma and reviewed by three anonymous referees.
Benedetti, A., Morcrette, J.-J., Boucher, O., Dethof, A., Engelen, R. J., Fisher, M., Flentje, H., Huneeus, N., Jones, L., Kaiser, J. W., Kinne, S., Mangold, A., Razinger, M., Simmons, A. J., and Suttie, M.: Aerosol analysis and forecast in the European Centre for Medium-Range Weather Forecasts Integrated Forecast System: 2. Data assimilation, J. Geophys. Res., 114, D13205, https://doi.org/10.1029/2008JD011115, 2009.
Borsdorff, T., Hasekamp, O. P., Wassmann, A., and Landgraf, J.: Insights into Tikhonov regularization: application to trace gas column retrieval and the efficient calculation of total column averaging kernels, Atmos. Meas. Tech., 7, 523–535, https://doi.org/10.5194/amt-7-523-2014, 2014.
Borsdorff, T., Aan de Brugh, J., Hu, H., Aben, I., Hasekamp, O., and Landgraf, J.: Measuring carbon monoxide with TROPOMI: First results and a comparison with ECMWF-IFS analysis data, Geophys. Res. Lett., 45, 2826–2832, https://doi.org/10.1002/2018GL077045, 2018.
Clerbaux, C., Boynard, A., Clarisse, L., George, M., Hadji-Lazaro, J., Herbin, H., Hurtmans, D., Pommier, M., Razavi, A., Turquety, S., Wespes, C., and Coheur, P.-F.: Monitoring of atmospheric composition using the thermal infrared IASI/MetOp sounder, Atmos. Chem. Phys., 9, 6041–6054, https://doi.org/10.5194/acp-9-6041-2009, 2009.
Courtier, P., Thépaut, J.-N., and Hollingsworth, A.: A strategy for operational implementation of 4D-Var, using an incremental approach, Q. J. Roy. Meteor. Soc., 120, 1367–1388, 1994.
Dee, D. P. and Uppala, S.: Variational bias correction of satellite radiance data in the ERA-Interim reanalysis, Q. J. Roy. Meteor. Soc, 135, 1830–1841, 2009.
Deeter, M., Francis, G., Gille, J., Mao, D., Martínez-Alonso, S., Worden, H., Ziskin, D., Drummond, J., Commane, R., Diskin, G., and McKain, K.: The MOPITT Version 9 CO product: sampling enhancements and validation, Atmos. Meas. Tech., 15, 2325–2344, https://doi.org/10.5194/amt-15-2325-2022, 2022.
Deeter, M. N., Martínez-Alonso, S., Edwards, D. P., Emmons, L. K., Gille, J. C., Worden, H. M., Pittman, J. V., Daube, B. C., and Wofsy, S. C.: Validation of MOPITT Version 5 thermal-infrared, near-infrared, and multispectral carbon monoxide profile retrievals for 2000–2011, J. Geophys. Res.-Atmos., 118, 6710–6725, https://doi.org/10.1002/jgrd.50272, 2013.
Deeter, M. N., Edwards, D. P., Francis, G. L., Gille, J. C., Martínez-Alonso, S., Worden, H. M., and Sweeney, C.: A climate-scale satellite record for carbon monoxide: the MOPITT Version 7 product, Atmos. Meas. Tech., 10, 2533–2555, https://doi.org/10.5194/amt-10-2533-2017, 2017.
Deeter, M. N., Edwards, D. P., Francis, G. L., Gille, J. C., Mao, D., Martínez-Alonso, S., Worden, H. M., Ziskin, D., and Andreae, M. O.: Radiance-based retrieval bias mitigation for the MOPITT instrument: the version 8 product, Atmos. Meas. Tech., 12, 4561–4580, https://doi.org/10.5194/amt-12-4561-2019, 2019.
Errera, Q., Ramonet, M., Sudarchikova, N., Schulz, M., Eskes, H. J., Basart, S., Benedictow, A., Bennouna, Y., Blechschmidt, A.-M., Chabrillat, S., Christophe, Y., Cuevas, E., El-Yazidi, A., Flentje, H., Fritzsche, P., Hansen, K. M., Im, U., Kapsomenakis, J., Langerock, B., Richter, A., Thouret, V., Wagner, A., Warneke, T., and Zerefos, C.: Validation report of the CAMS near-real-time global atmospheric composition service: Period March – May 2021, Copernicus Atmosphere Monitoring Service (CAMS) report, CAMS84_2018SC3_D1.1.1_MAM2021.pdf, https://doi.org/10.24380/qq5m-dg18, 2021.
Fisher, M.: Generalized frames on the sphere with application to background error covariance modelling, in: Seminar on recent developments in numerical methods for atmospheric and ocean modelling, Shinfield Park, Reading, 6–10 September 2004, Proceedings, ECMWF, https://www.ecmwf.int/node/9405 (last access: 30 June 2022), 2004.
Fisher, M.: Wavelet Jb – a new way to model the statistics of back-ground errors, ECMWF, Shinfield Park, Reading, ECMWF Newsletter, 106, 23–28, 2006.
Flemming, J. and Inness, A.: Carbon Monoxide, in: “State of the Climate in 2020”, B. Am. Meteorol. Soc., 102, S101–S102, https://doi.org/10.1175/2021BAMSStateoftheClimate.1, 2021.
Flemming, J., Huijnen, V., Arteta, J., Bechtold, P., Beljaars, A., Blechschmidt, A.-M., Diamantakis, M., Engelen, R. J., Gaudel, A., Inness, A., Jones, L., Josse, B., Katragkou, E., Marecal, V., Peuch, V.-H., Richter, A., Schultz, M. G., Stein, O., and Tsikerdekis, A.: Tropospheric chemistry in the Integrated Forecasting System of ECMWF, Geosci. Model Dev., 8, 975–1003, https://doi.org/10.5194/gmd-8-975-2015, 2015.
Flemming, J., Benedetti, A., Inness, A., Engelen, R. J., Jones, L., Huijnen, V., Remy, S., Parrington, M., Suttie, M., Bozzo, A., Peuch, V.-H., Akritidis, D., and Katragkou, E.: The CAMS interim Reanalysis of Carbon Monoxide, Ozone and Aerosol for 2003–2015, Atmos. Chem. Phys., 17, 1945–1983, https://doi.org/10.5194/acp-17-1945-2017, 2017.
Garrigues, S., Remy, S., Chimot, J., Ades, M., Inness, A., Flemming, J., Kipling, Z., laszlo, I., Benedetti, A., Ribas, R., Jafariserajehlou, S., Fougnie, B., Kondragunta, S., Engelen, R., Peuch, V.-H., Parrington, M., Bousserez, N., Vazquez Navarro, M., and Agusti-Panareda, A.: Monitoring multiple satellite Aerosol Optical Depth (AOD) products within the Copernicus Atmosphere Monitoring Service (CAMS) data assimilation system, Atmos. Chem. Phys. Discuss. [preprint], https://doi.org/10.5194/acp-2022-176, in review, 2022.
Gaubert, B., Arellano Jr., A. F., Barré, J., Worden, H. M., Emmons, L. K., Tilmes, S., Buchholz, R. R., Vitt, F., Raeder, K., Collins, N., Anderson, J. L., Wiedinmyer, C., Martinez Alonso, S., Edwards, D. P., Andreae, M. O., Hannigan, J. W., Petri, C., Strong, K., and Jones, N.: Toward a chemical reanalysis in a coupled chemistry-climate model: An evaluation of MOPITT CO assimilation and its impact on tropospheric composition, J. Geophys. Res.-Atmos., 121, 7310–7343, https://doi.org/10.1002/2016JD024863, 2016.
Gaubert, B., Emmons, L. K., Raeder, K., Tilmes, S., Miyazaki, K., Arellano Jr., A. F., Elguindi, N., Granier, C., Tang, W., Barré, J., Worden, H. M., Buchholz, R. R., Edwards, D. P., Franke, P., Anderson, J. L., Saunois, M., Schroeder, J., Woo, J.-H., Simpson, I. J., Blake, D. R., Meinardi, S., Wennberg, P. O., Crounse, J., Teng, A., Kim, M., Dickerson, R. R., He, H., Ren, X., Pusede, S. E., and Diskin, G. S.: Correcting model biases of CO in East Asia: impact on oxidant distributions during KORUS-AQ, Atmos. Chem. Phys., 20, 14617–14647, https://doi.org/10.5194/acp-20-14617-2020, 2020.
George, M., Clerbaux, C., Hurtmans, D., Turquety, S., Coheur, P.-F., Pommier, M., Hadji-Lazaro, J., Edwards, D. P., Worden, H., Luo, M., Rinsland, C., and McMillan, W.: Carbon monoxide distributions from the IASI/METOP mission: evaluation with other space-borne remote sensors, Atmos. Chem. Phys., 9, 8317–8330, https://doi.org/10.5194/acp-9-8317-2009, 2009.
George, M., Clerbaux, C., Bouarar, I., Coheur, P.-F., Deeter, M. N., Edwards, D. P., Francis, G., Gille, J. C., Hadji-Lazaro, J., Hurtmans, D., Inness, A., Mao, D., and Worden, H. M.: An examination of the long-term CO records from MOPITT and IASI: comparison of retrieval methodology, Atmos. Meas. Tech., 8, 4313–4328, https://doi.org/10.5194/amt-8-4313-2015, 2015.
Granier, C., Bessagnet, B., Bond, T., D'Angiola, A., Denier van der Gon, H., Frost, G. J., Heil, A., Kaiser, J. W., Kinne, S., Klimont, Z., Kloster,S., Lamarque, J.-F., Liousse, C., Masui, T., Meleux, F., Mieville, A., Ohara, R., Raut, J.-C., Riahi, K., Schultz, M. G., Smith, S. G., Thompson, A., van Aardenne, J., van der Werf, G. R., and van Vuuren, D. P.: Evolution of anthropogenic and biomass burning emissions of air pollutants at global and regional scales during the 1980–2010 period, Climatic Change, 109, 163–190, https://doi.org/10.1007/s10584-011-0154-1, 2011.
Granier, C., Darras, S., Denier van der Gon, H., Doubalova, J., Elguindi, N., Galle, B., Gauss, M., Guevara, M., Jalkanen, J.-P., Kuenen, J., Liousse, C., Quack, B., Simpson, D., and Sindelarova, K.: The Copernicus Atmosphere Monitoring Service global and regional emissions (April 2019 version), Copernicus Atmosphere Monitoring Service (CAMS) report, https://doi.org/10.24380/d0bn-kx16, 2019.
Griffin, R. J., Chen, J., Carmody, K., Vutukuru, S., and Dabdub, D.: Contribution of gas phase oxidation of volatile organic compounds to atmospheric carbon monoxide levels in two areas of the United States, J. Geophys. Res., 112, D10S17, https://doi.org/10.1029/2006JD007602, 2007.
Guenther, A., Karl, T., Harley, P., Wiedinmyer, C., Palmer, P. I., and Geron, C.: Estimates of global terrestrial isoprene emissions using MEGAN (Model of Emissions of Gases and Aerosols from Nature), Atmos. Chem. Phys., 6, 3181–3210, https://doi.org/10.5194/acp-6-3181-2006, 2006.
Hudman, R. C., Murray, L. T., Jacob, D. J., Millet, D. B., Turquety, S., Wu, S., Blake, D. R., Goldstein, A. H., Holloway, J., and Sachse, G. W.: Biogenic versus anthropogenic sources of CO over the United States, Geophys. Res. Lett., 35, L04801, https://doi.org/10.1029/2007GL032393, 2008.
Huijnen, V., Williams, J., van Weele, M., van Noije, T., Krol, M., Dentener, F., Segers, A., Houweling, S., Peters, W., de Laat, J., Boersma, F., Bergamaschi, P., van Velthoven, P., Le Sager, P., Eskes, H., Alkemade, F., Scheele, R., Nédélec, P., and Pätz, H.-W.: The global chemistry transport model TM5: description and evaluation of the tropospheric chemistry version 3.0, Geosci. Model Dev., 3, 445–473, https://doi.org/10.5194/gmd-3-445-2010, 2010.
Huijnen, V., Pozzer, A., Arteta, J., Brasseur, G., Bouarar, I., Chabrillat, S., Christophe, Y., Doumbia, T., Flemming, J., Guth, J., Josse, B., Karydis, V. A., Marécal, V., and Pelletier, S.: Quantifying uncertainties due to chemistry modelling – evaluation of tropospheric composition simulations in the CAMS model (cycle 43R1), Geosci. Model Dev., 12, 1725–1752, https://doi.org/10.5194/gmd-12-1725-2019, 2019.
Inness, A.: Model data exp=hmib for research article “Monitoring and assimilation of S5P/TROPOMI carbon monoxide data with the global CAMS near-real time system”, ECMWF [data set], https://doi.org/10.21957/ax0c-fm72, 2022a.
Inness, A.: Model data exp=hlxm for research article “Monitoring and assimilation of S5P/TROPOMI carbon monoxide data with the global CAMS near-real time system”, ECMWF [data set], https://doi.org/10.21957/mwqe-vs95, 2022b.
Inness, A., Baier, F., Benedetti, A., Bouarar, I., Chabrillat, S., Clark, H., Clerbaux, C., Coheur, P., Engelen, R. J., Errera, Q., Flemming, J., George, M., Granier, C., Hadji-Lazaro, J., Huijnen, V., Hurtmans, D., Jones, L., Kaiser, J. W., Kapsomenakis, J., Lefever, K., Leitão, J., Razinger, M., Richter, A., Schultz, M. G., Simmons, A. J., Suttie, M., Stein, O., Thépaut, J.-N., Thouret, V., Vrekoussis, M., Zerefos, C., and the MACC team: The MACC reanalysis: an 8 yr data set of atmospheric composition, Atmos. Chem. Phys., 13, 4073–4109, https://doi.org/10.5194/acp-13-4073-2013, 2013.
Inness, A., Benedetti, A., Flemming, J., Huijnen, V., Kaiser, J. W., Parrington, M., and Remy, S.: The ENSO signal in atmospheric composition fields: emission-driven versus dynamically induced changes, Atmos. Chem. Phys., 15, 9083–9097, https://doi.org/10.5194/acp-15-9083-2015, 2015a.
Inness, A., Blechschmidt, A.-M., Bouarar, I., Chabrillat, S., Crepulja, M., Engelen, R. J., Eskes, H., Flemming, J., Gaudel, A., Hendrick, F., Huijnen, V., Jones, L., Kapsomenakis, J., Katragkou, E., Keppens, A., Langerock, B., de Mazière, M., Melas, D., Parrington, M., Peuch, V. H., Razinger, M., Richter, A., Schultz, M. G., Suttie, M., Thouret, V., Vrekoussis, M., Wagner, A., and Zerefos, C.: Data assimilation of satellite-retrieved ozone, carbon monoxide and nitrogen dioxide with ECMWF's Composition-IFS, Atmos. Chem. Phys., 15, 5275–5303, https://doi.org/10.5194/acp-15-5275-2015, 2015b.
Inness, A., Aben, I., Agusti-Panareda, A., Borsdoff, T., Flemming, J., Landgraf, J., and Ribas, R.: Monitoring and assimilation of early TROPOMI total column carbon monoxide data in the CAMS system, ECMWF Technical Memoranda No. 838, https://doi.org/10.21957/r528zfho, 2019a.
Inness, A., Ades, M., Agustí-Panareda, A., Barré, J., Benedictow, A., Blechschmidt, A.-M., Dominguez, J. J., Engelen, R., Eskes, H., Flemming, J., Huijnen, V., Jones, L., Kipling, Z., Massart, S., Parrington, M., Peuch, V.-H., Razinger, M., Remy, S., Schulz, M., and Suttie, M.: The CAMS reanalysis of atmospheric composition, Atmos. Chem. Phys., 19, 3515–3556, https://doi.org/10.5194/acp-19-3515-2019, 2019b.
Inness, A., Flemming, J., Heue, K.-P., Lerot, C., Loyola, D., Ribas, R., Valks, P., van Roozendael, M., Xu, J., and Zimmer, W.: Monitoring and assimilation tests with TROPOMI data in the CAMS system: near-real-time total column ozone, Atmos. Chem. Phys., 19, 3939–3962, https://doi.org/10.5194/acp-19-3939-2019, 2019c.
Kaiser, J. W., Heil, A., Andreae, M. O., Benedetti, A., Chubarova, N., Jones, L., Morcrette, J.-J., Razinger, M., Schultz, M. G., Suttie, M., and van der Werf, G. R.: Biomass burning emissions estimated with a global fire assimilation system based on observed fire radiative power, Biogeosciences, 9, 527–554, https://doi.org/10.5194/bg-9-527-2012, 2012.
Kanakidou, M. and Crutzen, P. J.: The Photochemical Source of Carbon Monoxide: Importance, Uncertainties and feedbacks, Chemosphere, 1, 91–109, 1999.
Krol, M., Houweling, S., Bregman, B., van den Broek, M., Segers, A., van Velthoven, P., Peters, W., Dentener, F., and Bergamaschi, P.: The two-way nested global chemistry-transport zoom model TM5: algorithm and applications, Atmos. Chem. Phys., 5, 417–432, https://doi.org/10.5194/acp-5-417-2005, 2005.
Lambert, J.-C., Keppens, A., Compernolle, S., Eichmann, K.-U., de Graaf, M., Hubert, D., Langerock, B., Ludewig, A., Sha, M. K., Verhoelst, R., Wagner, T., Ahn, C., Argyrouli, A., Balis, D., Chan, K. L., De Smedt, I., Eskes, H., Fjæraa, A. M., Garane, K., Gleason, J. F., Goutail, F., Granville, J., Hedelt, P., Heue, K.-P., Jaross, G., Kleipool, Q., Koukouli, M. L., Lorente Delgado, A., Lutz, R., Michailidis, K., Nanda, S., Niemeijer, S., Pazmiño, A., Pinardi, G., Pommereau, J.-P., Richter, A., Rozemeijer, N., Sneep, M., Stein Zweers, D., Theys, N., Tilstra, G., Torres, O., Valks, P., van Geffen, J., Vigouroux, C., Wang, P., and Weber, M.: Quarterly Validation Report of the Copernicus Sentinel-5 Precursor Operational Data Products #15: April 2018–May 2022, S5P MPC Routine Operations Consolidated Validation Report series, Issue #15, Version 15.01.00, 212 pp., 13 July 2022, https://mpc-vdaf.tropomi.eu/, last access: 24 August 2022.
Landgraf, J., aan de Brugh, J., Scheepmaker, R., Borsdorff, T., Hu, H., Houweling, S., Butz, A., Aben, I., and Hasekamp, O.: Carbon monoxide total column retrievals from TROPOMI shortwave infrared measurements, Atmos. Meas. Tech., 9, 4955–4975, https://doi.org/10.5194/amt-9-4955-2016, 2016.
Martínez-Alonso, S., Deeter, M., Worden, H., Borsdorff, T., Aben, I., Commane, R., Daube, B., Francis, G., George, M., Landgraf, J., Mao, D., McKain, K., and Wofsy, S.: 1.5 years of TROPOMI CO measurements: comparisons to MOPITT and ATom, Atmos. Meas. Tech., 13, 4841–4864, https://doi.org/10.5194/amt-13-4841-2020, 2020.
McNorton, J., Bousserez, N., Agustí-Panareda, A., Balsamo, G., Cantarello, L., Engelen, R., Huijnen, V., Inness, A., Kipling, Z., Parrington, M., and Ribas, R.: Quantification of methane emissions from hotspots and during COVID-19 using a global atmospheric inversion, Atmos. Chem. Phys., 22, 5961–5981, https://doi.org/10.5194/acp-22-5961-2022, 2022.
Miyazaki, K., Eskes, H. J., and Sudo, K.: Global NOx emission estimates derived from an assimilation of OMI tropospheric NO2 columns, Atmos. Chem. Phys., 12, 2263–2288, https://doi.org/10.5194/acp-12-2263-2012, 2012.
Nedelec, P., Blot, R., Boulanger, D., Athier, G., Cousin, J.-M. , Gautron, B., Petzold, A., Volz-Thomas, A., and Thouret, V.: Instrumentation on Commercial Aircraft for Monitoring the Atmospheric Composition on a Global Scale: The IAGOS System, Technical Overview of Ozone and Carbon Monoxide Measurements, Tellus B, 67, 27791, https://doi.org/10.3402/tellusb.v67.27791, 2015.
Parrish, D. F. and Derber, J. C.: The National Meteorological Center's spectral statistical-interpolation analysis scheme, Mon. Weather Rev., 120, 1747–1763, 1992.
Peuch, V., Engelen, R., Rixen, M., Dee, D., Flemming, J., Suttie, M., Ades, M., Agustí-Panareda, A., Ananasso, C., Andersson, E., Armstrong, D., Barré, J., Bousserez, N., Dominguez, J. J., Garrigues, S., Inness, A., Jones, L., Kipling, Z., Letertre-Danczak, J., Parrington, M., Razinger, M., Ribas, R., Vermoote, S., Yang, X., Simmons, A., de Marcilla, J. G., and Thépaut, J.: The Copernicus Atmosphere Monitoring Service: from research to operations, B. Am. Meteorol. Soc., online first, https://doi.org/10.1175/BAMS-D-21-0314.1, 2022.
Rémy, S., Kipling, Z., Flemming, J., Boucher, O., Nabat, P., Michou, M., Bozzo, A., Ades, M., Huijnen, V., Benedetti, A., Engelen, R., Peuch, V.-H., and Morcrette, J.-J.: Description and evaluation of the tropospheric aerosol scheme in the European Centre for Medium-Range Weather Forecasts (ECMWF) Integrated Forecasting System (IFS-AER, cycle 45R1), Geosci. Model Dev., 12, 4627–4659, https://doi.org/10.5194/gmd-12-4627-2019, 2019.
Seinfeld, J. H. and Pandis, S. N.: Atmospheric Chemistry and Physics: From Air Pollution to Climate Change, 2nd edn., John Wiley & Sons, New York, ISBN 13: 9780471720188, 2006.
Sha, M. K., Langerock, B., Blavier, J.-F. L., Blumenstock, T., Borsdorff, T., Buschmann, M., Dehn, A., De Mazière, M., Deutscher, N. M., Feist, D. G., García, O. E., Griffith, D. W. T., Grutter, M., Hannigan, J. W., Hase, F., Heikkinen, P., Hermans, C., Iraci, L. T., Jeseck, P., Jones, N., Kivi, R., Kumps, N., Landgraf, J., Lorente, A., Mahieu, E., Makarova, M. V., Mellqvist, J., Metzger, J.-M., Morino, I., Nagahama, T., Notholt, J., Ohyama, H., Ortega, I., Palm, M., Petri, C., Pollard, D. F., Rettinger, M., Robinson, J., Roche, S., Roehl, C. M., Röhling, A. N., Rousogenous, C., Schneider, M., Shiomi, K., Smale, D., Stremme, W., Strong, K., Sussmann, R., Té, Y., Uchino, O., Velazco, V. A., Vigouroux, C., Vrekoussis, M., Wang, P., Warneke, T., Wizenberg, T., Wunch, D., Yamanouchi, S., Yang, Y., and Zhou, M.: Validation of methane and carbon monoxide from Sentinel-5 Precursor using TCCON and NDACC-IRWG stations, Atmos. Meas. Tech., 14, 6249–6304, https://doi.org/10.5194/amt-14-6249-2021, 2021.
Stein, O., Schultz, M. G., Bouarar, I., Clark, H., Huijnen, V., Gaudel, A., George, M., and Clerbaux, C.: On the wintertime low bias of Northern Hemisphere carbon monoxide found in global model simulations, Atmos. Chem. Phys., 14, 9295–9316, https://doi.org/10.5194/acp-14-9295-2014, 2014.
Strode, S. A., Duncan, B. N., Yegorova, E. A., Kouatchou, J., Ziemke, J. R., and Douglass, A. R.: Implications of carbon monoxide bias for methane lifetime and atmospheric composition in chemistry climate models, Atmos. Chem. Phys., 15, 11789–11805, https://doi.org/10.5194/acp-15-11789-2015, 2015.
Szopa, S., Naik, V., Adhikary, B., Artaxo, P., Berntsen, T., Collins, W. D., Fuzzi, S., Gallardo, L., Kiendler-Scharr, A., Klimont, Z., Liao, H., Unger, N., and Zanis, P.: Short-Lived Climate Forcers. In Climate Change 2021: The Physical Science Basis. Contribution of Working Group I to the Sixth Assessment Report of the Intergovernmental Panel on Climate Change, edited by: Masson-Delmotte, V., Zhai, P., Pirani, A., Connors, S. L., Péan, C., Berger, S., Caud, N., Chen, Y., Goldfarb, L., Gomis, M. I., Huang, M., Leitzell, K., Lonnoy, E., Matthews, J. B. R., Maycock, T. K., Waterfield, T., Yelekçi, O., Yu, R., and Zhou, B., Cambridge University Press, Cambridge, United Kingdom and New York, NY, USA, 817–922, https://doi.org/10.1017/9781009157896.008, 2021.
Thomas, J. L., Polashenski, C. M., Soja, A. J., Marelle, L., Casey, K. A., Choi, H. D., Raut, J.-C., Wiedinmyer, C., Emmons, L. K., Fast, J. D., Pelon, J., Law, K. S., Flanner, M. G., and Dibb, J. E.: Quantifying black carbon deposition over the Greenland ice sheet from forest fires in Canada, Geophys. Res. Lett., 44, 7965–7974, https://doi.org/10.1002/2017GL073701, 2017.
Veefkind, J. P., Aben, I., McMullan, K., Förster, H., de Vries, J., Otter, G., Claas, J., Eskes, H. J., de Haan, J. F., Kleipool, Q., van Weele, M., Hasekamp, O., Hoogeveen, R., Landgraf, J., Snel, R., Tol, P., Ingmann, P., Voors, R., Kruizinga, B., Vink, R., Visser, H., and Levelt, P. F.: TROPOMI on the ESA Sentinel-5 Precursor : A GMES Mission for global observations of the atmospheric composition for climate, air quality and ozone layer applications, Remote Sens. Environ., 120, 70–83, https://doi.org/10.1016/j.rse.2011.09.027, 2012.
Vidot, J., Landgraf, J., Hasekamp, O., Butz, A., Galli, A., Tol, P., and Aben, I.: Carbon monoxide from shortwave infrared reflectance measurements: A new retrieval approach for clear sky and partially cloudy atmospheres, Remote Sens. Environ., 120, 255–266, 2012.
Wagner, A., Bennouna, Y., Blechschmidt, A.-M., Brasseur, G., Chabrillat, S., Christophe, Y., Errera, Q., Eskes, H., Flemming, J., Hansen, K. M., Inness, A., Kapsomenakis, J., Langerock, B., Richter, A., Sudarchikova, N., Thouret, V., and Zerefos, C.: Comprehensive evaluation of the Copernicus Atmosphere Monitoring Service (CAMS) reanalysis against independent observations: Reactive gases, Elementa: Science of the Anthropocene, 9, 00171, https://doi.org/10.1525/elementa.2020.00171, 2021.
Worden, H. M., Deeter, M. N., Frankenberg, C., George, M., Nichitiu, F., Worden, J., Aben, I., Bowman, K. W., Clerbaux, C., Coheur, P. F., de Laat, A. T. J., Detweiler, R., Drummond, J. R., Edwards, D. P., Gille, J. C., Hurtmans, D., Luo, M., Martínez-Alonso, S., Massie, S., Pfister, G., and Warner, J. X.: Decadal record of satellite carbon monoxide observations, Atmos. Chem. Phys., 13, 837–850, https://doi.org/10.5194/acp-13-837-2013, 2013.