the Creative Commons Attribution 4.0 License.
the Creative Commons Attribution 4.0 License.
 | 21 Sep 2022
Robust evidence for reversal of the trend in aerosol effective climate forcing
Johannes Quaas
Hailing Jia
Chris Smith
Anna Lea Albright
Wenche Aas
Nicolas Bellouin
Olivier Boucher
Marie Doutriaux-Boucher
Piers M. Forster
Daniel Grosvenor
Stuart Jenkins
Zbigniew Klimont
Norman G. Loeb
Xiaoyan Ma
Vaishali Naik
Fabien Paulot
Philip Stier
Martin Wild
Gunnar Myhre
Michael Schulz
Anthropogenic aerosols exert a cooling influence that offsets part of the greenhouse gas warming. Due to their short tropospheric lifetime of only several days, the aerosol forcing responds quickly to emissions. Here, we present and discuss the evolution of the aerosol forcing since 2000. There are multiple lines of evidence that allow us to robustly conclude that the anthropogenic aerosol effective radiative forcing (ERF) – both aerosol–radiation interactions (ERFari) and aerosol–cloud interactions (ERFaci) – has become less negative globally, i.e. the trend in aerosol effective radiative forcing changed sign from negative to positive. Bottom-up inventories show that anthropogenic primary aerosol and aerosol precursor emissions declined in most regions of the world; observations related to aerosol burden show declining trends, in particular of the fine-mode particles that make up most of the anthropogenic aerosols; satellite retrievals of cloud droplet numbers show trends in regions with aerosol declines that are consistent with these in sign, as do observations of top-of-atmosphere radiation. Climate model results, including a revised set that is constrained by observations of the ocean heat content evolution show a consistent sign and magnitude for a positive forcing relative to the year 2000 due to reduced aerosol effects. This reduction leads to an acceleration of the forcing of climate change, i.e. an increase in forcing by 0.1 to 0.3 W m−2, up to 12 % of the total climate forcing in 2019 compared to 1750 according to the Intergovernmental Panel on Climate Change (IPCC).
- Article
(4995 KB) - Full-text XML
-
Supplement
(18562 KB) - BibTeX
- EndNote


Anthropogenic pollution particles, aerosols, exert an effective radiative forcing (ERF) on climate due to aerosol–radiation interactions (ERFari, also known as “aerosol direct effect”, combined with the “semi-direct effect”) and aerosol–cloud interactions (ERFaci, “aerosol indirect effect”) (Chýlek and Coakley, 1974; Boucher et al., 2013; Forster et al., 2021; Szopa et al., 2021). The ERFari occurs through the scattering and absorption of sunlight by aerosols while for ERFaci, aerosols act as cloud condensation nuclei (Twomey, 1974). Both entail rapid adjustments that tend to enhance the radiative forcing. A recent assessment provided an estimated total ERF due to aerosols (ERFaer) in the range of −2.0 to −0.35 W m−2 (5 %–95 % confidence interval; 2005 to 2015 compared to 1850, Bellouin et al., 202b). The latest assessment report by the Intergovernmental Panel on Climate Change (IPCC) concluded that the 2019 vs. 1750 ERFaer has a best estimate of −1.1 W m−2 and 5 % to 95 % confidence interval of −1.7 to −0.4 W m−2 (Forster et al., 2021). This negative forcing offsets a sizeable fraction of the current CO2 ERF. Throughout this paper, we consider ERF with 1750 as baseline, or changes in ERF over certain periods (most often from 2000 to 2019). Forster et al. (2021) quantify a temperature increase in 2019 relative to 1750 of +1.01 ∘C due to the ERF by CO2 (+1.81 ∘C considering all anthropogenic greenhouse gases), and a temperature change by −0.50 ∘C due to aerosols in that period. This implies that without the cooling effect of aerosols, the world would already have reached the 1.5 ∘C temperature threshold of “dangerous” climate change as set out by the Paris agreement.
A fundamental difference between radiative forcing by aerosols and long-lived greenhouse gases is tied to their atmospheric lifetimes: greenhouse gases have lifetimes of decades to millennia (Solomon et al., 2009), while the lifetime of tropospheric aerosols is only up to several days. Therefore, climate responds to long-lived greenhouse gases such as CO2 largely in terms of their cumulative emissions, but to aerosols in direct link to its current rate of emissions. Shorter-lived greenhouse gases such as methane have an intermediate effect, whereby deep reductions in emissions can have substantial effects on temperature within a few decades (Shindell and Smith, 2019; Smith et al., 2021b; Allen et al., 2022). A further reduction in aerosol emissions – required due to their environmental and health impacts (Lelieveld et al., 2015; Cohen et al., 2017) – thus takes out the negative aerosol forcing and leads to a warming relative to the period prior to emission reduction (Brasseur and Roeckner, 2005; Dufresne et al., 2005); this effect is also known as climate penalty of air quality improvements (Ekman et al., 2020; Hong et al., 2020). Additionally, the importance of the aerosol forcing relative to the CO2 forcing was largest during the early industrial period (Stevens, 2015). It will continue to decrease, since anthropogenic aerosol emissions will likely decrease at the global level (Myhre et al., 2015; Szopa et al., 2021).
At what point did the aerosol forcing became substantially less negative at a scale relevant for global forcing? There are suggestions that the decrease started in the last decades in different regions, and for several regions, this trend reversal has been documented (e.g. Cermak et al., 2010). The decrease stems particularly from reductions of SO2 emissions from coal use in the residential sector, power plants, and industry. For other regions, evidence is lacking or more anecdotal. However, to understand global climate change, it is relevant to ask to which extent the aerosol climate forcing has become less negative at the global scale. Here, we propose that aerosol trends and their effects can be best investigated in the satellite era since the turn of the century. We analyse multiple observational and model datasets to demonstrate that both ERFari and ERFaci show reduced trends since 2000 in regions which demonstrate a robust and substantial aerosol ERF trend in models.
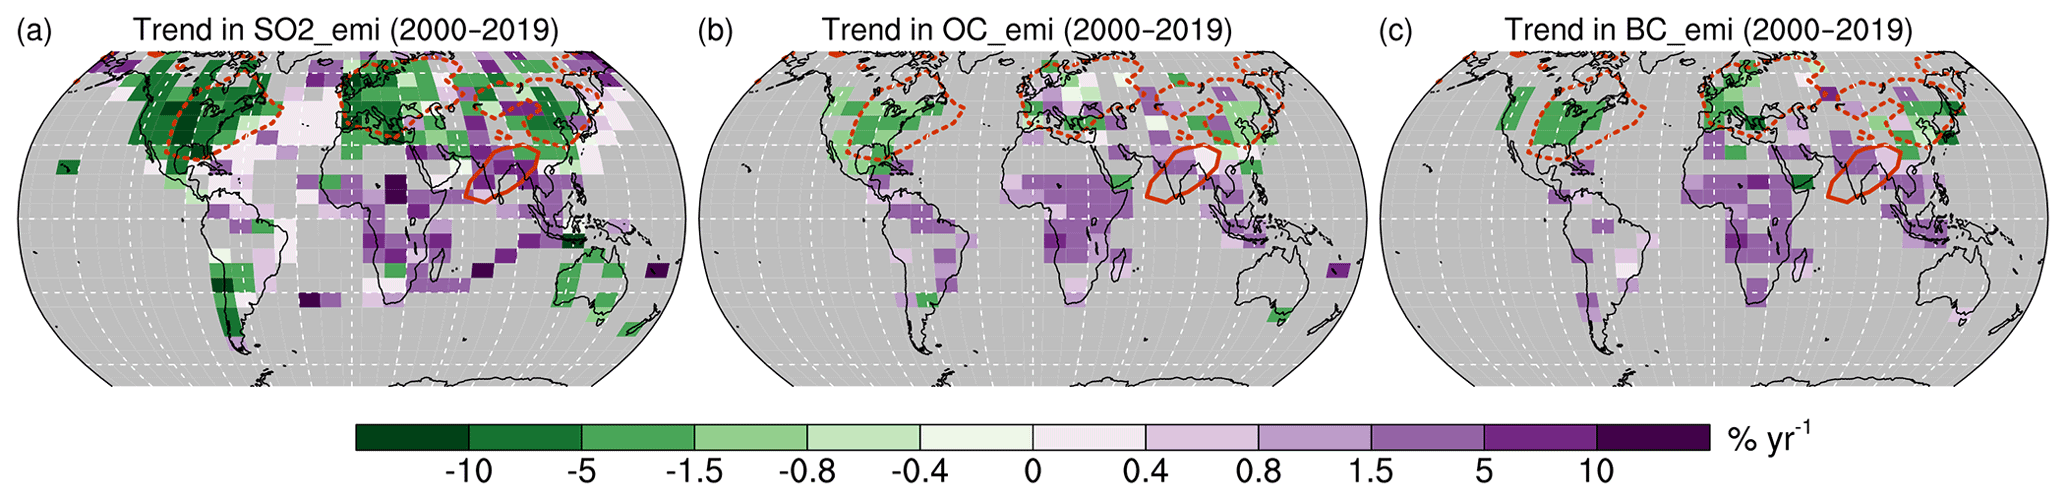
Figure 1Linear trends (2000 to 2019) of (a) anthropogenic emissions in sulfur dioxide (SO2) from the Community Emissions Data System (CEDS v_2021_04_21; Hoesly et al., 2018). Panels (b) and (c) are the same as (a), but for anthropogenic emissions in organic carbon (OC) and black carbon (BC), respectively. Regions with small absolute trends (less than 7 µg m−2 d−1 yr−1) are masked by grey shading. Isolines enclose regions with trends in clear-sky solar ERF (see later, Fig. 4) larger than 0.05 W m−2 yr−1 in absolute terms. The average values in these regions are shown in Fig. 6, listed in Table 1, and discussed in Section 7. A figure that combines the panels of Figs. 1 to 4 is provided as Supplement. A figure that shows the trends in absolute units is also provided as Supplement.
Despite substantial differences in their absolute magnitude, especially at the regional level (Elguindi et al., 2020), the different emission inventories generally agree on the sign of the historical trends at regional and global levels (Granier et al., 2011; Klimont et al., 2017; Hoesly et al., 2018; Aas et al., 2019; Elguindi et al., 2020), especially over Europe and North America (Elguindi et al., 2020). A number of clear conclusions have thus been drawn in the literature for aerosol emissions in specific regions. Aerosol emissions have seen a steep increase since the beginning of the industrial period (e.g. Szopa et al., 2021). In several regions, declines after a peak are documented. An example is Europe, where since the 1980s, aerosol emissions declined strongly following air quality policies (Krüger and Graßl, 2002; Vestreng et al., 2007; Tørseth et al., 2012; Cherian et al., 2014; Crippa et al., 2016; Costa-Surós et al., 2020). A similar behaviour is documented for North America (e.g. Streets et al., 2009; Aas et al., 2019; Elguindi et al., 2020). Sulfur and nitrogen deposition over the USA, reflecting anthropogenic emissions, have been declining by between 1 % yr−1 and 3 % yr−1 during the period 1989–2010 (Sickles II and Shadwick, 2015). In contrast, anthropogenic aerosol emissions over China have been increasing until around 2010, and decreasing thereafter (Klimont et al., 2017; Zheng et al., 2018; Aas et al., 2019; Wang et al., 2021). The exact temporal evolution of aerosol emissions over the past 20 years, especially over China, was erroneously represented (a too weak decline since 2010) in some emission datasets, leading to some incompatibility of aerosols in the sixth Coupled Model Intercomparison Project (CMIP6; Eyring et al., 2016; Hoesly et al., 2018; Elguindi et al., 2020) in comparison to observations (Paulot et al., 2018; Wang et al., 2021). Aerosol emissions over India continued to rise throughout the period 2000–2019 (Klimont et al., 2013; Wang et al., 2021). Over remote oceanic regions, ship emissions played a substantial, increasing role during the first part of the time period of interest (Smith et al., 2011). Since 2010, they have declined first in emission-control areas (IMO, 2008) and since 2020, over much of the global oceans (IMO, 2019). This declining signal is also visible in cloud properties (Gryspeerdt et al., 2019).
Here, we consider more specifically emissions from the newest version of the Community Emissions Data System (CEDS; O'Rourke et al., 2021). The trends are shown in Fig. 1. A previous version of this dataset was used in CMIP6 and described by Hoesly et al. (2018). Sulfur emissions were mostly declining since 2000, there were substantial declines over North America and Europe in particular, continuing decreasing trends that started in the last decades of the 20th century. Furthermore, over East Asia, due to reductions after 2010, the overall trend is negative, despite the fact that emissions still increased during the first decade of the 21st century. Over Southeast Asia, including India, and also over parts of Africa, sulfate precursor emissions showed increasing trends. Some shipping routes over ocean show increasing trends in this period. Organic carbon (OC) and black carbon (BC) emissions broadly show the same, but with more widespread increases, especially over more regions in East Asia, Africa, and also South America. All considered, aerosol species show increasing trends in emissions for high latitudes of both hemispheres. The updates of CEDS emissions (Elguindi et al., 2020) show that more recent evidence points to an even stronger decline in SO2 emissions during the second part of the last decade, and the BC and OC trends are showing a decline rather than increase, especially in China (see also Kanaya et al., 2020). These are further discussed in Elguindi et al. (2020).
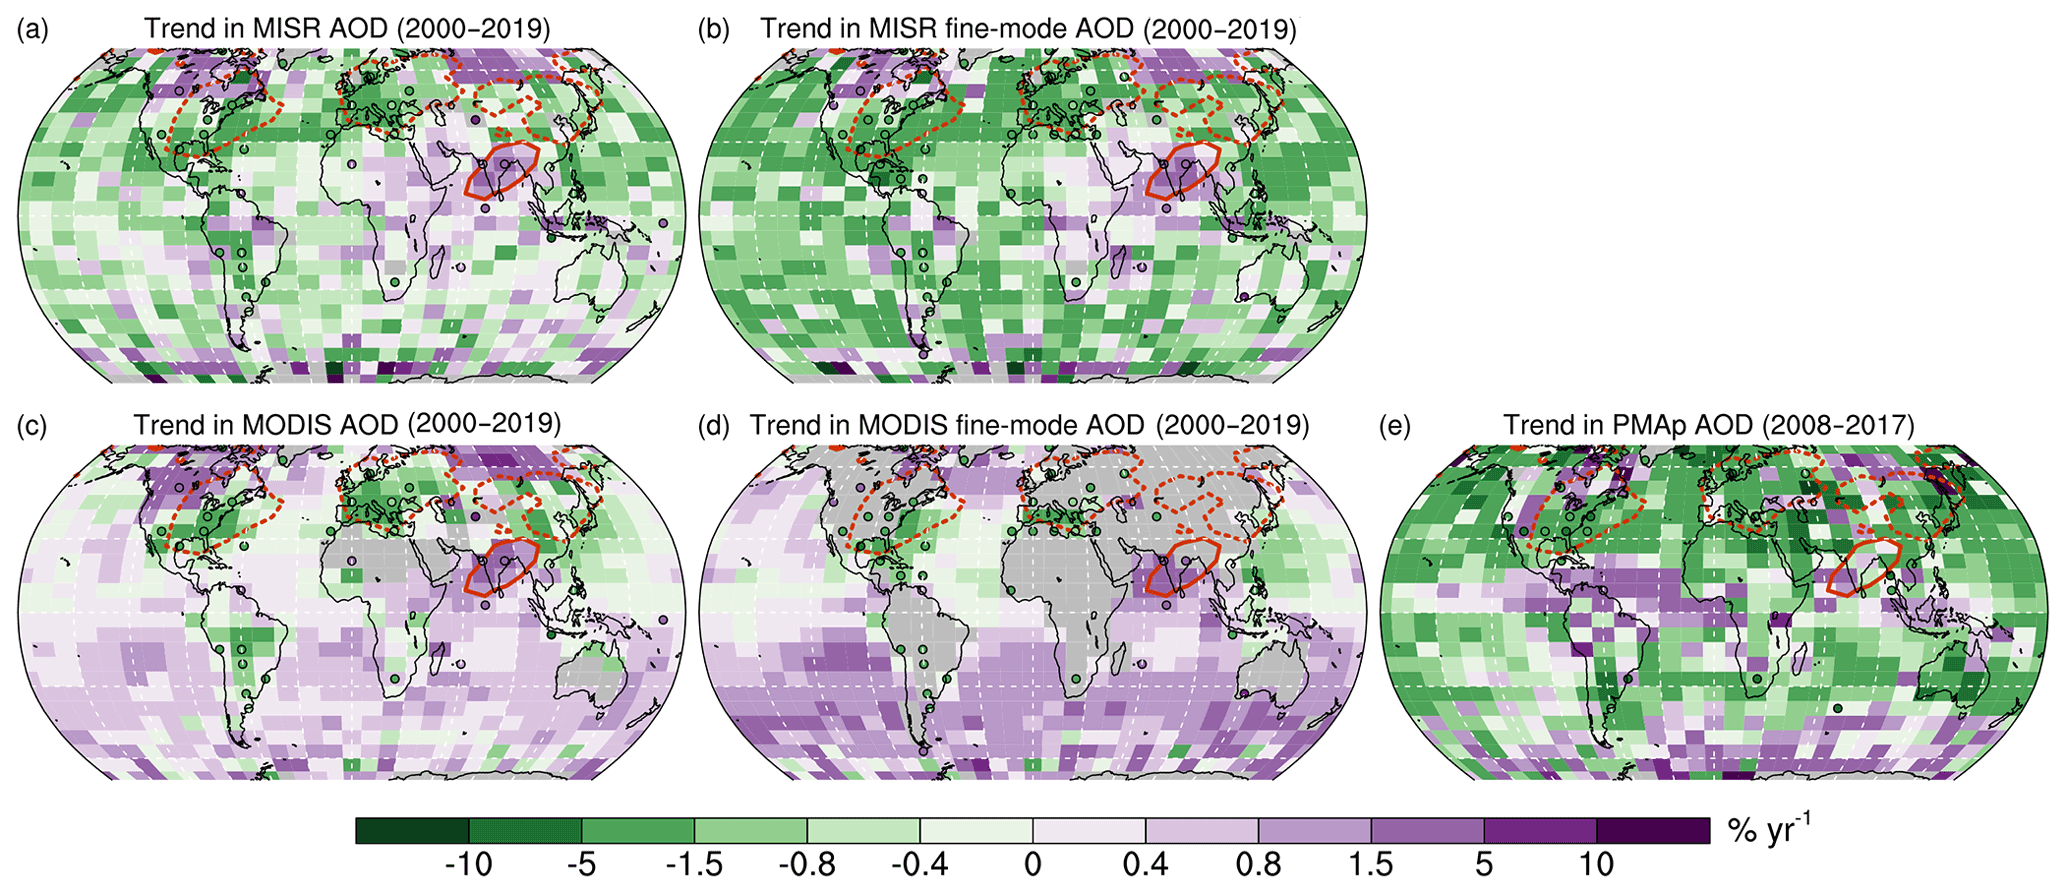
Figure 2Linear trends (2000–2019) of (a) aerosol optical depth (AOD) as retrieved from the Multi-angle Imaging Spectroradiometer (MISR; Garay et al., 2017) on board the Terra satellite, where the coloured circles show the AOD trends from the AERONET ground-based sun-photometer network (Holben et al., 1998; Giles et al., 2019) where data since 2000 are available. Panel (b) is the same as (a), but for the fine-mode AOD, i.e. the AOD due to aerosols with radii smaller than 1 µm. Panels (c) and (d) are the same as for (a) and (b), but with retrievals from the MODerate Resolution Imaging Spectroradiometer (MODIS; Levy et al., 2013) (fine-mode AOD unavailable over land) from the Terra satellite, averaged (starting in 2002) with MODIS retrievals from the Aqua satellite; (e) Polar multi-sensor aerosol product (PMAp) AOD as retrieved from the Global Ozone Monitoring Experiment-2 (GOME-2) instrument on board EUMETSAT's Metop-A satellite that is available only for 2008 to 2017. Isolines as in Fig. 1. A figure that shows the trends in absolute units is provided as Supplement.
The emission trends are reflected in observations of aerosol abundance. Due to their short lifetime, it is expected that regional trends in emissions are also reflected by regional trends in concentrations that are somewhat smoothed out spatially, in case of typically prevailing wind directions that are mostly leeward. Trends in surface concentrations from in situ observations were found to show the expected trends in a global compilation (Collaud Coen et al., 2020) for sulfate and PM2.5, and specifically so for the declining trends over Europe (Stjern et al., 2011; Aas et al., 2019) and North America (Jongeward et al., 2016; Aas et al., 2019), and the first increasing, then decreasing behaviour over China (Zheng et al., 2018; Aas et al., 2019).
The analysis of trends from remote sensing, especially from satellite remote sensing, is challenging, because datasets may not be homogeneous over the lifetime of a satellite instrument, due to changing instrument response and satellite orbit. However, for NASA's Earth observation satellites (EOS), Terra and Aqua, care has been taken to avoid many of the issues that hamper satellite trend analysis such as orbital drift (Levy et al., 2013). Studies show that trends from various satellites are, at least qualitatively, consistent (Wei et al., 2019). Declining trends in aerosols in certain regions, such as over Europe (Stjern et al., 2011; Cherian et al., 2014; Li et al., 2014; Georgoulias et al., 2016; Cherian and Quaas, 2020) and over the USA (Li et al., 2014; Jongeward et al., 2016; Cherian and Quaas, 2020), as seen from satellite analysis, have been documented earlier. The changes in aerosols over East Asia, especially China, are not monotonic over the period of interest. Rather, the trends are reversed from positive (2000–2010) to negative (since 2010), and this is seen in satellite observations of aerosols (Paulot et al., 2018; Sogacheva et al., 2018; Filonchyk et al., 2019; Ma et al., 2019; Samset et al., 2019). In contrast, over Southeast Asia, especially India, aerosol retrievals from satellites show continuing increases throughout the period (Li et al., 2014; Zhao et al., 2017; Dahutia et al., 2018; Hammer et al., 2018; Cherian and Quaas, 2020). Model–data synergy allowed us to attribute these satellite-derived trends to the specific emission changes (Bauer et al., 2020; Yu et al., 2020), and to quantify the changes between −3.1 % yr−1 and −1.2 % yr−1 for the different regions affected by the declines in anthropogenic aerosol emissions from 2000 to 2014 (Mortier et al., 2020). Mortier et al. (2020) further documented that climate models were able to reproduce these trends quantitatively.
We report aerosol optical depth (AOD) trends from various satellite datasets on a common scale in Fig. 2. It specifically shows AOD and fine-mode AOD (AODFM) from the MODerate Resolution Imaging Spectroradiometer (MODIS; Levy et al., 2013) instrument on board the EOS, Terra and Aqua, and the Multi-Angle Imaging Spectro-Radiometer (MISR; Garay et al., 2017) instrument on board the Terra EOS. Also the – presumably more stable – ground-based retrievals from the AERONET network (Holben et al., 1998, 2001; Giles et al., 2019) are analysed for the stations for which the time series since 2000 are available. The regression coefficients are reported, and it should be noted that none of the quantities really follows a straight line. Rather, reference is made to the overall tendency of the noisy time change. The trends in both AOD and AODFM from the different satellite instruments in the Southern Hemisphere oceanic, and also in the Northern Hemisphere high-latitude oceanic regions differ – MODIS shows increases while MISR shows decreases or scattered results in both quantities. As a third estimate, the EUMETSAT Polar Multi-sensor aerosol optical properties product (PMAp; Grzegorski et al., 2021) climate data record (CDR), derived using the Global Ozone Monitoring Experiment-2 (GOME-2) instrument on board EUMETSAT's Metop-A satellite are used. These are available for a shorter, 10-year period, for 2008 to 2017. In the Southern Hemisphere oceanic regions, Metop-A shows very small trends for this shorter period; in the Northern Hemisphere high-latitude oceanic regions, it tends to confirm the decreases shown by MISR. The increase in AOD retrieved by MODIS has been reported in previous studies. Bai et al. (2020) report an increasing trend over the 2003–2017 period; they propose that there might have been an increase in sea salt consistent with increasing wind speed in reanalysis. In a different conclusion, Fan et al. (2018) demonstrate that while trends in AOD from MODIS are consistent with those derived from Aeronet over land in the Northern Hemisphere, the trends over Australia and South America are inconsistent. Also in the study by Wei et al. (2019), the MODIS trends in the Southern Hemisphere were reported to show stronger positive trends than the six other satellite products they examined for the 2003–2010 period in the oceanic regions of the Southern Hemisphere that they investigated (South Atlantic and Indian oceans).
However, in the regions discussed above with pronounced trends in anthropogenic aerosol (precursor) emissions, the satellite trends show the same behaviour qualitatively in all three datasets. These trends are largely consistent with those from AERONET data (circles in Fig. 2). The decreasing trends over North America, Europe, and East Asia are clearly seen and statistically significant at many grid points (at 5 % significance level according to a t test with correction as in Santer et al., 2008), as are the increasing trends over India. It is particularly interesting to note that the trends in AODFM are still more consistent in spatial extent to the changes in sulfate (precursor) emissions. These smaller particles, with radii <1 µm, contain the bulk of the anthropogenic contribution to the aerosol (Bellouin et al., 2005; Kaufman et al., 2005; Kinne, 2019).
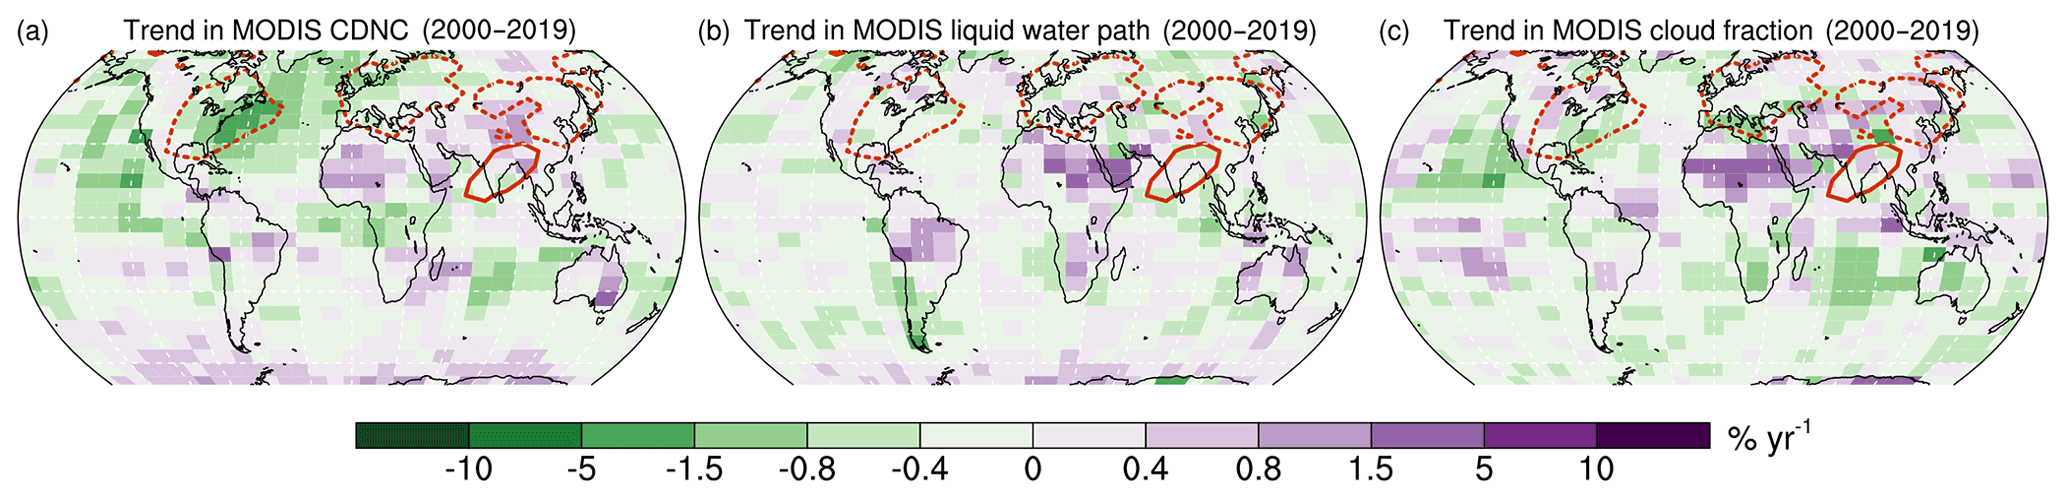
Figure 3Linear trends (2000–2019) in cloud properties retrieved for liquid-water clouds from MODIS (Platnick et al., 2017) where cloud droplet number concentration (CDNC, a) and cloud liquid water path (LWP, b) are computed assuming adiabatic clouds (Quaas et al., 2006; Grosvenor et al., 2018); (c) liquid cloud fraction. Isolines as in Fig. 1. A figure that shows the trends in absolute units is provided as Supplement.
Clouds are a key determinant for variability and trends of the Earth's energy budget. Due to their large spatio-temporal variability, it is not easy to distinguish long-term signals from weather noise. Clouds respond not only to aerosols, but also to global warming and interannual as well as decadal internal climate variability (Forster et al., 2021). Overall, satellite analysis documented changes in clouds that are consistent with several hypotheses relevant for cloud–climate feedbacks (Norris et al., 2016), but little evidence for patterns of cloud cover or cloud-top altitude trends that would be expected due to aerosol–cloud interactions (Norris et al., 2016). The most immediate impact of aerosols is on cloud droplet number concentration (Bellouin et al., 202b; Quaas et al., 2020). For this microphysical quantity, some clear and significant trends were identified in satellite observations for the outflow region east of East Asia (Bennartz et al., 2011), albeit the declining trends in cloud water path and cover are not necessarily what is expected in relation to aerosol–cloud interactions (Benas et al., 2020).
The trends in satellite-derived cloud droplet number concentrations were previously reported to be consistent with the aerosol trends in several regions (McCoy et al., 2018; Cherian and Quaas, 2020). Trends in cloudiness and cloud radiative properties are, however, less conclusive, possibly due to their large variability beyond the variability driven by aerosols (Norris et al., 2016; Cherian and Quaas, 2020), and also since their response to aerosols depends on cloud regime (Mülmenstädt and Feingold, 2018; Zhang et al., 2022).The trends in MODIS retrievals of cloud properties (Platnick et al., 2017) are shown in Fig. 3. MODIS Terra (10.30 h overpass time) is combined with MODIS Aqua (13.30 h overpass time) from 2002 onwards. Cloud droplet number concentration is derived from the MODIS retrievals as discussed in Grosvenor et al. (2018). For all three cloud quantities presented, only liquid-water clouds, as determined by the retrieval algorithm, are selected. The results confirm the qualitative consistency between droplet number and aerosol trends. This consistency is inferred from the similarity in sign across the regions in which aerosols show spatially contingent trends attributable to the anthropogenic aerosol emissions as evident from Fig. 1 in comparison to Fig. 2, and in particular, as summarised later in Table 1. Cloud droplet concentrations show declines, especially over the oceans of the Northern Hemisphere mid-latitudes, particularly downwind of the regions where aerosol emissions declined. The signal is much weaker over the continents though (as also discussed by Ma et al., 2018). Cloud liquid water path (LWP, related to cloud thickness; defined in the satellite retrievals as cloudy sky rather than all sky) does not show trend patterns that would be strongly related to the pattern of trends in droplet concentration. It was documented earlier that the adjustment of LWP to cloud droplet concentration perturbation appears to be weak in comparison to natural variability (Malavelle et al., 2017; Toll et al., 2019; Haghighatnasab et al., 2022; Chen et al., 2022). In contrast, the change in cloud fraction is broadly consistent in pattern and sign with the trends in droplet concentration. This was also suggested by satellite correlation studies (Gryspeerdt et al., 2016; Rosenfeld et al., 2019; Christensen et al., 2020) and analysis of the response of clouds to volcanic eruptions (Chen et al., 2022). It is to be noted that cloud properties, especially outside the regions with strong aerosol changes, also respond to global warming (in particular, sea surface temperature (SST) trends under stratocumulus regions such as the Eastern Pacific) and natural variability. Thus, only the averaging over the larger contingent regions with consistent aerosol changes may allow us to reduce this “noise” to infer a possible signal.
Nevertheless, the conclusion of this review of trends in cloud quantities is that cloud droplet concentrations show trends that are spatially consistent with the expectation of declining anthropogenic aerosol emissions, and that liquid-cloud fraction trends apparently also show patterns consistent with the aerosol declines. Since these retrievals are independent of the aerosol retrievals discussed earlier, this is a strong corroboration of the earlier conclusion that satellites show a declining trend in aerosols in regions of anthropogenic emissions.
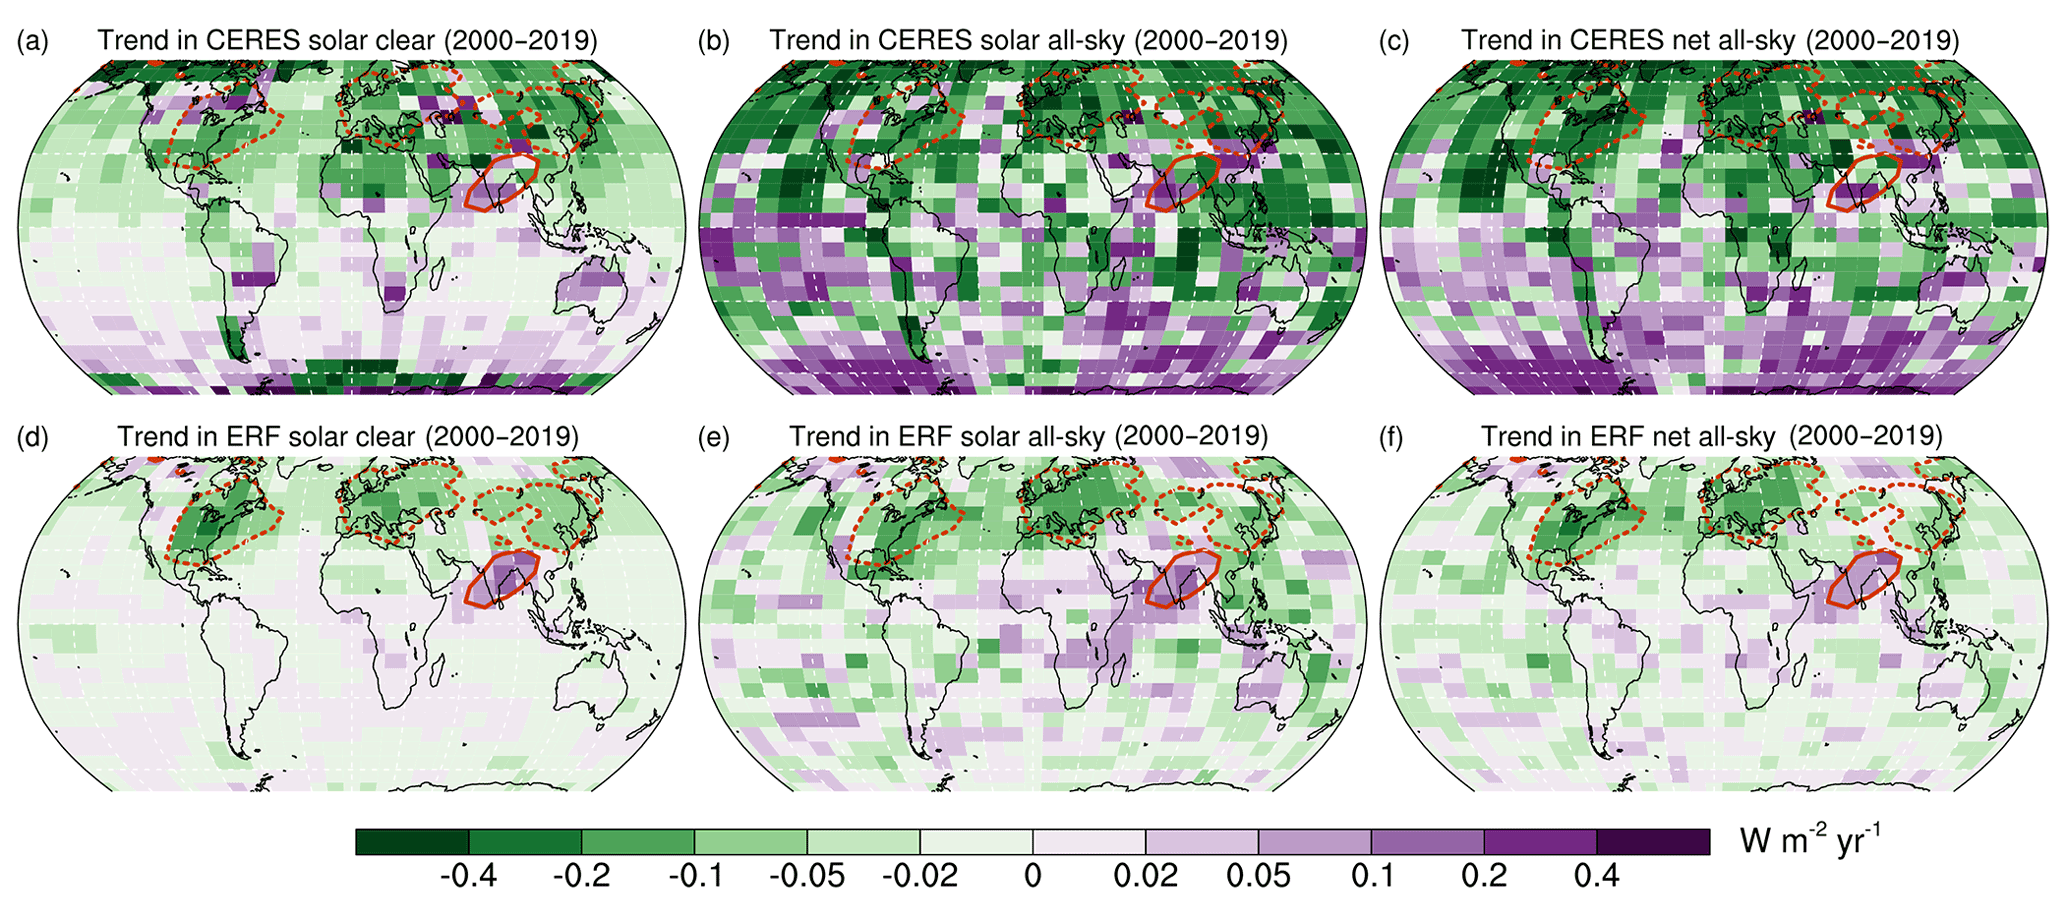
Figure 4Linear trends (2000–2019) in (a) net broadband solar flux for clear-sky situations as retrieved from the Clouds and the Earth's Radiant Energy System (CERES) Energy Balanced and Filled (EBAF) product (Loeb et al., 2018a) from Terra, averaged for years after 2002 with retrievals from Aqua as well. Panels (b) and (c) are the same as (a), but for all-sky solar radiation fluxes and all-sky solar plus terrestrial net fluxes, respectively; (d–f) trends in effective radiative forcings (ERFs) due to aerosols as computed from the dedicated RFMIP (Pincus et al., 2016)/AerChemMIP (Collins et al., 2017), for which output was available from the CanESM5 (Swart et al., 2019), GISS-E2-1-G (Kelley et al., 2020), HadGEM3-GC31-LL (Andrews et al., 2019), IPSL-CM6A-LR (Boucher et al., 2020), MIROC6 (Hajima et al., 2020), NOAA-GFDL (Held et al., 2019), and NorESM2-LM (Seland et al., 2020); the ensemble average is shown for (d) clear-sky solar, (e) all-sky solar, and (f) all-sky net (solar plus terrestrial) spectra. Signs are inverted for consistency with the CERES results (negative trends in ERFaer mean decreases in absolute magnitude). Isolines enclose regions with trends in clear-sky solar ERF (d) larger than 0.05 W m−2 yr−1 in absolute terms. The average values in these regions are listed in Table 1 and discussed in Sect. 7. Net fluxes, defined as positive if downward, are plotted, consistently in the simulations and the satellite retrievals.
Changes in net top-of-atmosphere radiation fluxes in a period correspond to the changes in ERF in that period, but also include the signal of natural variability and feedbacks to changing climate. Previous analysis of model simulations suggested that between 2000 and 2015, ERFaer was reduced in absolute magnitude, i.e. increased (became less negative) by about 0.003 W m−2 yr−1 at a global scale (Myhre et al., 2017), mainly over the Northern Hemisphere mid-latitudes, especially over North America, the North Atlantic Ocean, Europe, and adjacent Asia. In Fig. 4, the trends in ERFaer as simulated by models contributing to CMIP6 are analysed. This makes use of the dedicated simulations of the Radiative Forcing Model Intercomparison Project (RFMIP, Pincus et al., 2016) that trace the ERFaer over time (the piClim-histaer simulations). For seven Earth system models (ESMs), the relevant diagnostics for these simulations were submitted, namely for the Canadian Centre for Climate Modelling and Analysis (CCMA; Swart et al., 2019), the US National Aeronautics and Space Administration Goddard Institute for Space Studies Earth system model (GISS-E2-1-G; Kelley et al., 2020), the UK Hadley Centre Global Environment Model (HadGEM3-GC31-LL; Andrews et al., 2019), the Institut Pierre Simon Laplace Climate Model (IPSL-CM6A-LR; Boucher et al., 2020), the Model for Interdisciplinary Research on Climate (MIROC6; Hajima et al., 2020), the National Oceanic and Atmospheric Administration/Geophysical Fluid Dynamics Laboratory Climate Model (CM4; Held et al., 2019), and the Norwegian Earth System Model (NorESM2-LM; Seland et al., 2020). The ensemble average of these models is considered. The results show that the pattern in the clear-sky solar ERFaer trends is closely related to the pattern in the trends in sulfate precursors. It reflects the strong declines in the main source areas over North America, Europe, and East Asia, along with the increases over India and surrounding areas. The patterns in all-sky ERFaer, i.e. including the cloud effects, both in solar and terrestrial spectra, are noisier but also show trends that are consistent with the pattern seen for the clear-sky, solar ERFaer and in aerosols and droplet concentrations also in the observations. It is interesting to assess the relative importance of aerosols to other agents that are examined in the RFMIP piClim-histall simulations (Supplement Fig. S5). In the solar spectrum, as expected, the aerosol signal clearly dominates, whereas in the terrestrial spectrum, the additional signal by the increase in greenhouse gases is seen. Figures S6 to S8 examine the differences across models in the simulated ERFaer trends. Despite differences, particularly in the absolute magnitude, the pattern identified in the multi-model mean is qualitatively similar in all seven individual models. Similarly, for individual ensemble members of a selected ESM (Figs. S9 to S11), the pattern is robustly simulated.
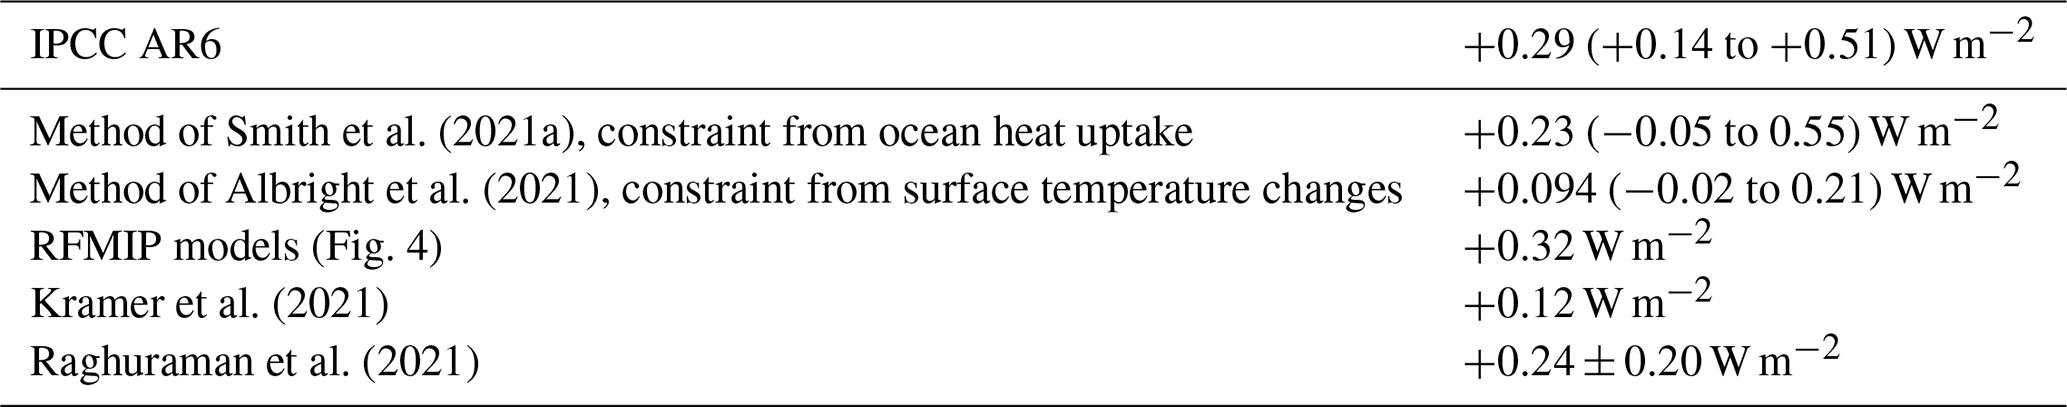
In the multi-model mean, global mean changes show a decline of the clear-sky, solar ERFaer by 0.0117 W m−2 yr−1, of the all-sky solar ERFaer, a decline by 0.0172 W m−2 yr−1, and of the all-sky terrestrial ERFaer, an (compensating) increase by 0.0013 W m−2 yr−1. The integral, net decline over the 20-year period according to these models was thus 0.32 W m−2.
This result can be compared to the assessment by IPCC AR6 (Forster et al., 2021). Their assessment is based on multiple lines of evidence that are incorporated in an emulator ensemble simulation. The time series of the diagnosed ERFaer is available via the IPCC website and at https://doi.org/10.5281/zenodo.5705391 (Smith et al., 2021). Computing the linear trend between 2000 and 2019 on the basis of the emulator ensemble yields an increase by +0.0145 W m−2 yr−1 between 2000 and 2019 (5 %–95 % confidence interval of +0.0068 to +0.0253), i.e. by +0.29 (+0.14 to +0.51) W m−2 over the full period (Gulev et al., 2021; Forster et al., 2021).
The ERFaer may be inferred from the Earth radiation budget which is measurable at the top of the atmosphere. Several studies have investigated the retrievals of this quantity from the Clouds and the Earth's Radiant Energy System (CERES) energy instrument that is also on the EOS Terra and Aqua satellites. CERES shows patterns for clear-sky broadband radiation that are consistent with the aerosol spatio-temporal changes (Loeb et al., 2018b, 2021b; Paulot et al., 2018). Furthermore, Loeb et al. (2021a) document an increase in the Earth's energy imbalance, seen in both Earth radiation budget satellite observations and ocean heat content. They find this to be due to a strong decreasing trend in reflected solar radiation, which they attribute to decreased reflection by clouds and sea ice, and a declining trend in emitted terrestrial radiation due to increases in greenhouse gases and water vapour. Using partial radiative perturbation analysis, Loeb et al. (2021a) attribute the trend in solar radiation mostly to changes in clouds, with a very small contribution only due to the effect by aerosol–radiation interactions. This is also a result of a new study by Jenkins et al. (2022). CERES observations were analysed by Raghuraman et al. (2021) as well. They find that for the period 2001 to 2020, an increasing trend by 0.038±0.024 W m−2 yr−1. They attribute about one third of this trend to the reduction in ERFaer.
Kramer et al. (2021) disentangle the trends in satellite-retrieved radiation fluxes using radiative kernels, notably isolating the impact of radiative forcings. They quantify the change in absorbed solar radiation over the 2003 to 2018 period at 0.044±0.02 W m−2 yr−1. Singling out the instantaneous radiative forcing in the solar spectrum, they obtain a change of 0.006±0.003 W m−2 yr−1 which they largely attribute to aerosol changes. Paulot et al. (2018) constrained the radiative forcing due to aerosol–radiation interactions (aerosol direct effect) in their climate model and obtained an almost negligible trend in ERFaer of 0.0002 W m−2 yr−1. Their study, however, considered the period from 2001 to 2015 only, and thus a time when then increasing emissions over China were much more relevant.
Bellouin et al. (2020a) used the Copernicus reanalysis of atmospheric composition, which assimilates MODIS AODs, to estimate the radiative forcing due to aerosols (RFaer) and found statistically significant decreasing (less negative) trends over North and South America, Europe, and China, and an increasing (more negative) trend over India for the period 2003–2017. Their globally averaged trend in RFaer is 0.00 W m−2 yr−1, but limitations in their estimate may imply that the real trend is positive.
Surface measurements of radiation also show increasing trends over large regions (Wild, 2009, 2012; Cherian et al., 2014; Hatzianastassiou et al., 2020). Trends in aerosol effects become particularly apparent in surface radiation records under cloud-free conditions. Such records indicate increasing clear-sky surface solar radiation in Europe, and thus decreasing aerosol effects throughout the 2000s with some tendency for saturation (levelling off) after 2010 (Manara et al., 2016; Wild et al., 2021). Surface radiation records in China suggest a trend reversal in clear-sky surface solar radiation from decrease to increase in the late 2000s (Yang et al., 2019), in line with anthropogenic aerosol emission trends (Section 2). For Europe (Pfeifroth et al., 2018) and China (Wang et al., 2019), it has been shown that solar radiation consistently increases in both surface and satellite observations.
The CERES data are also shown in Fig. 4. The clear-sky solar radiation changes in the areas where the models show decreases in the clear-sky solar ERFaer, with a pattern consistent in sign and magnitude with the model results. For all-sky radiation, the data show larger trends and also much more noise in the patterns. However, the sign of the changes in the regions where an aerosol signal is expected is consistent between the models and the data. These results are consistent with what was documented in the literature before (see above). A quantitative comparison is provided later in Sect. 7.
The temporal evolution of observed climate change – specifically surface temperature changes and their pattern – has been proposed as a constraint on the magnitude of the ERFaer (Ekman, 2014; Rotstayn et al., 2015; Stevens, 2015; Kretzschmar et al., 2017; Aas et al., 2019; Albright et al., 2021; Smith and Forster, 2021). It is now increasingly recognised that the ocean heat uptake is of overwhelming interest for monitoring the Earth energy imbalance (von Schuckmann et al., 2016; Palmer, 2017; Allison et al., 2020; Forster et al., 2021), since it is a non-volatile indicator of climate change.
Based on this, Smith et al. (2021a) constrained the aerosol ERF from the CMIP6 models by considering the ocean heat uptake from observations between 1971 and 2018, in addition to observations of surface temperature. In Smith et al. (2021a), a 100 000 member ensemble of time series of historical aerosol forcing was generated from emissions of BC, OC, and SO2 using simple formulas calibrated to CMIP6 models, considering ERFari and ERFaci separately, with 1850–2010 ERFari and ERFaci constrained to the distribution of Bellouin et al. (202b) in the prior. Weights were assigned to each ensemble member based on how closely historical surface temperature and ocean heat content change were simulated compared to observations when the aerosol forcing was combined with other historical forcings in a two-layer energy balance model (Geoffroy et al., 2013) to generate a posterior distribution of historical aerosol forcing. This study assessed the ERFaer between 1750 and 2019 at −0.9 W m−2 and suggested a slightly positive trend of 0.0025 W m−2 yr−1 between 1980 and 2014. The method of Smith et al. (2021a) is applied to assess the trend in aerosol ERF between 2000 and 2019 (Fig. 5), focusing on the emission trends during this period. This yields a constrained trend of 0.0114 (−0.003 to 0.0274) W m −1 yr−1, much stronger than the one considering the longer period (5 % to 95 % confidence interval in brackets). The integral change in the ERFaer 2000–2019 period is thus 0.23 W m−2 in the best estimate, very close to the suggestion by the analysed models.
Albright et al. (2021) explore bounds on ERFaer using a Bayesian model of aerosol forcing and Earth’s multi-timescale temperature response to radiative forcing, finding a best-estimate present-day lower bound of −1.3 W m−2. In Fig. 5, their method is applied to the period investigated here, from 2000 to 2019. Their baseline estimate yields a mean trend of 0.0047 W m−2 yr−1 (5 %–95 % confidence interval of −0.000912 to 0.0106 W m−2 yr−1). The best estimate of the change in ERFaer for the 20-year period is thus 0.094 W m−2 (5 %–95 % confidence interval of −0.018 to 0.21 W m−2). Prescribing internal climate variability that is a factor of 5 larger than the CMIP6 mean and assuming large, correlated errors in global temperature observations, yields a fifth-percentile ERFaer lower bound of −1.8 Wm−2 and a mean estimate of the change in ERFaer for the 20-year period of 0.16 W m−2 (5 %–95 % confidence interval of 0.04 to 0.32 W m−2, see “increased variance” in Fig. 5b).
Albright et al. (2021) caution that ocean heat content data do not, at present, offer robust additional constraints on ERFaer. Biases in coupled climate models towards radiative feedbacks that are too positive since about 1980, compared to radiative feedbacks in models forced by historical surface temperatures (e.g. Zhou et al., 2016), suggest that emulators trained on coupled models yield inferences of ERFaer that are biased low when attempting to fit to recent planetary heat uptake (see Sec. 4d in Albright et al., 2021). That is, the discrepancy between the observed planetary heat uptake and net top-of-atmosphere radiative imbalance in coupled models can be thought of as a “ghost forcing” that can either be attributed to more negative radiative feedbacks or more negative radiative forcing (e.g. more negative ERFaer). They conclude that constraining ERFaer with ocean heat content data requires independent observational constraints on the true radiative damping and a better understanding of whether recent SST patterns that cause more negative feedbacks are forced or unforced (Andrews et al., 2018; Sherwood et al., 2020).
Jenkins et al. (2022) also suggest that 0.2 W m−2 is a plausible best-estimate ERF change for the considered period, based on analysis of satellite observations and energy balance of global temperatures. However, they also conclude that large variability signals imply that a very weak trend change cannot be ruled out either.
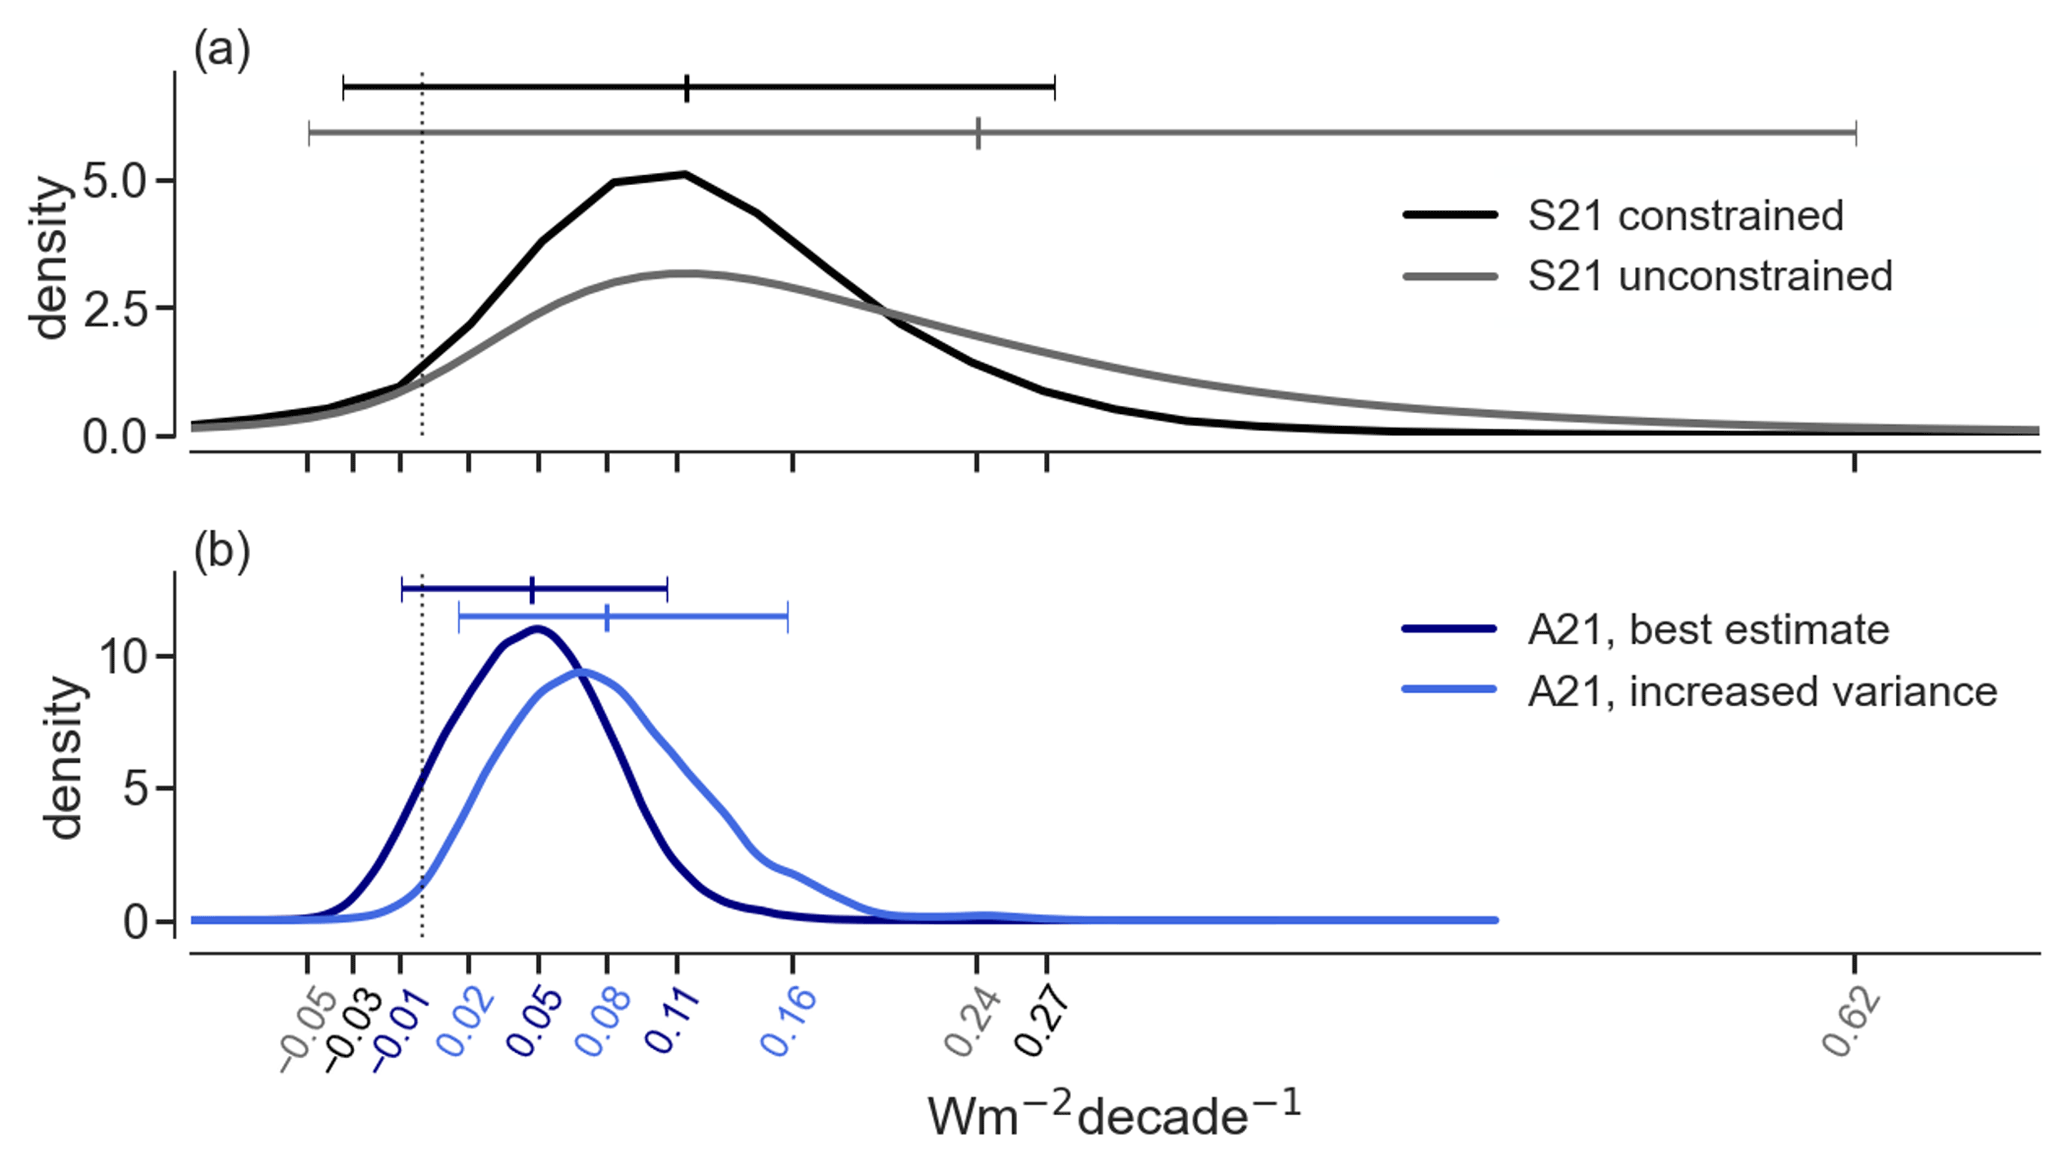
Figure 5Assessment of the linear trend in ERFaer between 2000 and 2019. Panel (a) as in Smith et al. (2021a, their Fig. 7; abbreviated as S21 in the labels), and panel (b) as in Albright et al. (2021, labelled A21). The constraint is as in the cited studies, but applied to the period 2000–2019. Increased variance in Albright et al. (2021) corresponds to a scenario prescribing internal climate variability that is a factor of 5 larger than the CMIP6 mean and assuming large, correlated errors in global temperature observations, yielding a fifth-percentile ERFaer lower bound of −1.8 W m−2. The labels along the x axis correspond to 5 % and 95 % percentiles, as well as mean, of the distribution of the curves in the corresponding colour.
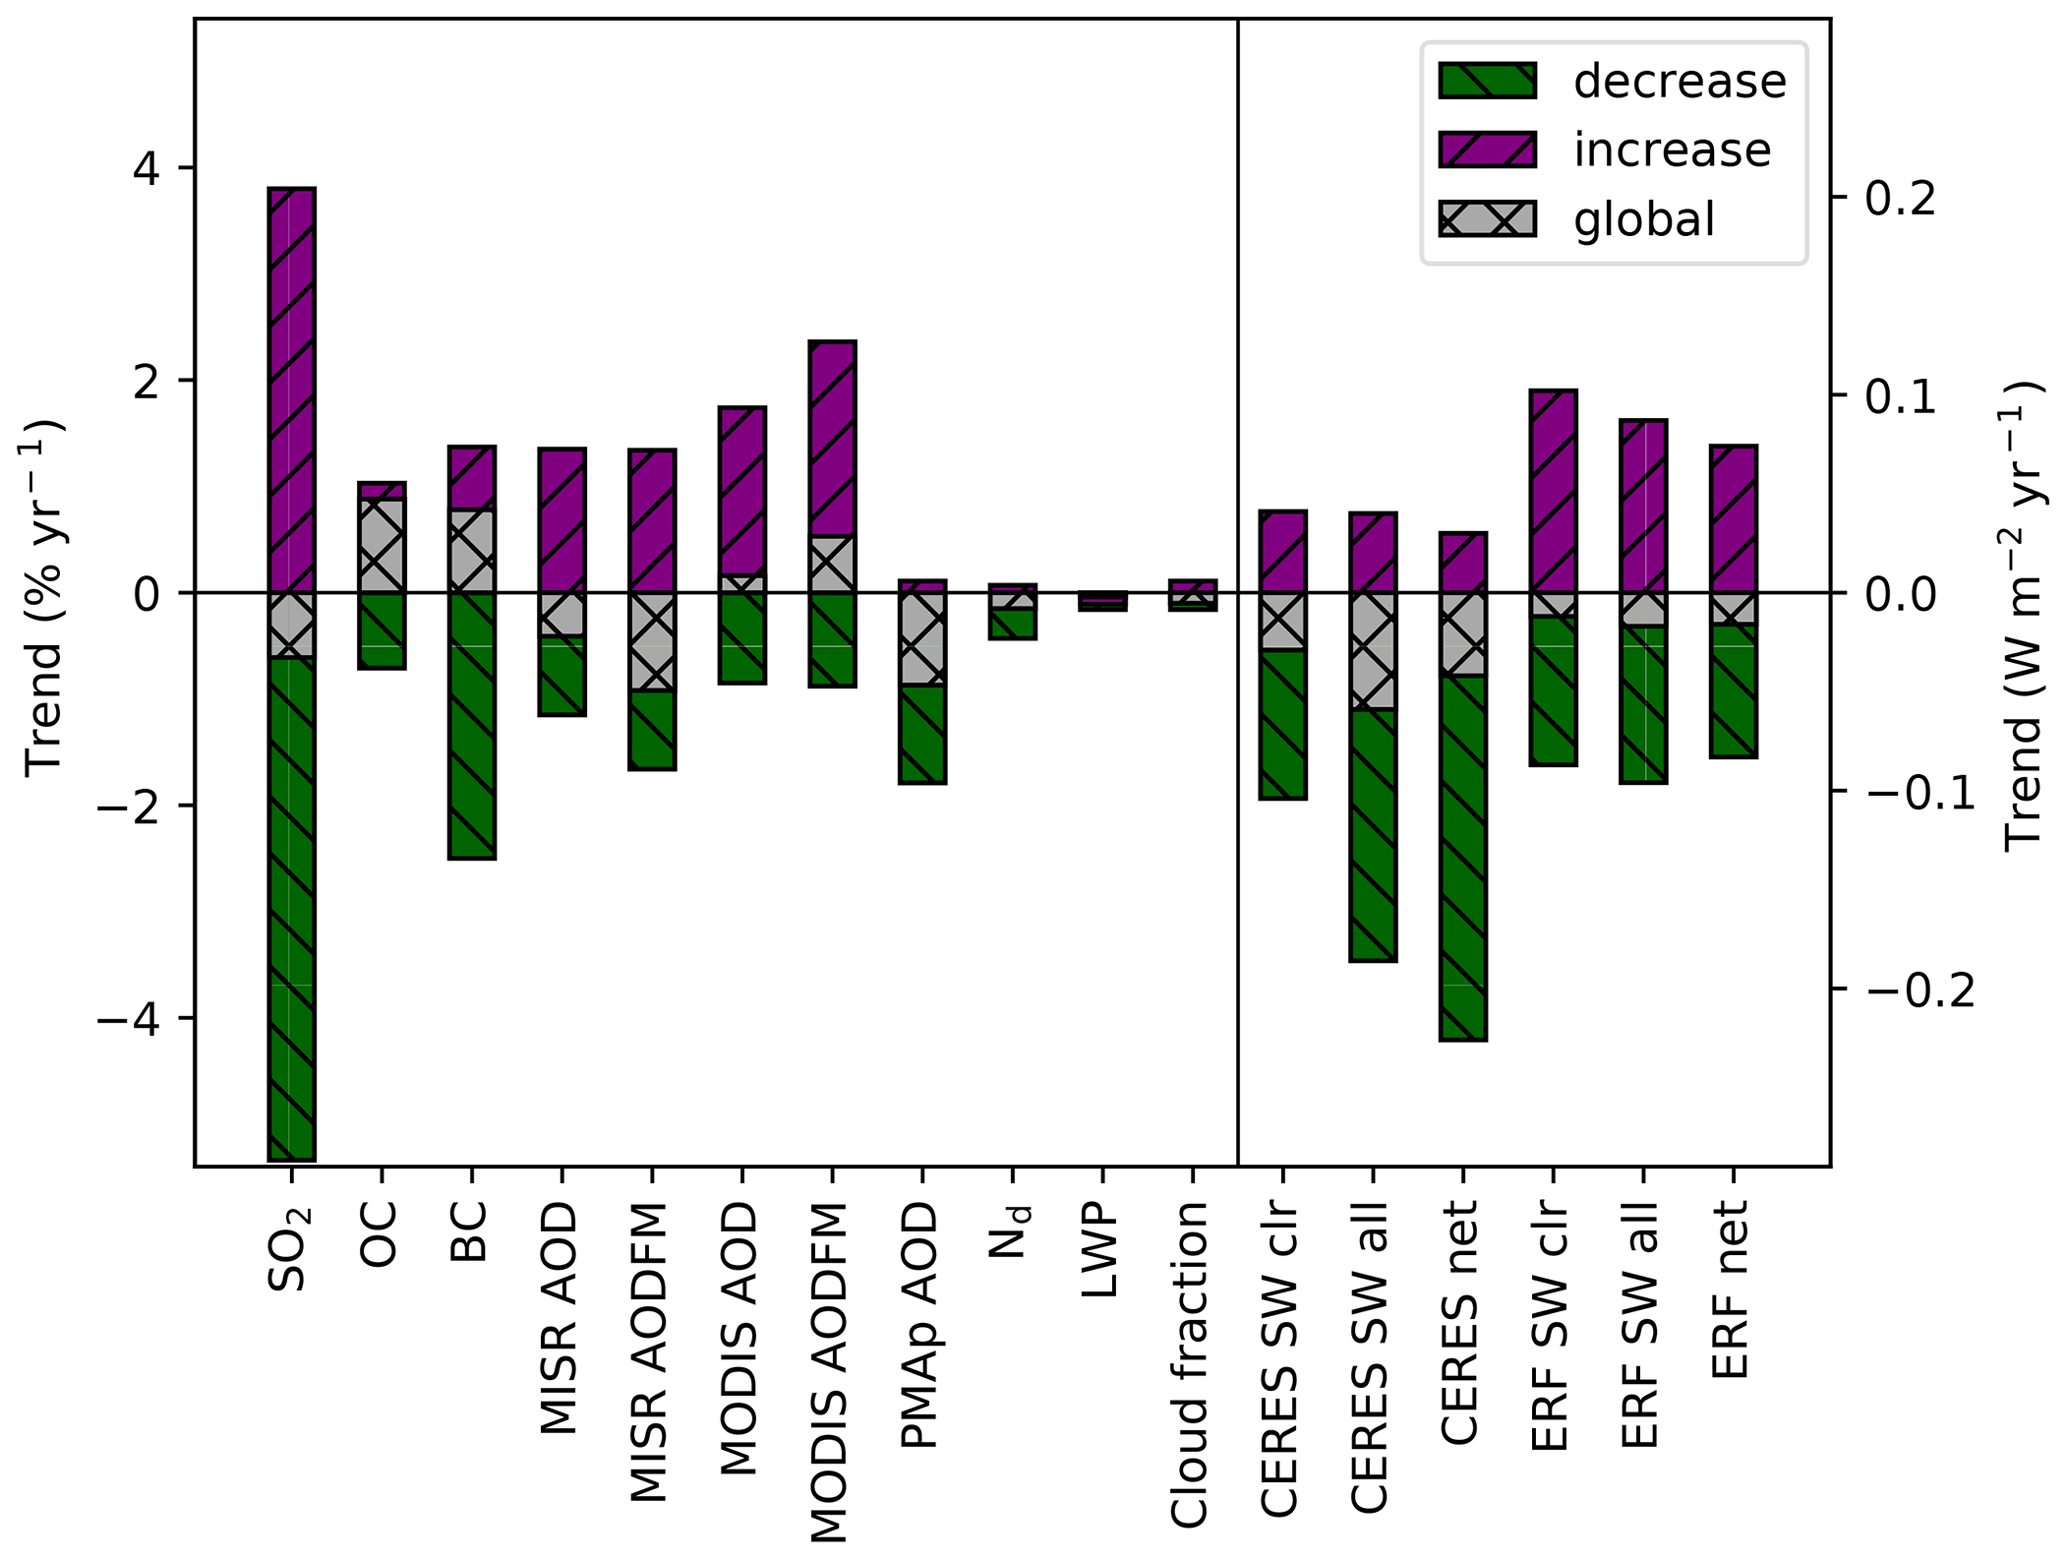
Figure 6Mean values derived from the maps in Figs. 1 to 4, averaged over (green/downward hatching) the regions with substantial negative trends (defined as larger than 0.05 W m−2 yr−1 in absolute terms; isolines in Fig. 4) in ERF solar clear-sky situations from RFMIP (Fig. 4d) and (purple/upward hatching) substantial positive trends. The grey bar (crosses) is the global mean between 60∘ S and 60∘ N. The regions with negative trends cover 7.3 % of the Earth surface, the ones with positive trends, 1.1 %. The AODFM is only retrieved over oceans, and the PMAp time series only spans 10 years from 2008 to 2017. From left to right: Trends in emissions of SO2, OC, and BC, in AOD and AODFM from MISR, MODIS, and Metop-A, in cloud droplet concentration Nd, LWP and cloud fraction from MODIS. All these are provided in units of % yr−1 and refer to the left axis. Trends in CERES retrievals of solar clear-sky, solar all-sky, and net all-sky radiation, as well as in model-derived ERF for solar clear-sky, solar all-sky, and net all-sky radiation are shown in units of W m−2 yr−1 (right axis) and are inverted in sign: negative trends here are for reduction in magnitude (less negative fluxes/effective forcings).
Table 1Values corresponding to Fig. 6. The trends in absolute units are reported in Supplement Table S1.
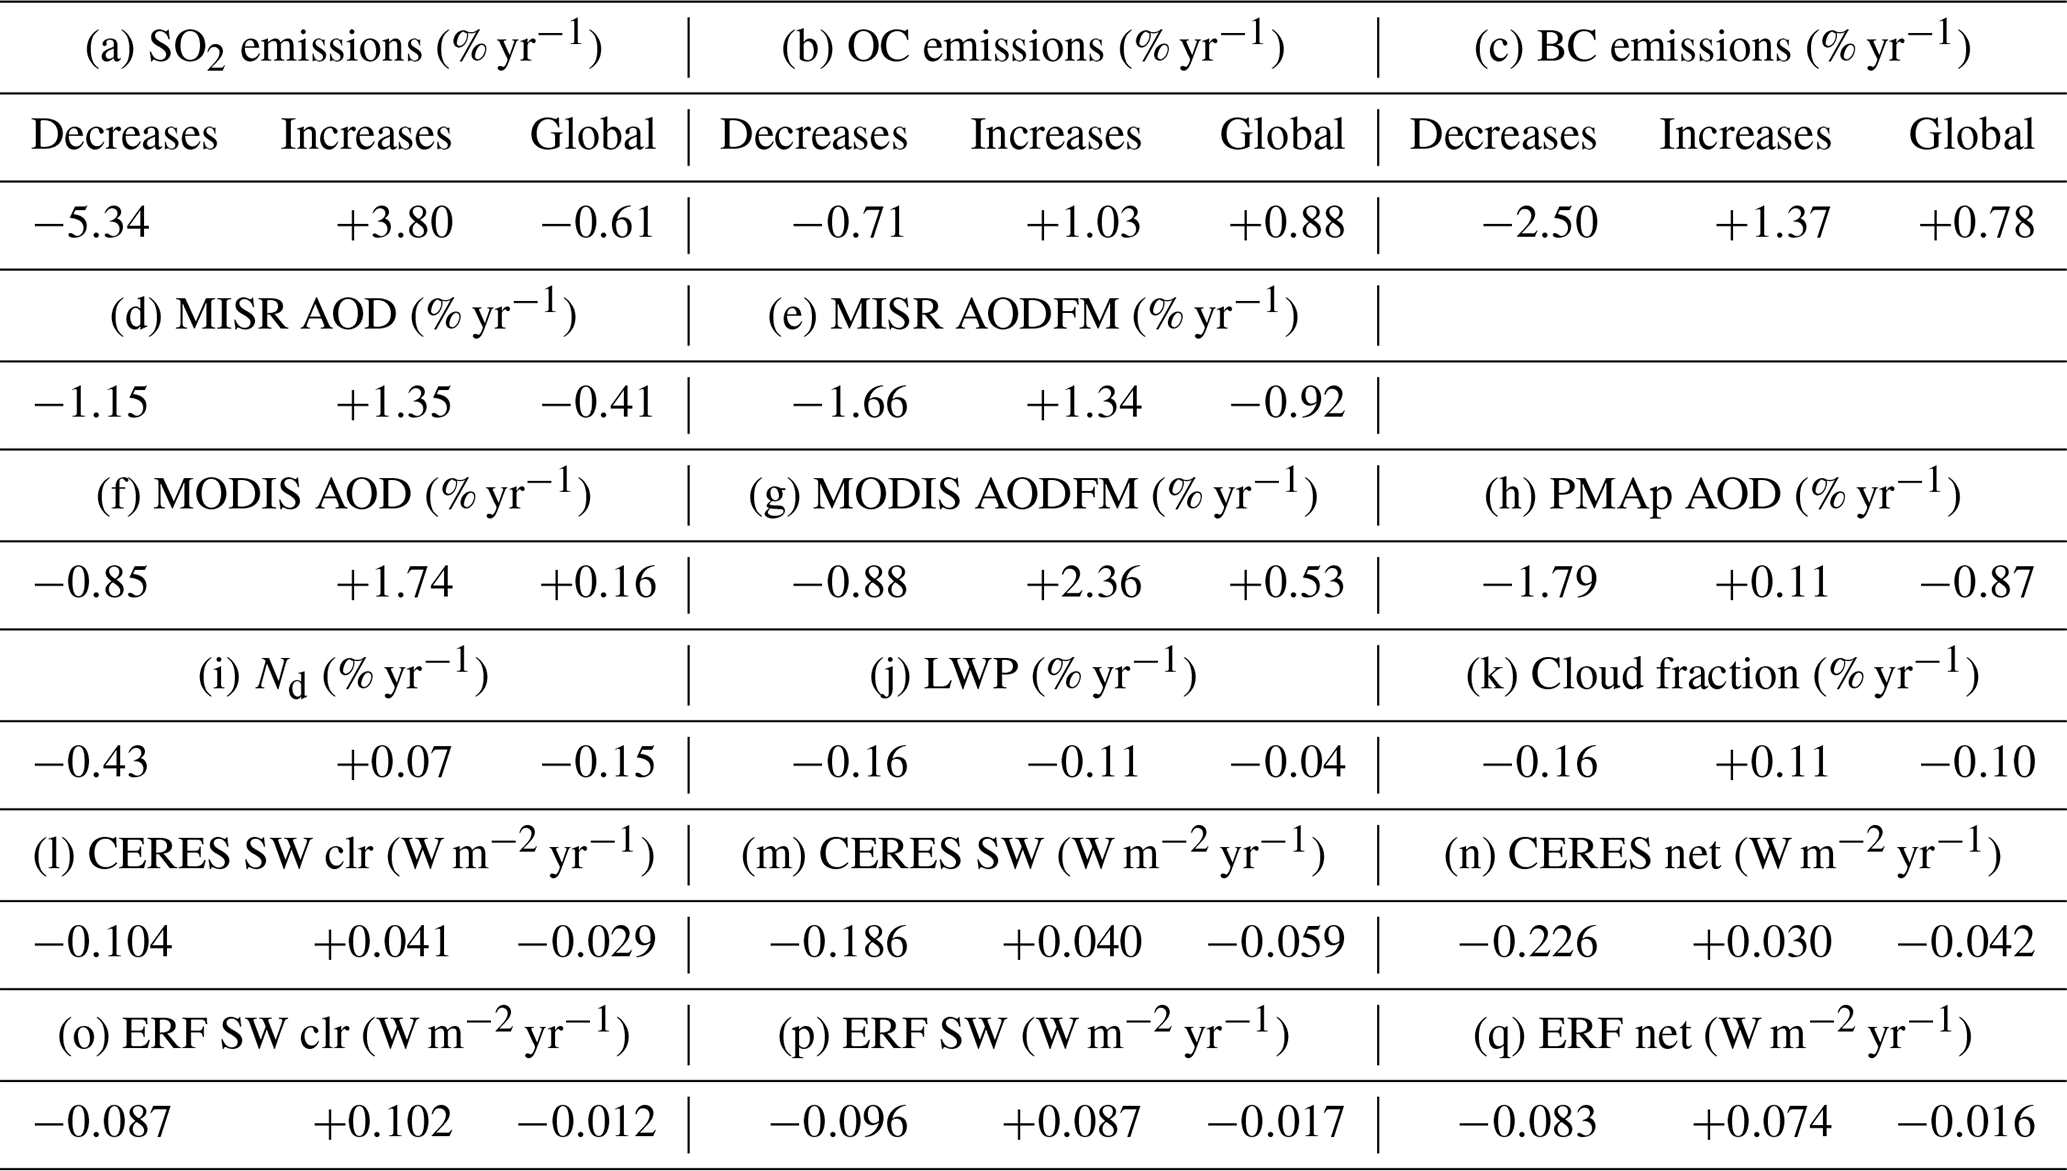
Table 2Estimates of ERFaer change between 2000 and 2019. The 5 % to 95 % uncertainty ranges are provided. Kramer et al. (2021) assess radiative forcing (RF) due to aerosols and use the period 2003–2018; Raghuraman et al. (2021) use the period 2001–2019.
The trends of aerosols, clouds, and radiation in the observations are subject to not only changes in anthropogenic aerosol emissions, but also other influencing factors. These include changes in natural aerosol emissions, which remain poorly constrained and contribute a substantial fraction of total observed AOD, interannual variability, and responses to greenhouse-gas-induced global warming; aerosol–cloud interactions may also be altered in a changing climate (Zhou et al., 2021; Murray-Watson and Gryspeerdt, 2022).
Natural aerosol emissions, especially of dust, are highly variable and impact the distribution of AOD in specific regions (Chin et al., 2014). Natural aerosol emissions may respond to increasing temperatures (Yli-Juuti et al., 2021). Furthermore, volcanic aerosol emissions, from both eruptions and degassing, are an important contribution, particularly to atmospheric sulfate aerosol. However, in satellite retrievals for the 2005–2016 period, no strong trends across volcanoes have been observed (Carn et al., 2017). Fires may emit large amounts of aerosols. This was the case for the Australian bush fires in 2020 (Boer et al., 2020; Heinold et al., 2022) in particular. It is not very clear whether there were substantial trends in fire aerosol emissions in recent decades (Doerr et al., 2016), even if burned areas decreased in many regions (Andela et al., 2017). However, global warming increases the risk of fire (van Oldenborgh et al., 2021). More broadly, biomass burning aerosols are typically considered separately from the anthropogenic emissions presented in Fig. 1. In particular, in the Northern Hemisphere high latitudes, increasing emissions of biomass burning occurred during the period of interest (van Marle et al., 2017) and likely explain the increases in aerosol abundance (Fig. 2) seen in these regions.Sea-salt aerosols, that are a function of near ocean-surface wind speed, are subject to variability, both forced and unforced, albeit to a lesser extent than dust (Stier et al., 2006). To the extent that MODIS, rather than MISR, AOD and AODFM trends above the Southern Hemisphere oceans are right, such variability in sea-salt aerosol may cause the increasing trends (Struthers et al., 2013). Trends in long-range transport of aerosols could be another reason for such increases. However, the satellite retrievals are particularly uncertain in this region, due to the large zenith angles and large cloud cover that both hamper aerosol retrievals.
Towards the end of the time series investigated here, there were specific effects due to the COVID-19 pandemic in 2020 (Forster et al., 2020; Gettelman et al., 2021; Fiedler et al., 2021). For this reason, and due to the particularly large fire activity, the end year of the data analysed here was chosen as 2019.
The different quantities investigated here are not independent. The climate models are driven by the emissions. In turn, the emission inventories consider satellite retrievals for some of their aspects such as fires and shipping. The satellite retrievals of cloud properties and radiation are not linked to the other quantities but are more noisy in their results. Cloud properties respond to variability in climate dynamics, both forced and unforced, beyond the impact of anthropogenic aerosols. Norris et al. (2016) document global patterns of changes in cloud coverage and cloud albedo; these patterns show a reduction in cloud cover and albedo in the mid-latitudes and an increase in the Tropics from the 1980s to the first decade of the 21st century. These are consistent with the expectations as a result of cloud responses to global warming.
We now turn to discussing the quantification of changes in aerosols, clouds, and radiation. For this, the regions with clear trends in aerosols are identified by subjectively choosing the regions in which the ERF simulated by the CMIP6 models (Fig. 4) exceeds ±0.05 W m−2 yr−1 for the solar, clear-sky component. Regions with increasing and decreasing ERF are distinguished. Table 1 summarises all quantities analysed in Figs. 1 to 4. In the regions with declining clear-sky solar ERFaer, SO2 emissions decreased strongly, in particular; however, OC and BC emissions also decrease according to the inventory of Hoesly et al. (2018). In regions with increasing clear-sky solar ERFaer, emissions of all three species increased. Both MODIS and MISR show corresponding declining trends in column-aerosol metrics for the regions with aerosol emission reductions, and increasing trends where aerosols increased. The numbers are much larger for MISR than for MODIS for the declining-trend regions (almost a factor of 2 larger in case of AODFM). Additionally, in the global average, the MODIS-derived AOD and AODFM trends are positive, consistent with the result from MISR and Metop-A, and inconsistent with the trends in clouds and radiation. This is due to the aerosol increases in MODIS over much of the oceans, especially in the Southern Hemisphere. The reasons are debated in the literature (see above). In contrast, MODIS-retrieved cloud droplet number, LWP, and cloud fraction in these regions all increase (decrease) where aerosol emissions increase (decrease). Globally, all three quantities decrease. Droplet number concentrations change by a rate that is a factor of 2 (compared to MODIS AOD) to 4 (compared to MISR AODFM) less than for AOD, highlighting that there is not a 1:1 relationship of droplet number and aerosol measured as AOD (e.g. Quaas et al., 2020; Jia et al., 2022). Since the regions with increasing aerosol are more limited in extent, the absolute numbers are expected to be more uncertain. There is only a small LWP response that is inconsistent in sign between regions with increasing and decreasing aerosol emissions. The LWP responds to not only Nd perturbations, but also global warming (with an expected increase in LWP on average; e.g. Norris et al., 2016). However, the fact that there is little LWP trend where Nd trends are substantial, is consistent with other observations-based assessments (Malavelle et al., 2017; Toll et al., 2019). Cloud fraction, in turn, appears to show decreasing trends in the regions with anthropogenic aerosol decreases, and increasing trends where aerosol increases. Although it is also a function of other drivers, this could hint towards a systematic (positive, i.e. negative in terms of forcing) aerosol effect on cloud fraction as also documented in earlier statistical studies (Gryspeerdt et al., 2016; Rosenfeld et al., 2019; Christensen et al., 2020; Chen et al., 2022). It is to be noted that the spatial consistency of the trends in cloudiness are not a proof of causality. Consistent with these results, CERES shows decreasing trends in top-of-atmosphere radiation budget. The changes in net radiation retrieved by CERES are expected to reflect the trends in ERF, but also natural variability and feedbacks to climate change. The numbers are stronger for all-sky than for clear-sky situations, indicating a comparatively strong contribution by aerosol–cloud interactions (Forster et al., 2021; Loeb et al., 2021a). The numbers are consistent in sign with what the CMIP6 models suggest for changes in ERFaer, although more negative (less positive where aerosols increase), particularly when the cloud effects are included. The global average values similarly show stronger declines than CMIP6, but are also consistent in sign.
In conclusion, there are clear, robust, and consistent signals for net declining anthropogenic aerosol influence on climate during the period since 2000, i.e. the period for which high-quality satellite retrievals of all relevant quantities are available. The regions in which aerosol emissions declined (in particular North America, Europe, and East Asia) dominate over regions with increasing trends. The summary of the results in terms of aerosol effective climate forcings are listed in Table 2. This demonstrates consistency of this study's findings to previous ones. The overall climate-relevant signal is a decline in negative ERFaer by about 0.1 to 0.3 W m−2, i.e. between 15 % and 50 % of the 0.6 W m−2 increase in CO2 ERF (Forster et al., 2021) in the same time period. This signal will most likely continue in the future, increasing the urgency for strong measures on reducing greenhouse gas emissions (McKenna et al., 2021).
The MODIS cloud products MYD08_D3 from Aqua and MOD08_D3 from Terra were used in this study from the Level-1 and Atmosphere Archive and Distribution System (LAADS) Distributed Active Archive Center (DAAC), https://doi.org/10.5067/MODIS/MOD06_L2.006 (Platnick et al., 2015a); https://doi.org/10.5067/MODIS/MYD06_L2.006 (Platnick et al., 2015b), and https://doi.org/10.5067/MODIS/MOD04_L2.061 (Levy et al., 2017a); https://doi.org/10.5067/MODIS/MYD04_L2.061 (Levy et al., 2017b). MISR data were obtained from the NASA Langley Research Center Atmospheric Science Data Center (https://opendap.larc.nasa.gov/opendap/MISR/MIL3YAEN.004, Garay et al., 2017). CERES data were obtained from https://ceres.larc.nasa.gov/data/ (Loeb et al., 2018a). The Metop-A data are available as PMAp Climate Data Record (CDR) at https://doi.org/10.15770/EUM_SEC_CLM_0053 (EUMETSAT, 2022). AERONET data were used from https://aeronet.gsfc.nasa.gov/data_push/AOT_Level2_Monthly.tar.gz (Holben et al., 1998; Giles et al., 2019). RFMIP model output is available from the Earth System Grid Federation (ESGF).
The supplement related to this article is available online at: https://doi.org/10.5194/acp-22-12221-2022-supplement.
The fundamentals stem from active discussions with all authors. JQ coordinated the study and led the writing of the manuscript with significant contributions from all authors. HJ created Figs. 1 to 4, including processing the data, and Table 1. with substantial help from CS for the RFMIP models and MDB for the Metop-A data. ALA and CS prepared Fig. 5 and the data processed for it.
At least one of the (co-)authors is a member of the editorial board of Atmospheric Chemistry and Physics. The peer-review process was guided by an independent editor, and the authors also have no other competing interests to declare.
Publisher's note: Copernicus Publications remains neutral with regard to jurisdictional claims in published maps and institutional affiliations.
We would like to thank Annica Ekman (Stockholm University), Bjorn Stevens (Max Planck Institute for Meteorology, Hamburg), and Songmiao Fan (GFDL Princeton) for insightful comments.
We thank all data producers for making their data available. We acknowledge the World Climate Research Programme, which, through its Working Group on Coupled Modelling, coordinated and promoted CMIP6. We thank the climate modelling groups for producing and making available their model output, and the multiple funding agencies who support CMIP6 and ESGF. We would also like to thank Michael Diamond and two anonymous reviewers for constructive and helpful comments. We further acknowledge the Open Access Publishing Fund of Leipzig University supported by the German Research Foundation within the programme Open Access Publication Funding.
This research has been supported by the Horizon 2020 (grant nos. FORCeS (821205), CONSTRAIN (820829), and RECAP (724602)) and the Deutsche Forschungsgemeinschaft (grant no. QU 311/28-1).
This paper was edited by Yuan Wang and reviewed by Michael Diamond and two anonymous referees.
Aas, W., Mortier, A., Bowersox, V., Cherian, R., Faluvegi, G., Fagerli, H., Hand, J., Klimont, Z., Galy-Lacaux, C., Lehmann, C. M. B., Lund Myhre, C., Myhre, G., Olivié, D., Sato, K., Quaas, J., Rao, P. S. P., Schulz, M., Shindell, D., Skeie, R. B., Stein, A., Takemura, T., Tsyro, S., Vet, R., and Xu, X.: Global and regional trends of atmospheric sulfur, Sci. Rep.-UK, 9, 953, https://doi.org/10.1038/s41598-018-37304-0, 2019. a, b, c, d, e, f, g
Albright, A. L., Proistosescu, C., and Huybers, P.: Origins of a Relatively Tight Lower Bound on Anthropogenic Aerosol Radiative Forcing from Bayesian Analysis of Historical Observations, J. Climate, 34, 8777–8792, https://doi.org/10.1175/JCLI-D-21-0167.1, 2021. a, b, c, d, e, f, g
Allen, M., Peters, G., Shine, K., Azar, C., Balcombe, P., Boucher, O., Cain, M., Ciais, P., Collins, W., Forster, P. M., Frame, D. J., Friedlingstein, P., Fyson, C., Gasser, T., Hare, B., Jenkins, S., Hamburg, S. P., Johansson, D. J. A., Lynch, J., Macey, A., Morfeldt, J., Nauels, A., Ocko, I., Oppenheimer, M., Pacala, S. W., Pierrehumbert, R., Rogelj, J., Schaeffer, M., Schleussner, C. F., Shindell, D., Skeie, R. B., Smith, S. M., and Tanaka, K.: Indicate separate contributions of long-lived and short-lived greenhouse gases in emission targets, npj Clim. Atmos. Sci., 5, 5, https://doi.org/10.1038/s41612-021-00226-2, 2022. a
Allison, L. C., Palmer, M. D., Allan, R. P., Hermanson, L., Liu, C., and Smith, D. M.: Observations of planetary heating since the 1980s from multiple independent datasets, Environ. Res. Comm., 2, 101001, https://doi.org/10.1088/2515-7620/abbb39, 2020. a
Andela, N., Morton, D. C., Giglio, L., Chen, Y., van der Werf, G. R., Kasibhatla, P. S., DeFries, R. S., Collatz, G. J., Hantson, S., Kloster, S., Bachelet, D., Forrest, M., Lasslop, G., Li, F., Mangeon, S., Melton, J. R., Yue, C., and Randerson, J. T.: A human-driven decline in global burned area, Science, 356, 1356–1362, https://doi.org/10.1126/science.aal4108, 2017. a
Andrews, T., Gregory, J. M., Paynter, D., Silvers, L. G., Zhou, C., Mauritsen, T., Webb, M. J., Armour, K. C., Forster, P. M., and Titchner, H.: Accounting for changing temperature patterns increases historical estimates of climate sensitivity, Geophys. Res. Lett., 45, 8490–8499, 2018. a
Andrews, T., Andrews, M. B., Bodas-Salcedo, A., Jones, G. S., Kuhlbrodt, T., Manners, J., Menary, M. B., Ridley, J., Ringer, M. A., Sellar, A. A., Senior, C. A., and Tang, Y.: Forcings, Feedbacks, and Climate Sensitivity in HadGEM3-GC3.1 and UKESM1, J. Adv. Model. Earth Sy., 11, 4377–4394, https://doi.org/10.1029/2019MS001866, 2019. a, b
Bai, H., Wang, M., Zhang, Z., and Liu, Y.: Synergetic satellite trend analysis of aerosol and warm cloud properties over ocean and its implication for aerosol-cloud interactions, J. Geophys. Res.-Atmos., 125, e2019JD031598, https://doi.org/10.1029/2019JD031598, 2020. a
Bauer, S. E., Tsigaridis, K., Faluvegi, G., Kelley, M., Lo, K. K., Miller, R. L., Nazarenko, L., Schmidt, G. A., and Wu, J.: Historical (1850–2014) Aerosol Evolution and Role on Climate Forcing Using the GISS ModelE2.1 Contribution to CMIP6, J. Adv. Model. Earth Sy., 12, e2019MS001978, https://doi.org/10.1029/2019MS001978, 2020. a
Bellouin, N., Boucher, O., Haywood, J., and Reddy, M. S.: Global estimate of aerosol direct radiative forcing from satellite measurements, Nature, 438, 1138–1141, https://doi.org/10.1038/nature04348, 2005. a
Bellouin, N., Davies, W., Shine, K. P., Quaas, J., Mülmenstädt, J., Forster, P. M., Smith, C., Lee, L., Regayre, L., Brasseur, G., Sudarchikova, N., Bouarar, I., Boucher, O., and Myhre, G.: Radiative forcing of climate change from the Copernicus reanalysis of atmospheric composition, Earth Syst. Sci. Data, 12, 1649–1677, https://doi.org/10.5194/essd-12-1649-2020, 2020a. a
Bellouin, N., Quaas, J., Gryspeerdt, E., Kinne, S., Stier, P., Watson-Parris, D., Boucher, O., Carslaw, K., Christensen, M., Daniau, A.-L., Dufresne, J.-L., Feingold, G., Fiedler, S., Forster, P., Gettelman, A., Haywood, J. M., Malavelle, F., Lohmann, U., Mauritsen, T., McCoy, D., Myhre, G., Mülmenstädt, J., Neubauer, D., Possner, A., Rugenstein, M., Sato, Y., Schulz, M., Schwartz, S. E., Sourdeval, O., Storelvmo, T., Toll, V., Winker, D., and Stevens, B.: Bounding global aerosol radiative forcing of climate change, Rev. Geophys., 58, e2019RG000660, https://doi.org/10.1029/2019RG000660, 2020b. a, b, c
Benas, N., Meirink, J. F., Karlsson, K.-G., Stengel, M., and Stammes, P.: Satellite observations of aerosols and clouds over southern China from 2006 to 2015: analysis of changes and possible interaction mechanisms, Atmos. Chem. Phys., 20, 457–474, https://doi.org/10.5194/acp-20-457-2020, 2020. a
Bennartz, R., Fan, J., Rausch, J., Leung, L. R., and Heidinger, A. K.: Pollution from China increases cloud droplet number, suppresses rain over the East China Sea, Geophys. Res. Lett., 38, L09704, https://doi.org/10.1029/2011GL047235, 2011. a
Boer, M. M., Resco de Dios, V., and Bradstock, R. A.: Unprecedented burn area of Australian mega forest fires, Nat. Clim. Change, 10, 171–172, https://doi.org/10.1038/s41558-020-0716-1, 2020. a
Boucher, O., Randall, D., Artaxo, P., Bretherton, C., Feingold, G., Forster, P., Kerminen, V.-M., Kondo, Y., Liao, H., Lohmann, U., Rasch, P., Satheesh, S., Sherwood, S., Stevens, B., and Zhang, X.: Clouds and Aerosols, in: Climate Change 2013: The Physical Science Basis. Contribution of Working Group I to the Fifth Assessment Report of the Intergovernmental Panel on Climate Change, edited by: Stocker, T., Qin, D., Plattner, G.-K., Tignor, M., Allen, S., Boschung, J., Nauels, A., Xia, Y., Bex, V., and Midgley, P., chap. 7, Cambridge University Press, Cambridge, United Kingdom and New York, NY, USA, 571–658, https://doi.org/10.1017/CBO9781107415324.016, 2013. a
Boucher, O., Servonnat, J., Albright, A. L., Aumont, O., Balkanski, Y., Bastrikov, V., Bekki, S., Bonnet, R., Bony, S., Bopp, L., Braconnot, P., Brockmann, P., Cadule, P., Caubel, A., Cheruy, F., Codron, F., Cozic, A., Cugnet, D., D'Andrea, F., Davini, P., de Lavergne, C., Denvil, S., Deshayes, J., Devilliers, M., Ducharne, A., Dufresne, J.-L., Dupont, E., Éthé, C., Fairhead, L., Falletti, L., Flavoni, S., Foujols, M.-A., Gardoll, S., Gastineau, G., Ghattas, J., Grandpeix, J.-Y., Guenet, B., Guez, Lionel, E., Guilyardi, E., Guimberteau, M., Hauglustaine, D., Hourdin, F., Idelkadi, A., Joussaume, S., Kageyama, M., Khodri, M., Krinner, G., Lebas, N., Levavasseur, G., Lévy, C., Li, L., Lott, F., Lurton, T., Luyssaert, S., Madec, G., Madeleine, J.-B., Maignan, F., Marchand, M., Marti, O., Mellul, L., Meurdesoif, Y., Mignot, J., Musat, I., Ottlé, C., Peylin, P., Planton, Y., Polcher, J., Rio, C., Rochetin, N., Rousset, C., Sepulchre, P., Sima, A., Swingedouw, D., Thiéblemont, R., Traore, A. K., Vancoppenolle, M., Vial, J., Vialard, J., Viovy, N., and Vuichard, N.: Presentation and Evaluation of the IPSL-CM6A-LR Climate Model, J. Adv. Model. Earth Sy., 12, e2019MS002010, https://doi.org/10.1029/2019MS002010, 2020. a, b
Brasseur, G. P. and Roeckner, E.: Impact of improved air quality on the future evolution of climate, Geophys. Res. Lett., 32, L23704, https://doi.org/10.1029/2005GL023902, 2005. a
Carn, S., Fioletov, V., McLinden, C. A., Li, C., and Krotkov, N. A.: A decade of global volcanic SO2 emissions measured from space, Sci. Rep.-UK, 7, 44095, https://doi.org/10.1038/srep44095, 2017. a
Cermak, J., Wild, M., Knutti, R., Mishchenko, M., and Heidinger, K.: Consistency between global satellite-derived aerosol and cloud data sets on recent brightening trends, Geophys. Res. Lett., 37, L21704, https://doi.org/10.1029/2010GL044632, 2010. a
Chen, Y., Haywood, J., Wang, Y., Malavelle, F., Jordan, G., Partridge, D., Fieldsend, J., Johannes De L., Schmidt, A., Cho, N., Oreopoulos, L., Platnick, S., Grosvenor, D., Field, P., and Lohmann, U.: Machine learning reveals climate forcing from aerosols is dominated by increased cloud cover, Nat. Geosci., 15, 609–614, https://doi.org/10.1038/s41561-022-00991-6, 2022. a, b, c
Cherian, R. and Quaas, J.: Trends in AOD, clouds and cloud radiative effects in satellite data and CMIP5 and CMIP6 model simulations over aerosol source regions, Geophys. Res. Lett., 47, e2020GL087132, https://doi.org/10.1029/2020GL087132, 2020. a, b, c, d, e
Cherian, R., Quaas, J., Salzmann, M., and Wild, M.: Pollution trends over Europe constrain global aerosol forcing as simulated by climate models, Geophys. Res. Lett., 41, 2176–2181, https://doi.org/10.1002/2013GL058715, 2014. a, b, c
Chin, M., Diehl, T., Tan, Q., Prospero, J. M., Kahn, R. A., Remer, L. A., Yu, H., Sayer, A. M., Bian, H., Geogdzhayev, I. V., Holben, B. N., Howell, S. G., Huebert, B. J., Hsu, N. C., Kim, D., Kucsera, T. L., Levy, R. C., Mishchenko, M. I., Pan, X., Quinn, P. K., Schuster, G. L., Streets, D. G., Strode, S. A., Torres, O., and Zhao, X.-P.: Multi-decadal aerosol variations from 1980 to 2009: a perspective from observations and a global model, Atmos. Chem. Phys., 14, 3657–3690, https://doi.org/10.5194/acp-14-3657-2014, 2014. a
Christensen, M. W., Jones, W. K., and Stier, P.: Aerosols enhance cloud lifetime and brightness along the stratus-to-cumulus transition, P. Natl. Acad. Sci. USA, 117, 17591–17598, https://doi.org/10.1073/pnas.1921231117, 2020. a, b
Chýlek, P. and Coakley, J. A.: Aerosols and Climate, Science, 183, 75–77, https://doi.org/10.1126/science.183.4120.75, 1974. a
Cohen, A., Brauer, M., Burnett, R., Anderson, H. R., Frostad, J., Estep, K., Balakrishnan, K., Brunekreef, B., Dandona, L., Dandona, R., Feigin, V., Freedman, G., Hubbell, B., Jobling, A., Kan, H., Knibbs, L., Liu, Y., Martin, R., Morawska, L., Pope III, C. A., Shin, H., Straif, K., Shaddick, G., Thomas, M., van Dingenen, R., van Donkelaar, A., Vos, T., Murray, C. J. L., and Forouzanfar, M. H.: Estimates and 25-year trends of the global burden of disease attributable to ambient air pollution: an analysis of data from the Global Burden of Diseases Study 2015, Lancet, 389, 1907–1918, https://doi.org/10.1016/S0140-6736(17)30505-6, 2017. a
Collaud Coen, M., Andrews, E., Alastuey, A., Arsov, T. P., Backman, J., Brem, B. T., Bukowiecki, N., Couret, C., Eleftheriadis, K., Flentje, H., Fiebig, M., Gysel-Beer, M., Hand, J. L., Hoffer, A., Hooda, R., Hueglin, C., Joubert, W., Keywood, M., Kim, J. E., Kim, S.-W., Labuschagne, C., Lin, N.-H., Lin, Y., Lund Myhre, C., Luoma, K., Lyamani, H., Marinoni, A., Mayol-Bracero, O. L., Mihalopoulos, N., Pandolfi, M., Prats, N., Prenni, A. J., Putaud, J.-P., Ries, L., Reisen, F., Sellegri, K., Sharma, S., Sheridan, P., Sherman, J. P., Sun, J., Titos, G., Torres, E., Tuch, T., Weller, R., Wiedensohler, A., Zieger, P., and Laj, P.: Multidecadal trend analysis of in situ aerosol radiative properties around the world, Atmos. Chem. Phys., 20, 8867–8908, https://doi.org/10.5194/acp-20-8867-2020, 2020. a
Collins, W. J., Lamarque, J.-F., Schulz, M., Boucher, O., Eyring, V., Hegglin, M. I., Maycock, A., Myhre, G., Prather, M., Shindell, D., and Smith, S. J.: AerChemMIP: quantifying the effects of chemistry and aerosols in CMIP6, Geosci. Model Dev., 10, 585–607, https://doi.org/10.5194/gmd-10-585-2017, 2017. a
Costa-Surós, M., Sourdeval, O., Acquistapace, C., Baars, H., Carbajal Henken, C., Genz, C., Hesemann, J., Jimenez, C., König, M., Kretzschmar, J., Madenach, N., Meyer, C. I., Schrödner, R., Seifert, P., Senf, F., Brueck, M., Cioni, G., Engels, J. F., Fieg, K., Gorges, K., Heinze, R., Siligam, P. K., Burkhardt, U., Crewell, S., Hoose, C., Seifert, A., Tegen, I., and Quaas, J.: Detection and attribution of aerosol–cloud interactions in large-domain large-eddy simulations with the ICOsahedral Non-hydrostatic model, Atmos. Chem. Phys., 20, 5657–5678, https://doi.org/10.5194/acp-20-5657-2020, 2020. a
Crippa, M., Janssens-Maenhout, G., Dentener, F., Guizzardi, D., Sindelarova, K., Muntean, M., Van Dingenen, R., and Granier, C.: Forty years of improvements in European air quality: regional policy-industry interactions with global impacts, Atmos. Chem. Phys., 16, 3825–3841, https://doi.org/10.5194/acp-16-3825-2016, 2016. a
Dahutia, P., Pathak, B., and Bhuyan, P. K.: Aerosols characteristics, trends and their climatic implications over Northeast India and adjoining South Asia, Int. J. Climatol., 38, 1234–1256, https://doi.org/10.1002/joc.5240, 2018. a
Doerr, S., Santín, C., and Santin Nuno, C.: Global trends in wildfire and its impacts: perceptions versus realities in a changing world, Philos. T. Roy. Soc. B, 371, 20150345, https://doi.org/10.1098/rstb.2015.0345, 2016. a
Dufresne, J.-L., Quaas, J., Boucher, O., Denvil, S., and Fairhead, L.: Constrast of the climate effects of anthropogenic sulfate aerosols between the 20th and 21st century, Geophys. Res. Lett., 32, L21703, https://doi.org/10.1029/2005GL023619, 2005. a
Ekman, A., Kjellström, E., Hansson, H.-C., Riipinen, I., Salter, M., Pandis, S., Klimont, Z., Martins, H., Cordeiro, A., Berntsen, T. K., and Jakobsson, I.: Is there a conflict between the clean air goals of the European Green Deal and climate neutrality?, https://forces-project.eu/publications/policy-brief/ (last access: 13 September 2022), 2020. a
Ekman, A. M. L.: Do sophisticated parameterizations of aerosol-cloud interactions in CMIP5 models improve the representation of recent observed temperature trends?, J. Geophys. Res.-Atmos., 119, 817–832, https://doi.org/10.1002/2013JD020511, 2014. a
Elguindi, N., Granier, C., Stavrakou, T., Darras, S., Bauwens, M., Cao, H., Chen, C., Denier van der Gon, H. A. C., Dubovik, O., Fu, T. M., Henze, D. K., Jiang, Z., Keita, S., Kuenen, J. J. P., Kurokawa, J., Liousse, C., Miyazaki, K., Müller, J.-F., Qu, Z., Solmon, F., and Zheng, B.: Intercomparison of Magnitudes and Trends in Anthropogenic Surface Emissions From Bottom-Up Inventories, Top-Down Estimates, and Emission Scenarios, Earth's Future, 8, e2020EF001520, https://doi.org/10.1029/2020EF001520, 2020. a, b, c, d, e, f, g
EUMETSAT: Polar Multi-Sensor Aerosol Optical Properties Climate Data Record Release 1 – Metop-A and -B, European Organisation for the Exploitation of Meteorological Satellites, https://doi.org/10.15770/EUM_SEC_CLM_0053, 2022. a
Eyring, V., Bony, S., Meehl, G. A., Senior, C. A., Stevens, B., Stouffer, R. J., and Taylor, K. E.: Overview of the Coupled Model Intercomparison Project Phase 6 (CMIP6) experimental design and organization, Geosci. Model Dev., 9, 1937–1958, https://doi.org/10.5194/gmd-9-1937-2016, 2016. a
Fan, X., Xia, X., and Chen, H.: Can MODIS detect trends in aerosol optical depth over land?, Adv. Atmos. Sci., 35, 135–145, https://doi.org/10.1007/s00376-017-7017-2, 2018. a
Fiedler, S., Wyser, K., Rogelj, J., and van Noije, T.: Radiative effects of reduced aerosol emissions during the COVID-19 pandemic and the future recovery, Atmos. Res., 264, 105866, https://doi.org/10.1016/j.atmosres.2021.105866, 2021. a
Filonchyk, M., Yan, H., Zhang, Z., Yang, S., Li, W., and Li, Y.: Combined use of satellite and surface observations to study aerosol optical depth in different regions of China, Sci. Rep.-UK, 9, 6174, https://doi.org/10.1038/s41598-019-42466-6, 2019. a
Forster, P., Forster, H., Evans, M., Gidden, M. J., Jones, C. D., Keller, C. A., Lamboll, R. D., Le Quéré, C., Rogelj, J., Rosen, D., Schleussner, C.-F., Richardson, T. B., Smith, C. J., and Turnock, S. T.: Current and future global climate impacts resulting from COVID-19, Nat. Clim. Change, 10, 913–919, https://doi.org/10.1038/s41558-020-0883-0, 2020. a
Forster, P., Storelvmo, T., Armour, K., Collins, W., Dufresne, J.-L., Frame, D., Lunt, D., Mauritsen, T., Palmer, M., Watanabe, M., Wild, M., and Zhang, H.: The Earth’s Energy Budget, Climate Feedbacks, and Climate Sensitivity, in: Climate Change 2021: The Physical Science Basis. Contribution of Working Group I to the Sixth Assessment Report of the Intergovernmental Panel on Climate Change, edited by: Masson-Delmotte, V., Zhai, P., Pirani, A., Connors, S., Péan, C., Berger, S., Caud, N., Chen, Y., Goldfarb, L., Gomis, M., Huang, M., Leitzell, K., Lonnoy, E., Matthews, J., Maycock, T., Waterfield, T., Yelekçi, O., Yu, R., and Zhou, B., chap. 7, Cambridge University Press, Cambridge, UK and New York, NY, USA, 923–1054, 2021. a, b, c, d, e, f, g, h, i
Garay, M. J., Kalashnikova, O. V., and Bull, M. A.: Development and assessment of a higher-spatial-resolution (4.4 km) MISR aerosol optical depth product using AERONET-DRAGON data, Atmos. Chem. Phys., 17, 5095–5106, https://doi.org/10.5194/acp-17-5095-2017, 2017 (data available at: https://opendap.larc.nasa.gov/opendap/MISR/MIL3YAEN.004, last access: 13 September 2022). a, b, c
Geoffroy, O., Saint-Martin, D., Bellon, G., Voldoire, A., Olivié, D. J. L., and Tytéca, S.: Transient Climate Response in a Two-Layer Energy-Balance Model. Part II: Representation of the Efficacy of Deep-Ocean Heat Uptake and Validation for CMIP5 AOGCMs, J. Climate, 26, 1859–1876, https://doi.org/10.1175/JCLI-D-12-00196.1, 2013. a
Georgoulias, A. K., Alexandri, G., Kourtidis, K. A., Lelieveld, J., Zanis, P., Pöschl, U., Levy, R., Amiridis, V., Marinou, E., and Tsikerdekis, A.: Spatiotemporal variability and contribution of different aerosol types to the aerosol optical depth over the Eastern Mediterranean, Atmos. Chem. Phys., 16, 13853–13884, https://doi.org/10.5194/acp-16-13853-2016, 2016. a
Gettelman, A., Lamboll, R., Bardeen, C. G., Forster, P. M., and Watson-Parris, D.: Climate impacts of COVID-19 induced emission changes, Geophys. Res. Lett., 48, e2020GL091805, https://doi.org/10.1029/2020GL091805, 2021. a
Giles, D. M., Sinyuk, A., Sorokin, M. G., Schafer, J. S., Smirnov, A., Slutsker, I., Eck, T. F., Holben, B. N., Lewis, J. R., Campbell, J. R., Welton, E. J., Korkin, S. V., and Lyapustin, A. I.: Advancements in the Aerosol Robotic Network (AERONET) Version 3 database – automated near-real-time quality control algorithm with improved cloud screening for Sun photometer aerosol optical depth (AOD) measurements, Atmos. Meas. Tech., 12, 169–209, https://doi.org/10.5194/amt-12-169-2019, 2019. a, b, c
Granier, C., Bessagnet, B., Bond, T., D’Angiola, A., van der Gon, H. D., Frost, G. J., Heil, A., Kaiser, J. W., Kinne, S., Klimont, Z., Kloster, S., Lamarque, J.-F., Liousse, C., Masui, T., Meleux, F., Mieville, A., Ohara, T., Raut, J.-C., Riahi, K., Schultz, M. G., Smith, S. J., Thompson, A., van Aardenne, J., van der Werf, G. R., and van Vuuren, D. P.: Evolution of anthropogenic and biomass burning emissions of air pollutants at global and regional scales during the 1980–2010 period, Climatic Change, 109, 163, https://doi.org/10.1007/s10584-011-0154-1, 2011. a
Grosvenor, D. P., Sourdeval, O., Zuidema, P., Ackerman, A., Alexandrov, M. D., Bennartz, R., Boers, R., Cairns, B., Chiu, C., Christensen, M., Deneke, H., Diamond, M., Feingold, G., Fridlind, A., Hünerbein, A., Knist, C., Kollias, P., Marshak, A., McCoy, D., Merk, D., Painemal, D., Rausch, J., Rosenfeld, D., Russchenberg, H., Seifert, P., Sinclair, K., Stier, P., B. van D., Wendisch, M., Werner, F., Wood, R., Zhang, Z., and Quaas, J.: Remote sensing of cloud droplet number concentration in warm clouds: A review of the current state of knowledge and perspectives, Rev. Geophys., 56, 409–453, https://doi.org/10.1029/2017RG000593, 2018. a, b
Gryspeerdt, E., Quaas, J., and Bellouin, N.: Constraining the aerosol influence on cloud fraction, J. Geophys. Res., 121, 3566–3583, https://doi.org/10.1002/2015JD023744, 2016. a, b
Gryspeerdt, E., Smith, T. W. P., O'Keeffe, E., Christensen, M. W., and Goldsworth, F. W.: The impact of ship emission controls recorded by cloud properties, Geophys. Res. Lett., 46, 12547–12555, https://doi.org/10.1029/2019GL084700, 2019. a
Grzegorski, M., Poli, G., Cacciari, A., Jafariserajehlou, S., Holdak, A., Lang, R., Vazquez-Navarro, M., Munro, R., and Fougnie, B.: Multi-Sensor Retrieval of Aerosol Optical Properties for Near-Real-Time Applications Using the Metop Series of Satellites: Concept, Detailed Description, and First Validation, Remote Sensing, 14, 85, https://doi.org/10.3390/rs14010085, 2021. a
Gulev, S., Thorne, P., Ahn, J., Dentener, F., Domingues, C., Gerland, S., Gong, D., Kaufman, D., Nnamchi, H., Quaas, J., Rivera, J., Sathyendranath, S., Smith, S., Trewin, B., von Schuckmann, K., and Vose, R.: Changing State of the Climate System, in: Climate Change 2021: The Physical Science Basis. Contribution of Working Group I to the Sixth Assessment Report of the Intergovernmental Panel on Climate Change, edited by: Masson-Delmotte, V., Zhai, P., Pirani, A., Connors, S., Péan, C., Berger, S., Caud, N., Chen, Y., Goldfarb, L., Gomis, M., Huang, M., Leitzell, K., Lonnoy, E., Matthews, J., Maycock, T., Waterfield, T., Yelekçi, O., Yu, R., and Zhou, B., chap. 2, Cambridge University Press, Cambridge, United Kingdom and New York, NY, USA, 2021. a
Haghighatnasab, M., Kretzschmar, J., Block, K., and Quaas, J.: Impact of Holuhraun volcano aerosols on clouds in cloud-system-resolving simulations, Atmos. Chem. Phys., 22, 8457–8472, https://doi.org/10.5194/acp-22-8457-2022, 2022. a
Hajima, T., Watanabe, M., Yamamoto, A., Tatebe, H., Noguchi, M. A., Abe, M., Ohgaito, R., Ito, A., Yamazaki, D., Okajima, H., Ito, A., Takata, K., Ogochi, K., Watanabe, S., and Kawamiya, M.: Development of the MIROC-ES2L Earth system model and the evaluation of biogeochemical processes and feedbacks, Geosci. Model Dev., 13, 2197–2244, https://doi.org/10.5194/gmd-13-2197-2020, 2020. a, b
Hammer, M. S., Martin, R. V., Li, C., Torres, O., Manning, M., and Boys, B. L.: Insight into global trends in aerosol composition from 2005 to 2015 inferred from the OMI Ultraviolet Aerosol Index, Atmos. Chem. Phys., 18, 8097–8112, https://doi.org/10.5194/acp-18-8097-2018, 2018. a
Hatzianastassiou, N., Ioannidis, E., Korras-Carraca, M.-B., Gavrouzou, M., Papadimas, C. D., Matsoukas, C., Benas, N., Fotiadi, A., Wild, M., and Vardavas, I.: Global Dimming and Brightening Features during the First Decade of the 21st Century, Atmosphere, 11, 308, https://doi.org/10.3390/atmos11030308, 2020. a
Heinold, B., Baars, H., Barja, B., Christensen, M., Kubin, A., Ohneiser, K., Schepanski, K., Schutgens, N., Senf, F., Schrödner, R., Villanueva, D., and Tegen, I.: Important role of stratospheric injection height for the distribution and radiative forcing of smoke aerosol from the 2019–2020 Australian wildfires, Atmos. Chem. Phys., 22, 9969–9985, https://doi.org/10.5194/acp-22-9969-2022, 2022. a
Held, I. M., Guo, H., Adcroft, A., Dunne, J. P., Horowitz, L. W., Krasting, J., Shevliakova, E., Winton, M., Zhao, M., Bushuk, M., Wittenberg, A. T., Wyman, B., Xiang, B., Zhang, R., Anderson, W., Balaji, V., Donner, L., Dunne, K., Durachta, J., Gauthier, P. P. G., Ginoux, P., Golaz, J.-C., Griffies, S. M., Hallberg, R., Harris, L., Harrison, M., Hurlin, W., John, J., Lin, P., Lin, S.-J., Malyshev, S., Menzel, R., Milly, P. C. D., Ming, Y., Naik, V., Paynter, D., Paulot, F., Rammaswamy, V., Reichl, B., Robinson, T., Rosati, A., Seman, C., Silvers, L. G., Underwood, S., and Zadeh, N.: Structure and Performance of GFDL's CM4.0 Climate Model, J. Adv. Model. Earth Sy., 11, 3691–3727, https://doi.org/10.1029/2019MS001829, 2019. a, b
Hoesly, R. M., Smith, S. J., Feng, L., Klimont, Z., Janssens-Maenhout, G., Pitkanen, T., Seibert, J. J., Vu, L., Andres, R. J., Bolt, R. M., Bond, T. C., Dawidowski, L., Kholod, N., Kurokawa, J.-I., Li, M., Liu, L., Lu, Z., Moura, M. C. P., O'Rourke, P. R., and Zhang, Q.: Historical (1750–2014) anthropogenic emissions of reactive gases and aerosols from the Community Emissions Data System (CEDS), Geosci. Model Dev., 11, 369–408, https://doi.org/10.5194/gmd-11-369-2018, 2018. a, b, c, d, e
Holben, B., Eck, T., Slutsker, I., Tanré, D., Buis, J., Setzer, A., Vermote, E., Reagan, J., Kaufman, Y., Nakajima, T., Lavenu, F., Jankowiak, I., and Smirnov, A.: AERONET–A Federated Instrument Network and Data Archive for Aerosol Characterization, Remote Sens. Environ., 66, 1–16, https://doi.org/10.1016/S0034-4257(98)00031-5, 1998 (data available at: https://aeronet.gsfc.nasa.gov/data_push/AOT_Level2_Monthly.tar.gz, last access: 13 September 2022). a, b, c
Holben, B. N., Tanré, D., Smirnov, A., Eck, T. F., Slutsker, I., Abuhassan, N., Newcomb, W. W., Schafer, J. S., Chatenet, B., Lavenu, F., Kaufman, Y. J., Castle, J. V., Setzer, A., Markham, B., Clark, D., Frouin, R., Halthore, R., Karneli, A., O'Neill, N. T., Pietras, C., Pinker, R. T., Voss, K., and Zibordi, G.: An emerging ground-based aerosol climatology: Aerosol optical depth from AERONET, J. Geophys. Res., 106, 12067–12097, https://doi.org/10.1029/2001JD900014, 2001. a
Hong, C., Zhang, Q., Zhang, Y., Davis, S. J., Zhang, X., Tong, D., Guan, D., Liu, Z., and He, K.: Weakening aerosol direct radiative effects mitigate climate penalty on Chinese air quality, Nat. Clim. Change, 10, 845–850, https://doi.org/10.1038/s41558-020-0840-y, 2020. a
IMO: MEPC.176(58) Amendments to the Annex of the Protocol of 1997 to amend the International Convention for the Prevention of Pollution from Ships, 1973, as modified by the Protocol of 1978 relating thereto (Revised MARPOL Annex VI), https://wwwcdn.imo.org/localresources/en/OurWork/Environment/Documents/176(58).pdf (last access: 13 September 2022), 2008. a
IMO: Annex 15, Resolution MEPC.321(74) 2019 Guidelines for Port State Control Under MARPOL Annex VI Chapter 3, https://wwwcdn.imo.org/localresources/en/OurWork/Environment/Documents/MEPC.321(74).pdf (last access: 13 September 2022), 2019. a
Jenkins, S., Grainger, R., Povey, A., Gettelman, A., Stier, P., and Allen, M.: Is Anthropogenic Global Warming Accelerating?, J. Climate, 1–43, https://doi.org/10.1175/JCLI-D-22-0081.1, 2022. a, b
Jia, H., Quaas, J., Gryspeerdt, E., Böhm, C., and Sourdeval, O.: Addressing the difficulties in quantifying droplet number response to aerosol from satellite observations, Atmos. Chem. Phys., 22, 7353–7372, https://doi.org/10.5194/acp-22-7353-2022, 2022. a
Jongeward, A. R., Li, Z., He, H., and Xiong, X.: Natural and Anthropogenic Aerosol Trends from Satellite and Surface Observations and Model Simulations over the North Atlantic Ocean from 2002 to 2012, J. Atmos. Sci., 73, 4469–4485, https://doi.org/10.1175/JAS-D-15-0308.1, 2016. a, b
Kanaya, Y., Yamaji, K., Miyakawa, T., Taketani, F., Zhu, C., Choi, Y., Komazaki, Y., Ikeda, K., Kondo, Y., and Klimont, Z.: Rapid reduction in black carbon emissions from China: evidence from 2009–2019 observations on Fukue Island, Japan, Atmos. Chem. Phys., 20, 6339–6356, https://doi.org/10.5194/acp-20-6339-2020, 2020. a
Kaufman, Y. J., Boucher, O., Tanré, D., Chin, M., Remer, L. A., and Takemura, T.: Aerosol anthropogenic component estimated from satellite data, Geophys. Res. Lett., 32, L17804, https://doi.org/10.1029/2005GL023125, 2005. a
Kelley, M., Schmidt, G. A., Nazarenko, L. S., Bauer, S. E., Ruedy, R., Russell, G. L., Ackerman, A. S., Aleinov, I., Bauer, M., Bleck, R., Canuto, V., Cesana, G., Cheng, Y., Clune, T. L., Cook, B. I., Cruz, C. A., Del Genio, A. D., Elsaesser, G. S., Faluvegi, G., Kiang, N. Y., Kim, D., Lacis, A. A., Leboissetier, A., LeGrande, A. N., Lo, K. K., Marshall, J., Matthews, E. E., McDermid, S., Mezuman, K., Miller, R. L., Murray, L. T., Oinas, V., Orbe, C., García-Pando, C. P., Perlwitz, J. P., Puma, M. J., Rind, D., Romanou, A., Shindell, D. T., Sun, S., Tausnev, N., Tsigaridis, K., Tselioudis, G., Weng, E., Wu, J., and Yao, M.-S.: GISS-E2.1: Configurations and Climatology, J. Adv. Model. Earth Sy., 12, e2019MS002025, https://doi.org/10.1029/2019MS002025, 2020. a, b
Kinne, S.: Aerosol radiative effects with MACv2, Atmos. Chem. Phys., 19, 10919–10959, https://doi.org/10.5194/acp-19-10919-2019, 2019. a
Klimont, Z., Smith, S. J., and Cofala, J.: The last decade of global anthropogenic sulfur dioxide: 2000–2011 emissions, Environ. Res. Lett., 8, 014003, https://doi.org/10.1088/1748-9326/8/1/014003, 2013. a
Klimont, Z., Kupiainen, K., Heyes, C., Purohit, P., Cofala, J., Rafaj, P., Borken-Kleefeld, J., and Schöpp, W.: Global anthropogenic emissions of particulate matter including black carbon, Atmos. Chem. Phys., 17, 8681–8723, https://doi.org/10.5194/acp-17-8681-2017, 2017. a, b
Kramer, R. J., He, H., Soden, B. J., Oreopoulos, L., Myhre, G., Forster, P. M., and Smith, C. J.: Observational evidence of increasing global radiative forcing, Geophys. Res. Lett., 48, e2020GL091585, https://doi.org/10.1029/2020GL091585, 2021. a, b, c
Kretzschmar, J., Salzmann, M., Mülmenstädt, J., Boucher, O., and Quaas, J.: Comment on “Rethinking the lower bound on aerosol radiative forcing”, J. Climate, 30, 6579–6584, https://doi.org/10.1175/JCLI-D-16-0668.1, 2017. a
Krüger, O. and Graßl, H.: The indirect aerosol effect over Europe, Geophys. Res. Lett., 29, 1925, https://doi.org/10.1029/2001GL014081, 2002. a
Lelieveld, J., Evans, J. S., Fnais, M., Giannadaki, D., and Pozzer, A.: The contribution of outdoor air pollution sources to premature mortality on a global scale, Nature, 525, 367–371, https://doi.org/10.1038/nature15371, 2015. a
Levy, R., Hsu, C., Sayer, A., Mattoo, S., and Lee, J.: MODIS Atmosphere L2 Aerosol Product, NASA MODIS Adaptive Processing System, Goddard Space Flight Center, https://doi.org/10.5067/MODIS/MOD04_L2.061, 2017a. a
Levy, R., Hsu, C., Sayer, A., Mattoo, S., and Lee, J.: MODIS Atmosphere L2 Aerosol Product, NASA MODIS Adaptive Processing System, Goddard Space Flight Center, https://doi.org/10.5067/MODIS/MYD04_L2.061, 2017b. a
Levy, R. C., Mattoo, S., Munchak, L. A., Remer, L. A., Sayer, A. M., Patadia, F., and Hsu, N. C.: The Collection 6 MODIS aerosol products over land and ocean, Atmos. Meas. Tech., 6, 2989–3034, https://doi.org/10.5194/amt-6-2989-2013, 2013. a, b, c
Li, J., Carlson, B. E., Dubovik, O., and Lacis, A. A.: Recent trends in aerosol optical properties derived from AERONET measurements, Atmos. Chem. Phys., 14, 12271–12289, https://doi.org/10.5194/acp-14-12271-2014, 2014. a, b, c
Loeb, N. G., Doelling, D. R., Wang, H., Su, W., Nguyen, C., Corbett, J. G., Liang, L., Mitrescu, C., Rose, F. G., and Kato, S.: Clouds and the Earth’s Radiant Energy System (CERES) Energy Balanced and Filled (EBAF) Top-of-Atmosphere (TOA) Edition-4.0 Data Product, J. Climate, 31, 895–918, https://doi.org/10.1175/JCLI-D-17-0208.1, 2018a (data available at: https://ceres.larc.nasa.gov/data/, last access: 13 September 2022). a, b
Loeb, N. G., Thorsen, T. J., Norris, J. R., Wang, H., and Su, W.: Changes in Earth’s energy budget during and after the “Pause” in global warming: An observational perspective, Climate, 6, 63, https://doi.org/10.3390/cli6030062, 2018b. a
Loeb, N. G., Johnson, G. C., Thorsen, T. J., Lyman, J. M., Rose, F. G., and Kato, S.: Satellite and ocean data reveal marked increase in Earth’s heating rate, Geophys. Res. Lett., 48, e2021GL093047, https://doi.org/10.1029/2021GL093047, 2021a. a, b, c
Loeb, N. G., Su, W., Bellouin, N., and Ming, Y.: Changes in Clear-Sky Shortwave Aerosol Direct Radiative Effects Since 2002, J. Geophys. Res., 126, e2020JD034090, https://doi.org/10.1029/2020JD034090, 2021b. a
Ma, X., Jia, H., Yu, F., and Quaas, J.: Opposite aerosol index-cloud droplet effective radius correlations over major industrial regions and their adjacent oceans, Geophys. Res. Lett., 45, 5771–5778, https://doi.org/10.1029/2018GL077562, 2018. a
Ma, Z., Liu, R., Liu, Y., and Bi, J.: Effects of air pollution control policies on PM2.5 pollution improvement in China from 2005 to 2017: a satellite-based perspective, Atmos. Chem. Phys., 19, 6861–6877, https://doi.org/10.5194/acp-19-6861-2019, 2019. a
Malavelle, F. F., Haywood, J. M., Jones, A., Gettelman, A., Clarisse, L., Bauduin, S., Allan, R. P., Karset, I. H. H., Kristjánsson, J. E., Oreopoulos, L., Cho, N., Lee, D., Bellouin, N., Boucher, O., Grosvenor, D. P., Carslaw, K. S., Dhomse, S., Mann, G. W., Schmidt, A., Coe, H., Hartley, M. E., Dalvi, M., Hill, A. A., Johnson, B. T., Johnson, C. E., Knight, J. R., O'Connor, F. M., Partridge, D. G., Stier, P., Myhre, G., Platnick, S., Stephens, G. L., Takahashi, H., and Thordarson, T.: Strong constraints on aerosol-cloud interactions from volcanic eruptions, Nature, 546, 485–491, https://doi.org/10.1038/nature22974, 2017. a, b
Manara, V., Brunetti, M., Celozzi, A., Maugeri, M., Sanchez-Lorenzo, A., and Wild, M.: Detection of dimming/brightening in Italy from homogenized all-sky and clear-sky surface solar radiation records and underlying causes (1959–2013), Atmos. Chem. Phys., 16, 11145–11161, https://doi.org/10.5194/acp-16-11145-2016, 2016. a
McCoy, D. T., Bender, F. A.-M., Grosvenor, D. P., Mohrmann, J. K., Hartmann, D. L., Wood, R., and Field, P. R.: Predicting decadal trends in cloud droplet number concentration using reanalysis and satellite data, Atmos. Chem. Phys., 18, 2035–2047, https://doi.org/10.5194/acp-18-2035-2018, 2018. a
McKenna, C., Maycock, A., Forster, P., Smith, C. J., and Tokarska, K. B.: Stringent mitigation substantially reduces risk of unprecedented near-term warming rates, Nat. Clim. Change, 11, 126–131, https://doi.org/10.1038/s41558-020-00957-9, 2021. a
Mortier, A., Gliß, J., Schulz, M., Aas, W., Andrews, E., Bian, H., Chin, M., Ginoux, P., Hand, J., Holben, B., Zhang, H., Kipling, Z., Kirkevåg, A., Laj, P., Lurton, T., Myhre, G., Neubauer, D., Olivié, D., von Salzen, K., Skeie, R. B., Takemura, T., and Tilmes, S.: Evaluation of climate model aerosol trends with ground-based observations over the last 2 decades – an AeroCom and CMIP6 analysis, Atmos. Chem. Phys., 20, 13355–13378, https://doi.org/10.5194/acp-20-13355-2020, 2020. a, b
Mülmenstädt, J. and Feingold, G.: The Radiative Forcing of Aerosol–Cloud Interactions in Liquid Clouds: Wrestling and Embracing Uncertainty, Curr. Clim. Change Rep., 4, 23–40, https://doi.org/10.1007/s40641-018-0089-y, 2018. a
Murray-Watson, R. J. and Gryspeerdt, E.: Stability-dependent increases in liquid water with droplet number in the Arctic, Atmos. Chem. Phys., 22, 5743–5756, https://doi.org/10.5194/acp-22-5743-2022, 2022. a
Myhre, G., Boucher, O., Bréon, F. M., Forster, P., and Shindell, D.: Declining uncertainty in transient climate response as CO2 forcing dominates future climate change, Nat. Geosci., 8, 181–185, https://doi.org/10.1038/ngeo2371, 2015. a
Myhre, G., Aas, W., Cherian, R., Collins, W., Faluvegi, G., Flanner, M., Forster, P., Hodnebrog, Ø., Klimont, Z., Lund, M. T., Mülmenstädt, J., Lund Myhre, C., Olivié, D., Prather, M., Quaas, J., Samset, B. H., Schnell, J. L., Schulz, M., Shindell, D., Skeie, R. B., Takemura, T., and Tsyro, S.: Multi-model simulations of aerosol and ozone radiative forcing due to anthropogenic emission changes during the period 1990–2015, Atmos. Chem. Phys., 17, 2709–2720, https://doi.org/10.5194/acp-17-2709-2017, 2017. a
Norris, J. R., Allen, R. J., Evan, A. T., Zelinka, M. D., O'Dell, C. W., and Klein, S. A.: Evidence for climate change in the satellite cloud record, Nature, 536, 72–75, https://doi.org/10.1038/nature18273, 2016. a, b, c, d, e
O'Rourke, P., Smith, S. J., Mott, A. R., Ahsan, H., Mcduffie, E. E., Crippa, M., Klimont, Z., Mcdonald, B., Wang, S., Nicholson, M. B., Hoesly, R. M., and Feng, L.: CEDS v_2021_04_21 Gridded emissions data, PNNL DataHub, https://doi.org/10.25584/PNNLDataHub/1779095, 2021. a
Palmer, M.: Reconciling Estimates of Ocean Heating and Earth's Radiation Budget, Curr. Clim. Change Rep., 3, 78–86, https://doi.org/10.1007/s40641-016-0053-7, 2017. a
Paulot, F., Paynter, D., Ginoux, P., Naik, V., and Horowitz, L. W.: Changes in the aerosol direct radiative forcing from 2001 to 2015: observational constraints and regional mechanisms, Atmos. Chem. Phys., 18, 13265–13281, https://doi.org/10.5194/acp-18-13265-2018, 2018. a, b, c, d
Pfeifroth, U., Sanchez‐Lorenzo, A., Manara, V., Trentmann, J., and Hollmann, R.: Trends and variability of surface solar radiation in Europe based on surface‐ and satellite‐based data records, J. Geophys. Res., 123, 1735–1754, https://doi.org/10.1002/2017JD027418, 2018. a
Pincus, R., Forster, P. M., and Stevens, B.: The Radiative Forcing Model Intercomparison Project (RFMIP): experimental protocol for CMIP6, Geosci. Model Dev., 9, 3447–3460, https://doi.org/10.5194/gmd-9-3447-2016, 2016. a, b
Platnick, S., Ackerman, S., King, M., Wind, G., Meyer, K., Menzel, P., Frey, R., Holz, R., Baum, B., and Yang, P.: MODIS atmosphere L2 cloud product (06_L2), NASA MODIS Adaptive Processing System, Goddard Space Flight Center, https://doi.org/10.5067/MODIS/MOD06_L2.006, 2015a. a
Platnick, S., Ackerman, S., King, M., Wind, G., Meyer, K., Menzel, P., Frey, R., Holz, R., Baum, B., and Yang, P.: MODIS atmosphere L2 cloud product (06_L2), NASA MODIS Adaptive Processing System, Goddard Space Flight Center, https://doi.org/10.5067/MODIS/MYD06_L2.006, 2015b. a
Platnick, S., Meyer, K. G., King, M. D., Wind, G., Amarasinghe, N., Marchant, B., Arnold, G. T., Zhang, Z., Hubanks, P. A., Holz, R. E., Yang, P., Ridgway, W. L., and Riedi, J.: The MODIS Cloud Optical and Microphysical Products: Collection 6 Updates and Examples From Terra and Aqua, IEEE T. Geosci. Remote, 55, 502–525, https://doi.org/10.1109/TGRS.2016.2610522, 2017. a, b
Quaas, J., Boucher, O., and Lohmann, U.: Constraining the total aerosol indirect effect in the LMDZ and ECHAM4 GCMs using MODIS satellite data, Atmos. Chem. Phys., 6, 947–955, https://doi.org/10.5194/acp-6-947-2006, 2006. a
Quaas, J., Arola, A., Cairns, B., Christensen, M., Deneke, H., Ekman, A. M. L., Feingold, G., Fridlind, A., Gryspeerdt, E., Hasekamp, O., Li, Z., Lipponen, A., Ma, P.-L., Mülmenstädt, J., Nenes, A., Penner, J. E., Rosenfeld, D., Schrödner, R., Sinclair, K., Sourdeval, O., Stier, P., Tesche, M., van Diedenhoven, B., and Wendisch, M.: Constraining the Twomey effect from satellite observations: issues and perspectives, Atmos. Chem. Phys., 20, 15079–15099, https://doi.org/10.5194/acp-20-15079-2020, 2020. a, b
Raghuraman, S., Paynter, D., and Ramaswamy, V.: Anthropogenic forcing and response yield observed positive trend in Earth’s energy imbalance, Nat. Commun., 12, 4577, https://doi.org/10.1038/s41467-021-24544-4, 2021. a, b, c
Rosenfeld, D., Zhu, Y., Wang, M., Zheng, Y., Goren, T., and Yu, S.: Aerosol-driven droplet concentrations dominate coverage and water of oceanic low-level clouds, Science, 364, eaay4194, https://doi.org/10.1126/science.aay4194, 2019. a, b
Rotstayn, L. D., Collier, M. A., Shindell, D. T., and Boucher, O.: Why does aerosol forcing control historical global-mean surface temperature change in CMIP5 models?, J. Climate, 28, 6608–6625, https://doi.org/10.1175/JCLI-D-14-00712.1, 2015. a
Santer, B. D., Thorne, P. W., Haimberger, L., Taylor, K. E., Wigley, T. M. L., Lanzante, J. R., Solomon, S., Free, M., Gleckler, P. J., Jones, P. D., Karl, T. R., Klein, S. A., Mears, C., Nychka, D., Schmidt, G. A., Sherwood, S. C., and Wentz, F. J.: Consistency of modelled and observed temperature trends in the tropical troposphere, Int. J. Climatol., 28, 1703–1722, https://doi.org/10.1002/joc.1756, 2008. a
Samset, B. H., Lund, M. T., Bollasina, M., Myhre, G., and Wilcox, L.: Emerging Asian aerosol patterns, Nat. Geosci., 12, 582–584, https://doi.org/10.1038/s41561-019-0424-5, 2019. a
Seland, Ø., Bentsen, M., Olivié, D., Toniazzo, T., Gjermundsen, A., Graff, L. S., Debernard, J. B., Gupta, A. K., He, Y.-C., Kirkevåg, A., Schwinger, J., Tjiputra, J., Aas, K. S., Bethke, I., Fan, Y., Griesfeller, J., Grini, A., Guo, C., Ilicak, M., Karset, I. H. H., Landgren, O., Liakka, J., Moseid, K. O., Nummelin, A., Spensberger, C., Tang, H., Zhang, Z., Heinze, C., Iversen, T., and Schulz, M.: Overview of the Norwegian Earth System Model (NorESM2) and key climate response of CMIP6 DECK, historical, and scenario simulations, Geosci. Model Dev., 13, 6165–6200, https://doi.org/10.5194/gmd-13-6165-2020, 2020. a, b
Sherwood, S., Webb, M. J., Annan, J. D., Armour, K., Forster, P. M., Hargreaves, J. C., Hegerl, G., Klein, S. A., Marvel, K. D., Rohling, E. J., Watanabe, M., Andrews, T., Braconnot, P., Bretherton, C. S., Foster, G. L., Hausfather, Z., von der Heydt, A. S., Knutti, R., Mauritsen, T., Norris, J. R., Proistosescu, C., Rugenstein, M., Schmidt, G. A., Tokarska, K. B., and Zelinka, M. D.: An assessment of Earth's climate sensitivity using multiple lines of evidence, Rev. Geophys., 58, e2019RG000678, https://doi.org/10.1029/2019RG000678, 2020. a
Shindell, D. and Smith, C.: Climate and air-quality benefits of a realistic phase-out of fossil fuels, Nature, 573, 408–411, https://doi.org/10.1038/s41586-019-1554-z, 2019. a
Sickles II, J. E. and Shadwick, D. S.: Air quality and atmospheric deposition in the eastern US: 20 years of change, Atmos. Chem. Phys., 15, 173–197, https://doi.org/10.5194/acp-15-173-2015, 2015. a
Smith, C. J. and Forster, P. M.: Suppressed late-20th Century warming in CMIP6 models explained by forcing and feedbacks, Geophys. Res. Lett., 48, e2021GL094948, https://doi.org/10.1029/2021GL094948, 2021. a
Smith, C., Hall, B., Dentener, F., Ahn, J., Collins, W., William, Jones, C., Meinshausen, M., Dlugokencky, E., Keeling, R., Krummel, P., Mühle, J., Nicholls, Z., and Simpson, I.: IPCC Working Group 1 (WG1) Sixth Assessment Report (AR6) Annex III Extended Data, Zenodo, https://doi.org/10.5281/zenodo.5705390, 2021. a
Smith, C. J., Harris, G. R., Palmer, M. D., Bellouin, N., Collins, W., Myhre, G., Schulz, M., Golaz, J.-C., Ringer, M., Storelvmo, T., and Forster, P. M.: Energy budget constraints on the time history of aerosol forcing and climate sensitivity, J. Geophys. Res.-Atmos., 126. e2020JD033622, https://doi.org/10.1029/2020JD033622, 2021a. a, b, c, d, e
Smith, M., Cain, M., and Allen, M.: Further improvement of warming-equivalent emissions calculation, npj Clim. Atmos. Sci., 4, 19, https://doi.org/10.1038/s41612-021-00169-8, 2021b. a
Smith, S. J., van Aardenne, J., Klimont, Z., Andres, R. J., Volke, A., and Delgado Arias, S.: Anthropogenic sulfur dioxide emissions: 1850–2005, Atmos. Chem. Phys., 11, 1101–1116, https://doi.org/10.5194/acp-11-1101-2011, 2011. a
Sogacheva, L., de Leeuw, G., Rodriguez, E., Kolmonen, P., Georgoulias, A. K., Alexandri, G., Kourtidis, K., Proestakis, E., Marinou, E., Amiridis, V., Xue, Y., and van der A, R. J.: Spatial and seasonal variations of aerosols over China from two decades of multi-satellite observations – Part 1: ATSR (1995–2011) and MODIS C6.1 (2000–2017), Atmos. Chem. Phys., 18, 11389–11407, https://doi.org/10.5194/acp-18-11389-2018, 2018. a
Solomon, S., Plattner, G.-K., Knutti, R., and Friedlingstein, P.: Irreversible climate change due to carbon dioxide emissions, P. Natl. Acad. Sci. USA, 106, 1704–1709, https://doi.org/10.1073/pnas.0812721106, 2009. a
Stevens, B.: Rethinking the Lower Bound on Aerosol Radiative Forcing, J. Climate, 28, 4794–4819, https://doi.org/10.1175/JCLI-D-14-00656.1, 2015. a, b
Stier, P., Feichter, J., Roeckner, E., Kloster, S., and Esch, M.: The evolution of the global aerosol system in a transient climate simulation from 1860 to 2100, Atmos. Chem. Phys., 6, 3059–3076, https://doi.org/10.5194/acp-6-3059-2006, 2006. a
Stjern, C. W., Stohl, A., and Kristjánsson, J. E.: Have aerosols affected trends in visibility and precipitation in Europe?, J. Geophys. Res., 116, D02212, https://doi.org/10.1029/2010JD014603, 2011. a, b
Streets, D. G., Yan, F., Chin, M., Diehl, T., Mahowald, N., Schultz, M., Wild, M., Wu, Y., and Yu, C.: Anthropogenic and natural contributions to regional trends in aerosol optical depth, 1980–2006, J. Geophys. Res., 114, D00D18, https://doi.org/10.1029/2008JD011624, 2009. a
Struthers, H., Ekman, A. M. L., Glantz, P., Iversen, T., Kirkevåg, A., Seland, O., Martensson, E. M., Noone, K., and Nilsson, E. D.: Climate-induced changes in sea salt aerosol number emissions: 1870 to 2100, J. Geophys. Res., 118, 670–682, https://doi.org/10.1002/jgrd.50129, 2013. a
Swart, N. C., Cole, J. N. S., Kharin, V. V., Lazare, M., Scinocca, J. F., Gillett, N. P., Anstey, J., Arora, V., Christian, J. R., Hanna, S., Jiao, Y., Lee, W. G., Majaess, F., Saenko, O. A., Seiler, C., Seinen, C., Shao, A., Sigmond, M., Solheim, L., von Salzen, K., Yang, D., and Winter, B.: The Canadian Earth System Model version 5 (CanESM5.0.3), Geosci. Model Dev., 12, 4823–4873, https://doi.org/10.5194/gmd-12-4823-2019, 2019. a, b
Szopa, S., Naik, V., Adhikary, B., Artaxo, P., Berntsen, T., Collins, W., Fuzzi, S., Gallardo, L., Scharr, A. K., Klimont, Z., Liao, H., Unger, N., and Zanis, P.: Short-Lived Climate Forcers, in: Climate Change 2021: The Physical Science Basis. Contribution of Working Group I to the Sixth Assessment Report of the Intergovernmental Panel on Climate Change, edited by: Masson-Delmotte, V., Zhai, P., Pirani, A., Connors, S., Péan, C., Berger, S., Caud, N., Chen, Y., Goldfarb, L., Gomis, M., Huang, M., Leitzell, K., Lonnoy, E., Matthews, J., Maycock, T., Waterfield, T., Yelekçi, O., Yu, R., and Zhou, B., chap. 6, Cambridge University Press, Cambridge, UK New York, NY, USA, 817–922, 2021. a, b, c
Toll, V., Christensen, M., Quaas, J., and Bellouin, N.: Weak average liquid-cloud-water response to anthropogenic aerosols, Nature, 572, 51–55, https://doi.org/10.1038/s41586-019-1423-9, 2019. a, b
Tørseth, K., Aas, W., Breivik, K., Fjæraa, A. M., Fiebig, M., Hjellbrekke, A. G., Lund Myhre, C., Solberg, S., and Yttri, K. E.: Introduction to the European Monitoring and Evaluation Programme (EMEP) and observed atmospheric composition change during 1972–2009, Atmos. Chem. Phys., 12, 5447–5481, https://doi.org/10.5194/acp-12-5447-2012, 2012. a
Twomey, S.: Pollution and the planetary albedo, Atmos. Environ., 8, 1251–1256, https://doi.org/10.1016/0004-6981(74)90004-3, 1974. a
van Marle, M. J. E., Kloster, S., Magi, B. I., Marlon, J. R., Daniau, A.-L., Field, R. D., Arneth, A., Forrest, M., Hantson, S., Kehrwald, N. M., Knorr, W., Lasslop, G., Li, F., Mangeon, S., Yue, C., Kaiser, J. W., and van der Werf, G. R.: Historic global biomass burning emissions for CMIP6 (BB4CMIP) based on merging satellite observations with proxies and fire models (1750–2015), Geosci. Model Dev., 10, 3329–3357, https://doi.org/10.5194/gmd-10-3329-2017, 2017. a
van Oldenborgh, G. J., Krikken, F., Lewis, S., Leach, N. J., Lehner, F., Saunders, K. R., van Weele, M., Haustein, K., Li, S., Wallom, D., Sparrow, S., Arrighi, J., Singh, R. K., van Aalst, M. K., Philip, S. Y., Vautard, R., and Otto, F. E. L.: Attribution of the Australian bushfire risk to anthropogenic climate change, Nat. Hazards Earth Syst. Sci., 21, 941–960, https://doi.org/10.5194/nhess-21-941-2021, 2021. a
Vestreng, V., Myhre, G., Fagerli, H., Reis, S., and Tarrasón, L.: Twenty-five years of continuous sulphur dioxide emission reduction in Europe, Atmos. Chem. Phys., 7, 3663–3681, https://doi.org/10.5194/acp-7-3663-2007, 2007. a
von Schuckmann, K., Palmer, M., Trenberth, K., Cazenave, A., Chambers, D., Champollion, N., Hansen, J., Josey, S. A., Loeb, N., Mathieu, P.-P., Meyssignac, B., and Wild, M.: An imperative to monitor Earth's energy imbalance, Nat. Clim. Change, 6, 138–144, https://doi.org/10.1038/nclimate2876, 2016. a
Wang, Y., Trentmann, J., Pfeifroth, U., Yuan, W., and Wild, M.: Improvement of Air Pollution in China Inferred from Changes between Satellite-Based and Measured Surface Solar Radiation, Remote Sens., 11, 2910, https://doi.org/10.3390/rs11242910, 2019. a
Wang, Z., Lin, L., Xu, Y., Che, H., Zhang, X., Zhang, H., Dong, W., Wang, C., Gui, K., and Xie, B.: Incorrect Asian aerosols affecting the attribution and projection of regional climate change in CMIP6 models, npj Clim. Atmos. Sci., 4, 2, https://doi.org/10.1038/s41612-020-00159-2, 2021. a, b, c
Wei, J., Peng, Y., Mahmood, R., Sun, L., and Guo, J.: Intercomparison in spatial distributions and temporal trends derived from multi-source satellite aerosol products, Atmos. Chem. Phys., 19, 7183–7207, https://doi.org/10.5194/acp-19-7183-2019, 2019. a, b
Wild, M.: Global dimming and brightening: A review, J. Geophys. Res., 114, D00D16, https://doi.org/10.1029/2008JD011470, 2009. a
Wild, M.: Enlightening Global Dimming and Brightening, B. Am. Meteor. Soc., 93, 27–37, 2012. a
Wild, M., Wacker, S., Yang, S., and Sanchez-Lorenzo, A.: Evidence for clear-sky dimming and brightening in central Europe, Geophys. Res. Lett., 48, e2020GL092216, https://doi.org/10.1029/2020GL092216, 2021. a
Yang, S., Wang, X., and Wild, M.: Causes of Dimming and Brightening in China Inferred from Homogenized Daily Clear-Sky and All-Sky in situ Surface Solar Radiation Records (1958–2016), J. Climate, 32, 5901–5913, https://doi.org/10.1175/JCLI-D-18-0666.1, 2019. a
Yli-Juuti, T., Mielonen, T., Heikkinen, L., Arola, A., Ehn, M., Isokääntä, S., Keskinen, H.-M., Kulmala, M., Laakso, A., Lipponen, A., Luoma, K., Mikkonen, S., Nieminen, T., Paasonen, P., Petäjä, T., Romakkaniemi, S., Tonttila, J., Kokkola, H., and Virtanen, A.: Significance of the organic aerosol driven climate feedback in the boreal area, Nat. Commun., 12, 5637, https://doi.org/10.1038/s41467-021-25850-7, 2021. a
Yu, H., Yang, Y., Wang, H., Tan, Q., Chin, M., Levy, R. C., Remer, L. A., Smith, S. J., Yuan, T., and Shi, Y.: Interannual variability and trends of combustion aerosol and dust in major continental outflows revealed by MODIS retrievals and CAM5 simulations during 2003–2017, Atmos. Chem. Phys., 20, 139–161, https://doi.org/10.5194/acp-20-139-2020, 2020. a
Zhang, J., Zhou, X., Goren, T., and Feingold, G.: Albedo susceptibility of northeastern Pacific stratocumulus: the role of covarying meteorological conditions, Atmos. Chem. Phys., 22, 861–880, https://doi.org/10.5194/acp-22-861-2022, 2022. a
Zhao, B., Jiang, J. H., Gu, Y., Diner, D., Worden, J., Liou, K.-N., Su, H., Xing, J., Garay, M., and Huang, L.: Decadal-scale trends in regional aerosol particle properties and their linkage to emission changes, Environ. Res. Lett., 12, 054021, https://doi.org/10.1088/1748-9326/aa6cb2, 2017. a
Zheng, B., Tong, D., Li, M., Liu, F., Hong, C., Geng, G., Li, H., Li, X., Peng, L., Qi, J., Yan, L., Zhang, Y., Zhao, H., Zheng, Y., He, K., and Zhang, Q.: Trends in China's anthropogenic emissions since 2010 as the consequence of clean air actions, Atmos. Chem. Phys., 18, 14095–14111, https://doi.org/10.5194/acp-18-14095-2018, 2018. a, b
Zhou, C., Zelinka, M. D., and Klein, S. A.: Impact of decadal cloud variations on the Earth’s energy budget, Nat. Geosci., 9, 871–874, 2016. a
Zhou, X., Zhang, J., and Feingold, G.: On the Importance of Sea Surface Temperature for Aerosol-Induced Brightening of Marine Clouds and Implications for Cloud Feedback in a Future Warmer Climate, Geophys. Res. Lett., 48, e2021GL095896, https://doi.org/10.1029/2021GL095896, 2021. a
- Abstract
- Introduction
- Changes in aerosol emissions
- Changes in aerosol abundance
- Changes in cloud properties
- Changes in radiation
- Ocean heat uptake and surface temperatures as constraints for the simulated ERFaer evolution
- Discussion and conclusions
- Data availability
- Author contributions
- Competing interests
- Disclaimer
- Acknowledgements
- Financial support
- Review statement
- References
- Supplement