the Creative Commons Attribution 4.0 License.
the Creative Commons Attribution 4.0 License.
 | 13 Sep 2022
Impacts of condensable particulate matter on atmospheric organic aerosols and fine particulate matter (PM2.5) in China
Mengying Li
Xue Chen
Zhen Li
Yibo Zhang
Zhe Song
Weiping Liu
Pengfei Li
Xiaoye Zhang
Meigen Zhang
Zirui Liu
Caiping Sun
Jingkun Jiang
Shuxiao Wang
Benjamin N. Murphy
Kiran Alapaty
Rohit Mathur
Daniel Rosenfeld
John H. Seinfeld
Condensable particulate matter (CPM) emitted from stationary combustion and mobile sources exhibits high emissions and a large proportion of organic components. However, CPM is not generally measured when conducting emission surveys of PM in most countries, including China. Consequently, previous emission inventories have not included emission rates for CPM. Here, we construct an emission inventory of CPM in China with a focus on organic aerosols (OAs) based on collected CPM emission information. Results show that OA emissions are enhanced twofold after the inclusion of CPM in a new inventory for China for the years 2014 and 2017. Considering organic CPM emissions and model representations of secondary OA (SOA) formation from CPM, a series of sensitivity cases have been simulated here using the three-dimensional Community Multiscale Air Quality (CMAQ) model to estimate the contributions of CPM emissions to atmospheric OA and fine PM (PM2.5, particulate matter with aerodynamic diameter not exceeding 2.5 µm) concentrations in China. Compared with observations at a Beijing site during a haze episode from 14 October to 14 November 2014, estimates of the temporal average primary OA (POA) and SOA concentrations were greatly improved after including the CPM effects. These scenarios demonstrated the significant contributions of CPM emissions from stationary combustion and mobile sources to the POA (51 %–85 %), SOA (42 %–58 %), and total OA concentrations (45 %–75 %). Furthermore, the contributions of CPM emissions to total OA concentrations were demonstrated over the 2 major cities and 26 other cities of the Beijing–Tianjin–Hebei region (hereafter referred to as the “BTH2 + 26 cities”) in December 2018, with average contributions of up to 49 %, 53 %, 54 %, and 50 % for Handan, Shijiazhuang, Xingtai, and Dezhou, respectively. Correspondingly, the inclusion of CPM emissions also narrowed the gap between simulated and observed PM2.5 concentrations over the BTH2 + 26 cities. These results improve the simulation performance of atmospheric OA and PM2.5 and may also provide important implications for the sources of OA.
- Article
(5583 KB) - Full-text XML
-
Supplement
(1114 KB) - BibTeX
- EndNote


Atmospheric fine particulate matter (PM2.5, particulate matter with aerodynamic diameter not exceeding 2.5 µm) is a serious and recurring air quality problem. Although the annual average concentration of PM2.5 in China has declined in recent years, it still exceeds standards promulgated by the World Health Organization (WHO) air quality guidelines (Lin et al., 2018). Heavy-haze episodes occur frequently in winter, especially in the eastern regions of China (Li et al., 2015; Chen et al., 2019; H. Li et al., 2017). Despite large reductions in primary emissions during the COVID-19 lockdown, several periods of heavy haze continued to occur in eastern China (Huang et al., 2021; L. Wang et al., 2020, 2021). Organic aerosols (OAs) contribute a large fraction to PM2.5 worldwide, ranging from 20 % to 90 % (Carlton et al., 2009; Kanakidou et al., 2005), with a negative radiative forcing and adverse impacts on air quality and human health (Gehring et al., 2013; Pope et al., 2002). Primary OA (POA) comes from a variety of sources, including fossil fuels and biomass burning. Secondary OA (SOA), in contrast, is generated through the photochemical oxidation of volatile organic compounds (VOCs) followed by gas–particle partitioning of low-volatility organic compounds into the aerosol phase (Fuzzi et al., 2006; Kroll and Seinfeld, 2008). In the literature, the significant contributions of OA to PM2.5 and of SOA to OA have been demonstrated in many observational results (He et al., 2020; Veld et al., 2021; Zhang et al., 2017). For example, Huang et al. (2014) explored the role of OA in PM2.5 during a severe haze episode in Beijing, Shanghai, Xi'an, and Guangzhou, showing the substantial contribution of OA to PM2.5 (30 %–50 %) as well as the fact that SOA accounted for 30 %–77 % of OA. Sun et al. (2015) showed that OA constituted up to 65 % of submicron aerosols in Beijing during winter, with 38 % being SOA.
With respect to the chemical schemes of SOA formation, a two-product model (Odum et al., 1996) was first proposed based on absorptive partitioning theory (Pankow, 1994) and chamber data. To address the underestimation in the early two-product model (Fu et al., 2012; Gao et al., 2016), the volatility basis set (VBS) framework was developed (Donahue et al., 2006). In this VBS scheme, semi-volatile and intermediate-volatility organic compounds (S/IVOCs) were classified by their volatilities based on absorptive partitioning theory (Robinson et al., 2007). A large portion of SVOCs are emitted as POA and then evaporate under ambient conditions due to gas–particle partitioning, whereas IVOC species exist in the form of organic vapor under various atmospheric conditions in the absence of photochemical reactions (Shrivastava et al., 2011). To date, the VBS mechanism has been incorporated into many global- and regional-scale models (Lane et al., 2008; Murphy and Pandis, 2009; Shrivastava et al., 2008; Han et al., 2016). The two-dimensional VBS scheme was put forward to improve the accuracy of fragmentation processes and OA oxidation (Donahue et al., 2011; Zhao et al., 2016). Despite advances in SOA formation mechanisms, a gap exists between the observed and modeled results due to uncertainties in the parameterization of SOA yields, a lack of localized parameters, and incomplete information on emission rates and properties of SOA precursors. Thus, recent studies have begun to focus on the important effects of emissions, including traditional precursors (VOCs) and S/IVOCs. For example, Zhao et al. (2017) found that IVOC emissions, which were 1.5–30 times those of POA emissions, contributed largely to OA concentrations over the Beijing–Tianjin–Hebei (BTH) region. Wu et al. (2019) constructed an inventory of S/IVOCs for the Pearl River Delta (PRD) region in China and conducted a simulation using the Weather Research and Forecasting model with Chemistry (WRF-Chem) that led to an increase of 161 % in SOA predictions. Emissions of S/IVOCs from mobile sources and IVOCs from volatile chemical products were also parameterized in models to represent SOA formation (Jathar et al., 2017; Lu et al., 2020; Pennington et al., 2021). Although the significant role of potential emission sources in OA formation has been demonstrated, the underestimation of SOA by current air quality models has not been completely resolved.
Stationary combustion sources are one of the major emission sources of PM2.5, including power plants and factories. Moreover, sampling temperatures and dilution rates are key factors for the accurate measurement of organic matter (Morino et al., 2018). The total primary PM emitted from stationary sources is composed of filterable PM (FPM) and condensable PM (CPM). FPM exists in the liquid or solid phases, whereas CPM is in the gas phase in flue (Corio and Sherwell, 2000; Feng et al., 2018). CPM is defined by the U.S. Environmental Protection Agency (U.S. EPA, 2017) as particles that are gaseous at flue gas temperature but condense or react in the ambient air to form solid or liquid PM through dilution and cooling immediately after discharge. Due to the ultralow emission standards implemented by coal-fired power plants (<10 mg Nm−3) in China since 2014, FPM emissions have been substantially reduced (even below 5 mg Nm−3) (Tang et al., 2019), making the remaining emissions of CPM an important issue.
The Ministry of Science and Technology of China issued a National Key R&D Project on the causes and controls of air pollution in 2016, and the project documentation outlines the key technologies for controlling CPM emissions (http://www.acca21.org.cn/zdy_cms/siteResources/DisasterReduction/resources/otherfiles/20160425/f15345793.pdf, last access: 10 March 2022). Existing measurement studies on emission characteristics and the chemical composition of CPM have exhibited non-negligible emissions. For example, Yang et al. (2014, 2018a, b) conducted investigations on different types of industrial boilers and power plants, and they concluded that CPM constituted 25.7 %–96.5 % of PM2.5. For an ultralow-emission coal-fired power plant, J. Li et al. (2017b) reported that the emission concentrations of CPM accounted for 83 % of the PM2.5. Wang et al. (2018) calculated the average emission factors of CPM from two stacks in a waste incineration power plant to be 0.201 and 0.178 g kg−1, which were 22.0 and 31.2 times higher than the corresponding values for FPM, respectively. Wu et al. (2020) found that FPM emissions from four typical coal-fired power plants met Chinese ultralow emission standards, whereas CPM showed high levels (even above 10 mg Nm−3). CPM includes organic and inorganic components, known as organic CPM and inorganic CPM, respectively. The contributions of the organic fractions varied from 13.6 % to 80.5 %, depending on the different fuel types, test methods, and operating conditions (Lu et al., 2019; Song et al., 2020; Yang et al., 2021, 2018b). Furthermore, many studies have confirmed that CPM contains more than 50 % organic components (J. Li et al., 2017b, c; Song et al., 2020; Wu et al., 2020), revealing that the large proportion of organic matter in CPM needs to be taken into account. The aforementioned studies provided valuable basic information on CPM emission characteristics for data references in this study, as summarized in Table S3. It is likely that the inorganic fractions of CPM make a contribution to the water-soluble ions in PM2.5 and that the organic components contribute to the organic matter in PM2.5. In addition, the large amounts of semi-volatile and intermediate-volatility organic compounds in CPM can be important precursors for SOA formation.
Current measurement methods for PM in stationary exhaust sources in China (GB/T 16157–1996) have not involved the collection of CPM; thus, the chemical composition of the collected PM has been quite different from that actually released into the atmosphere (Hu et al., 2016). Moreover, the emission inventory constructed based on emission surveys has not included the CPM emissions. Hence, it is important to introduce CPM emissions to the current emission inventory. For example, a European study improved OA simulations by including the CPM emissions from residential wood combustion sources (Denier van der Gon et al., 2015). Morino et al. (2018) revised the emission inventory via the consideration of CPM in Japan and showed that the OA emission rates were up to 7 times higher following the amendment and that CPM contributed greatly to atmospheric OA concentrations. A shortcoming of that study was that it did not separate the effects of CPM emissions on POA and SOA concentrations. Moreover, studies still lack the quantification of emissions of CPM released by stationary combustion sources in China.
In this study, we used the available CPM emission information to construct an emission inventory of CPM from stationary combustion and mobile sources in China (with a focus on OA) and conducted 15 sensitivity simulations to explore the contributions of CPM emissions to atmospheric OA and PM2.5 concentrations during winter haze episodes over China. This quantitative study on organic CPM emissions and the roles of CPM in OA formation emphasizes the importance of constraining CPM emissions from stationary combustion and mobile sources.
2.1 Estimations of CPM emissions
For ease of reading, Table 1 explicitly provides the definitions of acronyms used in the following. We collected available emission measurement data of CPM based on the published literature. In total, CPM emission data from 52 stationary combustion sources were acquired (Table S3). The emission sectors for these data included coal-fired power plants, waste incineration power plants, industrial coal boilers, heavy oil boilers, wood boilers, natural gas boilers, diesel boilers, iron and steel plants, and incinerators. Emissions of CPM depend on many factors, including source categories, fuel types, sampling flue gas temperature, and air pollution control devices (Feng et al., 2021). Furthermore, different measurement methods produce different CPM emission results (G. Wang et al., 2020). Recently, cooling and dilution methods have been applied to monitor CPM concentrations. CPM contains organic and inorganic fractions, but this study only focused on organic CPM emissions. The emission rate of organic CPM was estimated as shown in Eqs. (1)–(3) (Morino et al., 2018).
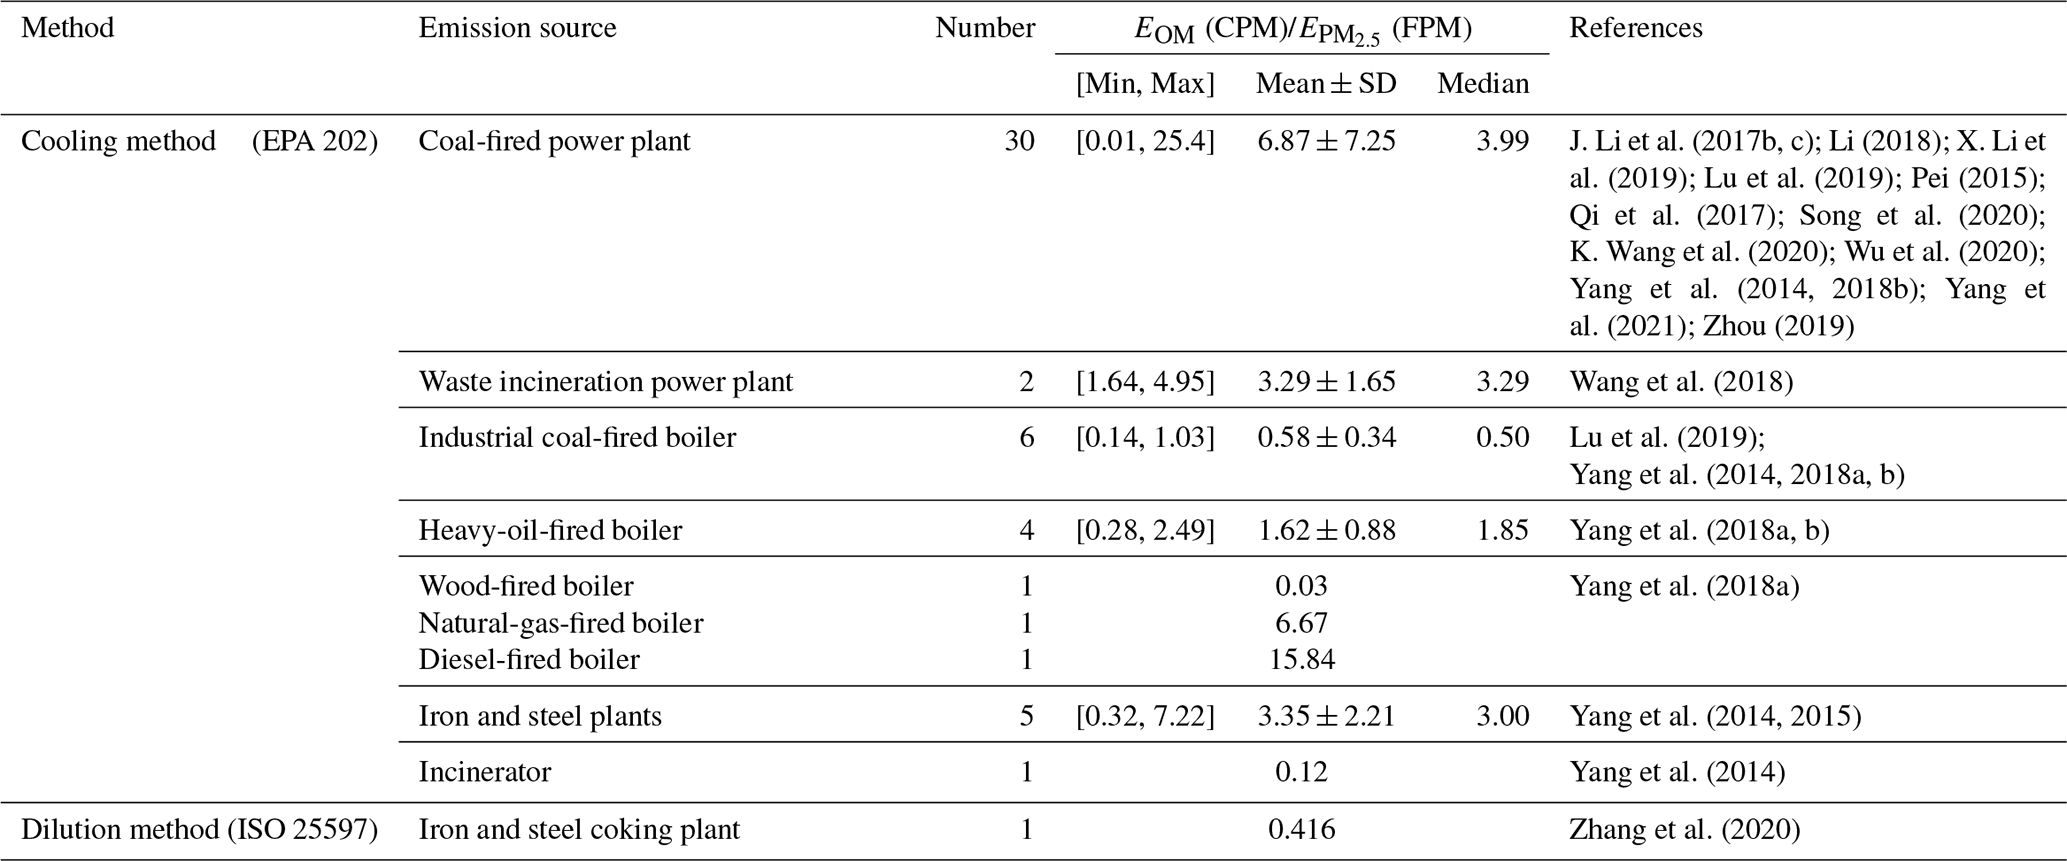
Here, EOM (CPM) is the emission rate of organic matter in CPM, EFOM (CPM) is the emission factor of organic matter in CPM, (FPM) is the emission rate of FPM2.5, EF (FPM) is the emission factor of FPM2.5, A denotes the activity level, COM (CPM) is the concentration of organic matter detected in CPM, and (FPM) is the detected concentration of FPM2.5. EOMsi (CPM) denotes the emission rate of OMsi in CPM, whereas COMsi (CPM) denotes the concentration of OMsi in CPM. A and EF (FPM) in Eq. (1) were combined to calculate (FPM) in Eq. (2), using values acquired from PM2.5 emission rates in the emission inventory of the baseline year. Among these parameters, COM (CPM) and (FPM) were derived from the collected emission survey data from the abovementioned stationary combustion sources. The COM (CPM) / COM (FPM) ratios should be used to estimate EOM (CPM); however, due to the limited data and very low values of COM (FPM) at these stationary sources, (FPM) was used instead of COM (FPM). The EOM (CPM) / (FPM) and EFOM (CPM) / EF (FPM) ratios should be equal to the COM (CPM) / (FPM) ratios at the same dilution ratio in the emission surveys. Table 2 summarizes the EOM (CPM) / (FPM) emission ratios for these stationary combustion sources. In this estimate, these emission ratios, which were collected from the best available data, were applied to represent the stationary combustion sources in the current emission inventory.
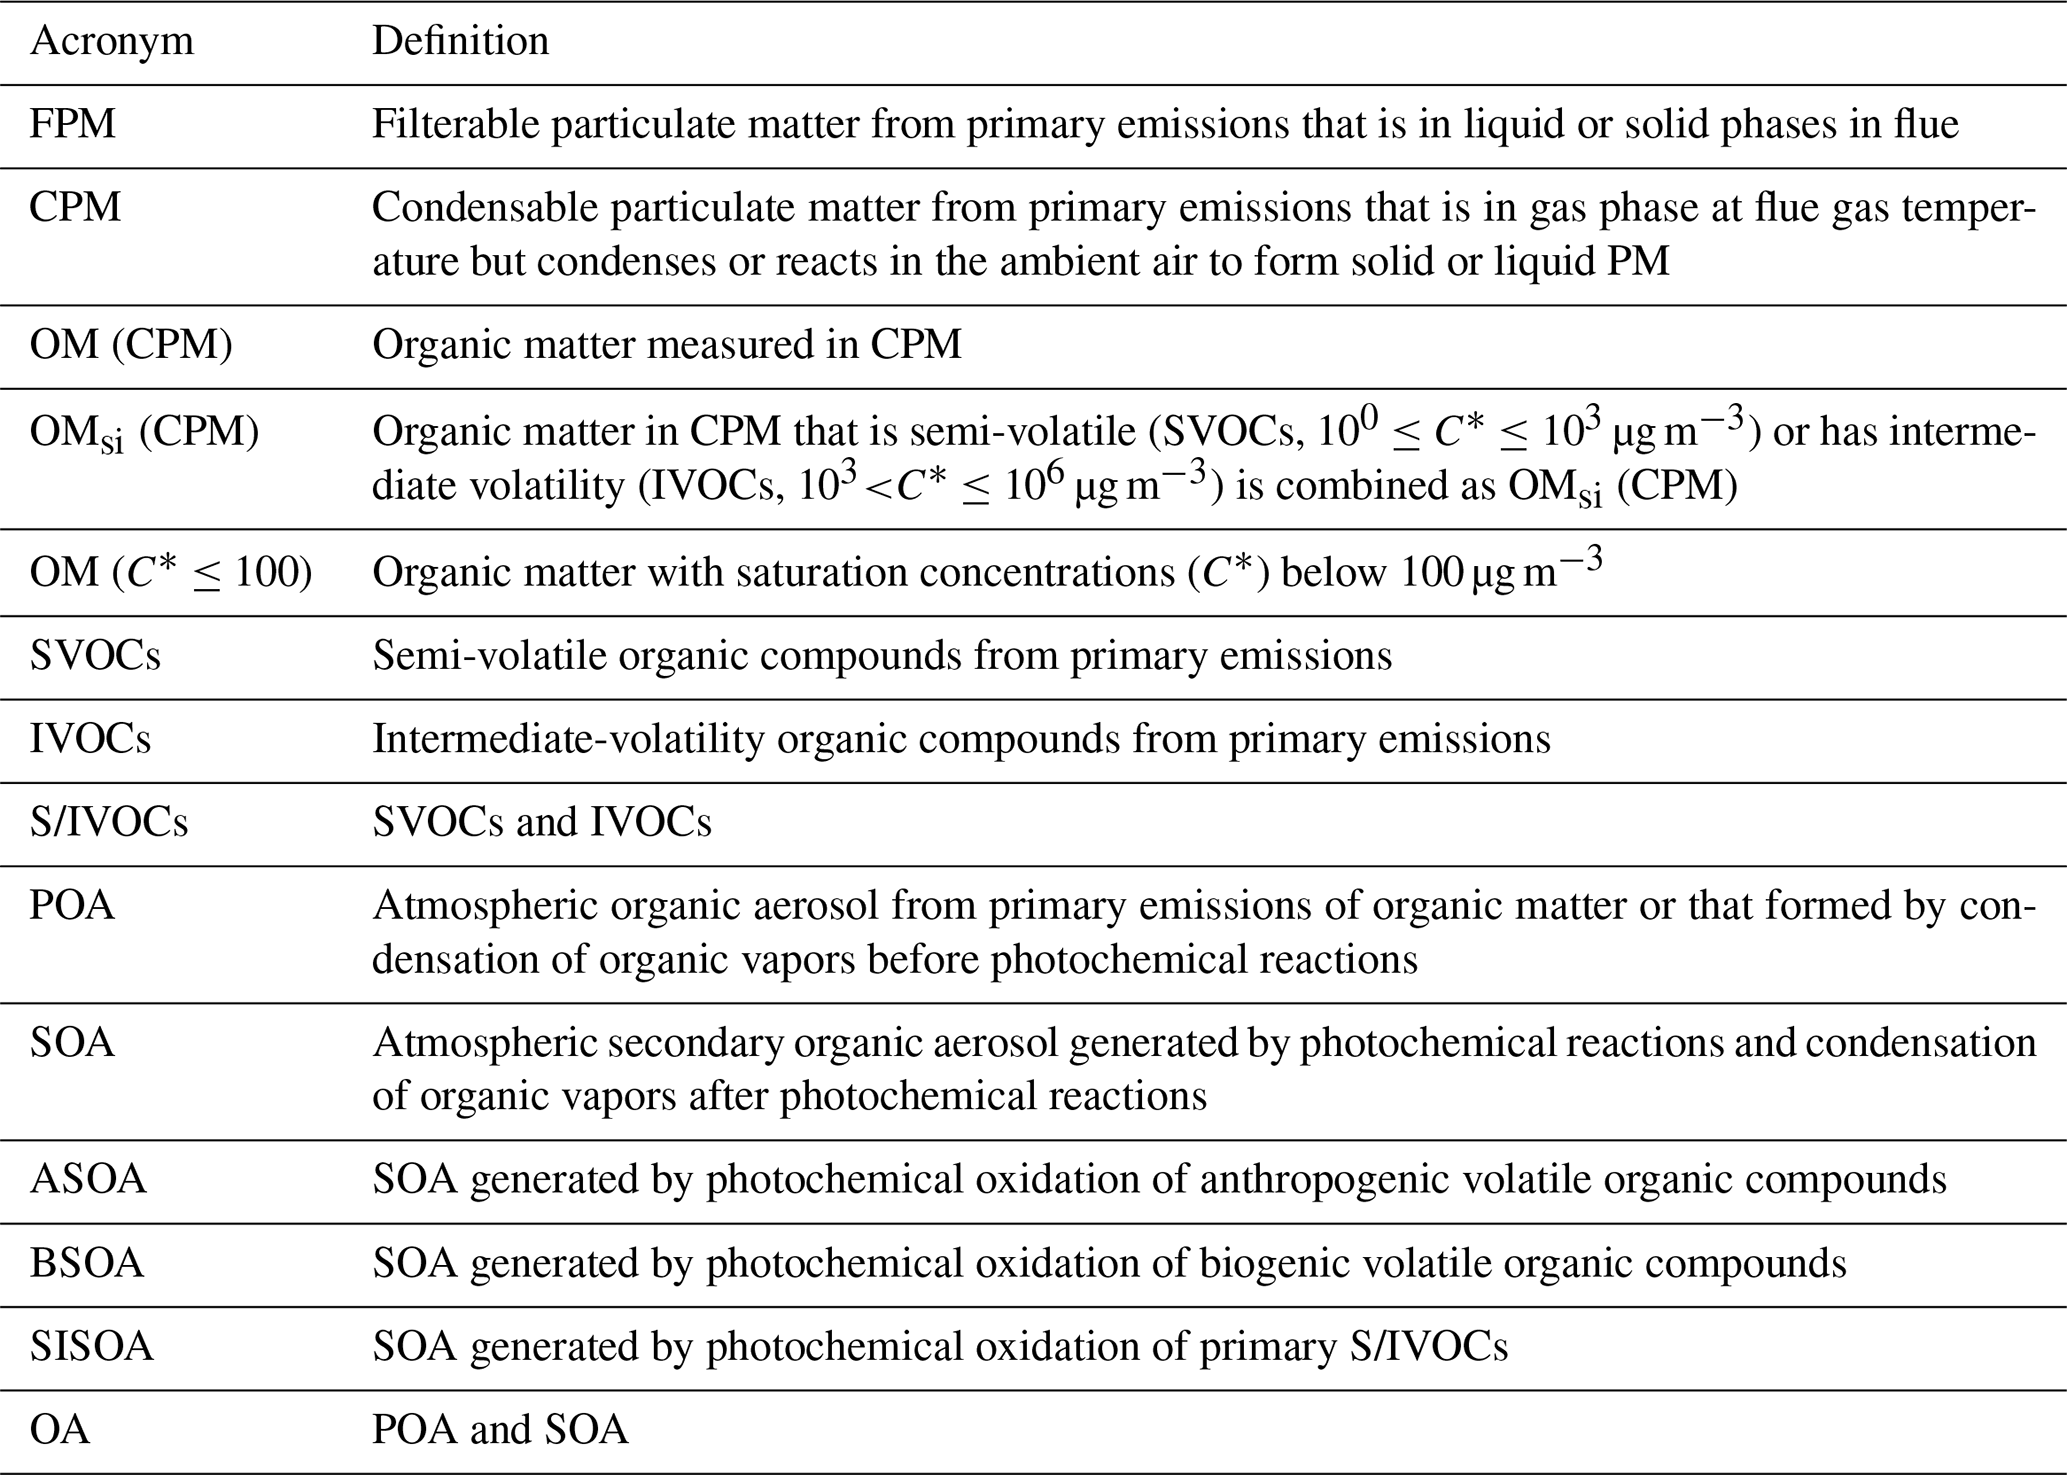
Table 2List of the ratios of the emission rates of OM in condensable particulate matter (CPM), EOM (CPM), to those of PM2.5 in filterable particulate matter (FPM), (FPM), from stationary combustion sources based on the collected references.
In addition, the component information of organic CPM is important to model the participation of organic CPM in atmospheric chemical reactions. The organic CPM mainly contains alkanes (with C10–C30 being the major n-alkanes), esters, and polycyclic aromatic hydrocarbons (PAHs) (J. Li et al., 2017b, c; Song et al., 2020; Zheng et al., 2018). Following Lu et al. (2018), based on the relationship between the carbon number of n-alkanes and saturation concentrations (C*), it is reasonable to speculate that organic CPM is composed of organic matter that is semi-volatile (SVOCs, 10 µg m−3) or has intermediate volatility (IVOCs, 10 µg m−3), which is combined as OMsi (CPM). This denotes a collective term for a range of organic matter with different volatilities in CPM. As the volatility characteristics of organic CPM from these stationary combustion sources have not been accurately determined in relevant measurement studies, the emissions of OMsi (CPM) were scaled to emissions of OM (CPM) in this estimate, as shown in Eq. (3) – that is, the total emissions of OM (CPM) were distributed in different volatility bins. The specific partitioning coefficients for different volatility bins in the model will be discussed in Sect. 2.3. In addition to stationary sources, mobile sources also generate certain emissions of CPM. Due to the lack of CPM emission data from on-road and off-road vehicles, we increased OM emission rates of the transportation sector (TR) by 30 % to consider the contributions of CPM from these mobile sources, following Morino et al. (2018) and Lu et al. (2020).
2.2 The model configuration
The three-dimensional Community Multiscale Air Quality (CMAQ, v5.3.2) model developed by the U.S. Environmental Protection Agency was used to simulate the spatiotemporal distributions of chemical species. For the detailed model configuration, the reader can refer to Appel et al. (2021) and Yu et al. (2014). The gas-phase chemical mechanism was based on the Carbon Bond Mechanism 6 (CB6) scheme. The aerosol module was based on the seventh-generation aerosol module of the CMAQ (AERO7). The CMAQv5.0.2-VBS version with AERO6 coupled with a VBS module (AERO6VBS) was used for comparison. Compared with the SOA formation in AERO6 in CMAQv5.2, the AERO7 module includes some improvements, including enhanced consistency in the SOA formation pathways between chemical mechanisms based on CB and the Statewide Air Pollution Research Center (SAPRC), updated photooxidized monoterpene SOA yields (Xu et al., 2018), added uptake of water by hydrophilic organics (Pye et al., 2017), consumption of inorganic sulfate when forming isoprene epoxydiol organic sulfate (Pye et al., 2013), and replacement of the Odum two-product model with a VBS framework to parameterize SOA formation (Appel et al., 2021; Qin et al., 2021). Both AERO6VBS and AERO7 contained five classes of organic matter, with one class being nonvolatile and the other four classes being semi-volatile with effective saturation concentrations of 1, 10, 100, and 1000 µg m−3, respectively. Each of these volatility bins was assigned to the CMAQ species of LVPO1, SVPO1, SVPO2, SVPO3, and IVPO1, respectively. The emissions of unspeciated IVOCs were set equal to 1.5 times the POA emissions in AERO6VBS and 6.579 times the POA emissions in AERO7 by default. The high scale factor of 6.579 in AERO7 was set to consider missing pathways of SOA formation from combustion sources including IVOC oxidation (Murphy et al., 2017, 2021), and it was primarily parameterized in Los Angeles where vehicle emissions are a principal source (Hayes et al., 2015). Thus, this parameter setting may not be suitable for fire and wood-burning sources. The scale factor was, therefore, zeroed out for these sources in this study, as stated in the release of CMAQv5.3.2. Meteorological fields were predicted by the WRF model version 3.7. The physical schemes of WRF were the same as those in Wu et al. (2018) and Zhang et al. (2021). Meteorological initial and boundary conditions were provided by the National Centers for Environmental Prediction (NCEP) Final analysis dataset with a spatial resolution of 1∘ × 1∘ and a temporal resolution of 6 h. The first several days were used for model spin-up, although this varied for different pollution periods, as described in Sect. 2.4. The gridded anthropogenic emission data for 2014 and 2017 were derived from the Emission Inventory of the Air Benefit and Cost and Attainment Assessment System (EI-ABaCAS) developed by the Tsinghua University (Dong et al., 2020; Zheng et al., 2019). It contained primary species such as PM2.5, SO2, NOx, CO, non-methane VOCs (NMVOCs), NH3, black carbon (BC), and organic carbon (OC) from nine anthropogenic sectors (i.e., agriculture, power plants, industry processes, industry combustion, steel, cement, residential, transport, and open burning). Biogenic source emissions were calculated online using the Biogenic Emission Inventory System version 3.14 (BEISv3.14) model (Carlton and Baker, 2011). Dust emissions were calculated by an online windblown dust scheme (Choi and Fernando, 2008). Our study period in 2014 occurred before and during the Asia-Pacific Economic Cooperation (APEC) summit held in Beijing (5–11 November 2014). During the pre-APEC period (28 October–2 November) and the APEC period (3–11 November), some pollution control measures were gradually implemented in Beijing and its surrounding areas. Based on the observed reductions in the concentrations of PM2.5, SO2, NO2, NO, and CO during APEC in Beijing and its surrounding cities (X. Li et al., 2017; Y. Li et al., 2019; Wen et al., 2016) as well as the 28 % contribution of the emission control measures to the reduction of the PM2.5 concentrations (Liang et al., 2017), an approximate emission reduction of 30 % was conducted in this study during the abovementioned time period for two municipalities (Beijing and Tianjin), four provinces (Hebei, Shanxi, Henan, and Shandong), and the Inner Mongolia Autonomous Region. The simulation domain covered mainland China with a 395 × 345 grid with a horizontal grid resolution of 12 km (Fig. 1). There were 29 vertical layers in a σz coordinate system reaching an upper pressure of 100 hPa with 20 layers located in the lowest 3 km to resolve the planetary boundary layer.
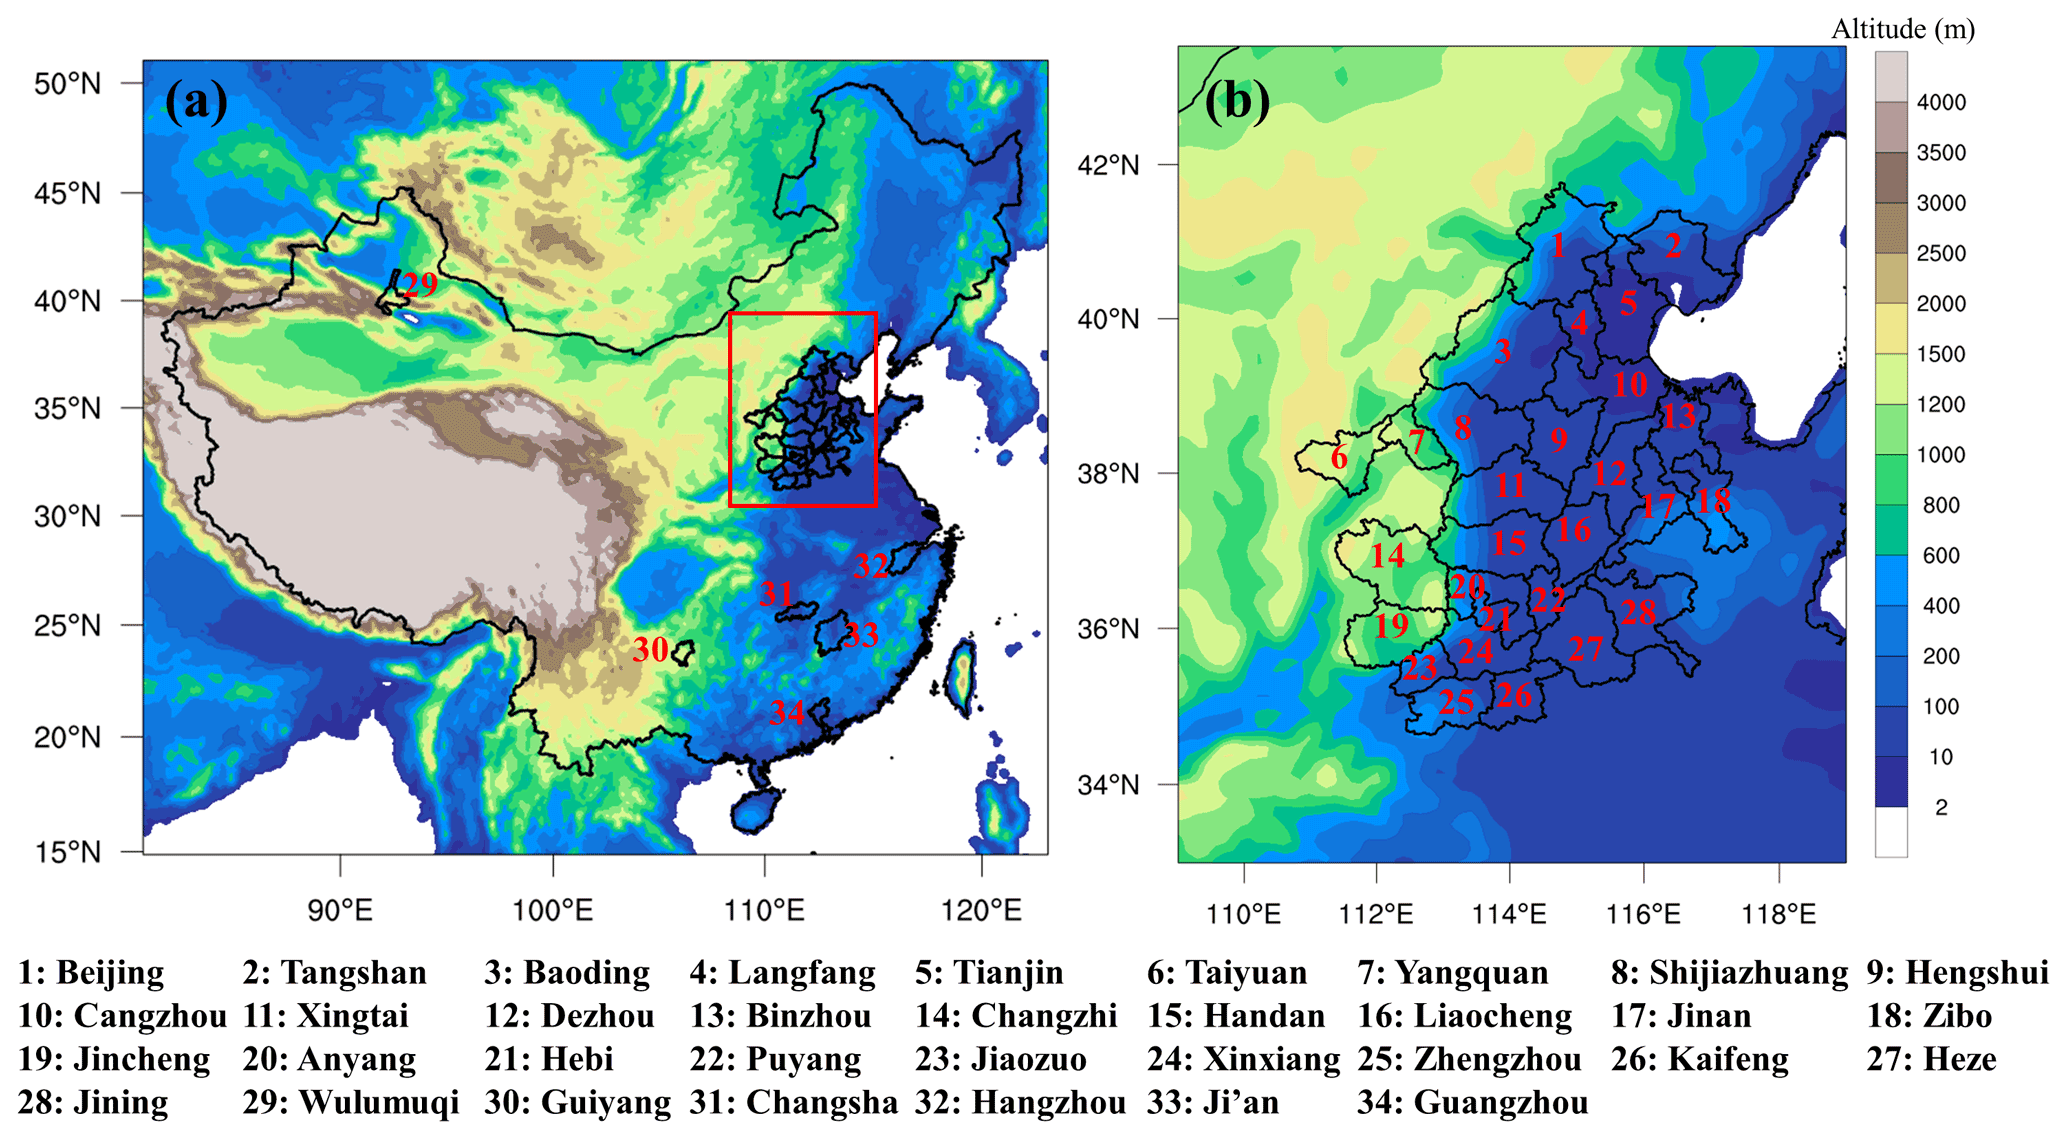
Figure 1(a) Map of the modeling domain and the location of each target city in the model evaluation. (b) The locations of the BTH2 + 26 cities are denoted using the red frame in panel (a). The colored shading represents the regional altitude.
2.3 Design of sensitivity simulation cases
According to the emission parameters summarized in Table 2, we carried out bootstrapping and Monte Carlo simulations to obtain the mean and uncertainty ranges of the EOM (CPM)/ (FPM) ratio for stationary combustion sources including power plant (PP), industry combustion (IN), and steel (IR) (see Table 3). First, the optimal probabilistic distributions and uncertainty ranges were determined for each source category. The statistical bootstrap simulation was then applied to calculate the mean and 95 % confidence interval of emission ratios for each source category. Finally, the uncertainties of these parameters were propagated to calculate the total emission uncertainty by running Monte Carlo simulations 10 000 times. Notably, the estimated uncertainties were only related to variabilities in the EOM (CPM) / (FPM) ratio, but they did not necessarily represent the overall uncertainties in the organic CPM emissions. On this basis, a series of sensitivity cases including low, medium, and high emission ratios were designed to explore the contributions of organic CPM emissions to OA concentrations and quantify the uncertainty ranges of the CPM effects on OA (see Table 4).
Table 3Probabilistic distributions with uncertainty ranges in the EOM (CPM) (FPM) ratio (95 % confidence interval). “Para1” represents the mean for normal distributions and the mean of ln (x) for lognormal distributions. “Para2” represents the standard deviation for normal distributions and the standard deviation of ln (x) for lognormal distributions. “Mean” represents the mean for emission ratios of each source category derived from the statistical bootstrap simulation.

Table 4Simulation case design. PP, IN, IR, and TR denote the power plant, industry combustion, steel, and transportation source sectors, respectively. Three kinds of scaling factors for the five volatility bins of organic CPM are tested: fac1 (0, 0.18, 0.14, 0.18, and 0.5), fac2 (0, 0.66, 0.40, 0.51, and 1.43), and fac3 (0, 0.42, 0.27, 0.345, and 0.965), the latter of which is the average of fac1 and fac2.
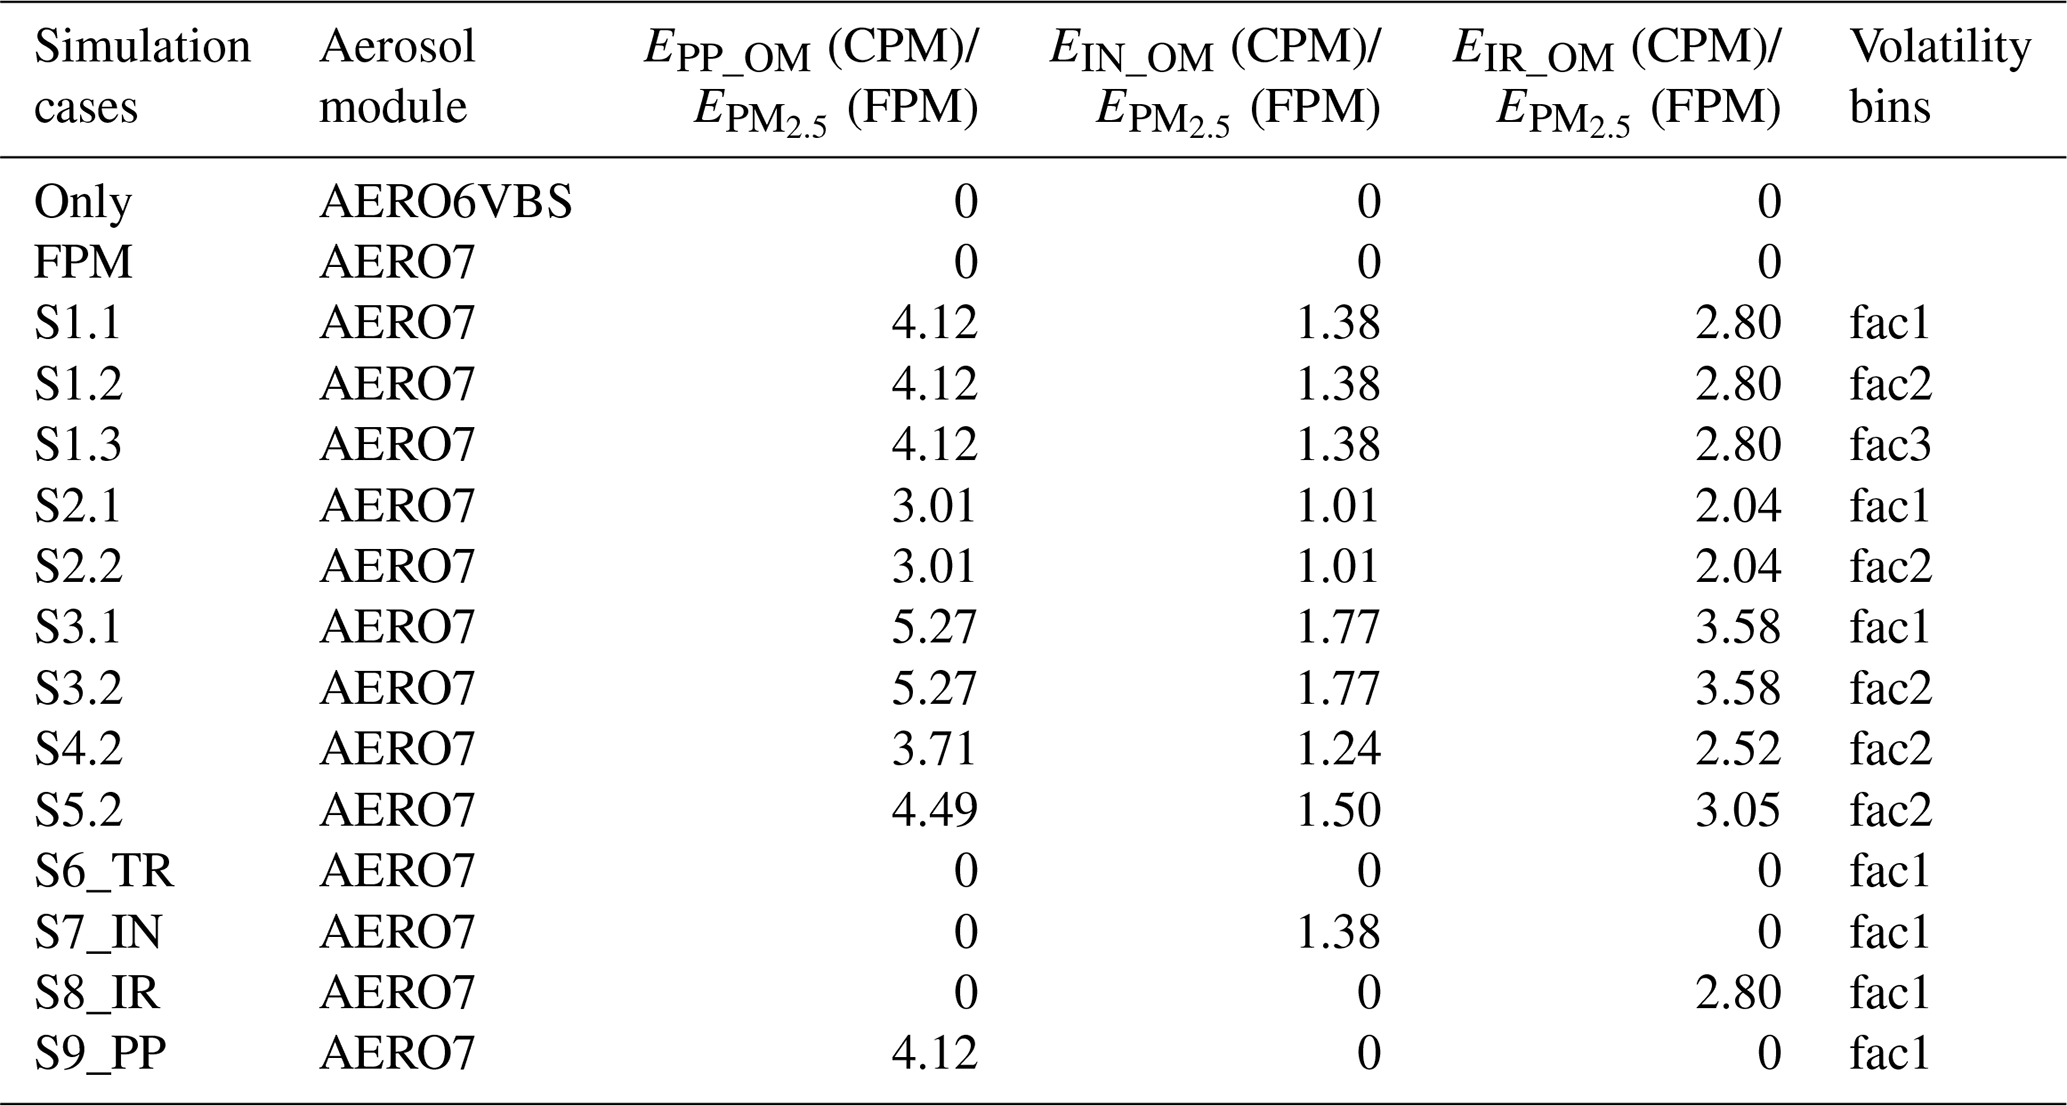
Here, to explore the contributions of organic CPM emissions to the atmospheric OA and PM2.5 concentrations, the estimated emissions of organic CPM were added into the CMAQ model as an individual source, separated from other emission sources. For the base scenarios, the simulations were performed with the inputs of the previous emission inventory without the newly constructed organic CPM emissions. Considering that organic FPM from stationary combustion and mobile sources mainly contains low-volatility matter, all of these emissions should be assigned to the CMAQ species of LVPO1, and other volatility bins should be assigned a scale factor of zero; the rest of the emissions should retain the default settings in the model. In addition, different volatility distributions could be chosen for different emission sources, but this was not the focus of our study nor did it interfere with the results of the CPM contributions. For the cases including CPM emissions from stationary combustion and mobile sources, the emissions of organic CPM were mapped to surrogate species for different volatility bins (LVPO1, SVPO1, SVPO2, SVPO3, and IVPO1) in the CMAQ model in order to represent the SOA formation from CPM. These mixed species underwent gas–particle partitioning and multigenerational gas-phase photochemical oxidation of organic vapors by OH radicals to generate successively lower-volatility and more-oxygenated species, and they then produced SOA. Due to the unavailability of volatility distribution information for OMsi (CPM), different scaling volatility bin factors were employed under each emission scenario to discuss the uncertainties of CPM effects. In this study, we tested two kinds of scaling factors for the five volatility bins: fac1 (0.09, 0.09, 0.14, 0.18, and 0.5) (Grieshop et al., 2009) and fac2 (0.40, 0.26, 0.40, 0.51, and 1.43) (Shrivastava et al., 2011). As mentioned in Sect. 2.1, organic CPM was composed of organic matter that was semi-volatile or had intermediate volatility; thus, the first bin, which represents nonvolatile organic matter, should be set to zero. Here, the original partitioning coefficient of the first bin was added to the following bin; thus the fac1 (0, 0.18, 0.14, 0.18, and 0.5) and fac2 (0, 0.66, 0.40, 0.51, and 1.43) scaling factors were applied in the sensitivity simulation cases. The fac2 scaling factors estimated the total SVOCs emissions as 3 times the POA emissions in order to consider missing OMsi (CPM) emissions. Then, the fac3 scaling factors (0, 0.42, 0.27, 0.345, and 0.965), which were the average of fac1 and fac2, were also tested for the five volatility bins. The fac1, fac2, and fac3 scaling factors were applied to the OMsi (CPM) emissions for cases S1.1, S1.2, and S1.3, respectively (see Table 4). For an evaluation of the sensitivity of OA outputs to organic CPM emissions, we conducted simulations with different magnitudes of CPM emissions at the 95 % and 50 % confidence intervals. Thus, the S2–S3 cases were designed with the uncertainty ranges of EOM (CPM)/ (FPM) at the 95 % confidence interval (73 % and 128 % of the amounts in case S1), and the S4–S5 cases were designed with the uncertainty ranges at the 50 % confidence interval (90 % and 109 % of the amounts in S1). Moreover, the contributions of individual emission categories including PP, IN, IR, and TR were quantified by excluding the perturbation of other sources in the S6–S9 cases. The simulated contributions of CPM emissions to the POA, SOA, OA, and PM2.5 concentrations under these scenarios were calculated as the improved simulated concentrations after including CPM emissions relative to the base case and were then divided by the simulations under these scenarios.
2.4 Observational data
For the year 2014, the simulation period was from 6 October to 14 November 2014, with the first 8 d being used for model spin-up. Field observational data during the episode from 14 October to 14 November 2014, at the Institute of Atmospheric Physics (IAP; 39∘58′ N, 116∘22′ E) in Beijing were from J. Li et al. (2017a) and Xu et al. (2015). Concentrations of aerosol components were measured in PM1. In order to make a comparison between simulated and observed results, the ratio of 0.77 was used to calculate the observed component concentrations in PM2.5 based on observations from Xu et al. (2015). To distinguish between SOA and POA, aerosol mass spectrometer (AMS) measurements and the positive matrix factorization (PMF) method were used by Xu et al. (2015), who identified three POA factors from coal combustion, biomass burning, and cooking, and two SOA factors from semi-volatile and low-volatility oxygenated OA. Observational data of OC at Qianyanzhou (located in Ji'an city) and Changsha on 3 November 2014 were provided by the CERN Atmospheric Science Branch of the Institute of Atmospheric Physics, Chinese Academy of Sciences (Liu et al., 2018). For the year 2018, the simulation period was from 1 to 31 December 2018, with the first 5 d used for model spin-up. The observed values of OC over the 2 major cities and 26 other cities of the Beijing–Tianjin–Hebei region (hereafter referred to as “BTH2 + 26 cities”) were provided by China National Environmental Monitoring Center. These cities include Beijing, Tianjin, Anyang, Baoding, Binzhou, Cangzhou, Changzhi, Dezhou, Hebi, Handan, Hengshui, Heze, Jincheng, Jinan, Jining, Jiaozuo, Kaifeng, Liaocheng, Langfang, Puyang, Shijiazhuang, Tangshan, Taiyuan, Xingtai, Xinxiang, Yangquan, Zibo, and Zhengzhou. The ratio of 1.4 (Simon et al., 2011) was used to calculate OA concentrations for comparison with the simulation results. The observed concentrations of PM2.5 were collected from the Chinese National Environmental Monitoring Center (CNEMC). As the observed PM2.5 data from 22 to 26 December were missing, the following analysis of PM2.5 did not include those 5 d. The hourly observed meteorological data, including temperature (T), relative humidity (RH), wind speed (WS), and wind direction (WD), were provided by the China Meteorological Administration (http://data.cma.cn/site/index.html, last access: 1 March 2022).

Figure 2Annual emissions of PM2.5 and OM in filterable particulate matter (FPM), OM in filterable and condensable particulate matter (FCPM) before the application of volatility distributions, and OM ( µg m−3) in FCPM after the application of the volatility distributions for the fac1, fac2, and fac3 cases over China in 2014 and 2017.
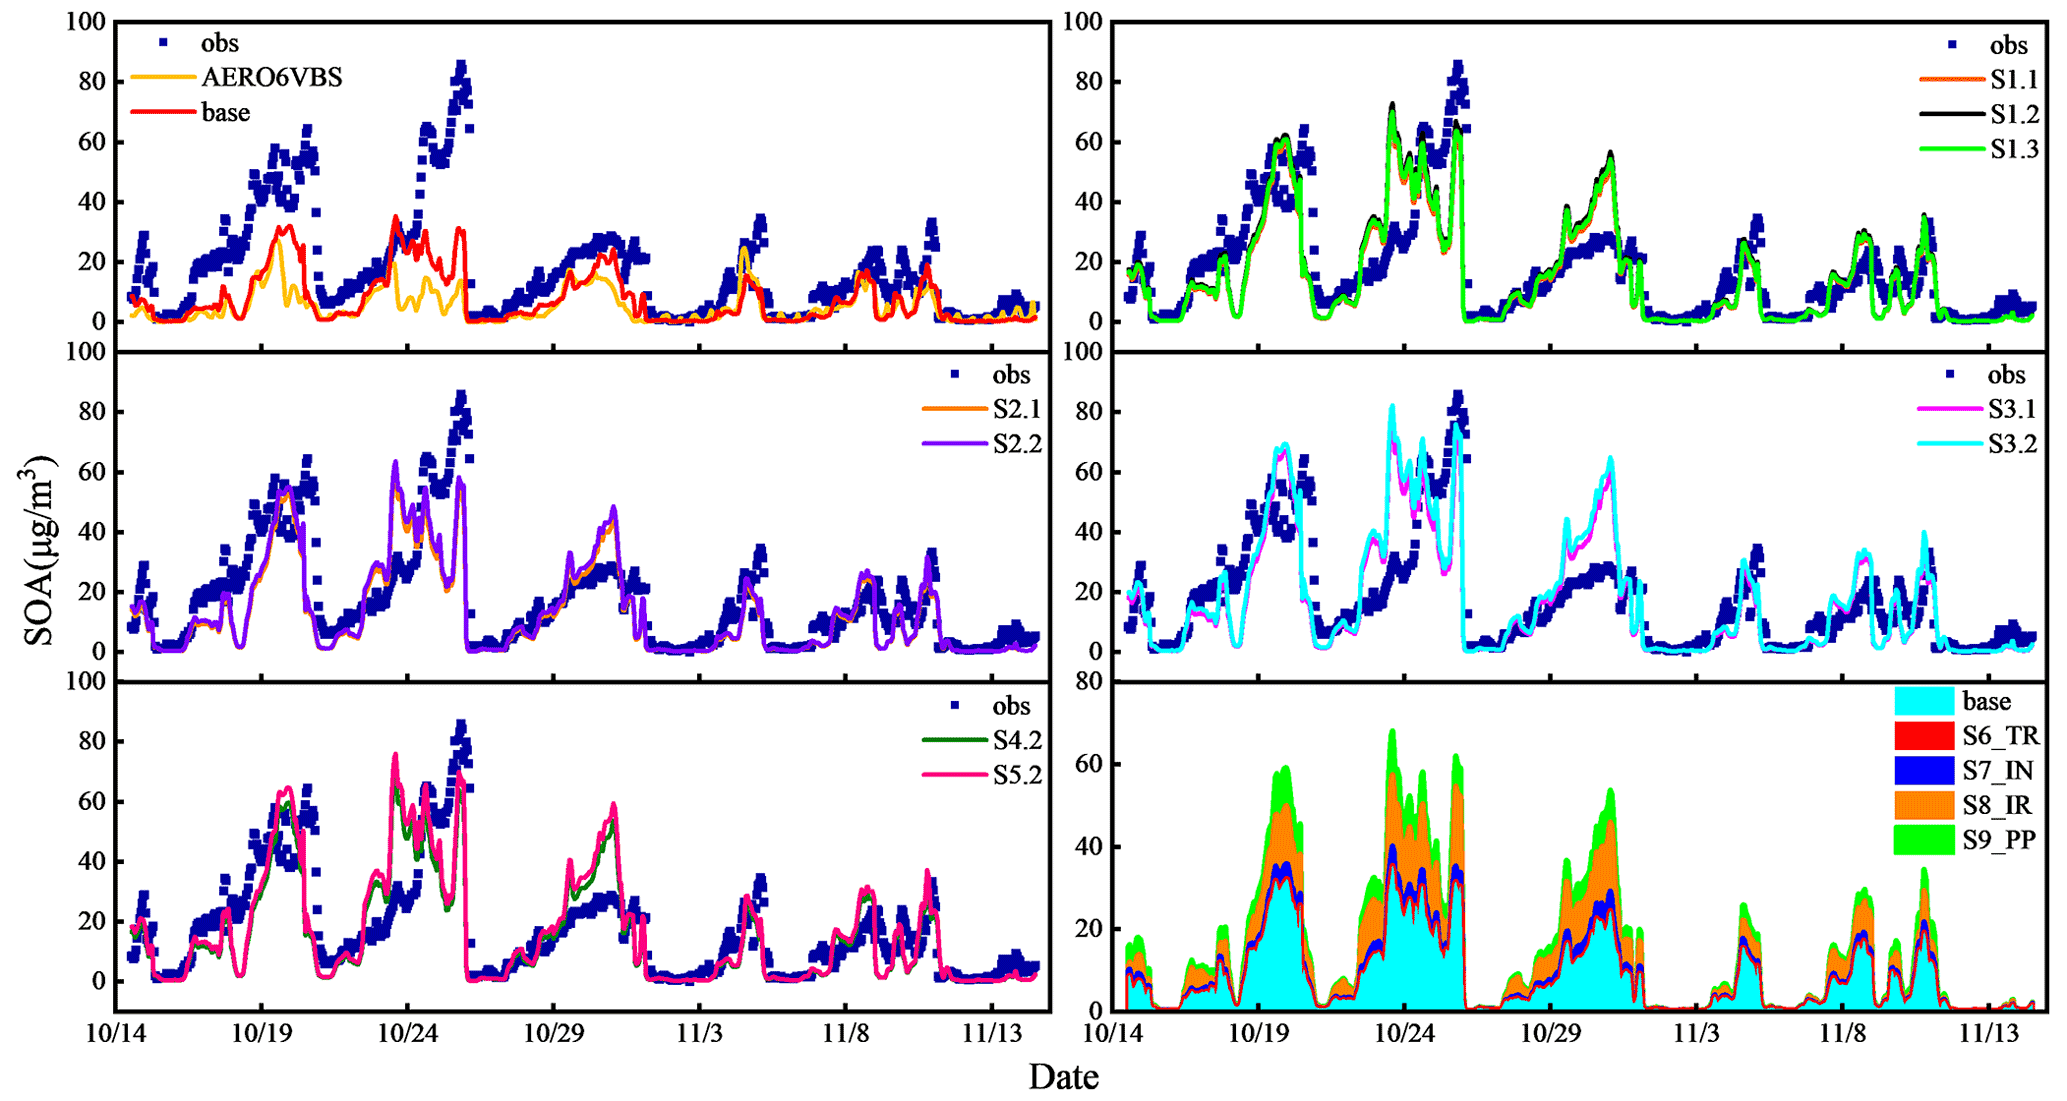
Figure 3The observed and simulated hourly SOA concentrations during the episode from 14 October to 14 November 2014 at the Beijing site for the sensitivity cases, as summarized in Table 3.
3.1 Emissions of condensable particulate matter
Emissions of OM in CPM, EOM (CPM), were comparable to or even exceeded the emissions of filterable PM2.5, (FPM), for most stationary combustion sources, regardless of the differences among these values (Table 2). Therefore, we constructed a new emission inventory by including CPM. The annual emissions of OA in the previous and modified emission inventories over China for the years 2014 and 2017 are presented in Fig. 2. OM represents the organic matter in the emission input before the application of volatility distributions, whereas OM ( µg m−3) represents the organic matter allocated to the bins after the application of the volatility distributions for the fac1, fac2, and fac3 cases. Based on the simulation case settings, OM (FPM) from all of the sectors was multiplied by fac1 (0.5), whereas OM (CPM) from stationary combustion and mobile sources was multiplied by fac1 (0.5), fac2 (1.57), or fac3 (1.035). In the previous inventory for 2014 without CPM, the emissions of OM over mainland China were 3664.6 Gg, approximately equal to 40 % of PM2.5 emissions. After the inclusion of CPM released by stationary combustion sources in the new inventory, the emissions of OM were enhanced by a factor of 2 and even exceeded emissions of FPM2.5. The dominant contributors of OM (FCPM, filterable and condensable particulate matter) were combustion sources in the power plant and industrial sectors, which were estimated to be 66 % (7006.2 Gg) of the total OA emissions (10531.1 Gg). The emissions of OM ( µg m−3) remained unchanged for the open burning, domestic, and industry process sources, as they were mostly FPM, whereas OM ( µg m−3) emissions for the power plant, industry combustion, and steel sources were variable based on whether fac1, fac2, or fac3 was applied to the CPM. Similarly, the emissions of OM (FCPM) were 3 times those of OM (FPM) for the year 2017. The emissions of OM from power plant, industry combustion, and steel sources increased by 33 times after considering CPM emissions. These results indicate that the inclusion of organic CPM from stationary combustion sources had a major impact on OM emissions and improved the contributions of the industrial and power sectors to OM emissions.
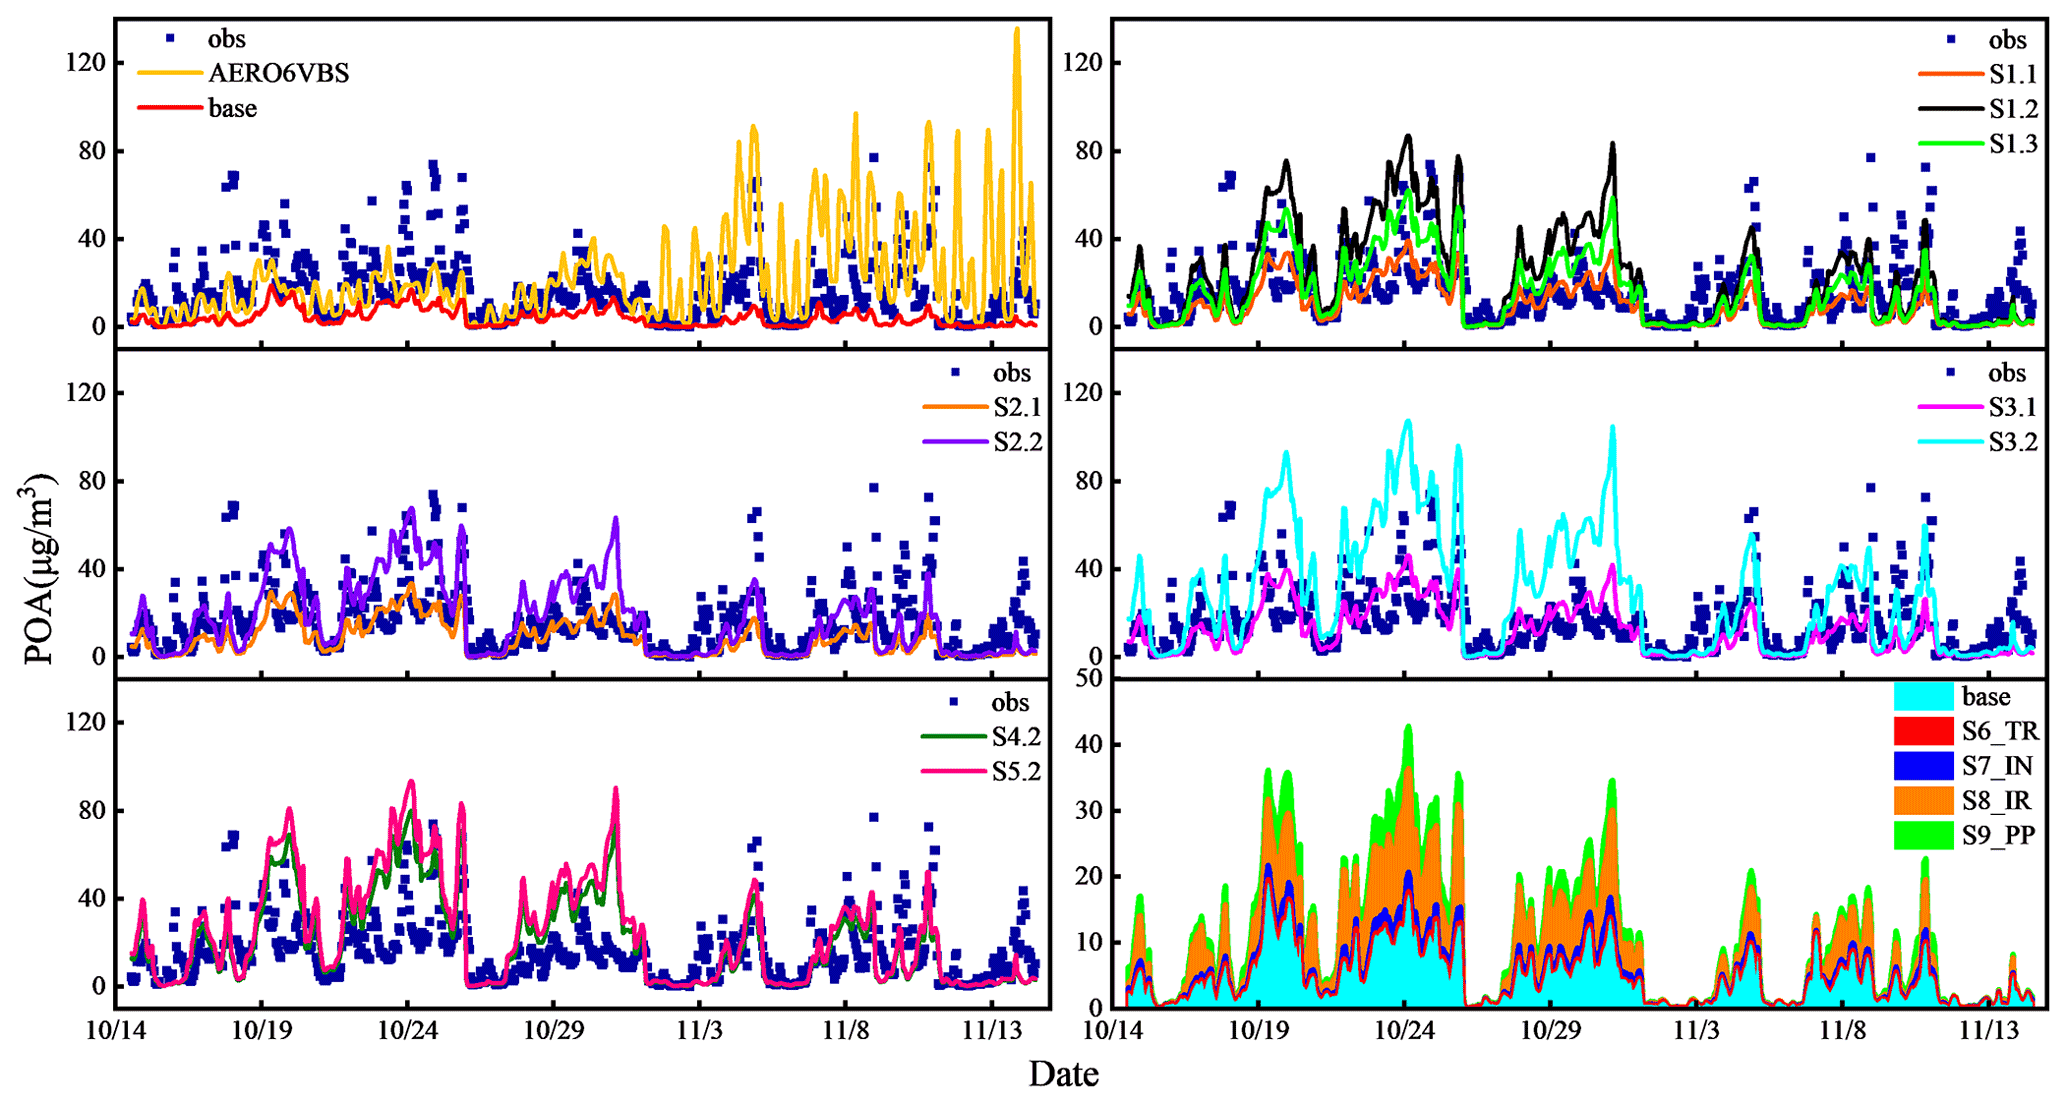
Figure 4The observed and simulated hourly POA concentrations during the episode from 14 October to 14 November 2014 at the Beijing site for the sensitivity cases, as summarized in Table 3.
Notably, the emission estimates of OM in CPM contained uncertainties, which were mainly attributed to the representativeness and limitations of the chosen emission sources. For the power plant, industry combustion, and steel sectors, the average EOM (CPM) / (FPM) ratios were 4.12, 1.38, and 2.80, respectively (Table 3). The estimation of uncertainties related to variabilities in the EOM (CPM) / (FPM) ratio is described in Sect. 2.3. Overall, the uncertainty range of EOM (CPM) related to variabilities in the ratio was −27 % to + 28 % at the 95 % confidence interval. On this basis, a series of sensitivity cases with different emission ratios were set to determine the uncertainty ranges of CPM contributions (Table 4). In the future, actual measurements of organic CPM emissions from various sources and source-specific identification of volatility distributions are needed to reduce uncertainties in emission estimates.
3.2 Effects of CPM emissions on POA and SOA concentrations
For the observed and simulated hourly SOA and POA concentrations at the Beijing site, Figs. 3 and 4 show obvious improvements in the SOA and POA levels after the consideration of CPM contributions. The specific model species for POA and SOA are shown in Table S4. In all of the simulation scenarios, five complete ascending and descending SOA episodes were well captured (see Fig. 3), with a much lower mean bias between the observed and simulated values than shown in previous work (J. Li et al., 2017a). Three pollution episodes were clearly captured by the model in the pre-APEC period. The third episode (27 October–1 November) had lower observed SOA levels relative to the first (16–21 October) and second episodes (22–26 October), attributed to lower precursor emission concentrations, a lower temperature, and regional transport by strong northerly winds on 26 October. During APEC, there were two pollution episodes with lower SOA concentrations due to the effects of emission controls and meteorological conditions (Ansari et al., 2019; Liang et al., 2017). Compared with the observed values, cases without CPM exhibited varying degrees of underestimation for SOA and POA. For example, in the base case, the maximum SOA values were underestimated by 50 % during the first episode and by up to 65 % during the second episode, while the simulated hourly POA values varied in the range of 0.12–19.06 µg m−3 (much lower than observed POA values during the whole time period). In comparison, the AERO6VBS case underpredicted SOA by up to 65 %, and it simulated low levels of POA during the first three periods and high levels during the last two episodes. Overall, the base case underestimated the average POA, SOA, and OA levels by 74 %, 56 %, and 65 %, respectively, emphasizing the potential contributions of missing CPM sources (Table 5).
Table 5Model evaluation statistics for hourly OA, POA, and SOA concentrations during 14 October–14 November 2014, and daily OA concentrations during 6–30 December 2018, for different sensitivity simulation cases.

The abbreviations used in the table are as follows: OBS and SIM denote the mean observed and simulated concentrations (µg m−3), respectively; MB represents mean bias; NMB represents normalized mean bias; NME represents normalized mean error; and R is the correlation coefficient.
After considering organic CPM emissions, the underestimation of average POA and SOA was reduced to respective values of 37 % and 15 % under the S1.1 scenario (Table 5). From the simulated hourly variations in the S1.1 case (Fig. 3), SOA concentrations were enhanced by between 0.01 and 1.86 times relative to the base case, which were values more consistent with the observations. The gap between the average simulated and observed values decreased from −9.84 to −2.61 µg m−3 (a 73 % decrease). For the peak values in the first, second, fourth, and fifth pollution episodes, the improvements in the peak SOA concentrations were approximately 30, 30, 10, and 15 µg m−3, respectively. Nevertheless, an overestimation of SOA occurred in the third period, mainly due to meteorological conditions (observed and modeled wind directions were inconsistent during this period), as shown in Fig. S1. The prevailing southerly and northeasterly wind directions in the model during the third period did not bring clean air from the northwestern boundary to dilute the locally generated SOA (Y. Li et al., 2016, 2019). Moreover, higher simulated wind speeds transported more precursors via the southerly and northeast winds and caused the overestimation of SOA (see Fig. S1). Correspondingly, the simulated hourly POA concentrations in the S1.1 case increased by 0.07–3.70 times compared with the base case, narrowing the average gap between the simulated and observed values from −11.97 to −6.01 µg m−3 (a 50 % decrease), but the high observed levels of POA were still not attained under this scenario. Comparatively, the S1.2 case presented similar simulated hourly results for SOA to those of the S1.1 case, with an enhancement of between 0.02 and 2.21 times versus the base case, whereas the simulated POA values were nearly 1.3 times higher than the S1.1 case, capturing most of the high observations throughout the whole study period. Under the S1.3 scenario, using different SVOC parameters compared with the S1.1 case, the simulated concentrations of SOA were 4 % higher, and the simulated concentrations of POA were 61 % higher than those under the S1.1 scenario, as shown in Table 5. Based on the evaluation results, the S1.3 scenario showed the optimal improvement effects, with mean biases of 1.23 % for POA and −11.68 % for SOA (see Table 5). Considering the uncertainty ranges of CPM emissions, a series of sensitivity cases with different emission ratios were conducted. Under the minimum emission scenario in the S2.1 case, the average SOA and POA concentrations were 12 %, and 15 % lower than those in the S1.1 case, respectively. Under the maximum emission scenario in the S3.1 case, the average SOA and POA concentrations were 14 % and 19 % higher than those in the S1.1 case, respectively. Thus the model can resolve 63 % (54 %–75 %) of the observed POA concentrations and 85 % (75 %–97 %) of the observed SOA concentrations in S1.1 (S2.1, S3.1). The S2.2 and S3.2 cases then applied the same S/IVOC parameters as S1.2, and they also displayed similar SOA results to those in the S2.1 and S3.1 cases, respectively. Under this setting, the uncertainty ranges were from −13 % to +13 % for SOA and from −22 % to +24 % for POA in the S1.2 case, as shown in Table 5. For the S4.2 and S5.2 cases with the CPM emissions at the 50 % confidence interval, SOA concentrations showed small changes: 5 % lower in the S4.2 case and 4 % higher in the S5.2 case compared with the S1.2 case. A similar minor sensitivity, 8 % decrease (S4.2) and 7 % increase (S5.2), was found for POA using the aforementioned cases. To explore the contribution of each source category to SOA and POA and to identify the key anthropogenic sources of CPM, we conducted simulations with different separate inputs (S6–S9; see Table 4). Results show that the CPM emissions from the IR sector made the largest contribution to the POA and SOA increases, accounting for 59 % of POA and 55 % of SOA, followed by the PP (26 % for POA and 30 % for SOA) and IN (13 % for POA and 14 % for SOA) sectors. This was consistent with the differences in the CPM emissions from the abovementioned three source sectors (Fig. 2). The sensitivity of SOA and POA to the emission ratio of organic CPM from the TR sector was very small, indicating a weak impact on OA due to the low contribution of transportation sources to the OA emissions in FCPM. The above results demonstrate that CPM from stationary sources is an important source for both POA and SOA formation. In summary, when considering the uncertainties of organic CPM emissions, CPM can be a significant contributor to OA concentrations, with contributions of 58 % (51 %, 65 %) to POA, 49 % (42 %, 55 %) to SOA, and 53 % (45 %, 59 %) to OA under the S1.1 (S2.1, S3.1) scenario as well as contributions of 82 % (76 %, 85 %) to POA, 53 % (45 %, 58 %) to SOA, and 70 % (63 %, 75 %) to OA under the S1.2 (S2.2, S3.2) scenario. The S1.3 scenario showed the best improvement of performance, with CPM contributing 74 % to POA, 51 % to SOA, and 63 % to OA.
Due to the better representation of temporal variations in SOA and POA after including CPM emissions, OA simulations were also improved. To separate the effects of CPM on OA into different process contributions, we compared the simulation results of the sensitivity cases, as shown in Fig. 5. The OA composition contains POA, ASOA (SOA from anthropogenic VOCs), BSOA (SOA from biogenic VOCs), and SISOA (SOA from S/IVOCs). The difference between the simulated and observed values decreased from 21.81 µg m−3 in the base case to 8.63 µg m−3 in the S1.1 case (a 60 % decrease), with an uncertainty of 11.92 µg m−3 (a 45 % decrease in S2.1) to 4.66 µg m−3 (a 79 % decrease in S3.1) relative to the base case. However, these cases still underestimated the observed OA levels. The S1.2, S2.2, and S3.2 cases increased the contributions of CPM to OA by 14.01, 10.24, and 17.92 µg m−3 compared with S1.1, S2.1, and S3.1, respectively. Notably, the simulated average OA values in S1.3 were relatively close to the observations, with average CPM contributions of 19.98 µg m−3 and a minor underestimation of 5.43 % (see Table 5). Taking OA composition into account, POA and SISOA accounted for the largest part in all of these scenarios. The effects of CPM were only reflected in the enhancements of POA and SISOA. These results suggest that OA was sensitive to the emissions of organic CPM; therefore, a reduction of emission uncertainties is required to ensure better simulations. In summary, the revised simulations after the inclusion of CPM from stationary combustion and mobile sources led to improved model performance with respect to OA simulation during the winter haze episodes, revealing a significant contribution of CPM to atmospheric OA.
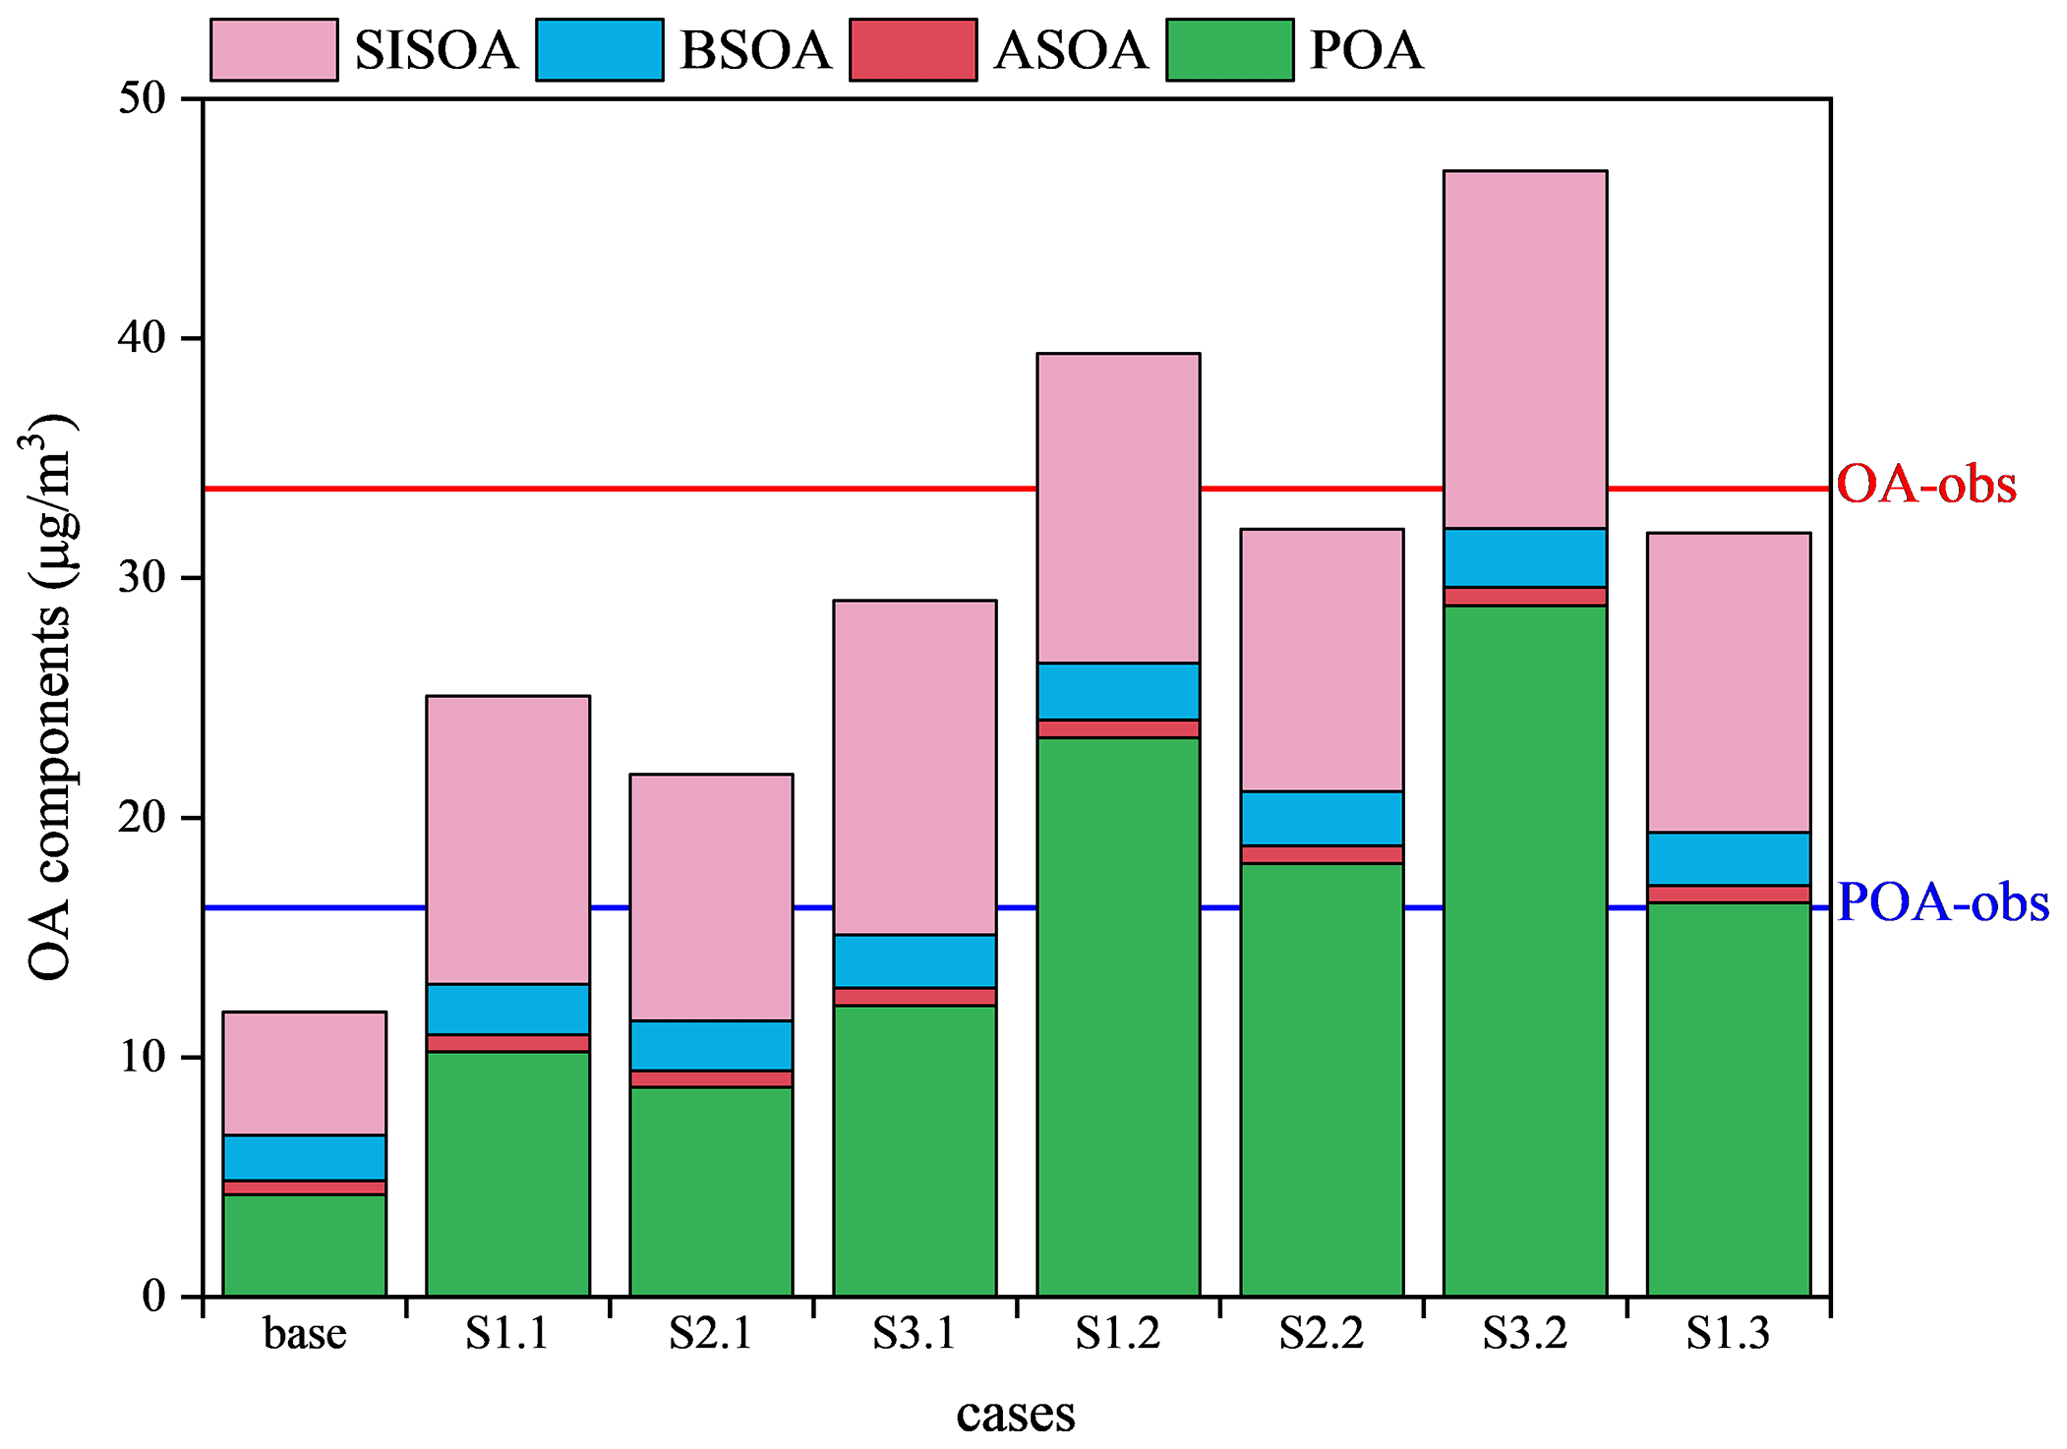
Figure 5The simulated concentrations of different OA components averaged over the whole study period from 14 October to 14 November 2014 at the Beijing site for the sensitivity cases. SISOA, BSOA, and ASOA denote SOA generated by S/IVOCs, biogenic VOCs, and anthropogenic VOCs, respectively. The red and blue horizontal lines denote the average observed concentrations of OA and POA, respectively.

Figure 6The observed and simulated OA concentrations for the sensitivity cases at Changsha and Qianyanzhou on 3 November 2014.
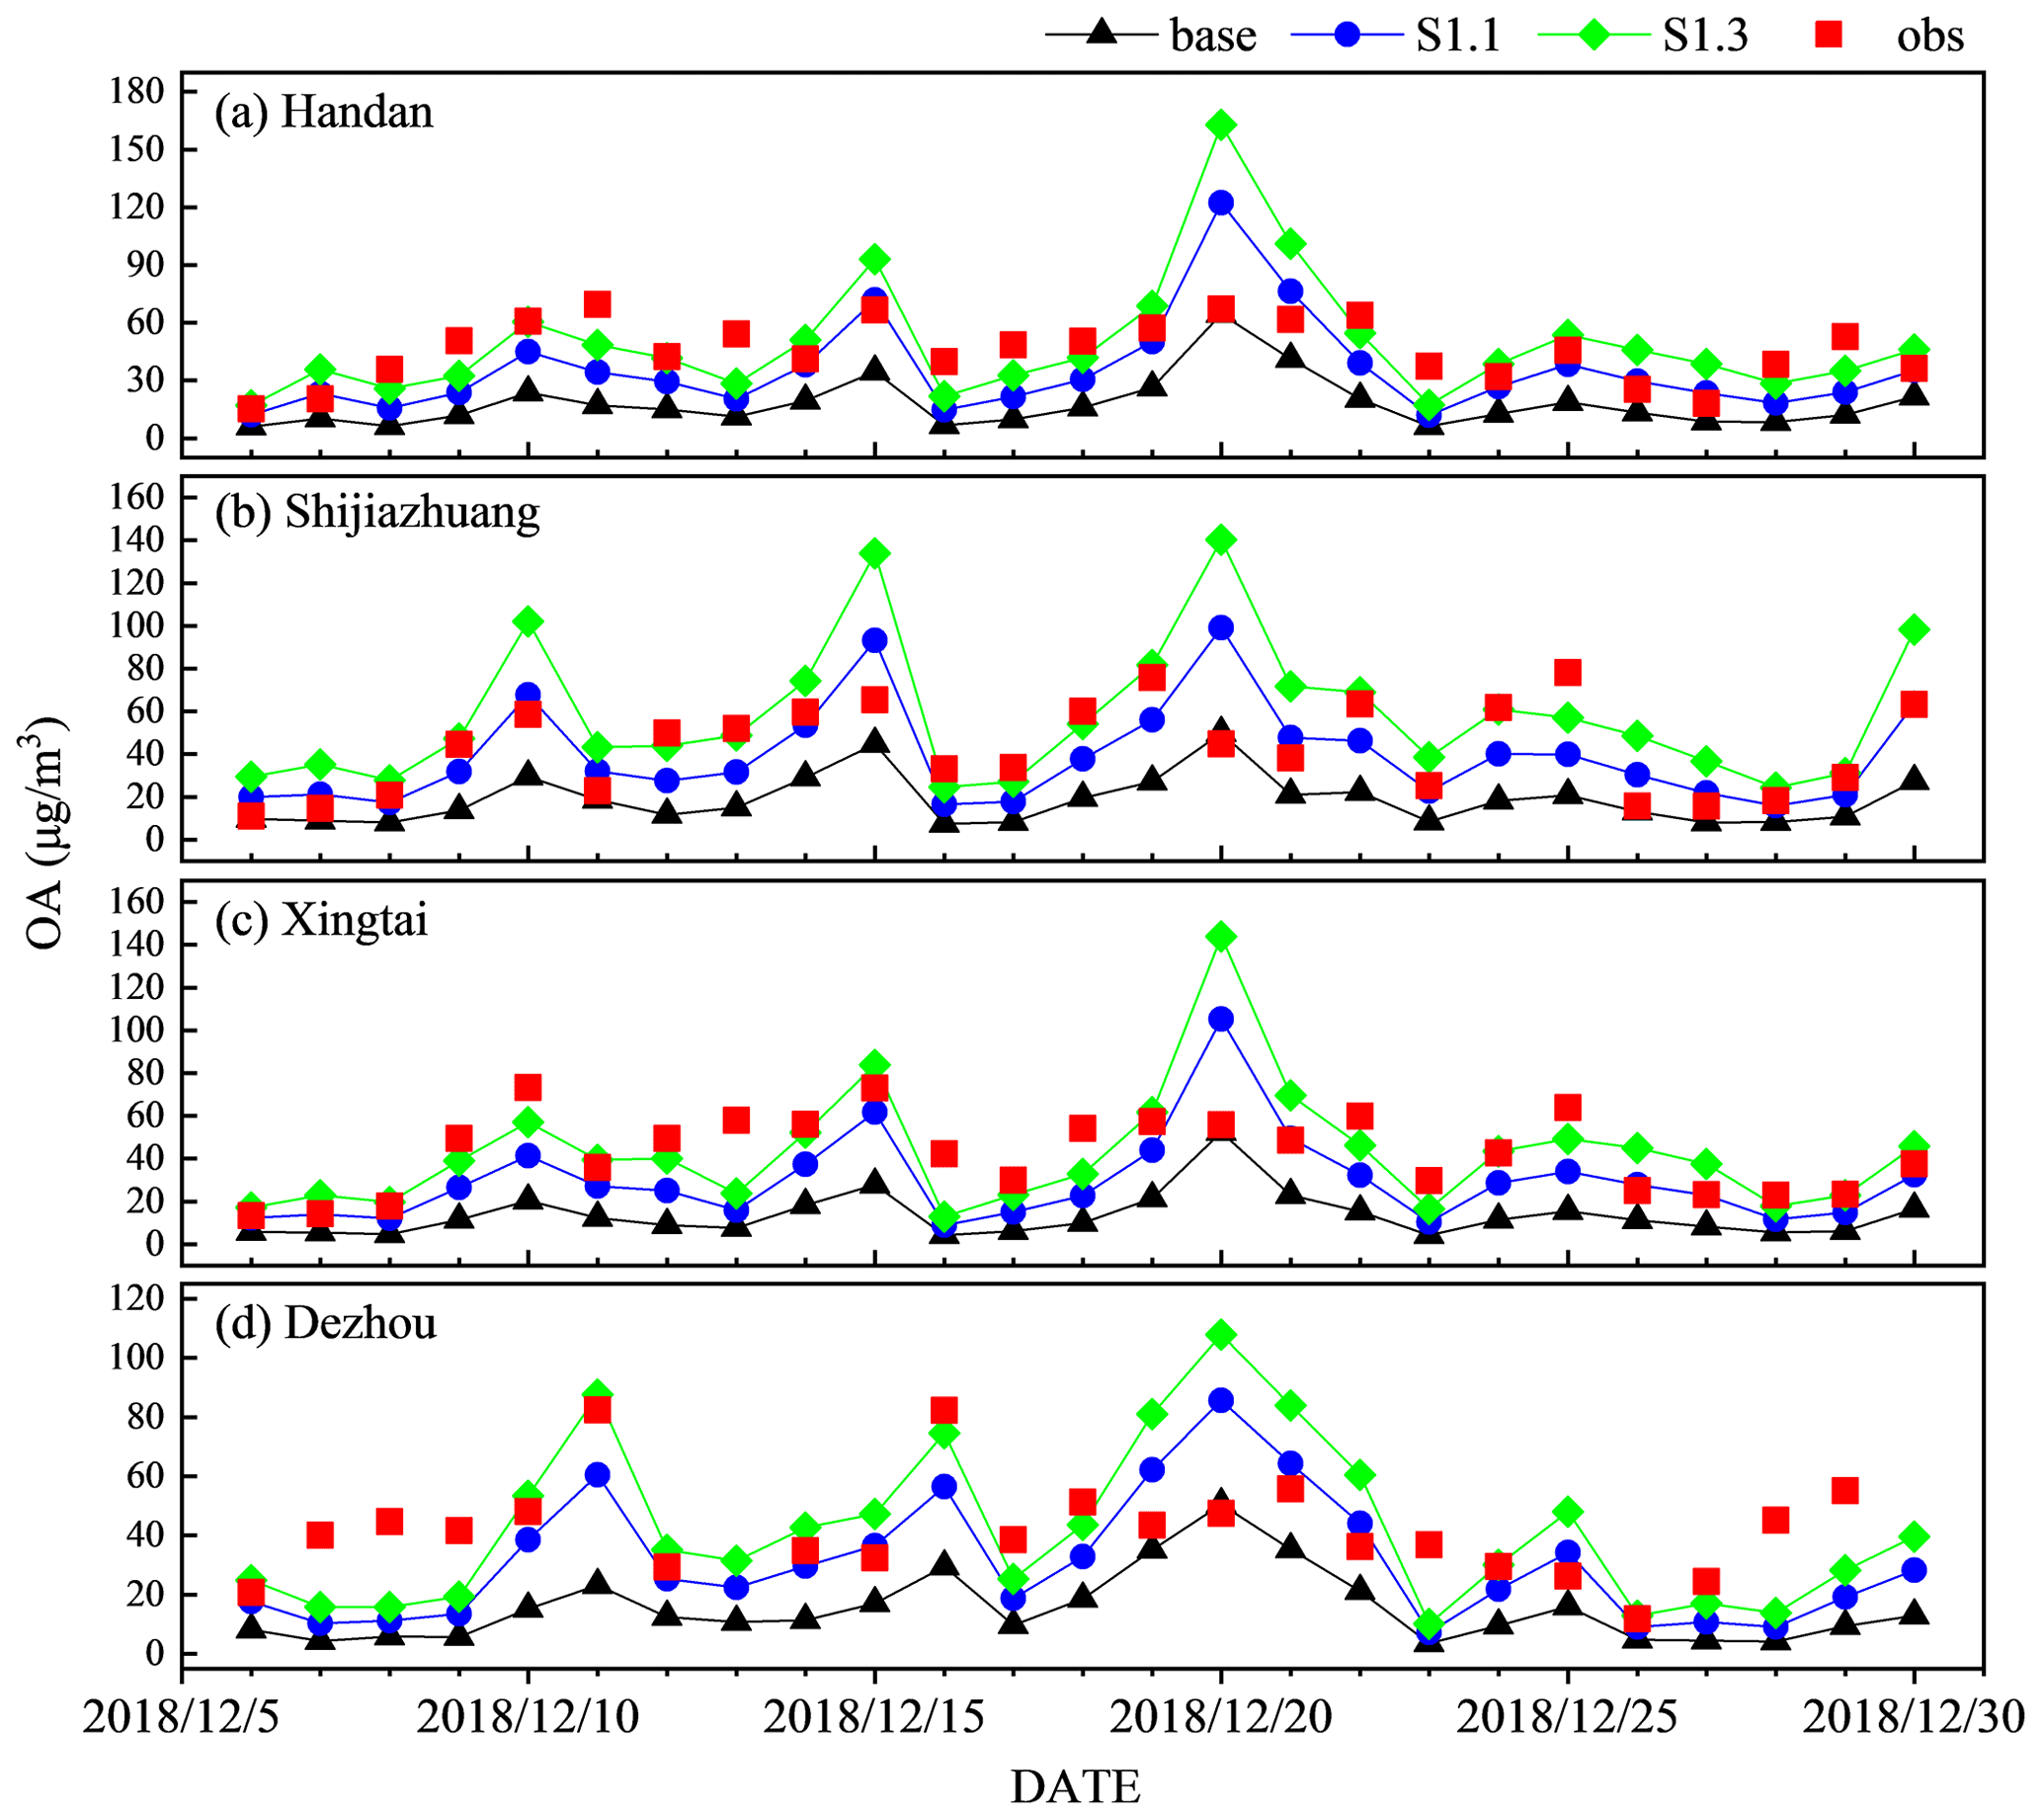
Figure 7The observed and simulated daily OA concentrations at (a) Handan, (b) Shijiazhuang, (c) Xingtai, and (d) Dezhou from 6 to 30 December 2018.
3.3 Effects of CPM on OA and PM2.5 concentrations
To ensure the accuracy and reliability of our modeling results, further studies in other cities are presented. Figure 6 shows large contributions of CPM to OA at Changsha and Qianyanzhou on 3 November 2014. After the inclusion of CPM effects in the S1.1, S1.2, and S1.3 cases versus the base case, the simulated OA concentrations were improved by 6.28, 15.80, and 9.60 µg m−3 for Changsha, respectively. The simulated OA concentrations increased by 7.06, 15.28, and 10.14 µg m−3 in the S1.1, S1.2, and S1.3 cases versus the base case for Qianyanzhou, respectively. Comparatively, the S1.2 case contributed to greater increases in OA concentrations, narrowing the simulation–observation bias from 79 % to less than 40 % for Changsha and from more than 70 % to less than 25 % for Qianyanzhou. The remaining bias was probably attributed to the underestimation of our estimated CPM emissions, the effects of meteorological factors, and other missing SOA formation pathways.

Figure 8Spatial distributions of the concentrations of POA, SOA, and OA averaged over the whole period from 14 October to 14 November in 2014 generated by the simulations with FPM sources (base) and CPM sources (S1.1-base, S1.2-base, and S1.3-base).
The impacts of CPM on OA were studied in the BTH 2 + 26 cities during the period from 6 to 30 December 2018. Improvements in simulated daily OA concentrations were found for Handan, Shijiazhuang, Xingtai, and Dezhou after the consideration of CPM, especially for high-pollution days (Fig. 7). The modeled underestimations of OA were improved from −60.88 % to −22.55 %, from −56.47 % to −7.91 %, from −68.38 % to −30.51 %, and from −62.84 % to −24.99 % with the inclusion of CPM emissions in the S1.1 case relative to the base case for Handan, Shijiazhuang, Xingtai, and Dezhou, respectively (Table 5). The contribution of CPM emissions to total OA concentrations reached up to 49 %, 53 %, 54 %, and 50 % for Handan, Shijiazhuang, Xingtai, and Dezhou, respectively. Under the S1.3 scenario, the OA simulations showed greater increases, and they slightly exceeded observed values, with mean biases of 8.00 %, 37.42 %, 0.81 %, and 2.21 % for the four respective abovementioned cities. For example, daily OA levels in Handan increased by between 5.60 and 57.89 µg m−3 after including CPM effects (S1.1 versus the base case). On average, the inclusion of CPM doubled the OA concentrations. However, some observations were not captured, whereas other observed values (e.g., on 20 December) were overestimated, indicating uncertainties in the estimated organic CPM emissions. Under the S1.3 scenario, the average simulated OA concentrations were enhanced by 1.8 times relative to the base case, with good representation of some underestimated values in the S1.1 case. For Shijiazhuang, which had daily OA concentrations below 80 µg m−3, the base case underestimated OA levels by 12 %–78 %. After incorporating the CPM emissions in the S1.1 case, the daily OA concentrations were significantly improved by a factor of between 0.7 and 1.7. Some observed high values of OA were well captured in the S1.1 case on December 10, with a simulated value of 67.75 µg m−3 versus an observed value of 58.65 µg m−3, and on 14 and 30 December. Under the S1.3 scenario, the daily OA levels increased by a factor of between 1.3 and 3.6 relative to the base case. Although the average OA concentrations were somewhat overestimated in the S1.3 case, good agreement between observed and simulated values existed on some days, including 9, 12, 13, 16–19, and 24 December. For Xingtai, the simulated OA concentrations were enhanced by a factor of between 1.0 and 1.8 in the S1.1 case relative to the base case. The model can resolve 69 % of the average OA observations in the S1.1 case when the emissions of CPM were included. The simulated average OA value was improved by 29.21 µg m−3 in the S1.3 case compared with the base case. Dezhou showed similar results with an enhancement of 0.7–1.6 times for daily OA contributed by CPM in S1.1. Although the observed high OA concentrations that exceeded 80 µg m−3 on 11 and 16 December were not captured in the S1.1 case, the bias between the simulated and observed values was reduced to −21.92 and −25.63 µg m−3 versus −59.17 and −52.64 µg m−3 in the base case, respectively. The underestimations of high OA levels on 11 and 16 December were resolved in the S1.3 case, and the average concentration over the whole period was very close to the observed value. Table S2 shows the model evaluation results for PM2.5 concentrations for different sensitivity simulation cases. Dezhou was not included due to missing data. After including the CPM emissions in the S1.1 case, the model can resolve 86 %, 86 %, and 72 % of average PM2.5 observations with a 32 %, 37 %, and 38 % increase in PM2.5 concentrations relative to the base case for Handan, Shijiazhuang, and Xingtai, respectively. PM2.5 simulations were further enhanced for these four cities in the S1.3 case, with NMB values of 2.04 %, 7.21 %, and −12.08 %, respectively. It was notable that the emissions of inorganic components in CPM were not investigated in this study, which can cause modeling deviation. Other factors including boundary layer height and wind can also affect the simulations. In summary, our estimated CPM emissions showed a reasonable range, which can make a significant contribution to atmospheric OA and PM2.5.
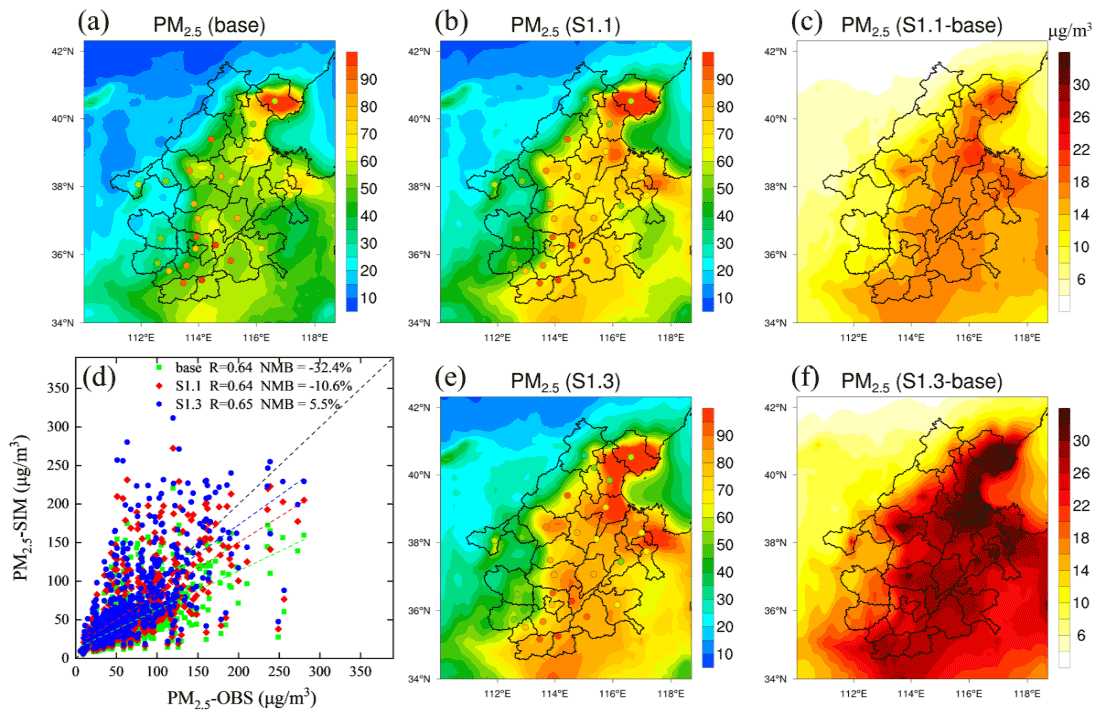
Figure 9Spatial distributions of the average PM2.5 concentrations over the BTH2 + 26 cities during the period from 6 to 30 December 2018 for the (a) base, (b) S1.1, and (e) S1.3 scenarios as well as (c) the absolute difference between the S1.1 and base scenarios and (f) the absolute difference between the S1.3 and base scenarios. Among them, the PM2.5 concentrations from 22 to 26 December are not included due to the missing observational data. (d) Scatterplots and linear regressions of observed (OBS) and simulated (SIM) daily PM2.5 concentrations for all of the BTH2 + 26 cities during the above time period under the base, S1.1, and S1.3 scenarios.
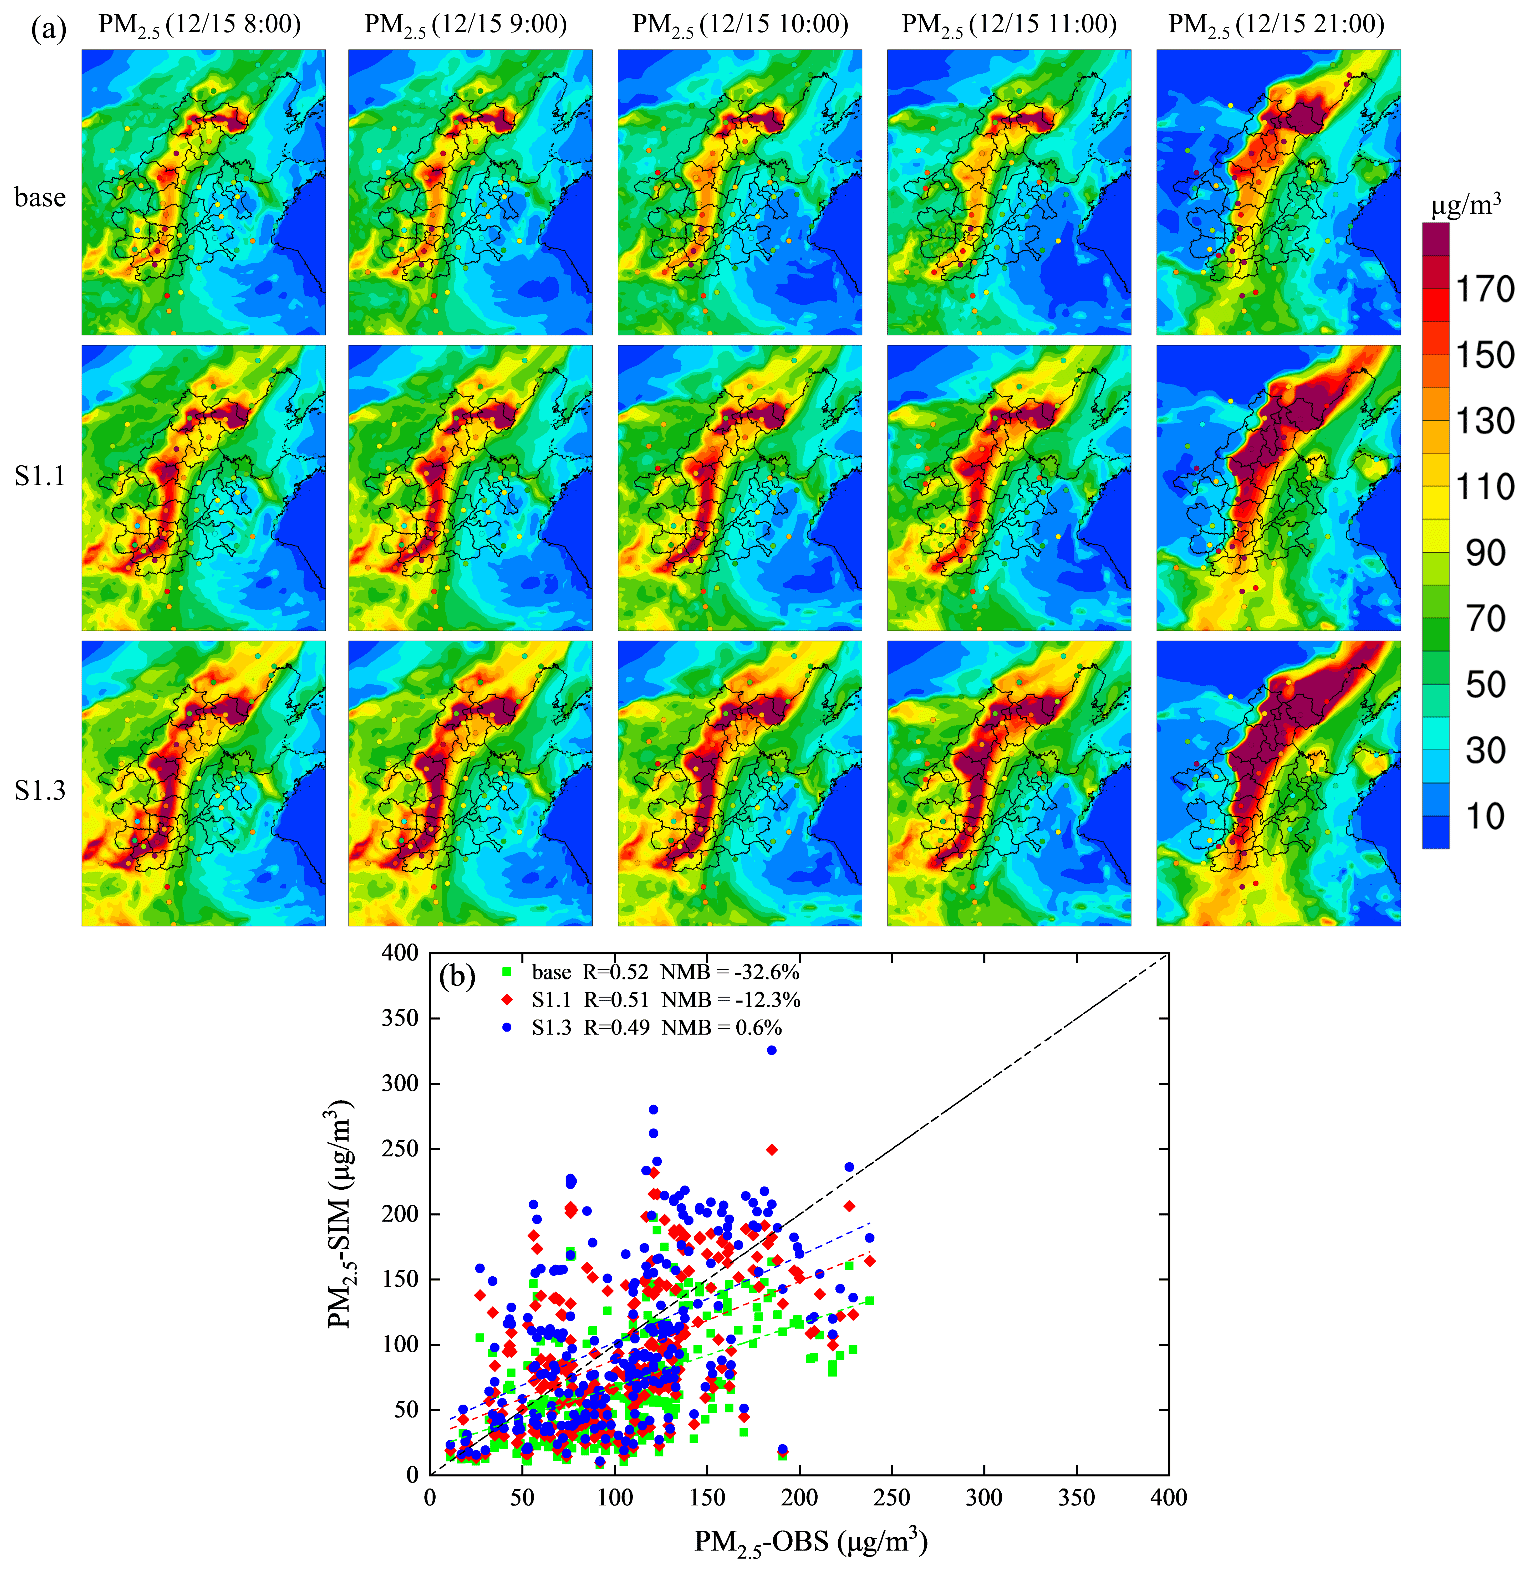
Figure 10(a) Spatial distributions of hourly PM2.5 concentrations at some peak hours over the BTH2 + 26 and some other surrounding cities under the base, S1.1, and S1.3 scenarios. The colored dots denote the observed values for each city. (b) Scatterplots and linear regressions of observed (OBS) and simulated (SIM) hourly PM2.5 concentrations for all cities under the base, S1.1, and S1.3 scenarios.
3.4 Regional contributions of CPM to OA and PM2.5
The regional effects of CPM emissions on atmospheric OA and PM2.5 from a nationwide perspective were investigated. The concentrations of POA, SOA, and OA averaged over the whole study period, from 14 October to 14 November 2014, showed varying degrees of regional increase after incorporating CPM emissions, mainly in the central and eastern regions in China (Fig. 8). In the base case, the simulated values of POA and SOA were both lower than 14 µg m−3 over China. Correspondingly, OA concentrations did not exceed 22 µg m−3, with the maximum values distributed in the BTH region and Central China. After the consideration of CPM effects in the S1.1 case relative to the base case, the concentrations of POA, SOA, and OA substantially increased over North China, East China, and Central China including Beijing; Tianjin; Shanghai; and the provinces of Liaoning, Shandong, Shanxi, Henan, Hubei, Anhui, Jiangsu, Zhejiang, Hunan, and Jiangxi. The most remarkable enhancement values were up to 10, 12, and 20 µg m−3 for POA, SOA, and OA, respectively. Moreover, under the S1.2 scenario with the same emissions as the S1.1 case but different S/IVOC parameterization, substantial increases in the simulated POA values, by more than 16 µg m−3, were found for most cities in North China, East China, and Central China, with the maximum distributed in the BTH region (up to 24 µg m−3), which was attributed to large amounts of emissions from industrial plants and power plants in this region. The OA concentrations for many cities located in North China and East China increased by more than 24 µg m−3 after including CPM emissions in the S1.2 case. As the contributions of CPM to SOA in the S1.2 case were only slightly larger than those in the S1.1 case, the greater improvements in OA in the S1.2 scenario mainly resulted from the POA increases. The regional increases in the simulated POA, SOA, and OA values in the S1.3 case were not lower than 10, 8, and 18 µg m−3 for most cities in North China, East China, and Central China, respectively.
The regional contributions of organic CPM emissions to PM2.5 concentrations were explored in the BTH2 + 26 cities averaged over the period from 6 to 30 December 2018 (Fig. 9). In the base case without the CPM effects, the model comparisons against observations suggest that PM2.5 levels were greatly underestimated in almost all cities except Tangshan (Fig. 9a). Several cities with observed PM2.5 concentrations higher than 80 µg m−3 showed the greatest underestimations, with simulated values under 50 µg m−3. Under the S1.1 scenario including CPM emissions, the simulated PM2.5 concentrations were substantially enhanced in almost all of the studied cities and were, thus, closer to the observations (Fig. 9b). The contributions of CPM to PM2.5 were not lower than 14 µg m−3 for the most cities (Fig. 9c). Under the S1.3 scenario, CPM made a significant contribution to PM2.5 concentrations, more than 24 µg m−3 for most cities (Fig. 9f). High observed values for Baoding, Shijiazhuang, Xingtai, Hengshui, Dezhou, and Handan were well captured (Fig. 9e). The scatterplots of observed and simulated daily PM2.5 concentrations for all BTH2 + 26 cities in Fig. 9d show an obvious improvement in PM2.5 simulations after including CPM emissions, with NMB values from −32.4 % in the base case to −10.6 % in the S1.1 case and to 5.5 % in the S1.3 case. Nevertheless, there were still model–measurement biases for PM2.5 concentrations in some cities with high observed values exceeding 90 µg m−3, including Baoding, Anyang, Puyang, Heze, Zhengzhou, and Kaifeng. The insufficient improvement in PM2.5 can be attributed to incomplete emission information of inorganic components, which require further research. In addition, some heavy-pollution hours were chosen to investigate the regional impacts of CPM on PM2.5 concentrations, including 08:00, 09:00, 10:00, 11:00, and 21:00 LT (local time, UTC+8:00) on 15 December (Fig. 10a). Besides the BTH2 + 26 cities, some surrounding cities (Chaoyang, Chengde, Datong, Dongying, Huludao, Jinzhou, Linxi, Luoyang, Luohe, Qinhuangdao, Qingdao, Rizhao, Sanmenxia, Shangqiu, Shuozhou, Tai'an, Weihai, Weifang, Xinzhou, Xinyang, Yantai, Zaozhuang, Zhangjiakou, Zhoukou, and Zhumadian) were also included. Results show that the underestimated PM2.5 concentrations in the base case were substantially improved after considering CPM emissions in S1.1 and S1.3, especially for some high observed values over 170 µg m−3. Better agreement between simulated and observed PM2.5 concentrations for all of these cities was achieved, with NMB values from −32.6 % in the base case to −12.3 % in S1.1 and to 0.6 % in S1.3 (Fig. 10b). In summary, the consideration of CPM effects can improve the underestimation of regional OA and PM2.5 simulations to a certain extent, especially during the heavy-pollution periods.
In this study, we focused on emissions of condensable PM from stationary combustion and mobile sources and developed an emission inventory of organic CPM in China. Using emission inputs with and without CPM contributions, the CMAQ model was applied to simulate the impacts of CPM on atmospheric OA and PM2.5 in China. The results show that the inclusion of CPM emissions increased annual OA emissions by a factor of 2 for both the years 2014 and 2017. The power plant, industry combustion, and steel sectors in the stationary combustion sources dominated OA emissions in the new inventory. A series of sensitivity scenarios with different emission ratios and volatility distributions show that CPM contributed significantly to the improvement of hourly SOA and POA concentrations in Beijing during the period from 14 October to 14 November 2014. The contributions of CPM were 51 %–85 % for POA and 42 %–58 % for SOA under these scenarios. The model comparison against observations suggests that the consideration of CPM effects improved the underestimations of simulation results and captured the peak SOA and POA values well. In addition, the enhancements of daily OA levels by CPM were demonstrated during the 6–30 December 2018 period at Handan, Shijiazhuang, Xingtai, and Dezhou. Compared with daily observations, the NMB values for POA, SOA, and OA in these four cities were improved from −60.88 %, −56.47 %, −68.38 %, −62.84 % (the base case) to −22.55 %, −7.91 %, −30.51 %, −24.99 % (the S1.1 case), respectively. The regional contributions of CPM also narrowed the gap between simulated and observed concentrations of PM2.5 in the BTH2 + 26 cities. In conclusion, our estimated CPM emissions contributed significantly to the improvement of simulation performance for both atmospheric OA and PM2.5, especially during high-pollution episodes. Therefore, the CPM emissions can be incorporated into chemical transport models along with FPM to improve the simulation accuracies of OA and PM2.5.
Our estimates of organic CPM emissions and SOA formation from CPM contained the following uncertainties:
-
The construction of the organic CPM emission inventory in the present study was based on EPOA(CPM) / (FPM) ratios derived from limited sources, instead of actual measurement data of CPM emissions from the different sources and regions over China.
-
As there was no explicit volatility characterization of primary organic CPM species available for incorporation into the emission inventories, the S/IVOCs emissions were scaled to the POA emissions.
-
Due to the lack of relevant data, the original surrogate species of S/IVOCs and their properties in the CMAQ model remained unchanged for representing the SOA formation from CPM, rather than introducing new model species with identified parameters related to OH reaction rates, effective saturation concentration, and multigenerational aging products.
Based on these limitations, it is strongly recommended that future studies conduct extensive surveys of CPM emissions from various stationary combustion sources and measure the actual emissions of source-specific and region-specific S/IVOCs to better constrain OA simulations by chemical transport models.
The emission data and model results are available from the authors upon request.
The supplement related to this article is available online at: https://doi.org/10.5194/acp-22-11845-2022-supplement.
SY and PL conceived and designed the research. ML performed the model simulations. ML, XC, YZ, and ZL conducted data analysis. ZS, WL, XZ, BNM, KA, RM, DR, and JHS contributed to the scientific discussions. MZ, YS, ZL, JJ, and CS provided observational data. SW provided the ABaCAS emission data. SY, ML, PL, and JHS wrote and revised the manuscript.
The contact author has declared that none of the authors has any competing interests.
The views expressed in this article are those of the authors and do not
necessarily represent the views or policies of the U.S. Environmental
Protection Agency.
Publisher’s note: Copernicus Publications remains neutral with regard to jurisdictional claims in published maps and institutional affiliations.
The authors would like to thank the comprehensive data collection and sharing platform for atmospheric environmental science as well as the CERN Atmospheric Science Branch of the Institute of Atmospheric Physics, Chinese Academy of Sciences, for providing OC measurement data.
This research has been supported by the National Natural Science Foundation of China (grant nos. 42175084, 21577126, 41561144004, and 92044302), the Department of Science and Technology of China (grant nos. 2018YFC0213506 and 2018YFC0213503), and the National Research Program for Key Issues in Air Pollution Control in China (grant no. DQGG0107). Pengfei Li is supported by the National Natural Science Foundation of China (grant no. 22006030), the Science and Technology Program of Hebei Province (grant no. 22343702D), the Research Foundation of Education Bureau of Hebei (grant no. BJ2020032), and the Initiation Fund of Hebei Agricultural University (grant no. 412201904).
This paper was edited by Yafang Cheng and reviewed by two anonymous referees.
Ansari, T. U., Wild, O., Li, J., Yang, T., Xu, W., Sun, Y., and Wang, Z.: Effectiveness of short-term air quality emission controls: a high-resolution model study of Beijing during the Asia-Pacific Economic Cooperation (APEC) summit period, Atmos. Chem. Phys., 19, 8651–8668, https://doi.org/10.5194/acp-19-8651-2019, 2019.
Appel, K. W., Bash, J. O., Fahey, K. M., Foley, K. M., Gilliam, R. C., Hogrefe, C., Hutzell, W. T., Kang, D., Mathur, R., Murphy, B. N., Napelenok, S. L., Nolte, C. G., Pleim, J. E., Pouliot, G. A., Pye, H. O. T., Ran, L., Roselle, S. J., Sarwar, G., Schwede, D. B., Sidi, F. I., Spero, T. L., and Wong, D. C.: The Community Multiscale Air Quality (CMAQ) model versions 5.3 and 5.3.1: system updates and evaluation, Geosci. Model Dev., 14, 2867–2897, https://doi.org/10.5194/gmd-14-2867-2021, 2021.
Carlton, A. G. and Baker, K. R.: Photochemical modeling of the ozark isoprene volcano: MEGAN, BEIS, and their impacts on air quality predictions, Environ. Sci. Technol., 45, 4438–4445, https://doi.org/10.1021/es200050x, 2011.
Carlton, A. G., Wiedinmyer, C., and Kroll, J. H.: A review of Secondary Organic Aerosol (SOA) formation from isoprene, Atmos. Chem. Phys., 9, 4987–5005, https://doi.org/10.5194/acp-9-4987-2009, 2009.
Chen, L., Zhu, J., Liao, H., Gao, Y., Qiu, Y., Zhang, M., Liu, Z., Li, N., and Wang, Y.: Assessing the formation and evolution mechanisms of severe haze pollution in the Beijing–Tianjin–Hebei region using process analysis, Atmos. Chem. Phys., 19, 10845–10864, https://doi.org/10.5194/acp-19-10845-2019, 2019.
Choi, Y. J. and Fernando, H. J. S.: Implementation of a windblown dust parameterization into MODELS-3/CMAQ: Application to episodic PM events in the US/Mexico border, Atmos. Environ., 42, 6039–6046, https://doi.org/10.1016/j.atmosenv.2008.03.038, 2008.
Corio, L. A. and Sherwell, J.: In-stack condensible particulate matter measurements and issues, J. Air Waste Manage. Assoc., 50, 207–218, https://doi.org/10.1080/10473289.2000.10464002, 2000.
Denier van der Gon, H. A. C., Bergström, R., Fountoukis, C., Johansson, C., Pandis, S. N., Simpson, D., and Visschedijk, A. J. H.: Particulate emissions from residential wood combustion in Europe – revised estimates and an evaluation, Atmos. Chem. Phys., 15, 6503–6519, https://doi.org/10.5194/acp-15-6503-2015, 2015.
Donahue, N. M., Robinson, A. L., Stanier, C. O., and Pandis, S. N.: Coupled partitioning, dilution, and chemical aging of semivolatile organics, Environ. Sci. Technol., 40, 2635–2643, https://doi.org/10.1021/es052297c, 2006.
Donahue, N. M., Epstein, S. A., Pandis, S. N., and Robinson, A. L.: A two-dimensional volatility basis set: 1. organic-aerosol mixing thermodynamics, Atmos. Chem. Phys., 11, 3303–3318, https://doi.org/10.5194/acp-11-3303-2011, 2011.
Dong, Z., Wang, S., Xing, J., Chang, X., Ding, D., and Zheng, H.: Regional transport in Beijing-Tianjin-Hebei region and its changes during 2014–2017: The impacts of meteorology and emission reduction, Sci. Total Environ., 737, 139792, https://doi.org/10.1016/j.scitotenv.2020.139792, 2020.
Feng, Y., Li, Y., and Cui, L.: Critical review of condensable particulate matter, Fuel, 224, 801–813, https://doi.org/10.1016/j.fuel.2018.03.118, 2018.
Feng, Y., Li, Y., Zhang, X., Su, S., Zhang, Z., Gan, Z., and Dong, Y.: Comparative study on the characteristics of condensable particulate matter emitted from three kinds of coal, Environ. Pollut., 270, 116267, https://doi.org/10.1016/j.envpol.2020.116267, 2021.
Fu, T.-M., Cao, J. J., Zhang, X. Y., Lee, S. C., Zhang, Q., Han, Y. M., Qu, W. J., Han, Z., Zhang, R., Wang, Y. X., Chen, D., and Henze, D. K.: Carbonaceous aerosols in China: top-down constraints on primary sources and estimation of secondary contribution, Atmos. Chem. Phys., 12, 2725–2746, https://doi.org/10.5194/acp-12-2725-2012, 2012.
Fuzzi, S., Andreae, M. O., Huebert, B. J., Kulmala, M., Bond, T. C., Boy, M., Doherty, S. J., Guenther, A., Kanakidou, M., Kawamura, K., Kerminen, V.-M., Lohmann, U., Russell, L. M., and Pöschl, U.: Critical assessment of the current state of scientific knowledge, terminology, and research needs concerning the role of organic aerosols in the atmosphere, climate, and global change, Atmos. Chem. Phys., 6, 2017–2038, https://doi.org/10.5194/acp-6-2017-2006, 2006.
Gao, M., Carmichael, G. R., Wang, Y., Saide, P. E., Yu, M., Xin, J., Liu, Z., and Wang, Z.: Modeling study of the 2010 regional haze event in the North China Plain, Atmos. Chem. Phys., 16, 1673–1691, https://doi.org/10.5194/acp-16-1673-2016, 2016.
Gehring, U., Gruzieva, O., Agius, R. M., Beelen, R., Custovic, A., Cyrys, J., Eeftens, M., Flexeder, C., Fuertes, E., Heinrich, J., Hoffmann, B., de Jongste, J. C., Kerkhof, M., Klümper, C., Korek, M., Mölter, A., Schultz, E. S., Simpson, A., Sugiri, D., Svartengren, M., von Berg, A., Wijga, A. H., Pershagen, G., and Brunekreef, B.: Air pollution exposure and lung function in children: The ESCAPE project, Environ. Health Perspect., 121, 1357–1364, https://doi.org/10.1289/ehp.1306770, 2013.
Grieshop, A. P., Logue, J. M., Donahue, N. M., and Robinson, A. L.: Laboratory investigation of photochemical oxidation of organic aerosol from wood fires 1: measurement and simulation of organic aerosol evolution, Atmos. Chem. Phys., 9, 1263–1277, https://doi.org/10.5194/acp-9-1263-2009, 2009.
Han, Z., Xie, Z., Wang, G., Zhang, R., and Tao, J.: Modeling organic aerosols over east China using a volatility basis-set approach with aging mechanism in a regional air quality model, Atmos. Environ., 124, 186–198, https://doi.org/10.1016/j.atmosenv.2015.05.045, 2016.
Hayes, P. L., Carlton, A. G., Baker, K. R., Ahmadov, R., Washenfelder, R. A., Alvarez, S., Rappenglück, B., Gilman, J. B., Kuster, W. C., de Gouw, J. A., Zotter, P., Prévôt, A. S. H., Szidat, S., Kleindienst, T. E., Offenberg, J. H., Ma, P. K., and Jimenez, J. L.: Modeling the formation and aging of secondary organic aerosols in Los Angeles during CalNex 2010, Atmos. Chem. Phys., 15, 5773–5801, https://doi.org/10.5194/acp-15-5773-2015, 2015.
He, X., Wang, Q., Huang, X. H. H., Huang, D. D., Zhou, M., Qiao, L., Zhu, S., Ma, Y.-g., Wang, H.-l., Li, L., Huang, C., Xu, W., Worsnop, D. R., Goldstein, A. H., and Yu, J. Z.: Hourly measurements of organic molecular markers in urban Shanghai, China: Observation of enhanced formation of secondary organic aerosol during particulate matter episodic periods, Atmos. Environ., 240, 117807, https://doi.org/10.1016/j.atmosenv.2020.117807, 2020.
Hu, Y., Feng, Y., Wang, C., Ma, Z., and Jiang, T.: Studies on Monitoring Method of Condensable Particulate and Water-soluble Ions in Fumes from Coal Fired Boilers, Environ. Monit. Manag. Technol., 28, 41–45, http://lib.cqvip.com/Qikan/Article/Detail?id=667763259 (last access: 6 March 2022), 2016.
Huang, R.-J., Zhang, Y., Bozzetti, C., Ho, K.-F., Cao, J.-J., Han, Y., Daellenbach, K. R., Slowik, J. G., Platt, S. M., Canonaco, F., Zotter, P., Wolf, R., Pieber, S. M., Bruns, E. A., Crippa, M., Ciarelli, G., Piazzalunga, A., Schwikowski, M., Abbaszade, G., Schnelle-Kreis, J., Zimmermann, R., An, Z., Szidat, S., Baltensperger, U., El Haddad, I., and Prévôt, A. S. H.: High secondary aerosol contribution to particulate pollution during haze events in China, Nature, 514, 218–222, https://doi.org/10.1038/nature13774, 2014.
Huang, X., Ding, A., Gao, J., Zheng, B., Zhou, D., Qi, X., Tang, R., Wang, J., Ren, C., Nie, W., Chi, X., Xu, Z., Chen, L., Li, Y., Che, F., Pang, N., Wang, H., Tong, D., Qin, W., Cheng, W., Liu, W., Fu, Q., Liu, B., Chai, F., Davis, S. J., Zhang, Q., and He, K.: Enhanced secondary pollution offset reduction of primary emissions during COVID-19 lockdown in China, Natl. Sci. Rev., 8, nwaa137, https://doi.org/10.1093/nsr/nwaa137, 2021.
Jathar, S. H., Woody, M., Pye, H. O. T., Baker, K. R., and Robinson, A. L.: Chemical transport model simulations of organic aerosol in southern California: model evaluation and gasoline and diesel source contributions, Atmos. Chem. Phys., 17, 4305–4318, https://doi.org/10.5194/acp-17-4305-2017, 2017.
Kanakidou, M., Seinfeld, J. H., Pandis, S. N., Barnes, I., Dentener, F. J., Facchini, M. C., Van Dingenen, R., Ervens, B., Nenes, A., Nielsen, C. J., Swietlicki, E., Putaud, J. P., Balkanski, Y., Fuzzi, S., Horth, J., Moortgat, G. K., Winterhalter, R., Myhre, C. E. L., Tsigaridis, K., Vignati, E., Stephanou, E. G., and Wilson, J.: Organic aerosol and global climate modelling: a review, Atmos. Chem. Phys., 5, 1053–1123, https://doi.org/10.5194/acp-5-1053-2005, 2005.
Kroll, J. H. and Seinfeld, J. H.: Chemistry of secondary organic aerosol: Formation and evolution of low-volatility organics in the atmosphere, Atmos. Environ., 42, 3593–3624, https://doi.org/10.1016/j.atmosenv.2008.01.003, 2008.
Lane, T. E., Donahue, N. M., and Pandis, S. N.: Simulating secondary organic aerosol formation using the volatility basis-set approach in a chemical transport model, Atmos. Environ., 42, 7439–7451, https://doi.org/10.1016/j.atmosenv.2008.06.026, 2008.
Li, H., Zhang, Q., Zhang, Q., Chen, C., Wang, L., Wei, Z., Zhou, S., Parworth, C., Zheng, B., Canonaco, F., Prévôt, A. S. H., Chen, P., Zhang, H., Wallington, T. J., and He, K.: Wintertime aerosol chemistry and haze evolution in an extremely polluted city of the North China Plain: significant contribution from coal and biomass combustion, Atmos. Chem. Phys., 17, 4751–4768, https://doi.org/10.5194/acp-17-4751-2017, 2017.
Li, J.: Experimental study on emission characteristics of condensable particulate matter and typical organic pollutants in coal-fired flue gas, PhD thesis, School of Energy Engineering, Zhejiang University, China, 164 pp., https://kns.cnki.net/KCMS/detail/detail.aspx?dbname=CDFDLAST2019&filename=1019028601.nh (last access: 8 March 2022), 2018.
Li, J., Zhang, M., Wu, F., Sun, Y., and Tang, G.: Assessment of the impacts of aromatic VOC emissions and yields of SOA on SOA concentrations with the air quality model RAMS-CMAQ, Atmos. Environ., 158, 105–115, https://doi.org/10.1016/j.atmosenv.2017.03.035, 2017a.
Li, J., Qi, Z., Li, M., Wu, D., Zhou, C., Lu, S., Yan, J., and Li, X.: Physical and Chemical Characteristics of Condensable Particulate Matter from an Ultralow-Emission Coal-Fired Power Plant, Energy and Fuels, 31, 1778–1785, https://doi.org/10.1021/acs.energyfuels.6b02919, 2017b.
Li, J., Li, X., Zhou, C., Li, M., Lu, S., Yan, J., and Qi, Z.: Study on the Influencing Factors of the Distribution Characteristics of Polycyclic Aromatic Hydrocarbons in Condensable Particulate Matter, Energy and Fuels, 31, 13233–13238, https://doi.org/10.1021/acs.energyfuels.7b01991, 2017c.
Li, P., Yan, R., Yu, S., Wang, S., Liu, W., and Bao, H.: Reinstate regional transport of PM2.5 as a major cause of severe haze in Beijing, P. Natl. Acad. Sci. USA, 112, E2739–E2740, https://doi.org/10.1073/pnas.1502596112, 2015.
Li, X., Qiao, Y., Zhu, J., Shi, L., and Wang, Y.: The “APEC blue” endeavor: Causal effects of air pollution regulation on air quality in China, J. Clean. Prod., 168, 1381–1388, https://doi.org/10.1016/j.jclepro.2017.08.164, 2017.
Li, X., Zhou, C., Li, J., Lu, S., and Yan, J.: Distribution and emission characteristics of filterable and condensable particulate matter before and after a low-low temperature electrostatic precipitator, Environ. Sci. Pollut. Res., 26, 12798–12806, https://doi.org/10.1007/s11356-019-04570-y, 2019.
Li, Y., Ye, C., Liu, J., Zhu, Y., Wang, J., Tan, Z., Lin, W., Zeng, L., and Zhu, T.: Observation of regional air pollutant transport between the megacity Beijing and the North China Plain, Atmos. Chem. Phys., 16, 14265–14283, https://doi.org/10.5194/acp-16-14265-2016, 2016.
Li, Y., Tan, Z., Ye, C., Wang, J., Wang, Y., Zhu, Y., Liang, P., Chen, X., Fang, Y., Han, Y., Wang, Q., He, D., Wang, Y., and Zhu, T.: Using wavelet transform to analyse on-road mobile measurements of air pollutants: a case study to evaluate vehicle emission control policies during the 2014 APEC summit, Atmos. Chem. Phys., 19, 13841–13857, https://doi.org/10.5194/acp-19-13841-2019, 2019.
Liang, P., Zhu, T., Fang, Y., Li, Y., Han, Y., Wu, Y., Hu, M., and Wang, J.: The role of meteorological conditions and pollution control strategies in reducing air pollution in Beijing during APEC 2014 and Victory Parade 2015, Atmos. Chem. Phys., 17, 13921–13940, https://doi.org/10.5194/acp-17-13921-2017, 2017.
Lin, C. Q., Liu, G., Lau, A. K. H., Li, Y., Li, C. C., Fung, J. C. H., and Lao, X. Q.: High-resolution satellite remote sensing of provincial PM2.5 trends in China from 2001 to 2015, Atmos. Environ., 180, 110–116, https://doi.org/10.1016/j.atmosenv.2018.02.045, 2018.
Liu, Z., Gao, W., Yu, Y., Hu, B., Xin, J., Sun, Y., Wang, L., Wang, G., Bi, X., Zhang, G., Xu, H., Cong, Z., He, J., Xu, J., and Wang, Y.: Characteristics of PM2.5 mass concentrations and chemical species in urban and background areas of China: emerging results from the CARE-China network, Atmos. Chem. Phys., 18, 8849–8871, https://doi.org/10.5194/acp-18-8849-2018, 2018.
Lu, C. M., Dat, N. D., Lien, C. K., Chi, K. H., and Chang, M. B.: Characteristics of Fine Particulate Matter and Polycyclic Aromatic Hydrocarbons Emitted from Coal Combustion Processes, Energy and Fuels, 33, 10247–10254, https://doi.org/10.1021/acs.energyfuels.9b02201, 2019.
Lu, Q., Zhao, Y., and Robinson, A. L.: Comprehensive organic emission profiles for gasoline, diesel, and gas-turbine engines including intermediate and semi-volatile organic compound emissions, Atmos. Chem. Phys., 18, 17637–17654, https://doi.org/10.5194/acp-18-17637-2018, 2018.
Lu, Q., Murphy, B. N., Qin, M., Adams, P. J., Zhao, Y., Pye, H. O. T., Efstathiou, C., Allen, C., and Robinson, A. L.: Simulation of organic aerosol formation during the CalNex study: updated mobile emissions and secondary organic aerosol parameterization for intermediate-volatility organic compounds, Atmos. Chem. Phys., 20, 4313–4332, https://doi.org/10.5194/acp-20-4313-2020, 2020.
Morino, Y., Chatani, S., Tanabe, K., Fujitani, Y., Morikawa, T., Takahashi, K., Sato, K., and Sugata, S.: Contributions of Condensable Particulate Matter to Atmospheric Organic Aerosol over Japan, Environ. Sci. Technol., 52, 8456–8466, https://doi.org/10.1021/acs.est.8b01285, 2018.
Murphy, B. N. and Pandis, S. N.: Simulating the formation of semivolatile primary and secondary organic aerosol in a regional chemical transport model, Environ. Sci. Technol., 43, 4722–4728, https://doi.org/10.1021/es803168a, 2009.
Murphy, B. N., Woody, M. C., Jimenez, J. L., Carlton, A. M. G., Hayes, P. L., Liu, S., Ng, N. L., Russell, L. M., Setyan, A., Xu, L., Young, J., Zaveri, R. A., Zhang, Q., and Pye, H. O. T.: Semivolatile POA and parameterized total combustion SOA in CMAQv5.2: impacts on source strength and partitioning, Atmos. Chem. Phys., 17, 11107–11133, https://doi.org/10.5194/acp-17-11107-2017, 2017.
Murphy, B. N., Nolte, C. G., Sidi, F., Bash, J. O., Appel, K. W., Jang, C., Kang, D., Kelly, J., Mathur, R., Napelenok, S., Pouliot, G., and Pye, H. O. T.: The Detailed Emissions Scaling, Isolation, and Diagnostic (DESID) module in the Community Multiscale Air Quality (CMAQ) modeling system version 5.3.2, Geosci. Model Dev., 14, 3407–3420, https://doi.org/10.5194/gmd-14-3407-2021, 2021.
Odum, J. R., Hoffmann, T., Bowman, F., Collins, D., Flagan, R. C., and Seinfeld, J. H.: Gas/Particle Partitioning and Secondary Organic Aerosol Yields, Environ. Sci. Technol., 30, 2580–2585, https://doi.org/10.1021/ES950943+, 1996.
Pankow, J. F.: An absorption model of gas/particle partitioning of organic compounds in the atmosphere, Atmos. Environ., 28, 185–188, https://doi.org/10.1016/1352-2310(94)90093-0, 1994.
Pei, B.: Determination and emission of condensable particulate matter from coal-fired power plants, Huanjing Kexue, 36, 1544–1549, https://doi.org/10.13227/j.hjkx.2015.05.005, 2015.
Pennington, E. A., Seltzer, K. M., Murphy, B. N., Qin, M., Seinfeld, J. H., and Pye, H. O. T.: Modeling secondary organic aerosol formation from volatile chemical products, Atmos. Chem. Phys., 21, 18247–18261, https://doi.org/10.5194/acp-21-18247-2021, 2021.
Pope, C. A., Burnett, R. T., Thun, M. J., Calle, E. E., Krewski, D., Ito, K., and Thurston, G. D.: Lung cancer, cardiopulmonary mortality, and long-term exposure to fine particulate air pollution, J. Am. Med. Assoc., 287, 1132–1141, https://doi.org/10.1001/jama.287.9.1132, 2002.
Pye, H. O. T., Pinder, R. W., Piletic, I. R., Xie, Y., Capps, S. L., Lin, Y., Surratt, J. D., Zhang, Z., Gold, A., Luecken, D. J., Hutzell, W. T., Jaoui, M., Offenberg, J. H., Kleindienst, T. E., Lewandowski, M., and Edney, E. O.: Epoxide pathways improve model predictions of isoprene markers and reveal key role of acidity in aerosol formation. Environ. Sci. Technol., 47, 11056–11064, https://doi.org/10.1021/es402106h, 2013.
Pye, H. O. T., Murphy, B. N., Xu, L., Ng, N. L., Carlton, A. G., Guo, H., Weber, R., Vasilakos, P., Appel, K. W., Budisulistiorini, S. H., Surratt, J. D., Nenes, A., Hu, W., Jimenez, J. L., Isaacman-VanWertz, G., Misztal, P. K., and Goldstein, A. H.: On the implications of aerosol liquid water and phase separation for organic aerosol mass, Atmos. Chem. Phys., 17, 343–369, https://doi.org/10.5194/acp-17-343-2017, 2017.
Qi, Z., Li, J., Wu, D., Xie, W., Li, X., and Liu, C.: Particulate Matter Emission Characteristics and Removal Efficiencies of a Low-Low Temperature Electrostatic Precipitator, Energy and Fuels, 31, 1741–1746, https://doi.org/10.1021/acs.energyfuels.6b02692, 2017.
Qin, M., Murphy, B. N., Isaacs, K. K., McDonald, B. C., Lu, Q., McKeen, S. A., Koval, L., Robinson, A. L., Efstathiou, C., Allen, C., and Pye, H. O. T.: Criteria pollutant impacts of volatile chemical products informed by near-field modelling, Nat. Sustain., 4, 129–137, https://doi.org/10.1038/s41893-020-00614-1, 2021.
Robinson, A. L., Donahue, N. M., Shrivastava, M. K., Weitkamp, E. A., Sage, A. M., Grieshop, A. P., Lane, T. E., Pierce, J. R., and Pandis, S. N.: Rethinking organic aerosols: Semivolatile emissions and photochemical aging, Science, 315, 1259–1262, https://doi.org/10.1126/science.1133061, 2007.
Shrivastava, M., Fast, J., Easter, R., Gustafson Jr., W. I., Zaveri, R. A., Jimenez, J. L., Saide, P., and Hodzic, A.: Modeling organic aerosols in a megacity: comparison of simple and complex representations of the volatility basis set approach, Atmos. Chem. Phys., 11, 6639–6662, https://doi.org/10.5194/acp-11-6639-2011, 2011.
Shrivastava, M. K., Lane, T. E., Donahue, N. M., Pandis, S. N., and Robinson, A. L.: Effects of gas particle partitioning and aging of primary emissions on urban and regional organic aerosol concentrations, J. Geophys. Res. Atmos., 113, D18301, https://doi.org/10.1029/2007JD009735, 2008.
Simon, H., Bhave, P. V., Swall, J. L., Frank, N. H., and Malm, W. C.: Determining the spatial and seasonal variability in ratios across the US using multiple regression, Atmos. Chem. Phys., 11, 2933–2949, https://doi.org/10.5194/acp-11-2933-2011, 2011.
Song, J., Lu, S., Wu, Y., Zhou, C., Li, X., and Li, J.: Migration and distribution characteristics of organic and inorganic fractions in condensable particulate matter emitted from an ultralow emission coal-fired power plant, Chemosphere, 243, 125346, https://doi.org/10.1016/j.chemosphere.2019.125346, 2020.
Sun, Y., Du, W., Wang, Q., Zhang, Q., Chen, C., Chen, Y., Chen, Z., Fu, P., Wang, Z., Gao, Z., and Worsnop, D. R.: Real-Time Characterization of Aerosol Particle Composition above the Urban Canopy in Beijing: Insights into the Interactions between the Atmospheric Boundary Layer and Aerosol Chemistry, Environ. Sci. Technol., 49, 11340–11347, https://doi.org/10.1021/acs.est.5b02373, 2015.
Tang, L., Qu, J., Mi, Z., Bo, X., Chang, X., Anadon, L. D., Wang, S., Xue, X., Li, S., Wang, X., and Zhao, X.: Substantial emission reductions from Chinese power plants after the introduction of ultra-low emissions standards, Nat. Energy, 4, 929–938, https://doi.org/10.1038/s41560-019-0468-1, 2019.
U.S. EPA: Method 202-Dry Impinger Method for Determining Condensable Particulate Emissions From Stationary Sources, Proposed Rule, U. S. Environmental Protection Agency, 82 FR 42508, https://www.federalregister.gov/d/2017-18425 (last access: 11 March 2022), 2017.
Veld, M., Alastuey, A., Pandolfi, M., Amato, F., Pérez, N., Reche, C., Via, M., Minguillón, M. C., Escudero, M., and Querol, X.: Compositional changes of PM2.5 in NE Spain during 2009–2018: A trend analysis of the chemical composition and source apportionment, Sci. Total Environ., 795, 148728–148728, https://doi.org/10.1016/j.scitotenv.2021.148728, 2021.
Wang, G., Deng, J., Ma, Z., Hao, J., and Jiang, J.: Characteristics of filterable and condensable particulate matter emitted from two waste incineration power plants in China, Sci. Total Environ., 639, 695–704, https://doi.org/10.1016/j.scitotenv.2018.05.105, 2018.
Wang, G., Deng, J., Zhang, Y., Li, Y., Ma, Z., Hao, J., and Jiang, J.: Evaluating Airborne Condensable Particulate Matter Measurement Methods in Typical Stationary Sources in China, Environ. Sci. Technol., 54, 1363–1371, https://doi.org/10.1021/acs.est.9b05282, 2020.
Wang, K., Yang, L., Li, J., Sheng, Z., He, Q., and Wu, K.: Characteristics of condensable particulate matter before and after wet flue gas desulfurization and wet electrostatic precipitator from ultra-low emission coal-fired power plants in China, Fuel, 278, 118206, https://doi.org/10.1016/j.fuel.2020.118206, 2020.
Wang, L., Li, M., Yu, S., Chen, X., Li, Z., Zhang, Y., Jiang, L., Xia, Y., Li, J., Liu W., Li, P., Eric, L., Rosenfeld, D., and Seinfeld, J. H.: Unexpected rises of ozone in urban and rural areas and sulfur dioxide in rural areas during the coronavirus city lockdown in Hangzhou, China: Implications for air quality, Environ. Chem. Lett., 18, 1713–1723, https://doi.org/10.1007/s10311-020-01028-3, 2020.
Wang, L., Chen, X., Zhang, Y., Li, M., Li, P., Jiang, L., Xia, Y., Li, Z., Li, J., Wang L., Hou, T., Liu W., Rosenfeld D., Zhu T., Zhang Y., Chen J., Wang S., Huang Y., Seinfeld, J. H., and Yu, S.: Switching to electric vehicles can lead to significant reductions of PM2.5 and NO2 across China, One Earth, 4, 1037–1048, https://doi.org/10.1016/j.oneear.2021.06.008, 2021.
Wen, W., Cheng, S., Chen, X., Wang, G., Li, S., Wang, X., and Liu, X.: Impact of emission control on PM and the chemical composition change in Beijing-Tianjin-Hebei during the APEC summit 2014, Environ. Sci. Pollut. R., 23, 4509–4521, https://doi.org/10.1007/s11356-015-5379-5, 2016.
Wu, B., Bai, X., Liu, W., Lin, S., Liu, S., Luo, L., Guo, Z., Zhao, S., Lv, Y., Zhu, C., Hao, Y., Liu, Y., Hao, J., Duan, L., and Tian, H.: Non-Negligible Stack Emissions of Noncriteria Air Pollutants from Coal-Fired Power Plants in China: Condensable Particulate Matter and Sulfur Trioxide, Environ. Sci. Technol., 54, 6540–6550, https://doi.org/10.1021/acs.est.0c00297, 2020.
Wu, L., Wang, X., Lu, S., Shao, M., and Ling, Z.: Emission inventory of semi-volatile and intermediate-volatility organic compounds and their effects on secondary organic aerosol over the Pearl River Delta region, Atmos. Chem. Phys., 19, 8141–8161, https://doi.org/10.5194/acp-19-8141-2019, 2019.
Wu, Y., Wang, P., Yu, S., Wang, L., Li, P., Li, Z., Mehmood, K., Liu, W., Wu, J., Lichtfouse, E., Rosenfeld, D., and Seinfeld, J. H.: Residential emissions predicted as a major source of fine particulate matter in winter over the Yangtze River Delta, China, Environ. Chem. Lett., 16, 1117–1127, https://doi.org/10.1007/s10311-018-0735-6, 2018.
Xu, L., Pye, H. O. T., He, J., Chen, Y., Murphy, B. N., and Ng, N. L.: Experimental and model estimates of the contributions from biogenic monoterpenes and sesquiterpenes to secondary organic aerosol in the southeastern United States, Atmos. Chem. Phys., 18, 12613–12637, https://doi.org/10.5194/acp-18-12613-2018, 2018.
Xu, W. Q., Sun, Y. L., Chen, C., Du, W., Han, T. T., Wang, Q. Q., Fu, P. Q., Wang, Z. F., Zhao, X. J., Zhou, L. B., Ji, D. S., Wang, P. C., and Worsnop, D. R.: Aerosol composition, oxidation properties, and sources in Beijing: results from the 2014 Asia-Pacific Economic Cooperation summit study, Atmos. Chem. Phys., 15, 13681–13698, https://doi.org/10.5194/acp-15-13681-2015, 2015.
Yang, F., Li, Z., Liu, H., Feng, P., Tan, H., Zhang, S., and Lu, X.: Emission characteristics of condensable particulate matter and sulfur trioxide from coal-fired power plants, J. Energy Inst., 94, 146–156, https://doi.org/10.1016/j.joei.2020.12.003, 2021.
Yang, H., Lee, K., Hsieh, Y., Luo, S., and Li, M.: Filterable and Condensable Fine Particulate Emissions from Stationary Sources, Aerosol Air Qual. Res., 14, 2010–2016, https://doi.org/10.4209/aaqr.2014.08.0178, 2014.
Yang, H. H., Lee, K. T., Hsieh, Y. S., Luo, S. W., and Huang, R. J.: Emission characteristics and chemical compositions of both filterable and condensable fine particulate from steel plants, Aerosol Air Qual. Res., 15, 1672–1680, https://doi.org/10.4209/aaqr.2015.06.0398, 2015.
Yang, H.-H., Arafath, S. M., Lee, K.-T., Hsieh, Y.-S., and Han, Y.-T.: Chemical characteristics of filterable and condensable PM2.5 emissions from industrial boilers with five different fuels, Fuel, 232, 415–422, https://doi.org/10.1016/j.fuel.2018.05.080, 2018a.
Yang, H.-H., Arafath, S. M., Wang, Y.-F., Wu, J.-Y., Lee, K.-T., and Hsieh, Y.-S.: Comparison of Coal- and Oil-Fired Boilers through the Investigation of Filterable and Condensable PM2.5 Sample Analysis, Energy and Fuels, 32, 2993–3002, https://doi.org/10.1021/acs.energyfuels.7b03541, 2018b.
Yu, S., Mathur, R., Pleim, J., Wong, D., Gilliam, R., Alapaty, K., Zhao, C., and Liu, X.: Aerosol indirect effect on the grid-scale clouds in the two-way coupled WRF–CMAQ: model description, development, evaluation and regional analysis, Atmos. Chem. Phys., 14, 11247–11285, https://doi.org/10.5194/acp-14-11247-2014, 2014.
Zhang, Y., Tang, L., Croteau, P. L., Favez, O., Sun, Y., Canagaratna, M. R., Wang, Z., Couvidat, F., Albinet, A., Zhang, H., Sciare, J., Prévôt, A. S. H., Jayne, J. T., and Worsnop, D. R.: Field characterization of the PM2.5 Aerosol Chemical Speciation Monitor: insights into the composition, sources, and processes of fine particles in eastern China, Atmos. Chem. Phys., 17, 14501–14517, https://doi.org/10.5194/acp-17-14501-2017, 2017.
Zhang, Y., Deng, J., Wang, G., Li, Y., Xu, P., and Jiang, J.: Characterization of haracterization of condensable particulate matter emitted from a typical coking plant in iron and steel plant, Environ. Eng., 38, 154–158 + 125, https://doi.org/10.13205/j.hjgc.202009025, 2020.
Zhang, Y., Chen, X., Yu, S., Wang, L., Li, Z., Li, M., Liu, W., Li, P., Rosenfeld, D., and Seinfeld, J. H.: City-level air quality improvement in the Beijing-Tianjin-Hebei region from 2016/17 to 2017/18 heating seasons: Attributions and process analysis, Environ. Pollut., 274, 116523, https://doi.org/10.1016/j.envpol.2021.116523, 2021.
Zhao, B., Wang, S., Donahue, N. M., Jathar, S. H., Huang, X., Wu, W., Hao, J., and Robinson, A. L.: Quantifying the effect of organic aerosol aging and intermediate-volatility emissions on regional-scale aerosol pollution in China, Sci. Rep., 6, 28815, https://doi.org/10.1038/srep28815, 2016.
Zhao, B., Wu, W., Wang, S., Xing, J., Chang, X., Liou, K.-N., Jiang, J. H., Gu, Y., Jang, C., Fu, J. S., Zhu, Y., Wang, J., Lin, Y., and Hao, J.: A modeling study of the nonlinear response of fine particles to air pollutant emissions in the Beijing–Tianjin–Hebei region, Atmos. Chem. Phys., 17, 12031–12050, https://doi.org/10.5194/acp-17-12031-2017, 2017.
Zheng, C., Hong, Y., Liu, S., Yang, Z., Chang, Q., Zhang, Y., and Gao, X.: Removal and emission characteristics of condensable particulate matter in an ultralow emission power plant, Energy and Fuels, 32, 10586–10594, https://doi.org/10.1021/acs.energyfuels.8b02464, 2018.
Zheng, H., Cai, S., Wang, S., Zhao, B., Chang, X., and Hao, J.: Development of a unit-based industrial emission inventory in the Beijing–Tianjin–Hebei region and resulting improvement in air quality modeling, Atmos. Chem. Phys., 19, 3447–3462, https://doi.org/10.5194/acp-19-3447-2019, 2019.
Zhou, C.: Experimental study on emission and distribution characteristics of organic pollutants in condensable particulate matter in coal-fired flue gas., Master thesis, School of Energy Engineering, Zhejiang University, China, 82 pp., https://doi.org/10.27461/d.cnki.gzjdx.2019.001904, 2019.