the Creative Commons Attribution 4.0 License.
the Creative Commons Attribution 4.0 License.
 | 12 May 2021
Spatial and temporal changes of the ozone sensitivity in China based on satellite and ground-based observations
Wannan Wang
Ronald van der A
Jieying Ding
Michiel van Weele
Tianhai Cheng
Ground-level ozone (O3) pollution has been steadily getting worse in most parts of eastern China during the past 5 years. The non-linearity of O3 formation with its precursors like nitrogen oxides (NOx= NO + NO2) and volatile organic compounds (VOCs) are complicating effective O3 abatement plans. The diagnosis from space-based observations, i.e. the ratio of formaldehyde (HCHO) columns to tropospheric NO2 columns (HCHO NO2), has previously been proved to be highly consistent with our current understanding of surface O3 chemistry. HCHO NO2 ratio thresholds distinguishing O3 formation sensitivity depend on regions and O3 chemistry interactions with aerosol. To shed more light on the current O3 formation sensitivity over China, we have derived HCHO NO2 ratio thresholds by directly connecting satellite-based HCHO NO2 observations and ground-based O3 measurements over the major Chinese cities in this study. We find that a VOC-limited regime occurs for HCHO NO2 < 2.3, and a NOx-limited regime occurs for HCHO NO2 > 4.2. The HCHO NO2 between 2.3 and 4.2 reflects the transition between the two regimes. Our method shows that the O3 formation sensitivity tends to be VOC-limited over urban areas and NOx-limited over rural and remote areas in China. We find that there is a shift in some cities from the VOC-limited regime to the transitional regime that is associated with a rapid drop in anthropogenic NOx emissions, owing to the widely applied rigorous emission control strategies between 2016 and 2019. This detected spatial expansion of the transitional regime is supported by rising surface O3 concentrations. The enhanced O3 concentrations in urban areas during the COVID-19 lockdown in China indicate that a protocol with simultaneous anthropogenic NOx emissions and VOC emissions controls is essential for O3 abatement plans.
- Article
(10415 KB) - Full-text XML
-
Supplement
(888 KB) - BibTeX
- EndNote


Ground-level ozone (O3) is one of the major air pollutants that has negative impacts on human health and can result in eye and nose irritation, respiratory disease, and lung function impairment (Jerrett et al., 2009; Khaniabadi et al., 2017; Huang et al., 2018). Y. Tian et al. (2020) observed increased admissions for pneumonia associated with O3 exposure, especially for elderly people. In addition, it also has important impacts on climate as a greenhouse gas by absorbing thermal radiation (Fishman et al., 1979; IPCC, 2014). Photochemical tropospheric O3 is formed in a non-linear manner from O3 precursors such as volatile organic compounds (VOCs) and nitrogen oxides (NOx= NO + NO2) in the presence of sunlight (Crutzen, 1974; Jacob, 2000).
In 2008, China was found to be the largest contributor to Asian emissions of carbon monoxide (CO), NOx, non-methane volatile organic carbon (NMVOC), and methane (CH4) (Kurokawa et al., 2013). Because of these large emissions of anthropogenic air pollutants, the Chinese State Council released the “Air Pollution Prevention and Action Plan” (APPAP) on September 2013, which has as a key task to prevent and control air pollution in China (Cai et al., 2017). Since then, critical emission control strategies have been carried out that are designed to reduce the concentrations of six environmental pollutants: sulfur dioxide (SO2), nitrogen dioxide (NO2), CO, O3, and particulate matter (PM2.5 and PM10) (Zhang et al., 2016; Feng and Liao, 2016). During the past decade, the concentrations of many pollutants including SO2, NO2, CO, PM2.5, and PM10 have declined in most cities; however, O3 concentrations showed an increasing trend (W. N. Wang et al., 2017; Z. Wang et al., 2019; Zeng et al., 2019). Therefore, reducing O3 concentrations has become the focus of China's next air quality control strategy (Cheng et al., 2018).
In terms of O3 concentrations, the effectiveness of emissions control strategy depends on whether the photochemical regime of O3 formation is a VOC-limited or NOx-limited regime (Jin et al., 2020). In the VOC-limited (or NOx-saturated) regime, VOC emission reductions reduce the chemical production of organic radicals (RO2), which in turn lead to decreased cycling with NOx and consequently lower concentration of O3 (Milford et al., 1989). In the NOx-limited (or VOC-saturated) regime, NOx emission reductions reduce NO2 photolysis, which is the primary source of free oxygen atoms. Therefore, in a NOx-limited regime, NOx reductions reduce ambient O3. In contrast, in a VOC-limited regime, NOx acts to reduce O3, so a NOx decrease in emissions promotes O3 production (Kleinman, 1994).
The observed photochemical indicators and observation-based models (OBMs) are the most commonly used tools to diagnose the O3 formation sensitivity. O3 production efficiency (OPE =ΔO3 ΔNOz) and the H2O2 NOz (or H2O2 HNO3) ratio are two widely used indicators to infer the O3 formation regimes (Chou et al., 2011; Ding et al., 2013). T. Wang et al. (2017) concluded that lower OPE values (e.g. < 4) indicate a VOC-limited regime. In contrast, higher OPE values (e.g. > 7) indicate a NOx-limited regime. OPE values in the medium range (e.g. 4 < OPE < 7) mark the transition between the two regimes. Another indicator of the O3 formation sensitivity regime is the H2O2 NOz ratio. Hammer et al. (2002) defined that, in the VOC-limited regime, lower H2O2 NOz ratios would be expected and higher H2O2 NOz ratios indicate the NOx-limited regime. In the past decade, the observed photochemical indicators have been applied to identify the O3 formation sensitivity in different periods and regions of China.
The OBM combines in situ field observations and chemical box modelling. It is built on widely used chemistry mechanisms (e.g. Master Chemical Mechanism (MCM), Carbon Bond, Regional Atmospheric Chemical Mechanism (RACM), Statewide Air Pollution Research Center mechanism (SAPRC)) and applied to the observed atmospheric conditions to simulate various atmospheric chemical processes, including the in situ O3 production rate. However, ground-based measurements are often limited in time period and spatial extent. The OBM analysis requires measuring nitric oxide (NO) at sub-ppb levels and more than 50 different types of VOCs with high accuracy, which is difficult to achieve (T. Wang et al., 2017).
Satellite remote sensing provides an alternative way to investigate long time periods of O3 formation sensitivity on large spatial scales. For over 2 decades, satellite-based spectrometers have provided continuous global observations on a daily basis for two species indicative of O3 precursors, i.e. NO2 for NOx (Martin et al., 2004; Lamsal et al., 2014) and formaldehyde (HCHO) for VOCs (Palmer et al., 2003; Fu et al., 2007). NOx can be approximated from satellite observation of NO2 column because of the short lifetime of NOx and high ratio of NO2 NOx in the boundary layer (Duncan et al., 2010; Jin and Holloway, 2015). HCHO is an intermediate of the oxidation reaction of various VOCs in the atmosphere. The production of HCHO is approximately proportional to the summed rate of reactions of VOC with OH radicals (Sillman, 1995). Therefore, HCHO can be used as a tracer for VOCs in the absence of other VOC observations (Martin et al., 2004; Duncan et al., 2010). The O3 formation sensitivity is defined by the ratio of HCHO to NO2 (referred to as FNR) (Martin et al., 2004). Duncan et al. (2010) combined models and Ozone Monitoring Instrument (OMI) HCHO and NO2 data to show certain ranges of FNR that can be useful for classifying a region into VOC-limited or NOx-limited regime. An FNR smaller than 1 indicates the VOC-limited conditions, and an FNR higher than 2 indicates the NOx-limited conditions. An FNR in the range of 1–2 should generally be considered indicative of the transitional regime. These FNR thresholds defined by Duncan et al. (2010) have been widely used for various regions (Choi and Souri, 2015; Jin and Holloway, 2015; Souri et al., 2017; Jeon et al., 2018) and with different satellite instruments (Choi et al., 2012).
However, these prior studies linked FNR with surface O3 sensitivity in models (Martin et al., 2004; Duncan et al., 2010). Modelled and observed HCHO columns, NO2 columns, and surface O3 often disagree. Jin et al. (2017) found that the spatial and temporal correlations between the modelled and satellite-derived FNR vary over the used satellite instruments. Brown-Steiner et al. (2015) found persistent O3 biases under all configurations of a global climate–chemistry model (GCCM) with detailed tropospheric chemistry. Although FNR thresholds defined by Duncan et al. (2010) have been used previously to investigate O3-NOx-VOC sensitivity in China (Witte et al., 2011; Tang et al., 2012; Jin and Holloway, 2015), their conclusions were based on the atmospheric situations in the United States and may not be suitable for the more complicated air pollution in China, concerning the different emission factors, sources, pollution levels, and climatology. For example, compared with the United States, most cities in China have higher aerosol levels (van Donkelaar et al., 2010; X. Li et al., 2019). Secondary aerosol production may become a large sink of radicals, which could shift O3 production toward a VOC-limited regime under these FNR thresholds suited to the United States (Liu et al., 2012; K. Li et al., 2019). It is therefore useful to describe surface O3 sensitivity using FNR thresholds derived entirely from satellite-observed FNR and ground-based measurements of O3. In addition, Schroeder et al. (2017) using airborne measurements suggested that the range and span of FNR marking the transitional regime varies regionally.
In this study, we assess whether space-based HCHO NO2 ratios capture the non-linearity of O3 chemistry by matching satellite observations with ground-based O3 measurements over major Chinese cities. Thresholds suited for China between space-based HCHO NO2 and the ground-based O3 response patterns are derived from observations instead of model results. We focus on the spatial and temporal variability of O3 formation sensitivity using our FNR thresholds on a nationwide scale and in typical cities from 2016 to 2019.
More recently, a new unique situation has occurred with the outbreak of the COVID-19 pandemic, which provided a unique opportunity to demonstrate our predicted effects on O3 pollution in China. Efforts to halt the spread of COVID-19 have drastically reduced human activities worldwide (Siciliano et al., 2020; H. Tian et al., 2020). As a result of these restrictions, a significant reduction in primary air pollutant emissions, especially in the concentration of NO2, has been noticed in China and several European and American countries (Tobías et al., 2020; Wang and Su, 2020; Bauwens et al., 2020; Ding et al., 2020). By contrast, increasing O3 concentrations during the same period were observed in densely populated metropolitan areas throughout the world (Siciliano et al., 2020; Zoran et al., 2020; Huang et al., 2020).
Section 2 describes the data and methods used in this study. Section 3 presents our derived FNR thresholds method and variations of O3 formation sensitivity in China. In addition, impacts of the COVID-19 outbreak on O3 levels are discussed. Finally, Sect. 4 gives a brief summary.
2.1 Satellite data
We use the NO2 and HCHO observations from the Ozone Monitoring Instrument (OMI) aboard the National Aeronautics and Space Administration (NASA) satellite Aura, which was launched in July 2004 (Levelt et al., 2006). In an ascending sun-synchronous polar orbit, OMI passes the Equator at about 13:40 LT (local time), providing global measurements of aerosol parameters, cloud, and various trace gases (NO2 and HCHO among them) (Levelt et al., 2006). The high spatial resolution (13 km × 24 km at nadir) allows for observing fine details of atmospheric parameters (Jin and Holloway, 2015). OMI data are considered to be reliable and of good quality for the full mission thus far (Zara et al., 2018). In addition, the OMI overpass time is well suited to detect the O3 formation sensitivity during the afternoon, when O3 photochemical production peaks and when the boundary layer is high and the solar zenith angle is small, maximizing instrument sensitivity to HCHO and NO2 in the lower troposphere (Jin et al., 2017).
We use the OMI tropospheric NO2 and HCHO data products from the European Quality Assurance for Essential Climate Variables project (QA4ECV, http://www.qa4ecv.eu/, last access: 6 May 2021). NO2 data are compiled by the Royal Netherlands Meteorological Institute (KNMI). The tropospheric NO2 column density is defined as the vertically integrated number of NO2 molecules between the Earth's surface and the tropopause per unit area. We select QA4ECV NO2 daily observations following the recommendations given in the product specification document (Boersma et al., 2011) for this data product: (1) no processing error, (2) less than 10 % snow or ice coverage, (3) solar zenith angle less than 80 ∘, and (4) cloud radiance fraction less than 50 %. The QA4ECV NO2 monthly datasets are processed with a spatial resolution of 0.125∘ × 0.125∘. Boersma et al. (2018) reported the single-pixel uncertainties for the QA4ECV NO2 columns are 35 %–45 % in the polluted regions; the monthly mean NO2 columns are estimated to have an uncertainty of ±10 %.
The OMI tropospheric HCHO data are retrieved by the Belgian Institute for Space Aeronomy (BIRA-IASB) (Smedt et al., 2017a). We select processing_quality_flags = 0 or > 255, providing a selection of observations that is considered optimal. Zara et al. (2018) found that the QA4ECV HCHO slant column densities (SCDs) have uncertainties of 8–12×1015 molecule/cm2 and a remarkably stable trend (increase < 1 %/yr). The QA4ECV HCHO monthly datasets are available with a spatial resolution of 0.05∘ × 0.05∘. Temporal averaging has been shown to reduce the HCHO measurements uncertainty and noise (Millet et al., 2008). We regrid the monthly OMI HCHO data (0.05∘ × 0.05∘) to the same grid as for the monthly OMI NO2 data (0.125∘ × 0.125∘).
2.2 NOx emission
Emission inventories of air pollutants are important sources of information for policy makers and form essential input for air quality models. Bottom-up inventories are usually compiled from statistics on emitting activities and their typical emission factors but are sporadically updated (Li et al., 2017). Satellite-derived emission inventories have important advantages over bottom-up emission inventories: they are spatially consistent, have high temporal resolution, and provide up-to-date emission information (Mijling and van der A, 2012). In this study, we use monthly mean NOx surface emission estimates derived from OMI observations of tropospheric NO2 columns (the QA4ECV product discussed in Sect. 2) by the Daily Emission estimation Constrained by Satellite Observations (DECSO) algorithm. Mijling and van der A (2012) for the first time developed DECSO (version 1) by calculating the sensitivity of concentration to emission based on a chemical transport model and using trajectory analysis to account for transport away from the source. Ding et al. (2015) improved DECSO (version 3) and demonstrated that it is able to detect the monthly change of NOx emissions due to air quality regulations on a city level. The NOx emissions derived by the improved DECSO version 5 are in good agreement with other bottom-up anthropogenic emission inventories. In addition, the improved algorithm is able to better capture the seasonality of NOx emissions. The precision of monthly NOx emissions derived by DECSO version 5 for each grid cell is about 20 % (Ding et al., 2017). Here, we use NOx emissions derived by the latest DECSO version 5.1qa which provides monthly emissions for the last decade (2007–2020) (Ding et al., 2018). These datasets are available from https://www.temis.nl/emissions/region_asia/datapage.php (last access: 6 May 2021).
2.3 Ground-based observations
Since 2012, the Chinese government at various levels began to establish a national air quality monitoring network, which released real-time ground-level O3 monitoring data to the public. By 2016, the establishment of more than 1000 sites was completed, covering more than 300 cities across the country. At each monitoring site, the concentration of O3 is measured using the ultraviolet absorption spectrometry method and differential optical absorption spectroscopy; NO2 is measured using the chemiluminescence method by a set of commercial instruments. The instrumental operation, maintenance, data assurance, and quality control were conducted based on the most recent revisions of China environmental protection standards (CMEE, 2013).
We use hourly O3 and NO2 concentrations (in standard conditions: 273 K, 101.325 kPa) from the network of ∼1000 sites operated by the China Ministry of Ecology and Environment (CMEE) since 2016. CMEE revised the monitoring of pollutants to a new reference conditions (298 K, 101.325 kPa) since 1 September 2018 (CMEE, 2018). Daily ground-based O3 and NO2 observations are calculated from hourly observations at OMI overpass time (average of 13:00 and 14:00 LT). In this study, we convert the gas concentrations before 1 September 2018 from the standard conditions to the reference conditions. The temperature dependence is according to Charles's law (Eq. 1),
where Vstd is the volume of a gas under standard conditions, Vref is the volume of a gas under reference conditions, Tstd (unit: K) is the thermodynamic temperature of standard conditions, and Tref (unit: K) is the thermodynamic temperature of reference conditions. The gas concentration conversion follows
where Cstd is the gas concentration under standard conditions, and Cref is the gas concentration under reference conditions.
Because the Chinese national air quality monitoring network stations are mostly located in the centre of cities or densely populated areas, which are usually the most polluted regions, we select the Naha station, located on the small island of Okinawa in Japan, as a location with a clean atmosphere. The hourly O3 and NO2 observations of Naha station are provided by the Japanese Atmospheric Environmental Regional Observation System (AEROS; http://soramame.taiki.go.jp/Index.php, last access: 6 May 2021).
2.4 CLASS model
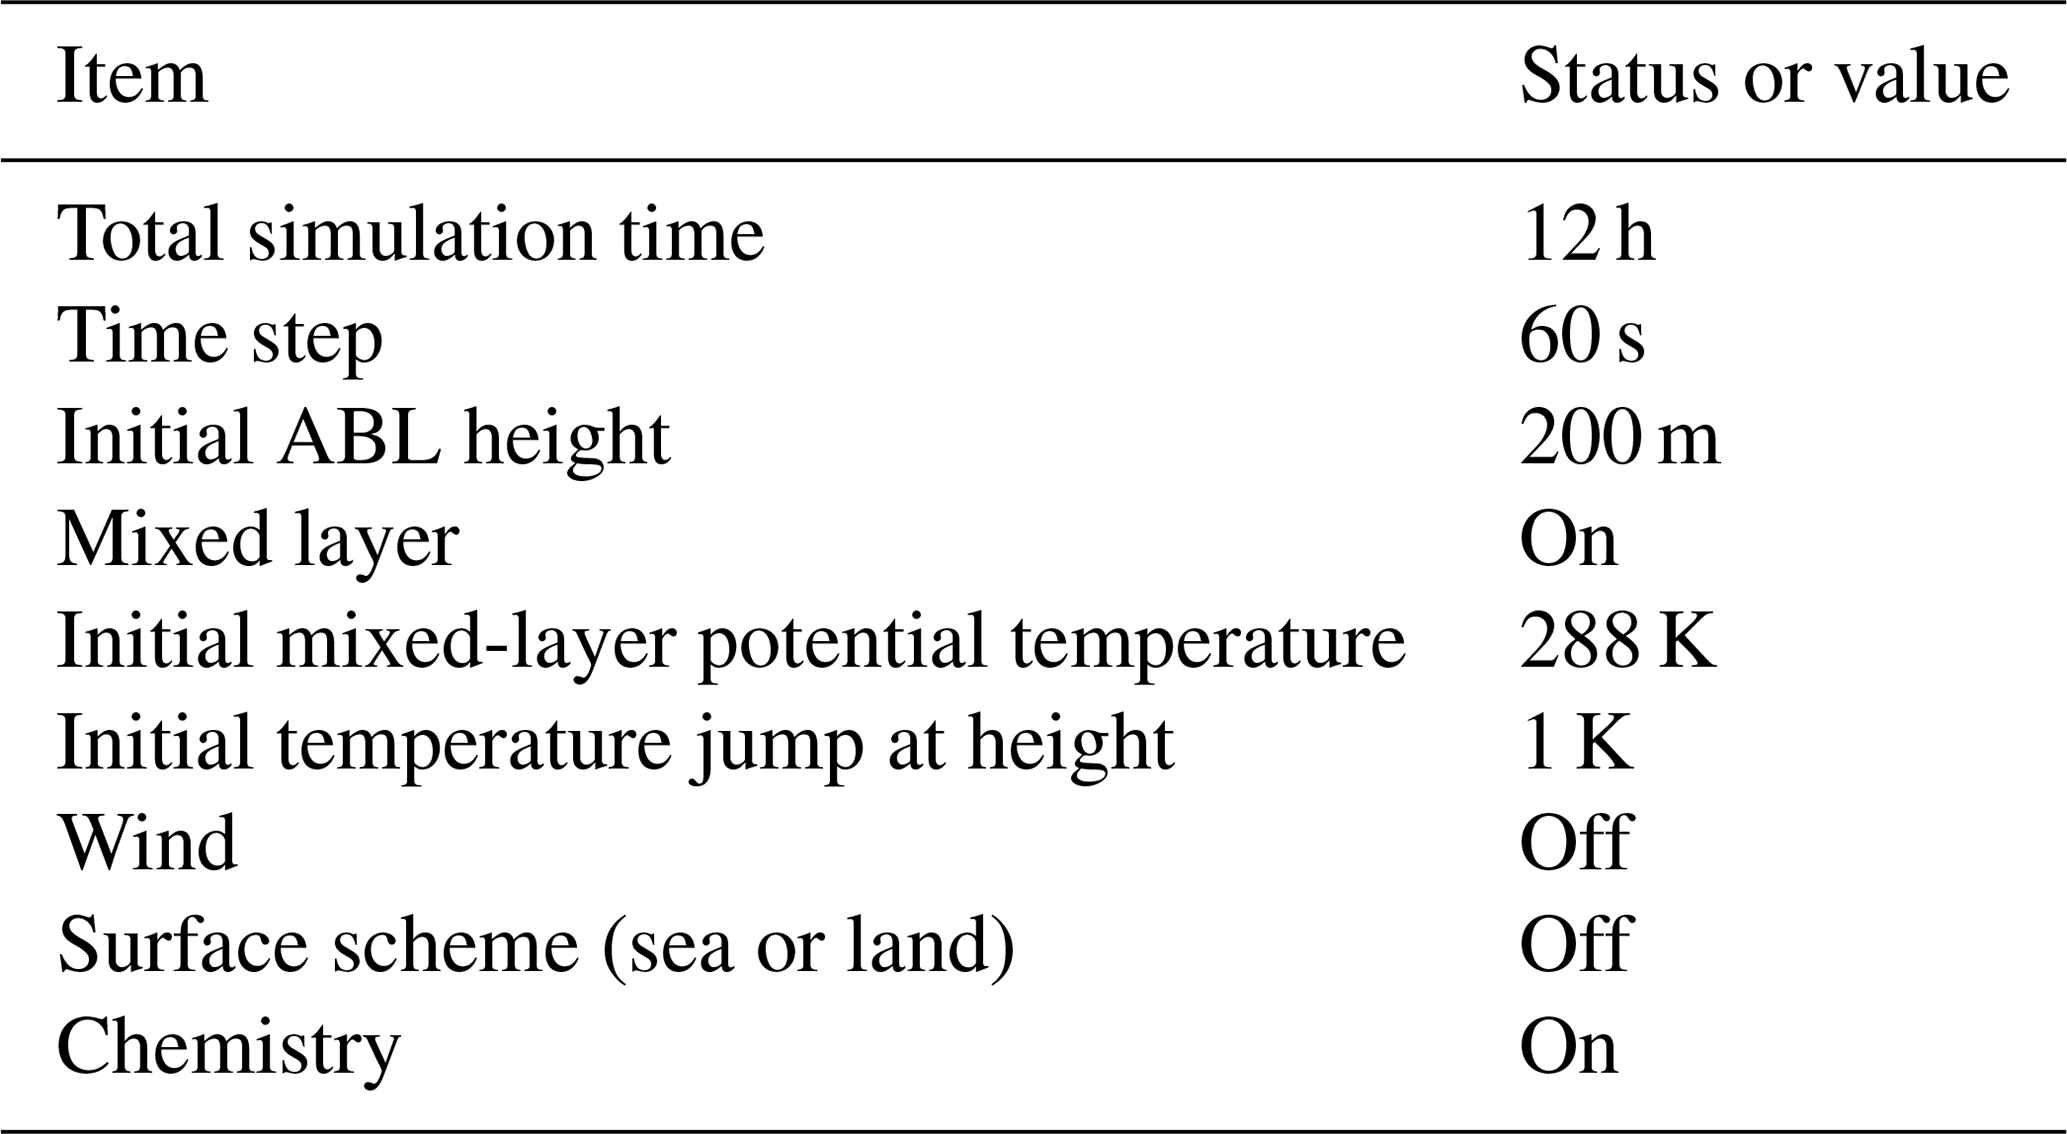
We simulate the non-linear relationship among O3, NO2, and HCHO using the Chemistry Land-surface Atmosphere Soil Slab model (CLASS). We performed a series of numerical experiments with the same dynamic and chemistry conditions listed in Table 1, but we modified only the concentrations of NO2 and HCHO. The initial mixing ratios of chemical species are shown in Table S1 in the Supplement. The initial mixing ratio data are from van Stratum et al. (2012). All other species (except for molecular oxygen and nitrogen) are initialized at zero, and we modified only the concentrations of NO2 and HCHO.
The CLASS model solves the diurnal evolution of dynamical variables (temperature, specific humidity, and wind) and chemical species over time in a well-mixed convective atmospheric boundary layer (ABL) in which entrainment and boundary layer growth are considered (Vilà-Guerau de Arellano et al., 2015; van Heerwaarden et al., 2010). All these variables are assumed to be constant with height due to intense turbulent mixing driven by convection (van Heerwaarden et al., 2010). The surface is assumed to be homogeneous in this box model. Chemistry is represented by a chemical scheme based on 27 reactions that control O3 formation described by van Stratum et al. (2012), with O3, NOx, and isoprene as the most important species. This simplified chemical scheme is able to represent the evolution of chemical species in semirural areas (Janssen et al., 2012; van Stratum et al., 2012). This chemical scheme is able to represent the evolution of the O3–NOx–VOC–HOx cycle in semirural areas (Vilà-Guerau de Arellano et al., 2011; Janssen et al., 2012; van Stratum et al., 2012). The model has been validated under various dynamical conditions (Barbaro et al., 2014; Janssen et al., 2012; van Heerwaarden et al., 2010).
Table 1Configuration and settings of the CLASS modelling system.
3.1 O3 formation sensitivity regime classification
In Fig. 1a, the CLASS model is applied to generate O3 isopleths, which illustrate O3 as a function of NO2 and HCHO values. The isopleths show that O3 formation is a highly non-linear process in relation to NO2 and HCHO. When NO2 is low, the O3 increases with increasing NO2. As NO2 increases, the O3 eventually reaches a local maximum. At higher NO2 concentrations, the O3 would decrease with increasing NO2.
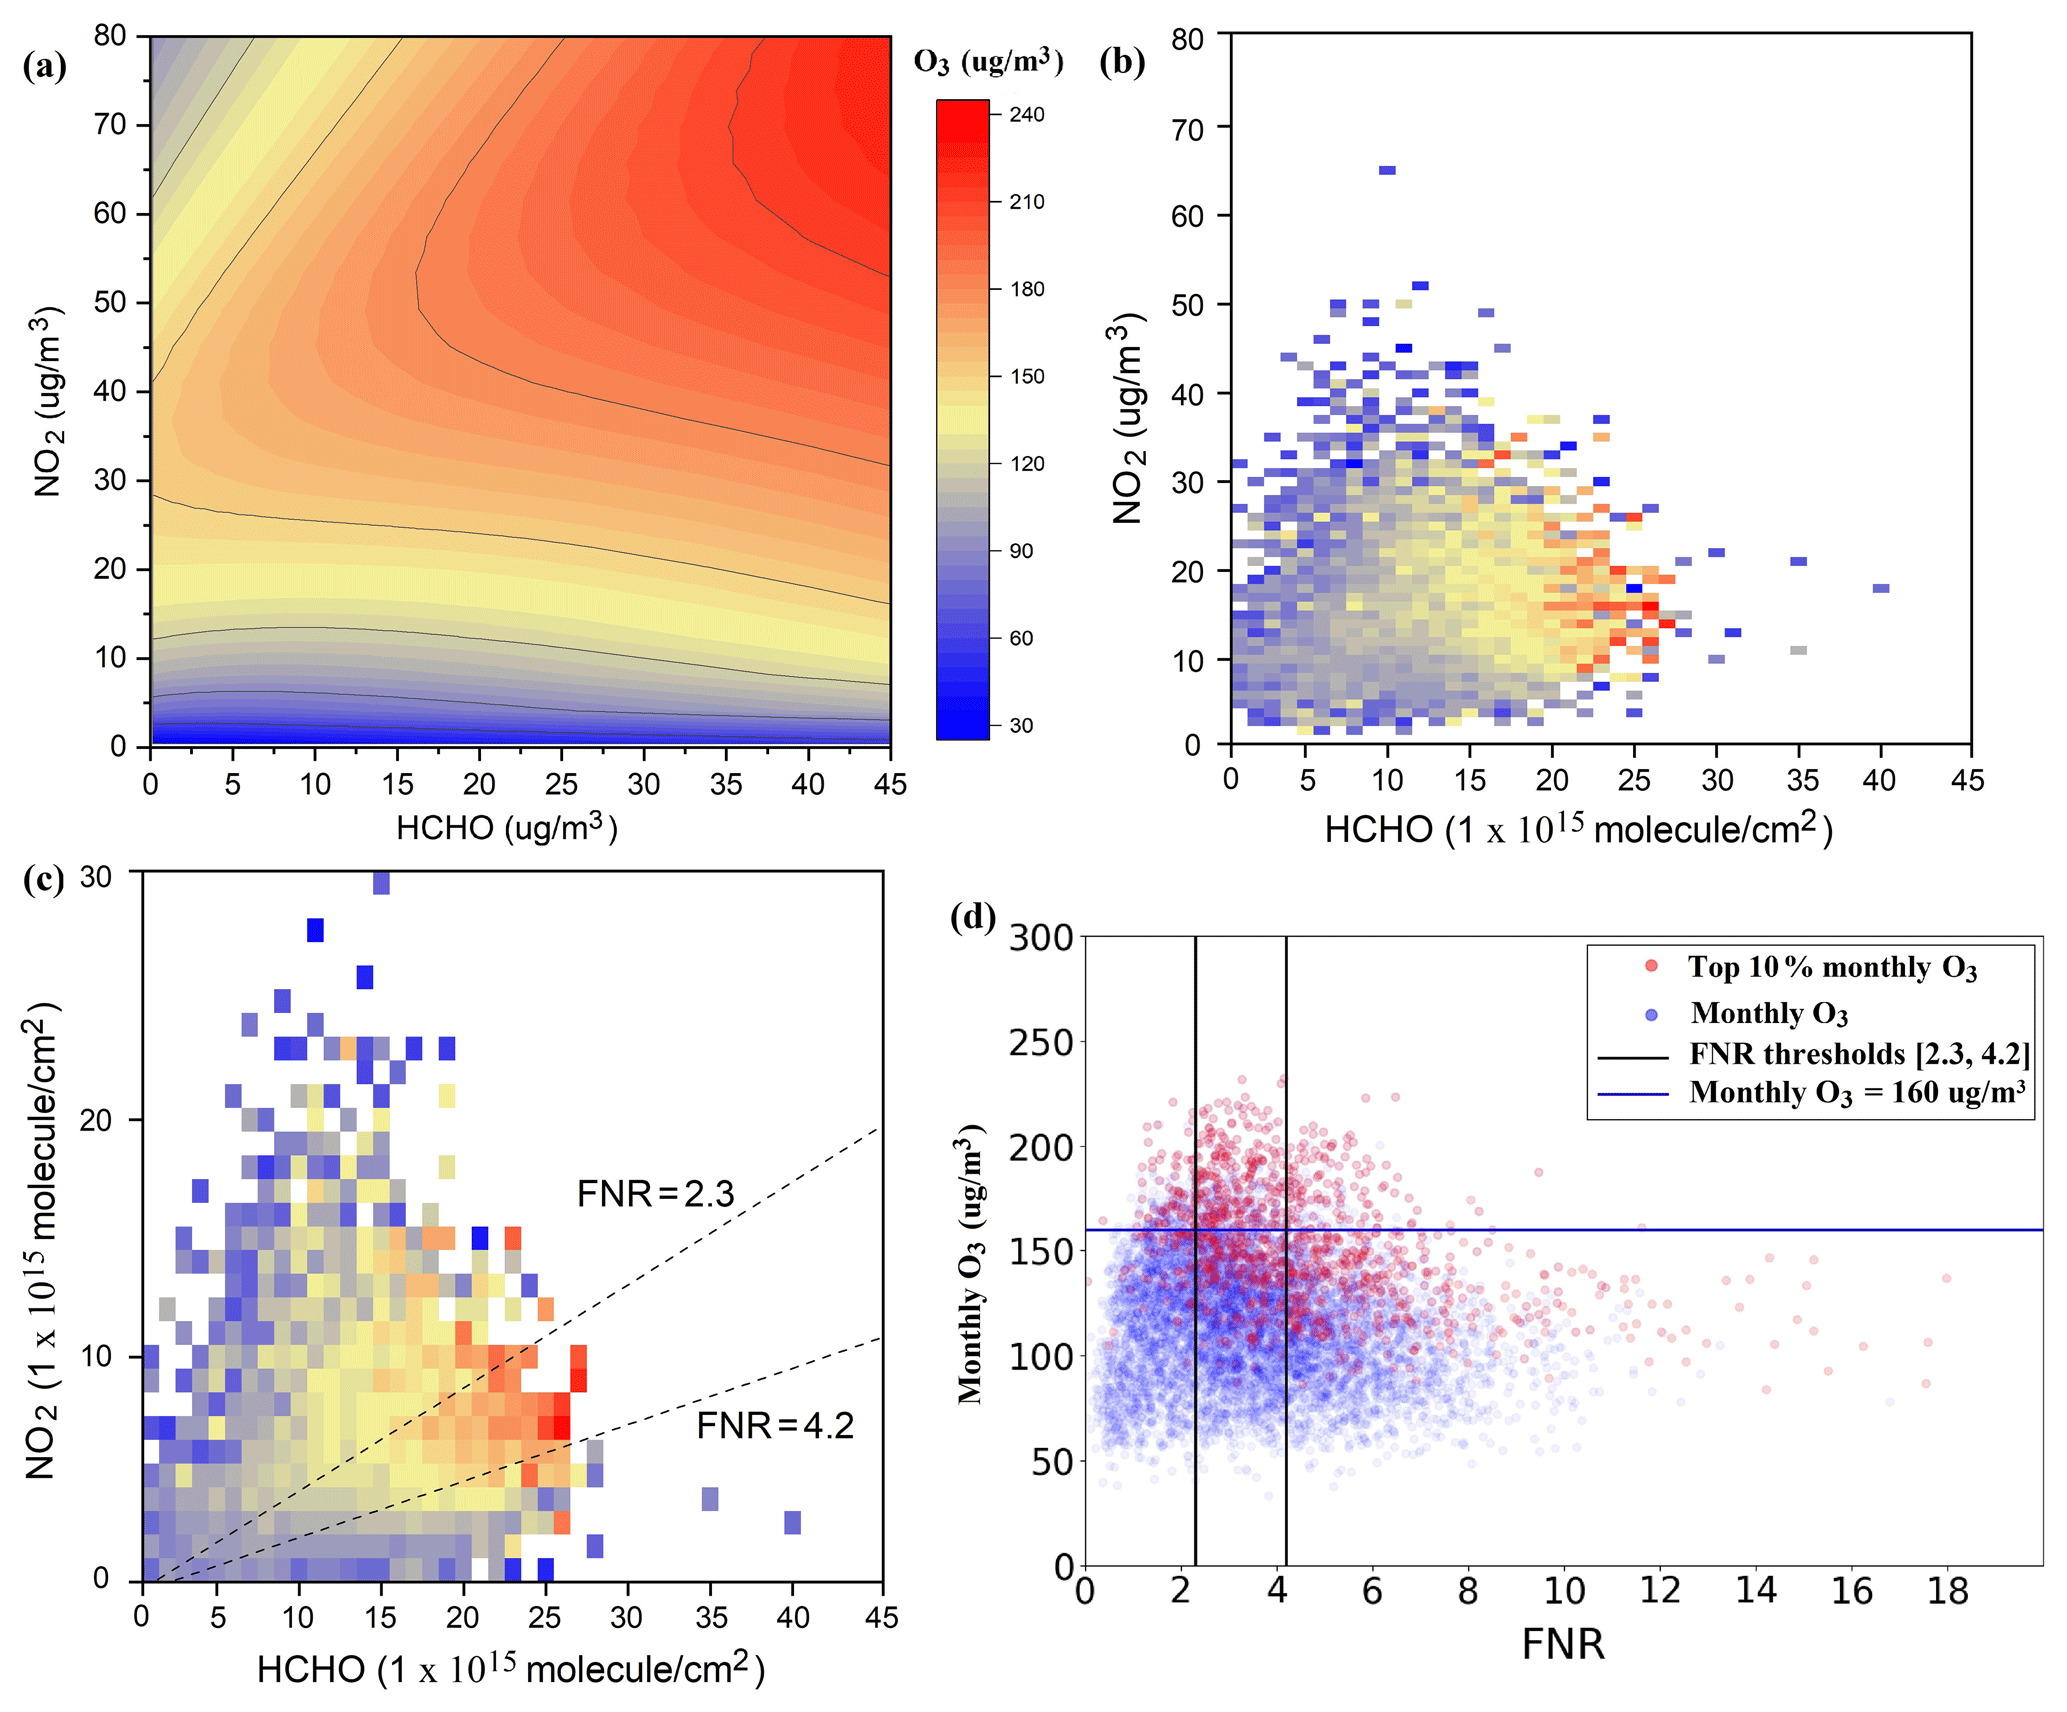
Figure 1(a) The simulated O3 isopleths versus NO2 and HCHO using the CLASS model. (b) The 360 cities' monthly mean in situ O3 concentrations versus in situ NO2 concentrations and HCHO columns from OMI observations in the summer during 2016–2019. Note that daily ground-based O3 and NO2 observations are calculated from hourly observations at OMI overpass time (averaged at 13:00 and 14:00 LT). The O3 numeric value of the grid cells is average of all points falling in each bin. (c) Same as (b) but with NO2 columns from OMI observations. (d) The top 10 % monthly O3 values and corresponding FNRs of each city. FNR thresholds are defined as the ±30 % range from the median of monthly O3 exceeding 160 µg/m3 in the top 10 % dataset.
We first evaluate if satellite-based HCHO and NO2 columns can capture the non-linear O3–NO2–HCHO chemistry shown by the CLASS model. In order to obtain a representative observation sample, we create monthly mean ground-based O3 and NO2 observations of 360 cities across China from the Chinese national air quality monitoring network from 2016 to 2019 and the background station observations from Naha, Japan, for comparison. Temperature is also a major factor in O3 chemistry. O3 pollution is rare when the ambient temperature is below 20 ∘C (Sillman, 2003). The seasonality of ground-level O3 concentrations also exhibited monthly variability peaking in summer and reaching the lowest levels in winter over China (W. N. Wang et al., 2017). In addition, long NOx lifetime and low concentrations of OH and RO2 radicals would lead most regions of China to a VOC-limited regime in winter (Shah et al., 2020). Therefore, we focus in this study on May–October as the summer period when meteorology is favourable for O3 formation (Jin et al., 2017).
By directly connecting HCHO columns from OMI observations with ground-based measurements of NO2 and O3 from 360 cities across China during May–October from 2016 to 2019 in Fig. 1b, we find that the satellite-based HCHO columns and ground-based NO2 concentrations can capture non-linear O3 chemistry consistent with the CLASS model results. It indicates that tropospheric HCHO columns from OMI can represent the near-surface HCHO environment as revealed by previous studies (Martin et al., 2004; Duncan et al., 2010; Jin et al., 2017). The overall O3–NO2–HCHO chemistry is also captured by satellite-based HCHO and NO2 columns in Fig. 1c, where we construct the O3 isopleth using only observations.
Having established this relationship between satellite-based HCHO NO2 columns and surface O3 concentrations, we subsequently derive the FNR thresholds marking the O3 transitional regime. The local O3 maximum can be thought of as a dividing line separating two different photochemical regimes (Sillman, 1999). According to the Chinese national ambient air quality standards released in 2012, 1 h average O3 concentration should below 160 µg/m3 in rural regions and below 200 µg/m3 in urban regions (Li et al., 2018). We assume that the monthly O3 concentration (daily O3 data are averaged at 13:00 and 14:00 LT) exceeding 160 µg/m3 has a large component that is due to local photochemical production not meteorology or regional transport. We calculated for each city the monthly mean surface O3 as a function of the monthly column densities of NO2 and HCHO for all months during May–October from 2016 to 2019. The results are shown in Fig. 1c. We only consider observations of monthly HCHO columns higher than 2 × 10¹⁵ molecule/cm2 (detection limitation), NO2 columns more than 1.5 × 10¹⁵ molecule/cm2 (which are defined as polluted regions), and O3 columns above 160 µg/m3 (minimizing the effect of background ozone). We then plot in Fig. 1d the surface O3 concentrations as a function of the FNR to determine the range of FNRs, which includes the O3 maximum for most (> 60 %) cities. We define this range as the transition between the NOx-limited and VOC-limited regimes.
It should be noted that the actual split between NOx-limited and VOC-limited regimes includes a broad transitional region rather than a sharp dividing line (Sillman, 1999). Although we reduce the noise by gridding, there is a blurry transition between NOx-limited and VOC-limited regimes. The lack of sharp and clear transitions between two O3 sensitivity regimes is likely influenced by factors such as meteorology, chemical and depositional loss of O3, and noisy satellite data. We find a relationship between FNR and the O3 response patterns that is qualitatively similar but quantitatively distinct across cities. Taking into account the range of transitional regime, the FNR thresholds [2.3, 4.2], marking the transitional regime, are defined as the ±30 % range from the median (3.28), covering the O3 maximum in most (60 %) studied cities.
To minimize the effect of background O3 by transport or meteorological variability, we use monthly mean O3 concentrations above 160 µg/m3 in summertime when the O3 chemistry is strongest. We assume that the results are applicable for the whole of China. To check this assumption, we investigate the FNR thresholds in different latitude zones (18–28∘ N, 28–38∘ N, and 38–53∘ N) in Fig. S1 in the Supplement. Generally, we conclude that the derived FNR thresholds range of [2.3, 4.2] for the whole domain is a good representation for all latitude zones in China.
Figure S2a in the Supplement shows monthly O3 concentration in winter (December–January–February), which rarely exceed 160 µg/m3, including the FNR thresholds derived using summertime data. Based on Fig. S2b, we assume that our FNR thresholds [2.3, 4.2] derived using summertime data will be valid for all seasons. Three regimes can be roughly identified from the FNR thresholds we adopted: a VOC-limited regime should occur when the FNR < 2.3, and a NOx-limited regime should occur when the FNR > 4.2. The FNR between 2.3 and 4.2 reflects the transition between the two regimes.
3.2 Variations in O3 formation sensitivity in China
Figure 2a and b show the photochemical regime classification over China in summer of 2016 and 2019 using our FNR thresholds. Combined with the China provincial administrative division in Fig. S3 in the Supplement, we see the VOC-limited regimes mainly appear in the North China Plain (NCP), the Yangtze River Delta (YRD), and the Pearl River Delta (PRD), and the NOx-limited regimes dominate the remaining areas, which are consistent with results from N. Wang et al. (2019) and Jin and Holloway (2015). In the NCP, the VOC-limited regimes are found in Beijing and some big cities in Hebei province, central regions in Shandong province, and Henan province. Transitional regimes control the remaining regions of Shandong province and Henan province and most regions of Hefei province. In the YRD, the VOC-limited regimes are found in Shanghai and southern Jiangsu province. In the PRD, the VOC-limited regimes are found in Guangzhou. Outside the NCP, YRD and PRD, the VOC-limited regimes concentrate in city centres of Shenyang, Chengdu, Chongqing, Xi'an, and Wuhan, which are surrounded by transitional regimes in the suburban areas. It has been acknowledged that the urban O3 formations are generally VOC-limited due to the large amount of NOx emissions from diverse sectors, like transportation, industry, residential sector, and power plants (Shao et al., 2009; Wang et al., 2009; Sun et al., 2011). The NOx-limited or transitional regimes dominated O3 formation in the suburban and rural areas of eastern China (Xing et al., 2011; Jin et al., 2017).

Figure 2(a) Photochemical regime classification over China in the summer of 2016. (b) Same as (a) but for 2019. Note that no data grids in (a) and (b) corresponds to monthly HCHO columns below the detection limit (2 × 10¹⁵ molecule/cm2) or NO2 columns lower than 1.5 × 10¹⁵ molecule/cm2. (c) Mean HCHO columns from OMI over China in the summer of 2016. (d) Same as (c) but for 2019. (e) Mean NO2 columns from OMI over China in the summer of 2016. (f) Same as (e) but for 2019.
Comparison of O3 sensitivities between 2016 and 2019 shows noticeable changes from VOC-limited regime to transitional regime in the NCP, YRD, and PRD. In the NCP, the continuous area of VOC-limited regimes that occurred in 2016 change to transitional regimes in 2019. The VOC-limited regimes remain in central Beijing, Tianjin, Shijiazhuang, Jinan, and Zhengzhou. In the YRD, Shanghai and Nanjing remain in the VOC-limited regime, and other cities mostly change to the transitional regime. In the PRD, the VOC-limited regime still controls Guangzhou, while the transitional regimes control its surrounding cities.
Figure 2c and d show mean HCHO columns over China in the summer of 2016 and 2019. The columns exceed 15 × 1015 molecule/cm2 in megacity clusters, such as in the NCP, YRD, and PRD, as well as the Sichuan Basin. Shen et al. (2019) found large increases of HCHO columns during May–September over 2005–2016 in the NCP and the YRD, consistent with the trend of anthropogenic VOC emissions. Our results show that the satellite HCHO columns increase in the NCP and the YRD and decrease in the PRD and in the Sichuan Basin during May–October of the 2016–2019 period. Figure 2e shows mean NO2 columns over China in the summer of 2016. The NCP, YRD, PRD, Sichuan Basin, and Urumqi have high levels (80 × 1015 molecule/cm2) of NO2 columns. Figure 2f shows the satellite NO2 columns have a strong decline in the NCP, the PRD, Hunan, Hubei, and Jiangxi provinces in summer from 2016 to 2019. However, the YRD shows increasing NO2 columns in 2019.
We select typical cities (Beijing, Shanghai, Guangzhou, Neijiang, Lhasa, and Naha) to analyse in more detail the O3 formation sensitivity in the summers of 2016 to 2019 in Fig. 3. These cities are selected based on their different chemical regimes in 2016. The locations of the six cities are shown in Fig. S4 in the Supplement. Economically developed megacities or provincial capital cities such as Beijing, Shanghai, and Guangzhou, with high levels of tropospheric NO2 and HCHO, remain in the VOC-limited regime over 2016–2019. The reduction of tropospheric NO2 results in a shift in the O3 formation sensitivity in cities such as Neijiang over 2016–2019. Lhasa as a city with low NO2 and the background station in Naha with even lower HCHO and NO2 columns remain in the NOx-limited regime over 2016–2019.
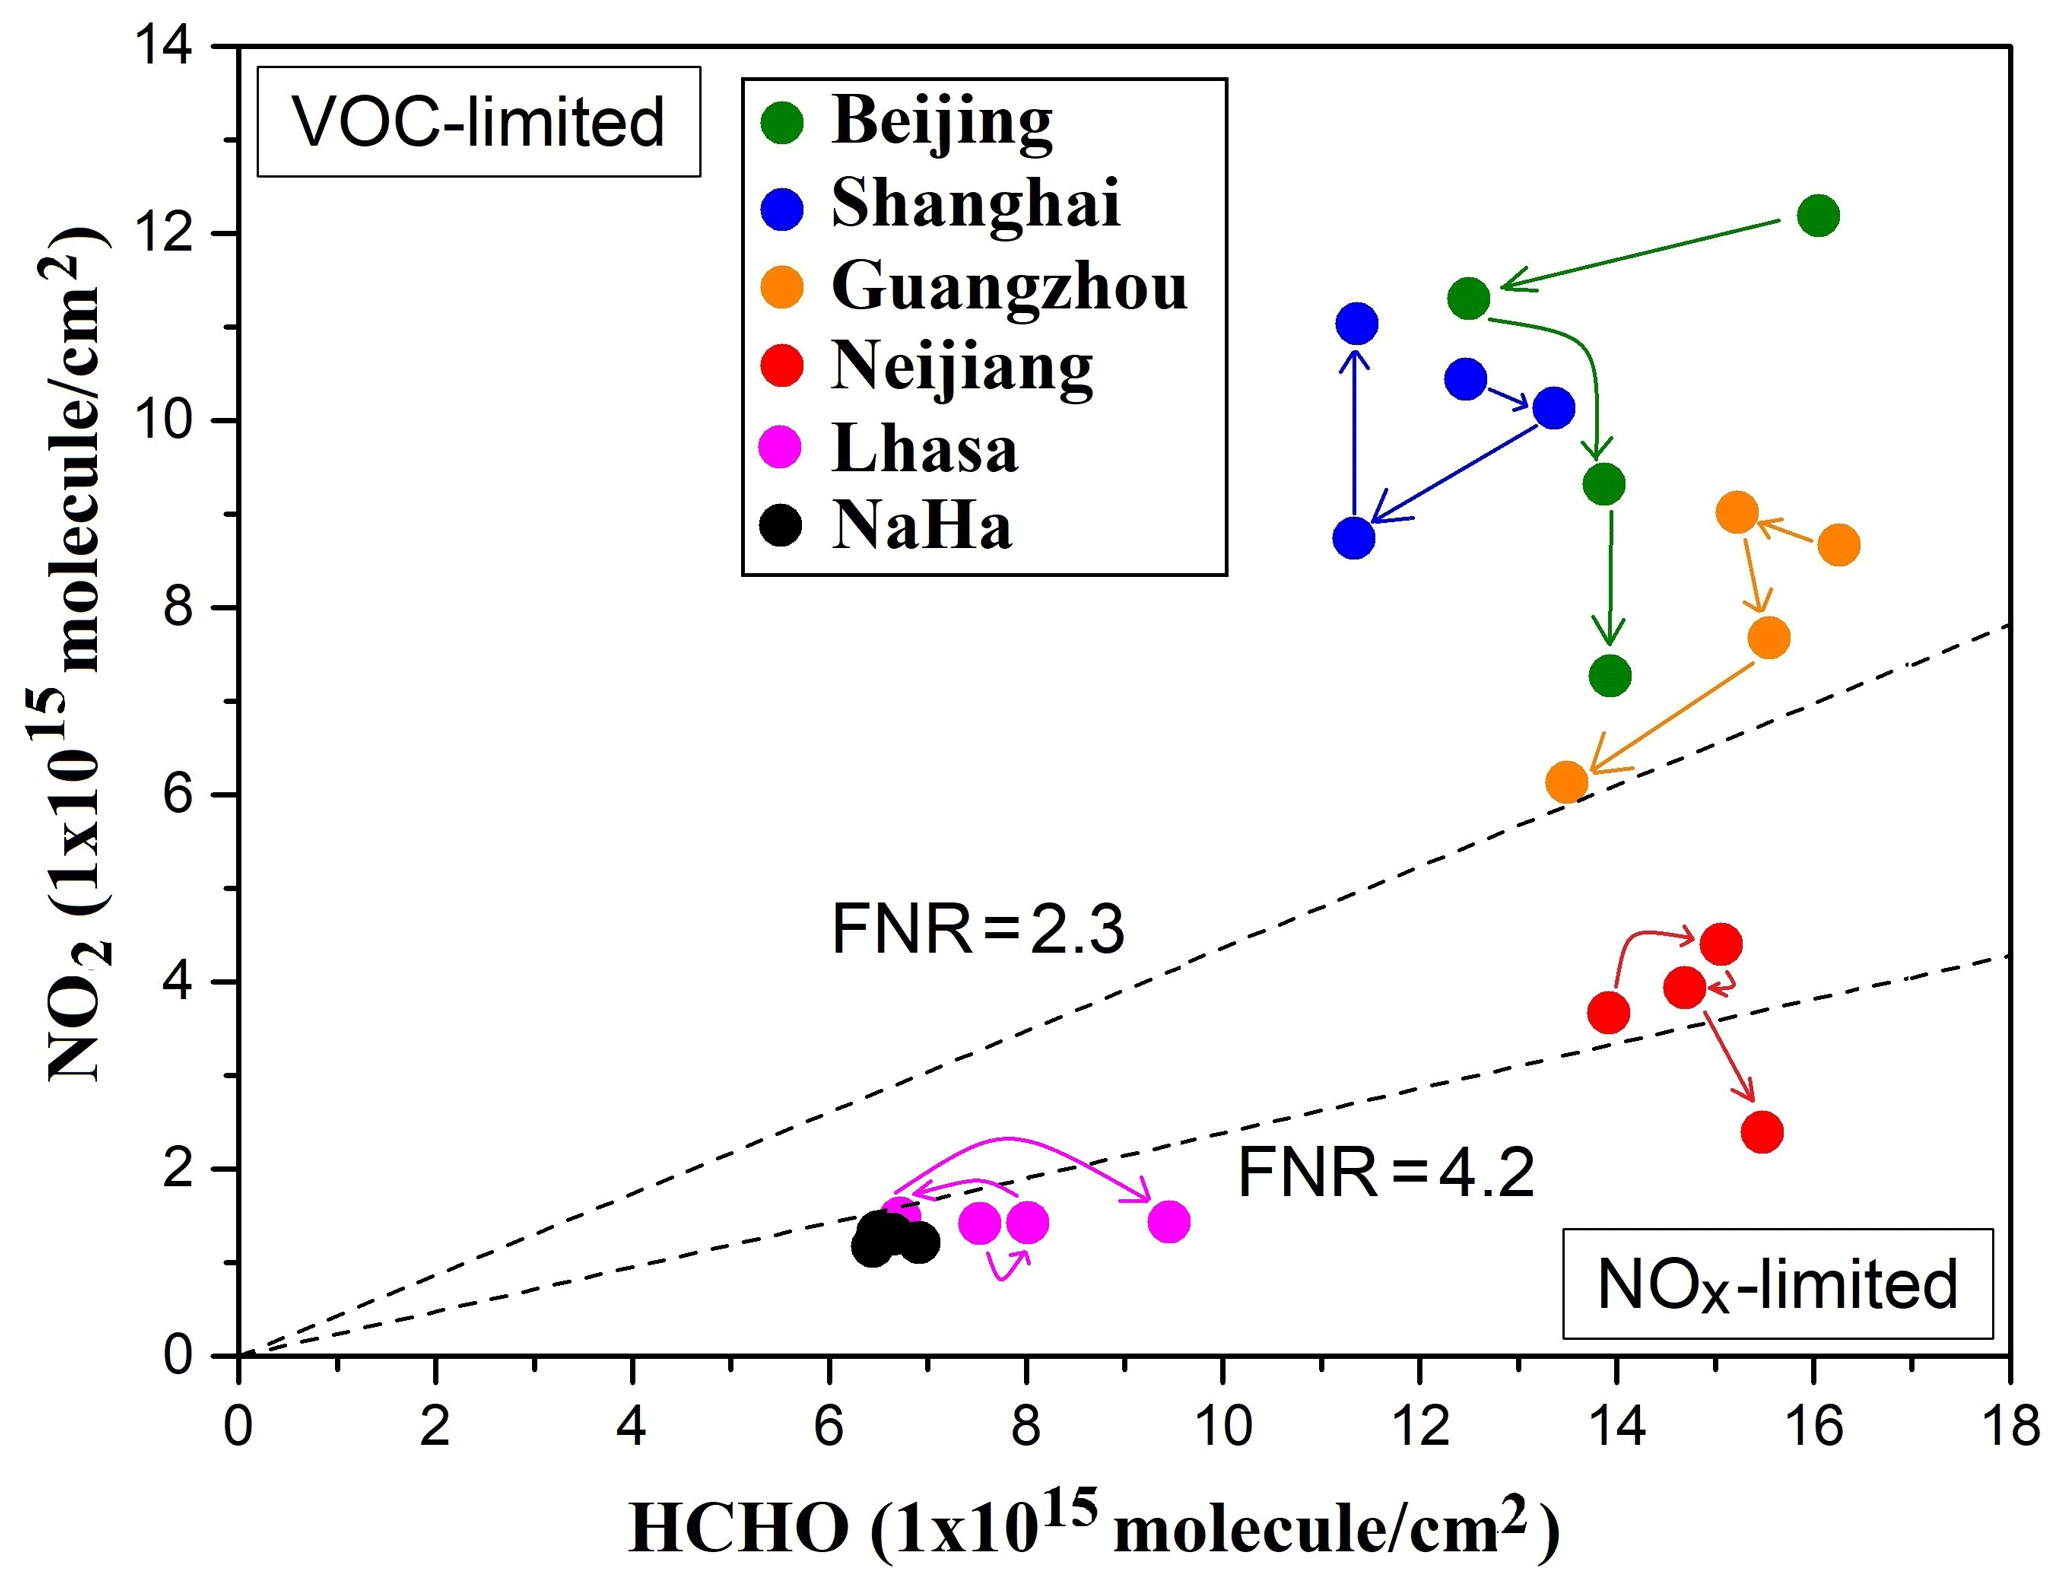
Figure 3The change of O3 formation sensitivity of six cities (Beijing, Shanghai, Guangzhou, Neijiang, Lhasa and Naha) in summer from 2016 to 2019. The arrows represent time step from 2016 to 2019.
As we know, O3 increases with increasing NOx in the NOx-limited regime and decreases with increasing NOx in the VOC-limited regime. The contrast between NOx-limited and VOC-limited regimes illustrates the difficulties involved in developing policies to reduce O3 in NOx polluted regions. Reductions in VOCs will only be effective in reducing O3 if VOC-limited chemistry predominates. Reductions in NOx will be effective only if NOx-limited chemistry predominates and may actually increase O3 in VOC-sensitive regions. If cities belonging to the VOC-limited regime like Beijing only focus on the reduction of NOx while ignore the control of VOC emissions, they will experience a process of rising O3 concentrations, the more NOx decrease, the greater the increase in O3 will be.
3.3 Observed response of ground-level O3 to chemical formation sensitivity
To validate the regimes derived from satellite observations, we also analyse the surface NO2 observations from ground-based measurements. Figure 4a and b show the mean ground-based NO2 concentrations in summer of 2016 and 2019. According to the NOx surface emission estimates derived with DECSO from OMI observations, the NOx emissions in eastern China (18∘ N, 104∘ E, 41.5∘ N, 124∘ E) decrease from 5.93 Tg/yr in 2016 to 4.21 Tg/yr in 2019. Such a strong decline in NOx emissions led to decreasing ambient NO2 concentrations at NCP (Beijing, Shijiazhuang, Zhengzhou, Jinan) and YRD (Hefei and other cities in Anhui province). In Fig. 4c, the national average NO2 concentration decrease by 14.4 % in summer from 2016 to 2019.
Figure 4(a) Mean ground-based NO2 concentration at each city in the summer of 2016. (b) Same as (a) but for 2019. (c) The bars indicate the number of cities (left axis) in a certain NO2 range in summer from 2016 to 2019. The black line indicates the average NO2 concentration (right axis) of all cities. (d) Mean ground-based O3 concentration at each city in summer of 2016. (e) Same as (d) but for 2019. (f) Same as (c) but for O3. Note that daily in situ NO2 and O3 data are the average of 13:00–14:00 LT of the sites in each city.
Figure 4d and e show the mean ground-based O3 concentration of about 360 cities across China in summer of 2016 and 2019. Generally, the O3 levels in western China are lower than in eastern China. In 2016, few cities have an average O3 concentration above 140 µg/m3. In 2019, cities with a mean O3 concentration exceeding 140 µg/m3 occurred at the NCP (Tianjin, Shijiazhuang, some cities in Shandong and Henan province), the YRD (Nanjing), and the PRD (Guangzhou). In Fig. 4f, we see the number of cities with average O3 values above 140 µg/m3 increases rapidly from 2.20 % in 2016 to 31.37 % in 2019. The cities with an average O3 value below 80 µg/m3 decrease from 11.02 % in 2016 to 2.24 % in 2019. In addition, the nationwide O3 average in summer increases year by year from 2016 (104.86 µg/m3) to 2019 (125.14 µg/m3). K. Li et al. (2019) reported the increasing O3 trends in summer in megacity clusters of eastern China and the highest O3 concentrations are in the NCP, which are consistent with our results.
A complex coupling of primary emissions, chemical transformation, and dynamic transport at different scales determine the O3 pollution (Jacob, 1999). NOx and VOCs play important roles in O3 formation. Emissions of NOx and VOCs to the environment are the starting point of O3 pollution problems. During the past decade in China, ambitious steps have been taken to control NOx emissions. In 2013, the Chinese State Council issued the APPAP. Stringent control measures were carried out since then, including phasing out highly emitting industries, closing outdated factories, tightening industrial emission standard, improving fuel quality (N. Wang et al., 2019). However, to the other important O3 precursors, VOCs, less attention has been given in emission control strategy. M. Li et al. (2019) concluded that anthropogenic NMVOC emissions in China during 1990–2017 have been increasing continuously due to the dramatic growth in activity rates and absence of effective control measures. Following China's past control strategy on VOCs, we can regard VOC emissions as rising or in steady state.

Figure 5(a) Differences in total NOx emissions derived from OMI observations in summer in east China between 2019 and 2016. (b) Variations in total NOx emissions in five cities (Beijing, Shanghai, Guangzhou, Neijiang, and Naha) in summer from 2016 to 2019. (c) Variations in mean ground-based O3 concentrations in five cities in summer from 2016 to 2019.
The reduction of the NOx emissions for cities in the VOC-limited regime is one of the main reason for the increasing of O3. Figure 5a shows the difference of total NOx emissions derived from OMI observations in summer in east China between 2019 and 2016. A decline in NOx emissions centres at the NCP, YRD and PRD, where most areas belong to the VOC-limited regime. In order to provide further insight into the impact of NOx emission variations on O3 concentrations, five selected typical cities (Beijing, Shanghai, Guangzhou, Neijiang and Naha) are shown in more detail (see Fig. 5b and c). For cities under the control of VOC-limited chemistry (Beijing, Shanghai and Guangzhou), accompanied with decreasing NOx emissions, O3 concentrations generally show an opposite behaviour to NOx emissions. The O3 formation sensitivity in Neijiang shows a shift from the transitional to the NOx-limited regime over 2016–2019. The reduction of NOx emissions in the transitional regime is accompanied by decreasing O3 in Neijiang. Although the O3 data in Naha for 2016–2018 are unavailable, we see that O3 concentrations in Naha are low in 2019, and NOx emissions are stable during 2016–2019. Note that we find a qualitative relationship between NOx emission and the O3 response patterns, confirming the non-linear O3–NO2–VOC chemistry but not in a quantitative sense. For example, the changes of NOx emissions in Beijing (−2.17 Gg N/cell), Shanghai (−1.18 Gg N/cell), Guangzhou (−0.28 Gg N/cell), and Neijiang (−0.15 Gg N/cell) during 2016–2019 lead to different levels of O3 changes in Beijing (10.43 µg/m3), Shanghai (7.81 µg/m3), Guangzhou (25.54 µg/m3), and Neijiang (−22.66 µg/m3). Because of the VOC-limited chemistry conditions, O3 increases with decreasing NOx emissions in Beijing, Shanghai, and Guangzhou. The NOx-limited conditions lead to decreasing O3 with decreasing NOx emissions in Neijiang. Compared with Beijing, NOx emissions in Guangzhou remained basically constant in 2016 and 2019. But O3 concentrations in Guangzhou increased more than in Beijing. The local O3 formation sensitivity is helpful to present the way that O3 responds to NOx emission, but VOC emission are needed when discussing their relationship in a quantitative way.
3.4 Enhanced O3 levels during the COVID-19 lockdown in China
The measures in response to the outbreak of the COVID-19 lead to sudden changes of NOx emissions and anthropogenic HCHO emissions in China in the beginning of 2020 (Wang et al., 2020; Hui et al., 2020). We analyse the change of O3 concentrations during the lockdown period to validate our method. To look into COVID-19 lockdown impacts on short-term O3 level, we choose two time periods covering 357 cities across China: period I (3–23 January 2020) and period II (9–29 February 2020), to avoid the coincidence of Chinese New Year holidays (24 January to 8 February 2020).
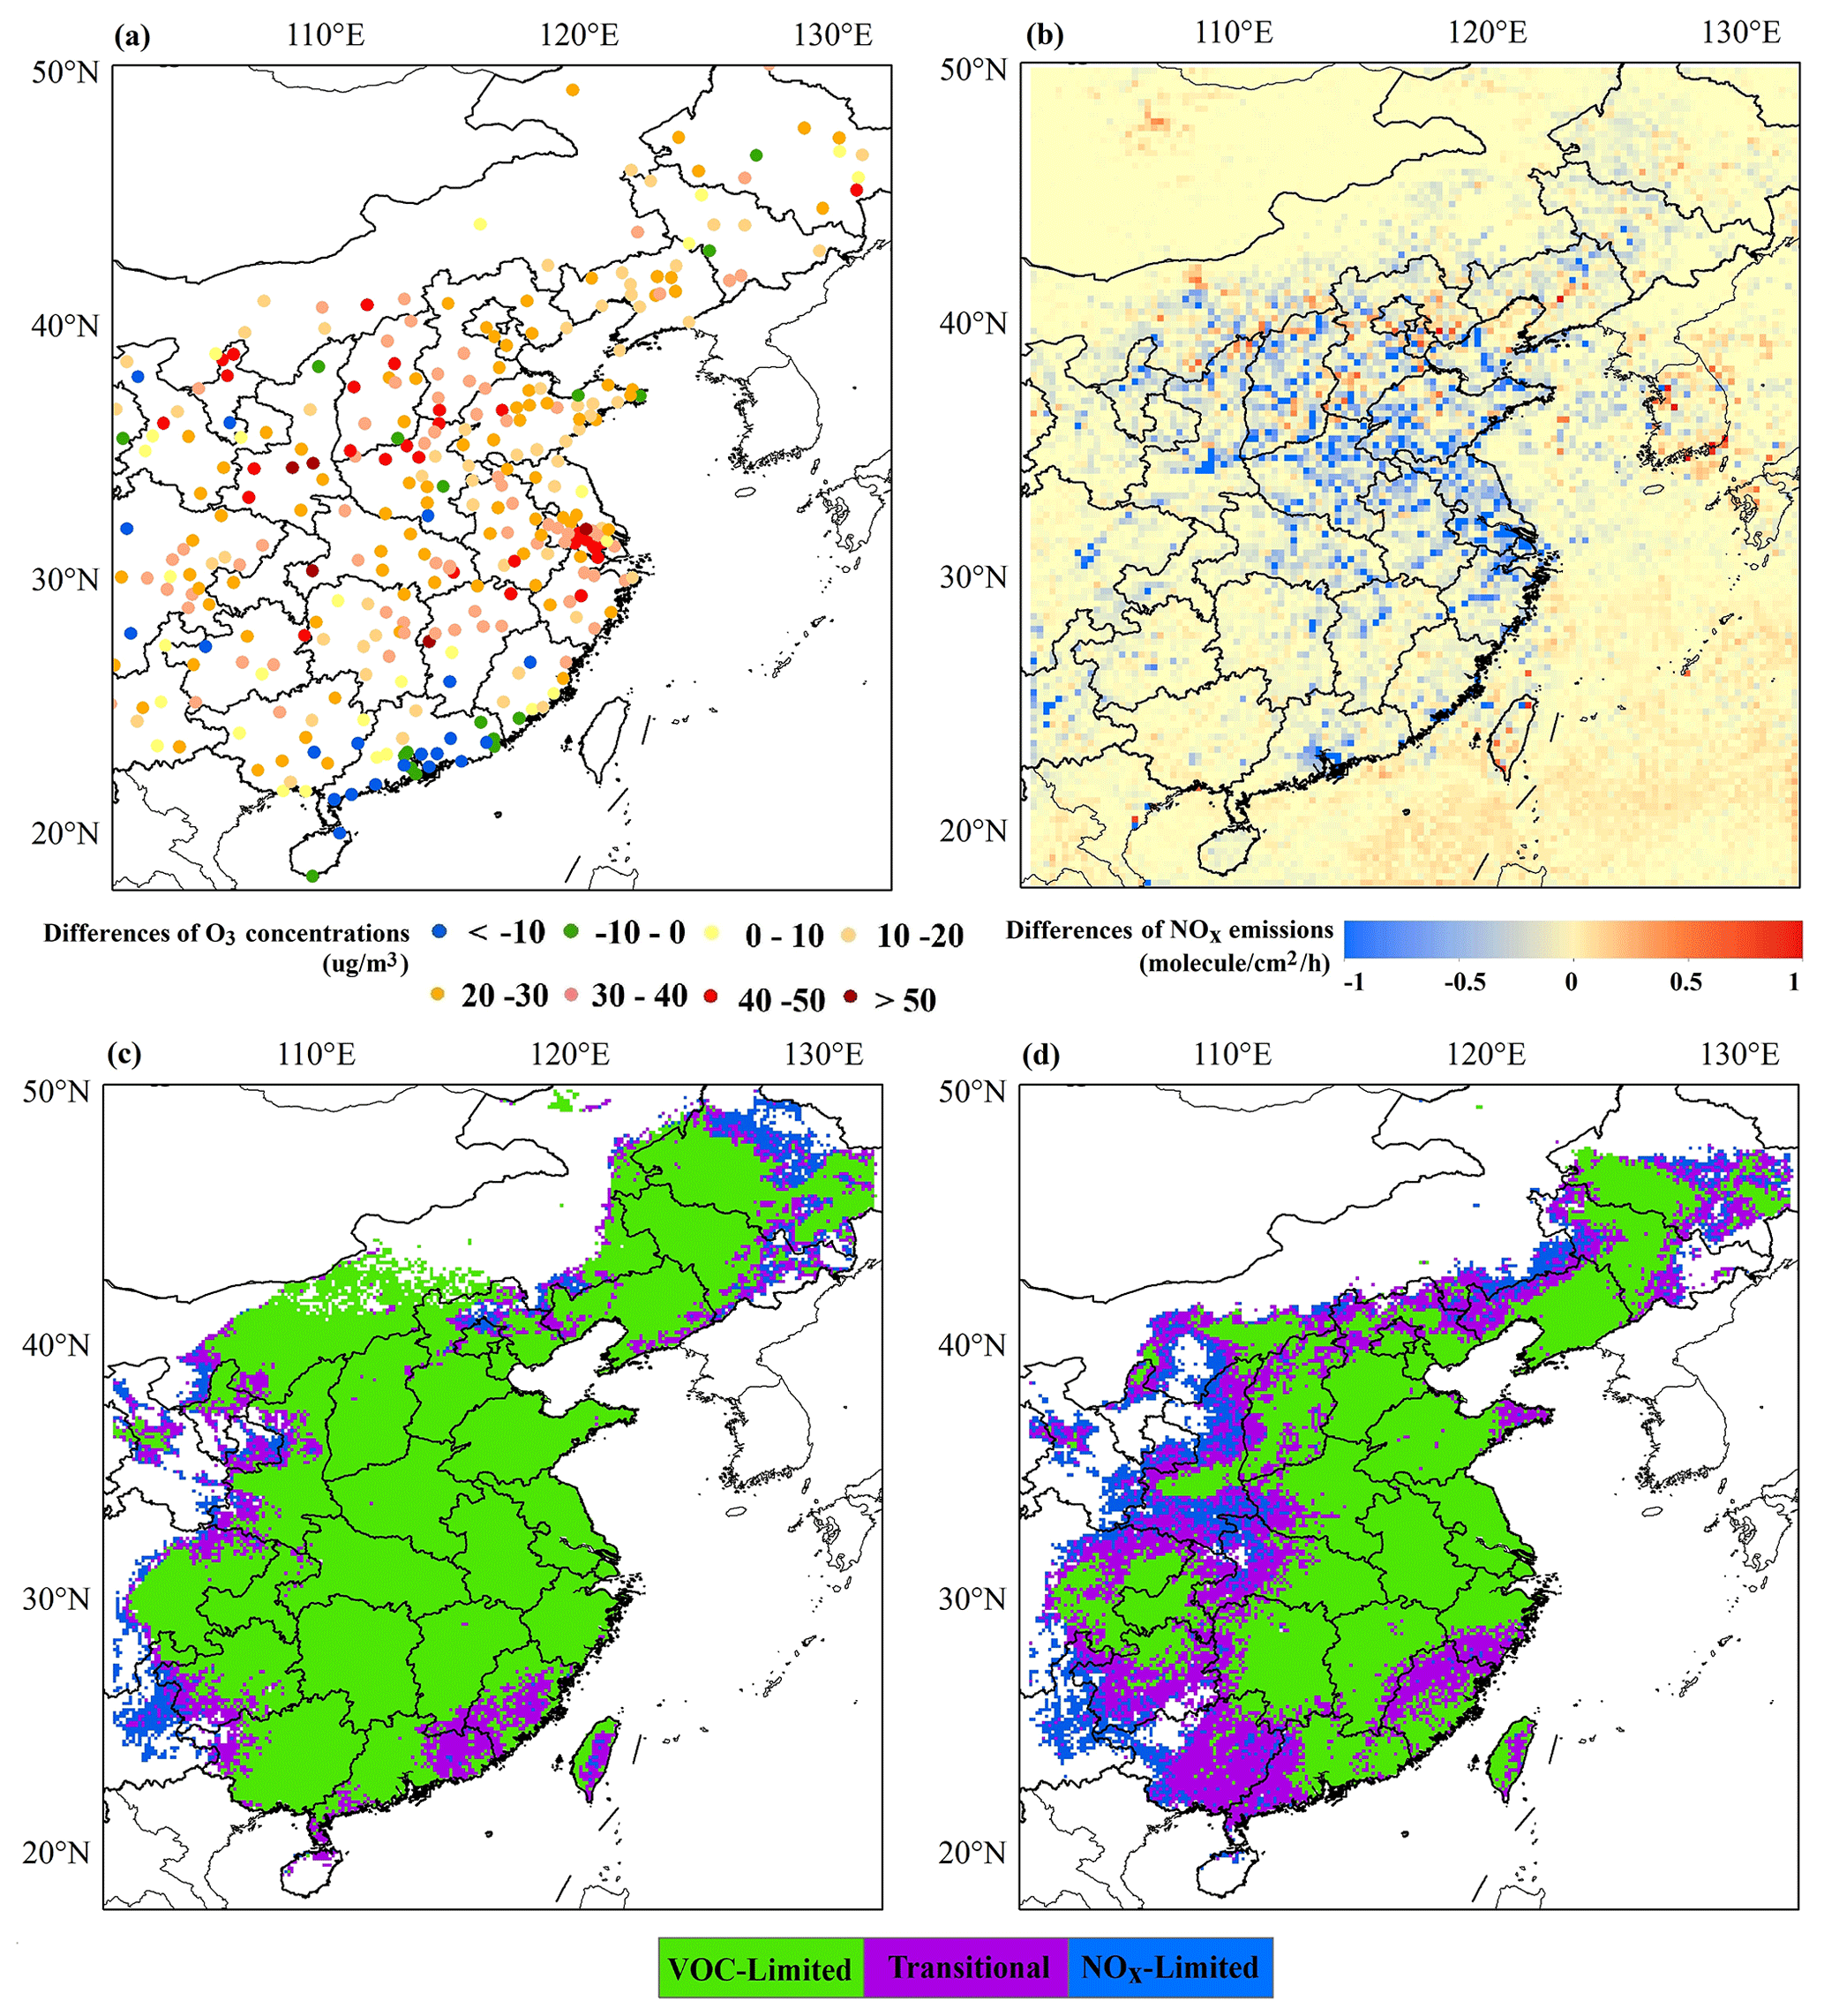
Figure 6(a) Differences in mean ground-based O3 concentrations in east China between period I and period II. (b) Differences in mean NOx emissions in east China between period I and period II. (c) O3 formation sensitivity in east China during period I. (d) Same as (c), but for period II. Note that period I (3–23 January 2020) is before the lockdown, and period II (9–29 February 2020) is during the lockdown.
Figure 6a shows enhanced O3 levels in most cities of eastern China during the COVID-19 lockdown, except for some cities in PRD and Fujian province. The cities with O3 concentration increases of more than 40 µg/m3 are located in the NCP and the YRD, i.e. the populous regions of China, indicating a potential negative health effect from O3 exposure in these regions. Figure 6b shows strong reductions in NOx emissions in eastern China, especially in Henan, Hubei, and Jiangsu provinces, where as a consequence of the lockdown, transportation, construction, and light industry activities have been dramatically decreased.
Assuming that our observation-based FNR thresholds derived using summertime data also apply during winter, we see that most regions of eastern China belong to the VOC-limited regime during periods I and II in Fig. 6c and d. Previous studies also reported that the O3 chemistry in the urban areas in China in wintertime is in a VOC-limited regime due to the relative lack of HOx radicals (Seinfeld and Pandis, 2016). During winter (VOC-limited conditions), when the concentration of NOx is high and the level of UV radiation is low, the O3 production varies inversely with the NOx concentration (Sillman et al., 1990). During the lockdown period, both the anthropogenic emissions of NOx and VOCs were reduced. The NOx reduction during the lockdown is higher than the VOC reduction according to Sicard et al. (2020). The reductions of VOC emissions are generally effective in reducing O3 concentrations. However, such air quality improvements are largely offset by reductions in NOx emissions leading to increases in O3 concentrations due to the strongly VOC-limited conditions in the NCP in winter (Xing et al., 2020). The NOx reduction during the lockdown is higher than the VOC reduction (Sicard et al., 2020). Thus, a reduction in NOx leads to an increase in the O3 concentrations in most regions of eastern China during period II. Besides, reduction of freshly emitted NO in particular from road traffic alleviates O3 titration locally (Seinfeld and Pandis, 2016; Levy et al., 2014). The O3 titration occurs particularly in winter (less photolysis reactions of NO2) under high NOx levels (Sillman, 1999). However, the lockdown measures result primarily in a lower titration of O3 by NO due to the reduction in local NOx emissions by road transport, which also enhances O3 levels in urban areas. On the other hand, some cities, mainly located in southeastern China, showed decreasing O3 levels. Zhao et al. (2020) concluded that the cause of O3 decline in these cities is the emission changes of NOx and VOC. In Fig. 6c we see that some cities in Fujian and Guangdong provinces belong to the transitional regime. Theoretically, the transitional regime should correspond to the conditions at which O3 formation is most efficient, indicating that reductions or increases in NOx and VOCs will reduce the O3 concentration.
Satellite-based HCHO NO2 ratios and ground-based O3 measurements were directly connected to capture the non-linearity of surface O3 chemistry over major Chinese cities in this study. Evaluating the FNR thresholds marking the O3 transitional regime in which O3 formation is less sensitive to the precursors, we found a broad transitional region, which reflects differences in factors among 360 cities, such as emissions, meteorology, and regional transport. The national FNR thresholds are defined as follows: a VOC-limited regime should occur for FNR < 2.3 and a NOx-limited regime should occur for FNR > 4.2. The FNR between 2.3 and 4.2 reflects the transition between the two regimes. Our FNR thresholds derived from satellite and ground-based observations are higher than previously reported model-based values. The non-linear chemistry of O3 depends on its precursors NO2 and VOCs with contributions from both local and regional sources (Xue et al., 2014). Modelling studies are good at simulating the response of surface O3 to an overall reduction in NOx or VOC emissions. The FNR thresholds derived with in situ O3 observations will be more indicative of the local O3 chemistry than the model, including the effect of NOx titration over urban areas (Jin et al., 2020).
We analysed the spatial and temporal variability of O3 formation sensitivity using our FNR thresholds over China from 2016 to 2019. Our results showed that O3 formation sensitivity tends to be VOC-limited over urban areas and NOx-limited over rural and remote areas in China. In 2016, the VOC-limited regimes mainly appear in the NCP, the YRD, and the PRD. In 2019, there was a shift in most NCP regions from the VOC-limited to the transitional regime. The area with a VOC-limited regime in the YRD and PRD also shrank. We found that O3 formation sensitivity changes in these regions were associated with a strong decline in tropospheric NO2 columns in the NCP and the PRD. For megacities such as Beijing and Guangzhou, although they remained in the VOC-limited regime over 2016–2019, there was still a decrease in NO2 columns. Consistent with decreasing tropospheric NO2 columns, the national average surface NO2 concentration decreased by 14.4 % in summer from 2016 to 2019 and the NOx emissions in eastern China decreased from 5.93 Tg/yr in 2016 to 4.21 Tg/yr in 2019. This detected spatial expansion of the transitional regime and NOx emission reduction in the VOC-limited regime has contributed to rising surface O3 concentrations. The nationwide averaged O3 concentration in summer increased year by year from 2016 (104.86 µg/m3) to 2019 (125.14 µg/m3). The cities with average O3 values above 140 µg/m3 increased rapidly from 2.20 % in 2016 to 31.37 % in 2019.
Satellite instruments measure the vertically integrated column density, which we use as a proxy of the actual surface concentrations. To reduce the effect of short-term variability in vertical distributions caused by meteorological changes, we use monthly mean averages. Therefore, our satellite-based HCHO NO2 method is limited to identification of long-term evolution in O3 sensitivity, focusing on understanding the average air quality.
We presented the level of O3 formed from photo-oxidation of total measured HCHO only not differentiating the contributions from different sources (directly emitted or photochemically formed). Due to the higher temperature and stronger solar radiation in summer, the higher concentration level of HCHO mainly results from the intense photo-oxidation of VOCs. Emission sources of HCHO, as a tracer of VOCs, can be anthropogenic and biogenic. Shen et al. (2019) found that the OMI HCHO distribution follows their anthropogenic inventory in megacity clusters over China, while it does not follow the biogenic emissions inventory. Despite the fact that local sources of anthropogenic VOCs are difficult to identify, our FNR thresholds derived from satellite-based information have the potential to provide important information to air quality planners. Compared with stringent control measures for NOx emissions, VOC emissions got less attention as the other O3 precursor in China. The case study of O3 level changes during the COVID-19 lockdown in China demonstrated that the strong reductions in anthropogenic NOx emissions resulted in significant O3 enhancement due to the VOC-limited regime in winter. It indicates that a protocol with strict measures to control NOx emissions,without simultaneous VOC emissions controls for power plants and heavy industry, such as petrochemical facilities, achieves only limited effects on O3 pollution.
Satellite data used in this research can be obtained from public sources. The OMI tropospheric NO2 product from the QA4ECV project can be obtained from https://doi.org/10.21944/qa4ecv-no2-omi-v1.1 (Boersma et al., 2017), and the HCHO product can be obtained from https://doi.org/10.18758/71021031 (De Smedt et al., 2017b).
The monthly mean NOx emission products derived from OMI observations by DECSO v5.1qa can be obtained from https://www.temis.nl/emissions/region_asia/datapage.php (Ding et al., 2018).
The hourly O3 and NO2 observations of Chinese ground stations can be accessed from third parties (http://www.pm25.in, China National Environmental Monitoring Center, 2021a, http://www.aqicn.org, China National Environmental Monitoring Center, 2021b).
The hourly O3 and NO2 observations of Naha station are provided by the Japanese Atmospheric Environmental Regional Observation System (AEROS; http://soramame.taiki.go.jp/DownLoad.php, Japanese Ministry of the Environment, 2021).
The supplement related to this article is available online at: https://doi.org/10.5194/acp-21-7253-2021-supplement.
WW and RvdA provided satellite data, tools and analysis. RvdA, JD, MvW and TC undertook the conceptualization and investigation. WW prepared the original draft. RvdA and JD carried out the review and editing. All authors discussed the results and commented on the paper.
The authors declare that they have no conflict of interest.
This article is part of the special issue “Regional assessment of air pollution and climate change over East and Southeast Asia: results from MICS-Asia Phase III”. It is not associated with a conference.
The support provided by China Scholarship Council (CSC) during a visit by Wannan Wang to Royal Netherlands Meteorological Institute (KNMI) is acknowledged.
This paper was edited by Tim Butler and reviewed by two anonymous referees.
Barbaro, E., de Arellano, J. V.-G., Ouwersloot, H. G., Schröter, J. S., Donovan, D. P., and Krol, M. C.: Aerosols in the convective boundary layer: Shortwave radiation effects on the coupled land-atmosphere system, J. Geophys. Res.-Atmos., 119, 5845–5863, https://doi.org/10.1002/2013jd021237, 2014.
Bauwens, M., Compernolle, S., Stavrakou, T., Müller, J. F., van Gent, J., Eskes, H., Levelt, P. F., van der A, R., Veefkind, J. P., Vlietinck, J., Yu, H., and Zehner, C.: Impact of Coronavirus Outbreak on NO2 Pollution Assessed Using TROPOMI and OMI Observations, Geophys. Res. Lett., 47, e2020GL087978, https://doi.org/10.1029/2020GL087978, 2020.
Boersma, K. F., Braak, K., and van der A, R. J.: Dutch OMI NO2 (DOMINO) data product v2.0 HE5 data file user manual, available at: https://d37onar3vnbj2y.cloudfront.net/static/docs/OMI_NO2_HE5_2.0_2011.pdf (last access: 6 May 2021), 2011.
Boersma, K. F., Eskes, H., Richter, A., De Smedt, I., Lorente, A., Beirle, S., Van Geffen, J., Peters, E., Van Roozendael, M., and Wagner, T.: QA4ECV NO2 tropospheric and stratospheric vertical column data from OMI (Version 1.1) [Data set], Royal Netherlands Meteorological Institute (KNMI), https://doi.org/10.21944/qa4ecv-no2-omi-v1.1, 2017.
Boersma, K. F., Eskes, H. J., Richter, A., De Smedt, I., Lorente, A., Beirle, S., van Geffen, J. H. G. M., Zara, M., Peters, E., Van Roozendael, M., Wagner, T., Maasakkers, J. D., van der A, R. J., Nightingale, J., De Rudder, A., Irie, H., Pinardi, G., Lambert, J.-C., and Compernolle, S. C.: Improving algorithms and uncertainty estimates for satellite NO2 retrievals: results from the quality assurance for the essential climate variables (QA4ECV) project, Atmos. Meas. Tech., 11, 6651–6678, https://doi.org/10.5194/amt-11-6651-2018, 2018.
Brown-Steiner, B., Hess, P. G., and Lin, M. Y.: On the capabilities and limitations of GCCM simulations of summertime regional air quality: A diagnostic analysis of ozone and temperature simulations in the US using CESM CAM-Chem, Atmos. Environ., 101, 134–148, https://doi.org/10.1016/j.atmosenv.2014.11.001, 2015.
Cai, S., Wang, Y., Zhao, B., Wang, S., Chang, X., and Hao, J.: The impact of the “Air Pollution Prevention and Control Action Plan” on PM2.5 concentrations in Jing-Jin-Ji region during 2012–2020, Sci. Total Environ., 580, 197–209, https://doi.org/10.1016/j.scitotenv.2016.11.188, 2017.
Cheng, L., Wang, S., Gong, Z., Li, H., Yang, Q., and Wang, Y.: Regionalization based on spatial and seasonal variation in ground-level ozone concentrations across China, J. Environ. Sci., 67, 179–190, https://doi.org/10.1016/j.jes.2017.08.011, 2018.
China National Environmental Monitoring Center: Real-time Air Quality Index, available at: http://www.pm25.in/ last access: 6 May 2021a.
China National Environmental Monitoring Center: Real-time Air Quality Index, available at: http://aqicn.org, last access: 6 May 2021b.
Choi, Y. and Souri, A. H.: Chemical condition and surface ozone in large cities of Texas during the last decade: Observational evidence from OMI, CAMS, and model analysis, Remote Sens. Environ., 168, 90–101, https://doi.org/10.1016/j.rse.2015.06.026, 2015.
Choi, Y., Kim, H., Tong, D., and Lee, P.: Summertime weekly cycles of observed and modeled NOx and O3 concentrations as a function of satellite-derived ozone production sensitivity and land use types over the Continental United States, Atmos. Chem. Phys., 12, 6291–6307, https://doi.org/10.5194/acp-12-6291-2012, 2012.
Chou, C. C.-K., Tsai, C.-Y., Chang, C.-C., Lin, P.-H., Liu, S. C., and Zhu, T.: Photochemical production of ozone in Beijing during the 2008 Olympic Games, Atmos. Chem. Phys., 11, 9825–9837, https://doi.org/10.5194/acp-11-9825-2011, 2011.
CMEE: Technical Specifications for Installation and Acceptance of Ambient air Quality Continuous Automated Monitoring System for SO2, NO2, O3 and CO, Chinese Ministry of Ecology and Environment (CMEE), available at: http://www.mee.gov.cn/ywgz/fgbz/bz/bzwb/jcffbz/201308/W020130802493970989627.pdf (last access: 3 February 2021), 2013.
Crutzen, P. J.: Photochemical reactions initiated by and influencing ozone in unpolluted tropospheric air, Tellus, 26, 47–57, https://doi.org/10.3402/tellusa.v26i1-2.9736, 1974.
De Smedt, I., Geffen, J., Richter, A., Beirle, S., Yu, H., Vlietinck, J., Roozendael, M., Lorente, A., Scanlon, T., Compernolle, S., Wagner, T., Eskes, H., and Boersma, F.: Product User Guide for HCHO, available at: http://www.qa4ecv.eu/ecv/hcho-p/data (last access: 6 May 2021), 2017a.
De Smedt, I., Yu, H., Richter, A., Beirle, S., Eskes, H., Boersma, K.F., Van Roozendael, M., Van Geffen, J., Lorente, A. and Peters, E.: QA4ECV HCHO tropospheric column data from OMI (Version 1.1) [Data set], Royal Belgian Institute for Space Aeronomy, https://doi.org/10.18758/71021031, 2017b.
Ding, A. J., Fu, C. B., Yang, X. Q., Sun, J. N., Petäjä, T., Kerminen, V.-M., Wang, T., Xie, Y., Herrmann, E., Zheng, L. F., Nie, W., Liu, Q., Wei, X. L., and Kulmala, M.: Intense atmospheric pollution modifies weather: a case of mixed biomass burning with fossil fuel combustion pollution in eastern China, Atmos. Chem. Phys., 13, 10545–10554, https://doi.org/10.5194/acp-13-10545-2013, 2013.
Ding, J., van der A, R. J., Mijling, B., Levelt, P. F., and Hao, N.: NOx emission estimates during the 2014 Youth Olympic Games in Nanjing, Atmos. Chem. Phys., 15, 9399–9412, https://doi.org/10.5194/acp-15-9399-2015, 2015.
Ding, J., van der A, R. J., Mijling, B., and Levelt, P. F.: Space-based NOx emission estimates over remote regions improved in DECSO, Atmos. Meas. Tech., 10, 925–938, https://doi.org/10.5194/amt-10-925-2017, 2017.
Ding, J., van der A, R. J., Mijling, B., Jalkanen, J. P., Johansson, L., and Levelt, P. F.: Maritime NOx Emissions Over Chinese Seas Derived From Satellite Observations, Geophys. Res. Lett., 45, 2031–2037, https://doi.org/10.1002/2017GL076788, 2018 (data available at: https://www.temis.nl/emissions/region_asia/datapage.php, last access: 6 May 2021).
Ding, J., van der A, R. J., Eskes, H. J., Mijling, B., Stavrakou, T., van Geffen, J. H. G. M., and Veefkind, J. P.: NOx emissions reduction and rebound in China due to the COVID‐19 crisis, Geophys. Res. Lett., 46, e2020GL089912, https://doi.org/10.1029/2020GL089912, 2020.
Duncan, B. N., Yoshida, Y., Olson, J. R., Sillman, S., Martin, R. V., Lamsal, L., Hu, Y., Pickering, K. E., Retscher, C., and Allen, D. J. J. A. E.: Application of OMI observations to a space-based indicator of NOx and VOC controls on surface ozone formation, Atmos. Environ., 44, 2213–2223, https://doi.org/10.1016/j.atmosenv.2010.03.010, 2010.
Feng, L. and Liao, W.: Legislation, plans, and policies for prevention and control of air pollution in China: achievements, challenges, and improvements, J. Clean. Prod., 112, 1549–1558, https://doi.org/10.1016/j.jclepro.2015.08.013, 2016.
Fishman, J., Ramanathan, V., Crutzen, P. J., and Liu, S. C.: Tropospheric ozone and climate, Nature, 282, 818–820, https://doi.org/10.1038/282818a0, 1979.
Fu, T.-M., Jacob, D. J., Palmer, P. I., Chance, K., Wang, Y. X., Barletta, B., Blake, D. R., Stanton, J. C., and Pilling, M. J.: Space-based formaldehyde measurements as constraints on volatile organic compound emissions in east and south Asia and implications for ozone, J. Geophys. Res., 112, D06312, https://doi.org/10.1029/2006jd007853, 2007.
Hammer, M.-U., Vogel, B., and Vogel, H.: Findings on H2O2 HNO3 as an indicator of ozone sensitivity in Baden-Württemberg, Berlin-Brandenburg, and the Po valley based on numerical simulations, J. Geophys. Res., 107, 8190, https://doi.org/10.1029/2000jd000211, 2002.
Huang, J., Li, G., Xu, G., Qian, X., Zhao, Y., Pan, X., Huang, J., Cen, Z., Liu, Q., He, T., and Guo, X.: The burden of ozone pollution on years of life lost from chronic obstructive pulmonary disease in a city of Yangtze River Delta, China, Environ. Pollut., 242, 1266–1273, https://doi.org/10.1016/j.envpol.2018.08.021, 2018.
Huang, X., Ding, A., Gao, J., Zheng, B., Zhou, D., Qi, X., Tang, R., Wang, J., Ren, C., Nie, W., Chi, X., Xu, Z., Chen, L., Li, Y., Che, F., Pang, N., Wang, H., Tong, D., Qin, W., Cheng, W., Liu, W., Fu, Q., Liu, B., Chai, F., Davis, S. J., Zhang, Q., and He, K.: Enhanced secondary pollution offset reduction of primary emissions during COVID-19 lockdown in China, Natl. Sci. Rev., 8, nwaa137, https://doi.org/10.1093/nsr/nwaa137, 2020.
Hui, D. S., I Azhar, E., Madani, T. A., Ntoumi, F., Kock, R., Dar, O., Ippolito, G., McHugh, T. D., Memish, Z. A., Drosten, C., Zumla, A., and Petersen, E.: The continuing 2019-nCoV epidemic threat of novel coronaviruses to global health – The latest 2019 novel coronavirus outbreak in Wuhan, China, Int. J. Infect. Dis., 91, 264–266, https://doi.org/10.1016/j.ijid.2020.01.009, 2020.
IPCC: Climate Change 2013 – The Physical Science Basis: Working Group I Contribution to the Fifth Assessment Report of the Intergovernmental Panel on Climate Change, Cambridge University Press, Cambridge, UK, 2014.
Jacob, D. J.: Introduction to Atmospheric Chemistry, Princeton University Press, Princeton, United States, 280 pp., 1999.
Jacob, D. J.: Heterogeneous chemistry and tropospheric ozone, Atmos. Environ., 34, 2131–2159, https://doi.org/10.1016/S1352-2310(99)00462-8, 2000.
Janssen, R. H. H., Vilà-Guerau de Arellano, J., Ganzeveld, L. N., Kabat, P., Jimenez, J. L., Farmer, D. K., van Heerwaarden, C. C., and Mammarella, I.: Combined effects of surface conditions, boundary layer dynamics and chemistry on diurnal SOA evolution, Atmos. Chem. Phys., 12, 6827–6843, https://doi.org/10.5194/acp-12-6827-2012, 2012.
Japanese Ministry of the Environment: Japanese Atmospheric Environmental Regional Observation System, available at: http://soramame.taiki.go.jp/DownLoad.php, last access: 6 May 2021.
Jeon, W., Choi, Y., Souri, A. H., Roy, A., Diao, L., Pan, S., Lee, H. W., and Lee, S.-H.: Identification of chemical fingerprints in long-range transport of burning induced upper tropospheric ozone from Colorado to the North Atlantic Ocean, Sci. Total Environ., 613–614, 820–828, https://doi.org/10.1016/j.scitotenv.2017.09.177, 2018.
Jerrett, M., Burnett, R. T., Pope, C. A., Ito, K., Thurston, G., Krewski, D., Shi, Y., Calle, E., and Thun, M.: Long-Term Ozone Exposure and Mortality, N Engl. J. Med., 360, 1085–1095, https://doi.org/10.1056/NEJMoa0803894, 2009.
Jin, X. and Holloway, T.: Spatial and temporal variability of ozone sensitivity over China observed from the Ozone Monitoring Instrument, J. Geophys. Res.-Atmos., 120, 7229–7246, https://doi.org/10.1002/2015jd023250, 2015.
Jin, X., Fiore, A. M., Murray, L. T., Valin, L. C., Lamsal, L. N., Duncan, B., Boersma, K. F., De Smedt, I., Abad, G. G., Chance, K., and Tonnesen, G. S.: Evaluating a Space-Based Indicator of Surface Ozone-NOx-VOC Sensitivity Over Midlatitude Source Regions and Application to Decadal Trends, J. Geophys. Res.-Atmos., 122, 10439–10461, https://doi.org/10.1002/2017JD026720, 2017.
Jin, X., Fiore, A., Boersma, K. F., De Smedt, I., and Valin, L.: Inferring Changes in Summertime Surface Ozone–NOx–VOC Chemistry over U.S. Urban Areas from Two Decades of Satellite and Ground-Based Observations, Environ. Sci. Technol., 54, 6518–6529, https://doi.org/10.1021/acs.est.9b07785, 2020.
Khaniabadi, Y. O., Hopke, P. K., Goudarzi, G., Daryanoosh, S. M., Jourvand, M., and Basiri, H.: Cardiopulmonary mortality and COPD attributed to ambient ozone, Environ. Res., 152, 336–341, https://doi.org/10.1016/j.envres.2016.10.008, 2017.
Kleinman, L.: Low and high NOx tropospheric photochemistry, J. Geophys. Res.-Atmos., 99, 16831–16838, 1994.
Kurokawa, J., Ohara, T., Morikawa, T., Hanayama, S., Janssens-Maenhout, G., Fukui, T., Kawashima, K., and Akimoto, H.: Emissions of air pollutants and greenhouse gases over Asian regions during 2000–2008: Regional Emission inventory in ASia (REAS) version 2, Atmos. Chem. Phys., 13, 11019–11058, https://doi.org/10.5194/acp-13-11019-2013, 2013.
Lamsal, L. N., Krotkov, N. A., Celarier, E. A., Swartz, W. H., Pickering, K. E., Bucsela, E. J., Gleason, J. F., Martin, R. V., Philip, S., Irie, H., Cede, A., Herman, J., Weinheimer, A., Szykman, J. J., and Knepp, T. N.: Evaluation of OMI operational standard NO2 column retrievals using in situ and surface-based NO2 observations, Atmos. Chem. Phys., 14, 11587–11609, https://doi.org/10.5194/acp-14-11587-2014, 2014.
Levelt, P. F., van den Oord, G. H. J., Dobber, M. R., Malkki, A., Huib, V., de Johan, V., Stammes, P., Lundell, J. O. V., and Saari, H.: The ozone monitoring instrument, IEEE T. Geosci. Remote, 44, 1093–1101, 2006.
Levy, M., Zhang, R., Zheng, J., Zhang, A. L., Xu, W., Gomez-Hernandez, M., Wang, Y., and Olaguer, E.: Measurements of nitrous acid (HONO) using ion drift-chemical ionization mass spectrometry during the 2009 SHARP field campaign, Atmos. Environ., 94, 231–240, https://doi.org/10.1016/j.atmosenv.2014.05.024, 2014.
Li, K., Jacob, D. J., Liao, H., Shen, L., Zhang, Q., and Bates, K. H.: Anthropogenic drivers of 2013–2017 trends in summer surface ozone in China, P. Natl. Acad. Sci. USA, 116, 422–427, https://doi.org/10.1073/pnas.1812168116, 2019.
Li, M., Zhang, Q., Kurokawa, J.-I., Woo, J.-H., He, K., Lu, Z., Ohara, T., Song, Y., Streets, D. G., Carmichael, G. R., Cheng, Y., Hong, C., Huo, H., Jiang, X., Kang, S., Liu, F., Su, H., and Zheng, B.: MIX: a mosaic Asian anthropogenic emission inventory under the international collaboration framework of the MICS-Asia and HTAP, Atmos. Chem. Phys., 17, 935–963, https://doi.org/10.5194/acp-17-935-2017, 2017.
Li, M., Zhang, Q., Zheng, B., Tong, D., Lei, Y., Liu, F., Hong, C., Kang, S., Yan, L., Zhang, Y., Bo, Y., Su, H., Cheng, Y., and He, K.: Persistent growth of anthropogenic non-methane volatile organic compound (NMVOC) emissions in China during 1990–2017: drivers, speciation and ozone formation potential, Atmos. Chem. Phys., 19, 8897–8913, https://doi.org/10.5194/acp-19-8897-2019, 2019.
Li, P., De Marco, A., Feng, Z., Anav, A., Zhou, D., and Paoletti, E.: Nationwide ground-level ozone measurements in China suggest serious risks to forests, Environ. Pollut., 237, 803–813, https://doi.org/10.1016/j.envpol.2017.11.002, 2018.
Li, X., Zhang, C., Zhang, B., and Liu, K.: A comparative time series analysis and modeling of aerosols in the contiguous United States and China, Sci. Total Environ., 690, 799–811, https://doi.org/10.1016/j.scitotenv.2019.07.072, 2019.
Liu, Z., Wang, Y., Gu, D., Zhao, C., Huey, L. G., Stickel, R., Liao, J., Shao, M., Zhu, T., Zeng, L., Amoroso, A., Costabile, F., Chang, C.-C., and Liu, S.-C.: Summertime photochemistry during CAREBeijing-2007: ROx budgets and O3 formation, Atmos. Chem. Phys., 12, 7737–7752, https://doi.org/10.5194/acp-12-7737-2012, 2012.
Martin, R. V., Fiore, A. M., and Van Donkelaar, A.: Space-based diagnosis of surface ozone sensitivity to anthropogenic emissions, Geophys. Res. Lett., 31, L06120, https://doi.org/10.1029/2004gl019416, 2004.
Mijling, B. and van der A, R. J.: Using daily satellite observations to estimate emissions of short-lived air pollutants on a mesoscopic scale, J. Geophys. Res., 117, D17302, https://doi.org/10.1029/2012JD017817, 2012.
Milford, J. B., Russell, A. G., and McRae, G. J.: A new approach to photochemical pollution control: Implications of spatial patterns in pollutant responses to reductions in nitrogen oxides and reactive organic gas emissions, Environ. Sci. Technol., 23, 1290–1301, 1989.
Millet, D. B., Jacob, D. J., Boersma, K. F., Fu, T.-M., Kurosu, T. P., Chance, K., Heald, C. L., and Guenther, A.: Spatial distribution of isoprene emissions from North America derived from formaldehyde column measurements by the OMI satellite sensor, J. Geophys. Res., 113, D02307, https://doi.org/10.1029/2007jd008950, 2008.
Palmer, P. I., Jacob, D. J., Fiore, A. M., Martin, R. V., Chance, K., and Kurosu, T. P.: Mapping isoprene emissions over North America using formaldehyde column observations from space, Geophys. Res., 108, 4180, https://doi.org/10.1029/2002jd002153, 2003.
Schroeder, J. R., Crawford, J. H., Fried, A., Walega, J., Weinheimer, A., Wisthaler, A., Müller, M., Mikoviny, T., Chen, G., Shook, M., Blake, D. R., and Tonnesen, G. S.: New insights into the column CH2ONO2 ratio as an indicator of near-surface ozone sensitivity, J. Geophys. Res.-Atmos., 122, 8885–8907, https://doi.org/10.1002/2017JD026781, 2017.
Seinfeld, J. H. and Pandis, S. N.: Atmospheric Chemistry and Physics: From Air Pollution to Climate Change, Wiley, United States, 1152 pp., 2016.
Shah, V., Jacob, D. J., Li, K., Silvern, R. F., Zhai, S., Liu, M., Lin, J., and Zhang, Q.: Effect of changing NOx lifetime on the seasonality and long-term trends of satellite-observed tropospheric NO2 columns over China, Atmos. Chem. Phys., 20, 1483–1495, https://doi.org/10.5194/acp-20-1483-2020, 2020.
Shao, M., Zhang, Y., Zeng, L., Tang, X., Zhang, J., Zhong, L., and Wang, B.: Ground-level ozone in the Pearl River Delta and the roles of VOC and NOx in its production, J. Environ. Manage., 90, 512–518, https://doi.org/10.1016/j.jenvman.2007.12.008, 2009.
Shen, L., Jacob, D. J., Zhu, L., Zhang, Q., Zheng, B., Sulprizio, M. P., Li, K., De Smedt, I., González Abad, G., Cao, H., Fu, T.-M., and Liao, H.: The 2005–2016 Trends of Formaldehyde Columns Over China Observed by Satellites: Increasing Anthropogenic Emissions of Volatile Organic Compounds and Decreasing Agricultural Fire Emissions, Geophys. Res. Lett., 46, 4468–4475, https://doi.org/10.1029/2019GL082172, 2019.
Sicard, P., De Marco, A., Agathokleous, E., Feng, Z., Xu, X., Paoletti, E., Rodriguez, J. J. D., and Calatayud, V.: Amplified ozone pollution in cities during the COVID-19 lockdown, Sci. Total Environ., 735, 139542, https://doi.org/10.1016/j.scitotenv.2020.139542, 2020.
Siciliano, B., Dantas, G., da Silva, C. M., and Arbilla, G.: Increased ozone levels during the COVID-19 lockdown: Analysis for the city of Rio de Janeiro, Brazil, Sci. Total Environ., 737, 139765, https://doi.org/10.1016/j.scitotenv.2020.139765, 2020.
Sillman, S.: The use of NOy, H2O2, and HNO3 as indicators for ozone-NOx-hydrocarbon sensitivity in urban locations, J. Geophys. Res.-Atmos., 100, 14175–14188, https://doi.org/10.1029/94JD02953, 1995.
Sillman, S.: The relation between ozone, NOx and hydrocarbons in urban and polluted rural environments, Atmos. Environ., 33, 1821–1845, https://doi.org/10.1016/S1352-2310(98)00345-8, 1999.
Sillman, S.: Tropospheric Ozone and Photochemical Smog, in: Treatise on Geochemistry, edited by: Holland, H. D. and Turekian, K. K., Pergamon, Oxford, UK, 407–431, 2003.
Sillman, S., Logan, J. A., and Wofsy, S. C.: The sensitivity of ozone to nitrogen oxides and hydrocarbons in regional ozone episodes, J. Geophys. Res.-Atmos., 95, 1837–1851, https://doi.org/10.1029/JD095iD02p01837, 1990.
Souri, A. H., Choi, Y., Jeon, W., Woo, J. H., Zhang, Q., and Kurokawa, J.: Remote sensing evidence of decadal changes in major tropospheric ozone precursors over East Asia, J. Geophys. Res.-Atmos., 122, 2474–2492, https://doi.org/10.1002/2016JD025663, 2017.
Sun, Y., Wang, L., Wang, Y., Quan, L., and Zirui, L.: In situ measurements of SO2, NOx, NOy, and O3 in Beijing, China during August 2008, Sci. Total Environ., 409, 933–940, https://doi.org/10.1016/j.scitotenv.2010.11.007, 2011.
Tang, G., Wang, Y., Li, X., Ji, D., Hsu, S., and Gao, X.: Spatial-temporal variations in surface ozone in Northern China as observed during 2009–2010 and possible implications for future air quality control strategies, Atmos. Chem. Phys., 12, 2757–2776, https://doi.org/10.5194/acp-12-2757-2012, 2012.
Tian, H., Liu, Y., Li, Y., Wu, C.-H., Chen, B., Kraemer, M. U. G., Li, B., Cai, J., Xu, B., Yang, Q., Wang, B., Yang, P., Cui, Y., Song, Y., Zheng, P., Wang, Q., Bjornstad, O. N., Yang, R., Grenfell, B. T., Pybus, O. G., and Dye, C.: An investigation of transmission control measures during the first 50 days of the COVID-19 epidemic in China, Science, 368, 638–642, https://doi.org/10.1126/science.abb6105, 2020.
Tian, Y., Wu, Y., Liu, H., Si, Y., Wu, Y., Wang, X., Wang, M., Wu, J., Chen, L., Wei, C., Wu, T., Gao, P., and Hu, Y.: The impact of ambient ozone pollution on pneumonia: A nationwide time-series analysis, Environ. Int., 136, 105498, https://doi.org/10.1016/j.envint.2020.105498, 2020.
Tobías, A., Carnerero, C., Reche, C., Massagué, J., Via, M., Minguillón, M. C., Alastuey, A., and Querol, X.: Changes in air quality during the lockdown in Barcelona (Spain) one month into the SARS-CoV-2 epidemic, Sci. Total Environ., 726, 138540, https://doi.org/10.1016/j.scitotenv.2020.138540, 2020.
van Donkelaar, A., Martin Randall, V., Brauer, M., Kahn, R., Levy, R., Verduzco, C., and Villeneuve Paul, J.: Global Estimates of Ambient Fine Particulate Matter Concentrations from Satellite-Based Aerosol Optical Depth: Development and Application, Environ. Health Persp., 118, 847–855, https://doi.org/10.1289/ehp.0901623, 2010.
van Heerwaarden, C. C., Vilà-Guerau de Arellano, J., Gounou, A., Guichard, F., and Couvreux, F.: Understanding the Daily Cycle of Evapotranspiration: A Method to Quantify the Influence of Forcings and Feedbacks, J. Hydrometeorol., 11, 1405–1422, https://doi.org/10.1175/2010JHM1272.1, 2010.
van Stratum, B. J. H., Vilà-Guerau de Arellano, J., Ouwersloot, H. G., van den Dries, K., van Laar, T. W., Martinez, M., Lelieveld, J., Diesch, J.-M., Drewnick, F., Fischer, H., Hosaynali Beygi, Z., Harder, H., Regelin, E., Sinha, V., Adame, J. A., Sörgel, M., Sander, R., Bozem, H., Song, W., Williams, J., and Yassaa, N.: Case study of the diurnal variability of chemically active species with respect to boundary layer dynamics during DOMINO, Atmos. Chem. Phys., 12, 5329–5341, https://doi.org/10.5194/acp-12-5329-2012, 2012.
Vilà-Guerau de Arellano, J., Patton, E. G., Karl, T., van den Dries, K., Barth, M. C., and Orlando, J. J.: The role of boundary layer dynamics on the diurnal evolution of isoprene and the hydroxyl radical over tropical forests, J. Geophys. Res.-Atmos., 116, D07304, https://doi.org/10.1029/2010JD014857, 2011.
Vilà-Guerau de Arellano, J., van Heerwaarden, C. C., van Stratum, B. J. H., and van den Dries, K.: Atmospheric Boundary Layer, Integrating Air Chemistry and Land Interactions, Cambridge University Press, New York, USA, 265 pp., 2015.
Wang, C., Horby, P. W., Hayden, F. G., and Gao, G. F.: A novel coronavirus outbreak of global health concern, Lancet, 395, 470–473, https://doi.org/10.1016/S0140-6736(20)30185-9, 2020.
Wang, N., Lyu, X., Deng, X., Huang, X., Jiang, F., and Ding, A.: Aggravating O3 pollution due to NOx emission control in eastern China, Sci. Total Environ., 677, 732–744, 2019.
Wang, Q. and Su, M.: A preliminary assessment of the impact of COVID-19 on environment – A case study of China, Sci. Total Environ., 728, 138915, https://doi.org/10.1016/j.scitotenv.2020.138915, 2020.
Wang, T., Wei, X. L., Ding, A. J., Poon, C. N., Lam, K. S., Li, Y. S., Chan, L. Y., and Anson, M.: Increasing surface ozone concentrations in the background atmosphere of Southern China, 1994–2007, Atmos. Chem. Phys., 9, 6217–6227, https://doi.org/10.5194/acp-9-6217-2009, 2009.
Wang, T., Xue, L., Brimblecombe, P., Lam, Y. F., Li, L., and Zhang, L.: Ozone pollution in China: A review of concentrations, meteorological influences, chemical precursors, and effects, Sci. Total Environ., 575, 1582–1596, https://doi.org/10.1016/j.scitotenv.2016.10.081, 2017.
Wang, W. N., Cheng, T. H., Gu, X. F., Chen, H., Guo, H., Wang, Y., Bao, F. W., Shi, S. Y., Xu, B. R., Zuo, X., Meng, C., and Zhang, X. C.: Assessing Spatial and Temporal Patterns of Observed Ground-level Ozone in China, Sci. Rep.-UK, 7, 3651, https://doi.org/10.1038/s41598-017-03929-w, 2017.
Wang, Z., Lv, J., Tan, Y., Guo, M., Gu, Y., Xu, S., and Zhou, Y.: Temporospatial variations and Spearman correlation analysis of ozone concentrations to nitrogen dioxide, sulfur dioxide, particulate matters and carbon monoxide in ambient air, China, Atmos. Pollut. Res., 10, 1203–1210, https://doi.org/10.1016/j.apr.2019.02.003, 2019.
Witte, J., Duncan, B., Douglass, A., Kurosu, T., Chance, K., and Retscher, C.: The unique OMI HCHO NO2 feature during the 2008 Beijing Olympics: Implications for ozone production sensitivity, Journal: Atmospheric Environment, 45, 3103–3111, https://doi.org/10.1016/j.atmosenv.2011.03.015, 2011.
Xing, J., Wang, S. X., Jang, C., Zhu, Y., and Hao, J. M.: Nonlinear response of ozone to precursor emission changes in China: a modeling study using response surface methodology, Atmos. Chem. Phys., 11, 5027–5044, https://doi.org/10.5194/acp-11-5027-2011, 2011.
Xing, J., Li, S., Jiang, Y., Wang, S., Ding, D., Dong, Z., Zhu, Y., and Hao, J.: Quantifying the emission changes and associated air quality impacts during the COVID-19 pandemic on the North China Plain: a response modeling study, Atmos. Chem. Phys., 20, 14347–14359, https://doi.org/10.5194/acp-20-14347-2020, 2020.
Xue, L. K., Wang, T., Gao, J., Ding, A. J., Zhou, X. H., Blake, D. R., Wang, X. F., Saunders, S. M., Fan, S. J., Zuo, H. C., Zhang, Q. Z., and Wang, W. X.: Ground-level ozone in four Chinese cities: precursors, regional transport and heterogeneous processes, Atmos. Chem. Phys., 14, 13175–13188, https://doi.org/10.5194/acp-14-13175-2014, 2014.
Zara, M., Boersma, K. F., De Smedt, I., Richter, A., Peters, E., van Geffen, J. H. G. M., Beirle, S., Wagner, T., Van Roozendael, M., Marchenko, S., Lamsal, L. N., and Eskes, H. J.: Improved slant column density retrieval of nitrogen dioxide and formaldehyde for OMI and GOME-2A from QA4ECV: intercomparison, uncertainty characterisation, and trends, Atmos. Meas. Tech., 11, 4033–4058, https://doi.org/10.5194/amt-11-4033-2018, 2018.
Zeng, Y., Cao, Y., Qiao, X., Seyler, B. C., and Tang, Y.: Air pollution reduction in China: Recent success but great challenge for the future, Sci. Total Environ., 663, 329–337, 2019.
Zhang, H., Wang, S., Hao, J., Wang, X., Wang, S., Chai, F., and Li, M.: Air pollution and control action in Beijing, J. Clean. Prod., 112, 1519–1527, https://doi.org/10.1016/j.jclepro.2015.04.092, 2016.
Zhao, Y., Zhang, K., Xu, X., Shen, H., Zhu, X., Zhang, Y., Hu, Y., and Shen, G.: Substantial Changes in Nitrogen Dioxide and Ozone after Excluding Meteorological Impacts during the COVID-19 Outbreak in Mainland China, Environ. Sci. Tech. Let., 7, 402–408, https://doi.org/10.1021/acs.estlett.0c00304, 2020.
Zoran, M. A., Savastru, R. S., Savastru, D. M., and Tautan, M. N.: Assessing the relationship between ground levels of ozone (O3) and nitrogen dioxide (NO2) with coronavirus (COVID-19) in Milan, Italy, Sci. Total Environ., 740, 140005, https://doi.org/10.1016/j.scitotenv.2020.140005, 2020.