the Creative Commons Attribution 4.0 License.
the Creative Commons Attribution 4.0 License.
 | 04 May 2021
Isotopic compositions of atmospheric total gaseous mercury in 10 Chinese cities and implications for land surface emissions
Chen Liu
Hui Zhang
Yue Xu
Hui Zhang
Xiaopu Lyu
Gan Zhang
Leiming Zhang
Land surface emissions are an important source of atmospheric total gaseous mercury (TGM); however, its role on the variations of TGM isotopic compositions and concentrations has not been properly evaluated. In this study, TGM isotope compositions, a powerful tracer for sources and transformation of Hg, were measured at 10 urban sites and one rural site in China. TGM concentrations were higher in summer than in winter in most cities except in Guiyang and Guangzhou in the low latitudes. The summertime high TGM concentrations coincided with prevailing low TGM δ202Hg and high TGM Δ199Hg signatures. These seasonal patterns were in contrast with those typically observed in rural areas in the Northern Hemisphere, suggesting that atmospheric oxidation chemistry, vegetation activity and residential coal combustion were likely not the dominant mechanisms contributing to the TGM concentration and isotopic composition seasonality in Chinese cities. The amplitudes of seasonal variations in TGM concentrations and Δ199Hg (or TGM δ202Hg) were significantly positively (or negatively) correlated with that of the simulated soil GEM emission flux. These results suggest that the seasonal variations in TGM isotopic compositions and concentrations in the 10 Chinese cities were likely controlled by land surface emissions that were observed or reported with highly negative δ202Hg signatures.
- Article
(4787 KB) - Full-text XML
-
Supplement
(3723 KB) - BibTeX
- EndNote


Mercury (Hg) is a toxic heavy metal pollutant of global concern for ecological and human health. Hg in the atmosphere includes three major forms: gaseous elemental mercury (GEM), gaseous oxidized mercury (GOM) and particulate bound mercury (PBM). According to global Hg models, GEM is the dominant form of total gaseous mercury (TGM = GEM + GOM, 88.8 %–92.9 %) and total Hg (88.8 %–92.8 %) in the troposphere (Selin et al., 2007; Holmes et al., 2010; Horowitz et al., 2017), and the fraction of GEM in total atmospheric Hg is thought to be much higher in the planetary boundary layer (PBL) (e.g., on average >95 %) than that in the free troposphere (Swartzendruber et al., 2009; Lyman and Jaffe, 2012; Shah et al., 2016). GEM has a long atmospheric residence time and can transport globally through the atmosphere (Obrist et al., 2018). GEM can be deposited onto Earth's surface by dry deposition or atmospheric oxidation followed by wet and dry deposition. Once deposited, it can be transformed to methylmercury and subsequently bioaccumulated in the food web, posing a threat to human health and the environment (Obrist et al., 2018). GEM in the atmosphere can be derived from primary anthropogenic, natural and legacy emissions. Land surface emissions are an important source of atmospheric GEM. Total GEM emissions from global land surfaces, although not well constrained, are estimated to range from 600 to 2000 Mg yr−1, which are similar in magnitude to the global primary anthropogenic GEM emissions (Selin et al., 2007; Holmes et al., 2010; Pirrone et al., 2010; Agnan et al., 2016). However, to what extent the land surface emissions can contribute to the variations of GEM at local, regional and global scales has not been well understood.
TGM or GEM concentrations in urban areas are generally elevated as compared to rural areas (Fu et al., 2015; Mao et al., 2016), which could be attributed to strong Hg emissions from primary anthropogenic sources, urban surfaces (soil, pavement and building surfaces, mainly referred to as “legacy” emissions) and indoor Hg-containing products (Carpi and Chen, 2001; Feng et al., 2005; Eckley and Branfireun, 2008; Rutter et al., 2009). A previous study in Mexico City, Mexico, based on pollution roses and concentration field analysis (CFA), suggested that highly elevated GEM concentrations (mean = 7.2 ng m−3) were dominantly (81 %) attributed to anthropogenic sources (Rutter et al., 2009). The large percentage of anthropogenic source contributions, however, might have been supplemented by volcanic emissions and re-emission of Hg previously deposited to urban surfaces in anthropogenic source regions (Rutter et al., 2009). On the other hand, TGM concentrations in New York, USA (mean = 3.90 ng m−3), and Nanjing, China (mean = 7.9 ng m−3), were observed to be positively correlated with air temperature and/or the intensity of solar radiation, implying that land surface emissions contributed to elevated TGM levels (Carpi and Chen, 2002; Zhu et al., 2012). This hypothesis has not considered the atmospheric transport patterns and temporal variations in anthropogenic emissions at local and regional scales and needs to be further validated. GOM is a potential proxy of anthropogenic sources. However, GOM has a short atmospheric residence time and could also be produced via in situ oxidation of GEM, making it challenging to identify the contributions of anthropogenic sources to TGM or GEM in many urban areas using GOM observations (Lynam and Keeler, 2005; Peterson et al., 2009; Rutter et al., 2009). Relative contributions from specific sources in urban areas could be also assessed by development of TGM or GEM emission inventories of different source categories. For example, total GEM emissions from soils in Guiyang, China, were scaled up based on an empirical model and were similar in magnitude to those from anthropogenic sources (Feng et al., 2005). Such approaches, however, are very limited in many urban areas in China and other countries worldwide. Therefore, the understanding of the sources of TGM or GEM in urban areas is essentially limited and there is a need to develop an additional tracer to identify the controls of specific sources on the variations of TGM or GEM in urban areas.
The Hg stable isotope is a rapidly growing tool for studying the biogeochemical cycle of Hg in the environment (Blum and Johnson, 2017). Hg isotopes in Earth surface systems can undergo both mass-dependent fractionation (MDF; δ202Hg signature) and mass-independent fractionation (MIF; Δ199Hg, Δ201Hg and Δ200Hg signatures), which might be caused by a specific or multiple sources and transformation processes (Blum et al., 2014). Previous studies found that Chinese coal-fired power plants (CFPPs) emitted GEM with slightly negative δ202Hg (mean = −0.26 ‰) and significantly negative Δ199Hg (mean = −0.26 ‰) values (Tang et al., 2017; H. W. Liu et al., 2019). Based on the observed isotopic compositions of global source materials, fractionation of Hg isotopes during industrial processes and global Hg emission inventory, R. Y. Sun et al. (2016) predicted a mean δ202Hg of −0.59 ‰ and a mean Δ199Hg of −0.02 ‰ for the global primary anthropogenic GEM emissions in 2010. On the other hand, isotopic compositions of indoor GEM and GEM emitted from urban building surfaces were characterized by highly negative δ202Hg (means = −1.54 ‰ to −1.56 ‰, n=2) and near zero to slightly positive Δ199Hg values (means = 0.00 ‰ to 0.17 ‰, n=2) (Jiskra et al., 2019a). Isotopic compositions of GEM emitted from urban soils currently remain unknown. Global Hg isotope models proposed this source would have highly negative δ202Hg (e.g., ‰) and positive Δ199Hg signatures (e.g., ∼1.7 ‰) (Sonke, 2011; Sun et al., 2019). Therefore, GEM emitted from anthropogenic sources is probably isotopically distinguishable from that emitted from land surfaces and indoor Hg-containing products, which provide an useful tracer for identification of TGM or GEM sources in urban areas.
Previous studies have measured the isotopic compositions of TGM or GEM at many rural and a few urbanized sites in the Northern Hemisphere (Gratz et al., 2010; Sherman et al., 2010; Demers et al., 2013, 2015; Enrico et al., 2016; Fu et al., 2016; Yu et al., 2016; Obrist et al., 2017; Xu et al., 2017; Fu et al., 2018, 2019; Jiskra et al., 2019a, b). According to these studies, TGM or GEM isotopic compositions in urban areas showed a mean δ202Hg of −0.49 ± 0.28 ‰ and a mean Δ199Hg of 0.02 ± 0.04 ‰ (1σ, n=4), which were much lower and higher, respectively, than the mean values observed in rural areas (mean δ202Hg = 0.56 ± 0.45 ‰, mean Δ199Hg = −0.18 ± 0.06 ‰, 1σ, n=10). The lower TGM δ202Hg and higher Δ199Hg signatures in urban areas relative to rural areas were previously hypothesized to be mainly related to primary anthropogenic emissions, whereas the effect of emission and re-emission of GEM from urban surfaces was frequently neglected mainly because of the strong primary anthropogenic Hg emissions and poor understanding of emission flux and isotopic signatures of GEM from land surfaces in urban areas. It should be noted that many observational TGM δ202Hg values in urban areas (e.g., Beijing and Guiyang of China) or in urbanized and industrial plumes were far more negative than that estimated for anthropogenic emissions (−0.59 ‰) (R. Y. Sun et al., 2016; Yu et al., 2016; Fu et al., 2018). This indicates that primary anthropogenic emissions were not the exclusive explanation for the highly negative TGM δ202Hg signatures in the urban atmosphere.
In this study, TGM concentrations and isotopic compositions were measured in 10 Chinese cities in summer and winter 2018, providing a unique opportunity for studying the spatial and seasonal variations in TGM concentrations and isotopic compositions in urban areas of China. Isotopic compositions of GEM emitted from soils were also measured in two Chinese cities and, together with data in literature, were used to investigate the role of land surface emissions in the seasonal and spatial variations in TGM concentrations and isotopic compositions in major Chinese cities. The findings in this study are helpful for a better understanding of the sources of atmospheric TGM in urban areas of China and the knowledge gained emphasizes the need to mitigate surface Hg emissions during implementation of the Minamata Convention.
2.1 Study sites
Ten cities including Beijing, Shijiazhuang, and Jinan in northern China, Lanzhou in northwestern China, Zhengzhou and Wuhan in central China, Shanghai in eastern China, Chengdu and Guiyang in southwestern China, and Guangzhou in southern China were selected for measuring TGM concentrations and isotopic compositions (Fig. S1 in the Supplement). These cities are located in different geographical regions of China, which were potentially characterized by specific source emission patterns, climate, and atmospheric chemistry. The designated investigations in these cities may therefore provide comprehensive information on the variations of TGM concentrations and isotopic compositions in the megacities of China and help to explore the major factors influencing the atmospheric TGM in Chinese cities. Site locations, information about the 10 cities and sampling periods are given in Table S1 in the Supplement. Briefly, these cities have populations of 3.75 to 21.54 million in urban areas. Fractions of the urban and construction land area out of the total land area of a 1∘ × 1∘ grid surrounding the sampling sites ranged from 4.9 % to 41.1 % (mean = 22.5 %), whereas the remaining land surfaces are mainly croplands, barren lands, open grassland, open shrublands and open forests (range from 35.6 % to 82.3 % with a mean of 57.5 %) (Fig. S2 and Table S1 in the Supplement). In each of the 10 cities, one sampling site was selected for measuring TGM concentrations and isotopic compositions. The sampling sites are generally located in heavily commercial and residential areas in all the cities and with no major industrial Hg emission sources within 2 km of the sampling sites. All the measurements were conducted on building roofs at elevations of >10 m. In order to investigate the shift of GEM isotopic compositions in urban areas relative to that in remote areas due to local urbanized emissions, the same type of measurements were also conducted at the rural Waliguan Baseline Observatory in northwestern China (Mt. Waliguan), which belongs to the World Meteorological Organization's (WMO) Global Atmospheric Watch (GAW) network (Fig. S1 in the Supplement).
2.2 Sampling of TGM
In this study, chlorine-impregnated activated carbon (CLC; 0.5 g) traps were used to collect atmospheric TGM samples (Fu et al., 2014). A schematic diagram of the sampling system is shown in Fig. S3 in the Supplement. Briefly, particles in ambient air were first removed using a Teflon filter (47 mm diameter; 0.2 µm pore size) at the inlet of the sampling system, and then ambient TGM were trapped onto the CLC traps at a flow rate of ∼2.5 L min−1 using a Teflon-coated mini-diaphragm vacuum pump (N89 KTDC, KNF Inc.). The sampling flow rate was adjusted using a needle valve installed at the outlet of the vacuum pump. The inlet of the sampling system was about 1.5 m above the surface. Daily (24 h) continuous sampling of TGM at each urban site lasted for approximately 1 week in the winter and summer of 2018, respectively (daily samples; Table S1 in the Supplement). The wintertime samplings were conducted from 5 to 15 January 2018 simultaneously in Beijing, Shijiazhuang, Jinan, Lanzhou and Zhengzhou, and from 18 to 27 January 2018 simultaneously in Shanghai, Chengdu, Wuhan, Guiyang and Guangzhou. The summertime samplings were conducted from 29 June to 7 July 2018 simultaneously in Shijiazhuang, Jinan, Zhengzhou, Guiyang and Guangzhou, and from 27 July to 10 August 2018 simultaneously in Beijing, Lanzhou, Shanghai, Wuhan and Chengdu. TGM samples were also continuously collected from 19 November 2014 to 19 February 2015 at Mt. Waliguan with a sampling duration of 10 d. After field sampling, CLC traps were sealed carefully and kept in a sealed polypropylene crisper before sample processing for Hg isotope analysis.
GOM concentrations are generally elevated in Chinese urban areas due to local primary anthropogenic emissions (Fu et al., 2015). Previous studies showed that GOM measured using a Tekran 2537/1130/1135 system on average accounted for 0.37 % to 0.50 % of TGM in Guiyang, Beijing and Shanghai, China, while the daily GOM fractions in TGM ranged from 0.04 % to 1.58 % in Guiyang (Table S2 in the Supplement) (Fu et al., 2011; Duan et al., 2017; Zhang et al., 2019). It is likely that the Tekran system could underestimate GOM concentrations by approximately 3-fold with respect to that measured by other recently developed methods (e.g., cation exchange membranes (CEMs) or nylon membranes) (Huang et al., 2013; Gustin et al., 2015, 2019). To date, GOM has not been measured by CEM or nylon membranes in Chinese urban areas. If adjusting GOM concentrations by a factor of 3, the abovementioned mean GOM fractions would be increased to 1.1 %–1.5 % in Guiyang, Beijing and Shanghai, and these values are similar to those observed in Reno, Nevada, USA, based on the CEM method (mean GOM fraction of 2.7 %) (Gustin et al., 2019). Mean δ202Hg and Δ199Hg of TGM in urban areas of this study ranged from −0.96 ‰ to −0.24 ‰ and −0.12 ‰ to −0.01 ‰, respectively. Assuming that the isotope composition of GOM resemble those of primary anthropogenic emissions (e.g., δ202Hg = −0.77 ‰, Δ199Hg = −0.06 ‰) (R. Y. Sun et al., 2016), a maximum GOM fraction of TGM (5 %) would lead to negligible shifts in TGM δ202Hg (−0.03 ‰ to 0.01 ‰) and Δ199Hg (−0.003 ‰ to 0.003 ‰). Therefore, TGM isotopic composition measured in this study would not be biased significantly by GOM compounds. The use of the terms “TGM” and “GEM” interchangeably in this and previous studies would not significantly confound the intercomparison of isotopic composition.
2.3 Sample processing and TGM analysis
Before the analysis of Hg concentration and isotopic composition, TGM collected on CLC traps were preconcentrated into 5 mL of 2HNO3 1HCl mixed acid solution (40 %) following previous studies (Biswas et al., 2008; Sun et al., 2013; Fu et al., 2014). Trapping solution Hg concentrations were measured by a Tekran 2500 Hg analyzer following US EPA Method 1631 (USEPA, 2002). TGM concentrations of the samples were calculated using Eq. (1):
where TGM is the atmospheric TGM concentration in ng m−3, C is the Hg concentration in the trap solution in ng mL−1, Vsolution is the volume of the trap solution in mL and Vgas is the cumulative sampling air volume in m3. Full procedural blanks of field sampling and preconcentration were measured at each sampling site and in each season by combustion of sealed field CLC traps (containing 0.5 g CLC) prepared before field sampling. The mean Hg concentration in these sealed field blanks was 0.20 ± 0.09 ng (1σ, n=27; Table S3 in the Supplement), which was negligible (<5 %) compared to the Hg in trapping solutions of samples. Breakthrough tests showed that 96.7 % to 99.6 % (mean = 98.9 ± 0.9 %, 1σ, n=10) of TGM in ambient air could be collected by the CLC traps in our experiment setting (Table S3 in the Supplement). Recoveries of the preconcentration were tested by combustion of lichen CRM (BCR 482), which showed a mean value of 92.5 ± 3.9 % (1σ, n=6; Table S3 in the Supplement). Standard additions of Hg0 vapor (5 to 25 ng; produced by SnCl2 reduction of diluted NIST 3133 solutions) to CLC traps at the 2.5 L min−1 sampling flow rate showed a mean recovery of 93.2 ± 11.8 % (1σ, n=11; Table S3 in the Supplement) for the sampling and preconcentration method. These tests indicate that the above method is reliable and efficient for measuring TGM concentrations and isotopic compositions.
2.4 TGM isotope analysis
Prior to isotope analysis, the concentrations of Hg in trap solution were diluted to 0.5 or 1.0 ng mL−1 using the 2HNO3 1HCl mixed acid solution (20 %). Isotope ratios of Hg in diluted trap solutions were measured by cold-vapor multicollector inductively coupled plasma mass spectrometry (CV-MC-ICPMS) using a Nu Plasma (Nu Instruments) and a Neptune (Thermo Fisher Scientific) in the Institute of Geochemistry, CAS (Guiyang, China) (Fu et al., 2019). TGM isotopic compositions were calculated following Eqs. (2) and (3) (Blum and Bergquist, 2007):
where δxxxHgTGM are the MDF signatures of TGM in per mil (‰), xxx is the mass number of Hg isotopes (199, 200, 201, 202, and 204), (xxxHg 198Hg)sample is the isotope ratios for TGM samples and (xxxHg 198Hg)NIST 3133 is the isotope ratios for the bracketing NIST 3133 standard (concentrations matched within 10 % of the sample trapping solution Hg concentrations).
where ΔxxxHgTGM are the MIF signatures of TGM isotopes 199Hg, 200Hg, 201Hg and 204Hg in per mil (‰), and β values are 0.252, 0.5024, 0.752 and 1.493 for isotopes 199Hg, 200Hg, 201Hg and 204Hg, respectively (Blum and Bergquist, 2007).
Isotopic compositions of NIST 3177 Hg standard (n=30), lichen CRM (BCR 482, n=6) and standard additions of NIST 3133 Hg to CLC traps (n=11) (Table S3 in the Supplement) were analyzed periodically during TGM isotope analysis, and the results were consistent with previously reported values or the original values of the NIST 3133 Hg standard (Table S3 in the Supplement) (Enrico et al., 2016; G. Sun et al., 2016; Blum and Johnson, 2017). In the present study, we report the analytical uncertainties (2σ) of TGM isotopic compositions as the 2σ values of the sample replicates when they are higher than the 2σ values of standard addition of NIST 3133 Hg to CLC traps. When the 2σ values of the sample replicates were lower than the standard additions of NIST 3133 Hg to CLC traps, 2σ values of the standard additions of NIST 3133 Hg to CLC traps were used to represent the 2σ of TGM isotopic compositions.
2.5 Ancillary parameters and statistical methods
Data for concentrations of ozone (O3) and carbon monoxide (CO) during the sampling periods were extracted from national air quality monitoring stations (http://106.37.208.233:20035/, last access: 8 February 2020) located within 1.5 km of the sites, with the exception of the sampling site in Guangzhou (4.1 km). Normalized difference vegetation index (NDVI) around the sampling sites (1∘ × 1∘) was obtained from the NASA Earth Observations (NEO, https://neo.sci.gsfc.nasa.gov/, last access: 30 March 2020).
In order to investigate the effect of soil emissions on the variations in TGM concentrations and isotopic compositions, GEM exchange flux between soil and atmosphere at 1∘ × 1∘ resolution at each sampling site in July and January were extracted from the gridded land surface emission inventory in China simulated for 2013, which has a spatial resolution of ∼36 km and a monthly temporal resolution (Fig. S1 in the Supplement) (Wang et al., 2016). This model established a new scheme for estimating soil–atmosphere GEM flux, which has taken into account the effect of photochemical and nonphotochemical reduction of Hg(II) in soil, diffusion of Hg0 from soil to atmosphere as well as the temperature, moisture, organic matter contents, PH, Hg concentration, bulk density and land cover of soils, etc. (for more detail see Wang et al., 2016). Note that the simulated surface emission inventory does not include GEM emissions from pavement, building surfaces and indoor Hg-containing products. These sources are in close proximity to the sampling sites (Fig. S2 in the Supplement), and their effect is also interpreted in Sect. 3.4.
Daily isotopic compositions of GEM emitted from hillslope barren soil in Guiyang (114.269∘ E, 30.488∘ N) and from agricultural soil in Wuhan (114.269∘ E, 30.488∘ N) from 29 July to 3 August 2019 and from 24 to 27 August 2019, respectively, obtained by measuring the GEM isotopic compositions at the inlet and outlet of a dynamic flux chamber, was followed by a calculation based on the binary mixing model (Eqs. 4 and 5):
where xxx corresponds to the mass number of Hg isotopes (199, 200, 201, 202 (not for the MIF signature) and 204), δxxxGEMoutlet and ΔxxxGEMoutlet are the MDF and MIF values of GEM at the outlet, respectively, δxxxGEMinlet and ΔxxxGEMinlet are the MDF and MIF values of GEM at the inlet, respectively, and GEMoutlet and GEMinlet are the GEM concentrations measured at the outlet and inlet, respectively.
Linear regression analysis was performed with IBM SPSS Statistics using the forced entry method.
3.1 TGM concentrations
Mean TGM concentrations at the urban sites during the study periods ranged from 2.34 to 4.56 ng m−3 (n=10) with a mean (±1σ) of 3.08 ± 0.79 ng m−3 (Fig. 1). These values were 1.5 to 3.0 times higher than the mean background value of 1.51 ng m−3 in 2014 in the Northern Hemisphere obtained from the Global Mercury Observation System (GMOS) (Sprovieri et al., 2016) and 1.2 to 2.4 times higher than the mean value of 1.94 ± 0.64 (±1σ) ng m−3 at urban sites in North America and Europe (Mao et al., 2016). Mean TGM concentrations observed at some urban sites were, however, 44 %–55 % lower than previously reported mean values for earlier years, e.g., 4.19 ng m−3 in Shanghai in 2014, 8.88 ng m−3 in Guiyang in 2010 and 4.60 ng m−3 in Guangzhou in 2011 (Chen et al., 2013; Fu and Feng, 2015; Duan et al., 2017), likely due to a combination of several factors such as decreased anthropogenic emissions (K. Y. Liu et al., 2019), different sampling locations even inside the same city and different sampling times and durations of the year. The declining TGM concentration (by 40 %) in recent years (2014–2016) has indeed been reported in Chongming Island, Shanghai (Tang et al., 2018), which has been mostly attributed to reduced anthropogenic Hg emissions in China. Such emission reductions would impact more on urban than rural areas in atmospheric TGM (K. Y. Liu et al., 2019).
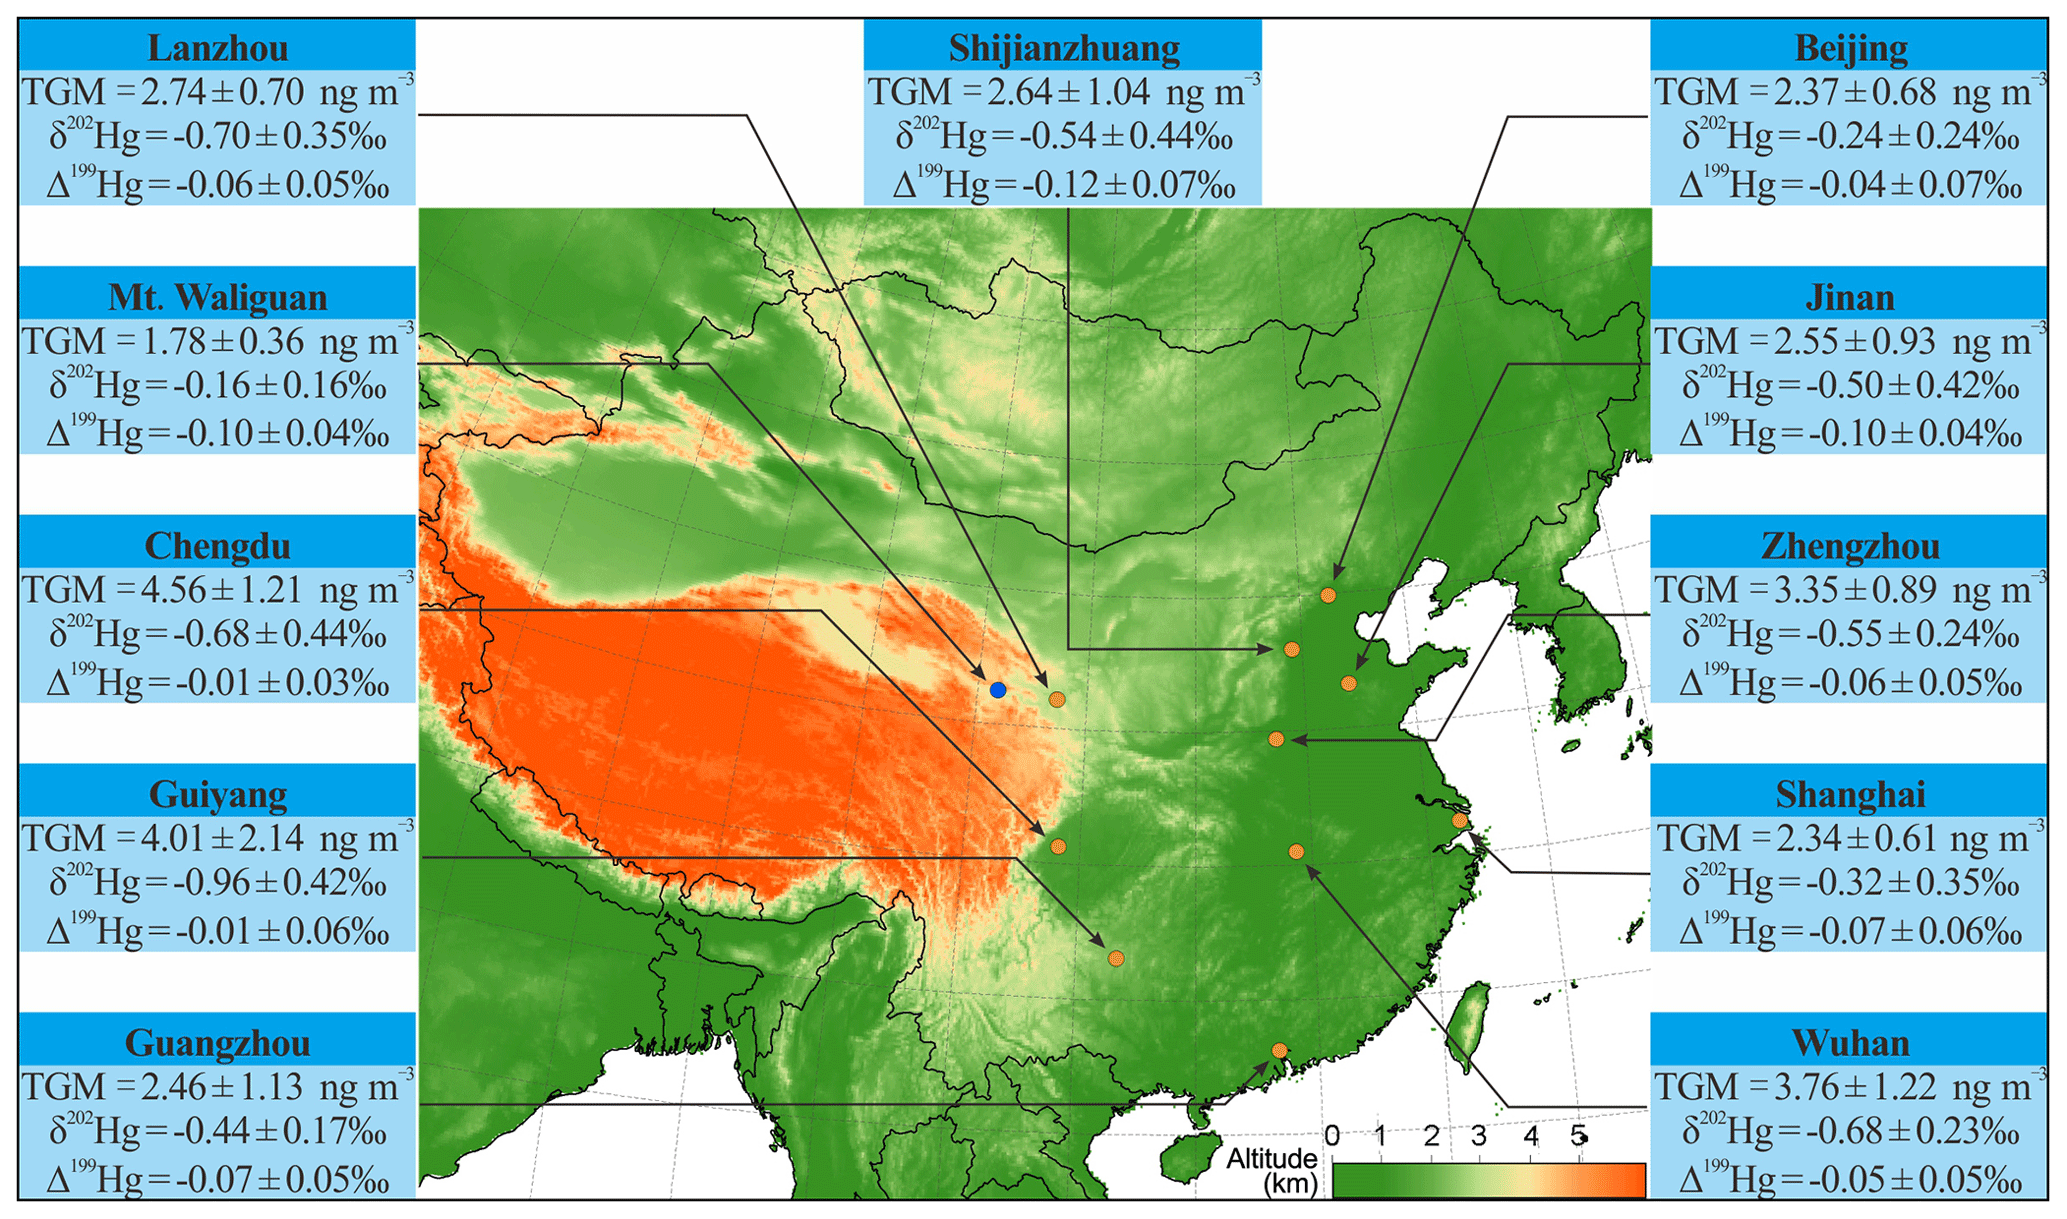
Figure 1TGM mean concentrations (±1σ), δ202Hg (±1σ) and Δ199Hg values (±1σ) at the 10 urban sites (brown circle) and one rural site (blue circle) in China during the whole study period.
3.2 TGM isotopic compositions
Figure 2 shows the isotopic compositions of daily TGM samples collected at the 10 urban sites and one rural site. Large variations in daily TGM isotopic compositions were observed with values ranging from −1.68 ‰ to 0.63 ‰ for δ202Hg and from −0.23 ‰ to 0.10 ‰ for Δ199Hg (Fig. 2 and Table S4 in the Supplement). Mean TGM δ202Hg values were the lowest in Guiyang (−0.96 ± 0.42 ‰, 1σ), Lanzhou (−0.70 ± 0.35 ‰, 1σ) and Chengdu (−0.68 ± 0.44 ‰, 1σ) in southwestern and northwestern China, followed by Wuhan (mean = −0.68 ± 0.23 ‰, 1σ) and Zhengzhou (mean = −0.55 ± 0.24 ‰, 1σ) in central China, Shijiazhuang (−0.54 ± 0.44 ‰, 1σ) and Jinan (−0.50 ± 0.42 ‰, 1σ) in northern China, coastal Guangzhou (−0.44 ± 0.17 ‰, 1σ) in southern China, coastal Shanghai (−0.32 ± 0.35 ‰, 1σ) in eastern China, and was the highest in Beijing (−0.24 ± 0.24 ‰, 1σ) in northern China (Fig. 1 and Table S5 in the Supplement). Much smaller spatial variations were seen in mean TGM Δ199Hg than TGM δ202Hg. The highest mean TGM Δ199Hg were observed in Guiyang (−0.01 ± 0.06 ‰, 1σ) and Chengdu (−0.01 ± 0.03 ‰, 1σ), whereas values at the other urban sites ranged from −0.12 ‰ to −0.04 ‰ (n=8). Mean TGM δ202Hg (−0.16 ± 0.16 ‰, 1σ) (or Δ199Hg = −0.10 ± 0.04 ‰, 1σ) values measured at rural Mt. Waliguan in winter were higher (or lower) than that in most cities in winter, with the exception of δ202Hg in Beijing and Shanghai (means = −0.09 ‰ to -0.07 ‰, n=2) and Δ199Hg in Shijiazhuang, Jinan, and Shanghai (means = −0.17 ‰ to −0.11 ‰, n=3), where TGM concentrations were low (means = 1.88 to 2.12 ng m−3) and comparable to that at rural Mt. Waliguan (Table S5 in the Supplement). Mean TGM Δ200Hg values at the urban sites were all indistinguishable from zero (−0.03 ‰ to 0.02 ‰, n=10; Table S5 in the Supplement), a phenomenon that is similar to previous observations in urban areas in China and the USA (means = −0.01 ‰ to 0.01 ‰ , n=4) (Gratz et al., 2010; Yu et al., 2016; Xu et al., 2017). Therefore, we do not further interpret the MIF of even-mass Hg isotopes in this study.
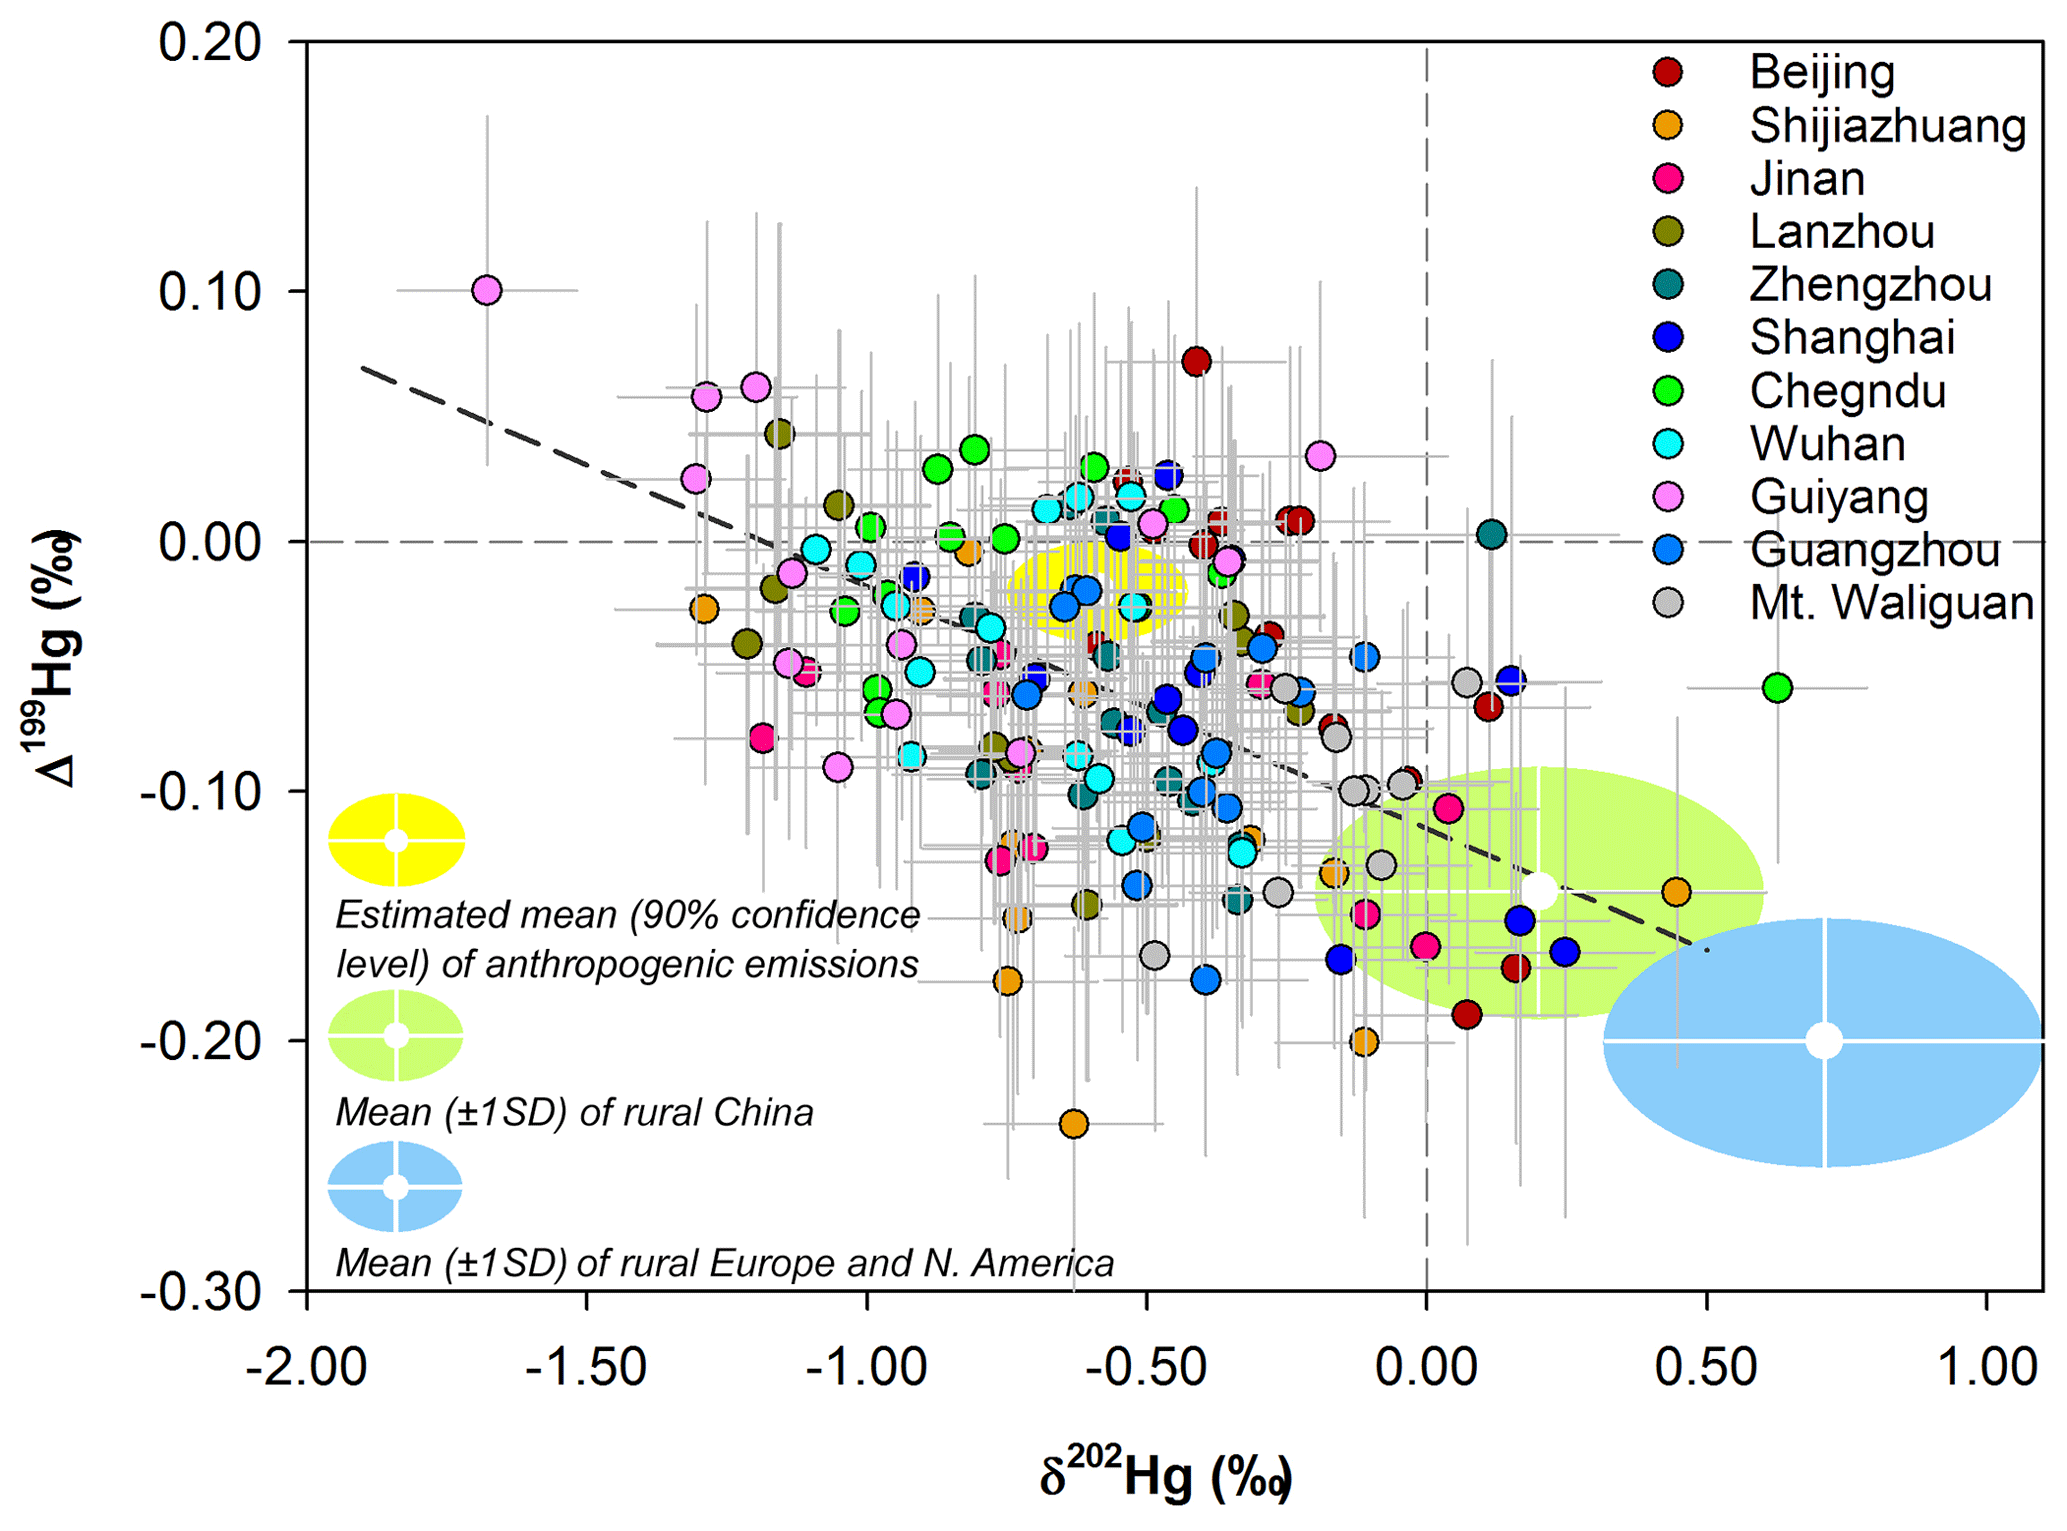
Figure 2Mass-dependent (δ202Hg) and mass-independent (Δ199Hg) signatures of daily TGM samples collected in the present study (circle) with error bars representing 2σ analytical uncertainty. The shaded areas are the literature-based mean (±1σ) δ202Hg and Δ199Hg of TGM or GEM measured in rural areas of China (light green) and Europe and North America (light blue) as well as those estimated for anthropogenic emissions (yellow) (Gratz et al., 2010; Sherman et al., 2010; Demers et al., 2013, 2015; Enrico et al., 2016; Fu et al., 2016; Yu et al., 2016; Obrist et al., 2017; Xu et al., 2017; Fu et al., 2018, 2019; Jiskra et al., 2019a, b). The dotted line represents the linear regression between TGM δ202Hg and Δ199Hg measured in the present study (ANOVA, R2=0.38, p<0.01).
Mean values of TGM δ202Hg and Δ199Hg in this study were similar to those reported at urban sites in China in previous studies, e.g., negative δ202Hg (means = −0.73 ‰ to −0.08 ‰, n=3) and close to zero Δ199Hg (means = −0.03 ‰ to 0.04 ‰, n=3) in Beijing, Xi'an and Guiyang (Yu et al., 2016; Xu et al., 2017). On the other hand, mean TGM δ202Hg values in this study were 0.44 ‰ to 1.60 ‰ lower than the values reported for rural areas of China (mean = 0.20 ± 0.40 ‰, 1σ, n=3) and North America and Europe (mean = 0.71 ± 0.39 ‰, 1σ, n=7), whereas mean TGM Δ199Hg values were 0.02 ‰ to 0.18 ‰ higher than the means in rural areas of China (mean = −0.14 ± 0.05 ‰, 1σ) and North America and Europe (mean = −0.20 ± 0.05 ‰, 1σ) (Fig. 2) (Gratz et al., 2010; Demers et al., 2013, 2015; Enrico et al., 2016; Fu et al., 2016; Obrist et al., 2017; Fu et al., 2018, 2019; Jiskra et al., 2019b). Apparently, atmospheric TGM is isotopically distinguishable between urban and rural sites and between different regions of the world, providing a potentially valuable tracer for understanding the sources and transformations of atmospheric Hg at local, regional and global scales. As shown in Fig. 2, some of the daily TGM isotopic compositions (i.e., δ202Hg and Δ199Hg signatures) fell between the end-member TGM isotopic compositions estimated for anthropogenic TGM emissions and observed from background areas, suggesting mixed influences on TGM isotopic compositions between anthropogenic emissions and background atmospheric pool (Demers et al., 2015; Fu et al., 2016; Xu et al., 2017; Fu et al., 2018). There were, however, many exceptions with daily TGM isotopic compositions outside the abovementioned range, e.g., with δ202Hg lower than −0.75 ‰ or Δ199Hg higher than −0.01 ‰ (Fig. 2). Thus, additional sources and environmental processes should have also contributed to the variations in TGM isotopic compositions in urban environments of China.
3.3 TGM isotopic compositions estimated for urbanized source end-members and measured for soil emissions
Mean TGM concentrations at the urban sites (2.37 to 4.56 ng m−3, n=10) were highly elevated compared to the background value (∼1.5 ng m−3) in the Northern Hemisphere (Sprovieri et al., 2016). This could be attributed to local and regional Hg sources including Hg emissions from primary anthropogenic sources, land surfaces (e.g., soil, building, and pavement) and indoor Hg-containing products. As shown in Fig. 2, TGM isotopic compositions in the cities were probably controlled by a binary physical mixing between the regional-scale background and the key end-member sources in the cities, which could be associated with the local and regional emission sources. Here we use a linearized binary physical mixing diagram to estimate the mean isotopic signature of the urbanized source end-members by extrapolating the 1 TGMmean to zero (where TGM is mostly derived from urbanized sources) (Fig. 3), which showed δ202Hg and Δ199Hg values of approximately −1.16 ± 0.15 ‰ and 0.05 ± 0.02 ‰ (1σ), respectively.
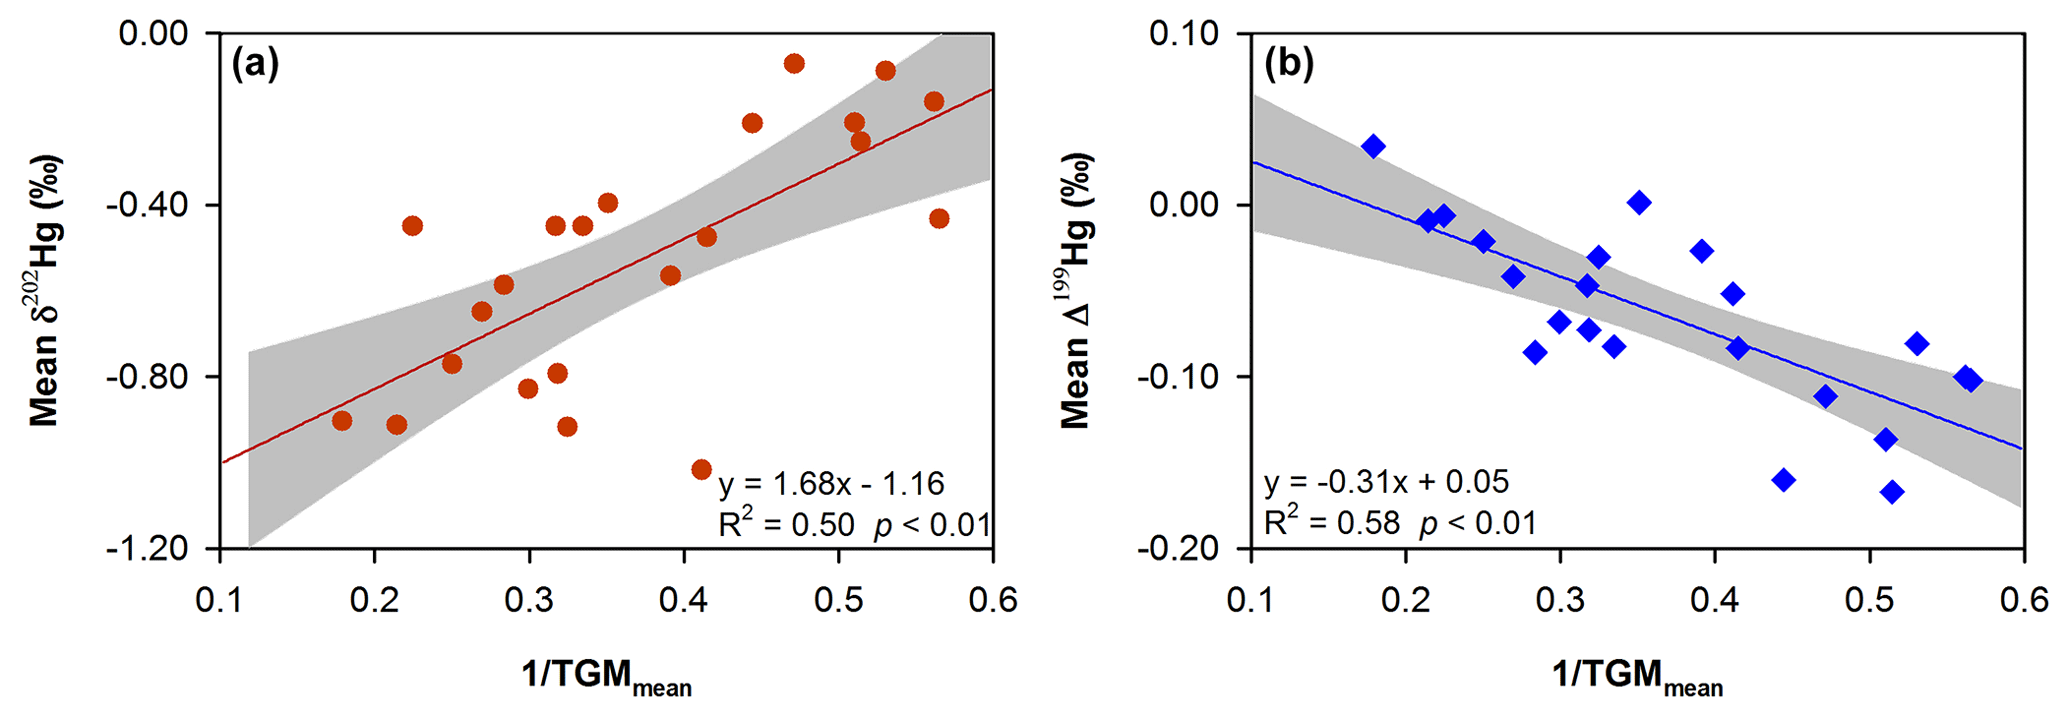
Figure 3(a) Mean δ202Hg versus 1 TGM and (b) mean Δ199Hg versus 1 TGM diagrams suggesting a physical binary mixing between the regional-scale background and urbanized source end-member. Lines represent the linear regression of the data and shaded gray areas are the 95 % confidence area of the regression.
The estimated δ202Hg (or Δ199Hg) for urbanized emissions was much lower (or much higher) than the δ202Hg of −0.26 ‰ (or Δ199Hg of −0.26 ‰) for GEM emitted from CFPPs in China (Tang et al., 2017; H. W. Liu et al., 2019). The isotopic signatures of other anthropogenic emission sectors in China have not been appropriately constrained. R. Y. Sun et al. (2016) estimated a mean δ202Hg of −0.59 ‰ and a mean Δ199Hg of −0.02 ‰ for the global anthropogenic GEM emissions in 2010. Our estimate of δ202Hg and Δ199Hg for the urbanized sources were, however, 0.57 ‰ lower and 0.07 ‰ higher than their predicted value for anthropogenic emissions, respectively. A recent study by Jiskra et al. (2019a) showed highly negative δ202Hg (means = −1.54 ‰ to −1.56 ‰, n=2) and high Δ199Hg values (means = 0.00 ‰ to 0.17 ‰, n=2) for GEM in air impacted by Hg emissions from building surfaces and indoor sources, and these values seemed to support, to some extent, the estimated negative δ202Hg and close to zero Δ199Hg signatures of urbanized sources in the present study.
Soil emissions are a potentially important source of atmospheric TGM in urban areas (Feng et al., 2005; Agnan et al., 2016), and GEM emission fluxes from urban soils were reported to be approximately one order of magnitude higher than that from pavement and building surfaces (Gabriel et al., 2006; Eckley and Branfireun, 2008). The sampling sites in the present study were largely surrounded by cropland and sparsely vegetated soils (Fig. S2 in the Supplement), and it is therefore important to investigate their effects on the variations in TGM concentrations and isotopic compositions. The measured mean GEM emission fluxes from soils in Guiyang and Wuhan in summer were 35.9 ± 32.6 (1σ, n=5) and 9.8 ± 5.3 (1σ, n=3) ng m−2 h−1, respectively. The mean δ202Hg and Δ199Hg values of GEM emitted from soils were −2.16 ± 0.60 ‰ and −0.27 ± 0.15 ‰ (1σ, n=5), respectively, in Guiyang, and were −1.07 ± 0.86 ‰ and −0.01 ± 0.52 ‰ (1σ, n=3), respectively, in Wuhan (Fig. S4 in the Supplement). These values suggest that the isotopic compositions of soil GEM emissions in urban areas of China likely have highly negative δ202Hg values, similar to that of GEM emitted from building surfaces and indoor Hg-containing products (Jiskra et al., 2019a). We thus hypothesize that soil, building surfaces and indoor Hg-containing product emissions contributed to the highly negative TGM δ202Hg values observed in this study. Based on the estimated δ202Hg values of urbanized source end-member (mean = −1.16 ‰), anthropogenic emissions (mean = −0.59 ‰), and GEM emitted from soils, building surfaces and indoor Hg-containing products (mean = −1.57 ‰) in this and previous studies (R. Y. Sun et al., 2016; Jiskra et al., 2019a), we estimate that the contribution of soil, building surfaces and indoor Hg-containing product emissions to the TGM in the 10 cities was approximately equal to that of primary anthropogenic emissions (48 % versus 52 %). We caution that, due to the fact that the isotopic signatures of GEM emitted from many anthropogenic sources and land surfaces in China have not been well constrained, such a preliminary assessment should have large uncertainties. However, our estimate is overall consistent with previous studies on GEM emission fluxes from land surfaces and anthropogenic sources in Chinese urban areas. For example, previous studies on GEM emission fluxes from urban surfaces in China showed a mean value of 83.2 ± 170 ng m−2 h−1 (1σ, n=39) (Fang et al., 2004; Feng et al., 2005; Wang et al., 2006; Fu et al., 2012), which was relatively higher than the mean anthropogenic GEM flux (48.4 ± 48.1 ng m−2 h−1, 1σ, n=10) in the 10 investigated cities (Table S5 in the Supplement) (AMAP/UNEP, 2013). The findings in this and previous studies therefore suggest that soil, building surfaces and indoor Hg-containing product emissions would play an important role in regulating the TGM concentrations and isotopic compositions in urban areas of China, which is further discussed in the following section.
3.4 Effect of surface emissions on seasonal variations in TGM concentrations and isotopic compositions
Strong seasonal variations in the mean TGM concentrations and isotopic compositions were observed for most cities (Fig. 4). The mean TGM concentrations and Δ199Hg values were relatively higher in summer than winter in most cities except for the two (Guiyang and Guangzhou) in the low latitudes that showed an opposite trend. On the contrary, the mean TGM δ202Hg showed lower values in summer than winter in all the cities except southernmost Guangzhou, which showed no seasonal difference. The seasonal variations in TGM concentrations and δ202Hg in the present study were consistent with previous findings generated from year-round continuous observations in China, e.g., higher summertime TGM in Beijing and Shanghai (Zhang et al., 2013; Duan et al., 2017), higher wintertime TGM in Guiyang and Guangzhou (Feng et al., 2004; Chen et al., 2013), and lower summer δ202Hg in Guiyang and Xi'an (Yu et al., 2016; Xu et al., 2017).
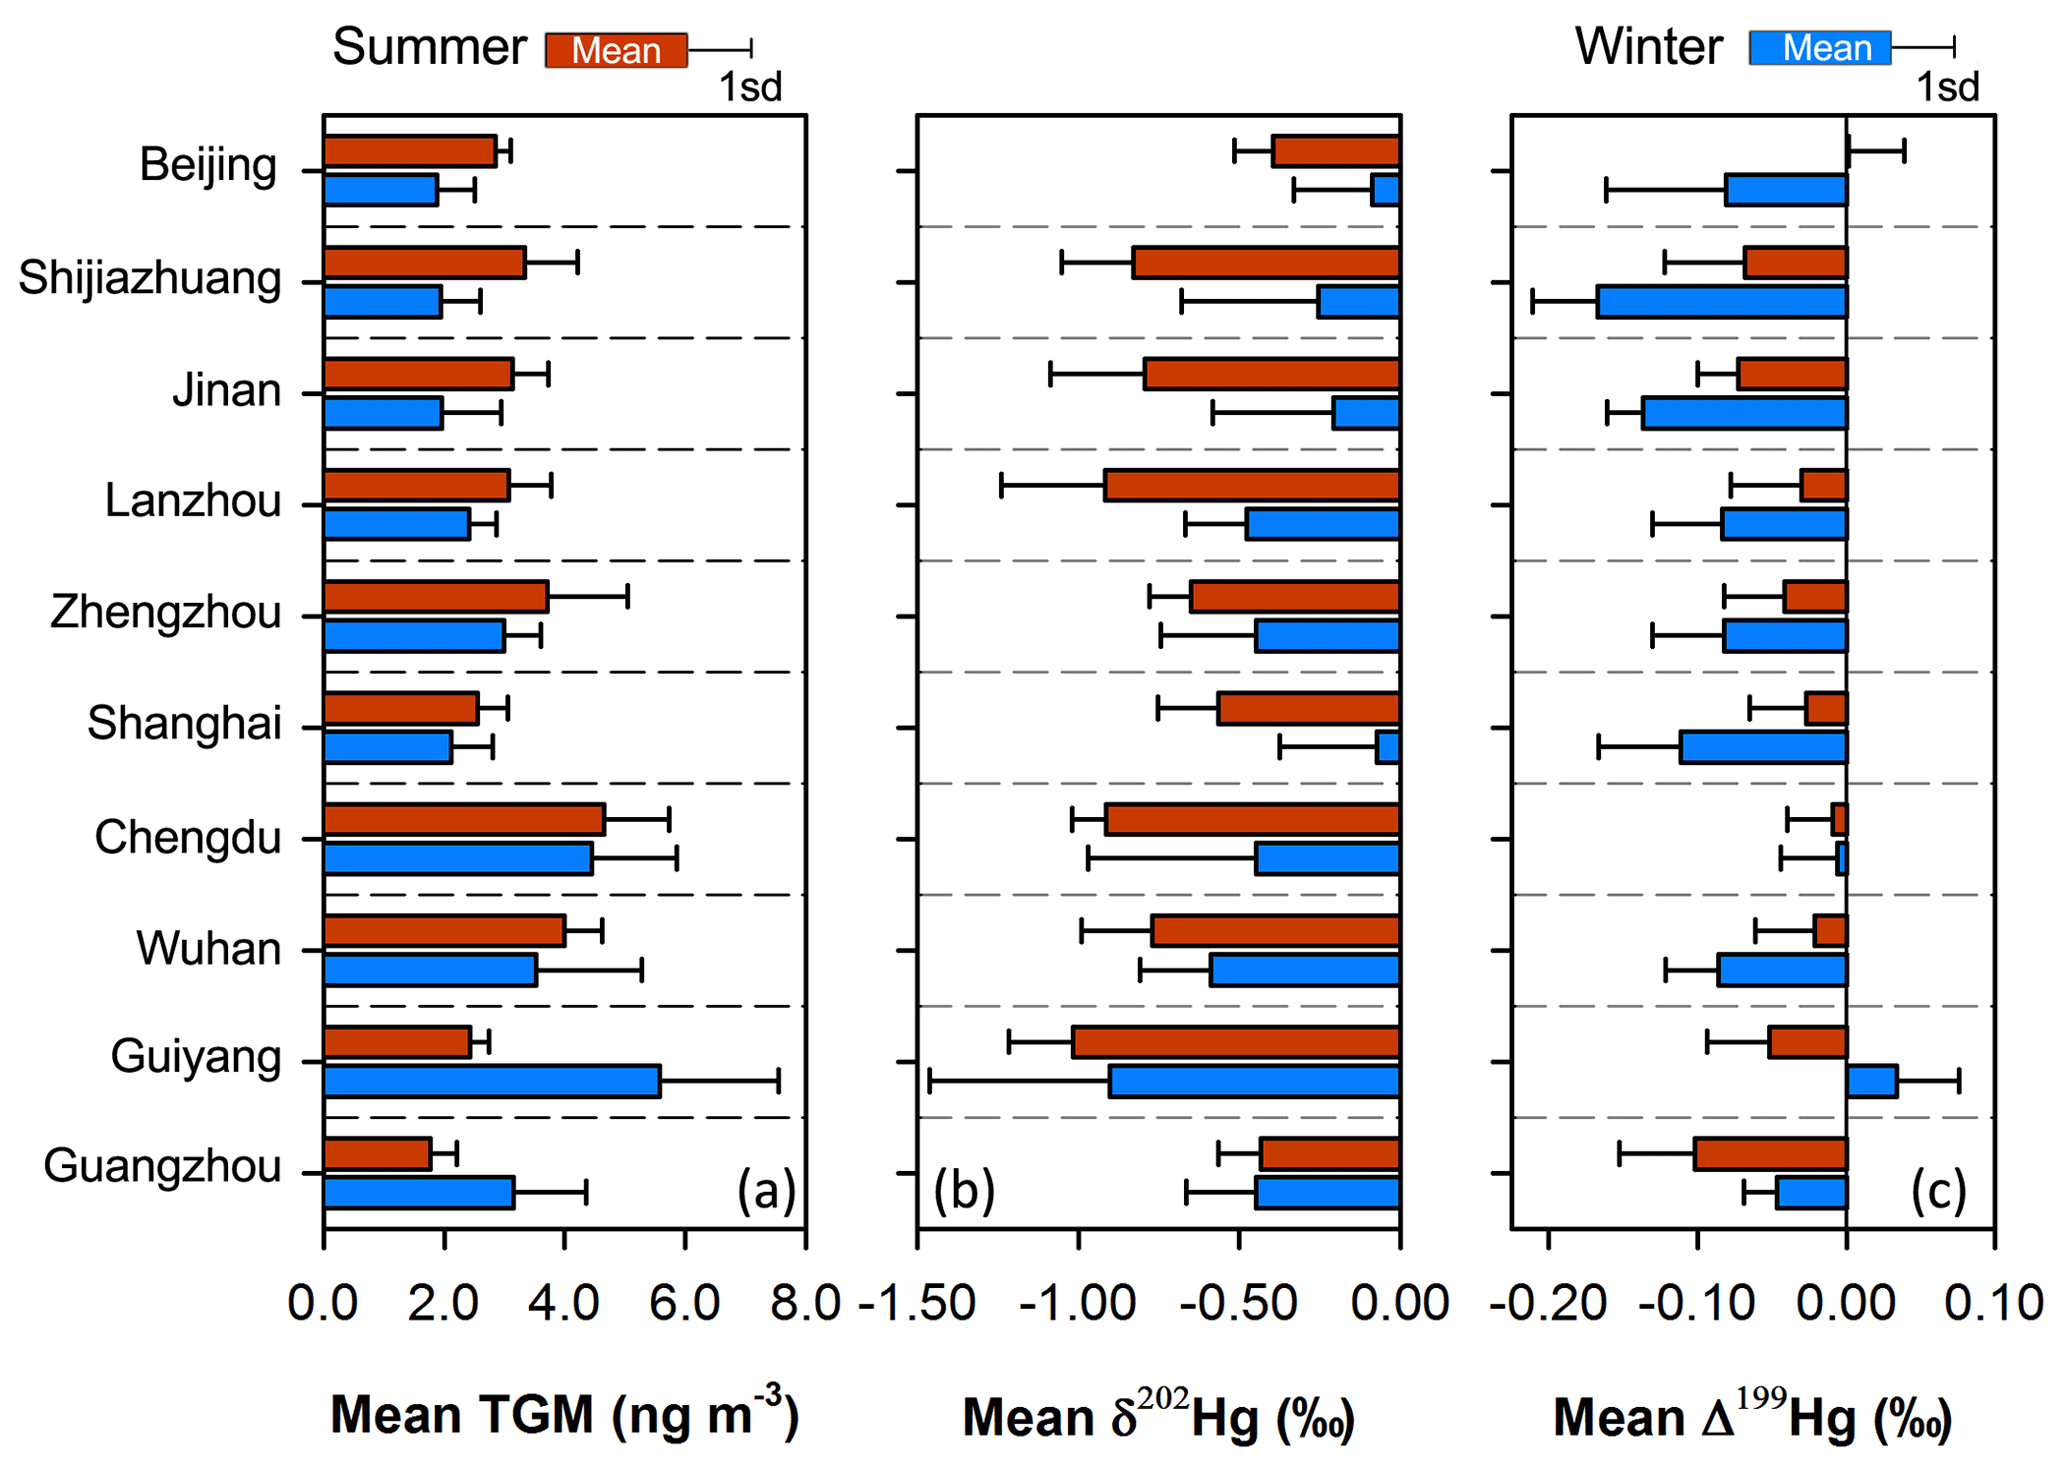
Figure 4Summertime and wintertime means of TGM concentrations (a), TGM δ202Hg (b) and TGM Δ199Hg (c) in the 10 Chinese cities. Error bars represent 1σ.
The summertime higher TGM concentrations observed in most cities in the present study was in contrast to the observations in most rural areas in China as well as in other regions in the Northern Hemisphere, which frequently showed lower TGM or GEM concentrations in summer than in winter (Fu et al., 2015; Mao et al., 2016; Jiskra et al., 2018). Studies on the seasonal variations in TGM or GEM isotopic compositions in rural areas are currently limited. A recent study at rural Mt. Changbai in northeastern China showed higher TGM δ202Hg values in summer than winter (Fu et al., 2019), which is opposite to the seasonal variations in TGM δ202Hg at most urban sites in the present study. Such a summertime lower TGM or GEM level and higher δ202Hg pattern in rural areas should be mainly attributed to increasing atmospheric oxidation and vegetation uptake of GEM as well as decreasing residential coal combustion (Sprovieri et al., 2016; Horowitz et al., 2017; Jiskra et al., 2018; Fu et al., 2019; Sun et al., 2019). The seasonality in atmospheric oxidation chemistry, vegetation activity and residential coal combustion should be similar between urban and rural areas in China, as reflected by the seasonality in O3 (representing atmospheric oxidation chemistry), NDVI (representing vegetation activity) and CO (predominantly (40 %) originating from residential coal combustion) (Jiskra et al., 2018; Zheng et al., 2018), which showed summertime higher O3 concentrations and NDVI and lower CO concentrations at most urban sites (Fig. S5 in the Supplement). Therefore, the contrasting seasonal variations in TGM concentrations and isotopic compositions at most urban sites with respect to rural sites provided evidence that summertime enhanced emissions in these cities probably outbalanced the effect of seasonal variations in atmospheric oxidation chemistry, vegetation activity and residential coal combustion.
Traditionally, local and regional anthropogenic emissions were thought to dominate the TGM or GEM pollution in urban areas of China (Lin et al., 2010). A recent study showed quantitatively comparable coal combustion Hg emissions in China between winter and summer (Gao et al., 2019). Seasonal-resolution Hg emission inventories for other anthropogenic sources (e.g., production of cement, iron, steel, aluminum and non-ferrous metals) in China have not been established. Based on the monthly production data of these source materials, we estimated that there is no strong seasonality in total Hg emissions from these sources (Table S6 in the Supplement). Prevailing wind directions during the wintertime and summertime sampling campaigns were similar in Jinan, Lanzhou, Zhengzhou and Shanghai but were different in the remaining cities (Fig. S6 in the Supplement). Variations in the predominant wind direction would change the relationships between receptor and regional anthropogenic emissions, which could further influence the TGM levels and isotopic compositions in these cities. Given the similarity in wintertime and summertime prevailing wind directions in some cities and consistent summertime lower CO concentrations in most cities, it is postulated that the variations in local anthropogenic emissions and transport of regional anthropogenic emissions were not likely the main cause for the seasonal variations in TGM concentrations and isotopic compositions.
We found that the amplitudes of seasonal variations in TGM concentrations ((TGMsummer–TGMwinter) TGMsummer) and Δ199Hg values (Δ199Hgsummer–Δ199Hgwinter) were both significantly positively correlated with latitude of the cities (ANOVA, R2 were 0.85 and 0.66 for TGM and Δ199Hg, respectively, p<0.01 for both; Fig. 5a and c), whereas the seasonal δ202Hg amplitudes (δ202Hgsummer–δ202Hgwinter) were significantly negatively correlated with latitude (ANOVA, R2=0.46, p<0.01; Fig. 5b). This indicates the seasonality in TGM concentrations and isotopic compositions were likely related to weather- and climate-dependent (e.g., solar radiation and air temperature) sources and/or atmospheric processes.
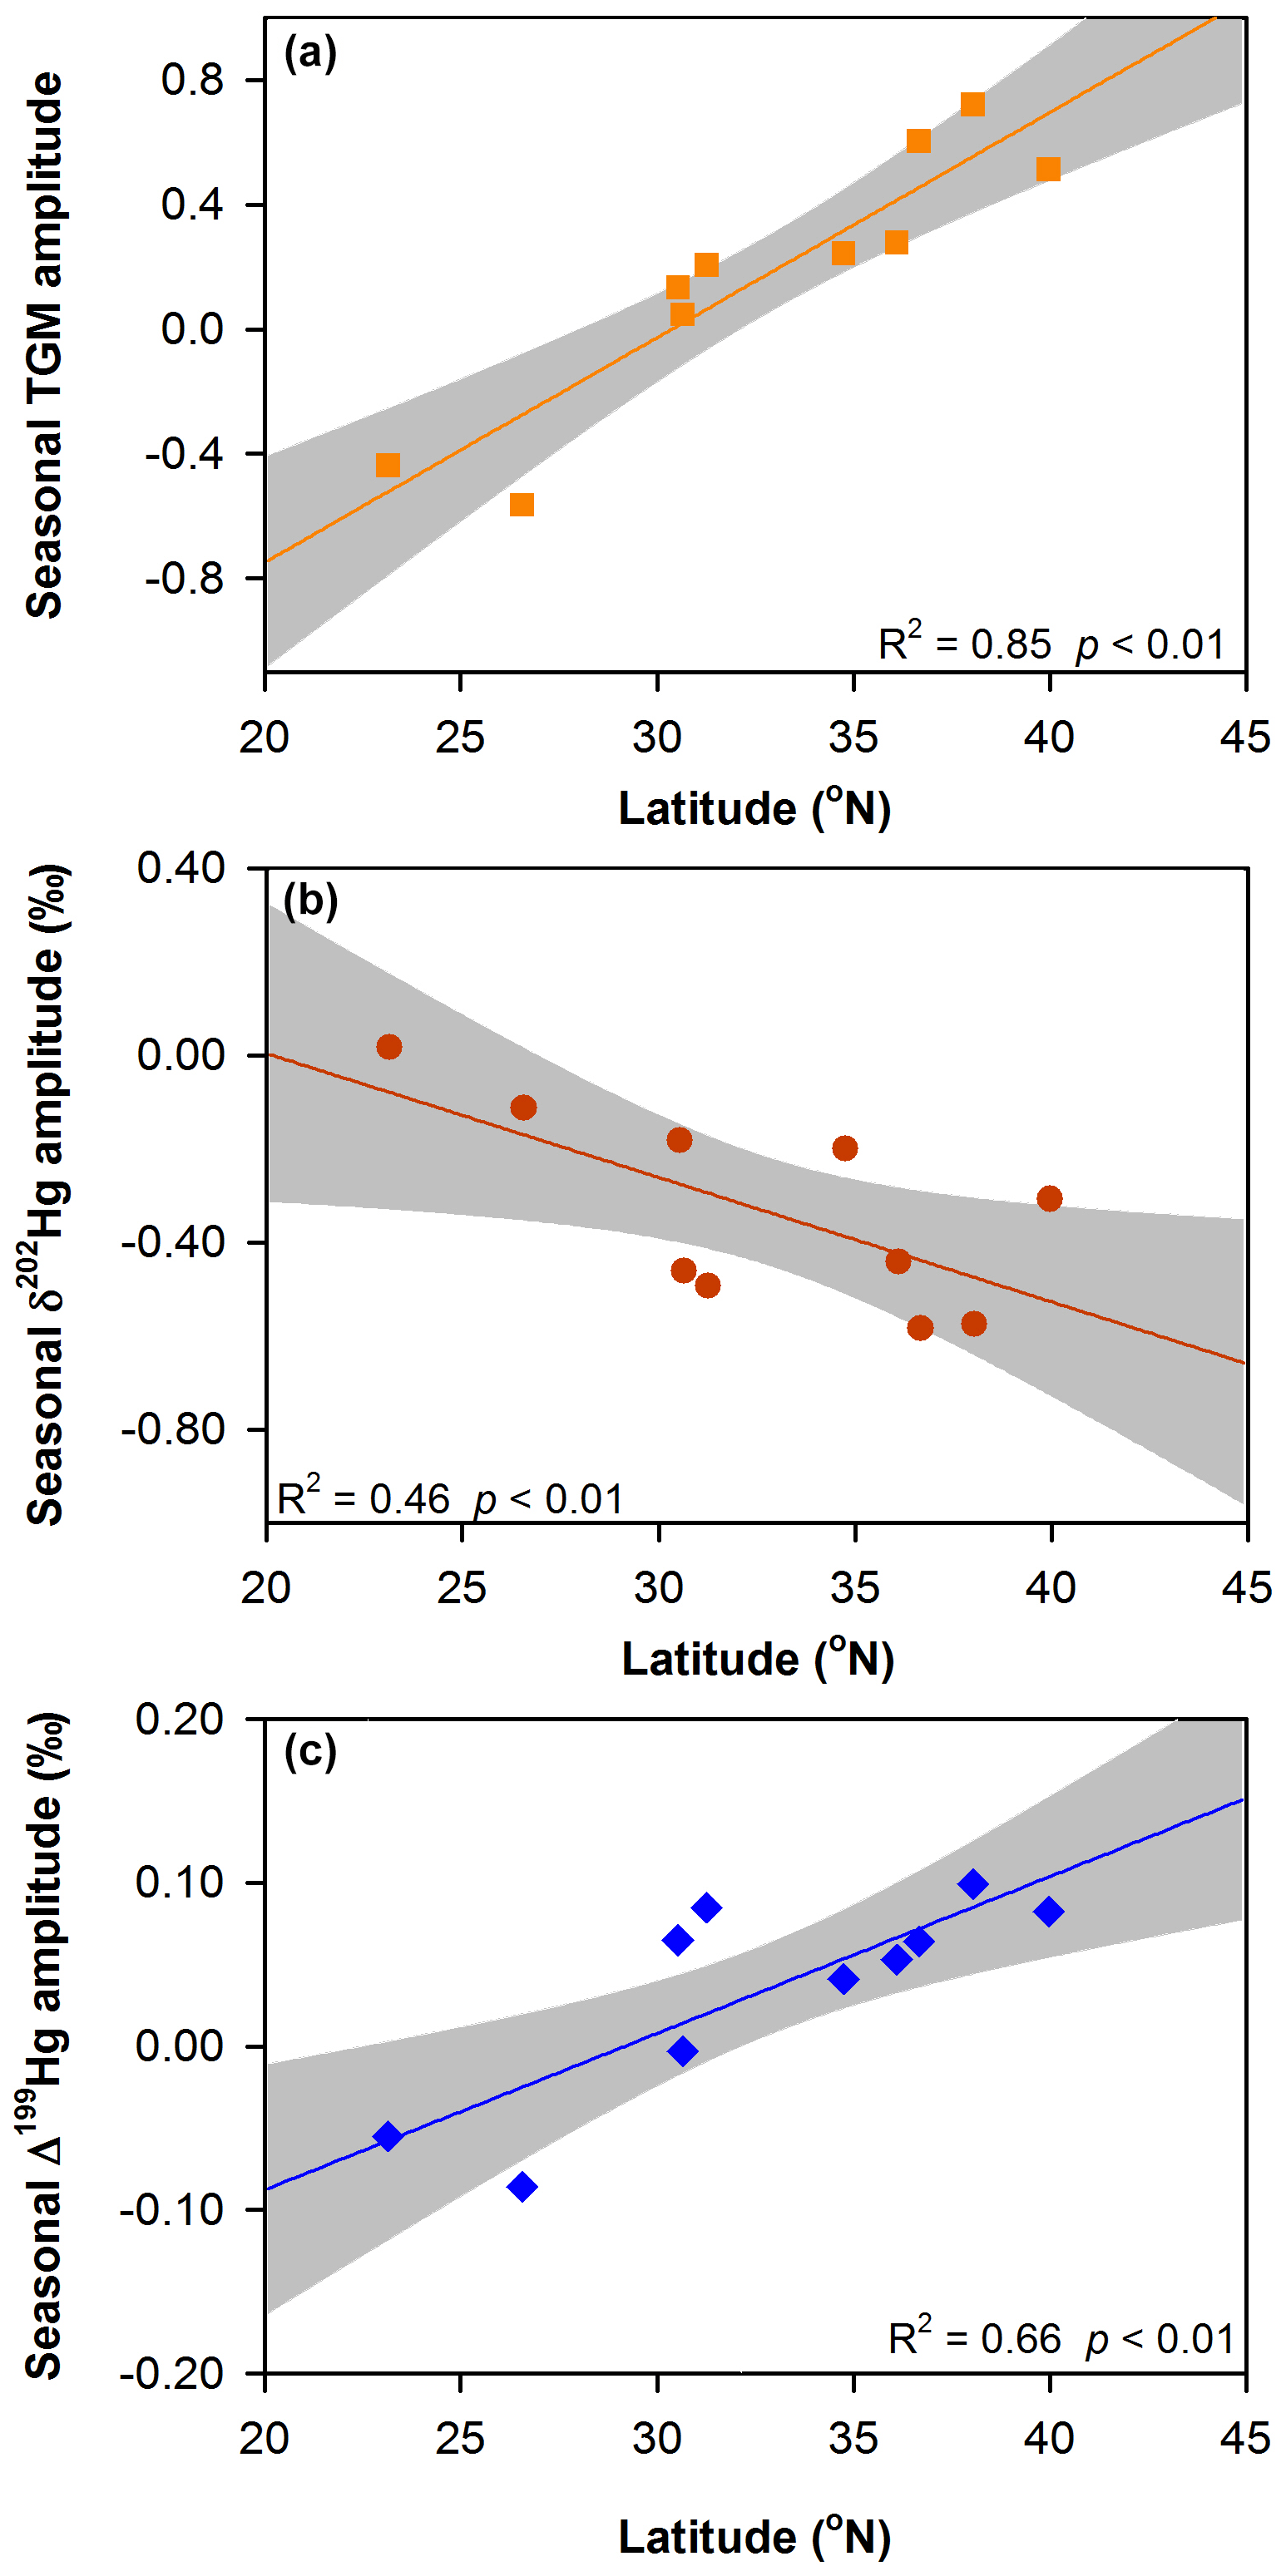
Figure 5Latitude dependence of the seasonal variations in TGM concentrations and isotopic compositions in the 10 Chinese cities. (a) Seasonal amplitude of TGM concentrations ((TGMsummer–TGMwinter) TGMsummer) versus latitude. (b) Seasonal amplitude of δ202Hg values (δ202Hgsummer–δ202Hgwinter) versus latitude. (c) Seasonal amplitude of Δ199Hg values (Δ199Hgsummer–Δ199Hgwinter) versus latitude. Lines represent the linear regression of the data and shaded gray areas are the 95 % confidence area of the regression.
GEM emission fluxes from soil, building surfaces and pavement in urban areas are highly related to solar radiation and temperature and frequently peak in summer in the Northern Hemisphere (Gabriel et al., 2006; Eckley and Branfireun, 2008). Studies on the seasonal variations in GEM emissions from building surfaces and pavement are not available in Chinese urban areas but are expected to be similar to that of soil GEM emission (Gabriel et al., 2006). Therefore, using simulated seasonal soil GEM emission data is generally adequate to interpret the effect of surface GEM emission on the seasonal variations in TGM concentrations and isotopic compositions. As shown in Fig. 6a, a significant positive correlation was observed between the seasonal amplitudes of TGM concentration and simulated soil GEM emission flux ((fluxJuly–fluxJanuary) fluxJuly), indicating enhanced surface GEM emission is responsible for the summertime increase of TGM concentrations at most urban sites. Negative seasonal TGM magnitudes were observed in Guiyang and Guangzhou in the low latitudes where there is a small summertime increase of soil GEM emission fluxes (Fig. 6a). We postulate that the effect of surface emission on the seasonal variations in TGM concentrations in Guiyang and Guangzhou was likely outbalanced by other factors, e.g., seasonal variations in atmospheric oxidization chemistry, vegetation activity and residential coal combustion.
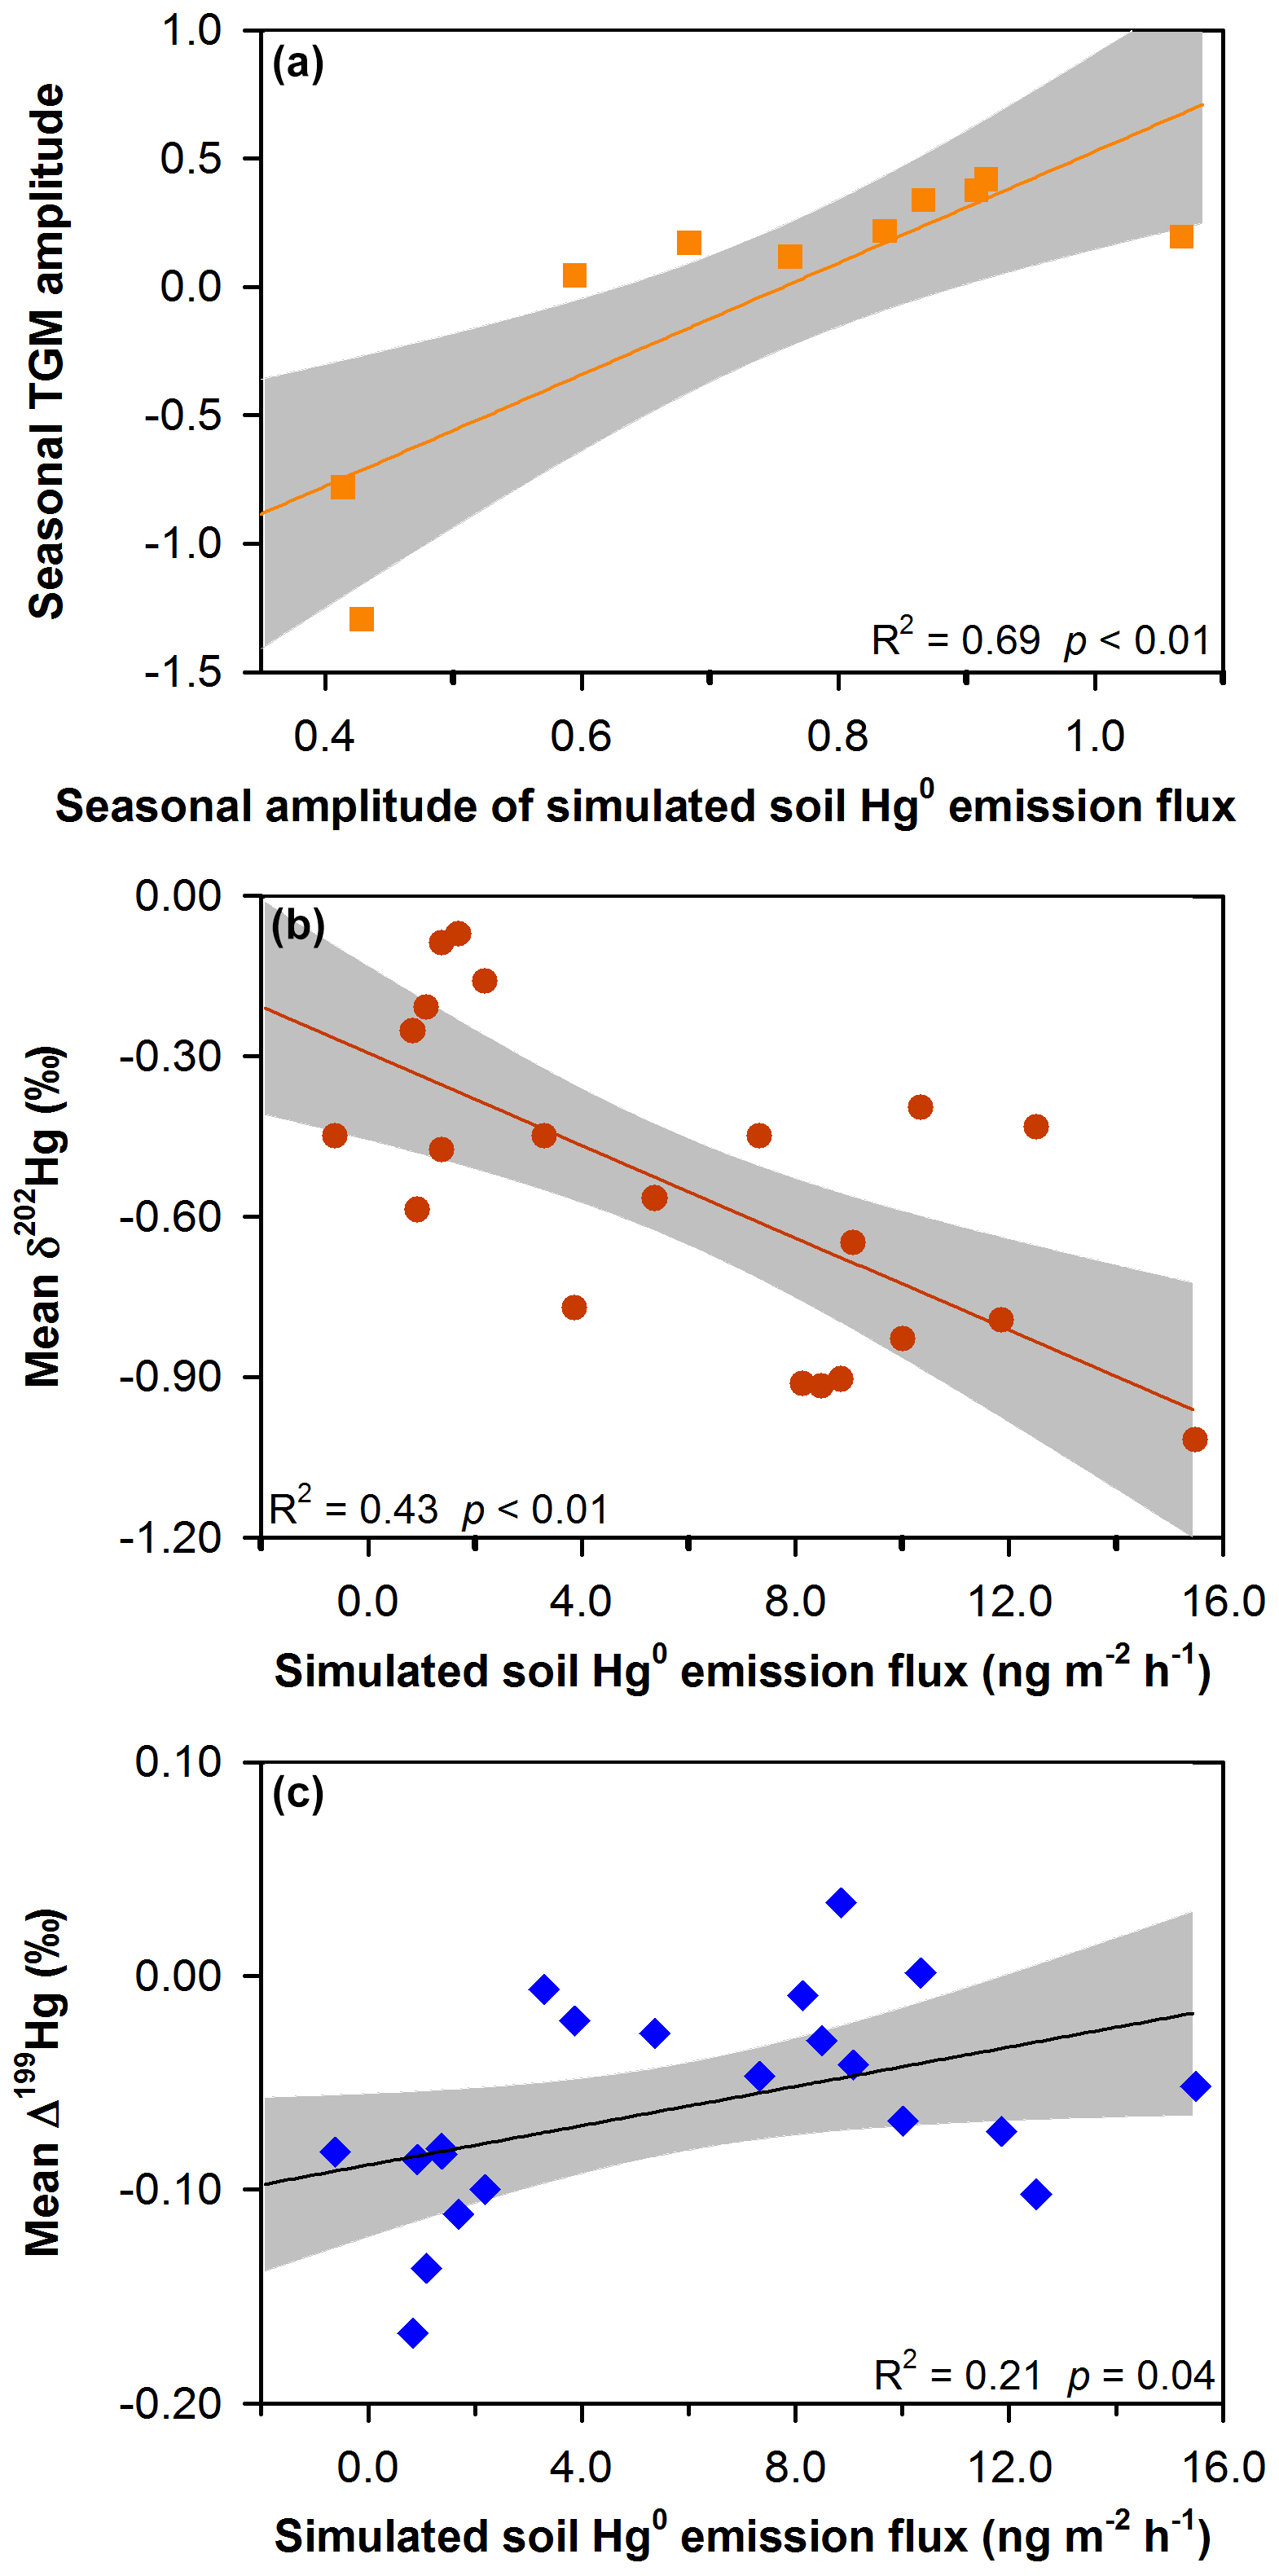
Figure 6Effect of soil Hg0 (GEM) emissions on variations in TGM concentrations and isotopic compositions at the sampling sites in this study. Linear regressions between (a) seasonal TGM amplitude and seasonal amplitude of simulated soil Hg0 emissions flux, (b) mean TGM δ202Hg and simulated soil Hg0 emissions flux, and (c) mean TGM Δ199Hg and simulated soil Hg0 emissions flux. Lines represent the linear regression of the data and shaded gray areas are the 95 % confidence area of the regression. Simulated soil Hg0 emission fluxes are from Wang et al. (2016).
Site-specific mean TGM δ202Hg and Δ199Hg values were calculated for summer and winter sampling campaigns separately and then values at all the sampling sites were correlated with their respective simulated soil GEM emission fluxes. A significant negative correlation was obtained between TGM δ202Hg and simulated soil emission (ANOVA, R2=0.43, p<0.01; Fig. 6b). As mentioned above, the isotopic compositions of GEM emitted from urban surfaces were characterized by highly negative δ202Hg values (mean = −1.57 ‰). Thus, high surface GEM emissions should shift TGM δ202Hg towards negative values. A weak positive correlation was observed between mean TGM Δ199Hg and simulated soil GEM emission fluxes (ANOVA, R2=0.21, p<0.05; Fig. 6b), suggesting that high surface GEM emissions led to a slightly positive shift of TGM Δ199Hg. Seasonal amplitudes of δ202Hg (or Δ199Hg) in the 10 cities were significantly negatively (or positively) correlated with seasonal amplitudes of simulated soil GEM emission flux (ANOVA, R2 of 0.54 or 0.63, p<0.01 for both; Fig. S7 in the Supplement), suggesting the dominant role of surface GEM emissions on the seasonal variations in TGM isotopic compositions.
It should be noted that indoor TGM also have highly negative δ202Hg (−1.56 ‰, n=1) and positive Δ199Hg (0.17 ‰, n=1) values (Jiskra et al., 2019a), but this source is not likely a dominant one contributing to the seasonal variations in TGM isotopic compositions. Indoor TGM concentrations in urban areas can be highly elevated mainly due to evaporation of GEM from Hg-containing products (e.g., spills of liquid mercury in thermometers, fluorescent light and Hg switches) in the absence of sunlight (Carpi and Chen, 2001; Baughman, 2006). This source is expected to yield Δ199Hg Δ201Hg slopes of ∼1.6 in TGM isotopic compositions due to the nuclear volume effect (NVE) (Zheng and Hintelmann, 2010; Ghosh et al., 2013). As shown in Fig. S8 in the Supplement, a York bivariate linear regression between TGM Δ199Hg and Δ201Hg in the studied cites showed a slope of 1.01 ± 0.10 (1σ), which is consistent with that of soil GEM emissions (1.09 ± 0.06, 1σ; Fig. S7 in the Supplement) and that of photoreduction of Hg(II) to GEM (∼1.0) (Blum et al., 2014) but much lower than that predicted for indoor GEM sources, suggesting that seasonal variations in TGM isotopic compositions were unlikely dominated by indoor emission sources.
Hence, we can conclude that the seasonal variations in TGM concentrations and isotopic compositions in the 10 cities were likely controlled by surface emission sources. However, it is currently difficult to determine which of the surface emission sources (e.g., soil, pavement or building surfaces) was more important. As discussed earlier, GEM emitted from these sources were characterized by similar isotopic signatures and are difficult to distinguish. GEM emissions flux data from pavement and building surfaces in Chinese urban areas are very limited. A previous study in Toronto, Canada, and Austin, USA, reported that GEM emission fluxes from soils were on average 8 times higher than those from pavement and building surfaces (Eckley and Branfireun, 2008). This, together with the large fraction of cropland and sparsely vegetated soil area in the total urban land area (mean = 57 %; Table S1 in the Supplement), indicates soil emissions were likely more important than building surface and pavement emissions at a regional scale (e.g., the size of 1∘ × 1∘ surrounding the sampling sites). However, given that building surfaces and pavement emissions sources were in close proximity to the sampling sites (Fig. S2 in the Supplement), their contributions to atmospheric TGM budget may exceed those of soil emission sources locally. Therefore, further studies and approaches are needed to better constrain the contributions of local and regional land surface emissions to TGM variations at specific sites.
TGM concentrations in Chinese urban areas were generally highly elevated, which was traditionally thought to be mainly attributed to primary anthropogenic emissions (Lin et al., 2010; Fu et al., 2015). Due to the implementation of aggressive air pollution control measures in China since 2014, primary anthropogenic Hg emissions within or surrounding many Chinese cities are expected to have been reduced noticeably in recent years (K. Y. Liu et al., 2019). Land surface Hg emissions are also an important source of atmospheric Hg (Selin et al., 2007; Holmes et al., 2010; Pirrone et al., 2010; Agnan et al., 2016). Therefore, questions have emerged as to whether land surface emissions become important in the variations in TGM concentrations and isotopic compositions in Chinese urban areas. The present study suggests that surface GEM emissions likely dominated the seasonal variations in TGM concentrations and isotopic compositions in most cities. GEM emissions from land surface are generally higher in summer and characterized by significantly negative δ202Hg signatures, and therefore are able to cause increasing TGM concentrations and a negative shift of TGM δ202Hg in summer in Chinese cities. Therefore, we suggest that land surface emissions should be incorporated in future studies to interpret the cycling (or fractionation) of TGM (or TGM isotopes) in urban areas and/or other regions with strong land surface GEM emissions.
China has been regarded as the world's strongest source region of anthropogenic Hg emissions. Since the Chinese economic reform in 1978, more than 13 000 Mg of Hg have been released into the atmosphere from anthropogenic sources (Wu et al., 2016). Large fractions (35 % to 49 %) of these emitted Hg were in the form of short-lived particulate bound and oxidized Hg and would have deposited quickly to areas close to sources such as urbanized and industrial areas, which should have increased Hg content in land surface substrates. The combined effects of global warming and increased substrate Hg content would induce increasing surface emissions, blunting the benefits of anthropogenic Hg emission control in China. Therefore, future studies should be conducted in systematically assessing the negative effects of increasing soil Hg emissions in a changing environment (anthropogenic emissions and climate and land use change) during the implementation of the Minamata Convention. Possible strategies should also be considered to mitigate surface Hg emissions and, together with effective controls of anthropogenic emissions, to eventually reduce the threats of Hg to human health and the environment.
All the datasets used in this study can be found in the Supplement.
The supplement related to this article is available online at: https://doi.org/10.5194/acp-21-6721-2021-supplement.
XuF, GZ, JL, HG and XiF initiated the project and designated the field experiments. XuF, CL, HZ, YX, HZ and XL carried out the field sampling. CL and HZ performed the laboratory analysis. XuF prepared the manuscript with contributions from all co-authors.
The authors declare that they have no conflict of interest.
This work was funded by the National Key R&D Program of China (2017YFC0212001), the Chinese Academy of Sciences (ZDBS-LY-DQC029 and 2017443), the National Nature Science Foundation of China (41622305) and the K. C. Wong Education Foundation. We also thank Guangcai Zhong, Shuhao Dong, Baoxin Li, Shizhen Zhao, Bolun Zhang, Jiao Tang, Hongxing Jiang, Buqing Xu, Yu Wang, Dawen Yao, Fengwen Huang, Kun Nie, Lingxi Zhan, Jiaying Wang, Liuyuan Zhao and Zhanxiang Wang who have contributed to the sampling of TGM. We thank the two anonymous reviewers for their thoughtful suggestions.
This research has been supported by the National Key R and D Program of China (grant no. 2017YFC0212001), the Chinese Academy of Sciences (grant no. ZDBS-LY-DQC029 and 2017443), the National Nature Science Foundation of China (grant no. 41622305) and the K. C. Wong Education Foundation.
This paper was edited by Ashu Dastoor and reviewed by two anonymous referees.
Agnan, Y., Le Dantec, T., Moore, C. W., Edwards, G. C., and Obrist, D.: New Constraints on Terrestrial Surface Atmosphere Fluxes of Gaseous Elemental Mercury Using a Global Database, Environ. Sci. Technol., 50, 507–524, https://doi.org/10.1021/acs.est.5b04013, 2016.
AMAP/UNEP: Geospatially distributed mercury emissions dataset 2010v1, available at: https://www.amap.no/mercury-emissions/datasets (last access: 25 April 2021), 2013.
Baughman, T. A.: Elemental mercury spills, Environ. Health Persp., 114, 147–152, https://doi.org/10.1289/ehp.7048, 2006.
Biswas, A., Blum, J. D., Bergquist, B. A., Keeler, G. J., and Xie, Z. Q.: Natural mercury isotope variation in coal deposits and organic soils, Environ. Sci. Technol., 42, 8303–8309, https://doi.org/10.1021/Es801444b, 2008.
Blum, J. D. and Bergquist, B. A.: Reporting of variations in the natural isotopic composition of mercury, Anal. Bioanal. Chem., 388, 353–359, https://doi.org/10.1007/s00216-007-1236-9, 2007.
Blum, J. D. and Johnson, M. W.: Recent Developments in Mercury Stable Isotope Analysis, Rev. Mineral. Geochem., 82, 733–757, 2017.
Blum, J. D., Sherman, L. S., and Johnson, M. W.: Mercury isotopes in earth and environmental sciences, Annu. Rev. Earth Pl. Sc., 42, 249–269, https://doi.org/10.1146/annurev-earth-050212-124107, 2014.
Carpi, A. and Chen, Y.-f.: Gaseous Elemental Mercury as an Indoor Air Pollutant, Environ. Sci. Technol., 35, 4170–4173, https://doi.org/10.1021/es010749p, 2001.
Carpi, A. and Chen, Y.-f.: Gaseous elemental mercury fluxes in New York City, Water Air Soil Poll., 140, 371–379, https://doi.org/10.1023/A:1020198025725, 2002.
Chen, L. G., Liu, M., Xu, Z. C., Fan, R. F., Tao, J., Chen, D. H., Zhang, D. Q., Xie, D. H., and Sun, J. R.: Variation trends and influencing factors of total gaseous mercury in the Pearl River Delta – A highly industrialised region in South China influenced by seasonal monsoons, Atmos. Environ., 77, 757–766, https://doi.org/10.1016/j.atmosenv.2013.05.053, 2013.
Demers, J. D., Blum, J. D., and Zak, D. R.: Mercury isotopes in a forested ecosystem: Implications for air-surface exchange dynamics and the global mercury cycle, Global Biogeochem. Cy., 27, 222–238, https://doi.org/10.1002/Gbc.20021, 2013.
Demers, J. D., Sherman, L. S., Blum, J. D., Marsik, F. J., and Dvonch, J. T.: Coupling atmospheric mercury isotope ratios and meteorology to identify sources of mercury impacting a coastal urban-industrial region near Pensacola, Florida, USA, Global Biogeochem. Cy., 29, 1689–1705, 2015.
Duan, L., Wang, X. H., Wang, D. F., Duan, Y. S., Cheng, N., and Xiu, G. L.: Atmospheric mercury speciation in Shanghai, China, Sci. Total Environ., 578, 460–468, 2017.
Eckley, C. S. and Branfireun, B.: Gaseous mercury emissions from urban surfaces: Controls and spatiotemporal trends, Appl. Geochem., 23, 369–383, https://doi.org/10.1016/j.apgeochem.2007.12.008, 2008.
Enrico, M., Le Roux, G., Marusczak, N., Heimburger, L. E., Claustres, A., Fu, X. W., Sun, R. Y., and Sonke, J. E.: Atmospheric Mercury Transfer to Peat Bogs Dominated by Gaseous Elemental Mercury Dry Deposition, Environ. Sci. Technol., 50, 2405–2412, https://doi.org/10.1021/acs.est.5b06058, 2016.
Fang, F. M., Wang, Q. C., and Li, J. F.: Urban environmental mercury in Changchun, a metropolitan city in Northeastern China: source, cycle, and fate, Sci. Total Environ., 330, 159–170, https://doi.org/10.1016/j.scitotenv.2004.04.006, 2004.
Feng, X. B., Shang, L. H., Wang, S. F., Tang, S. L., and Zheng, W.: Temporal variation of total gaseous mercury in the air of Guiyang, China, J. Geophys. Res.-Atmos., 109, D03303, https://doi.org/10.1029/2003jd004159, 2004.
Feng, X. B., Wang, S. F., Qiu, G. A., Hou, Y. M., and Tang, S. L.: Total gaseous mercury emissions from soil in Guiyang, Guizhou, China, J. Geophys. Res.-Atmos., 110, D14306, https://doi.org/10.1029/2004jd005643, 2005.
Fu, X., Yang, X., Tan, Q., Ming, L., Lin, T., Lin, C.-J., Li, X., and Feng, X.: Isotopic Composition of Gaseous Elemental Mercury in the Marine Boundary Layer of East China Sea, J. Geophys. Res.-Atmos., 123, 7656–7669, https://doi.org/10.1029/2018JD028671, 2018.
Fu, X., Zhang, H., Liu, C., Zhang, H., Lin, C.-J., and Feng, X.: Significant Seasonal Variations in Isotopic Composition of Atmospheric Total Gaseous Mercury at Forest Sites in China Caused by Vegetation and Mercury Sources, Environ. Sci. Technol., 53, 13748–13756, https://doi.org/10.1021/acs.est.9b05016, 2019.
Fu, X. W., and Feng, X. B.: Variations of atmospheric total gaseous mercury concentrations for the sampling campaigns of 2001/2002 and 2009/2010 and implications of changes in regional emissions of atmospheric mercury, Bull. Miner. Petr. Geochem., 34, 242–249, 2015 (in Chinese).
Fu, X. W., Feng, X. B., Qiu, G. L., Shang, L. H., and Zhang, H.: Speciated atmospheric mercury and its potential source in Guiyang, China, Atmos. Environ., 45, 4205–4212, https://doi.org/10.1016/j.atmosenv.2011.05.012, 2011.
Fu, X. W., Feng, X. B., Zhang, H., Yu, B., and Chen, L. G.: Mercury emissions from natural surfaces highly impacted by human activities in Guangzhou province, South China, Atmos. Environ., 54, 185–193, https://doi.org/10.1016/j.atmosenv.2012.02.008, 2012.
Fu, X. W., Heimburger, L. E., and Sonke, J. E.: Collection of atmospheric gaseous mercury for stable isotope analysis using iodine- and chlorine-impregnated activated carbon traps, J. Anal. Atom. Spectrom., 29, 841–852, https://doi.org/10.1039/C3ja50356a, 2014.
Fu, X. W., Zhang, H., Yu, B., Wang, X., Lin, C.-J., and Feng, X. B.: Observations of atmospheric mercury in China: a critical review, Atmos. Chem. Phys., 15, 9455–9476, https://doi.org/10.5194/acp-15-9455-2015, 2015.
Fu, X. W., Marusczak, N., Wang, X., Gheusi, F., and Sonke, J. E.: Isotopic Composition of Gaseous Elemental Mercury in the Free Troposphere of the Pic du Midi Observatory, France, Environ. Sci. Technol., 50, 5641–5650, https://doi.org/10.1021/acs.est.6b00033, 2016.
Gabriel, M. C., Williamson, D. G., Zhang, H., Brooks, S., and Lindberg, S.: Diurnal and seasonal trends in total gaseous mercury flux from three urban ground surfaces, Atmos. Environ., 40, 4269–4284, https://doi.org/10.1016/j.atmosenv.2006.04.004, 2006.
Gao, W. D., Jiang, W., and Zhou, M. M.: The spatial and temporal characteristics of mercury emission from coal combustion in China during the year 2015, Atmos. Pollut. Res., 10, 776–783, https://doi.org/10.1016/j.apr.2018.12.005, 2019.
Ghosh, S., Schauble, E. A., Couloume, G. L., Blum, J. D., and Bergquist, B. A.: Estimation of nuclear volume dependent fractionation of mercury isotopes in equilibrium liquid-vapor evaporation experiments, Chem. Geol., 336, 5–12, 2013.
Gratz, L. E., Keeler, G. J., Blum, J. D., and Sherman, L. S.: Isotopic composition and fractionation of mercury in Great Lakes precipitation and ambient air, Environ. Sci. Technol., 44, 7764–7770, https://doi.org/10.1021/Es100383w, 2010.
Gustin, M. S., Amos, H. M., Huang, J., Miller, M. B., and Heidecorn, K.: Measuring and modeling mercury in the atmosphere: a critical review, Atmos. Chem. Phys., 15, 5697–5713, https://doi.org/10.5194/acp-15-5697-2015, 2015.
Gustin, M. S., Dunham-Cheatham, S. M., and Zhang, L.: Comparison of 4 Methods for Measurement of Reactive, Gaseous Oxidized, and Particulate Bound Mercury, Environ. Sci. Technol., 53, 14489–14495, https://doi.org/10.1021/acs.est.9b04648, 2019.
Holmes, C. D., Jacob, D. J., Corbitt, E. S., Mao, J., Yang, X., Talbot, R., and Slemr, F.: Global atmospheric model for mercury including oxidation by bromine atoms, Atmos. Chem. Phys., 10, 12037–12057, https://doi.org/10.5194/acp-10-12037-2010, 2010.
Horowitz, H. M., Jacob, D. J., Zhang, Y., Dibble, T. S., Slemr, F., Amos, H. M., Schmidt, J. A., Corbitt, E. S., Marais, E. A., and Sunderland, E. M.: A new mechanism for atmospheric mercury redox chemistry: implications for the global mercury budget, Atmos. Chem. Phys., 17, 6353–6371, https://doi.org/10.5194/acp-17-6353-2017, 2017.
Huang, J. Y., Miller, M. B., Weiss-Penzias, P., and Gustin, M. S.: Comparison of gaseous oxidized Hg measured by KCl-coated denuders, and Nylon and Cation exchange Membranes, Environ. Sci. Technol., 47, 7307–7316, https://doi.org/10.1021/Es4012349, 2013.
Jiskra, M., Sonke, J. E., Obrist, D., Bieser, J., Ebinghaus, R., Myhre, C. L., Pfaffhuber, K. A., Wangberg, I., Kyllonen, K., Worthy, D., Martin, L. G., Labuschagne, C., Mkololo, T., Ramonet, M., Magand, O., and Dommergue, A.: A vegetation control on seasonal variations in global atmospheric mercury concentrations, Nat. Geosci., 11, 244–250, https://doi.org/10.1038/s41561-018-0078-8, 2018.
Jiskra, M., Marusczak, N., Leung, K. H., Hawkins, L., Prestbo, E., and Sonke, J. E.: Automated Stable Isotope Sampling of Gaseous Elemental Mercury (ISO-GEM): Insights into GEM Emissions from Building Surfaces, Environ. Sci. Technol., 53, 4346–4354, https://doi.org/10.1021/acs.est.8b06381, 2019a.
Jiskra, M., Sonke, J. E., Agnan, Y., Helmig, D., and Obrist, D.: Insights from mercury stable isotopes on terrestrial–atmosphere exchange of Hg(0) in the Arctic tundra, Biogeosciences, 16, 4051–4064, https://doi.org/10.5194/bg-16-4051-2019, 2019b.
Lin, C.-J., Pan, L., Streets, D. G., Shetty, S. K., Jang, C., Feng, X., Chu, H.-W., and Ho, T. C.: Estimating mercury emission outflow from East Asia using CMAQ-Hg, Atmos. Chem. Phys., 10, 1853–1864, https://doi.org/10.5194/acp-10-1853-2010, 2010.
Liu, H. W., Diao, X., Yu, B., Shi, J. B., Liu, Q., Yin, Y. G., Hu, L. G., Yuan, C. G., and Jiang, G. B.: Effect of air pollution control devices on mercury isotopic fractionation in coal-fired power plants, Chem. Geol., 517, 1–6, https://doi.org/10.1016/j.chemgeo.2019.04.019, 2019.
Liu, K. Y., Wu, Q. R., Wang, L., Wang, S. X., Liu, T. H., Ding, D., Tang, Y., Li, G. L., Tian, H. Z., Duan, L., Wang, X., Fu, X. W., Feng, X. B., and Hao, J. M.: Measure-Specific Effectiveness of Air Pollution Control on China's Atmospheric Mercury Concentration and Deposition during 2013–2017, Environ. Sci. Technol., 53, 8938–8946, https://doi.org/10.1021/acs.est.9b02428, 2019.
Lyman, S. N. and Jaffe, D. A.: Formation and fate of oxidized mercury in the upper troposphere and lower stratosphere, Nat. Geosci., 5, 114–117, https://doi.org/10.1038/NGEO1353, 2012.
Lynam, M. M. and Keeler, G. J.: Automated speciated mercury measurements in Michigan, Environ. Sci. Technol., 39, 9253–9262, https://doi.org/10.1021/Es040458r, 2005.
Mao, H., Cheng, I., and Zhang, L.: Current understanding of the driving mechanisms for spatiotemporal variations of atmospheric speciated mercury: a review, Atmos. Chem. Phys., 16, 12897–12924, https://doi.org/10.5194/acp-16-12897-2016, 2016.
Obrist, D., Agnan, Y., Jiskra, M., Olson, C. L., Colegrove, D. P., Hueber, J., Moore, C. W., Sonke, J. E., and Helmig, D.: Tundra uptake of atmospheric elemental mercury drives Arctic mercury pollution, Nature, 547, 201–204, https://doi.org/10.1038/nature22997, 2017.
Obrist, D., Kirk, J. L., Zhang, L., Sunderland, E. M., Jiskra, M., and Selin, N. E.: A review of global environmental mercury processes in response to human and natural perturbations: Changes of emissions, climate, and land use, Ambio, 47, 116–140, https://doi.org/10.1007/s13280-017-1004-9, 2018.
Peterson, C., Gustin, M., and Lyman, S.: Atmospheric mercury concentrations and speciation measured from 2004 to 2007 in Reno, Nevada, USA, Atmos. Environ., 43, 4646–4654, https://doi.org/10.1016/j.atmosenv.2009.04.053, 2009.
Pirrone, N., Cinnirella, S., Feng, X., Finkelman, R. B., Friedli, H. R., Leaner, J., Mason, R., Mukherjee, A. B., Stracher, G. B., Streets, D. G., and Telmer, K.: Global mercury emissions to the atmosphere from anthropogenic and natural sources, Atmos. Chem. Phys., 10, 5951–5964, https://doi.org/10.5194/acp-10-5951-2010, 2010.
Rutter, A. P., Snyder, D. C., Stone, E. A., Schauer, J. J., Gonzalez-Abraham, R., Molina, L. T., Márquez, C., Cárdenas, B., and de Foy, B.: In situ measurements of speciated atmospheric mercury and the identification of source regions in the Mexico City Metropolitan Area, Atmos. Chem. Phys., 9, 207–220, https://doi.org/10.5194/acp-9-207-2009, 2009.
Selin, N. E., Jacob, D. J., Park, R. J., Yantosca, R. M., Strode, S., Jaegle, L., and Jaffe, D.: Chemical cycling and deposition of atmospheric mercury: Global constraints from observations, J. Geophys. Res.-Atmos., 112, D02308, https://doi.org/10.1029/2006jd007450, 2007.
Shah, V., Jaeglé, L., Gratz, L. E., Ambrose, J. L., Jaffe, D. A., Selin, N. E., Song, S., Campos, T. L., Flocke, F. M., Reeves, M., Stechman, D., Stell, M., Festa, J., Stutz, J., Weinheimer, A. J., Knapp, D. J., Montzka, D. D., Tyndall, G. S., Apel, E. C., Hornbrook, R. S., Hills, A. J., Riemer, D. D., Blake, N. J., Cantrell, C. A., and Mauldin III, R. L.: Origin of oxidized mercury in the summertime free troposphere over the southeastern US, Atmos. Chem. Phys., 16, 1511–1530, https://doi.org/10.5194/acp-16-1511-2016, 2016.
Sherman, L. S., Blum, J. D., Johnson, K. P., Keeler, G. J., Barres, J. A., and Douglas, T. A.: Mass-independent fractionation of mercury isotopes in Arctic snow driven by sunlight, Nat. Geosci., 3, 173–177, https://doi.org/10.1038/Ngeo758, 2010.
Sonke, J. E.: A global model of mass independent mercury stable isotope fractionation, Geochim. Cosmochim. Ac., 75, 4577–4590, https://doi.org/10.1016/j.gca.2011.05.027, 2011.
Sprovieri, F., Pirrone, N., Bencardino, M., D'Amore, F., Carbone, F., Cinnirella, S., Mannarino, V., Landis, M., Ebinghaus, R., Weigelt, A., Brunke, E.-G., Labuschagne, C., Martin, L., Munthe, J., Wängberg, I., Artaxo, P., Morais, F., Barbosa, H. D. M. J., Brito, J., Cairns, W., Barbante, C., Diéguez, M. D. C., Garcia, P. E., Dommergue, A., Angot, H., Magand, O., Skov, H., Horvat, M., Kotnik, J., Read, K. A., Neves, L. M., Gawlik, B. M., Sena, F., Mashyanov, N., Obolkin, V., Wip, D., Feng, X. B., Zhang, H., Fu, X., Ramachandran, R., Cossa, D., Knoery, J., Marusczak, N., Nerentorp, M., and Norstrom, C.: Atmospheric mercury concentrations observed at ground-based monitoring sites globally distributed in the framework of the GMOS network, Atmos. Chem. Phys., 16, 11915–11935, https://doi.org/10.5194/acp-16-11915-2016, 2016.
Sun, G., Sommar, J., Feng, X., Lin, C.-J., Ge, M., Wang, W., Yin, R., Fu, X., and Shang, L.: Mass-dependent and -independent fractionation of mercury isotope during gas-phase oxidation of elemental mercury vapor by atomic Cl and Br, Environ. Sci. Technol., 50, 9232–9241, https://doi.org/10.1021/acs.est.6b01668, 2016.
Sun, R. Y., Enrico, M., Heimburger, L. E., Scott, C., and Sonke, J. E.: A double-stage tube furnace-acid-trapping protocol for the pre-concentration of mercury from solid samples for isotopic analysis, Anal. Bioanal. Chem., 405, 6771–6781, https://doi.org/10.1007/s00216-013-7152-2, 2013.
Sun, R. Y., Streets, D. G., Horowitz, H. M., Amos, H. M., Liu, G. J., Perrot, V., Toutain, J. P., Hintelmann, H., Sunderland, E. M., and Sonke, J. E.: Historical (1850–2010) mercury stable isotope inventory from anthropogenic sources to the atmosphere, Elem. Sci. Anth., 4, 1–15, https://doi.org/10.12952/journal.elementa.000091, 2016.
Sun, R. Y., Jiskra, M., Amos, H. M., Zhang, Y. X., Sunderland, E. M., and Sonke, J. E.: Modelling the mercury stable isotope distribution of Earth surface reservoirs: Implications for global Hg cycling, Geochim. Cosmochim. Ac., 246, 156–173, https://doi.org/10.1016/j.gca.2018.11.036, 2019.
Swartzendruber, P. C., Jaffe, D. A., and Finley, B.: Development and First Results of an Aircraft-Based, High Time Resolution Technique for Gaseous Elemental and Reactive (Oxidized) Gaseous Mercury, Environ. Sci. Technol., 43, 7484–7489, https://doi.org/10.1021/Es901390t, 2009.
Tang, S., Feng, C., Feng, X., Zhu, J., Sun, R., Fan, H., Wang, L., Li, R., Mao, T., and Zhou, T.: Stable isotope composition of mercury forms in flue gases from a typical coal-fired power plant, Inner Mongolia, northern China, J. Hazard. Mater., 328, 90–97, https://doi.org/10.1016/j.jhazmat.2017.01.014, 2017.
Tang, Y., Wang, S., Wu, Q., Liu, K., Wang, L., Li, S., Gao, W., Zhang, L., Zheng, H., Li, Z., and Hao, J.: Recent decrease trend of atmospheric mercury concentrations in East China: the influence of anthropogenic emissions, Atmos. Chem. Phys., 18, 8279–8291, https://doi.org/10.5194/acp-18-8279-2018, 2018.
United States Environmental Protection Agency (USEPA): Method 1631, Revision E: Mercury in Water by Oxidation, Purge and Trap, and Cold Vapor Atomic Fluorescence Spectrometry, United States Environmental Protection Agency, 10–46 pp., 2002.
Wang, D. Y., He, L., Shi, X. J., Wei, S. Q., and Feng, X. B.: Release flux of mercury from different environmental surfaces in Chongqing, China, Chemosphere, 64, 1845–1854, https://doi.org/10.1016/j.chemosphere.2006.01.054, 2006.
Wang, X., Lin, C.-J., Yuan, W., Sommar, J., Zhu, W., and Feng, X.: Emission-dominated gas exchange of elemental mercury vapor over natural surfaces in China, Atmos. Chem. Phys., 16, 11125–11143, https://doi.org/10.5194/acp-16-11125-2016, 2016.
Wu, Q. R., Wang, S. X., Li, G. L., Liang, S., Lin, C. J., Wang, Y. F., Cai, S. Y., Liu, K. Y., and Hao, J. M.: Temporal Trend and Spatial Distribution of Speciated Atmospheric Mercury Emissions in China During 1978–2014, Environ. Sci. Technol., 50, 13428–13435, 2016.
Xu, H., Sonke, J. E., Guinot, B., Fu, X., Sun, R., Lanzanova, A., Candaudap, F., Shen, Z., and Cao, J.: Seasonal and Annual Variations in Atmospheric Hg and Pb Isotopes in Xi'an, China, Environ. Sci. Technol., 51, 3759–3766, https://doi.org/10.1021/acs.est.6b06145, 2017.
Yu, B., Fu, X., Yin, R., Zhang, H., Wang, X., Lin, C.-J., Wu, C., Zhang, Y., He, N., Fu, P., Wang, Z., Shang, L., Sommar, J., Sonke, J. E., Maurice, L., Guinot, B., and Feng, X.: Isotopic Composition of Atmospheric Mercury in China: New Evidence for Sources and Transformation Processes in Air and in Vegetation, Environ. Sci. Technol., 50, 9262–9269, https://doi.org/10.1021/acs.est.6b01782, 2016.
Zhang, H., Wang, Z. W., Wang, C. J., and Zhang, X. S.: Concentrations and gas-particle partitioning of atmospheric reactive mercury at an urban site in Beijing, China, Environ. Pollut., 249, 13–23, https://doi.org/10.1016/j.envpol.2019.02.064, 2019.
Zhang, L., Wang, S. X., Wang, L., and Hao, J. M.: Atmospheric mercury concentration and chemical speciation at a rural site in Beijing, China: implications of mercury emission sources, Atmos. Chem. Phys., 13, 10505–10516, https://doi.org/10.5194/acp-13-10505-2013, 2013.
Zheng, B., Tong, D., Li, M., Liu, F., Hong, C., Geng, G., Li, H., Li, X., Peng, L., Qi, J., Yan, L., Zhang, Y., Zhao, H., Zheng, Y., He, K., and Zhang, Q.: Trends in China's anthropogenic emissions since 2010 as the consequence of clean air actions, Atmos. Chem. Phys., 18, 14095–14111, https://doi.org/10.5194/acp-18-14095-2018, 2018.
Zheng, W. and Hintelmann, H.: Nuclear Field Shift Effect in Isotope Fractionation of Mercury during Abiotic Reduction in the Absence of Light, J. Phys. Chem. A., 114, 4238–4245, 2010.
Zhu, J., Wang, T., Talbot, R., Mao, H., Hall, C. B., Yang, X., Fu, C., Zhuang, B., Li, S., Han, Y., and Huang, X.: Characteristics of atmospheric Total Gaseous Mercury (TGM) observed in urban Nanjing, China, Atmos. Chem. Phys., 12, 12103–12118, https://doi.org/10.5194/acp-12-12103-2012, 2012.