the Creative Commons Attribution 4.0 License.
the Creative Commons Attribution 4.0 License.
 | 15 Jan 2021
Stratospheric aerosol layer perturbation caused by the 2019 Raikoke and Ulawun eruptions and their radiative forcing
Corinna Kloss
Gwenaël Berthet
Pasquale Sellitto
Felix Ploeger
Ghassan Taha
Mariam Tidiga
Maxim Eremenko
Adriana Bossolasco
Fabrice Jégou
Jean-Baptiste Renard
Bernard Legras
In June 2019 a stratospheric eruption occurred at Raikoke (48∘ N, 153∘ E). Satellite observations show the injection of ash and SO2 into the lower stratosphere and an early entrainment of the plume into a cyclone. Following the Raikoke eruption, stratospheric aerosol optical depth (sAOD) values increased in the whole Northern Hemisphere and tropics and remained enhanced for more than 1 year, with peak values at 0.040 (short-wavelength, high northern latitudes) to 0.025 (short-wavelength, Northern Hemisphere average). Discrepancies between observations and global model simulations indicate that ash may have influenced the extent and evolution of the sAOD. Top of the atmosphere radiative forcings are estimated at values between −0.3 and (clear-sky) and of −0.1 to (all-sky), comparable to what was estimated for the Sarychev eruption in 2009. Almost simultaneously two significantly smaller stratospheric eruptions occurred at Ulawun (5∘ S, 151∘ E) in June and August. Aerosol enhancements from the Ulawun eruptions mainly had an impact on the tropics and Southern Hemisphere. The Ulawun plume circled the Earth within 1 month in the tropics. Peak shorter-wavelength sAOD values at 0.01 are found in the tropics following the Ulawun eruptions and a radiative forcing not exceeding −0.15 (clear-sky) and −0.05 (all-sky). Compared to the Canadian fires (2017), Ambae eruption (2018), Ulawun (2019) and the Australian fires (2019/2020), the highest sAOD and radiative forcing values are found for the Raikoke eruption.
- Article
(13845 KB) - Full-text XML
- BibTeX
- EndNote


Severe volcanic eruptions can inject a significant amount of sulfur-containing species and, potentially, ash material directly into the UTLS (Upper Troposphere–Lower Stratosphere). In the UTLS, secondary sulfate aerosols are formed by conversion of sulfur dioxide (SO2) to particles. Because of the limited potential of dry and wet deposition in the UTLS, these particles (sulfate aerosols in particular, but also fine ash particles, when present) have a long lifetime. Additionally, sulfate aerosols are reflective and effectively scatter shortwave radiation back to space, thus producing a net cooling effect on the climate (Kremser et al., 2016). The extent of the impact on the global stratospheric composition and climate, from a volcanic eruption, depends on various parameters: (1) chemical composition and concentration of the plume, (2) geographical location of the erupting volcano, (3) injection altitude, and (4) dynamical situation at the time and location of the injection. (1) The sulfur burden in the plume determines the resulting sulfate aerosol formation and dominates the climate impact (Kremser et al., 2016). Whether the initial plume contains ash or not can modify the chemical and microphysical evolution pathways and aerosol formation/evolution and can alter related dynamical features (radiative balance including local diabatic heating) (Robock, 2000; Vernier et al., 2016). (2) A tropical volcano producing sulfate material into the UTLS usually has a larger geographical impact than a similarly sized eruption at higher latitudes. From the tropical lower stratosphere air masses have the potential to be transported over very long distances, in both hemispheres and up to higher latitudes, within the Brewer–Dobson circulation (BDC) (Butchart, 2014; Jones et al., 2017). (3) The aerosol lifetime of a plume is also connected with the injection altitude relative to the tropopause. A higher injection altitude results in a longer potential transport within the BDC and a longer sedimentation time, which leads to a longer potential lifetime of the formed or pre-existing aerosol. (4) The dynamical situation around the plume (cyclones, anticyclones, jets, etc.) can modify the transport pathways and, in some cases, lead to a fast transport/distribution (Fairlie et al., 2014; Wu et al., 2017).
The Pinatubo (15.13∘ N, 120.35∘ E) eruption in June 1991 is the most recent example of a volcanic eruption with a global climate influence. Up to around 20 Tg of SO2 was injected into the lower stratosphere (Bluth et al., 1992), which caused a global mean surface temperature drop of nearly 0.4 ∘C (Thompson et al., 2009), although its amplitude has been debated and revised (Canty et al., 2013; Wunderlich and Mitchell, 2017). Since then, no volcanic eruption with a comparable impact on the climate has occurred. However, even without major (Pinatubo-like) stratospheric eruptions it has been shown that, during the past 2 decades, moderate eruptions substantially increased the amount of stratospheric aerosols (Vernier et al., 2011; Solomon et al., 2011; Ridley et al., 2014). Some prominent “moderate-sized” volcanic eruptions during the last decade were recorded, in particular at Kasatochi on 7 August 2008 in southwestern Alaska (52.17∘ N, 175.51∘ E), Sarychev on 15 June 2009 on the Kuril Islands (48.1∘ N, 153.2∘ E) and Nabro on 12/13 June 2011 in the Afar Triangle between Ethiopia and southern Eritrea (13.37∘ N, 41.47∘ E). The eruption at Kasatochi produced an initial SO2 injection of 0.7–2.2 Tg (Kristiansen et al., 2010; Krotkov et al., 2010; Günther et al., 2018). The SO2 burden injected from the Sarychev eruption into the UTLS was originally calculated at 1.2±0.2 Tg (Haywood et al., 2010). After Pinatubo, the Nabro eruption was considered the largest single injection of SO2 into the UTLS, with 1.3–2 Tg (e.g., Clarisse et al., 2012; Sawamura et al., 2012).
An accurate description of such stratospheric volcanic eruptions is challenging. Fromm et al. (2014) raise awareness of some limitations in data quality, but conflicting injection sequence information can also lead to different conclusions about the same volcanic eruption. Furthermore, for the Sarychev eruption several re-estimations during the past decade yield different numbers between 0.8 and 1.5 Tg for the injected SO2 burden (Clarisse et al., 2012; Jégou et al., 2013; Höpfner et al., 2015; Günther et al., 2018), which in itself indicates the complexity and the uncertainty that goes along with a single eruption.
Ten years after the Sarychev eruption, in 2019 another eruption similar in location, time of year and load of injected aerosol precursors took place at Raikoke (48∘ N and 153∘ E) on 21/22 June 2019. At almost the same time, the volcano at Ulawun erupted on 26 June and 3 August 2019 (5∘ S and 151∘ E) and two stratospheric fire events occurred in Alberta, Canada (June), and Siberia (July).
This study aims at a first description of the complex situation in the UTLS around the Raikoke and Ulawun eruptions. We investigate the injection, global transport and climate impact of the 2019 eruptions at Raikoke and Ulawun.
Section 2 gives an overview of both volcanoes and some key information on the presented eruptions. In Sect. 3, we introduce the data sets, models and their respective setup. The early phase of the injected Raikoke plume and the global transport of the Raikoke and Ulawun plumes are analyzed in Sect. 4, and the resulting climate impact is estimated in Sect. 5. Finally conclusions are drawn.
2.1 Raikoke
The Raikoke volcano on the Kuril Islands in the western Pacific Ocean (48.29∘ N, 153.25∘ E) is known for its relatively frequent explosive activity (last documented eruptions in 1924 and 1778) (NASA, 2019). Crafford and Venzke (2019) state that a series of paroxysmal eruptions occurred at Raikoke between 21 (18:00 UTC) and 22 (05:40 UTC) June 2019. Some first crude estimations with IASI/Metop-B data indicate SO2 altitudes in the range between 10 and 16 km on 23 June (Aeris, 2018). Hedelt et al. (2019) show plume altitudes ranging from 6–8 km up to 18 km altitude with TROPOMI observations on 23 June and from 11 to 20 km altitude the following day. Sentinel5P/TROPOMI observations indicate an SO2 injected mass of around 1.35 Tg in the Raikoke plume from 23 June (Carn, 2019a). Airplanes flying over the North Pacific had to be redirected (Crafford and Venzke, 2019).
2.2 Ulawun
The Ulawun volcano in Papua New Guinea (5.05∘ S, 151.33∘ E) was identified as 1 of the 16 “decade volcanoes” by the International Association of Volcanology and Chemistry of the Earth's Interior (IAVCEI) and is therefore known as one of the most potentially destructive volcanoes on Earth (Cas, 2019). Two eruptions occurred during summer 2019, on 26 June and 3 August. Injection altitudes of SO2 are identified between 13 and 17 km with IASI/Metop-B data for the first eruption on 26 June. For the second and larger eruption, IASI/Metop-B data indicate SO2 altitudes of around 14–17 km for 3 and 4 August (Aeris, 2018). For the first eruption Sentinel5P/TROPOMI data suggest a SO2 load of ≈0.14 Tg of the plume, while the second one was a bit larger and data suggest ≈0.2 Tg of SO2 (Carn, 2019b). With its tropical location, the eruptions at Ulawun have the potential to have an impact on the lower stratosphere of both hemispheres within the BDC, once injected into the UTLS (Butchart, 2014; Jones et al., 2017). Ulawun remained in an active phase with observed ash plumes in October 2019 up to 3 km altitude (Bennis and Venzke, 2019). By February 2020 only water vapor plumes were observed and the Alert Level remained at Stage 1 (Sennert, 2020).
3.1 OMPS
The Ozone Mapping Profiler Suite Limb Profiler (OMPS-LP) is onboard the Suomi National Polar-orbiting Partnership satellite that was launched in October 2011. It was originally designed for height-resolved atmospheric ozone observations (Loughman et al., 2018; Bhartia and Torres, 2019). Aerosol extinction measurements at 675 nm are provided from 10 to 40 km altitude on a 1 km vertical grid. Three slits separated horizontally by 4.25∘ result in three measured profiles at each point in time separated by 250 km of the tangent points at the Earth's surface. The vertical resolution is ≈1.6 km. Here, we use the aerosol extinction profile measurements from 2017 onwards of the NASA OMPS data product version 1.5 (Rault and Loughman, 2013). A near-global coverage is produced within 3–4 d. Tropopause values are included in the data set from the MERRA-2 (Modern-Era Retrospective analysis for Research and Applications, Version 2) forward processing (Randles et al., 2017; Gelaro et al., 2017). To avoid removing enhanced aerosol layers that are mistakenly identified as clouds, we use the unfiltered OMPS data set. The influence of stratospheric clouds for the interpretation of this transport study about the Australian fire plume is expected to be negligible and not further analyzed. With its high sampling rate, we use the OMPS data set to study the global transport of the respective volcanic plumes in the lower stratosphere.
3.2 SAGE III/ISS
As part of an ongoing instrumental series, a Stratospheric Aerosol and Gas Experiment instrument flies onboard the International Space Station (SAGE III/ISS). It is a solar and lunar occultation instrument, providing, among other parameters, vertical profile observations of ozone, water vapor, nitrogen dioxide and nitrogen trioxide concentration, and aerosol extinction. Aerosol extinction values from the solar occultation measurements are provided for various wavelengths: 384, 449, 521, 676, 756, 869, and 1020 nm. Measurements have been provided since June 2017 between 60∘ S and 60∘ N on a 0.5 km vertical grid from 0.5 (or cloud top) to 40 km altitude. The vertical resolution is ≈1 km. Similarly to OMPS, the tropopause information is included in the data set from the MERRA-2 reanalysis. We use the data version 5.1. Chen et al. (2019) find good agreement between SAGE III/ISS and OMPS data. In particular, after the eruption at Ambae a small discrepancy ( %) was found. As a solar occultation instrument, SAGE III/ISS provides 30 measurements per day. This relatively low sampling rate (e.g., compared to OMPS) limits the interpretability of the finer transport features analyzed with SAGE III/ISS. However, the better vertical resolution and observations at multiple wavelengths compared to OMPS bring an added value when spatiotemporally averaged data are used for the radiative forcing calculations. The wavelength dependence, for example, can be used to extract information on the aerosol size distribution via the Angström exponent.
3.3 Himawari
Himawari-8 is a geostationary satellite at 140∘ E from the Japanese Space Agency providing measurements of temperature, clouds, precipitation and aerosol distribution since 2015 (launched in 2014). It has an expected lifetime of 8 years and will be replaced afterwards by Himawari-9. It observes the area of East Asia and the western Pacific (Da, 2015). We use the brightness temperature (BT) observations from the 16-channel multispectral imager from the Clear Sky Radiance product (Uesawa, 2009). The data have a spatial resolution at a sub-satellite point of 2 km for the infrared channels (0.46–13.3 µm). For the interpretation of the results in this study, we use the operational Eumetrain RGB recipes (Eumetrain, 2020), which allows the discrimination between clouds, ash and SO2, thanks to the combination of the infrared channels at 8.5, 10.4 and 12.3 µm. The Dust RGB product performs better for volcanic plumes than the Ash RGB product at large viewing angles. Thus, the Dust RGB product is used to describe the first phases of dispersion of the Raikoke plume.
3.4 IASI
The Infrared Atmospheric Sounding Interferometer (IASI) is a Fourier transform spectrometer (Clerbaux et al., 2009), operating between 645 and 2760 cm−1 (3.62 to 15.5 µm) spectral range onboard the MetOp-A/B/C spacecraft series since 2006/2012/2018, respectively. The instrument provides global coverage every 12 h, thanks to its circular footprints of 12 km radius spaced by 25 km at nadir and a swath of 2200 km. The IASI has the relatively high apodized spectral resolution of 0.5 cm−1. While its primary target is the monitoring of meteorological parameters (surface temperature, temperature, humidity profiles and cloud information), IASI also provides high-quality information on trace gas parameters and particles, including gases and particles emitted by volcanoes (e.g., Clarisse et al., 2013; Carboni et al., 2016; Ventress et al., 2016; Guermazi et al., 2020).
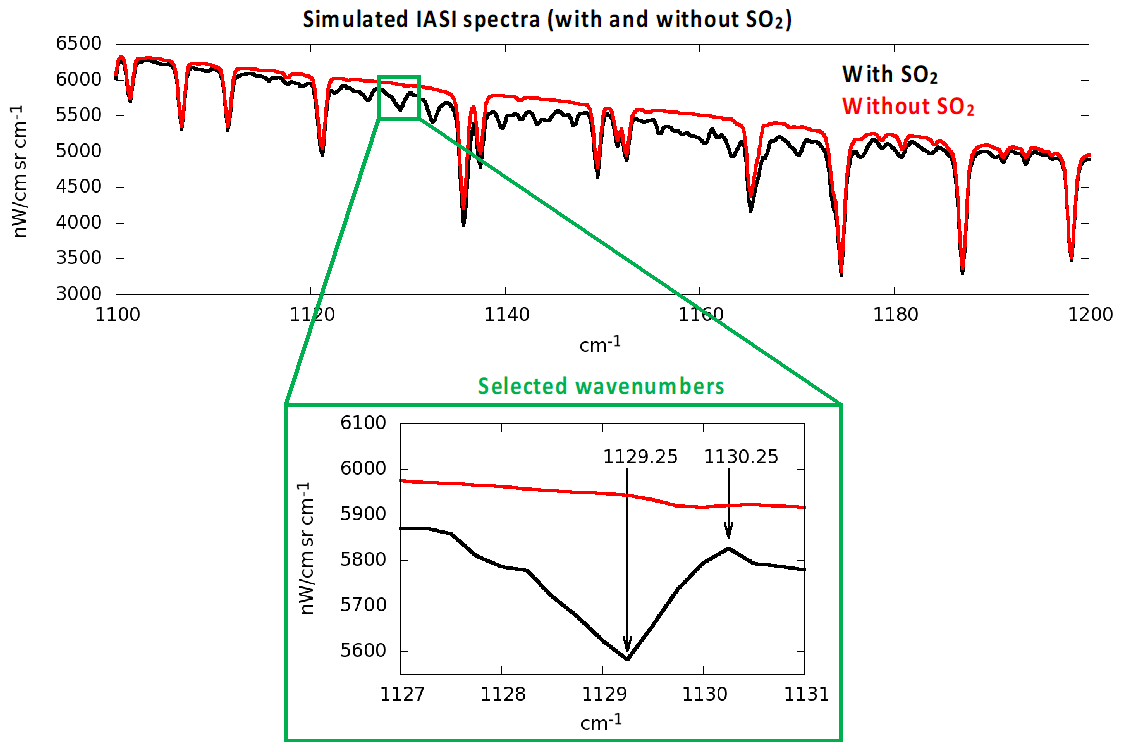
In this work, we exploit the high spectral resolution of IASI to resolve one absorption line of SO2 to provide a quick estimate of SO2 detection in volcanic plumes (i.e., without the use of a detailed and computationally demanding inversion algorithm, e.g., based on radiative transfer model-based spectral fitting). We define the following parameter:
R(ν) represents the radiance observed from IASI at wavenumber ν. The two values and represent two spectrally close wavenumbers, the first at the center of a SO2 absorption line and the second outside. Figure 1 shows a case of simulated IASI spectra with and without SO2 (all other parameters in the simulations of the IASI spectra are the same, e.g., surface temperature, temperature and humidity profiles, gaseous absorbers and aerosol profiles). The two selected wavenumbers ν1 and ν2 are highlighted to show their extreme position (ν1 at the approximate center and ν2 outside the absorption feature) in one isolated SO2 absorption line, which is not affected by the absorption of water vapor or other extra-SO2 species. From the definition of Eq. (1) and Fig. 1 it is possible to see that values of larger than 1.0 are linked to spectra where SO2 is detected. It is important to stress that is purely a qualitative detection parameter and is not to be taken as a quantitative retrieval of the SO2 concentration even if linked to the latter. This parameter is only useful in case of strong SO2 anomalies, like the one generated by the Raikoke eruption, and for the analysis of relatively large-scale dispersions of SO2-rich plumes.
3.5 LOAC in situ measurements
The Light Optical Aerosol Counter (LOAC) is an optical particle counter suitable for tropospheric and stratospheric observations of aerosol concentration (Renard et al., 2016). It is light and compact enough for in situ measurements using weather balloons. It provides particle number concentrations for 19 sizes in the 0.2–50 µm size range, with an uncertainty of ±20 % for concentrations higher than 1 particle per cm3; the uncertainty increases to about ±30 % for submicron particle concentrations higher than 1 particle per cm3 and to about ±60% for concentrations smaller than 10−2 particles per cm3. The raw LOAC concentrations are corrected in terms of sampling efficiency for observations during balloon ascent (Renard et al., 2016), the sampling being dominated by sub-isokinetic conditions and the divergence of the flow field at the inlet entrance. LOAC V1.5 data used in this study have been improved in comparison with LOAC V1.2 presented in Renard et al. (2016), resulting in reduced stray light and a higher signal-to-noise ratio with a more powerful laser source (65 mW instead of 25 mW formerly). The size distributions have been converted to 675 nm extinction with the Mie scattering theory, assuming spherical particles with a refractive index corresponding to stratospheric sulfuric acid particles. Only size classes below 1 µm have been used to avoid spurious effects (i.e., local enhancements in the calculated extinction value) resulting from the transient presence of micrometric particles. As a result, only a partial extinction has been derived. In this study, we use LOAC observations during balloon ascent from France (Ury, 48.34∘ N, 2.60∘ E) from 11 measurement flights, i.e., 22 March 2019, 8 and 29 August 2019, 16 September 2019, 11 and 30 October 2019, 20 November2019, 3 December 2019, 7 January 2020, 6 February 2020, and 6 March 2020. For the transformation from aerosol concentration to extinction for the stratospheric aerosol optical depth (sAOD) comparisons with satellites, only size classes below 1 µm are used because of artifacts, which appear for size classes above 1 µm.
3.6 Transport simulation with CLaMS
The Chemical Lagrangian Model of the Stratosphere (CLaMS) is a Lagrangian chemistry transport model. The model transport is based on 3D forward trajectories and an additional parameterization of small-scale mixing (McKenna et al., 2002; Pommrich et al., 2014). The transport is driven by the ERA-5 meteorological data (Hersbach et al., 2020). As CLaMS uses an isentropic vertical coordinate in the stratosphere, vertical transport in the model is driven with the reanalysis total diabatic heating rate.
Here, we perform CLaMS passive transport simulations for both volcanic eruptions. Chosen boxes in space and time are filled with a passive tracer and monitored in terms of dynamical behavior for the following months. The initialization box for Raikoke was chosen for 23–24 June 2020, 163∘ E–170∘ W, 49–62∘ N and 335–460 K potential temperature. For the Raikoke eruption the box was chosen according to Hedelt et al. (2019). IASI/Metop-B data from Aeris (2018) show similar injection altitudes (see Sect. 2). The Ulawun transport was initialized on 3–4 August 2019, 137–178∘ E, 10∘ S–5∘ N and 350–385 K potential temperature, according to IASI/Metop-B data.
Note that the CLaMS model analysis has certain limitations. As a consequence of choosing a box shape for the initialization of the simulations, many of the presented trajectories do not exactly originate from the actual plume position. However, we want to emphasize that the CLaMS simulations in this study are purely to be taken as a rough idea of the transport from the respective initialization boxes.
3.7 UVSPEC radiative forcing calculations
We use the UVSPEC (UltraViolet SPECtrum) radiative transfer model as implemented within the LibRadtran package (Mayer and Kylling, 2005) (http://www.libradtran.org/doku.php, last access: 8 January 2021). With UVSPEC, the daily-average (equinox-equivalent) regional shortwave surface and top-of-the-atmosphere (TOA) radiative forcing (RF) are estimated. The RF estimations are based on radiation flux simulations in the spectral range from 300 to 3000 nm, with a 0.1 nm spectral resolution. The radiative transfer equation is parameterized and solved as follows. (1) The solar flux spectra used to drive the simulations are taken from Kurucz (Kurucz, 1994). (2) Vertical profiles of temperature, pressure, humidity and gas concentration come from the climatological standards of the Air Force Geophysics Laboratory (AFGL). Mid-latitude standard profiles are used for simulations of the Raikoke plume, while tropical standard profiles are used for Ulawun. (3) The molecular absorption is parameterized with the LOWTRAN band model (Pierluissi and Peng, 1985) (as adopted from the SBDART code). We consider a fixed wavelength-independent value of 0.1 for the surface reflectivity. This is intended to represent an average value for the main surfaces underneath the dispersed plume: ocean, and bare and vegetated soil. It is important to mention that the surface reflectance can be significantly larger for ice- and snow-covered surfaces; RF estimations can be quite sensitive to the surface reflectance (Sellitto et al., 2016). (4) The radiative transfer equation is then solved with the SDISORT method (the pseudo-spherical approximation of the discrete ordinate method – DISORT). The volcanically perturbed simulations are carried out by adding average SAGE III/ISS profile observations of the volcanic aerosol extinction coefficient (details on the spatiotemporal identification of the volcanic perturbations are given in Sect. 5). As a baseline, SAGE III/ISS aerosol extinction profiles are taken for background conditions, i.e., without volcanic aerosols (details on the spatiotemporal identification of the background are given in Sect. 5). For both setups (background and volcanically perturbed) we carry out multiple runs with varying solar zenith angles (SZAs). Finally, the daily-average shortwave TOA radiative forcing is calculated by integrating the SZA-averaged upward diffuse irradiance for the background scenario over the whole shortwave spectral range. The shortwave surface radiative forcing is calculated with the SZA-averaged downward global irradiance with aerosols minus the background scenario, integrated over the whole spectral range.
3.8 WACCM model
Model simulations were performed using the global CESM1 (Community Earth System Model 1) using its Whole Atmosphere Community Climate Model (WACCM) module linked to the CARMA (Community Aerosol and Radiation Model for Atmospheres) module, involving the sulfur cycle with a sectional aerosol scheme (English et al., 2011). Land, sea ice, and rivers were active modules, whereas oceans were prescribed. The spatial resolution was a longitude–latitude grid of 144 points by 96, respectively (i.e., approximately 2∘resolution) and over 88 levels of altitude ranging from the ground to approximately 150 km altitude with approximately 20 levels in the troposphere. Specified dynamics were used, with a nudging towards the Modern-Era Retrospective analysis for Research and Applications 2 (MERRA-2) meteorological data (Randles et al., 2017; Gelaro et al., 2017) at every time step (30 min) with a weight factor of 0.1 towards the analysis, for temperature and wind fields. Anthropogenic surface emissions were prescribed for SO2 using the MACCity data set (e.g., Diehl et al., 2012). Carbonyl sulfide (OCS) was prescribed using data from Kettle et al. (2002). The simulation presented in this study deals with a multi-annual model experiment starting on 1 January 2013 using the CESM1 initial atmosphere state file at that date. The Raikoke and Ulawun eruptions have been simulated by injecting a volcanic SO2 mass burden into model grid boxes corresponding to the locations of the volcanoes (Raikoke 48∘ N and 153∘ E, Ulawun 5∘ S and 151∘ E), over 6 h, spread evenly between a certain altitude range for each eruption (see Table 1 for a summary of the model setup) following the method of Mills et al. (2016). The chosen SO2 burden of 1.5 Tg for Raikoke is in fairly good agreement with Muser et al. (2020), who calculate with TROPOMI and estimate 1–2×10⁹ kg with HIMAWARI data. The model's 2.5∘ longitude × 1.875∘ latitude grid resolution means that the volcanic plumes are initially too diluted in the model compared to reality. This is nevertheless a typical methodology used in the literature (e.g., Lurton et al., 2018). The timing and injection altitude of the SO2 emissions are based on information provided by the SSiRC (Stratospheric Sulfur and its Role in Climate) community (SSiRC, 2018), Sect. 2, and the results shown in Sect. 4.1. This SSiRC information relies on SO2 satellite retrievals from IASI (Clarisse et al., 2012), OMI (Ozone Monitoring Instrument, Theys et al., 2015), and MLS (Krotkov et al., 2008). Uncertainties and discrepancies in injection altitude (Sects. 2 and 4.1) have motivated us to find compromise values for the selected input parameters in the model (see Table 1). The OMPS aerosol extinction profile shortly after the Raikoke eruption shown in Fig. A1 supports the chosen altitude range of 9–16 km. The CESM1 (WACCM) atmospheric chemistry scheme includes a comprehensive sulfur cycle and key stratospheric nitrogen (NOy) and halogenated and hydrogenated (in particular HOx radicals) compounds. The formation and microphysics of sulfuric acid aerosol particles simulated by the CARMA module are described in detail in English et al. (2011). Following Lurton et al. (2018), aerosol extinctions have been derived at 550 nm and integrated above the tropopause to yield a sAOD. In our study, the Raikoke and Ulawun eruptions are simulated by WACCM from a pure sulfate point of view; i.e., ash emissions are not included.
Table 1Characteristics of the model setup accounting for volcanic injections of SO2. The injections have been initialized between 18:00 and 00:00 UTC.
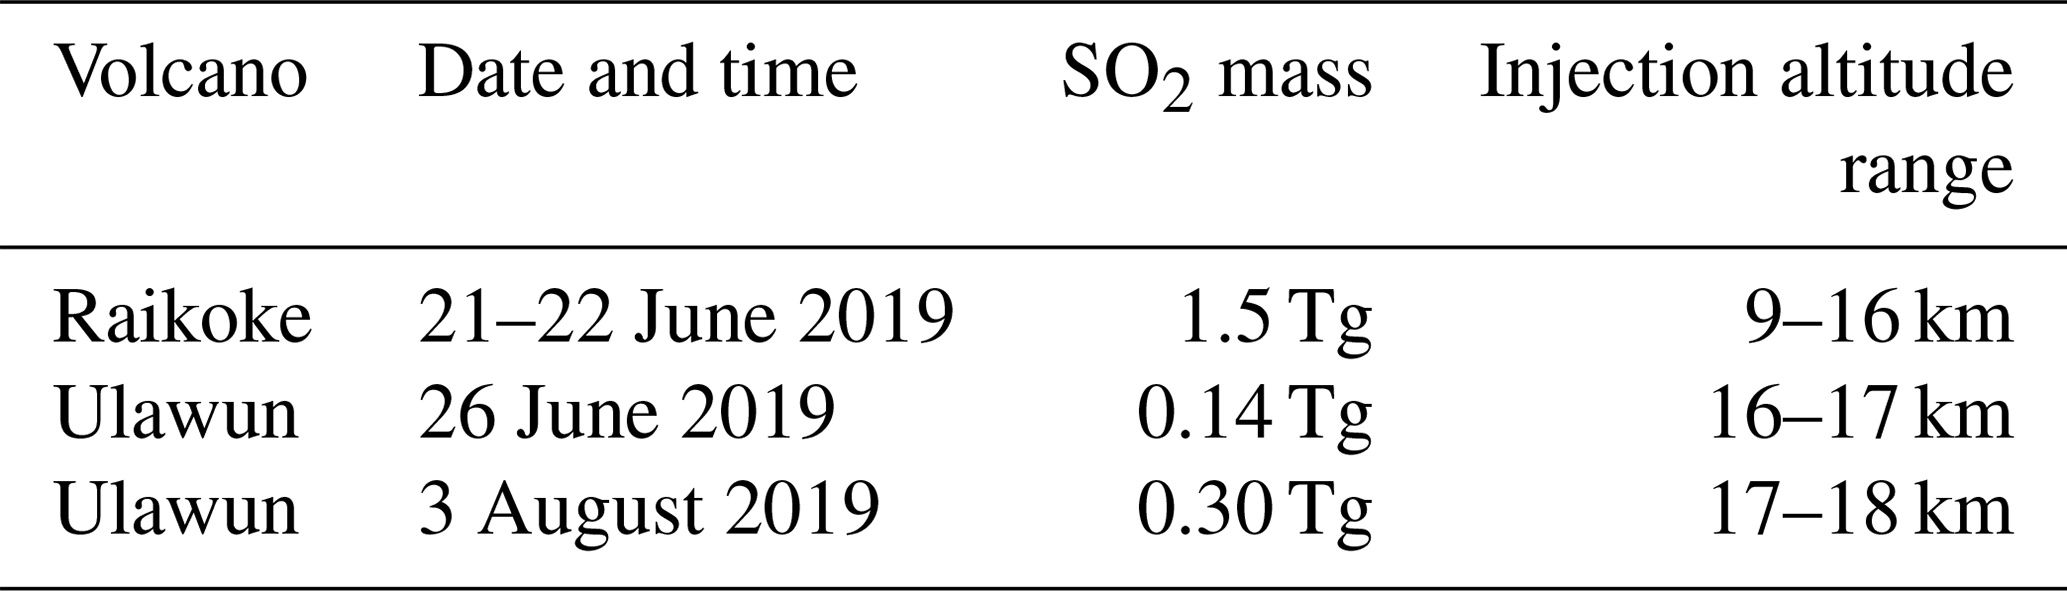

Figure 2Himawari Dust RGB images from 21 June 2019 to 28 June 2019, over the region of Raikoke. Red: ash; bright green: SO2; yellow: mixture of SO2 and thin ash; greenish: thick and thin mid-level clouds or cirrus clouds; brown: thick and high ice clouds; blue: humid low-level air; pink to violet: dry low-level air. The contour lines are plotted for the Montgomery potential on the potential temperature surface 340 K and indicate the mean atmospheric circulation. The image frame is expanded from the first panel to the last to follow the dispersion of the plume.
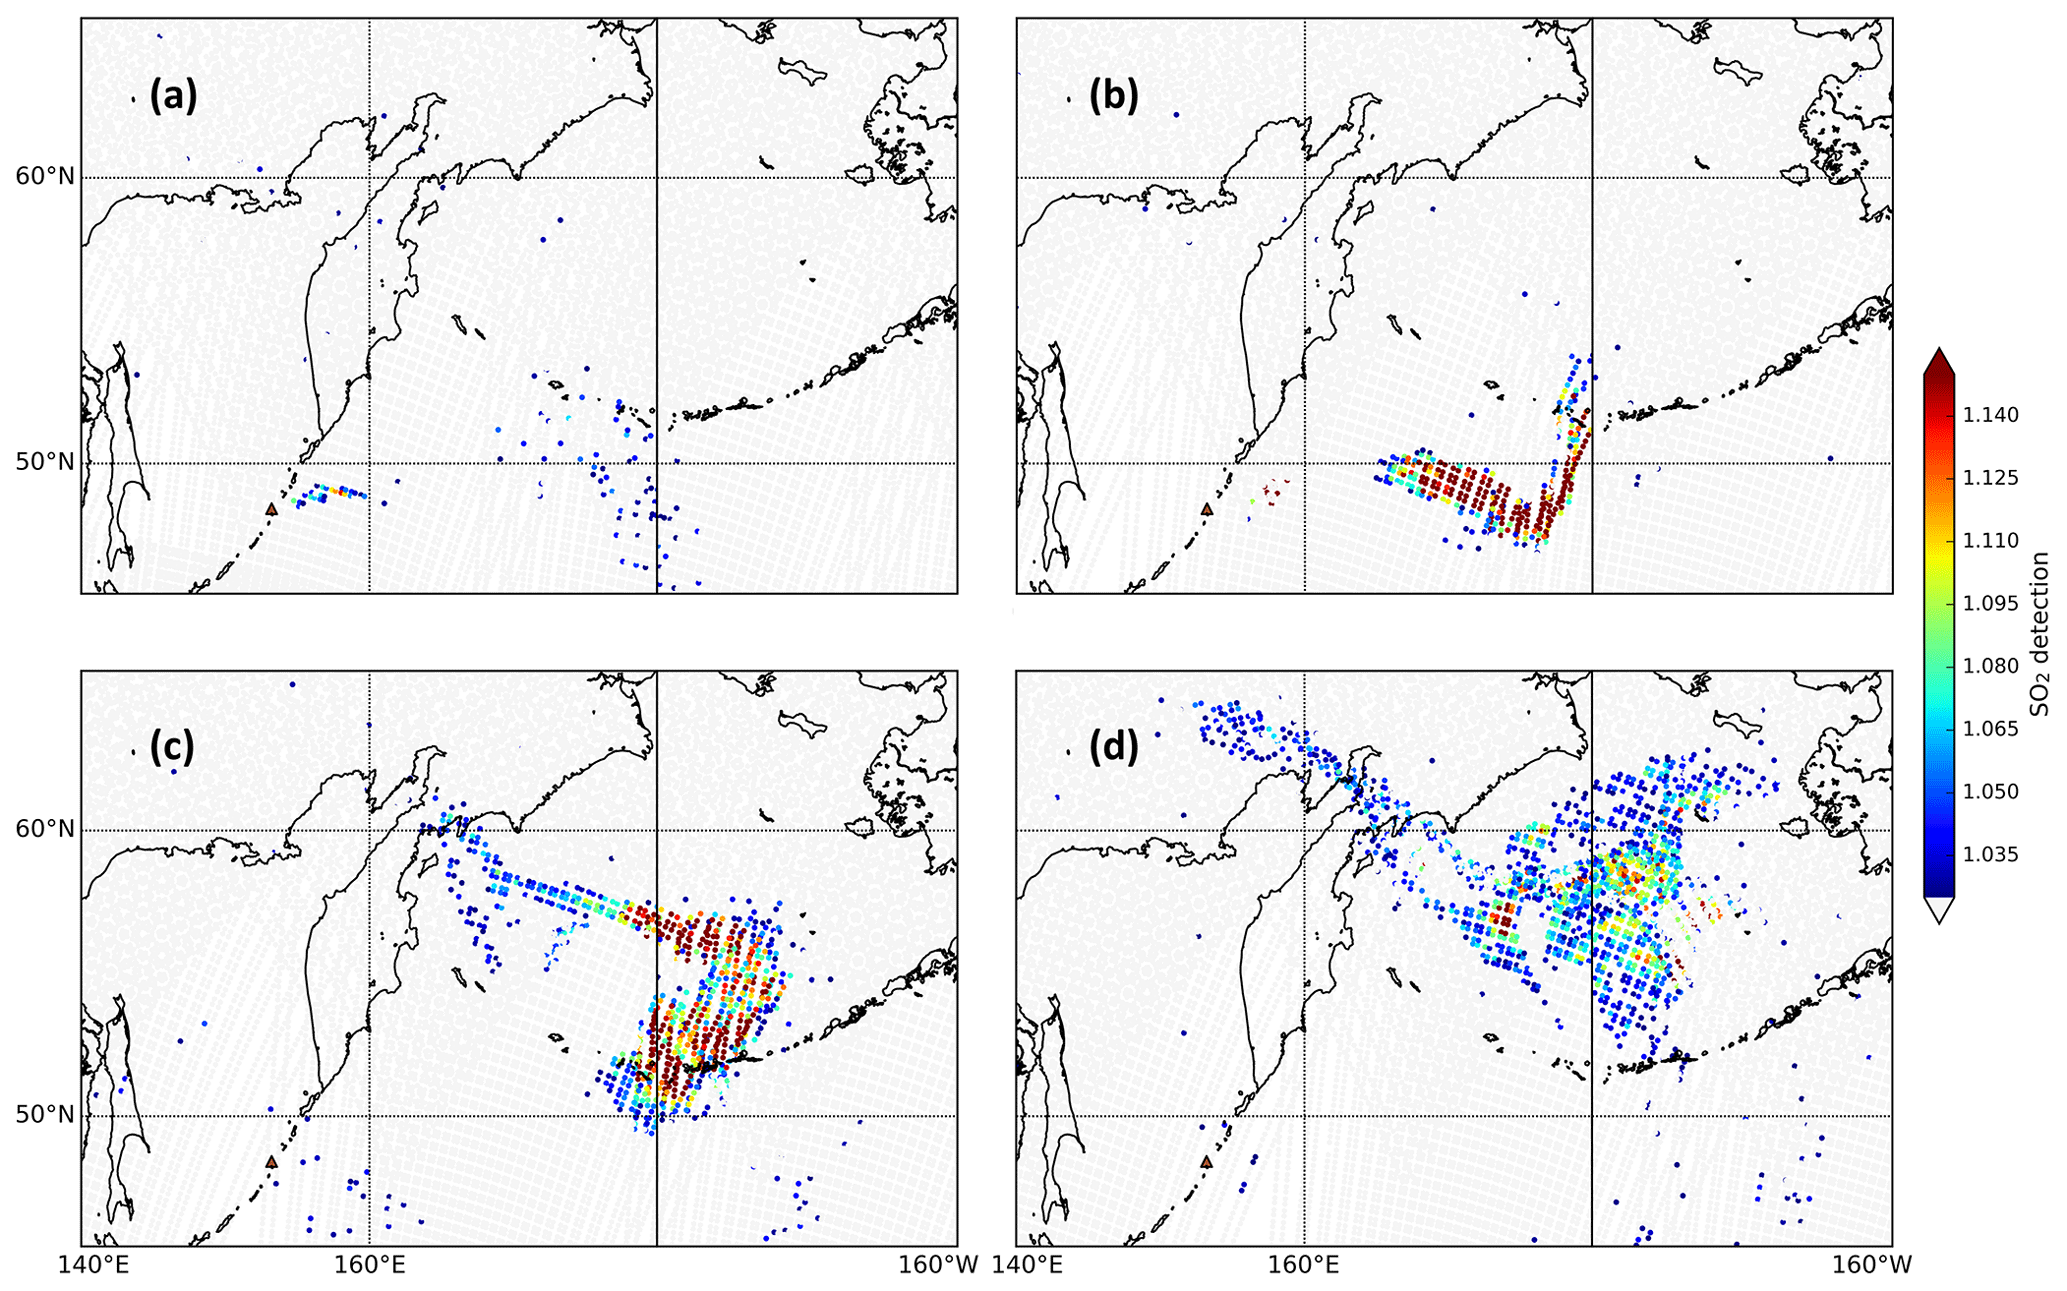
Figure 3IASI SO2 detections for the morning overpasses (about 09:00 LT) (a) for 22, (b) 23, (c) 24, and (d) 25 June 2019.
4.1 Injection and early dispersion of the Raikoke plume
Using a similar method to Kloss et al. (2020), we attempt an estimation of the injection height using Himawari infrared brightness temperature information at the moment of the main eruption and coincident temperature profiles from ERA5 reanalyses. The brightness temperature of the plume core (not shown) exhibits a plateau at about 225 K within a few hours after the eruption. However, the exact injection altitude could not be identified due to the fact that the temperature profile in the area of the Raikoke is quasi-isothermal in the altitude range between 10 and 24 km (see supporting material, Fig. A1a). Thus, a univocal attribution of the plume top height at the time of the main eruption is not possible using this method. With the exception of an overpass at around 49∘ N that intersected only a narrow tail of the volcanic plume at around 16–17 km altitude, there are no CALIOP intersections of the core plume during the early stage. An OMPS aerosol extinction profile, which was observed on 22 June 2019 02:26 UTC at 49∘ N and 154∘ E, displays an enhanced aerosol signal at ≈14 km altitude (supporting material Fig. A1b) that is compatible with previous estimates (e.g., Muser et al., 2020). A sequence of Himawari-8 infrared observations at 20 min intervals has been used to produce a GIF (GIF in the supporting material), which displays the complex pattern of plumes of gas and ash emitted by the successive explosions. The exact estimation of the injection altitude is evidently complicated. For the first Ulawun eruption we estimate an injection altitude between 15 and 19 km and for the second between 15 and 18 km, with Himawari brightness temperature and the corresponding ERA5 temperature profile (Fig. A2). These differ from the estimation derived from IASI (Sect. 2). CALIOP data (not shown) exhibit plumes up to 18 km for the first eruption and 18.5 km for the second eruption. The initial evolution of the Raikoke plume is shown with the Himawari Dust RGB images starting from 21 June 19:00 UTC (Fig. 2). The Dust RGB product is used instead of the Ash RGB product because it is more sensitive for large satellite viewing angles, which is the case for the region of interest for Raikoke. This product is based on the stronger absorption of ashes at 12 µm than at 10.4 µm, while it is the opposite for ice and liquid water and on the absorption by SO2 at 8.7 µm. It depends a lot on the size distribution of aerosols and ice crystals and provides only qualitative information (Millington et al., 2012). This plume is initially composed of ash (reddish colors in Fig. 2), with also some evidence of SO2 (yellow and bright green colors in Fig. 2). The remaining brownish and blueish colors indicate the presence of water- and ice-dominated clouds associated with the volcanic plume. Over 22 June, the plume disperses eastward of the volcano and separates into an ash-dominated component in the south and a SO2-dominated component in the north (see the two upper rows of Fig. 2). In the following days, the ash plume is rapidly diluted or sediments and cannot be further followed. The SO2 plume instead persists and, from 23 June, stops moving eastward to wrap upon itself and get trapped for several days within the cyclonic circulation of the Aleutian low which was exceptionally strong for this summer period. As a consequence, the confined plume remains compact and exhibits a number of dense patches and filaments that are well defined in the Himawari images, reaching locations as far as Alaska and central Russia, as visible from IASI observations (in the supporting material Fig. A3). CALIOP sections of these patches on 25 and 26 June (not shown) exhibit aerosol plumes up to 15.5 km. We find no confirmation of the rise to 22 km within a few days reported in the modeling study of Muser et al. (2020). After 25 June, the SO2 plume gets more diluted and is converted to sulfate aerosols. The presence of a compact SO2 plume, after ash removal, is supported by the strong detection of SO2; i.e., values significantly larger than 1.0 are obtained with the high-spectral-resolution observations of IASI, starting from 23 June 2019, at about 09:00 UTC (morning overpass, Fig. 3b). The intensity of the detection parameter decreases in the following days (Fig. 3c and d), as the plume dilutes and a part of the SO2 converts to sulfate aerosols.
4.2 The global dispersion of the Raikoke and Ulawun plumes with OMPS observations and WACCM simulations
After the first atmospheric processing following the injection in the UTLS, including the entrainment into the storm discussed in Sect. 4.1, the Raikoke plume entered the global, lower stratosphere. To study the global, stratospheric distribution of the enhanced aerosol layer during the year following the Raikoke eruption in June 2019, we use the OMPS-LP aerosol extinction observations for 1 year following the eruption (Figs. 4 and 5a) combined with WACCM simulations (Fig. 5b and c). We investigate the possible interaction between the Raikoke and Ulawun perturbations and their impact on the stratospheric aerosol layer properties and radiative balance.
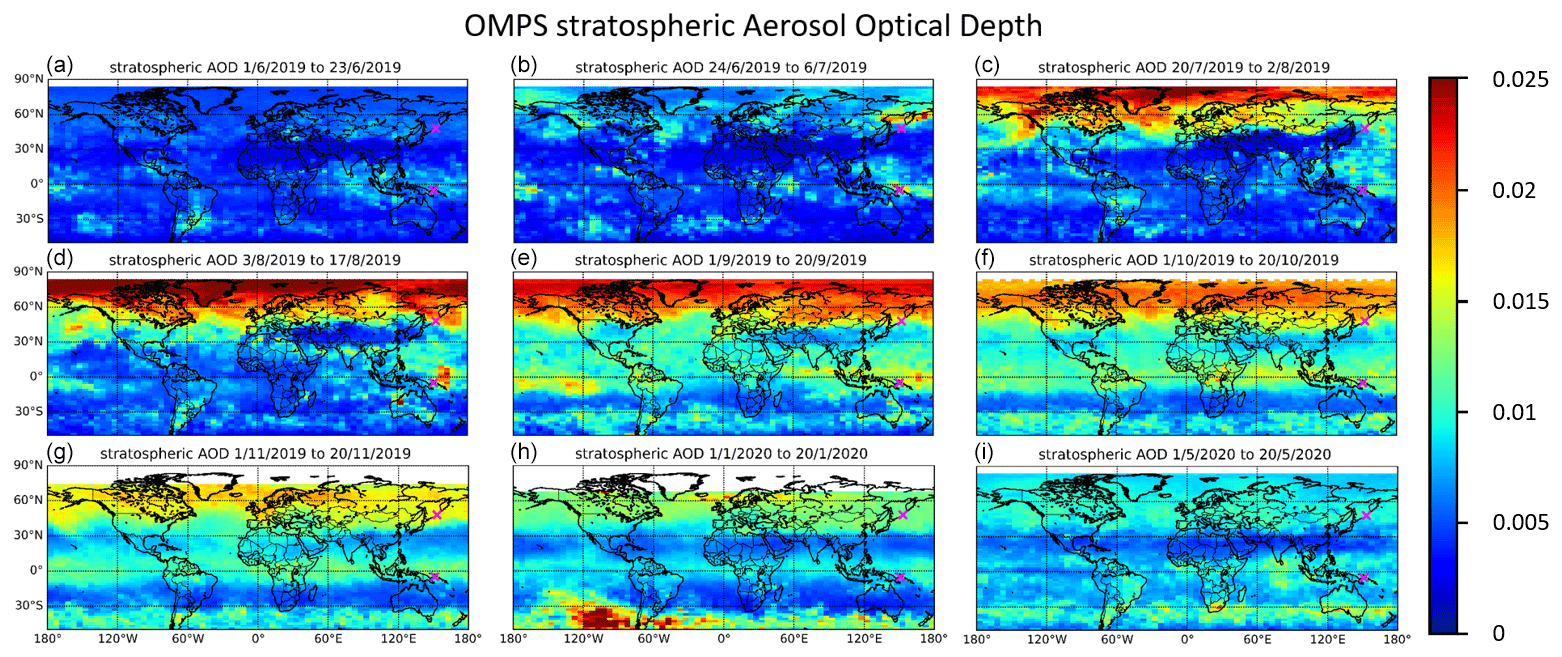
Figure 4Global OMPS (at 675 nm) sAOD averaged over the indicated time frames (a–i: June 2019 to May 2020). The locations of Raikoke and Ulawun are indicated with magenta crosses. White areas in the north are not covered by OMPS measurements.
The initial injection and early plume dispersion during the first week, seen in Figs. 2 and 3 with Himawari and IASI observations, are not as evident looking at the global view from OMPS (Fig. 4a). A blind stage like this for observational data was also found after the Sarychev eruption (Haywood et al., 2010). Figure 4b shows a first clear enhancement north of the Raikoke location spreading towards the east during the first week of July (more than 1 week after the initial injection). This enhancement of the aerosol extinction is most likely due to the conversion of the SO2 plume to sulfate aerosols (i.e., longitude dispersion occurred faster than the conversion to H2SO4). Enhanced sAOD values in Fig. 4b further west (i.e., above Europe) can be attributed to the plume from the Alberta fires in Canada from June 2019 (Jenner, 2019). During the following weeks and months the sAOD increases throughout all longitudes north of the Raikoke location. In August (Fig. 4d) the AOD is increased by around a factor of 5 compared to prior Raikoke conditions in Fig. 4a, reaching values larger than 0.025 for the integrated sAOD (calculated from the tropopause upwards). Starting from August an increase in AOD is also evident south of the Raikoke location. Even in the mid latitudes and tropics an enhanced signal is visible in Fig. 4d and e. This might result from an efficient transport within the horizontal circulation of the Asian monsoon anticyclone (AMA). This is supported by the fact that no aerosol enhancement is visible within the AMA core (Fig. 4c and d). A mixing from the aerosol plume from the second Ulawun eruption (3 August) is possible as well. From July to October (Fig. 4c–f) the transport barrier of the AMA leads to a low bias of sAOD values (i.e., air masses with increased aerosol do not pass into the area of the AMA). From September 2019 to May 2020 AOD values systematically decrease as the downwelling of the lower branch of the BDC in the NH (Northern Hemisphere) intensifies and due to wet/dry deposition once aerosols are back in the troposphere. However, values remain elevated compared to prior Raikoke conditions even nearly 1 year after the eruption (Fig. 4i). Elevated AOD values in the NH in January 2020 (Fig. 4h) point to polar stratospheric clouds related to the strong Arctic stratospheric vortex in winter 2020 (Lawrence et al., 2020).
Other than for Raikoke, OMPS detects elevated aerosol extinction values already during the days following both Ulawun eruptions. Figure 4b and d show enhanced sAOD values during the 2 weeks following each eruption. The second Ulawun eruption gives a higher AOD signal in terms of spatial extent and maximum value (by a factor of around 2, Fig. 4b and d). The aerosol plume from the first Ulawun eruption (23 June) mostly propagates eastwards at the Equator (Fig. 4b and c). The plume from the second eruption was distributed in both directions in the tropics (east and west, Fig 4d). The eastward transport dominates, which depends on the vertical distribution of the aerosol and the phase of the QBO (quasi-biennial oscillation) (Lee and Smith, 2003). During October and November (Fig. 4f and g) the tropical stratosphere is enhanced with increased aerosol extinction values. We estimate a circling of the Earth in the tropics of the second Ulawun eruption in the vicinity of 1 month. The tropical background aerosol 1 month after the Ulawun eruptions is increased by a factor of around 3, reaching sAOD values as high as 0.02, in a very limited latitude range. In May 2020 the AOD signal in the tropics remains enhanced. We attribute enhanced sAOD values from August 2019 onwards south of 30∘ S, which are clearly separated from the increased values in the tropics, to a horizontal tropopause crossing, originating from the Ulawun eruptions (further discussed below). During the end of 2019/beginning of 2020 historically severe wildfires occurred in Australia. Through the formation of pyro-convection a significant part of smoke particles was injected into the stratosphere (Khaykin et al., 2020; Ohneiser, 2020). Most of the enhanced AOD in the SH in Fig. 4h and i originates from those fires, likely mixing with the remaining enhanced aerosol signature from the Ulawun eruptions. While in this study we focus on the complex situation of the global transport of the Raikoke and Ulawun aerosol plumes in the tropics and NH, the global impacts of the Australian fires have mostly been in the lower stratosphere in the SH (Southern Hemisphere). They pose a unique example of stratospheric perturbation from an extreme wildfire event and should be investigated in a separate study.
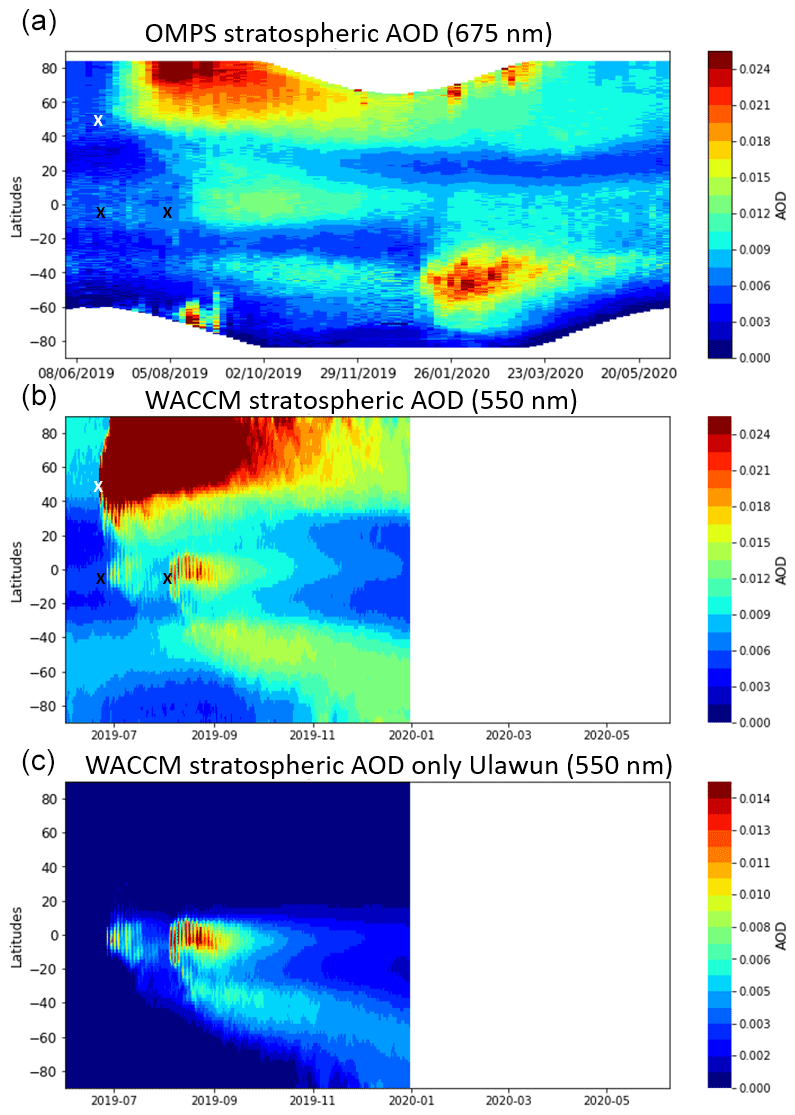
Figure 5Latitude/time global distribution of the longitude-averaged sAOD. (a) For OMPS observations and (b) the integrated stratospheric column for the WACCM simulation for both eruptions and (c) for the Ulawun-only WACCM simulations. Crosses symbolize the position and timing of the eruptions, white for Raikoke and black for Ulawun. The WACCM sAOD is shown here for sulfate only, i.e., with no condensation of water, to eliminate the signature of PSCs in the winter hemisphere, which would likely mask the signature of the plume closer to the pole.
Another representation of the horizontal distribution and evolution of sAOD (latitude–time Hovmöller plots, averaged over all longitudes) is presented in Fig. 5a for OMPS observations and Fig. 5b and c for the WACCM simulations. While OMPS observations show a clear increase of AOD only around 1 month after the eruption north of the Raikoke position (48∘ N), WACCM already gives a strong signal during the initial injection (Fig. 5b). During the first few months (until October) WACCM sAOD values are significantly larger. These deviations may be due to different reasons. In part, this depends on the different wavelengths of OMPS observations and WACCM outputs: 550 nm for WACCM and 675 nm for OMPS. The lack of ash emissions in the WACCM simulations also causes different dynamics of sulfate aerosols formation. This is a well-known effect in volcanic eruption modeling, and similar deviations between limb observations and modeling of sulfate aerosol plumes build-up have been observed, e.g., for the Sarychev eruption (Haywood et al., 2010, see their Fig. 5). Furthermore, the AOD values from the model simulation seem to decrease faster (October–December 2019) than for OMPS. For both Ulawun eruptions (26 June and 3 August), OMPS data show some AOD perturbations after the first eruption and more significantly elevated values after the second eruption. Like for the Raikoke eruption, WACCM shows immediate and stronger signals during the weeks following the eruptions, but decreasing faster. While for OMPS observations a significant impact (sAOD around 0.01) of the second Ulawun eruption is still apparent in the tropical stratosphere by the end of the year 2019, in the model comparable values are found in October. By the end of 2019 the sAOD has values down to 10 times smaller than for OMPS. The model shows a faster decrease. Using the modeling capabilities, we have isolated the impact of the Ulawun plumes (Fig. 5c) to analyze the possible cross-impact of the Ulawun eruptions in the northern regions, which are already affected by the Raikoke eruption and, vice versa, to detect a possible impact of the Raikoke plume in the tropics and SH. As described for Fig. 4 the AOD enhancement starting from July 2019 at 40∘ S is clearly separated from the Ulawun impact on the tropical stratosphere and can result from a horizontal tropopause crossing of the aerosol plume towards the south (Fig. 5a). This hypothesis is confirmed by the model simulation in Fig. 5b and c, where only volcanic sources of stratospheric aerosols are considered. However, it has to be noted that WACCM simulations reveal elevated sAOD values in the SH originating from the Raikoke eruption (see also Fig. B1). Such a feature is not confirmed with CLaMS passive air mass tracer simulations (not shown). For an accurately defined altitude level of tropopause crossing more analysis would be needed, which goes beyond the scope of this study. A similar enhancement due to tropopause crossing in the north from the Ulawun plume would possibly interfere with the interpretation of the global distribution of the Raikoke plume. However, the Ulawun-only simulation of Fig. 5c indicates that very limited to no transport of the Ulawun plume occurred to the north via an horizontal tropopause crossing. Because the influence of the Ulawun eruption on the SH seen by OMPS is well reproduced by the model, we trust this conclusion. However, a transport during the winter months (November/December/January) also towards the north within the BDC, as seen following the Ambae eruption in 2018 (Kloss et al., 2020), is likely. Even though such a feature is not clearly visible in OMPS observations (Figs. 4 and 5a), we believe that an already enhanced aerosol layer in the north (following the Raikoke eruption) masks this transport towards the north in the winter months. By the end of the year, WACCM simulations in Fig. 5b and c show low sAOD values, which is why the model data potentially miss this feature as well. Consequently, we cannot rule out that Ulawun air masses have interfered with the evolution of the Raikoke plume. Figure 5b shows higher sAOD values in the tropics and SH compared to Fig. 5c. Hence, the Raikoke eruption had a significant impact on the tropical stratosphere. The sAOD for the respective Raikoke WACCM simulation is presented in the supporting material (Fig. B1). As also seen in Fig 4h, the enhanced aerosol signature starting from the end of 2019 in the SH is attributed to the aerosol plume of the Australian wildfires 2019–2020.
Discrepancies between the model output and OMPS observations are expected, especially following the Raikoke eruption, for the following reasons. WACCM does not account for ash particles. In a recent study by Muser et al. (2020) a burden of 0.4–1.8×10⁹ kg is estimated for ash particles (with a diameter <32 µm). Whether ash is included or not determines the chemical evolution, dynamics and aerosol load. The WACCM simulations can therefore only be seen as a pure sulfate point of view with the associated limitations. Furthermore, the determination of the altitude range of the plume injection is very challenging. The injection altitude in WACCM is based on satellite observations. However, as discussed in Sect. 4.1, the exact determination of the injection altitude is impossible, at least for the specific atmospheric conditions during the Raikoke eruption. The plume dispersion and its chemical/microphysical evolution depend strongly on the initial injection altitude (Lachatre et al., 2020). Any information about the SO2 injection altitude cannot be derived from ash because different altitude levels can be reported for SO2 and ash (Vernier et al., 2016). The same goes for timing and burden of the plume injection. Here, we assume an evenly distributed injection (vertically and time-wise), which is a necessary simplification of reality where pulses in injection altitude and magnitude are inevitable. The sulfate burden injected was taken from the SSiRC community based on the IASI data set, which agrees well with estimations from Muser et al. (2020) with from TROPOMI and 1–2×10⁹ kg for Himawari-8. It can be assumed that different instruments and models with different setups will come up with varying values for the burden (as seen after the Sarychev eruption, e.g., Günther et al., 2018; Kristiansen et al., 2010; Krotkov et al., 2010). The issue of different models and instruments leading to different scientific conclusions is addressed in Fromm et al. (2014). Other aerosol sources (e.g., from other, minor volcanic eruptions or dust) are not included in the model. For OMPS, we use the full, non-filtered data set of aerosol extinction values. Hence, cloud signatures are potentially included in the observations, but excluded for the WACCM simulation. Furthermore, the sampling of any observational instrument compared to that of a global model is not comparable. The WACCM global simulations are performed twice a day while OMPS reaches a global coverage every ≈3 d. The sampling bias could be prevented by sampling WACCM data according to the OMPS orbit. However, while this bias can mean that very local features are missed by OMPS, it cannot explain time delays on the order of weeks. Despite these differences, the general dynamics of sulfate aerosol formation/removal, from observations and simulation, is rather consistent in terms of the impacted latitude bands.
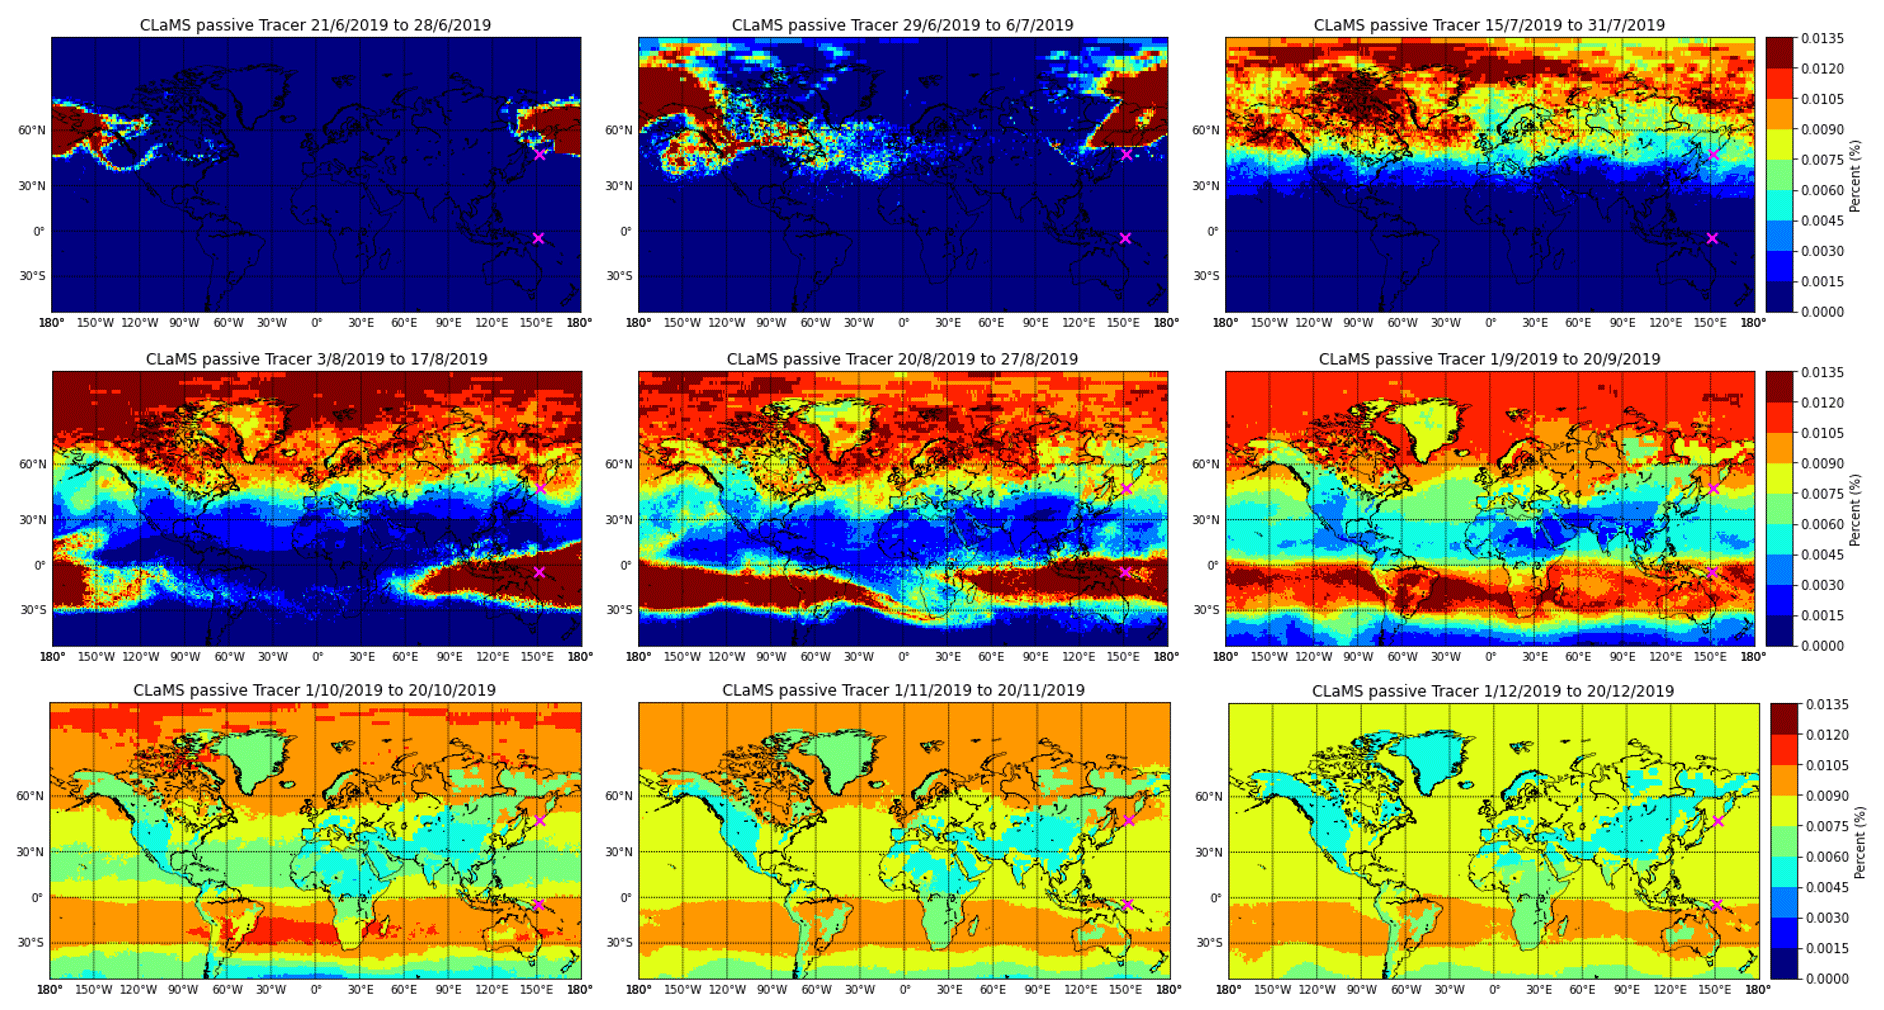
Figure 6Mean column air mass fraction from the Raikoke and Ulawun plumes, calculated from integrating the passive CLaMS air mass tracers over all vertical levels. The two main eruptions (Raikoke 21 June and Ulawun 3 August) are equally included. Initialized boxes are selected according to Himawari and IASI observations. The Raikoke eruption is initialized from 23–24 June, 163∘ E–170∘ W, 49–62∘ N and 335–460 K. The Ulawun eruption is initialized from 3 to 4 August, 137–178∘ E, 10∘ S–5∘ N and 350–385 K. The magenta cross symbols indicate the locations of the two volcanoes.
4.3 The global distribution of the Raikoke and Ulawun plumes with a passive air mass tracer
A complementary overview of the dynamics of both volcanic plumes, once injected into the UTLS, is given using an air mass origin tracer with CLaMS (Fig. 6). We choose two initialization boxes in space and time corresponding to the rough respective injection locations of the volcanic plumes. For the Raikoke eruption the initialization box is chosen according to observations by Hedelt et al. (2019) (at 11–18 km, 335–460 K, from 163∘ E to 170∘ W and 49–62∘ N for 23 to 24 June 2019). This is equivalent to the position of the plume during the storm entrainment (see Figs. 2 and 3). For simplicity, we ignore the minor impact of the first Ulawun eruption (from 26 June). For the larger eruption at Ulawun (3 August), we define a rough injection box from 137–178∘ E, 10∘ S–5∘ N from 14 to 17 km altitude, 350–385 K, on 3 and 4 August 2019. After initialization, the tracer is advected passively during the subsequent months. This simulation is a simple way of illustrating the plume's global transport in the UTLS throughout the weeks following the respective eruptions, integrated over all altitudes. The simulation cannot be taken for quantitative estimations for the following reasons. First, the chosen initialization is given in a box shape, whereas the real injection does not appear in the shape of a box. Therefore, many trajectories in this simulation do not necessarily correspond to an actual plume air parcel during injection. Second, in this simulation we use a passive tracer, with no chemical/microphysical processes being taken into account. Finally, the injected burden and related quantitative factors are not accounted for in the CLaMS simulations, as the Raikoke and Ulawun air mass tracers are equally represented. However, as CLaMS transport is driven by the newest reanalysis (ERA5), the simulation provides a reliable diagnostic of the air mass transport from the volcano region (initialization box).
Once initialized after the Raikoke eruption, the air mass tracer is transported towards the east, which is consistent with OMPS observation (see Fig. 4). By mid-July (roughly within 3 weeks after the eruption), the plume tracer has circled the Earth at latitudes mostly north of the Raikoke location. At the beginning of July the main bulk of the air mass tracer remains west of the Atlantic Ocean, with only a minimal impact above southern Europe (Fig. 6, second panel). Therefore, the sAOD enhancement above northern Europe observed by OMPS in Fig. 4b does likely originate from other sources than Raikoke (e.g., from forest fires in Alberta, Canada). The plume air mass transport is qualitatively consistent with OMPS observations, as by the end of July (Fig. 4) enhanced AOD values are apparent throughout all longitudes, mostly north of the Raikoke position. For the CLaMS simulation a clear signal of the tracer is visible around the area of the AMA from end-July until mid-September, which is also consistent with OMPS data (Fig. 4c–e). By mid-August a small percentage of the initialized Raikoke tracer has reached the tropics in the CLaMS simulations. Such a transport can also be seen from OMPS and WACCM data in Fig. 5a and b in July/August 2019 (with sAOD values below 0.01 for OMPS). As seen for OMPS data, the plume tracer initialized according to the second Ulawun eruption is transported eastwards and westwards, with a dominating component towards the east. The CLaMS air mass tracer suggests a circling of the Earth in the tropics within less than 1 month (which agrees with OMPS data; cf. Sect. 4.2). Already during the first month after the Ulawun eruption in August, the simulation with CLaMS suggests that an overlapping of air mass tracers for the Raikoke and Ulawun eruptions is possible in the tropics. Starting from September the air mass tracer for the Ulawun eruption remains largely in the tropics (between 0 and 30∘ S), slowly expanding towards the north and south.
Even though CLaMS simulations neither take any chemical/microphysical processes into account nor possible lifting due to aerosol–radiation dynamics (suggested to play a crucial role for the Raikoke eruption in Muser et al., 2020), comparisons show that the horizontal passive tracer distribution from the ClaMS simulation illustrates the effect of passive transport for plume dispersal.
4.4 Vertical distribution
Figure 7 shows the vertical distribution of aerosol extinction values and its evolution, around the location of the volcano. The initial injection phase after the Raikoke eruption is more evident for the WACCM simulation than for OMPS observations (Fig. 7a and b). In the model, the aerosol plume rises from around 15 to 20 km altitude during the month following the eruption, while OMPS shows maximum altitude values of the aerosol plume rise with a slower rate from around 15 to 22 km altitude (1.5 km per month). The approximate descending rate in OMPS data, from November 2019 to February 2020, of around 2 km per month reflects a contribution from both sedimentation processes and the descending branch of the BDC. Increasing aerosol extinction values in spring 2020 around the tropopause are a recurrent seasonal feature, independent of Raikoke perturbation.
For the August eruption of Ulawun, both WACCM and OMPS show a plume rising up to 19 km (first eruption) and 20 km (second eruption), directly after the respective eruptions (Fig. 7c and d). A subsequent transport to ≈21 km in the area around the volcano is also shown in observations and reproduced in the model. One month after the eruption, the signal of the dispersed plume is at higher altitudes in the observations than in the model. This can potentially reflect an underestimation of the amount of SO2 initially injected in the model. As seen in Fig. 5, OMPS reveals increased aerosol extinction values even 10 months after the second Ulawun eruption, while WACCM values seem almost back at background conditions within 5 months. The large differences between OMPS observations and the WACCM simulation seen in the troposphere can be explained by clouds and other tropospheric sources of aerosols, which are not included in the model. We focus on the transport in the lower stratosphere rather than the troposphere; therefore, those differences are of no interest in this study.
The panel series in Fig. 7e shows, in a similar manner to what is shown in Chouza et al. (2020) (in their Fig. 7, using CALIOP data), the vertical distribution of mean aerosol extinction OMPS values averaged over all longitudes for each month from June to December 2019. Following the Raikoke eruption, a clear enhanced aerosol extinction signal is visible north of the Raikoke location (48∘ N), rising from ≈16 to 17.5 km from July to August (≈1.5 km per month: ≈0.3 mm s−1). A clear rise up to altitudes at around 25/26 km from the Raikoke plume as discussed in Chouza et al. (2020) is not apparent in Fig. 7e. Slightly enhanced aerosol extinction values following the Ulawun eruption appear in the tropics in August at above 17 km. The Ulawun plume remains largely in the tropics and rises within the ascending branch of the BDC (≈1 km per month: from September to December).
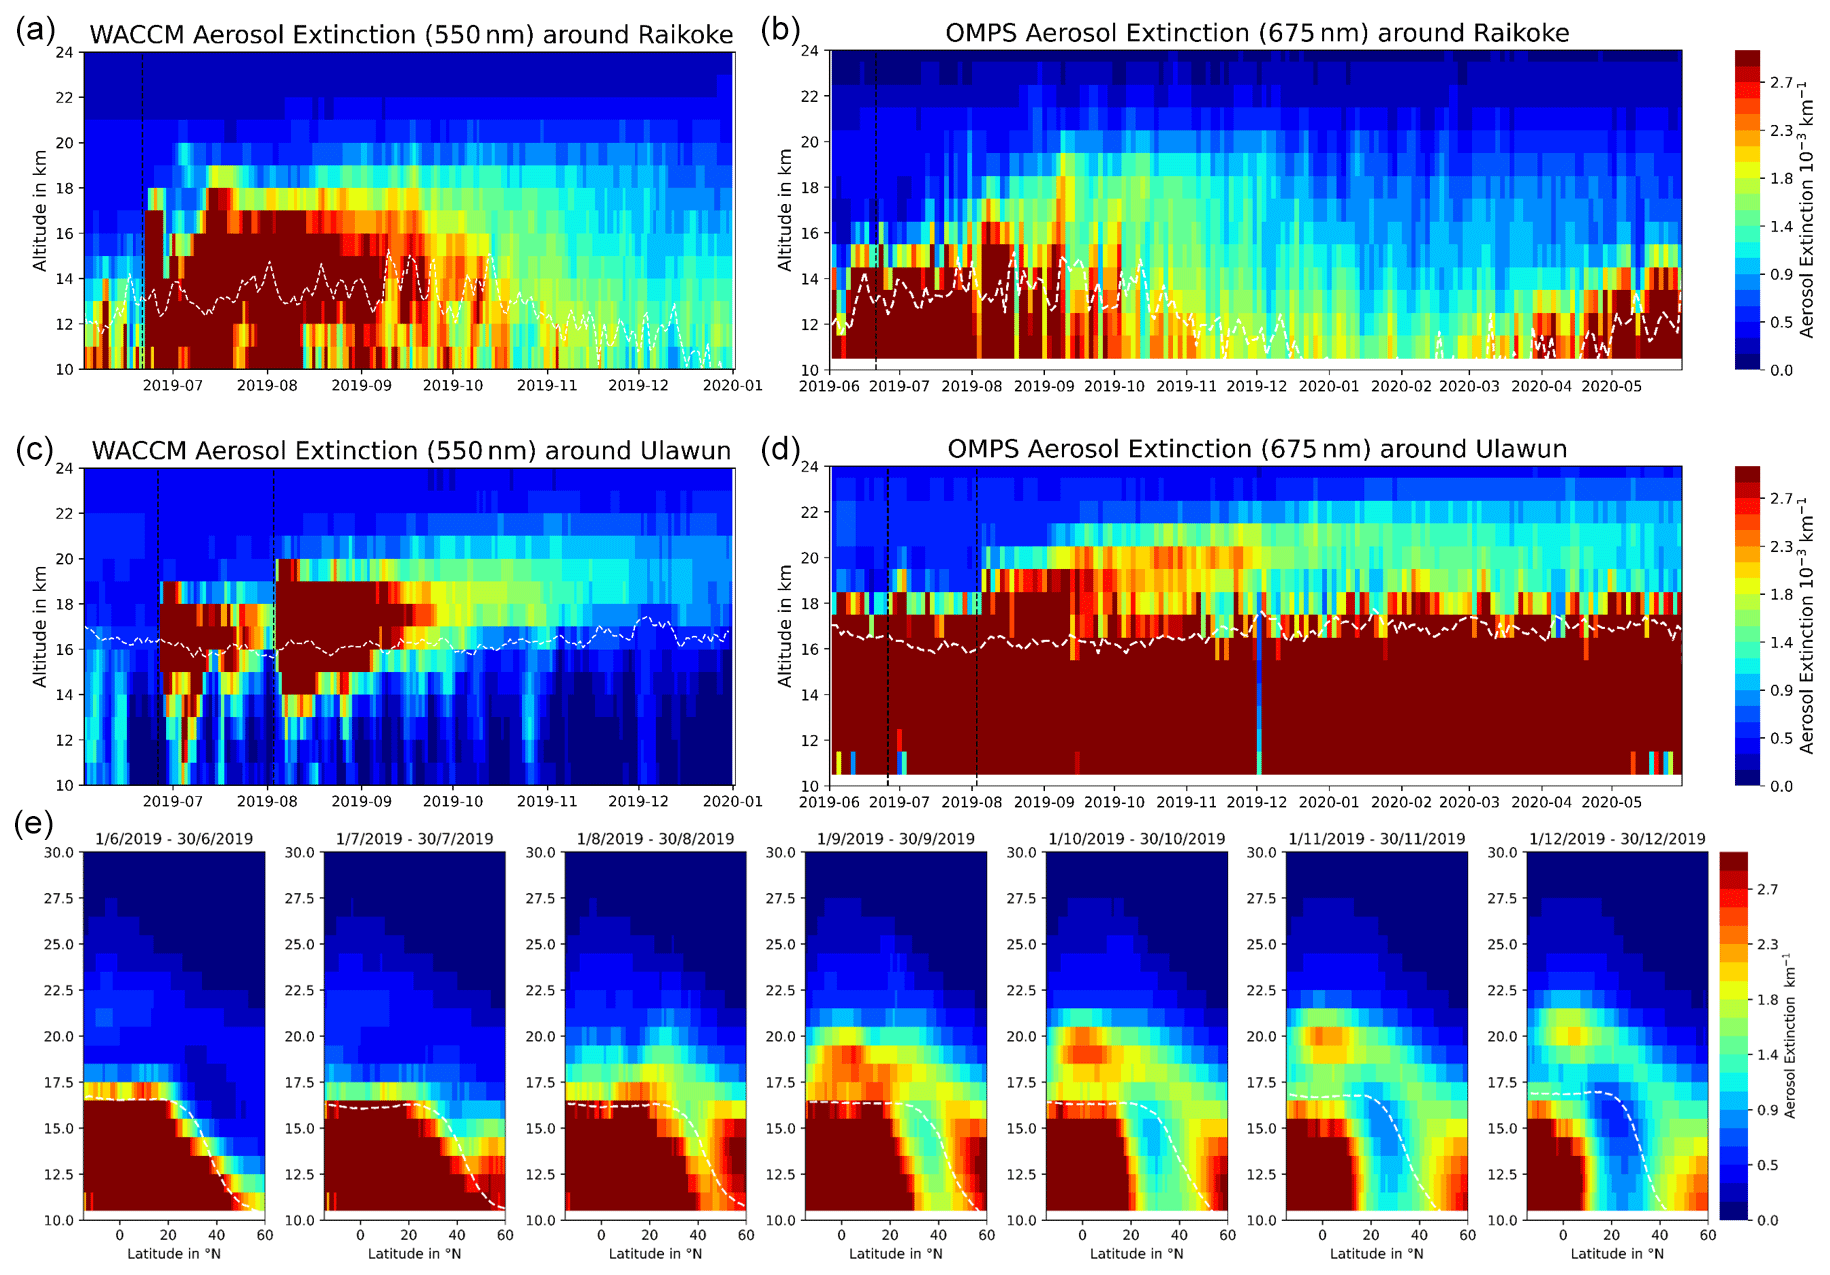
Figure 7Vertical aerosol extinction distribution at the location of the volcanoes. (a) WACCM simulation around the Raikoke location (30–55∘ N and 145–175∘ E) and (b) OMPS observations, respectively. (c) and (d), respectively, for the Ulawun eruption (0–10∘ S and 145–175∘ E). The timing of the Raikoke and both Ulawun eruptions is indicated by the black, dashed lines. (e) OMPS aerosol extinction monthly averages over all longitudes from June to December 2019. White dashed lines represent the averaged tropopause altitude.
4.5 In the context of other recent events (2017–2020)
Figure 8 shows mean sAOD estimations for OMPS, SAGE III/ISS and in situ LOAC observations from France. The mean sAOD from the OMPS and SAGE III/ISS aerosol extinction observations are at 675 and 676 nm, respectively. The dense sampling, reaching high latitudes from OMPS, gives confidence in the representation of the overall AOD evolution (Fig. 8a). While we present 3 d averages for the OMPS data set, we calculate 30 d averages for SAGE III/ISS to account for the much sparser sampling of SAGE III/ISS.
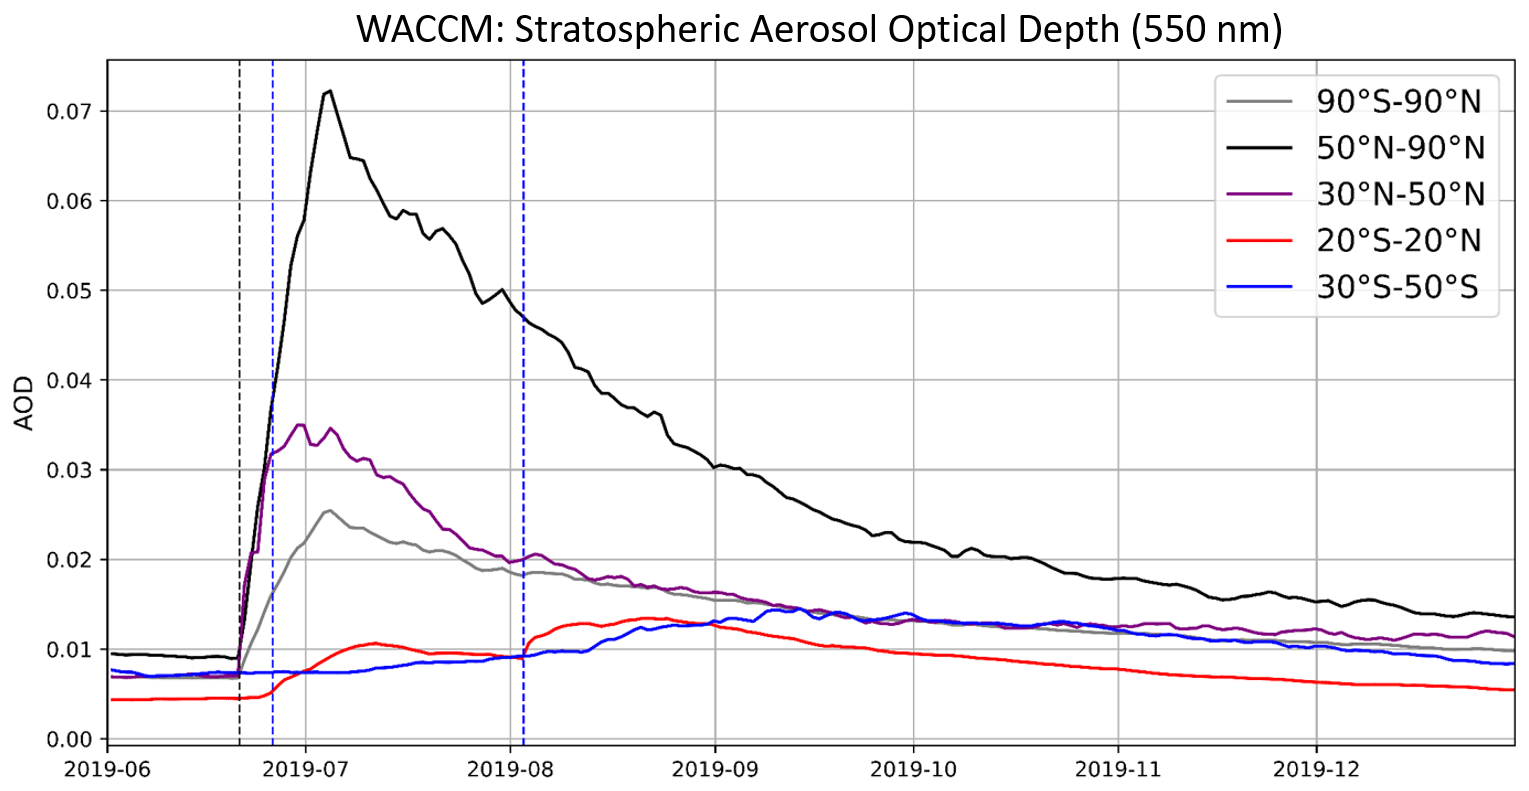
The timing and total value of sAOD enhancements for OMPS and SAGE III/ISS (Fig. 8a and b) following the Canadian wildfires in 2017, the Ambae eruptions in 2018 and the Raikoke/Ulawun eruption in the different latitude bands agree very well. Observed peak sAOD values by SAGE III/ISS are by ≈10 % higher than OMPS values for most latitude bands, which is consistent with the difference of ±10 % found by Chen et al. (2019) following the Ambae eruption. Peak values in the 30–50∘ N latitude band are significantly higher following the Raikoke eruption for SAGE III/ISS values, which is likely due to the sparse sampling. Compared to the sAOD impact of the Canadian fires in 2017, the Raikoke eruption led to 2.5 times higher AOD peak values north of 50∘ N (for OMPS and SAGE III/ISS data in Fig. 8a and b). Particular sAOD enhancements from the two stratospheric fire events in 2019 (Alberta in June and Siberia in July) are not visible. The Raikoke plume has likely mixed with the plumes of the fire events, however, compared to Raikoke the fire signature is small. The impact of the Ulawun eruption on the tropical sAOD from OMPS is by a factor of around 1.5 higher than what was observed for Ambae (factor of 1.8 with SAGE III/ISS data). For the past 3 years, including the impact of the Canadian fires, Ambae eruption and Australian fires on the sAOD, the Raikoke and Ulawun eruptions have had the highest impact on NH sAOD levels. Even 1 year after the eruptions, AOD values at latitudes higher than 50∘ N are elevated and comparable to sAOD values from the peak phases of the Canadian fire event. Other similar comparisons 1 year after the Raikoke and Ulawun eruption are not possible, because of the impact of the recent Australian wildfires (AOD increases seen from end of 2019 onwards). OMPS and SAGE III/ISS data suggest a comparable but smaller sAOD impact for the Australian fires than for the Raikoke eruption (30–50∘ S compared to 50–90∘ N).
A similar representation of the sAOD as seen in Fig. 8a and b with the WACCM simulation is shown in the supporting material (Fig. C1). Peak to pre-eruption AOD values (around 0.025–0.0075 at 550 nm) for WACCM are by a factor of ≈2 higher than what is observed with OMPS and SAGE III/ISS (around 0.0125–0.005 at 675 nm). Discrepancies in terms of AOD extent and timing compared to OMPS and SAGE III/ISS observations are also shown in Fig. 5 and explained in Sect. 4.2.
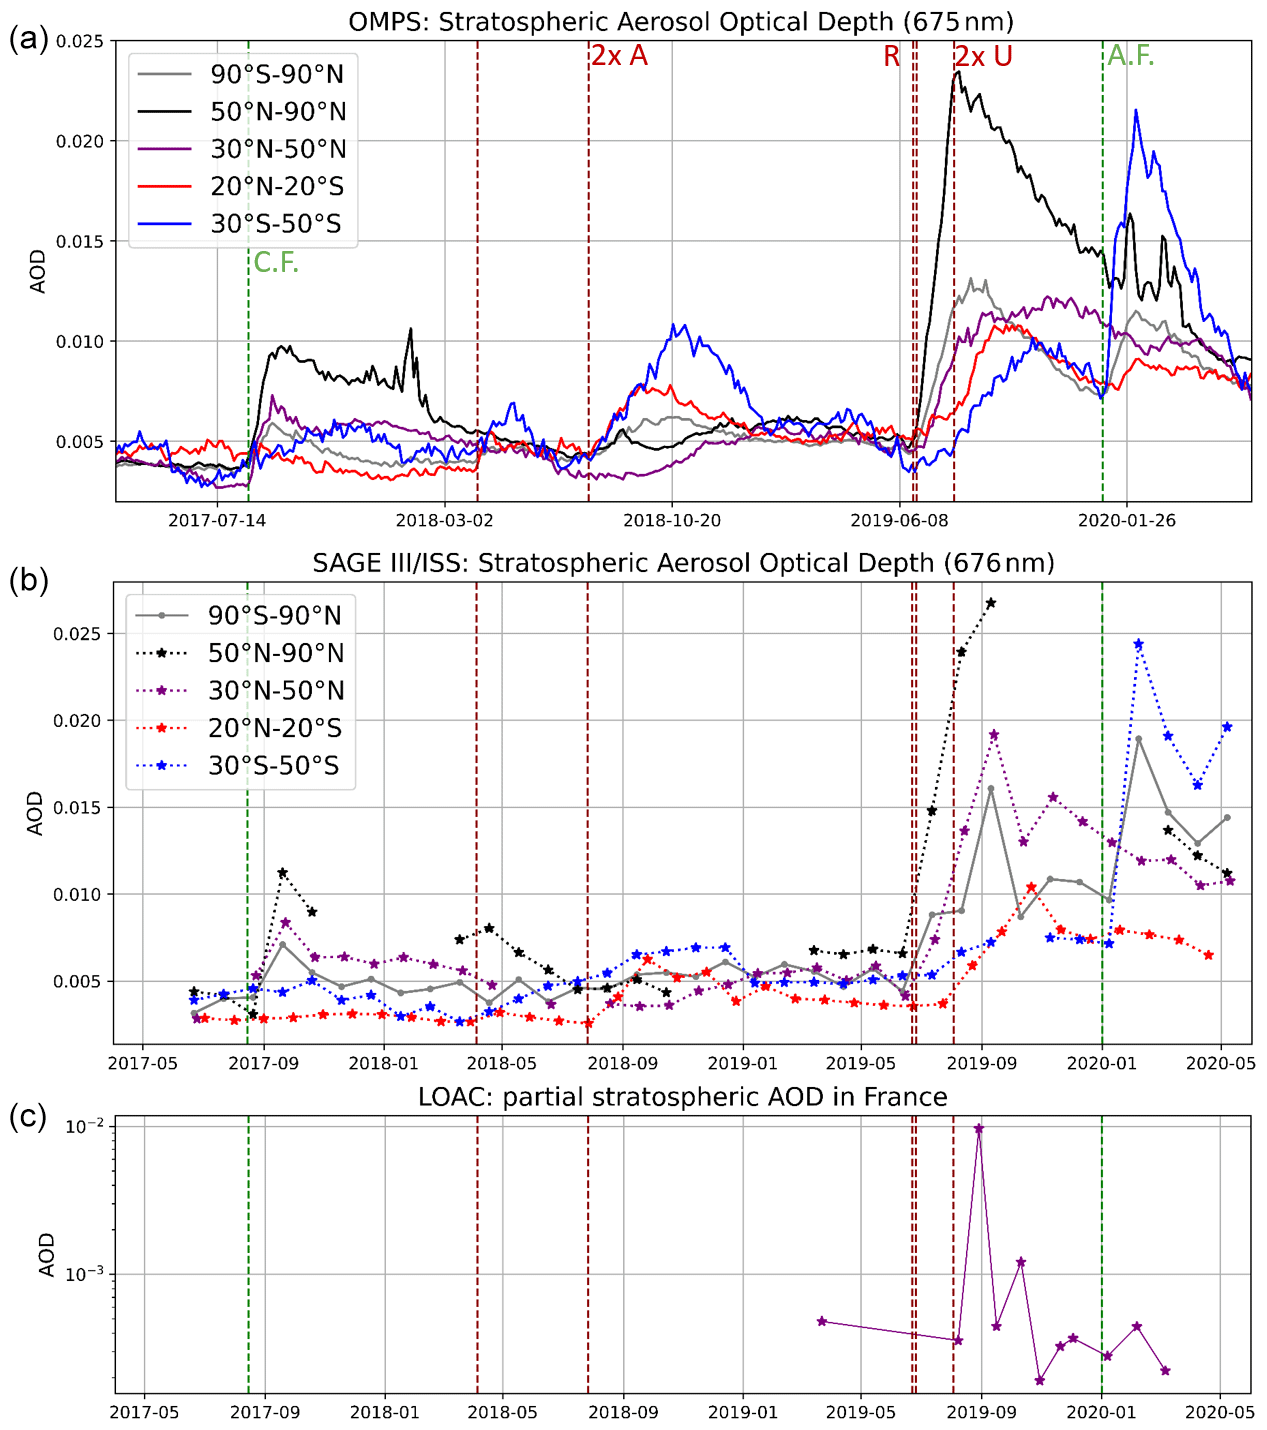
Figure 8(a) 3 d mean sAOD from OMPS aerosol extinction values (from tropopause altitude up to 30 km) averaged over five latitude ranges (global, 50–90∘ N: north of Raikoke, 30–50∘ N: south of Raikoke, 20∘ S–20∘ N: tropics and 30–50∘ S: SH, respectively). Vertical lines represent the event dates of the Canadian fires (C.F.), both Ambae eruptions (2xA), the Raikoke eruption (R), both Ulawun eruptions (2xU) and the Australian fires (A.F.). (b) Same as (a) but with SAGE III/ISS measurements for 30-day averages. The maximum value is an average over the month of September (30 August–29 September 2019) with 221 measurement profiles in a latitude range from 50 to 61∘ N (black line in (b)). The respective averaged AOD for August (31 July–30 August 2019) considers 51 profiles from 50 to 58∘ N. (c) Derived partial sAODs for balloon-borne LOAC aerosol concentration observations from Ury in France, for particle sizes from 0.2 to 0.7 µm from the tropopause up to 23 km altitude.
LOAC in situ observations in central France (Fig. 8c) show a maximum AOD value in August, which coincides with the satellite observations in Fig. 8a and b. Furthermore, this is consistent with Fig. 4, which also shows enhanced sAOD values above France in August 2019. For LOAC, only partial AOD (in terms of particles size) have been derived for LOAC in situ data, i.e., in the range from 0.2 to 0.7 µm, to avoid spurious aerosol extinction enhancements resulting from the presence of low-concentrated micrometer-sized particles, for instance coming from the balloon flight chain above the instrument or corresponding to the “background” meteoritic population (e.g., Renard et al., 2008; Murphy et al., 2014). As a result, the LOAC AOD values cannot be directly compared with OMPS. The in situ AODs reveal a significant enhancement over the 2019 summer–fall period above France. Following the Raikoke eruption, the in situ data present an oscillating behavior with some low values in late 2019 (especially the October measurement in Fig. 8c). This could reflect the sparse and very local sampling of in situ observations and could also be explained by a still inhomogeneous volcanic plume at this period. The slight increase in the observed AOD in the southernmost latitude band in April 2019 can be related to remnants of the midlatitude signature of the Ambae eruption (Kloss et al., 2020) and could reflect that background aerosol conditions were not reached in the stratosphere for the period before the Raikoke eruption, which is consistent with OMPS and SAGE III/ISS observations in Fig. 8a and b.
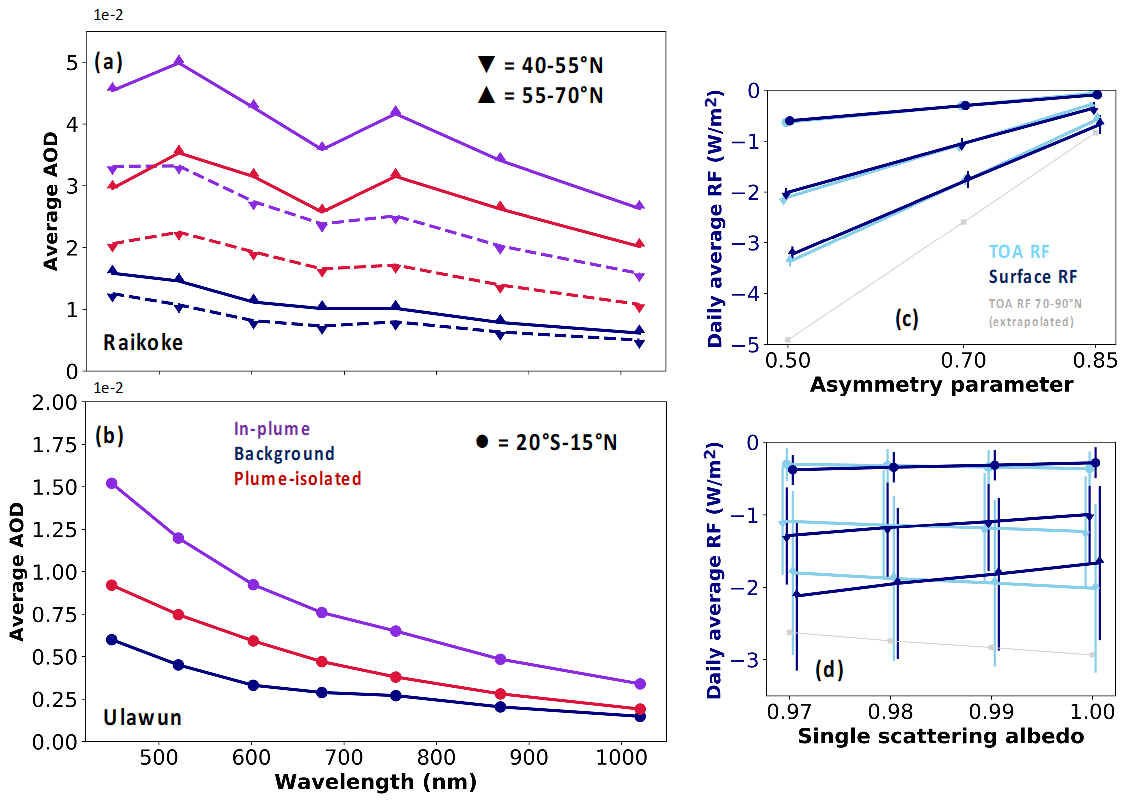
Figure 9(a) Average SAGE III/ISS sAOD vs. wavelength (from tropopause to TOA) attributed to Raikoke (average over the period from the eruption to the end of September 2019, violet lines), corresponding background (1 to 15 September 2018, blue lines) and Raikoke plume-isolated (Raikoke – background, red lines), in the latitude bands 40–55∘ N (downward triangle and dashed lines) and 55–70∘ N (upwards triangle and solid lines). (b) Average SAGE III/ISS stratospheric AOD vs. wavelength attributed to Ulawun, second eruption, in August 2019 (average in the period from the eruption to the end of November 2019), corresponding background (15 to 30 June 2018, blue lines) and Ulawun plume-isolated (Ulawun – background, red lines), in the latitude bands 20∘ S–15∘ N (circles), same color code as panel (a). (c) Equinox-equivalent clear-sky daily average radiative forcing, at TOA (sky blue symbols and lines) and surface (dark blue symbols and lines), as a function of the hypothesis on the asymmetry parameter (and averaged over all single scattering albedo hypotheses), for Ulawun (at 20∘ S–15∘ N, circles) and Raikoke (at 40–55∘ N, downward triangles, and at 55–70∘ N, upward triangles). An OMPS-based extrapolation of the radiative forcing at 70–90∘ N is also shown with grey squares and lines. Error bars are a measure of the variability of the RF estimations with the different hypotheses on SSA. (d) Same as (c) but as a function of the assumptions on the single scattering albedo (and averaged over all asymmetry parameter hypotheses). Error bars are a measure of the variability of the RF estimations with the different hypotheses on the asymmetry parameter.
The multispectral SAGE III/ISS observations are used to further characterize the optical properties of the Raikoke and Ulawun plumes and to estimate their radiative forcing (RF). Despite their sparser spatiotemporal sampling, with respect to OMPS, the solar occultation geometry of SAGE III/ISS observations is associated with a better signal-to-noise ratio. Figure 9a and b show the average Raikoke- (panel a) and Ulawun-attributed (panel b) SAGE III/ISS sAOD, at the different available wavelengths between about 449 and 1020 nm. The Raikoke-perturbed spatiotemporal interval has been considered to be the longitude-integrated latitude bands between 40 and 70∘ N, in the period from the eruption to the end of September 2019. While at periods later than September 2019 the stratosphere is expected to still be somewhat perturbed by the late Raikoke plume, the selected period is chosen to be representative for both peak and declining volcanic perturbation (see Fig. 5a). To get a more detailed characterization of the plume and its impact, we subdivided the overall latitude range chosen for Raikoke into two sub-intervals: 40–55 and 55–70∘ N. It is important to mention that latitudes higher than 70∘ N are very sparsely sampled with the SAGE III/ISS orbit. Furthermore, higher impacted regions in terms of stratospheric aerosol are possibly partly missed by SAGE III/ISS. The Ulawun-perturbed spatiotemporal interval has been considered to be the longitude-integrated latitude bands between 20∘ S and 15∘ N, in the period from the eruption to the end of November 2019, which encompasses the whole evolution of the Ulawun plume. For both eruptions, a corresponding background atmosphere has been chosen, in a clear period at similar seasonal conditions, as a baseline for both the sAOD and the RF estimations: 1 to 15 September 2018, at both 40–55 and 55–70∘ N, for Raikoke, and 15 to 30 June 2018, at 20∘ S–15∘ N, for Ulawun. The respective background is subtracted from both Raikoke- and Ulawun-attributed sAOD values to obtain plume-isolated sAODs for both eruptions. For Raikoke, the whole averaged sAOD (plume plus background) reaches values as large as 0.045 (at 449 nm) to 0.030 (at 1020 nm), at 55–70∘ N, and 0.030 to 0.020, at 40–55∘ N. The impact of Raikoke is significantly larger at higher latitudes. The plume-isolated Raikoke sAOD, i.e., with the background subtracted, reaches values as large as 0.035 to 0.025 (55–70∘ N) and 0.020 to 0.015 (40–55∘ N), depending on the wavelength. Comparing the sAOD at 550 nm of Andersson et al. (2015), for the past moderate eruptions of Sarychev, Kasatochi and Nabro (≈0.012, 0.012 and 0.09), with our estimations for Raikoke, this latter eruption displays sAOD perturbations at least twice as large as past eruptions. Ulawun exhibits significantly smaller plume-isolated sAODs: from 0.010 (at 449 nm) to 0.0025 (at 1020 nm), hence comparable with the Ambae eruption in 2018 (Kloss et al., 2020) and smaller than Sarychev, Kasatochi and Nabro (Andersson et al., 2015). It is interesting to notice how the spectral variability of the plume-isolated sAODs, while clearly decreasing with the wavelength, as expected, is somewhat steeper for Ulawun than Raikoke. This could suggest a more homogeneous small-sized sulfate aerosol composition of the Ulawun plume and the possible presence of either some ash or carbonaceous or larger sulfate-coated ash or carbonaceous particles in the Raikoke plume. Bulk estimations of the Angström exponent (AE) of the background and volcanically perturbed aerosol layers, for both volcanic eruptions, can be determined by exploiting the spectral variability of the sAOD. For both Raikoke and Ulawun, a pristine average AE of about 1.7 is estimated using the background sAODs. While the Ulawun eruption did not significantly perturb the average AE (AE of the Ulawun-perturbed stratospheric aerosol layer of about 1.7), the Raikoke eruption modified this parameter significantly (AE of the Raikoke-perturbed stratospheric aerosol layer of about 1.2). The AE is an optical proxy of the mean particle size in an aerosol population, with larger AE values associated with smaller particles, and vice versa. While values approaching 2.0 are typical for smaller sulfate aerosol-dominated aerosol populations, values of 1.2 can be associated with significantly larger particles. Thus, Raikoke perturbed the stratospheric aerosol layer by producing significantly larger particles than the background.
We calculate the shortwave RF of the Raikoke and Ulawun plumes using the UVSPEC radiative transfer model (see Sect. 2.7 for the setup of the model and calculations). As input parameters for the model, the SAGE III/ISS volcano-attributed aerosol extinction profiles discussed above are used. While these are measured parameters, some assumptions must be done on two non-measured optical properties of the plume: the single scattering albedo (SSA, an optical proxy of the absorption properties of the plume) and the phase function, summarized by the scalar asymmetry coefficient (g, a metric of the forward/backward scattering properties, linked to the size and composition of the particles in the plume). In the past, very weakly absorbing plumes, composed of small particles, have been proposed for volcanic perturbations of the upper-tropospheric and stratospheric aerosol layer (e.g., Sellitto et al., 2017; Kloss et al., 2020), based on the hypothesis that these are mainly composed of tiny secondary sulfate aerosols. In our case, both parameters are very uncertain and, as discussed above, the presence of larger ash-coated or ash particles cannot be excluded. For this reason, we performed several RF estimations with a range of SSA (from 1.00, typical for non-absorbing particles, down to 0.97, thus partly absorbing particles) and g values (from 0.50, typical for very small particles, up to 0.85, linked to significantly larger particles). The regional RF estimations, in the latitude bands 40–55 and 55–70∘ N (Raikoke) and 20∘ S–15∘ N (Ulawun), are shown in Fig. 9c and d, for the different values of SSA and g assumptions. By scaling the SAGE III/ISS extinction with the OMPS-derived AOD ratio 55–70/70–90∘ N, the RF has been extrapolated to 70–90∘ N and is also shown in Fig. 9c,d. Regional RF values as large as −2 to are found for Raikoke, at both TOA and surface, in the 40–55 and 55–70∘ N, respectively, for the assumption of very small (g=0.5) and very reflective (SSA=1.0) particles. This is linked to a significant cooling of the regional climate system and a very limited energy absorption by the plume. The TOA RF at the highest northern latitudes (70–90∘ N) is found to have values as large as but this estimation has to be taken with caution (as discussed above, it is based on an extrapolation). For smaller SSA, the TOA and surface RF start to deviate significantly (larger surface than TOA RF), thus indicating a significant absorption of radiative energy of the plume. This energy imbalance and the possible resulting radiative heating of the plume can be a possible reason for the observed lifting, shown in Fig. 7e; this hypothesis requires further investigation. The assumption about the asymmetry parameter g dominates the uncertainty of the RF estimations (error bars of Fig. 9c and d). It is important to mention that all these RF estimations are based on the assumption of clear sky, so these are just a reference and have to be scaled down to take the impact of clouds into account by reducing the effective RF.
Table 2Global clear-sky TOA RF estimations (in W m−2). Experiment 1: using shortwave SSA between 0.97 and 1.0 and shortwave g between 0.50 and 0.85; Experiment 2: using shortwave SSA between 0.98 and 1.0 and shortwave g between 0.50 and 0.70.
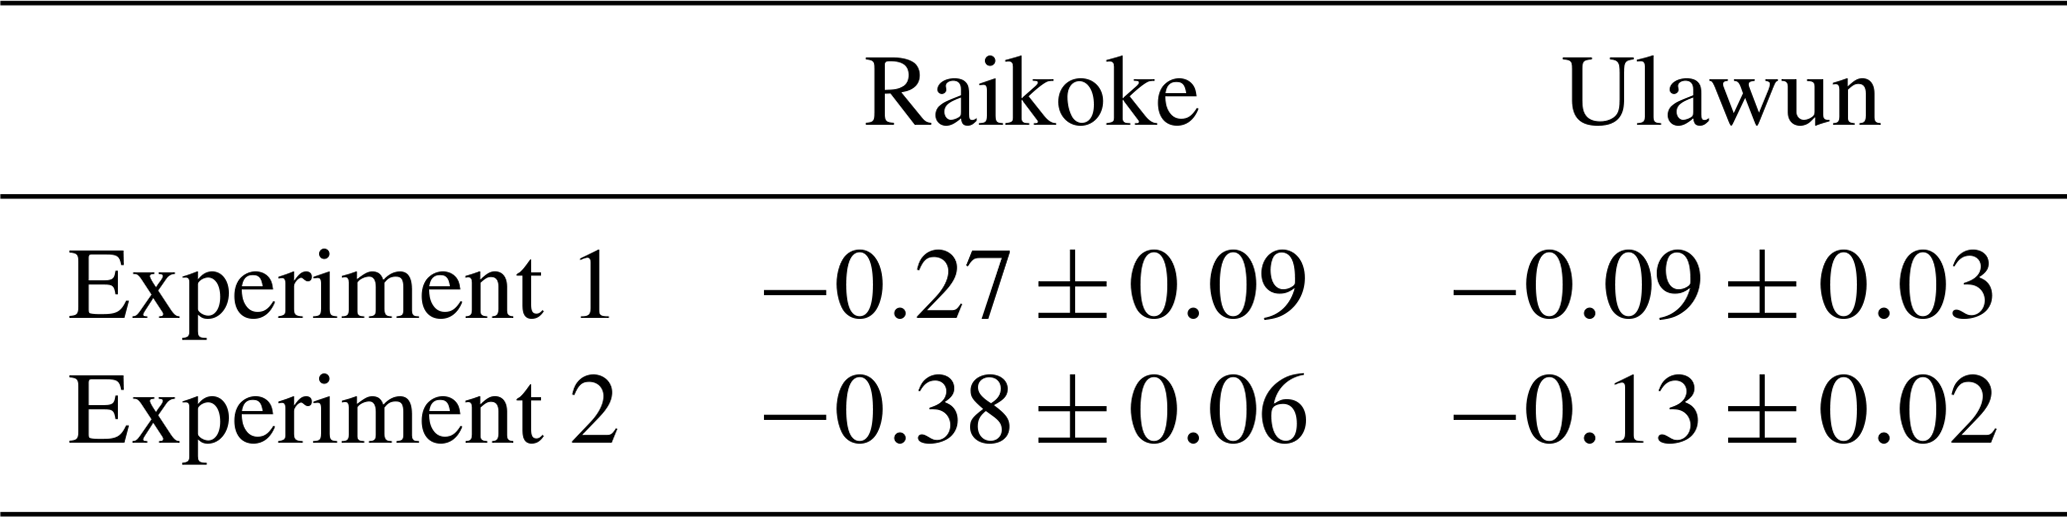
Based on the above-mentioned regional clear-sky RF estimations in the shortwave (Table 2), the equinox-equivalent daily average shortwave global TOA radiative forcing of Raikoke and Ulawun plumes, based on their stratospheric aerosol layer perturbations, can be estimated. We calculate this as a latitude-weighted mean of the regional RF, extended over the whole globe, by considering a zero impact outside the regions defined in this section. Because we know that the Raikoke plume had an influence on the tropics (which is here considered to be a “zero impact region”), the calculated global clear-sky RF values are likely underestimated. The clear-sky global averages are listed in Table 2, for Raikoke and Ulawun, and for two hypotheses: an average of all SSA and g hypotheses (Experiment 1) and excluding the extreme values of SSA (0.97) and g (0.85), which are linked to a relatively large absorption and a large average particle size (Experiment 2). Values as high as are found for Raikoke. The all-sky to clear-sky RF ratio for the Sarychev eruption has been reported at about 0.4 (Haywood et al., 2010); the Sarychev eruption occurred at a very similar period of the year and location with respect to Raikoke. Applying this empirical scaling factor, we obtain an all-sky RF for Raikoke in the range from −0.11 to , which is very similar to the estimation for Sarychev (Haywood et al., 2010). Smaller values are found for Ulawun: a clear-sky RF of −0.09 to , extendable to values of −0.04 to at all-sky conditions.
We show that during the past 3 years, the highest peak sAOD values resulted from the Raikoke eruption. This series includes the Canadian fires (2017), the Ambae eruption (2018) and the Australian fires in 2019/2020. During the eruption multiple plumes were injected at different altitudes at different points in time containing SO2 and ash, making this eruption challenging for the modeling world. During the first few days after the eruption the Raikoke plume was entrained in the Aleutian cyclone. Within 3 weeks to 1 month after the Raikoke eruption, the plume circled the Earth. Stratospheric AOD values as high as 0.045 (at 449 nm) and decreasing to about 0.04 (longer-wavelength visible, 676 nm) and 0.03 (near infrared, 1020 nm) are observed at higher NH latitudes, with an average value of 0.025 at longer wavelength (visible, 675 nm) in the NH. The background sAOD is still enhanced in the NH 1 year after the eruption. The OMPS aerosol extinction observations show a rising of aerosol-filled air masses from ≈15 km in July to 21 km in September from the Raikoke eruption. In the same period, a smaller impact from the Ulawun eruptions, especially the one in August 2019, is also observed. The Ulawun plume circled the Earth in the tropics within 1 month and led to sAOD values of ≈0.01, in the visible, in the tropics. The Ulawun plume was mainly transported towards the south. A possible transport towards the north within the BDC is masked by already increased sAOD values from the Raikoke eruption in the NH. Even though SAGE III/ISS has a much sparser sampling rate than OMPS, the monthly sAOD evolution on broad latitudinal bands is reliably represented in terms of absolute value (in the tropics and NH) and timing for all documented stratospheric aerosol events. Discrepancies (in terms of aerosol concentration and lifetime) between observations and the global model WACCM point to the complexity of those events. In particular, it may indicate that the initial injection of ash (which is not implemented in the WACCM setup) plays a role in the evolution of such plumes, in particular for Raikoke. The global RF for Raikoke is estimated at values between −0.3 and in clear-sky conditions and can be scaled to values of −0.1 to in all-sky conditions. Simulation results potentially indicate an impact of the Raikoke plume on the SH. This would lead to an underestimation of the given global RF values. As is, our estimation is on par with or exceeds the RF of the well-studied Sarychev eruption in 2009, thus setting a new reference for climatic impacts of stratospheric aerosol perturbations for the post-Pinatubo-influenced period. The RF of the Ulawun eruptions is down to 4 times smaller than the one for Raikoke and is, in this respect, negligible.
Figure A1: observations for the analysis of the injection of the Raikoke plume. This is used to determine the input of the WACCM initialization of the plumes' injection following the Raikoke eruption on 21–22 June 2019.
Figure A2: same as for Fig. A1 but for the injection of the Ulawun plumes for both eruptions. Additionally, we present the corresponding Himawari Ash RGB, showing a clear signal of ash on 3 August for the second Ulawun eruption.
Movie: GIF of the Raikoke eruption from 18:00 UTC on 21 June to 09:40 UTC on 22 June at 20 min intervals (https://doi.org/10.5281/zenodo.3939167). Notice the series of explosions that occurred at many instances between 18:00 and 05:40 UTC, in particular, the two last ones at 03:40 and 05:50 UTC. The images are produced using the RGB Dust recipe like in Fig. 2.
Figure A3: IASI observations show the entrainment of SO2 enhanced air masses in the cyclonic circulation of the Aleutian low.
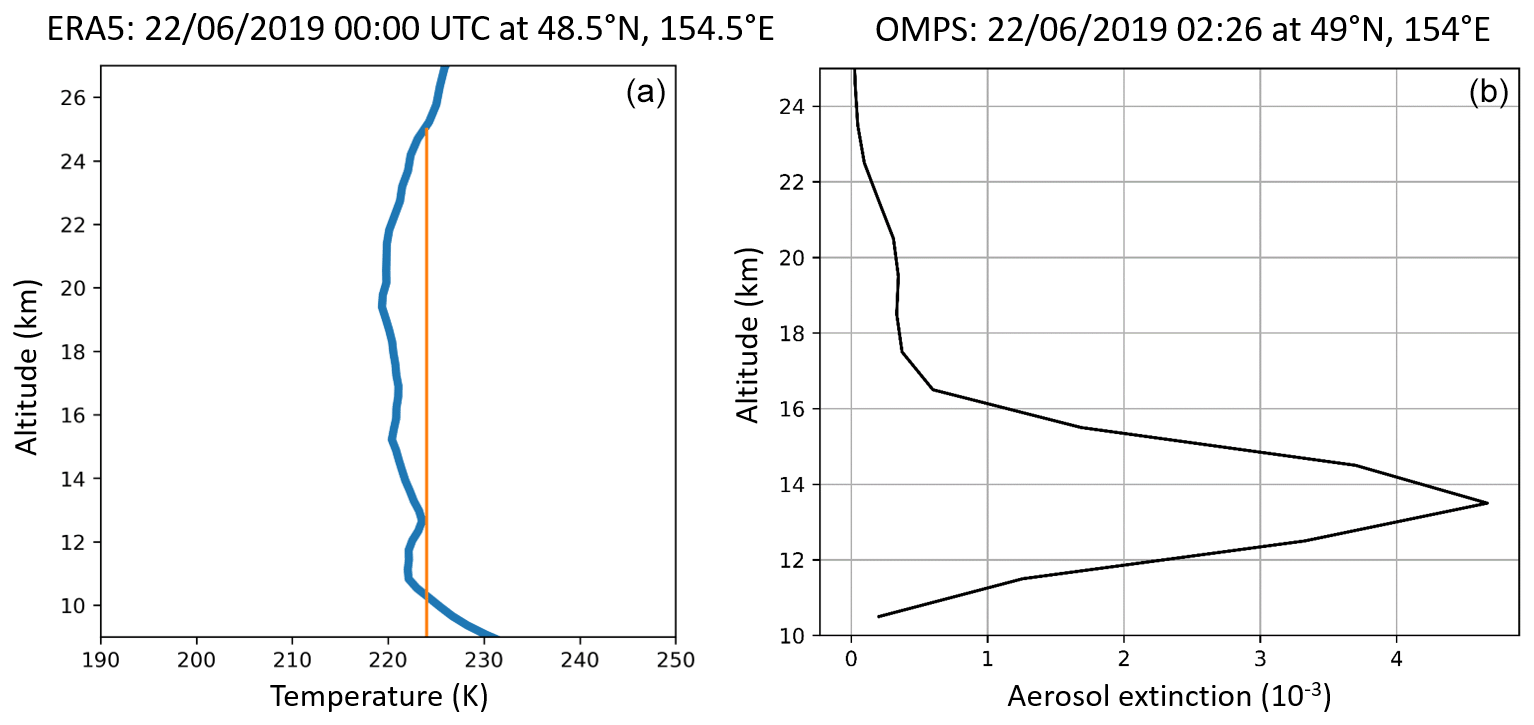
Figure A1(a) ERA5 temperature profile (blue line) at the location of the minimum brightness temperature (orange line) of Himawari-8 observations of the Raikoke plume a few hours after the eruption. (b) OMPS aerosol extinction profile close to the Raikoke location shortly after the injection phase.
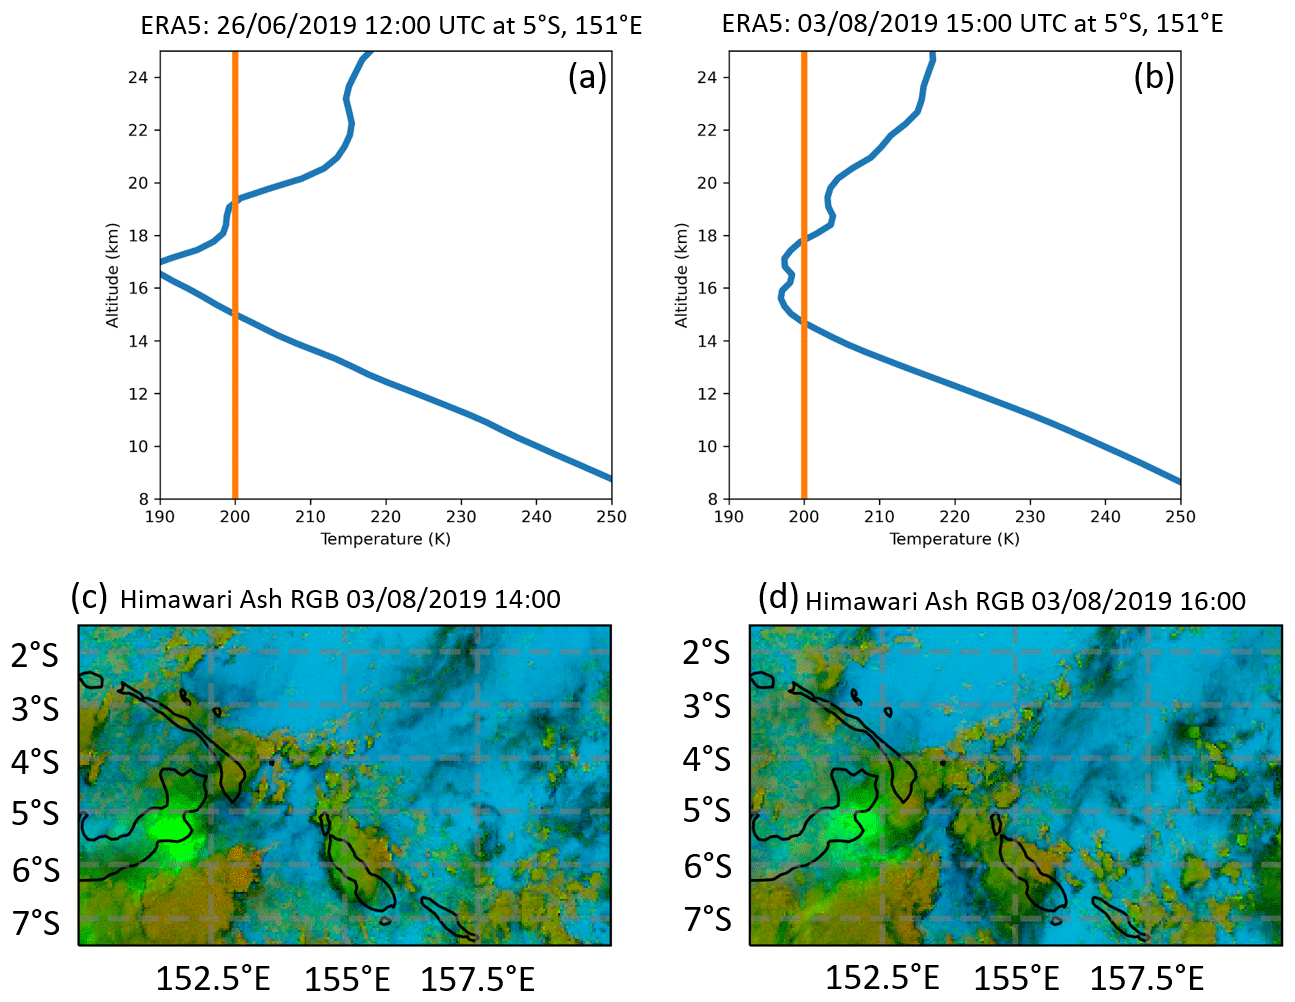
Figure A2(a, b) As in Fig. A1 (a) but for both Ulawun eruptions accordingly. (c, d) Similar to Fig. 1, Himawari ash RGB for the second Ulawun eruption. Bright green represents SO2, while darker green shades show clouds.
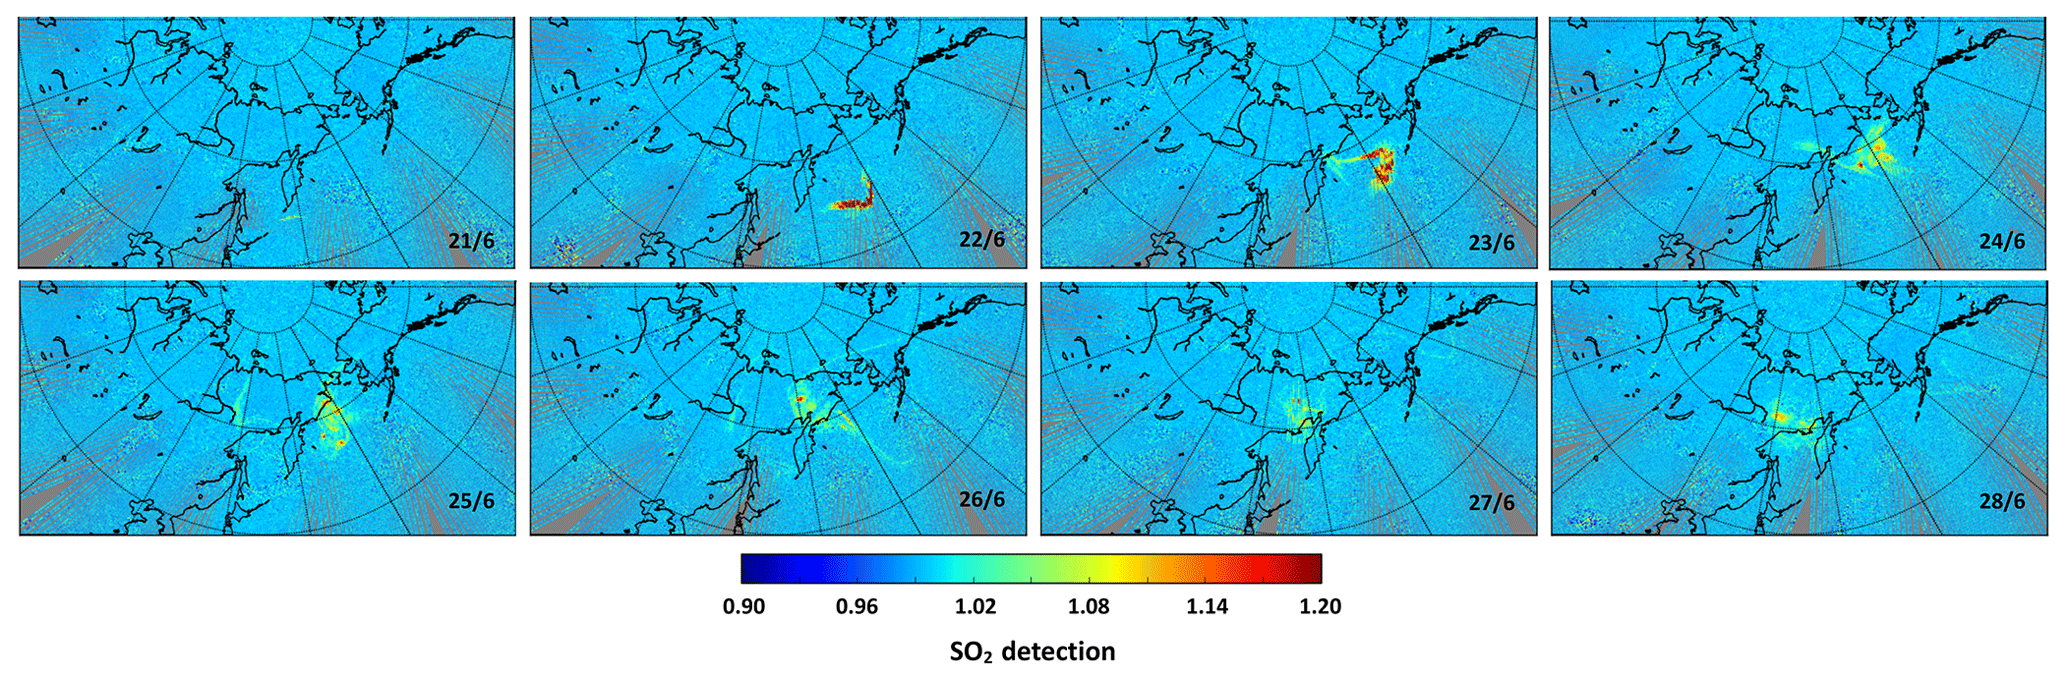
Figure A3IASI SO2 observations from 21 to 28 June.
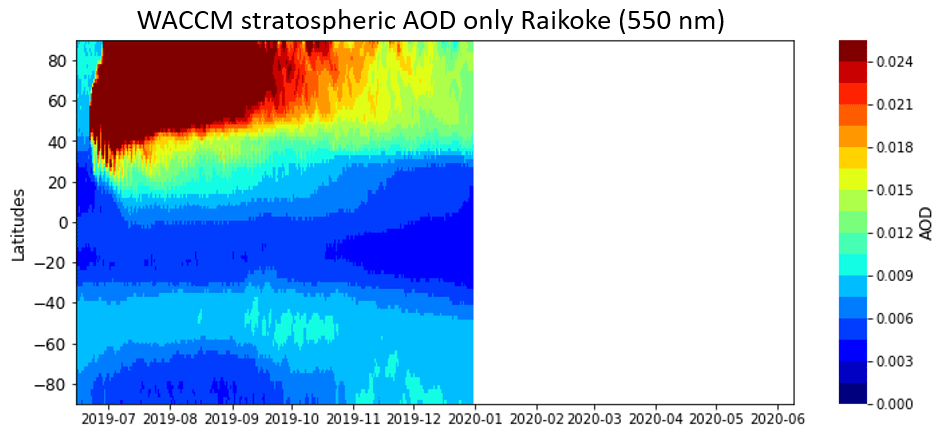
Figure C1: WACCM mean sAOD values for the respective latitude bands, as shown with OMPS and SAGE III/ISS observations in Fig. 8a and b. When comparing Fig. 8a and b with Fig. C1, the higher and faster impacts on the sAOD from the model simulations become evident (as also shown and explained in Sect. 4.3).
The aerosol extinction data sets from SAGE III-ISS v5.1 are available at https://eosweb.larc.nasa.gov (last access: 4 November 2020) (NASA EARTHDATA, 2020a) and OMPS v1.5 at https://daac.gsfc.nasa.gov/ (last access: 4 November 2020) (NASA EARTHDATA, 2020b). The model and simulation data may be requested from the corresponding author: the CLaMS model data (f.ploeger@fz-juelich.de) and the UVSPEC input and output files for the radiative forcing calculations (pasquale.sellitto@lisa.u-pec.fr). Himawari-8 and IASI Level 1c data are provided by the AERIS/ICARE data center (https://en.aeris-data.fr/direct-access-icare/, last access: 4 November 2020) (AERIS, 2020); the ERA5 data are available from the Copernicus Climate Change Service (https://climate.copernicus.eu/climate-reanalysis, last access: 4 November 2020) (ECMWF, 2011). LOAC data are available at https://doi.org/10.5281/zenodo.3937477 (Berthet and Renard, 2021).
CK, PS, BL and GB designed the research and analyzed and interpreted data. CK carried out the OMPS and SAGE III/ISS analysis. BL carried out the Himawari data analysis. ME and PS produced the IASI SO2 detection observations. GB and MT carried out the WACCM simulations. FP carried out the CLAMS simulations. PS carried out the radiative forcing calculations and related analyses. GT provided expertise on OMPS data. JBR and GB provided LOAC observations, data treatment and analysis. FJ, GT and AB were involved in the discussions. CK wrote the paper with contributions from PS, GB and BL. All the authors approved the final version.
The authors declare that they have no conflict of interest.
This article is part of the special issue “Satellite observations, in situ measurements and model simulations of the 2019 Raikoke eruption (ACP/AMT/GMD inter-journal SI)”. It is not associated with a conference.
The authors are grateful to the providers of LibRadtran and the National Aeronautics and Space Administration (NASA), SAGE III/ISS and OMPS teams. The IASI-related activities were supported by CNES (TOSCA IASI project). The authors are grateful to Tong Zhu from SSAI and Talat Khattatov for technical support. Furthermore, the authors would like to thank Jim Haywood and an anonymous reviewer for their suggestions, which improved the quality of the paper.
This research has been supported by the ANR (Agence Nationale de La Recherche) under grants ANR-17-CE01-0015 (TTL-Xing) and ANR-10-LABX-100-01 (French Labex VOLTAIRE managed by the University of Orleans). Corinna Kloss was funded by the Deutsche Forschungsgemeinschaft (DFG, German Research Foundation) – 409585735. Felix Ploeger was funded by the Helmholtz Association under grant VH-NG-1128 (Helmholtz Young Investigators Group A-SPECi).
This paper was edited by Peter Haynes and reviewed by Jim M. Haywood and one anonymous referee.
Aeris: SO2 total column from IASI (Level 2), available at: https://iasi.aeris-data.fr/so2/ (last access: 8 January 2021), 2018. a, b, c
AERIS: Direct access to Aeris/Icare portal, available at: https://en.aeris-data.fr/direct-access-icare/, last access: 4 November 2020. a
Andersson, S., Martinsson, B., vernier, J., Friberg, J., Brenninkmeijer, C., Hermann, M., Velthoven, P., and Zahn, A.: Significant radiative impact of volcanic aerosol in the lowermost stratosphere, Nat. Commun., 6, 7692, https://doi.org/10.1038/ncomms8692, 2015. a, b
Bennis, K. and Venzke, E.: Bulletin of the Global Volcanism Network, 44:12, Global Volcanism Program, 2019, Report on Ulawun, Papua New Guinea, https://doi.org/10.5479/si.GVP.BGVN201912-252120, 2019. a
Berthet, G. and Renard, J.-B.: LOAC in situ balloon data for Raikoke eruption, Zenodo, https://doi.org/10.5281/zenodo.3937477, 2021. a
Bhartia, P. K. and Torres, O. O.: OMPS-NPP L2 LP Aerosol Extinction Vertical Profile swath daily 3slit V1.5, GES DISC – Goddard Earth Sciences Data and Information Services Center, Greenbelt, MD, USA, https://doi.org/10.5067/GZJJYA7L0YW2, 2019. a
Bluth, G. J. S., Doiron, S. D., Schnetzler, C. C., Krueger, A. J., and Walter, L. S.: Global tracking of the SO2 clouds from the June, 1991 Mount Pinatubo eruptions, Geophys. Res. Lett., 19, 151–154, https://doi.org/10.1029/91GL02792, 1992. a
Butchart, N.: The Brewer-Dobson circulation, Rev. Geophys., 52, 157–184, https://doi.org/10.1002/2013RG000448, 2014. a, b
Canty, T., Mascioli, N. R., Smarte, M. D., and Salawitch, R. J.: An empirical model of global climate – Part 1: A critical evaluation of volcanic cooling, Atmos. Chem. Phys., 13, 3997–4031, https://doi.org/10.5194/acp-13-3997-2013, 2013. a
Carboni, E., Grainger, R. G., Mather, T. A., Pyle, D. M., Thomas, G. E., Siddans, R., Smith, A. J. A., Dudhia, A., Koukouli, M. E., and Balis, D.: The vertical distribution of volcanic SO2 plumes measured by IASI, Atmos. Chem. Phys., 16, 4343–4367, https://doi.org/10.5194/acp-16-4343-2016, 2016. a
Carn, S.: Twitter, available at: https://twitter.com/simoncarn/status/1142713198480482304 (last access: 1 July 2020), 2019a. a
Carn, S.: Twitter, available at: https://twitter.com/simoncarn/status/1158080192268705792 (last access: 1 July 2020), 2019b. a
Cas, R.: IAVCEI: from small beginnings to a vibrant international association, Cas, R. A. F.: IAVCEI: from small beginnings to a vibrant international association, Hist. Geo Space. Sci., 10, 181–191, https://doi.org/10.5194/hgss-10-181-2019, 2019. a
Chen, Z., Bhartia, P. K., Torres, O., Jaross, G., Loughman, R., DeLand, M., Colarco, P., Damadeo, R., and Taha, G.: Evaluation of the OMPS/LP stratospheric aerosol extinction product using SAGE III/ISS observations, Atmos. Meas. Tech., 13, 3471–3485, https://doi.org/10.5194/amt-13-3471-2020, 2020. a, b
Chouza, F., Leblanc, T., Barnes, J., Brewer, M., Wang, P., and Koon, D.: Long-term (1999–2019) variability of stratospheric aerosol over Mauna Loa, Hawaii, as seen by two co-located lidars and satellite measurements, Atmos. Chem. Phys., 20, 6821–6839, https://doi.org/10.5194/acp-20-6821-2020, 2020. a, b
Clarisse, L., Hurtmans, D., Clerbaux, C., Hadji-Lazaro, J., Ngadi, Y., and Coheur, P.-F.: Retrieval of sulphur dioxide from the infrared atmospheric sounding interferometer (IASI), Atmos. Meas. Tech., 5, 581–594, https://doi.org/10.5194/amt-5-581-2012, 2012. a, b, c
Clarisse, L., Coheur, P.-F., Prata, F., Hadji-Lazaro, J., Hurtmans, D., and Clerbaux, C.: A unified approach to infrared aerosol remote sensing and type specification, Atmos. Chem. Phys., 13, 2195–2221, https://doi.org/10.5194/acp-13-2195-2013, 2013. a
Clerbaux, C., Boynard, A., Clarisse, L., George, M., Hadji-Lazaro, J., Herbin, H., Hurtmans, D., Pommier, M., Razavi, A., Turquety, S., Wespes, C., and Coheur, P.-F.: Monitoring of atmospheric composition using the thermal infrared IASI/MetOp sounder, Atmos. Chem. Phys., 9, 6041–6054, https://doi.org/10.5194/acp-9-6041-2009, 2009. a
Crafford, A. and Venzke, E.: Bulletin of the Global Volcanism Network, 44:8, Global Volcanism Program, 2019, Report on Raikoke, Russia, https://doi.org/10.5479/si.GVP.BGVN201908-290250, 2019. a, b
Da, C.: Preliminary assessment of the Advanced Himawari Imager (AHI) measurement onboard Himawari-8 geostationary satellite, Remote Sens. Lett., 6, 637–646, 2015. a
Diehl, T., Heil, A., Chin, M., Pan, X., Streets, D., Schultz, M., and Kinne, S.: Anthropogenic, biomass burning, and volcanic emissions of black carbon, organic carbon, and SO2 from 1980 to 2010 for hindcast model experiments, Atmos. Chem. Phys. Discuss., 12, 24895–24954, https://doi.org/10.5194/acpd-12-24895-2012, 2012. a
ECMWF: Climate reanalysis, available at: https://climate.copernicus.eu/climate-reanalysis, last access: 4 November 2020. a
English, J. M., Toon, O. B., Mills, M. J., and Yu, F.: Microphysical simulations of new particle formation in the upper troposphere and lower stratosphere, Atmos. Chem. Phys., 11, 9303–9322, https://doi.org/10.5194/acp-11-9303-2011, 2011. a, b
Eumetrain: EUMeTrain Quick Guides, available at: http://www.eumetrain.org/rgb_quick_guides, last access: 1 July 2020. a
Fairlie, T. D., Vernier, J.-P., Natarajan, M., and Bedka, K. M.: Dispersion of the Nabro volcanic plume and its relation to the Asian summer monsoon, Atmos. Chem. Phys., 14, 7045–7057, https://doi.org/10.5194/acp-14-7045-2014, 2014. a
Fromm, M., Kablick III, G., Nedoluha, G., Carboni, E., Grainger, R., Campbell, J., and Lewis, J.: Correcting the record of volcanic stratospheric aerosol impact: Nabro and Sarychev Peak, J. Geophys. Res.-Atmos., 119, 10343–10364, https://doi.org/10.1002/2014JD021507, 2014. a, b
Gelaro, R., McCarty, W., Suárez, M. J., Todling, R., Molod, A., Takacs, L., Randles, C. A., Darmenov, A., Bosilovich, M. G., Reichle, R., Wargan, K., Coy, L., Cullather, R., Draper, C., Akella, S., Buchard, V., Conaty, A., da Silva, A. M., Gu, W., Kim, G.-K., Koster, R., Lucchesi, R., Merkova, D., Nielsen, J. E., Partyka, G., Pawson, S., Putman, W., Rienecker, M., Schubert, S. D., Sienkiewicz, M., and Zhao, B.: The Modern-Era Retrospective Analysis for Research and Applications, Version 2 (MERRA-2), J. Climate, 30, 5419–5454, 2017. a, b
Guermazi, H., Sellitto, P., Cuesta, J., Eremenko, M., Lachatre, M., Mailler, S., Carboni, E., Salerno, G., Caltabiano, T., Menut, L., Serbaji, M. M., Rekhiss, F., and Legras, B.: Height-resolved retrieval of volcanic sulphate aerosols from IASI observations, Remote Sens., in review, 2020. a
Günther, A., Höpfner, M., Sinnhuber, B.-M., Griessbach, S., Deshler, T., von Clarmann, T., and Stiller, G.: MIPAS Observations of Volcanic Sulfate Aerosol and Sulfur Dioxide in the Stratosphere, Atmos. Chem. Phys., 18, 1217–1239, https://doi.org/10.5194/acp-18-1217-2018, 2018. a, b, c
Haywood, J. M., Jones, A., Clarisse, L., Bourassa, A., Barnes, J., Telford, P., Bellouin, N., Boucher, O., Agnew, P., Clerbaux, C., Coheur, P., Degenstein, D., and Braesicke, P.: Observations of the eruption of the Sarychev volcano and simulations using the HadGEM2 climate model, J. Geophys. Res.-Atmos., 115, D21212, https://doi.org/10.1029/2010JD014447, 2010. a, b, c, d, e
Hedelt, P., Efremenko, D. S., Loyola, D. G., Spurr, R., and Clarisse, L.: Sulfur dioxide layer height retrieval from Sentinel-5 Precursor/TROPOMI using FP_ILM, Atmos. Meas. Tech., 12, 5503–5517, https://doi.org/10.5194/amt-12-5503-2019, 2019. a, b, c
Hersbach, H., Bell, B., Berrisford, P., Hirahara, S., Horányi, A., Muñoz-Sabater, J., Nicolas, J., Peubey, C., Radu, R., Schepers, D., Simmons, A., Soci, C., Abdalla, S., Abellan, X., Balsamo, G., Bechtold, P., Biavati, G., Bidlot, J., Bonavita, M., De Chiara, G., Dahlgren, P., Dee, D., Diamantakis, M., Dragani, R., Flemming, J., Forbes, R., Fuentes, M., Geer, A., Haimberger, L., Healy, S., Hogan, R. J., Hólm, E., Janisková, M., Keeley, S., Laloyaux, P., Lopez, P., Lupu, C., Radnoti, G., de Rosnay, P., Rozum, I., Vamborg, F., Villaume, S., and Thépaut, J.-N.: The ERA5 global reanalysis, Q. J. Roy. Meteorol. Soc., 146, 1999–2049, https://doi.org/10.1002/qj.3803, 2020. a
Höpfner, M., Boone, C. D., Funke, B., Glatthor, N., Grabowski, U., Günther, A., Kellmann, S., Kiefer, M., Linden, A., Lossow, S., Pumphrey, H. C., Read, W. G., Roiger, A., Stiller, G., Schlager, H., von Clarmann, T., and Wissmüller, K.: Sulfur dioxide (SO2) from MIPAS in the upper troposphere and lower stratosphere 2002–2012, Atmos. Chem. Phys., 15, 7017–7037, https://doi.org/10.5194/acp-15-7017-2015, 2015. a
Jégou, F., Berthet, G., Brogniez, C., Renard, J.-B., François, P., Haywood, J. M., Jones, A., Bourgeois, Q., Lurton, T., Auriol, F., Godin-Beekmann, S., Guimbaud, C., Krysztofiak, G., Gaubicher, B., Chartier, M., Clarisse, L., Clerbaux, C., Balois, J. Y., Verwaerde, C., and Daugeron, D.: Stratospheric aerosols from the Sarychev volcano eruption in the 2009 Arctic summer, Atmos. Chem. Phys., 13, 6533–6552, https://doi.org/10.5194/acp-13-6533-2013, 2013. a
Jenner, L.: Alberta Canada Experiencing an Extreme Fire Season, available at: https://www.nasa.gov/image-feature/goddard/2019/alberta-canada-experiencing-an-extreme-fire-season (last access: 8 January 2020), 2019. a
Jones, A., Haywood, J., Dunstone, N., Emanuel, K., Hawcroft, K., Hodges, K., and Jones, A.: Impacts of hemispheric solar geoengineering on tropical cyclone frequency, Nat. Commun., 8, 1382, https://doi.org/10.1038/s41467-017-01606-0, 2017. a, b
Kettle, A. J., Kuhn, U., von Hobe, M., Kesselmeier, J., and Andreae, M. O.: Global budget of atmospheric carbonyl sulfide: Temporal and spatial variations of the dominant sources and sinks, J. Geophys. Res.-Atmos., 107, ACH 25-1–ACH 25-16, https://doi.org/10.1029/2002JD002187, 2002. a
Khaykin, S., Legras, B., Bucci, S., Sellitto, P., Isaksen, L., Tence, F., Bekki, S., Bourassa, A. E., Rieger, L. A., Zawada, D., Jumelet, J., and Godin-Beekmann, S.: The 2019/20 Australian wildfires generated a persistent smoke-charged vortex rising up to 35 km altitude, Commun. Earth Environ., 1, 22, https://doi.org/10.1038/s43247-020-00022-5, 2020. a
Kloss, C., Sellitto, P., Legras, B., Vernier, J.-P., Jégou, F., Venkat Ratnam, M., Kumar, B. S., Madhavan, B. L., and Berthet, G.: Impact of the 2018 Ambae eruption on the global stratospheric aerosol layer and climate, J. Geophys. Res.-Atmos., 14, e2020JD032410, https://doi.org/10.1029/2020JD032410, 2020. a, b, c, d, e
Kremser, S., Thomason, L. W., von Hobe, M., Hermann, M., Deshler, T., Timmreck, C., Toohey, M., Stenke, A., Schwarz, J. P., Weigel, R., Fueglistaler, S., Prata, F. J., Vernier, J.-P., Schlager, H., Barnes, J. E., Antuña-Marrero, J.-C., Fairlie, D., Palm, M., Mahieu, E., Notholt, J., Rex, M., Bingen, C., Vanhellemont, F., Bourassa, A., Plane, J. M. C., Klocke, D., Carn, S. A., Clarisse, L., Trickl, T., Neely, R., James, A. D., Rieger, L., Wilson, J. C., and Meland, B.: Stratospheric aerosol–Observations, processes, and impact on climate, Rev. Geophys., 54, 278–335, 2016. a, b
Kristiansen, N. I., Stohl, A., Prata, A. J., Richter, A., Eckhardt, S., Seibert, P., Hoffmann, A., Ritter, C., Bitar, L., Duck, T. J., and Stebel, K.: Remote sensing and inverse transport modeling of the Kasatochi eruption sulfur dioxide cloud, J. Geophys. Res.-Atmos., 115, D00L16, https://doi.org/10.1029/2009JD013286, 2010. a, b
Krotkov, N. A., McClure, B., Dickerson, R. R., Carn, S. A., Li, C., Bhartia, P. K., Yang, K., Krueger, A. J., Li, Z., Levelt, P. F., Chen, H., Wang, P., and Lu, D.: Validation of SO2 retrievals from the Ozone Monitoring Instrument over NE China, J. Geophys. Res.-Atmos., 113, D16S40, https://doi.org/10.1029/2007JD008818, 2008. a
Krotkov, N. A., Schoeberl, M. R., Morris, G. A., Carn, S., and Yang, K.: Dispersion and lifetime of the SO2 cloud from the August 2008 Kasatochi eruption, J. Geophys. Res.-Atmos., 115, D00L20, https://doi.org/10.1029/2010JD013984, 2010. a, b
Kurucz, R.: Synthetic Infrared Spectra, in: Infrared Solar Physics, Vol. 154 of International Astronomical Union/Union Astronomique Internationale, edited by: Rabin, D., Jefferies, J., and Lindsey, C., Springer, the Netherlands, 523–531, https://doi.org/10.1007/978-94-011-1926-9_62, 1994. a
Lachatre, M., Mailler, S., Menut, L., Turquety, S., Sellitto, P., Guermazi, H., Salerno, G., Caltabiano, T., and Carboni, E.: New strategies for vertical transport in chemistry transport models: application to the case of the Mount Etna eruption on 18 March 2012 with CHIMERE v2017r4, Geosci. Model Dev., 13, 5707–5723, https://doi.org/10.5194/gmd-13-5707-2020, 2020. a
Lawrence, Z. D., Perlwitz, J., Butler, A. H., Manney, G. L., Newman, P. A., Lee, S. H., and Nash, E. R.: The Remarkably Strong Arctic Stratospheric Polar Vortex of Winter 2020: Links to Record-Breaking Arctic Oscillation and Ozone Loss, ESSOAr, 27, https://doi.org/10.1002/essoar.10503356.1, 2020. a
Lee, H. and Smith, A. K.: Simulation of the combined effects of solar cycle, quasi-biennial oscillation, and volcanic forcing on stratospheric ozone changes in recent decades, J. Geophys. Res.-Atmos., 108, 4049, https://doi.org/10.1029/2001JD001503, 2003. a
Loughman, R., Bhartia, P. K., Chen, Z., Xu, P., Nyaku, E., and Taha, G.: The Ozone Mapping and Profiler Suite (OMPS) Limb Profiler (LP) Version 1 aerosol extinction retrieval algorithm: theoretical basis, Atmos. Meas. Tech., 11, 2633–2651, https://doi.org/10.5194/amt-11-2633-2018, 2018. a
Lurton, T., Jégou, F., Berthet, G., Renard, J.-B., Clarisse, L., Schmidt, A., Brogniez, C., and Roberts, T. J.: Model simulations of the chemical and aerosol microphysical evolution of the Sarychev Peak 2009 eruption cloud compared to in situ and satellite observations, Atmos. Chem. Phys., 18, 3223–3247, https://doi.org/10.5194/acp-18-3223-2018, 2018. a, b
Mayer, B. and Kylling, A.: Technical note: The libRadtran software package for radiative transfer calculations – description and examples of use, Atmos. Chem. Phys., 5, 1855–1877, https://doi.org/10.5194/acp-5-1855-2005, 2005. a
McKenna, D. S., Konopka, P., Grooß, J.-U., Günther, G., Müller, R., Spang, R., Offermann, D., and Orsolini, Y.: A new Chemical Lagrangian Model of the Stratosphere (CLaMS) 1. Formulation of advection and mixing, J. Geophys. Res., 107, ACH 15-1–ACH 15-15, https://doi.org/10.1029/2000JD000114, 2002. a
Millington, S. C., Saunders, R. W., Francis, P. N., and Webster, H. N.: Simulated volcanic ash imagery: A method to compare NAME ash concentration forecasts with SEVIRI imagery for the Eyjafjallajökull eruption in 2010, J. Geophys. Res.-Atmos., 117, D00U17, https://doi.org/10.1029/2011JD016770, 2012. a
Mills, M. J., Schmidt, A., Easter, R., Solomon, S., Kinnison, D. E., Ghan, S. J., Neely III, R. R., Marsh, D. R., Conley, A., Bardeen, C. G., and Gettelman, A.: Global volcanic aerosol properties derived from emissions, 1990–2014, using CESM1 (WACCM), J. Geophys. Res.-Atmos., 121, 2332–2348, https://doi.org/10.1002/2015JD024290, 2016. a
Murphy, D. M., Froyd, K. D., Schwarz, J. P., and Wilson, J. C.: Observations of the chemical composition of stratospheric aerosol particles, Q. J. Roy. Meteorol. Soc., 140, 1269–1278, https://doi.org/10.1002/qj.2213, 2014. a
Muser, L. O., Hoshyaripour, G. A., Bruckert, J., Horváth, Á., Malinina, E., Wallis, S., Prata, F. J., Rozanov, A., von Savigny, C., Vogel, H., and Vogel, B.: Particle aging and aerosol–radiation interaction affect volcanic plume dispersion: evidence from the Raikoke 2019 eruption, Atmos. Chem. Phys., 20, 15015–15036, https://doi.org/10.5194/acp-20-15015-2020, 2020. a, b, c, d, e, f
NASA: Raikoke Erupts, available at: https://earthobservatory.nasa.gov/images/145226/raikoke-erupts (last access: 11 January 2021), 2019. a
NASA EARTHDATA: Atmospheric Science Data Center, available at: https://eosweb.larc.nasa.gov (last access: 4 November 2020), 2020a. a
NASA EARTHDATA: GES DISC, available at: https://daac.gsfc.nasa.gov/ (last access: 4 November 2020), 2020b. a
Ohneiser, K., Ansmann, A., Baars, H.,Seifert, P., Barja, B., Jimenez, C., Radenz, M., Teisseire, A., Floutsi, A., Haarig, M., Foth, A.,Chudnovsky, A., Engelmann, R., Zamorano, F., Bühl, J., and Wandinger, U.: Smoke of extreme Australian bushfires observed in the stratosphere over Punta Arenas, Chile, in January 2020: optical thickness, lidar ratios, and depolarization ratios at 355 and 532 nm, Atmos. Chem. Phys., 20, 8003–8015, https://doi.org/10.5194/acp-20-8003-2020, 2020. a
Pierluissi, J. H., Peng, J. and G. S.: New molecular transmission band models for LOWTRAN, Opt. Engin., 24, 541–547, https://doi.org/10.1117/12.7973523, 1985. a
Pommrich, R., Müller, R., Grooß, J.-U., Konopka, P., Ploeger, F., Vogel, B., Tao, M., Hoppe, C. M., Günther, G., Spelten, N., Hoffmann, L., Pumphrey, H.-C., Viciani, S., D'Amato, F., Volk, C. M., Hoor, P., Schlager, H., and Riese, M.: Tropical troposphere to stratosphere transport of carbon monoxide and long-lived trace species in the Chemical Lagrangian Model of the Stratosphere (CLaMS), Geosci. Model Dev., 7, 2895–2916, https://doi.org/10.5194/gmd-7-2895-2014, 2014. a
Randles, C. A., da Silva, A. M., Buchard, V., Colarco, P. R., Darmenov, A., Govindaraju, R., Smirnov, A., Holben, B., Ferrare, R., Hair, J., Shinozuka, Y., and Flynn, C. J.: The MERRA-2 Aerosol Reanalysis, 1980 Onward. Part I: System Description and Data Assimilation Evaluation, J. Climate, 30, 6823–6850, https://doi.org/10.1175/JCLI-D-16-0609.1, 2017. a, b
Rault, D. F. and Loughman, D. F.: The OMPS Limb Profiler Environmental Data Record Algorithm Theoretical Basis Document and Expected Performance, IEEE T. Geosci. Remote, 51, 2505–2527, https://doi.org/10.1109/TGRS.2012.2213093, 2013. a
Renard, J.-B., Brogniez, C., Berthet, G., Bourgeois, Q., Gaubicher, B., Chartier, M., Balois, J.-Y., Verwaerde, C., Auriol, F., Francois, P., Daugeron, D., and Engrand, C.: Vertical distribution of the different types of aerosols in the stratosphere: Detection of solid particles and analysis of their spatial variability, J. Geophys. Res.-Atmos., 113, D21303, https://doi.org/10.1029/2008JD010150, 2008. a
Renard, J.-B., Dulac, F., Berthet, G., Lurton, T., Vignelles, D., Jégou, F., Tonnelier, T., Jeannot, M., Couté, B., Akiki, R., Verdier, N., Mallet, M., Gensdarmes, F., Charpentier, P., Mesmin, S., Duverger, V., Dupont, J.-C., Elias, T., Crenn, V., Sciare, J., Zieger, P., Salter, M., Roberts, T., Giacomoni, J., Gobbi, M., Hamonou, E., Olafsson, H., Dagsson-Waldhauserova, P., Camy-Peyret, C., Mazel, C., Décamps, T., Piringer, M., Surcin, J., and Daugeron, D.: LOAC: a small aerosol optical counter/sizer for ground-based and balloon measurements of the size distribution and nature of atmospheric particles – Part 1: Principle of measurements and instrument evaluation, Atmos. Meas. Tech., 9, 1721–1742, https://doi.org/10.5194/amt-9-1721-2016, 2016. a, b, c
Ridley, D. A., Solomon, S., Barnes, J. E., Burlakov, V. D., Deshler, T., Dolgii, S. I., Herber, A. B., Nagai, T., Neely III, R. R., Nevzorov, A. V., Ritter, C., Sakai, T., Santer, B. D., Sato, M., Schmidt, A., Uchino, O., and Vernier, J. P.: Total volcanic stratospheric aerosol optical depths and implications for global climate change, Geophys. Res. Lett., 41, 7763–7769, 2014. a
Robock, A.: Volcanic eruptions and climate, Rev. Geophys., 38, 191–219, https://doi.org/10.1029/1998RG000054, 2000. a
Sawamura, P., Vernier, J. P., Barnes, J. E., Berkoff, T. A., Welton, E. J., Alados-Arboledas, L., Navas-Guzmán, F., Pappalardo, G., Mona, L., Madonna, F., Lange, D., Sicard, M., Godin-Beekmann, S., Payen, G., Wang, Z., Hu, S., Tripathi, S. N., Cordoba-Jabonero, C., and Hoff, R. M.: Stratospheric AOD after the 2011 eruption of Nabro volcano measured by lidars over the Northern Hemisphere, Environ. Res. Lett., 7, 034013, https://doi.org/10.1088/1748-9326/7/3/034013, 2012. a
Sellitto, P., di Sarra, A., Corradini, S., Boichu, M., Herbin, H., Dubuisson, P., Sèze, G., Meloni, D., Monteleone, F., Merucci, L., Rusalem, J., Salerno, G., Briole, P., and Legras, B.: Synergistic use of Lagrangian dispersion and radiative transfer modelling with satellite and surface remote sensing measurements for the investigation of volcanic plumes: the Mount Etna eruption of 25–27 October 2013, Atmos. Chem. Phys., 16, 6841–6861, https://doi.org/10.5194/acp-16-6841-2016, 2016. a
Sellitto, P., Zanetel, C., di Sarra, A., Salerno, G., Tapparo, A., Meloni, D., Pace, G., Caltabiano, T., Briole, P., and Legras, B.: The impact of Mount Etna sulfur emissions on the atmospheric composition and aerosol properties in the central Mediterranean: A statistical analysis over the period 2000–2013 based on observations and Lagrangian modelling, Atmos. Environ., 148, 77–88, https://doi.org/10.1016/j.atmosenv.2016.10.032, 2017. a
Sennert, S. K.: Global Volcanism Program, 2019, Report on Ulawun Papua New Guinea, Weekly Volcanic Activity Report, 29 January–4 February 2020, available at: https://volcano.si.edu/showreport.cfm?doi=GVP.WVAR20200129-252120 (last access: 11 January 2021), 2020. a
Solomon, S., Daniel, J. S., Neely, R. R., Vernier, J.-P., Dutton, E. G., and Thomason, L. W.: The Persistently Variable “Background” Stratospheric Aerosol Layer and Global Climate Change, Science, 333, 866–870, 2011. a
SSiRC: SSiRC Stratospheric Sulfur and its Role in Climate, available at: http://www.sparc-ssirc.org/ (last access: 11 January 2021), 2018. a
Theys, N., De Smedt, I., van Gent, J., Danckaert, T., Wang, T., Hendrick, F., Stavrakou, T., Bauduin, S., Clarisse, L., Li, C., Krotkov, N., Yu, H., Brenot, H., and Van Roozendael, M.: Sulfur dioxide vertical column DOAS retrievals from the Ozone Monitoring Instrument: Global observations and comparison to ground-based and satellite data, J. Geophys. Res.-Atmos., 120, 2470–2491, https://doi.org/10.1002/2014JD022657, 2015. a
Thompson, D. W., Wallace, J. M., Jones, P. D., and Kennedy, J. J.: Identifying Signatures of Natural Climate Variability in Time Series of Global-Mean Surface Temperature: Methodology and Insights, J. Climate, 22, 6120–6141, 2009. a
Uesawa, D.: Clear Sky Radiance (CSR) product from MTSAT-1R, Meteorological Satellite CenterTechnical Note, 39–48, 2009. a
Ventress, L. J., McGarragh, G., Carboni, E., Smith, A. J., and Grainger, R. G.: Retrieval of ash properties from IASI measurements, Atmos. Meas. Tech., 9, 5407–5422, https://doi.org/10.5194/amt-9-5407-2016, 2016. a
Vernier, J.-P., Thomason, L. W., Pommereau, J.-P., Bourassa, A., Pelon, J., Garnier, A., Hauchecorne, A., Blanot, L., Trepte, C., Degenstein, D., and Vargas, F.: Major influence of tropical volcanic eruptions on the stratospheric aerosol layer during the last decade, Geophys. Res. Lett., 38, L12807, https://doi.org/10.1029/2011GL047563, 2011. a
Vernier, J.-P., Fairlie, T. D., Deshler, T., Natarajan, M., Knepp, T., Foster, K., Wienhold, F. G., Bedka, K. M., Thomason, L., and Trepte, C.: In situ and space-based observations of the Kelud volcanic plume: The persistence of ash in the lower stratosphere, J. Geophys. Res.-Atmos., 121, 11104–11118, https://doi.org/10.1002/2016JD025344, 2016. a, b
Wu, X., Griessbach, S., and Hoffmann, L.: Equatorward dispersion of a high-latitude volcanic plume and its relation to the Asian summer monsoon: a case study of the Sarychev eruption in 2009, Atmos. Chem. Phys., 17, 13439–13455, https://doi.org/10.5194/acp-17-13439-2017, 2017. a
Wunderlich, F. and Mitchell, D. M.: Revisiting the observed surface climate response to large volcanic eruptions, Atmos. Chem. Phys., 17, 485–499, https://doi.org/10.5194/acp-17-485-2017, 2017. a
- Abstract
- Introduction
- Raikoke and Ulawun eruptions in 2019
- Methods
- Results
- Optical properties and the global impact on the radiative balance
- Conclusions
- Appendix A: Supporting material for Sect. 4.1
- Appendix B: Supporting material for Sect. 4.2
- Appendix C: Supporting material for Sect. 4.5
- Data availability
- Author contributions
- Competing interests
- Special issue statement
- Acknowledgements
- Financial support
- Review statement
- References