the Creative Commons Attribution 4.0 License.
the Creative Commons Attribution 4.0 License.
 | 21 Oct 2021
Technical note: Adsorption and desorption equilibria from statistical thermodynamics and rates from transition state theory
Daniel A. Knopf
Adsorption and desorption represent the initial processes of the interaction of gas species with the condensed phase. They have important implications for evaluating heterogeneous (gas-to-solid) and multiphase chemical kinetics involved in catalysis; environmental interfaces; and, in particular, aerosol particles. When describing gas uptake, gas-to-particle partitioning, and the chemical transformation of aerosol particles, parameters describing adsorption and desorption rates are crucial to assessing the underlying chemical kinetics such as surface reaction and surface-to-bulk transfer. For instance, the desorption lifetime, in turn, depends on the desorption free energy which is affected by the chosen adsorbate model. To assess the impact of those conditions on desorption energy and, thus, desorption lifetime, we provide a complete classical and statistical thermodynamic treatment of the adsorption and desorption process considering transition state theory for two typically applied adsorbate models, the 2D ideal gas and the 2D ideal lattice gas, the latter being equivalent to Langmuir adsorption. Both models apply to solid and liquid substrate surfaces. We derive the thermodynamic and microscopic relationships for adsorption and desorption equilibrium constants, adsorption and desorption rates, first-order adsorption and desorption rate coefficients, and the corresponding pre-exponential factors. Although some of these derivations can be found in the literature, this study aims to bring all derivations into one place to facilitate the interpretation and analysis of the variables driving adsorption and desorption for their application in multiphase chemical kinetics. This exercise allows for a microscopic interpretation of the underlying processes including the surface accommodation coefficient and highlights the importance of the choice of adsorbate model and standard states when analyzing and interpreting adsorption and desorption processes. We demonstrate how the choice of adsorbate model affects equilibrium surface concentrations and coverages, desorption rates, and decay of the adsorbate species with time. In addition, we show how those results differ when applying a concentration- or activity-based description. Our treatment demonstrates that the pre-exponential factor can differ by orders of magnitude depending on the choice of adsorbate model with similar effects on the desorption lifetime, yielding significant uncertainties in the desorption energy derived from experimentally derived desorption rates. Furthermore, uncertainties in surface coverage and assumptions about standard surface coverage can lead to significant changes in desorption energies derived from measured desorption rates. Providing a comprehensive thermodynamic and microscopic representation aims to guide theoretical and experimental assessments of desorption energies and estimate potential uncertainties in applied desorption energies and corresponding desorption lifetimes important for improving our understanding of multiphase chemical kinetics.
- Article
(3417 KB) - Full-text XML
-
Supplement
(405 KB) - BibTeX
- EndNote


Any interaction between gas-phase species and condensed matter, including liquid, semi-solid, and solid phases, commences by adsorption and desorption processes (McNaught and Wilkinson, 2014; Langmuir, 1915, 1916, 1918). These are of importance in the research areas of catalysis and, in particular, multiphase chemical kinetics or phase transfer kinetics involving environmental surfaces and interfaces (Cussler, 2009; Chorkendorff and Niemantsverdriet, 2007; Finlayson-Pitts and Pitts, 2000; Ravishankara, 1997; Solomon, 1999). Surfaces including water bodies, ice, and terrestrial and anthropogenic structures can provide interfaces at which phase transfer processes and multiphase and heterogeneous reactions can take place. In the atmospheric sciences, multiphase chemical reactions have been the foci of research since the realization that heterogeneous reactions on the surface of polar stratospheric clouds lead to the activation of inert chlorine reservoir species that subsequently result in ozone depletion, manifested in the spring southern hemispheric ozone hole (Solomon, 1999; Rowland, 1991). By now it is well established that gas–particle interactions play crucial roles in particle growth by condensation, gas–particle partitioning, and the chemical evolution of particles during aerosol formation and aging (Pöschl et al., 2007; Kolb et al., 2010; Rudich et al., 2007; George and Abbatt, 2010; Pöschl and Shiraiwa, 2015; Moise et al., 2015; Ammann et al., 2013; Crowley et al., 2013; Kroll et al., 2011; Donahue et al., 2011; Jimenez et al., 2009). The role of reversible adsorption and desorption has been addressed in many studies of gas uptake and multiphase chemical reactions, in particular for the decoupling of mass transport and chemical reaction (Kolb et al., 1995, 2010; Hanson and Ravishankara, 1991; Ammann et al., 2013; Crowley et al., 2013; Pöschl and Shiraiwa, 2015).
In the context of atmospheric sciences, adsorption is commonly described by the surface accommodation coefficient, αs, which is the probability that a molecule undergoing a gas kinetic collision is adsorbed at the surface (see overview and definitions by Kolb et al., 2010). For desorption, according to the Frenkel equation, the desorption lifetime (τd) of a surface-adsorbed chemical species (i.e., the adsorbate) follows an Arrhenius-type behavior (Arrhenius, 1889a, b; Laidler, 1949; Frenkel, 1924; Laidler et al., 1940):
where is the desorption energy with the energy reference of the gas molecule at rest at T=0 K (as outlined below), kd is a first-order desorption rate coefficient, A is a pre-exponential factor, R is the general gas constant, and T is temperature. Adsorption is treated as an activated process if an energy barrier exists. Desorption is always treated as an activated process, independent of whether an additional energy barrier exists. When describing multiphase chemical kinetics, kd affects the overall rate of transfer of a gas molecule into the bulk by impacting the loss rate by surface reaction and the surface-to-bulk transfer and, thus, the bulk accommodation coefficient (Ammann and Pöschl, 2007; Pöschl et al., 2007; Shiraiwa and Pöschl, 2021). For example, a kinetic multilayer model analysis of measured uptake coefficients for OH radicals on levoglucosan substrates yielded a tight correlation between τd and the chemical reaction rate coefficient at the surface because the experimental data only allowed us to constrain the product of the two (Arangio et al., 2015). A similar issue, the competition between adsorption (and uptake) and desorption, pertains to gas–particle partitioning kinetics when describing condensation of water vapor and volatile organic compounds (VOCs) and volatilization of organic reaction products (Shiraiwa et al., 2012, 2013; Shiraiwa and Seinfeld, 2012). Thus, accurate derivation of the chemical reaction kinetics requires accurate τd values. Atmospheric trace gases and water vapor can undergo reversible adsorption on aerosol, cloud, and ground surfaces over a wide range of temperatures from below 200 to above 300 K. Especially at low temperatures, large values of τd could counteract slow rates of chemical reaction and diffusion, enhancing the overall gas uptake, which may involve reversible, reactive, and catalytic processes on the surface or in the bulk of the particles (Ammann et al., 2013; Crowley et al., 2013; Kolb et al., 2010; Pöschl et al., 2007; Rudich et al., 2007; Li et al., 2020; Li and Knopf, 2021).
Equation (1) does not explicitly show that the desorption rate depends on the choice of adsorbate model and standard states. The same applies to the surface accommodation coefficient, which is not referring to the adsorbate model. Once the pre-exponential factor A for desorption is expressed in terms of the free energy of activation (Campbell et al., 2013, 2016; Donaldson et al., 2012; Kolasinski, 2012), the choice of adsorbate model and standard states has a significant impact on the values of the pre-exponential factor A and thus τd. Vice versa, when using experimentally observed desorption rates to derive , assumptions about the adsorbate model can result, as we show in this study, in significant changes in the corresponding values. It is known that the choice of standard states and adsorbate model impacts the interpretation of the equilibrium constant and the desorption process (Campbell et al., 2016; Donaldson et al., 2012; Kolasinski, 2012).
The difference in adsorbate models reflects the treatment of the potential well in which the adsorbate “sits” (Hill, 1986; Campbell et al., 2016). The most commonly applied adsorbate model is the 2D ideal gas which lacks 1 translational degree of freedom compared to the 3D ideal gas (Hill, 1986). It is defined by the condition of negligible lateral potential wells; thus, it can freely move parallel across the surface. The other extreme is the 2D ideal lattice gas where the absorbate cannot overcome the potential well of the adsorption site. Thus, it exerts only vibrational movements parallel and vertically to the surface. A model that can describe both extremes is, e.g., the ideal hindered translator model (Hill, 1986; Campbell et al., 2016; Sprowl et al., 2016). Which of the two models, the 2D ideal gas and the 2D ideal lattice gas, is realized will depend on the activation barrier for adsorbate diffusion parallel to the surface. If this activation barrier is above kBT (Boltzmann constant times temperature), the 2D ideal lattice gas model is the preferred model, whereas if it is below kBT, diffusion of adsorbates parallel to the surface can commence and the adsorption is described by a 2D ideal gas (Sprowl et al., 2016). The hindered translator model (Sprowl et al., 2016) is not discussed in this study. It will be shown that the choice of adsorbate model and corresponding standard states will result in different equilibrium constants; pre-exponential factors; and, thus, desorption rates but, counter-intuitively, in the same adsorption rates. Ultimately, the choice of the adsorbate model will also render and τd, important parameters when examining and interpreting the multiphase chemical kinetics at environmental interfaces.
The purpose of this study is to provide a holistic description of the thermodynamic functions derived from microscopic principles (i.e., corresponding partition functions) that allow for the calculation of the pre-exponential factor of the desorption rate based on transition state (TS) theory for the case of the 2D ideal gas and 2D ideal lattice gas. We will apply statistical thermodynamics to describe the microscopic, i.e., on the molecular level, processes and classical thermodynamics that define the overall energy and equilibrium conditions. The presented framework only considers physisorptive processes, within the general framework of treating adsorption in atmospheric chemistry (Kolb et al., 2010; Pöschl et al., 2007). Although many aspects of the presented derivations can be found in statistical thermodynamic textbooks (Hill, 1986; Kolasinski, 2012) and articles (Campbell et al., 2016; Donaldson et al., 2012; Savara, 2013), a complete treatment of adsorption and desorption including the TS and respective standard states is not readily available in the literature, as far as the authors are aware of. An outcome of this exercise is an improved understanding of the defining parameters that govern typically measured and reported thermodynamic parameters and their dependency on chosen standard states. For example, the presented derivations demonstrate that the pre-exponential factor, commonly assumed to be around 1013 s−1 (Atkins and de Paula, 2006), can differ by orders of magnitude in response to the choice of standard state and adsorbate model (Campbell et al., 2016). This, in turn, will alter interpretation and analyses of multiphase chemical kinetics occurring at interfaces.
The outline of this study is guided by ways to derive the thermodynamic functions. TS theory assumes thermodynamic equilibrium between the adsorbed state and the TS for desorption (Kolasinski, 2012; Eyring, 1935). The description of this equilibrium in terms of the basic thermodynamic functions is based on adsorption thermodynamics. Since the desorption rate and the pre-exponential factor are expressed in terms of molecular properties (i.e., the microscopic picture), the linkage between statistical thermodynamics and the thermodynamic functions has to be considered and applied. However, the foundational derivations for the thermodynamics and statistical thermodynamics of adsorption are not well established and not treated in comprehensive ways in textbooks. We therefore retrace this theory first for the case of desorption as an overall process. This will then serve as the basis for applying this theory to the TS theory for desorption and adsorption and to derive the pre-exponential factor for desorption. A great part of those derivations follows the treatment by Campbell et al. (2016). Subsequently, combination of the rate expressions of desorption and adsorption establishes the links between the overall adsorption thermodynamics and the microscopic kinetic parameters including the interpretation of the surface accommodation coefficient. In this study, the surface accommodation coefficient follows the definition by Kolb et al. (2010) valid for physisorptive processes and consistent with the Langmuir adsorption description but not necessarily the same as the sticking coefficient used in surface sciences or catalysis, which is often inconsistently defined and sometimes lumps or sometimes does not lump physisorption and chemisorption together. There are alternative descriptions such as the Kisliuk-type precursor mechanism that consider more complex configurations of the adsorbate (Kisliuk, 1957; Tully, 1994; Campbell et al., 2016), not discussed in this study. Lastly, we evaluate how our findings impact interpretation and analysis of measured or theoretically derived values.
Since the basis for describing desorption by TS theory requires consideration of thermodynamic equilibria, in Sects. 2 to 5 and the Supplement, we introduce first the overall desorption thermodynamics in more detail to provide the necessary equations and terminology. Section 2 discusses the general thermodynamic functions for describing adsorption and desorption, their derivations from microscopic properties (partition functions), and definitions of the standard states. Section 3 provides the derivation of equilibrium thermodynamic functions that describe the desorption process for the two different adsorbate models. The results so far are applied in Sect. 4 to derive the desorption rates and associated pre-exponential factors for the different adsorbate models in terms of thermodynamic and microscopic quantities. Section 5 presents the derivation of the adsorption rate including thermodynamic and microscopic treatment and evaluation of the surface accommodation coefficient. In Sect. 6, by combination of the previous results we consider the equilibrium between adsorption and desorption to derive the corresponding equilibrium constants demonstrating that the derivations are internally consistent. Section 7 provides the derivation of the kinetic parameters from equilibrium between adsorption and desorption. Section 8 discusses how the choices made for standard states and the type of adsorbate model impact surface concentration, activity, and coverage; adsorption and desorption rates; and τd values; and thus our interpretation of multiphase chemical kinetics. This is followed by the Conclusions section.
To fundamentally follow all derivations presented in this document, an excess number of equations would have needed to be shown, which would have rendered this document difficult to read. In the Supplement we provided all necessary definitions, equations, and derivations from first principles to follow the thoughts in the main document. The reader is encouraged to study this document side by side with the Supplement that contains all information leading to the results shown here. We apply the definitions of parameters and standard states given in the Supplement. The Supplement includes all necessary detailed derivations of the thermodynamic equations for 3D ideal gas, 2D ideal gas, 2D ideal lattice gas, and TS. It includes the following sections: (S1) Definition of desorption and adsorption equilibrium constants; (S2) Derivation of thermodynamic functions for desorption and adsorption; (S3) Standard molar enthalpies, entropies, and Gibbs free energies; (S4) Derivation of equilibrium constants; (S5) Standard molar Gibbs free energy change and equilibrium constant between the 3D ideal gas and the transition state for adsorption; and (S6) Adsorption–desorption equilibrium.
In this section we define the nomenclature, signage, and units involved in partition functions, thermodynamic quantities, and standard states when describing adsorption and desorption processes.
2.1 Gibbs free energy, enthalpy, and entropy of the adsorption and desorption process
The spontaneous occurrence of adsorption implies an exergonic process with the thermodynamic condition (Bolis, 2013):
Since adsorption of a gas on a substrate results in an increase in molecular ordering and , the change in enthalpy has to be negative. In this study, and are expressed in units of J mol−1 and in units of .
For the remainder of the text, the subscripts denote the process direction in the order of (from left to right) process (adsorption or desorption), educt (e.g., adsorbate), and product (e.g., gas species). Subscript m denotes molar quantities.
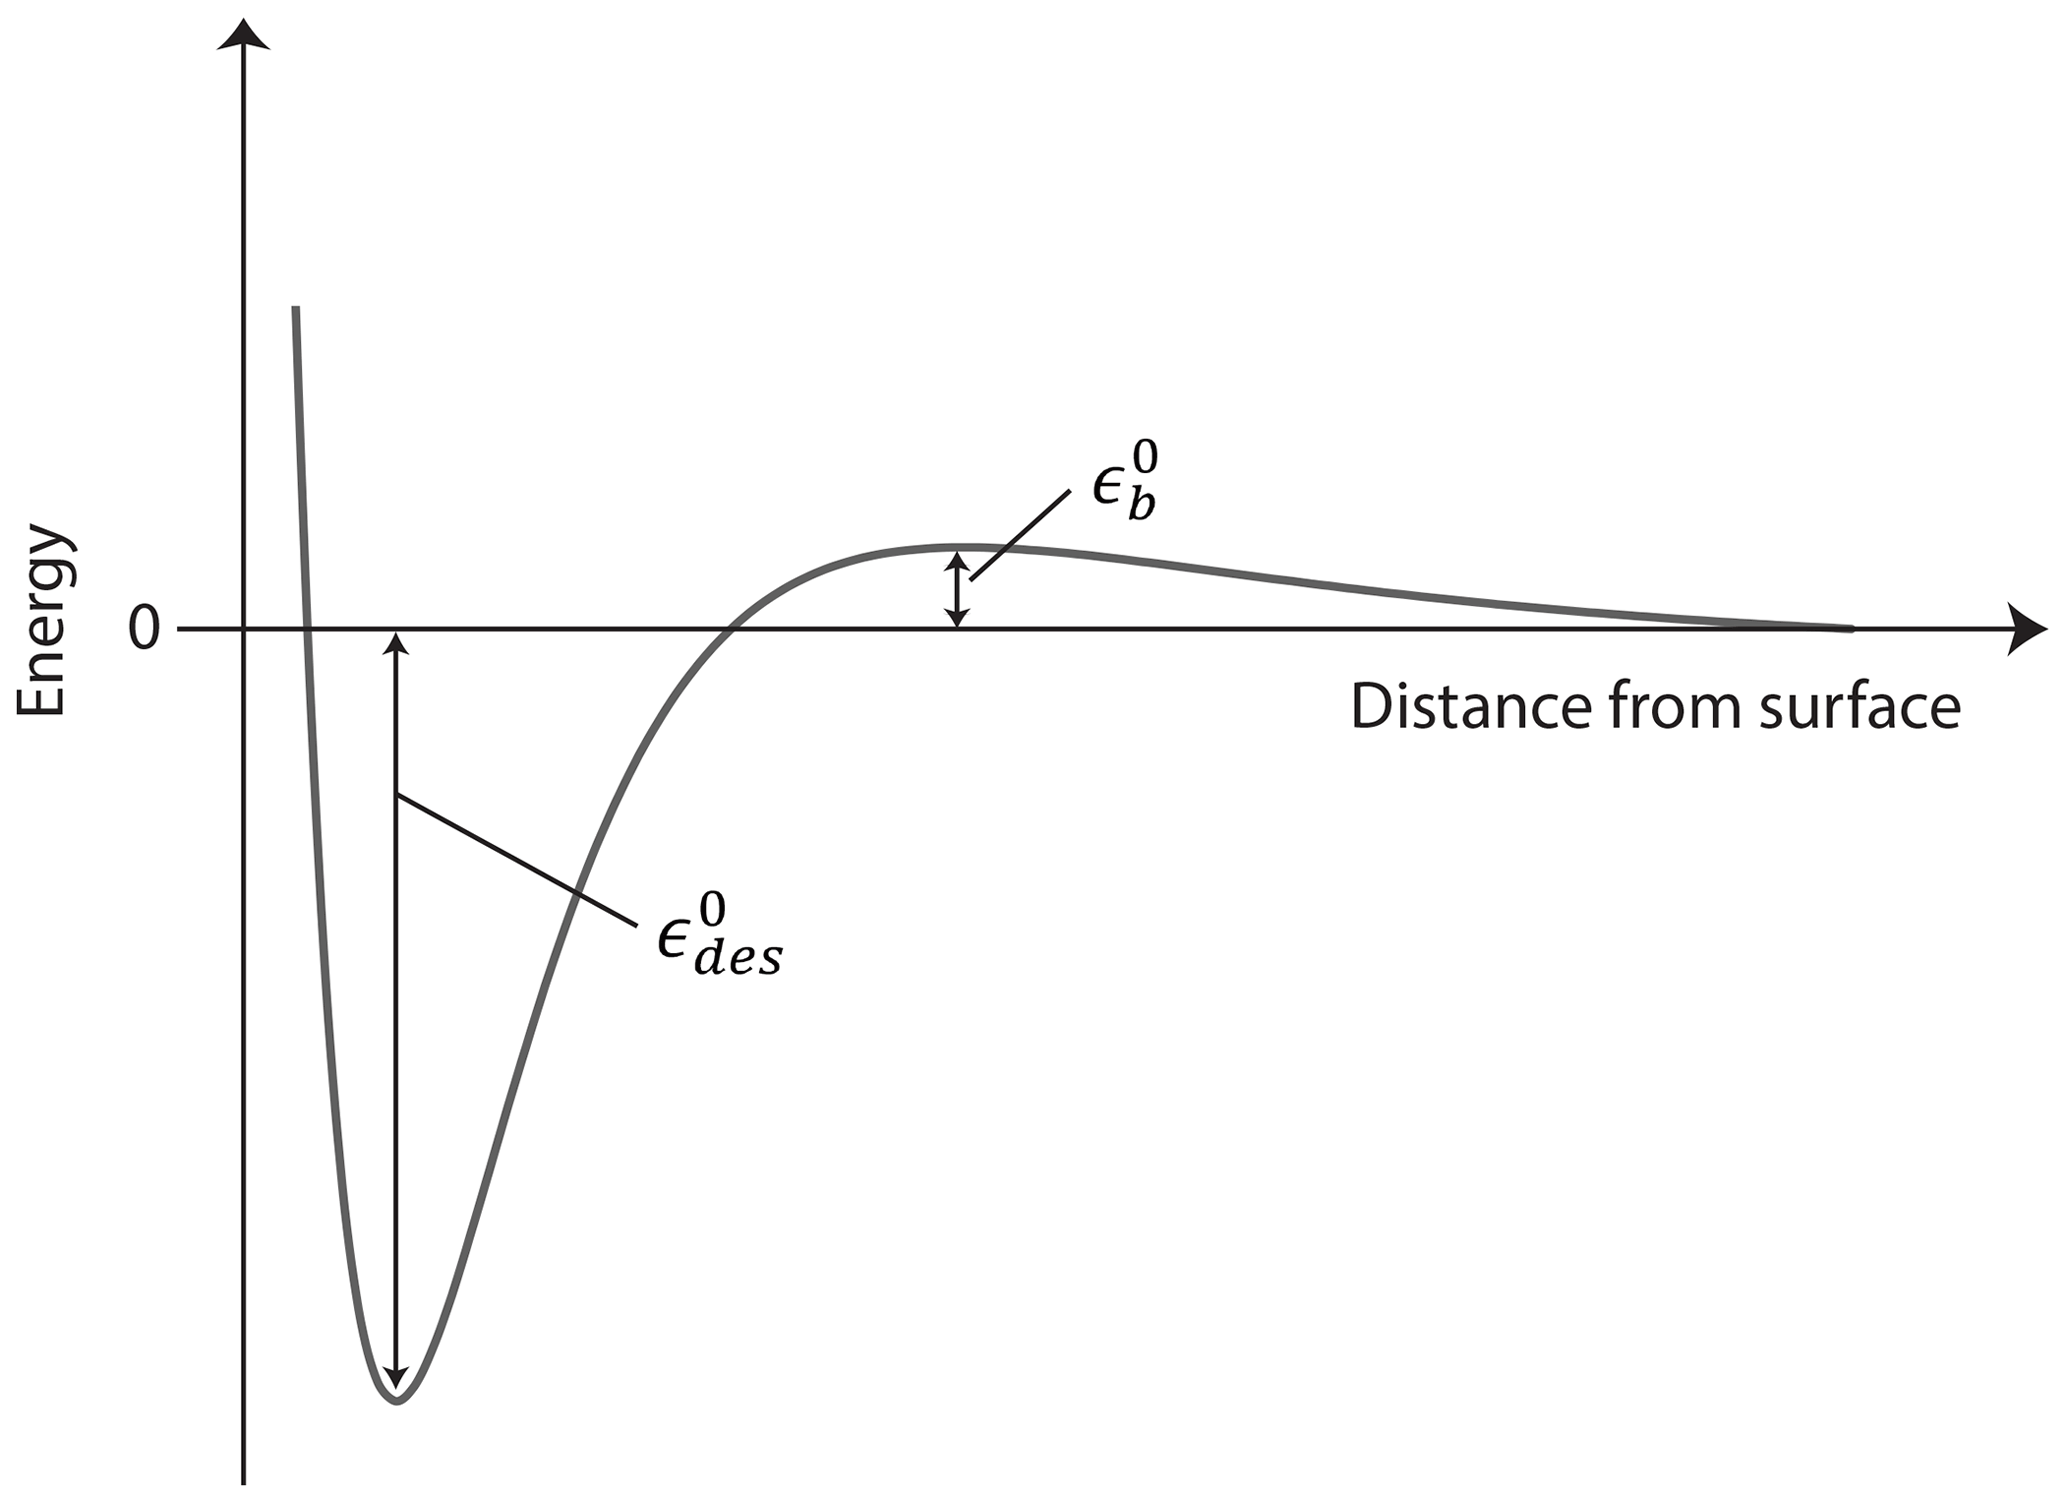
Figure 1Potential energy curve for adsorption and desorption processes expressed by the heat of desorption, . For activated adsorption and desorption processes an additional energy barrier, expressed by , must be overcome.
2.2 Adsorption and desorption energy and activation barrier
We define the energy reference as the internal energy, U, of the gas molecule at rest at T=0 K. The adsorbed or desorbing molecule is at the bottom of a potential well, at with being a positive number in units of joules indicating the necessary heat for the molecule to desorb as depicted in Fig. 1. Different processes can contribute to such as molecular rotations and vibrations or other molecular interactions. In molecular quantities and at a constant volume, accounting for the number of adsorbed molecules in the system, Nads, yields the internal energy of the adsorbate
where represents the molecular desorption energy. In molar quantities we obtain
and, thus,
We treat the general case of activated adsorption–desorption here, meaning that the TS's internal energy is elevated by the barrier height above the reference level. The TS for adsorption–desorption is assumed to exist at some fixed distance from the surface but within a very thin layer of thickness d, where it experiences an increase in potential energy (relative to the gas phase at infinite separation) to a maximum value expressed by the energy barrier due to its interaction with the surface (e.g., due to Pauli repulsion) as outlined in Fig. 1. We further assume for simplicity that at this TS distance from the surface, the potential energy does not depend on the rotational orientation of the molecule or on the location parallel to the surface. In molecular quantities, accounting for the number of molecules in the TS in the system, NTS, at a constant volume yields the internal energy of the TS
and in molar quantities
In the literature, the desorption energy often includes the energy barrier (Kolasinski, 2012), so the activation of desorption is, expressed in our notation here,
For the remainder of the document, we treat the desorption energy and energy barrier separately. In the absence of an energy barrier for adsorption and desorption, i.e., , all equations simplify accordingly. Note, however, as mentioned above, in the absence of a barrier, the desorption process remains an activated process with .
2.3 Relationship between partition functions and thermodynamic quantities
We use statistical thermodynamics to relate the microscopic properties to the matter's bulk properties. Via the partition function Q we can express the thermodynamic functions U, S (entropy), H (enthalpy), and G (Gibbs free energy) in the following way (Atkins and de Paula, 2006):
T and 𝒱 are the system's temperature and volume, respectively, and kB is the Boltzmann constant. We first calculate the molecular quantities U, H, G, and S and then express them as molar quantities:
where q is the molecular partition function (Atkins and de Paula, 2006), N is the number of molecules in the system, n is the number of moles in the system, NA is the Avogadro number, and R is the general gas constant.
As introduced below for the cases of 3D ideal gas, 2D ideal gas, 2D ideal lattice gas, and TS for desorption, we will apply the appropriate partition functions (see also Sect. S3 in the Supplement). For the 3D and 2D ideal gases we will use the canonical partition function, expressed for indistinguishable and independent molecules as (Atkins and de Paula, 2006). For the 2D ideal lattice gas, we will have to modify the canonical partition function to introduce adsorption sites (Hill, 1986).
2.4 Concentration, standard states of gas species and adsorbates, and activities
The concentration of the 3D ideal gas in the gas phase is given by
where Ng is the number of gas molecules in the system. Its standard concentration is
where is the standard number of moles of the gas species (typically set equal to 1) and indicates the standard molar volume reflecting . For mol, at 298 K and 1000 hPa. We define the gas-phase activity, ag, as the concentration in the gas phase, 𝒩g, divided by the standard concentration, :
We define the concentration for the adsorbate representing a 2D ideal gas as
where Nads is the number of gas molecules on the surface and 𝒜 is the surface of the system. Its standard concentration is
where is the standard number of moles of adsorbate and indicates the corresponding standard molar surface area. Several suggestions have been made for the surface concentrations (Donaldson et al., 2012; Ammann et al., 2013; Campbell et al., 2016; Kemball and Rideal, 1946; de Boer, 1968). Campbell et al. (2016) argue that when choosing , the adsorbate considered a 2D ideal gas has an entropy two-thirds of that of the gas species; i.e., when considering only the translational degrees of freedom (see below). Since a 2D ideal gas is a simple and straightforward assumption especially for physisorption, this standard state has advantages. This standard surface concentration corresponds to cm−2 at 298 K at 1000 hPa. In comparison, the IUPAC Task Group on Atmospheric Chemical Kinetic Data Evaluation is using cm−2 (Ammann et al., 2013; Crowley et al., 2013). We define the surface activity for the 2D ideal gas, aads,2D, as the concentration at the surface, 𝒩ads, divided by the standard surface concentration, :
We define the concentration for the molecule in the TS for desorption as
where NTS is the number of molecules in the TS. Its standard concentration is
where is the standard moles of TS molecules. Since the TS is assumed to exist at some fixed distance from the surface but within a very thin layer of thickness, it is treated as a 2D ideal gas, independent of the choice of model for the adsorbate. Hence, we define the surface activity for the TS, aTS, as the concentration of the TS, 𝒩TS, divided by the standard concentration of the TS, :
For many applications, it has been common to normalize the surface concentration, 𝒩ads, to a maximum concentration:
Then, the surface concentration can also be expressed as a coverage:
with a corresponding standard surface coverage
Similarly to the 3D ideal gas, for the 2D ideal gas case, in principle, there is also no limit to the surface concentration. To remain within physically reasonable bounds, all equations in conjunction with the 2D ideal gas model relate to conditions of surface coverages below a typical monolayer coverage of about 1014 cm−2.
For the 2D ideal lattice gas case, the maximum number of equivalent but distinguishable sites is Nads,max=M, which will be important for the statistical thermodynamic derivation (Sect. S2.3 in the Supplement). A physically reasonable choice for M is such that cm−2. Then, the standard surface coverage is θ0=0.0117 at 298 K. We define the surface activity for the 2D ideal lattice gas, aads,latt:
where aads,latt does not depend linearly on surface coverage, θ, and standard surface coverage, θ0. The reason for this, ultimately, lies in the canonical partition function describing equivalent but distinguishable adsorption sites (Eqs. S40 and S41 in the Supplement). For example, from the derivation of the chemical potential of the adsorbed 2D ideal lattice gas (Eq. S56 in the Supplement), it can be clearly seen that Eq. (28) provides a self-consistent definition of the activity for this adsorbate model. The difference between surface coverage and activity will be further discussed below.
We derive the desorption equilibrium constants for the 2D ideal gas and 2D ideal lattice gas in equilibrium with the gas phase considering the corresponding standard states and partition functions. See also general definitions for equilibrium constants outlined in Sect. S1 in the Supplement. For both adsorbate models we also derive the change in enthalpy and entropy between the adsorbed and the gas molecule. The derivations in this section will demonstrate the importance of standard states when calculating the equilibrium constants for the desorption processes.
3.1 Desorption equilibrium for adsorbed 2D ideal gas
The adsorbed 2D ideal gas is characterized by molecules moving freely parallel to the surface with a constant binding energy to the surface. In other words, the adsorbate vibrates in all directions but has free translational motion only in the horizontal plane. The thermodynamic desorption equilibrium constant is defined by the ratio of the activity in the gas phase (ag) to that on the surface (aads),
As indicated by the definition of the adsorbate surface activity, aads,2D, used in the definition of the equilibrium constant, for the 2D ideal gas, the surface activity and thus also the surface concentration are linearly correlated with the gas-phase activity and concentration (i.e., number density). This is often expressed with a constant (Klin) directly relating gas-phase number density with surface concentration (Crowley et al., 2010):
As mentioned above, no limitations by surface area or number of sites are convoluted in this equation. The relationship between Klin and the equilibrium constant is
The equilibrium constant, , is also related to the free energy change, . Since , we can associate the two free energies with the two partition functions for the two states and thus express the equilibrium constant as (see Eqs. S119–S123 with Eqs. S86, S89, S91, S93, S97, and S98 in the Supplement)
The two partition functions, and , are evaluated using the standard molar volume and area, respectively. Typical values for standard partition functions are given in Table S1 in the Supplement. The desorption or activation energy at the molecule's zero-point energy reflects the energy to elevate the adsorbed molecule from the lowest vibrational state to the lowest vibrational state of the activated complex, i.e., the molecular state from which the adsorbate can directly desorb into the gas phase. In other words, Edes corresponds to the depth of the potential well (per mole). It has a positive value as defined above (Eq. 5). When applying the standard adsorption enthalpy and entropy in Eq. (32) (via ), those have to be based on the same standard concentrations as given in Eqs. (17) and (20) to result in the same . Applying the expressions for the partition functions (see Eqs. S92 and S99 in the Supplement) gives
and thus it follows that
Hence, Klin can be readily calculated if vibrations are not considered. For a molecule at 298 K with a molecular weight of 60 g mol−1 and kJ mol−1, Klin is about 0.1 cm, a typical value also found experimentally for many species (Crowley et al., 2010).
The standard free energy change (and the equilibrium constant) is also related to the adsorption entropy and enthalpy via (Eqs. S119–S121 in the Supplement)
As shown in the Supplement (Eqs. S12, S28, and S120),
The enthalpy difference is due to the change in translational degrees of freedom between the 3D and 2D ideal gases and in the binding energy of the 2D ideal gas on the surface.
As derived in the Supplement (Eq. S16) from statistical thermodynamics, the entropy in the gas phase is given by the Sackur–Tetrode equation (Campbell et al., 2016; Atkins and de Paula, 2006; Hill, 1986) as
while the entropy on the surface is (Eq. S33 in the Supplement)
As already mentioned above, following Campbell et al. (2016), when choosing the standard state as , the entropy on the surface becomes two-thirds of that in the gas phase (Eq. 37) as evident from the following:
From this follows (Eq. S121 with Eq. S89 in the Supplement)
Using (Eq. 36) and (Eq. 40) together in the second part of Eq. (35) results in the last expression of Eq. (35). Thus, the expressions for the thermodynamic functions are all consistent with each other.
Substituting the definition of θ (Eq. 27) into the equation for the adsorption entropy (Eq. 39) leads to
Thus, the adsorption entropy can be considered the sum of a translational term, Strans,2D, and a coverage-dependent term, Scov. For θ0=0.012, Scov=5.42R. At room temperature, Strans,2D is around 23R.
3.2 Desorption equilibrium for adsorbed 2D ideal lattice gas
In contrast to the adsorbate being equivalent to a 2D ideal gas, where molecules freely diffuse parallel across the surface, the adsorbed molecule could also randomly populate a fixed number of adsorption sites, where the adsorbates have only vibrational degrees of freedom in three directions. This adsorption model is generally referred to as Langmuir adsorption (Langmuir, 1915, 1916, 1932). It is worthwhile noting that this concept holds for solid and liquid surfaces as long as the number of adsorption sites is given by M. In other words, it is not necessary to know how the M adsorption sites are distributed over the surface and time. The corresponding picture would be to treat the adsorbate as a 2D ideal lattice gas (Campbell et al., 2016). The activity is then given by (Sect. S2.3 in the Supplement). In analogy to Eq. (29), the equilibrium constant is formulated as the ratio of activities:
In the traditional formulation of Langmuir adsorption, the coverage is related to the gas-phase concentration via
where KLang is the Langmuir adsorption constant. From this, we can derive
This equation clearly demonstrates the usefulness of the definition of the adsorbate surface activity. Thus, for the relationship between the KLang and , we obtain
This relationship demonstrates that the functional form of the dependence of the surface coverage on pressure or concentration in the gas phase is the same for both definitions of the equilibrium constants (apart from the inverse formulation of the equilibrium constant as the ratio of gas-to-surface concentrations (Eq. 42) rather than the ratio of surface-to-gas concentrations). However, only can be related to the free energy change directly. Also in this case, the standard free energy change, , embodied in , can be related to the partition functions describing the molecules in the gas phase and adsorbed phases as (see Eqs. S131, S133, and S134 with Eqs. S86, S89, S91, S100, S103, and S105 in the Supplement)
When inserting the expressions for the standard molar partition functions for the translational motions (see Eq. S92 in the Supplement),
KLang can now be expressed as
Hence, KLang can be readily calculated. For a molecule at 273 K with a molecular weight of 48 g mol−1, vibration frequency of about 1013 s−1, and kJ mol−1, KLang is about 10−13 cm3, representing a typical value (Ammann et al., 2013).
Since is also related to the enthalpy and entropy of adsorption, we can write
In contrast to the case of the 2D ideal gas and neglecting vibrations, (Eq. S45 in the Supplement) due to the absence of translational motion (while in the gas phase, or for the 2D ideal gas, ). Also, as shown in Eq. (S49) in the Supplement (neglecting the contribution of vibrations in the gas and adsorbed phase), we obtain
Overall, for the change in enthalpy between gas and adsorbed states (see also Eq. S133 in the Supplement), we obtain
We can now obtain the relationship between the desorption energy and the adsorption enthalpy as
Thus, in the case of the 2D ideal lattice gas, the relationship between the desorption energy and the enthalpy contains the standard surface coverage explicitly.
For the entropy of the adsorbed 2D ideal lattice gas (Eqs. S54 and S103 in the Supplement), we can write (Campbell et al., 2016)
The adsorption entropy has a contribution for the vibrations in three dimensions at the site, Sads,latt,vib (related to qads,latt, Eq. S38 in the Supplement), and a configurational contribution, Sads,latt,config. Using the above standard state of θ0=0.012 leads to
Typical values for Svib for three dimensions at room temperature, assuming a vibration frequency of 1014 s−1, are around 4.90R (Campbell et al., 2016; McQuarrie, 2000; Atkins and de Paula, 2006). Note that another choice of θ0 has also been used, i.e., θ0=0.5, because then is unity. Consequently, this leads to a different numerical value for the standard adsorption entropy (Sads,latt,config=1.39R). The choice of the standard state adopted here and suggested by Campbell et al. (2016) has the advantage that the standard adsorbate coverage is low and the coverage-dependent contributions Sads,latt,config for the 2D ideal lattice gas and Scov for the 2D ideal gas have nearly the same value (5.417 and 5.423, respectively).
For the change in entropy upon desorption, we can derive (Eq. S135 in the Supplement; Campbell et al., 2016)
3.3 Adsorbate model comparison of surface concentration, activity, and coverage
We can now use the results in Sect. 3.1 and 3.2 to evaluate the equilibrium conditions between gas-phase and surface concentrations and activities and respective coverages for the 2D ideal gas and 2D ideal lattice gas, presented in Figs. 2–4. The thermodynamic quantities to reproduce these figures are given in Table S1. Figure 2 illustrates the behavior of the adsorption equilibria for the 2D ideal gas and the 2D ideal lattice gas cases in terms of surface concentration versus gas-phase concentration. As intuitively clear from the defining equations, for the 2D ideal gas case, the surface concentration increases linearly with gas-phase concentration without a limitation, thus increasing beyond a monolayer coverage, here assumed as 1019 m−2. In turn, for the 2D ideal lattice gas case, the initially linear increase is followed by the well-established adsorption saturation due to the limitation by the number of available sites on the surface, known as Langmuir adsorption. Note that we purposely chose a larger desorption energy for this case, leading to the higher initial slope. Assuming the same desorption energy for both cases, the initial slopes would be the same for both adsorption models. As shown in Fig. 3, when normalizing the surface concentration to the maximum number of adsorption sites to obtain the coverage, the picture remains the same.
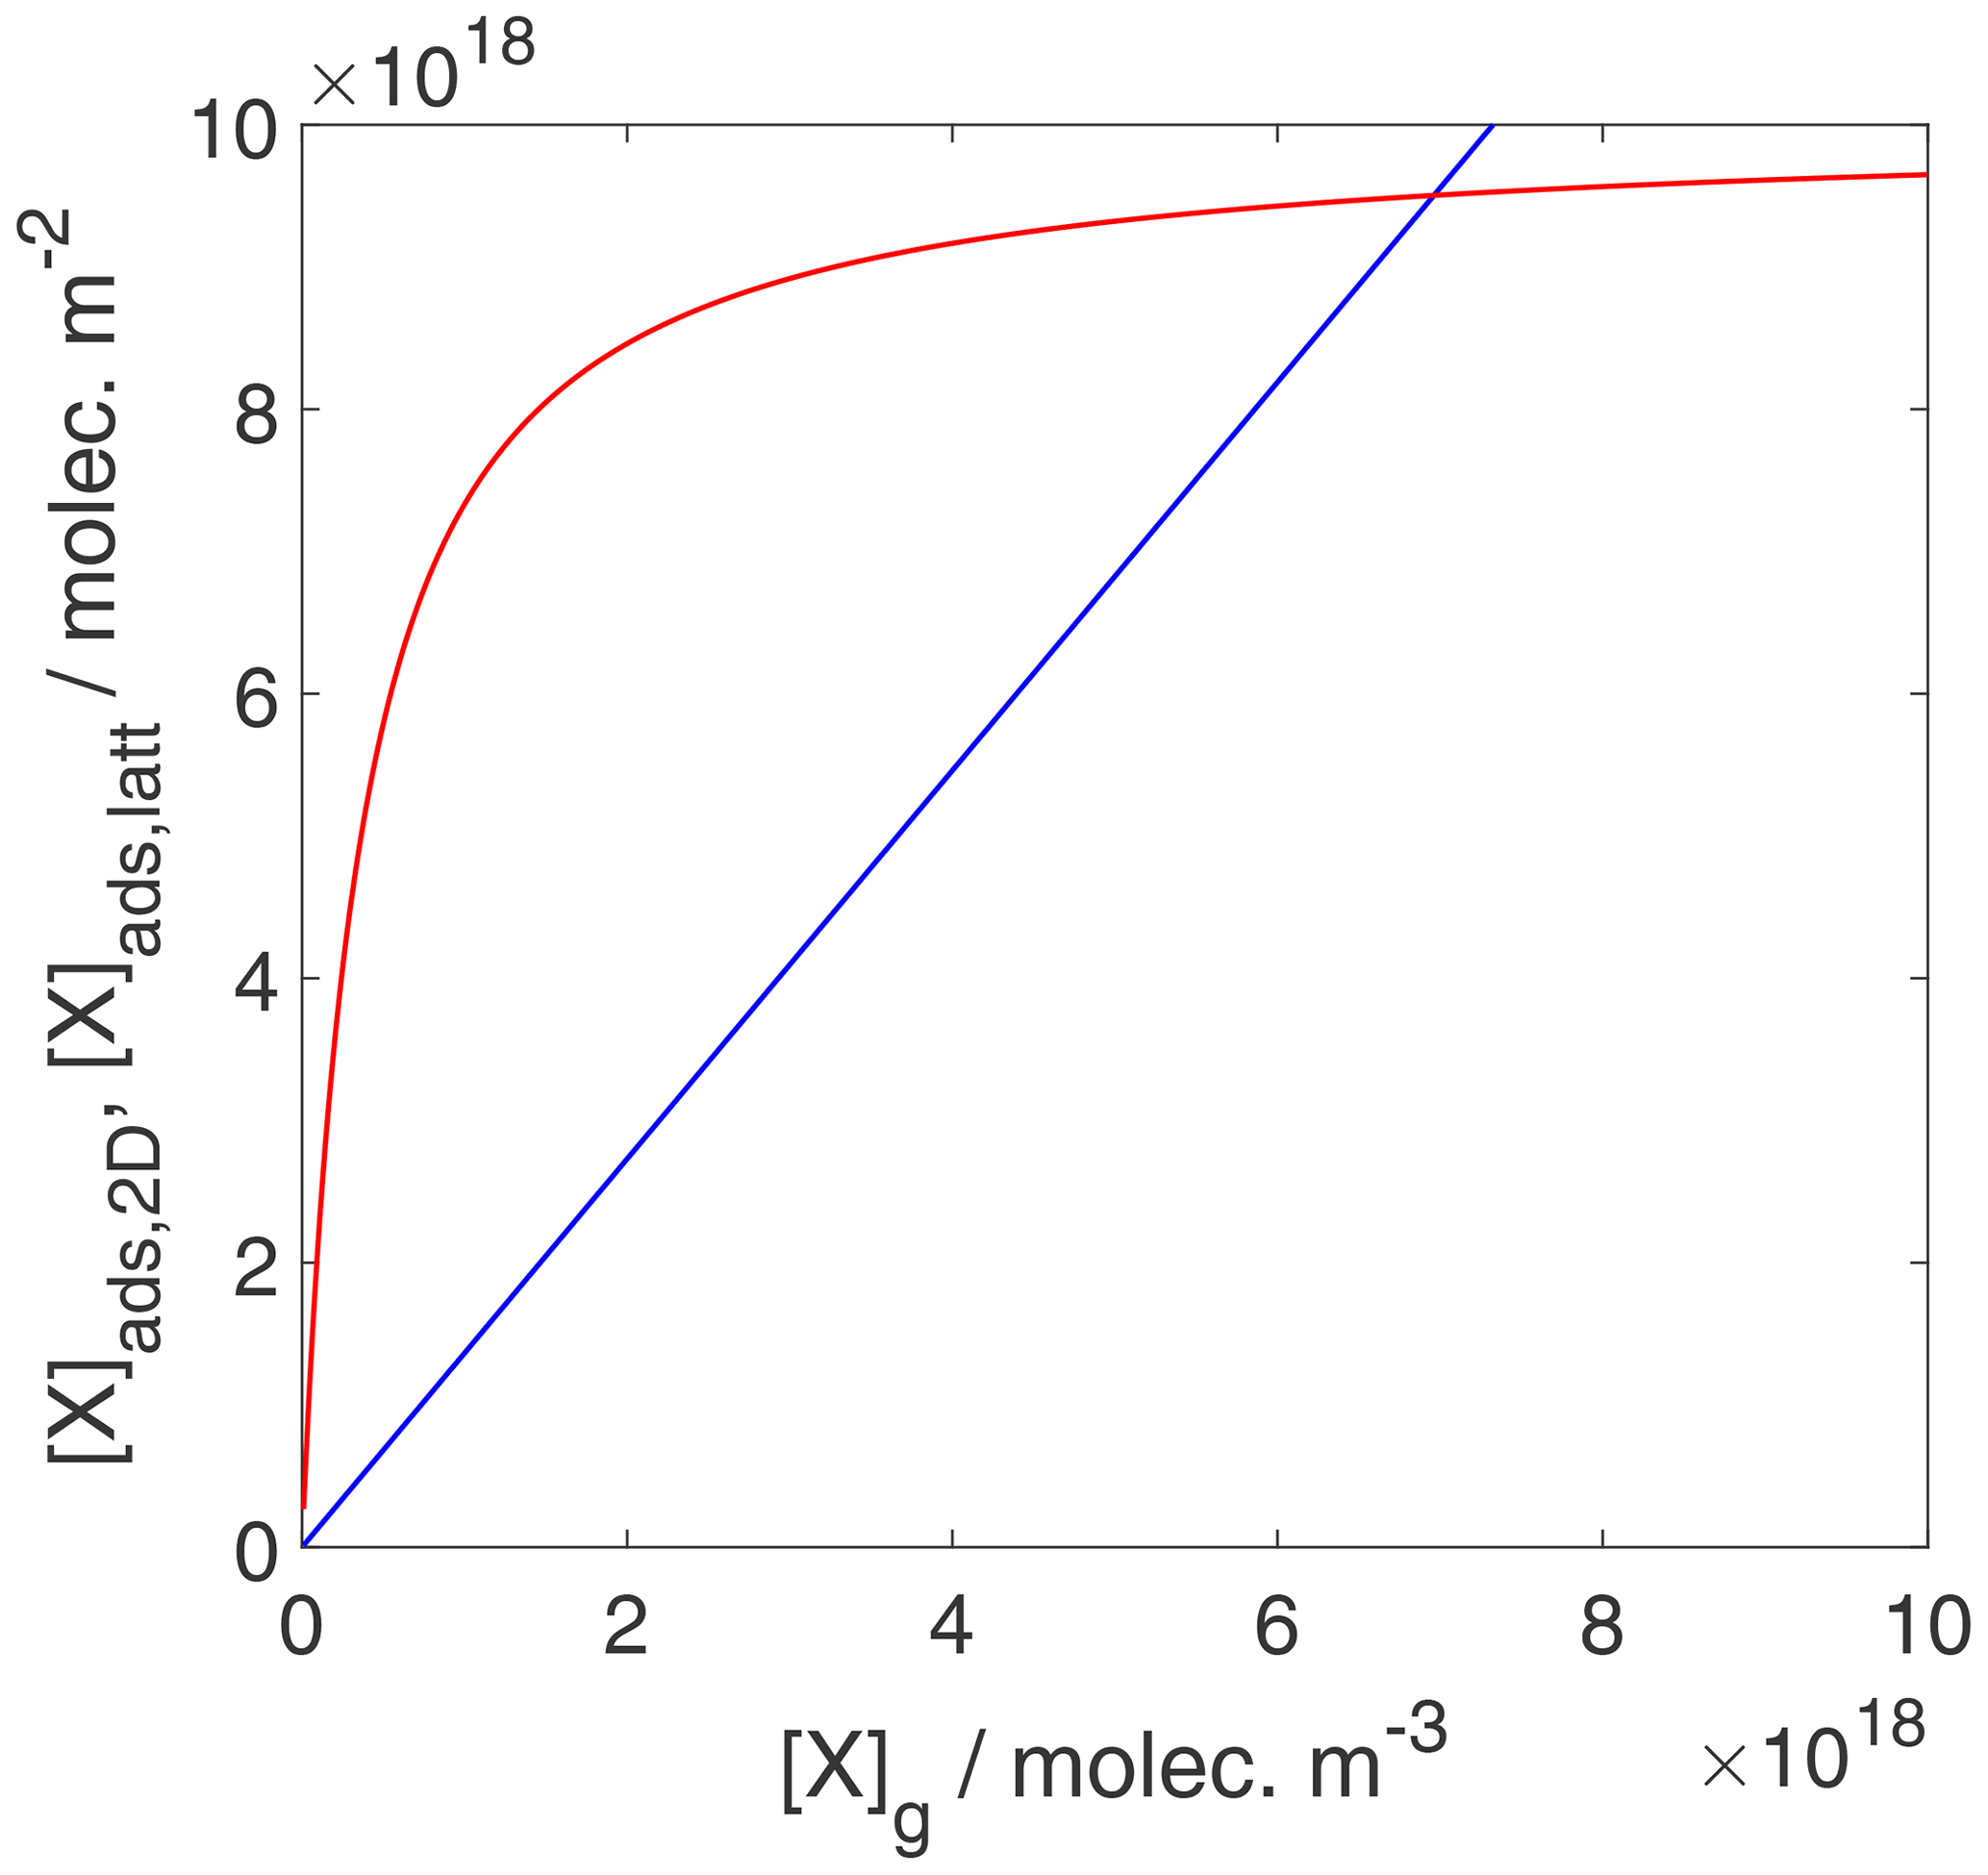
Figure 2Equilibrium adsorbate surface concentration as a function of gas-phase concentration for the case of a 2D ideal gas (blue line) and 2D ideal lattice gas (red line). Applied values are 63 and 88 kJ mol−1, respectively. We assume a desorption process without an additional barrier: . Thermodynamic quantities for calculation are given in Table S1.
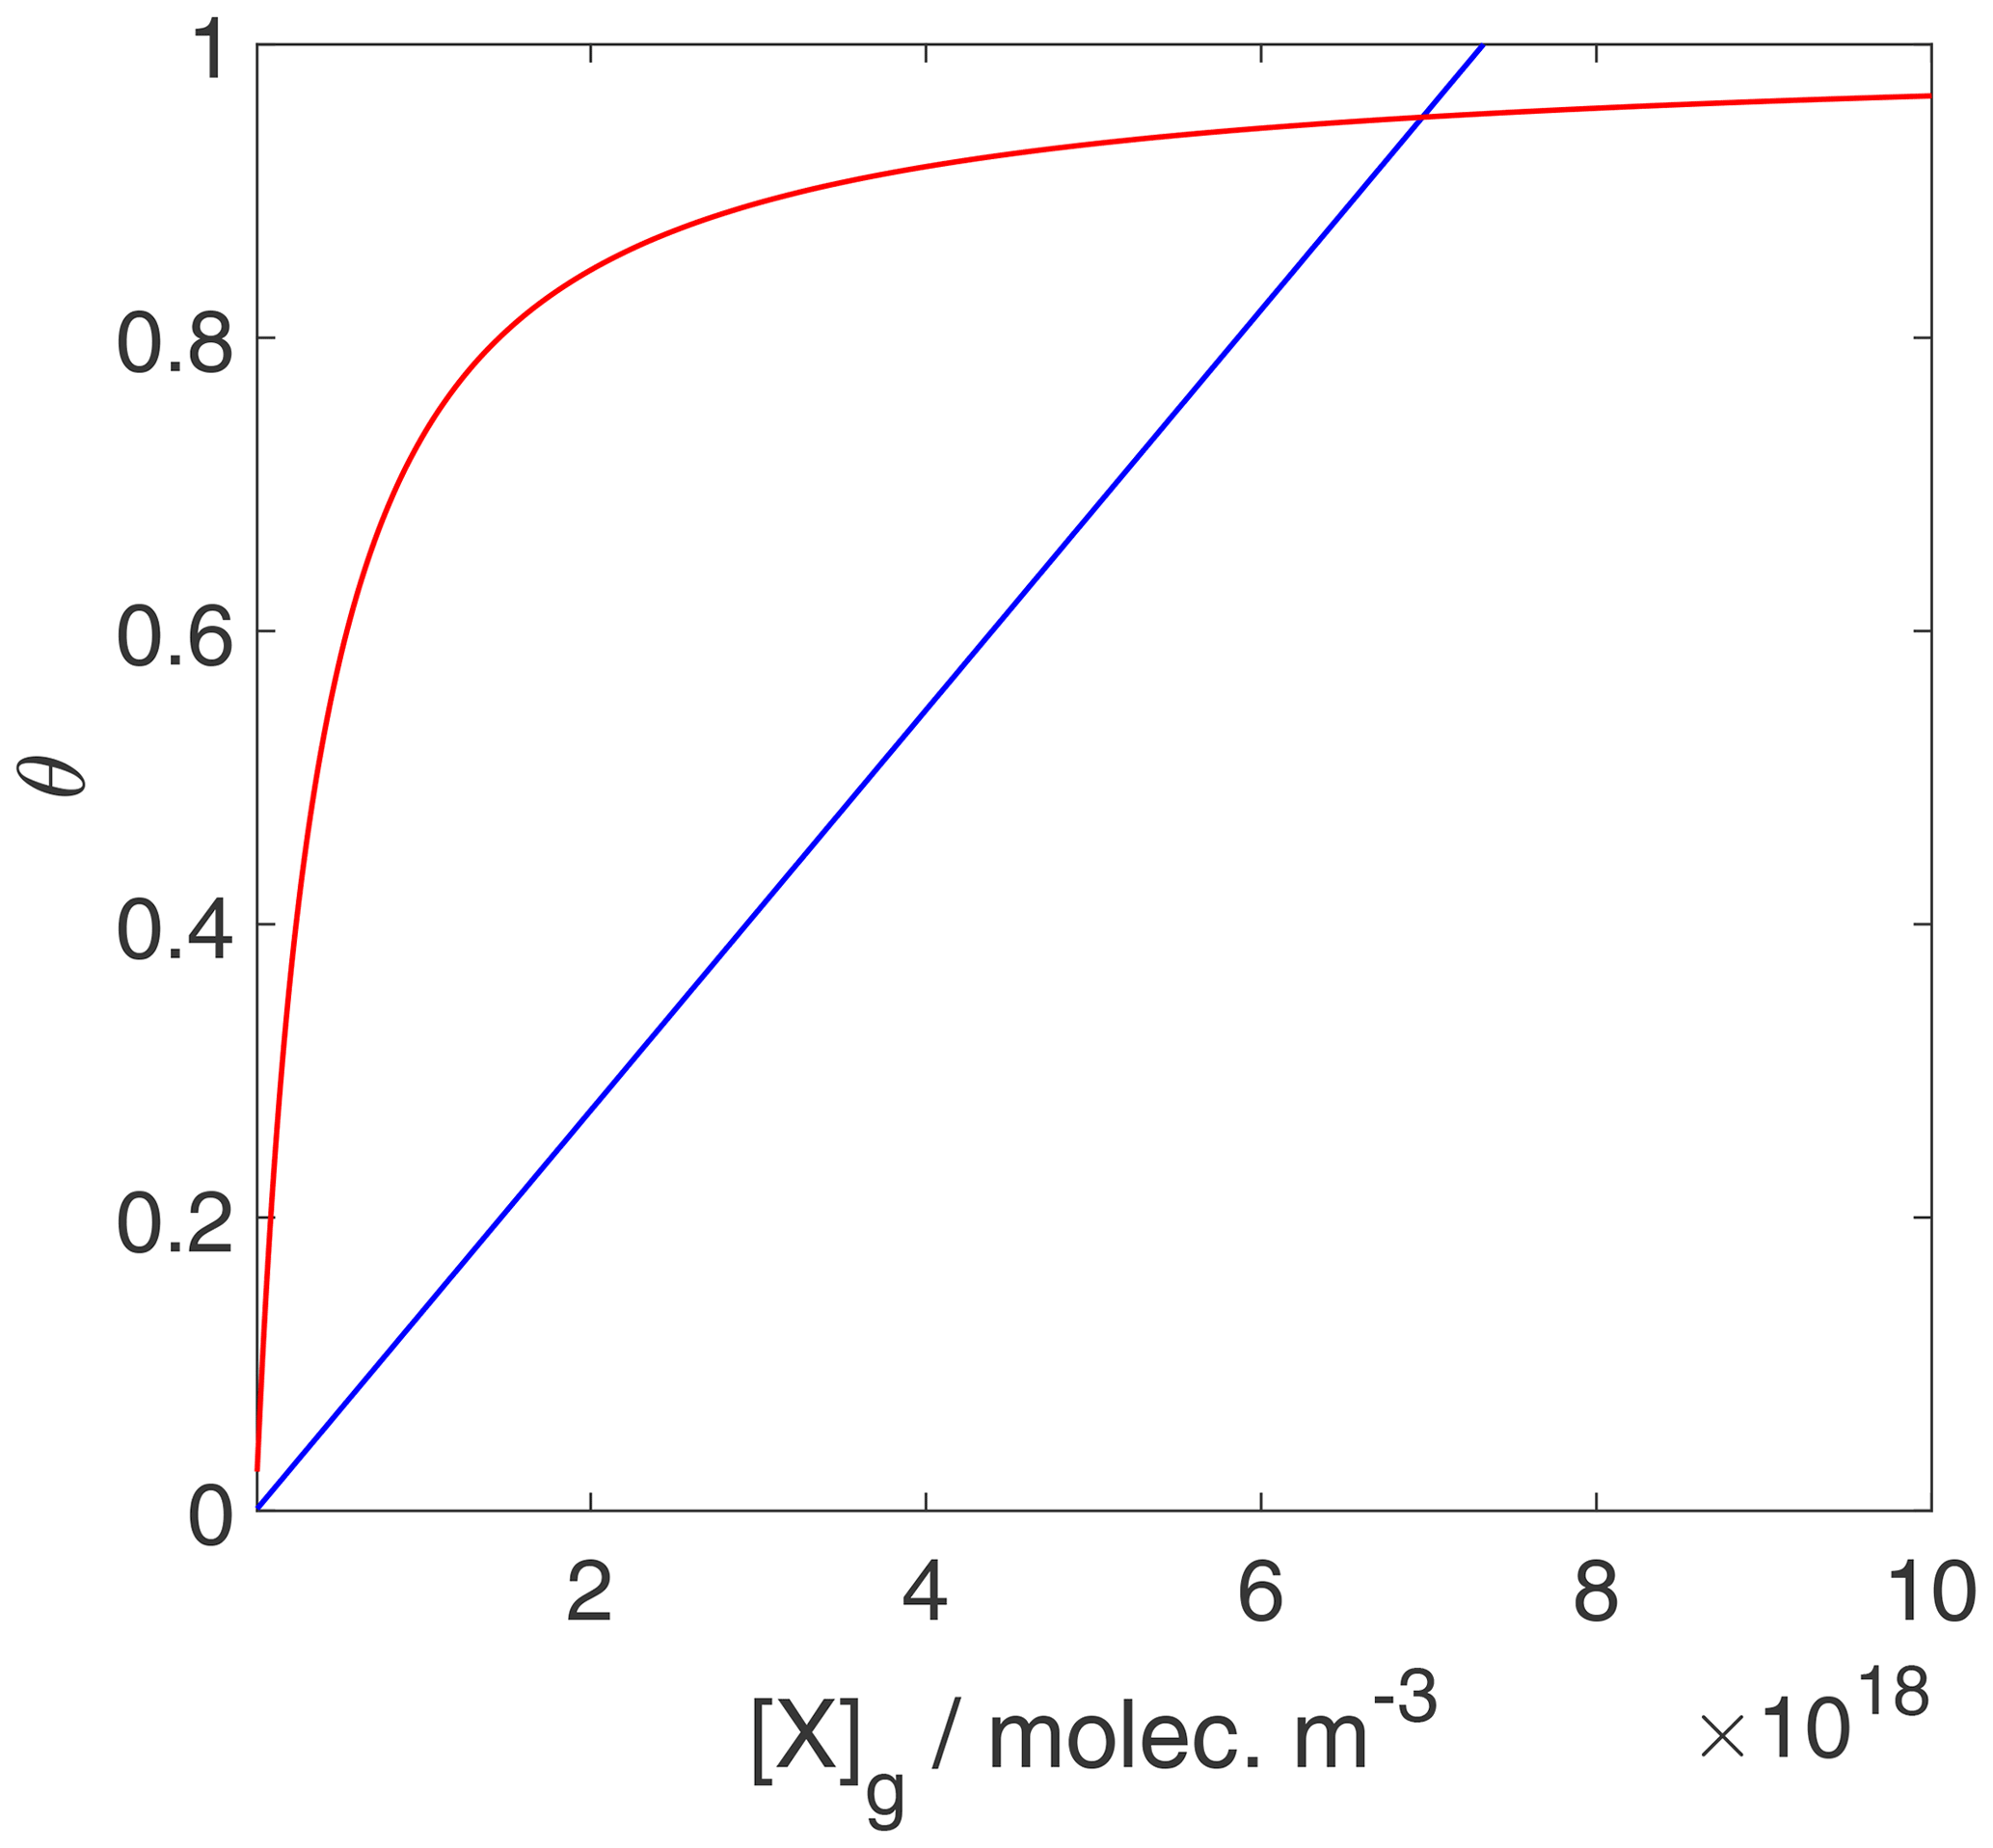
Figure 3Equilibrium surface coverage as a function of gas-phase concentration for the case of a 2D ideal gas (blue line) and 2D ideal lattice gas (red line). The data are the same as used for the derivation of Fig. 2, but surface coverages are derived by normalization with the maximum number of adsorption sites. Thermodynamic quantities and standard states necessary for calculation are given in Table S1.
In contrast to Figs. 2 and 3, when considered in terms of activities, both adsorbate models exhibit a linear relationship between the surface activity and the gas-phase activity as shown in Fig. 4. While trivial for the 2D ideal gas case, for the 2D ideal lattice gas case, this is related to the definition of the activity as being proportional to . Note that the gas-phase activity range in Fig. 4 covers the same gas-phase concentration range as in Figs. 2 and 3. Also note that the numerical values for the activities are completely different for the two cases. For example, for the 2D ideal gas case, at values of θ of 0.5 and 0.8, aads,2D is 42.8 and 68.4, respectively, while for the 2D ideal lattice gas at the same coverages, aads,latt is 85.9 and 336.8, respectively. On the one hand, the different slopes of surface activity as a function of gas-phase activity are related to the normalization to the two different standard states. On the other hand, when considered a function of θ, the relationship between the two surface activities is highly non-linear due to the diverging nature of the term for high θ.
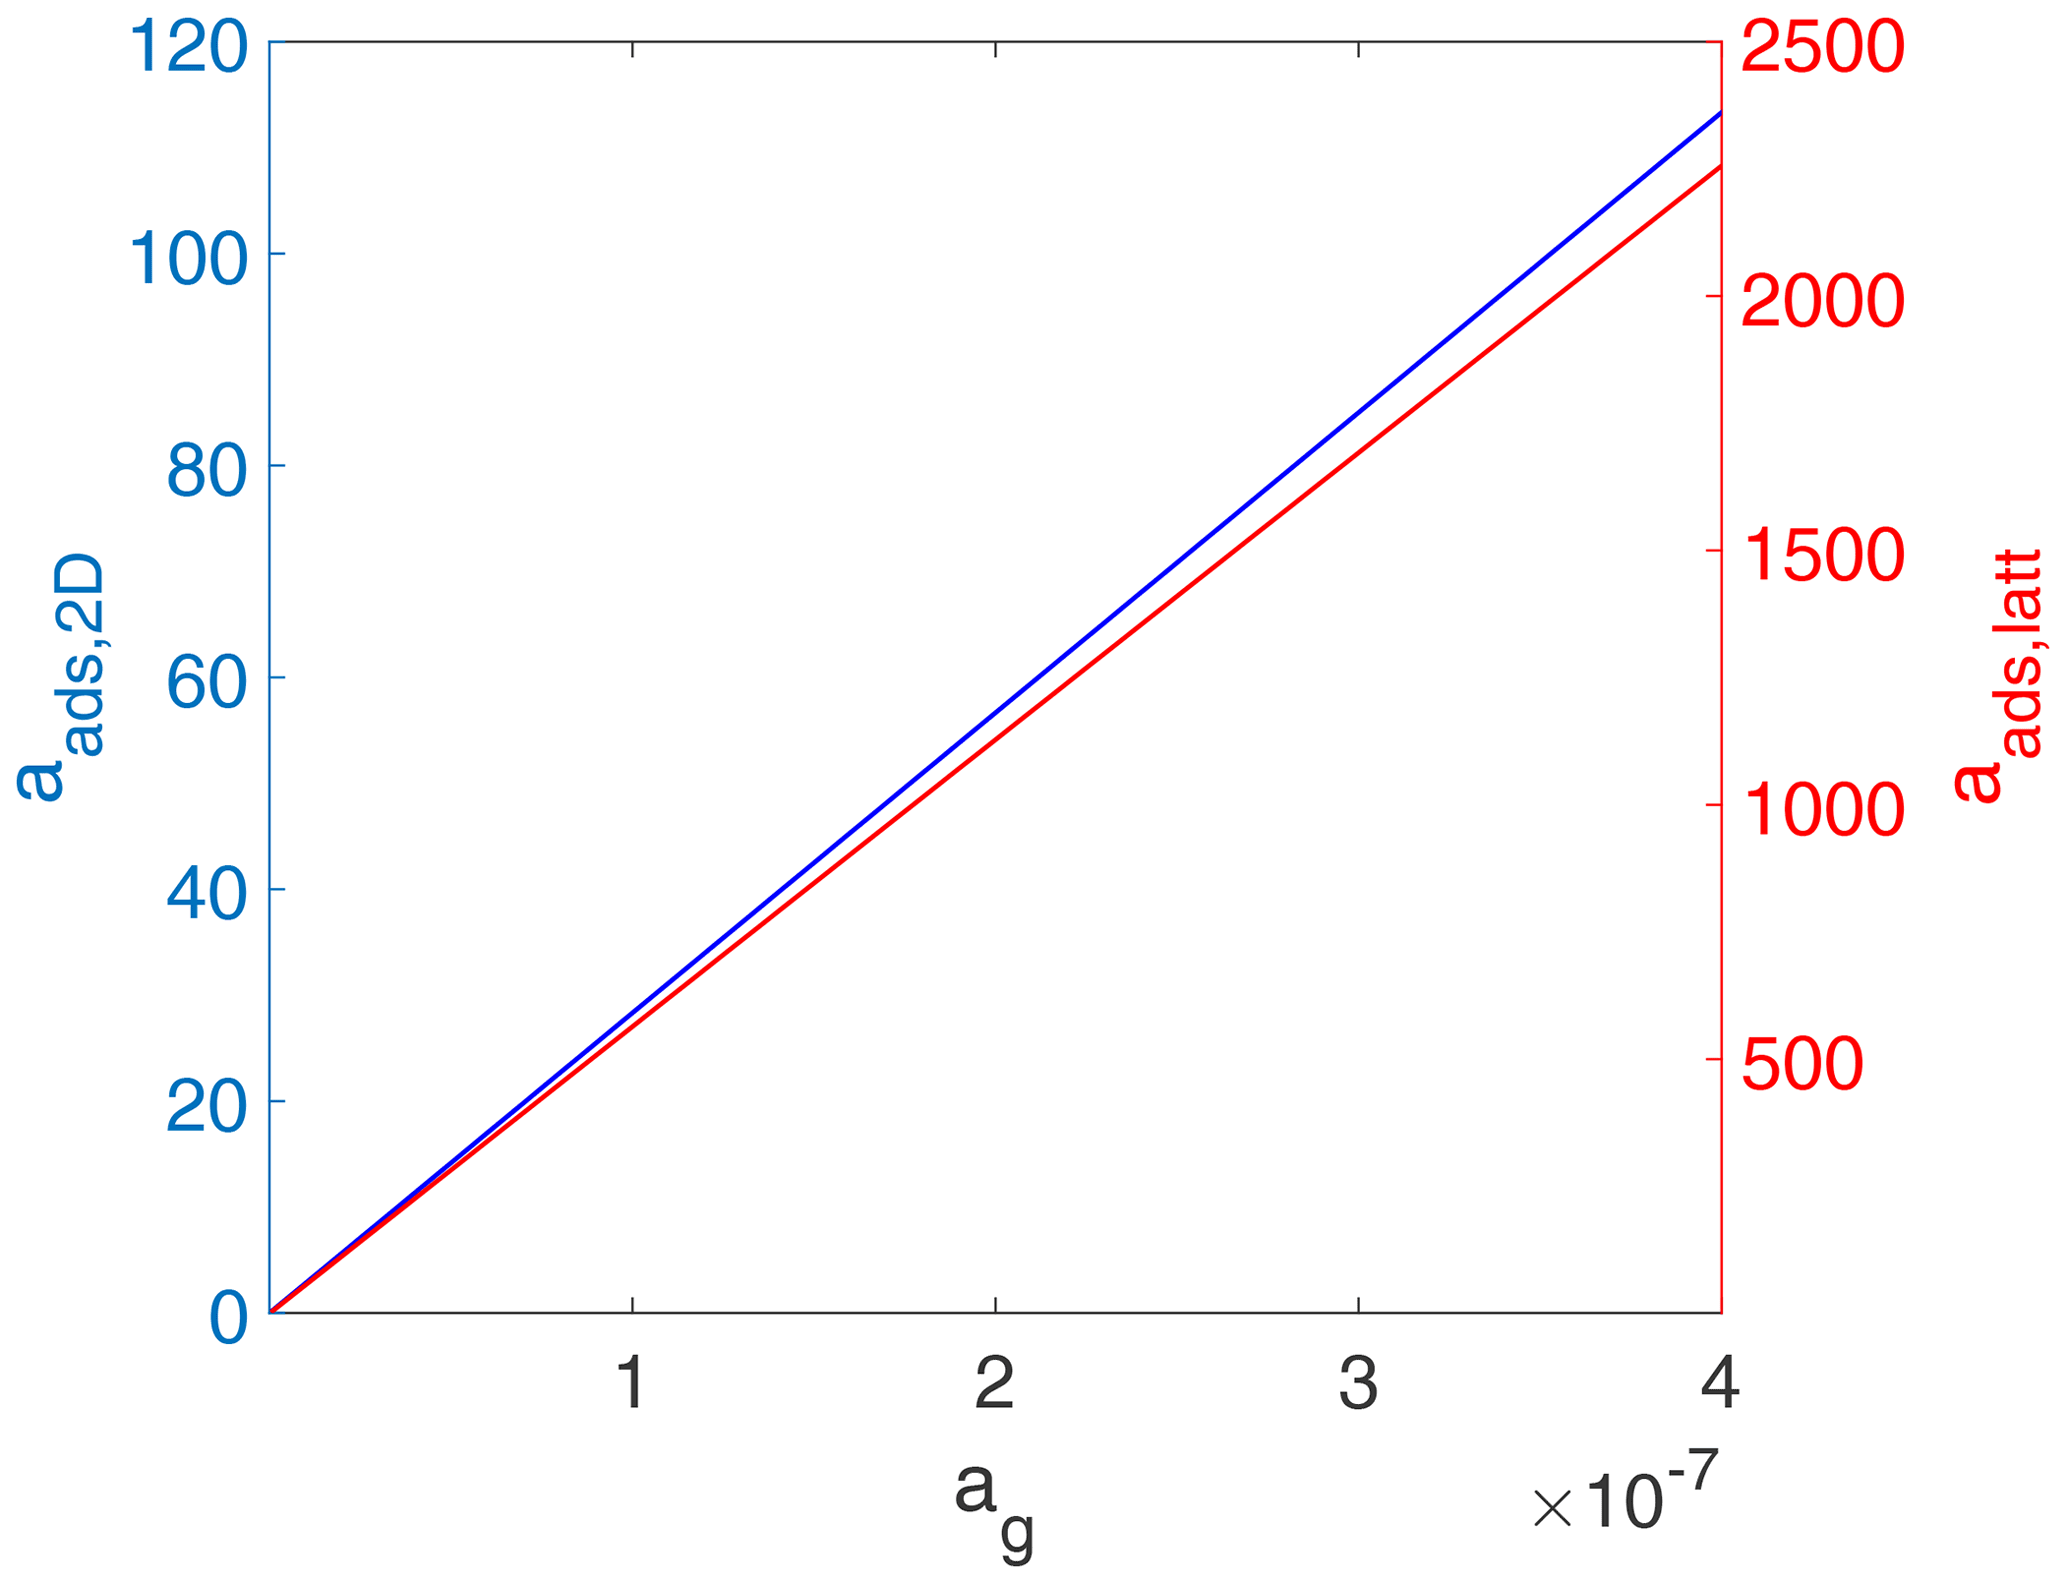
Figure 4Equilibrium surface activity as a function of gas-phase activity for the case of a 2D ideal gas (blue line) and 2D ideal lattice gas (red line). The data are the same as used for the derivation of Fig. 2. Thermodynamic quantities and standard states necessary for calculation are given in Table S1.
Above we have outlined the determination of the equilibrium constant and the importance of considering the standard concentrations. In this section we will derive the desorption rate and its pre-exponential factor A from TS theory, which starts from the free energy change between the adsorbate and the TS. This exercise will demonstrate the necessity of knowing the standard state of the entropic contribution or the standard concentrations of the TS and adsorbate for the correct derivation of A. As we will show below, the pre-exponential factor A in the desorption rate coefficient, kdes, includes the entropic change between the adsorbed and TS of the desorbing molecule. If we would like to calculate A, the standard desorption entropy has to be based on the same standard concentrations as those for the definition of the activity. Again, the same activity definitions have to be applied to calculate actual desorption rates. We will see that without knowledge of the chosen standard state of the entropy or standard concentrations of TS and adsorbate species, A cannot be accurately derived. Furthermore, we examine two cases of adsorbate where we first treat the adsorbate as a 2D ideal gas and secondly as a 2D ideal lattice gas. The TS is treated as a 2D ideal gas in both cases. This section follows the derivations outlined in Campbell et al. (2016). Detailed derivations are given in the Supplement.
In general, the desorption rate can be expressed as
where kdes represents the first-order rate coefficient for desorption (in units of s−1), describing the rate of change of surface concentration. As is evident from the definitions of activity above, the surface concentration is not necessarily proportional to the surface activity. We therefore introduce a separate rate expression and corresponding desorption rate coefficient acting on surface activities, and , respectively, as
4.1 Desorption of a 2D ideal gas
According to conventional transition state theory (CTST) (Kolasinski, 2012), Edes is the activation energy necessary to elevate an adsorbed species from the lowest vibrational state to the lowest vibrational state of the activated complex, i.e., the molecular state from which the adsorbate can directly desorb into the gas phase. Note that desorption is always considered an activated process, irrespective of whether an energy barrier is considered or not. In CTST, rates are derived from assuming equilibrium between the adsorbed state and the TS, which is the reason for discussing the overall adsorption–desorption equilibrium in detail above. The TS for desorption is assumed to exist at some fixed distance from the surface but within a very thin layer of thickness d, where it experiences an increase in potential energy to a maximum value expressed by the energy barrier due to its interaction with the surface as outlined above. In principle, the TS resembles a 2D ideal gas, but as discussed further below and in Sect. S3.4 in the Supplement, CTST assumes molecules in the TS exhibit translational motion along the reaction coordinate, which for the case of desorption is orthogonally away from the surface. The associated equilibrium constant is related to the free energy change between the adsorbed state and the TS, each expressed with the corresponding standard molar partition function, , and (Sects. S1, S2, and S4 and Eqs. S3, S22, S60, S117, and S152 in the Supplement):
The equilibrium constant is also related to the ratio of activities:
As discussed above, the entropy values depend strongly on the configuration (i.e., degrees of freedom) of the species in the adsorbed state and the TS.
Within this CTST approach, the desorption rate can be obtained by assuming that the TS has a finite width d across which the molecule moves with its mean thermal velocity in the direction orthogonal to the surface:
where κ is a transmission coefficient defining the probability with which an activated complex proceeds to desorption (Kolasinski, 2012). The partition function for the translational motion of the transition state in the direction of desorption is
Solving this for d and inserting it into Eq. (60) allows us to express the desorption rate as a function of this partition function:
The surface concentration of the TS can be derived from the equilibrium (Eq. 59):
Inserting Eq. (63) into Eq. (62) leads to
When considering surface activities, by dividing by the standard surface concentration we obtain
As further discussed in Sect. S3.4, the activation process can be conceptually envisioned by bringing the molecules in the 2D ideal gas from the zero-point energy to the actual energy level that allows for the formation of the TS. Thus, activation does not include the energy of the motion along the desorption coordinate and as such is less than the energy associated with the TS. When defining the of desorption as (see Eqs. S145 and S146 in the Supplement) minus the TS's free energy associated with the motion along the desorption coordinate, expressed by its molecular partition function, qTS,des, we obtain
With this definition of , we can express the desorption rate as
and obtain for the activity-based desorption rate
Thus, we can derive the desorption rate coefficient as
where we assume
Equation (69) is consistent with Eq. (4.4.24) in Kolasinski (2012), since the standard concentrations are the same for the TS and the adsorbed state in this case.
Following Campbell et al. (2016) defining as the partition function for the TS after omitting motion in the direction of the reaction coordinate, this leaves the partition function for a 2D ideal gas (Eq. S117 in the Supplement):
Using Eq. (70) in Eqs. (67) and (68), we obtain
and
Identifying Eq. (71) with Eq. (56) yields
We can convert the standard molar partition functions back to the molecular ones. For that, we consider that
and analogously for the TS, we then obtain
This yields
Hence, we have an expression for kdes,2D based on thermodynamic quantities (Eq. 69) and on molecular properties (Eq. 75). The latter is consistent with Eq. (4.4.20) given by (Kolasinski, 2012):
where q‡ represents the partition function of the TS, for which, in the explanation of Kolasinski, “the loose vibration in the direction of desorption has been factored out” and can be identified with . Note that factoring out a “loose” vibration has the same effect on qTS as assigning the TS a translation over the length d, as discussed above and in other textbooks (Hill, 1986; Pilling and Seakins, 1996). As outlined above, in the literature, the desorption energy often includes the energy barrier (Kolasinski, 2012); i.e., .
The above derivations include the definition of the free energy of desorption (i.e., the free energy change between the adsorbed state and the TS) and, thus, allow us to evaluate the pre-exponential factor A. We first formulate kdes using the definition of (Eq. 66), equate it with the expression in Eq. (75), and apply the relationship (Eq. S148 with Eqs. S108 and S93 in the Supplement):
With this, we can define the pre-exponential factor A as
Equation (78) demonstrates the relevance of knowing the standard state. The first expression on the right-hand side, the formulation in terms of the molecular partition functions (, qads,2D), indicates that the value of Ades,2D is directly linked to the assumptions of the adsorbate model as a basis for the calculation of the partition functions. In contrast, when Ades,2D is obtained from the entropy of activation (), the Arrhenius term needs to be corrected by the ratio of the standard states, .
Above derivations (Eq. 77) now allow for the interpretation of Ades,2D. Let us assume κ≈1. Also recall that if both adsorbed and TS are 2D ideal gases and if we neglect vibrations,
which is equivalent to having no significant change in entropy; i.e., . This leads to the commonly applied value of at room temperature (298 K). It is clear, that if the ratio of the partition functions deviates significantly from 1 and, thus, there are significant changes in when going from the adsorbed state to the activated state, substantial deviations from the “benchmark” value of 1013 s−1 are expected. For example,
which represents the case where a greater number of accessible configurations of the TS (more degrees of freedom) are available that are more easily excited by thermal energy than for the adsorbed state. In contrast,
indicates that the TS is constrained where, e.g., the molecule has to obtain a specific configuration in the activated complex. Campbell et al. (2013) showed that the observed variations in A for different adsorbates can be well described by a linear correlation between adsorbate entropies and gas-phase entropies provided the adsorbate's surface residence time is less than ∼1000 s. The underlying explanation is that the gas molecule's motions in the z direction are arrested (i.e., frustrated rotational and translational modes) resulting in a steep interaction potential well in the z direction, better described by a hindered translator model.
4.2 Desorption of a 2D ideal lattice gas
For the case of the adsorbate being a 2D ideal lattice gas but the TS being a 2D ideal gas, the associated equilibrium constant is related to the free energy change between the TS and the absorbed state, each expressed with the corresponding standard molar partition function, , and qads,latt (Eqs. S4, S38, and S175 in the Supplement):
The equilibrium constant is also related to the ratio of activities:
Note that qads,latt represents only vibrations and rotations. In addition, for the 2D ideal lattice gas, the surface activity is based on the coverage, and correspondingly, for the normalization to the standard state, replaces . Using the same procedure as for the 2D ideal gas case, i.e., rearranging Eq. (80), leads to (Campbell et al., 2016)
Setting this into Eq. (62) yields
We note that Eq. (82) differs from Eq. (71) for the ideal 2D gas, such that qads,latt has only vibrational degrees of freedom (instead of two translational motions) (Campbell et al., 2016).
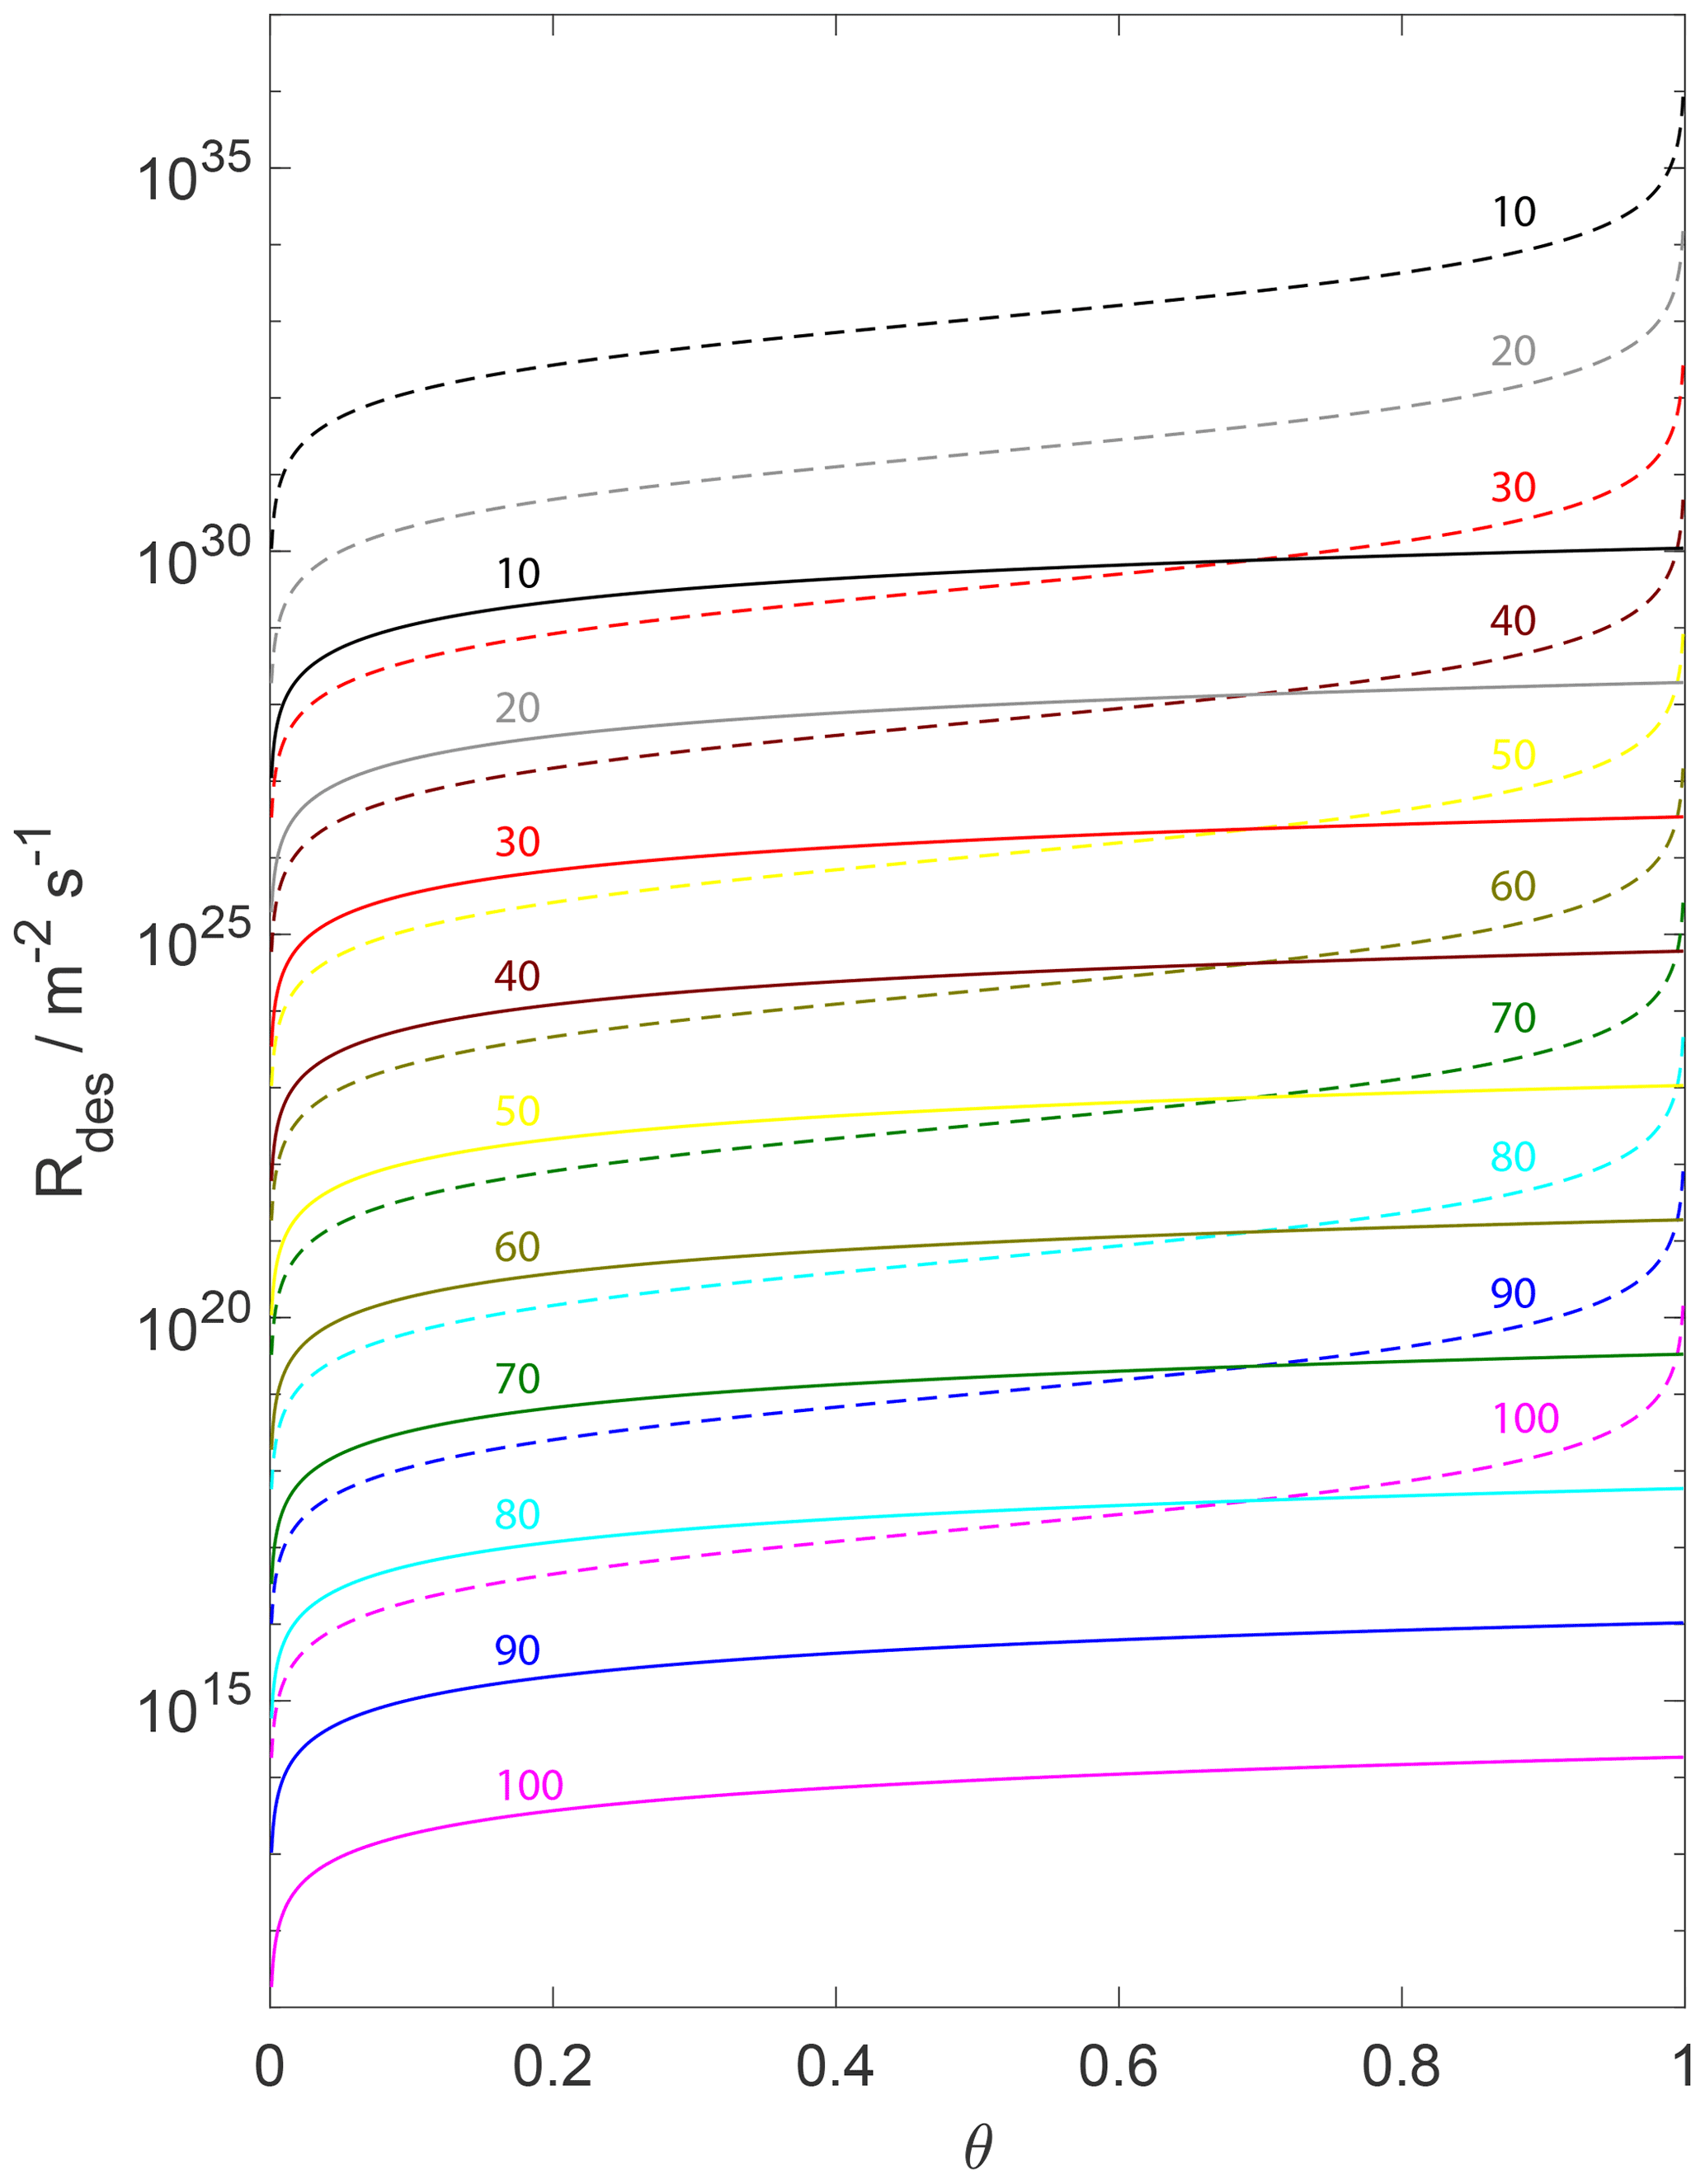
Figure 5The change in the desorption rate for the assumption of a 2D ideal gas (solid lines) and 2D ideal lattice gas (dashed lines) is plotted as a function of the adsorbate fractional surface coverage θ and variation in from 100 (bottom) to 10 kJ mol−1 (top) indicated by colored numbers. We assume a desorption process without an additional barrier: . Thermodynamic quantities and standard states necessary for calculation are given in Table S1.
Equation (82) highlights that the desorption rate is not proportional to the surface concentration but depends non-linearly on the surface coverage θ for high θ. Figure 5 highlights this behavior. The desorption rate first changes linearly with coverage for both adsorbate models but then strongly non-linearly for the 2D ideal lattice gas when approaching high (θ close to 1) surface coverages. This fact makes conversion of the rate expression to the surface activity challenging. The rate of change of surface activity is related to the rate of change of θ as (see Eqs. 26, 56, and S2 in the Supplement)
Assuming that the steady-state surface concentration of the TS remains much smaller than the number of adsorbed molecules (in a time interval necessary to populate the TS) and correspondingly the desorption rate remains relatively small in comparison to the actual coverage, we can write
since
In other words, for small rates of change of θ, the desorption rate in terms of rate of change of activity can be assumed to depend linearly on θ. Since this concerns the rate of change of θ, Eq. (84) holds for any coverage. This allows us to express the desorption rate in terms of activity as
Therefore, dividing Eq. (82) by leads to the corresponding activity-based desorption rate expression
We now follow a similar derivation as for the 2D ideal gas. We define the of desorption as minus the TS's free energy associated with the motion along the desorption coordinate and obtain
Thus, we can express the desorption rate for an adsorbate treated as a 2D ideal lattice gas as
The activity-based desorption rate expression becomes
Therefore, the desorption rate coefficient (in units of s−1) related to the surface activity is given by
While the activity-based desorption rate expression (Eq. 86) clearly displays the first-order decay behavior of the activity, driven by , Eqs. (82) and (88) demonstrate that when expressed in terms of molecules desorbing per unit area and time, it is not first order in the surface concentration but shows a strong dependence on the surface coverage, , otherwise included in the activity. Therefore, for high surface coverage, an apparent kdes,latt cannot easily be derived. For low coverage (of the adsorbate, not of the transition state),
the rate Eq. (82) simplifies to
From this it follows that . This demonstrates that the decay of surface concentration at high coverage cannot be used to derive , as also pointed out by Campbell et al. (2016). In other words, the decay of the surface coverage is not a first-order process at high coverages. Using Eq. (70) in Eq. (82) yields
Note that the last equation is consistent with the desorption rate derived by Campbell et al. (2016) for the special case of θ0=0.5.
We can now express the desorption rate coefficient as
For the second and third expression in Eq. (93), we have converted the standard molar partition function back to the molecular ones, using
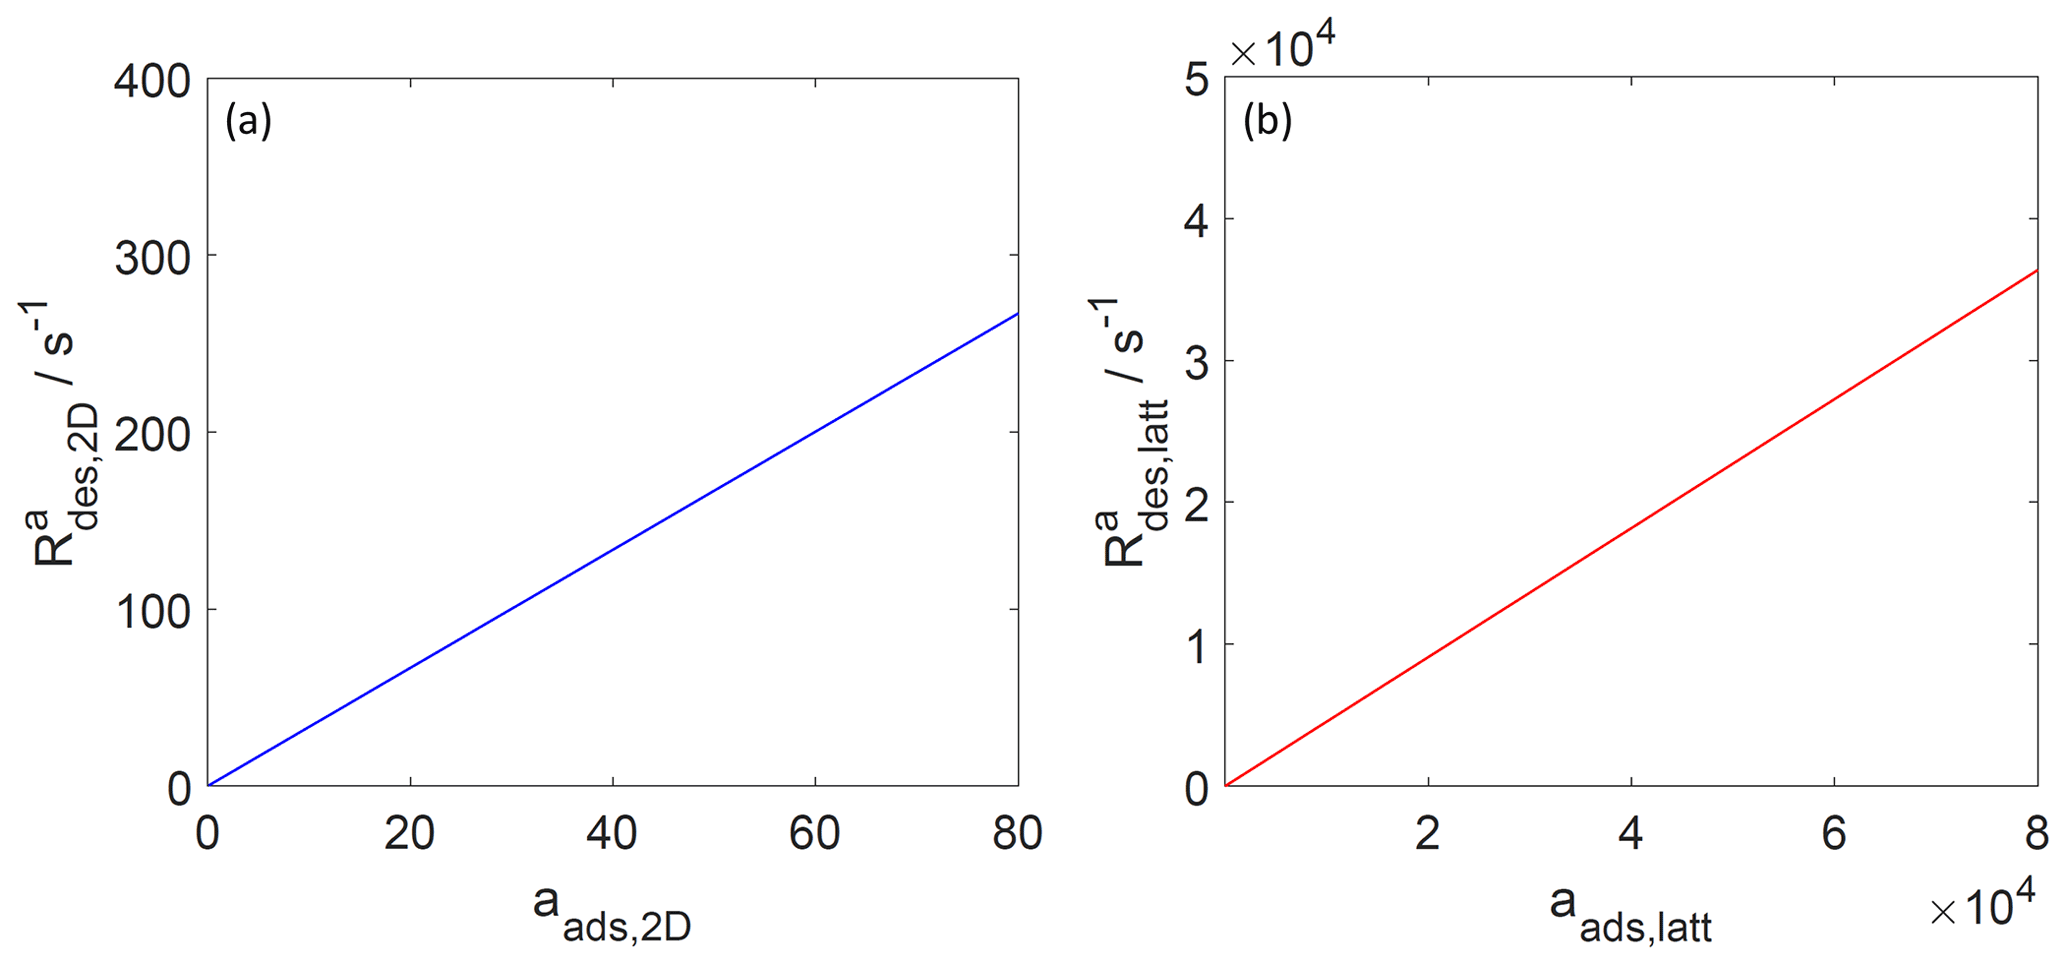
Figure 6The activity-based desorption rate for the case of a 2D ideal gas (blue line, a) and 2D ideal lattice gas (red line, b). Applied values are 70 and 92 kJ mol−1, respectively. We assume a desorption process without an additional barrier: . Thermodynamic quantities and standard states necessary for calculation are given in Table S1.
We can establish the link between the entropy and the pre-exponential factor by taking the expression for and inserting the definition of accounting for the relationship between and (Eqs. S108 and S171 in the Supplement):
Neglecting vibrations, we obtain
Then it follows that
With this, we can derive the pre-exponential factor as
We can, therefore, identify
Again, as for the previous case, Eqs. (96) and (97) clearly show that when using thermodynamic data to assess the TS, the correct standard state needs to be applied to calculate from the entropy of activation.
4.3 Adsorbate model comparison of desorption rate and pre-exponential factor
Since, strictly speaking, the desorption rate law is representing a first-order process acting on the surface activity, it is also straightforward to understand that the desorption rate, when expressed as rate of change of activity per unit time is proportional to the surface activity, as shown in Fig. 6, independent of the adsorbate model. Thus, even when the surface coverage becomes high, the activity-based first-order desorption rate coefficient remains constant. The consequence of this becomes then directly apparent in Fig. 7, showing the desorption rate expressed as the rate of change of surface concentration per unit area and unit time, as a function of the surface coverage. For the 2D ideal gas case, the linear relationship is maintained; i.e., the surface concentration-based desorption rate coefficient is constant and thus independent of the surface coverage. In contrast, for the 2D ideal lattice gas case, the desorption rate rapidly increases towards high surface coverages, clearly demonstrating the non-first-order behavior of desorption when expressed in terms of surface concentration. This behavior is a consequence of the high configurational entropy at high coverages and naturally results from a consistent description of the surface activity. Therefore, the dependency of the desorption rate on coverage is not due to surface sites with different desorption energies but is a consequence of the applied lattice gas adsorption model that entails a limited number of equivalent sites. In other words, the lifetime of an individual adsorbate molecule depends on the overall surface coverage, exerting shorter adsorbate lifetimes for greater surface coverages. Therefore, as also pointed out by Campbell et al. (2016), experimental desorption rate measurements need to be analyzed with care when deriving the desorption energy from measured desorption rates.
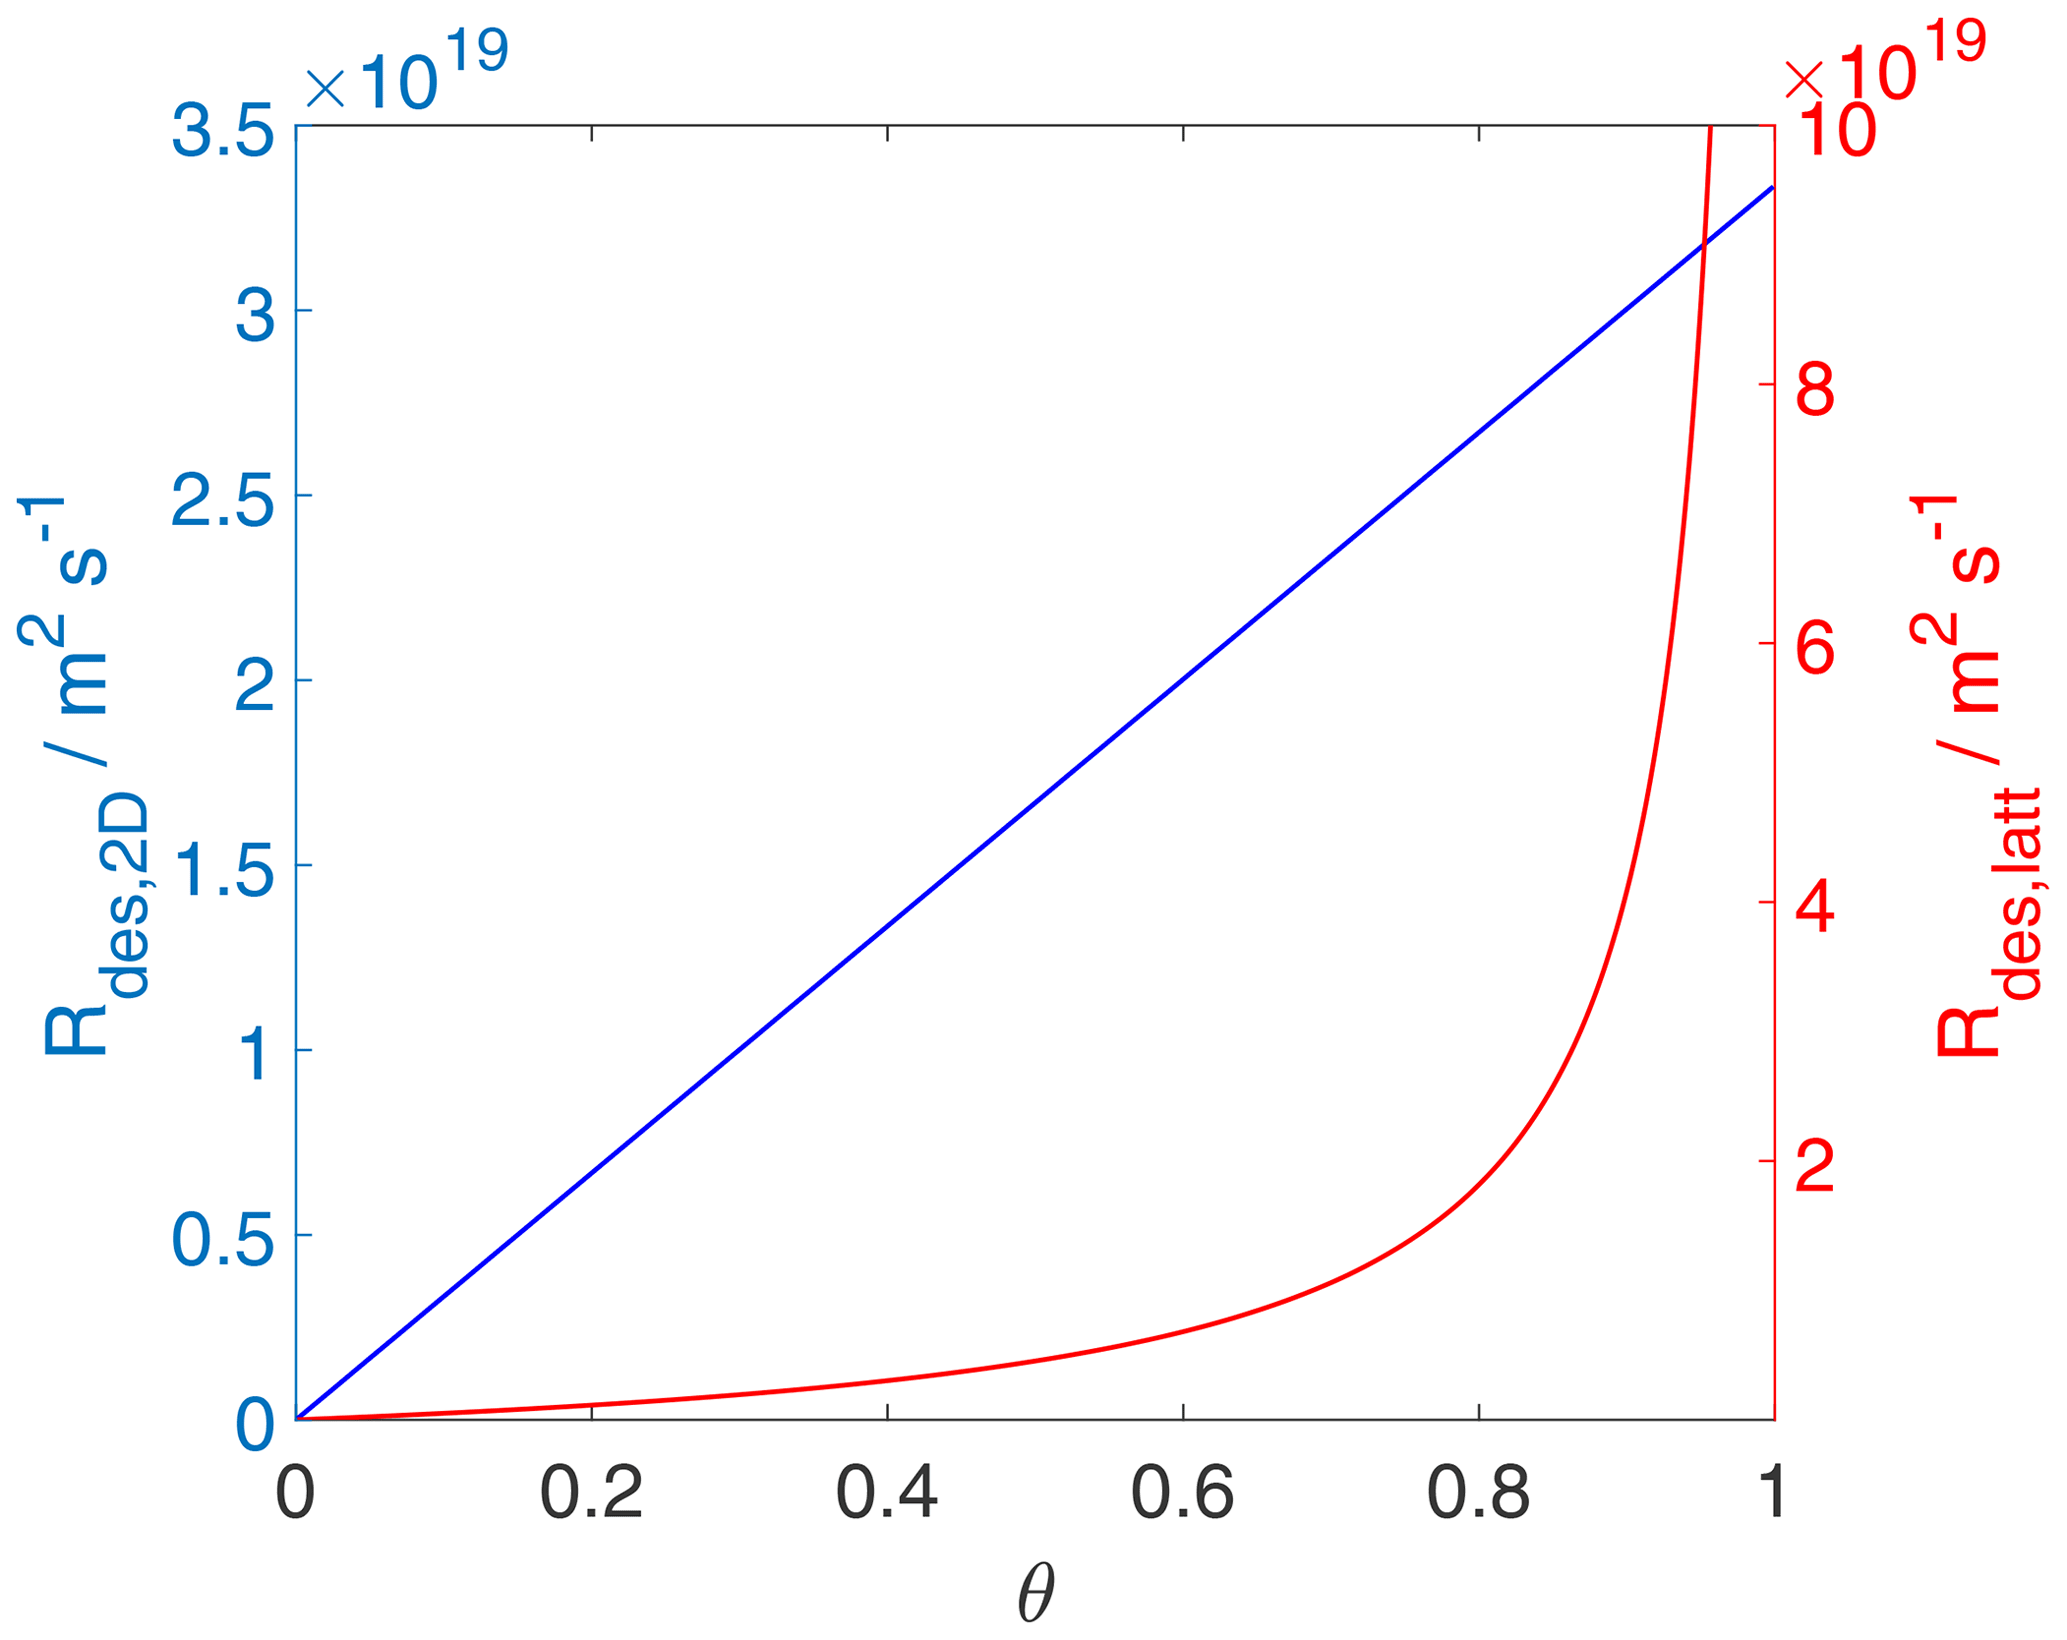
Figure 7The desorption rate for the case of a 2D ideal gas (blue line) and 2D ideal lattice gas (red line). Applied values are 63 and 88 kJ mol−1, respectively. We assume a desorption process without an additional barrier: . Thermodynamic quantities and standard states necessary for calculation are given in Table S1.
The features of the rate law for desorption acting as a first-order process on the surface activity then also become manifest in the time-dependent decay of the surface coverage for the two adsorbate models. As expected for the 2D ideal gas case, where surface activity and surface coverage are proportional to each other, the first order and thus single exponential decay of the surface activity leads to a corresponding single exponential decay of the surface coverage, as shown in Fig. 8. In contrast, as demonstrated in Fig. 9, the single exponential decay of the surface activity of the 2D ideal lattice gas case leads to a non-exponential decay of the surface coverage. This further emphasizes the need to carefully analyze experimental data of desorption rate measurements, especially if short timescales are considered.
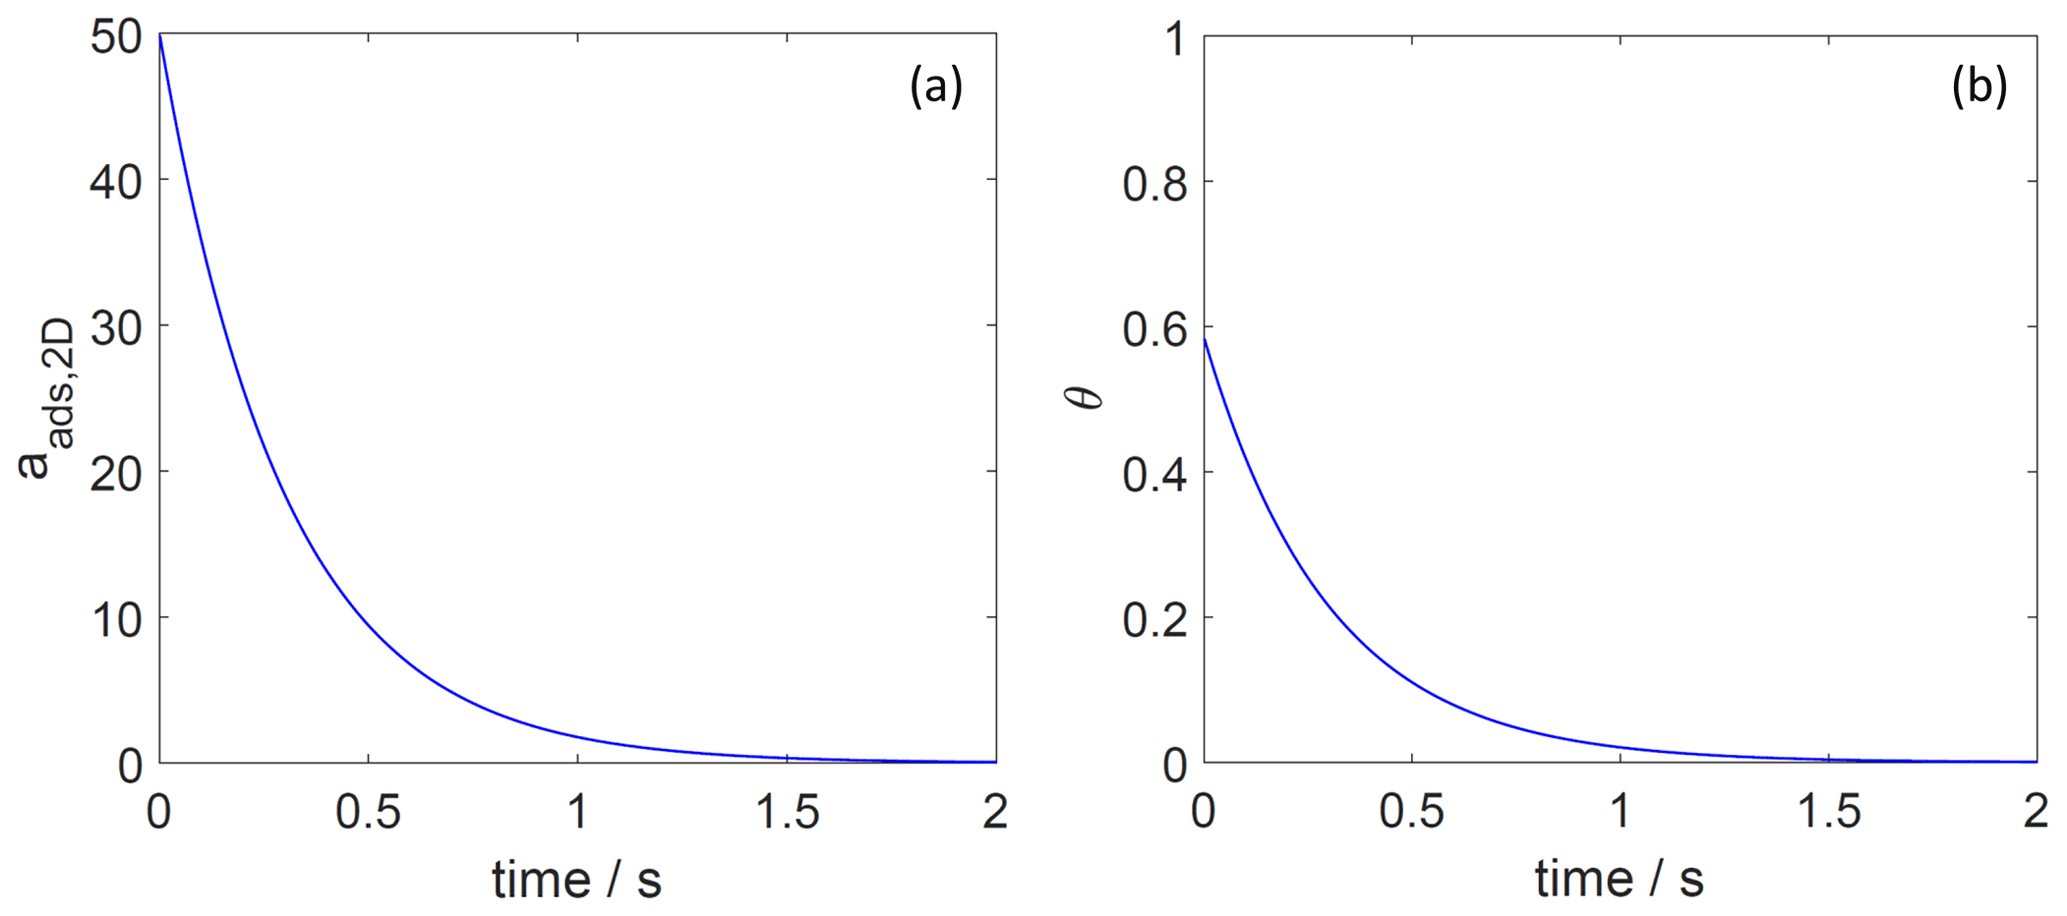
Figure 8The decay of surface activity (a) and surface coverage (b) of the 2D ideal gas adsorbate as a function of time due to desorption. The applied is 70 kJ mol−1, and the initial surface activity is 50. We assume a desorption process without an additional barrier: . Thermodynamic quantities and standard states necessary for calculation are given in Table S1.
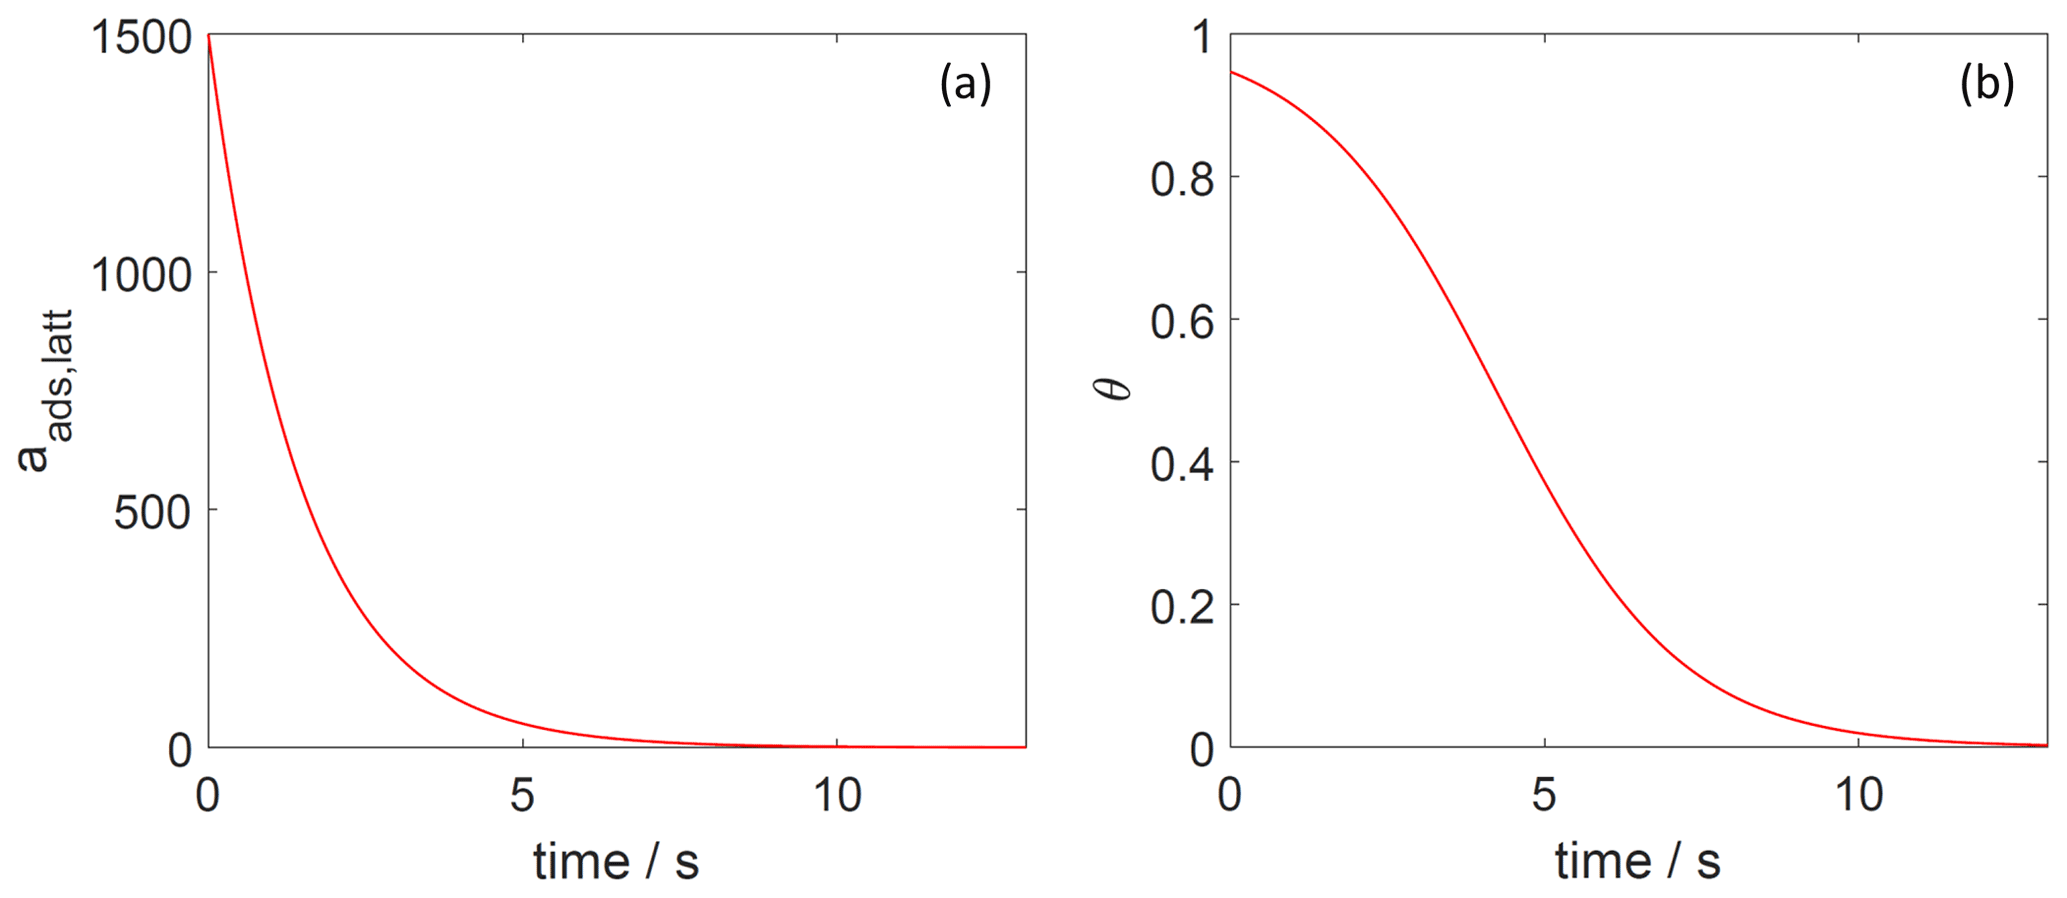
Figure 9The decay of surface activity (a) and surface coverage (b) of the 2D ideal lattice gas adsorbate as a function of time due to desorption. The applied is 91 kJ mol−1, and the initial surface activity is 1500. We assume a desorption process without an additional barrier: . Thermodynamic quantities and standard states necessary for calculation are given in Table S1.
As discussed above, the pre-exponential factor is often assumed to be . Figure 10 shows Ades for both adsorbate models as a function of temperature. For the 2D ideal gas, Ades displays a weak temperature dependency, and, when approaching room temperature, Ades,2D is close to the typically applied value of 1013 s−1. For the 2D ideal lattice gas, is about 3 orders of magnitude larger and exhibits a stronger temperature dependency compared to the 2D ideal gas. The greater values for can be understood in the following way. When going from a localized bound species (i.e., 2D ideal lattice gas) to a 2D ideal gas (TS), it is very likely that the ratio of partition functions is larger than 1 and . Hence, it can be expected that in these cases , as demonstrated in Fig. 10. Even when ignoring internal rotations, the change in translational degrees of freedom between the 2D ideal lattice gas adsorbate and the 2D ideal gas of the TS, the configurational contribution to the 2D ideal lattice gas adsorbate leads to an increase in (if κ remains as 1).
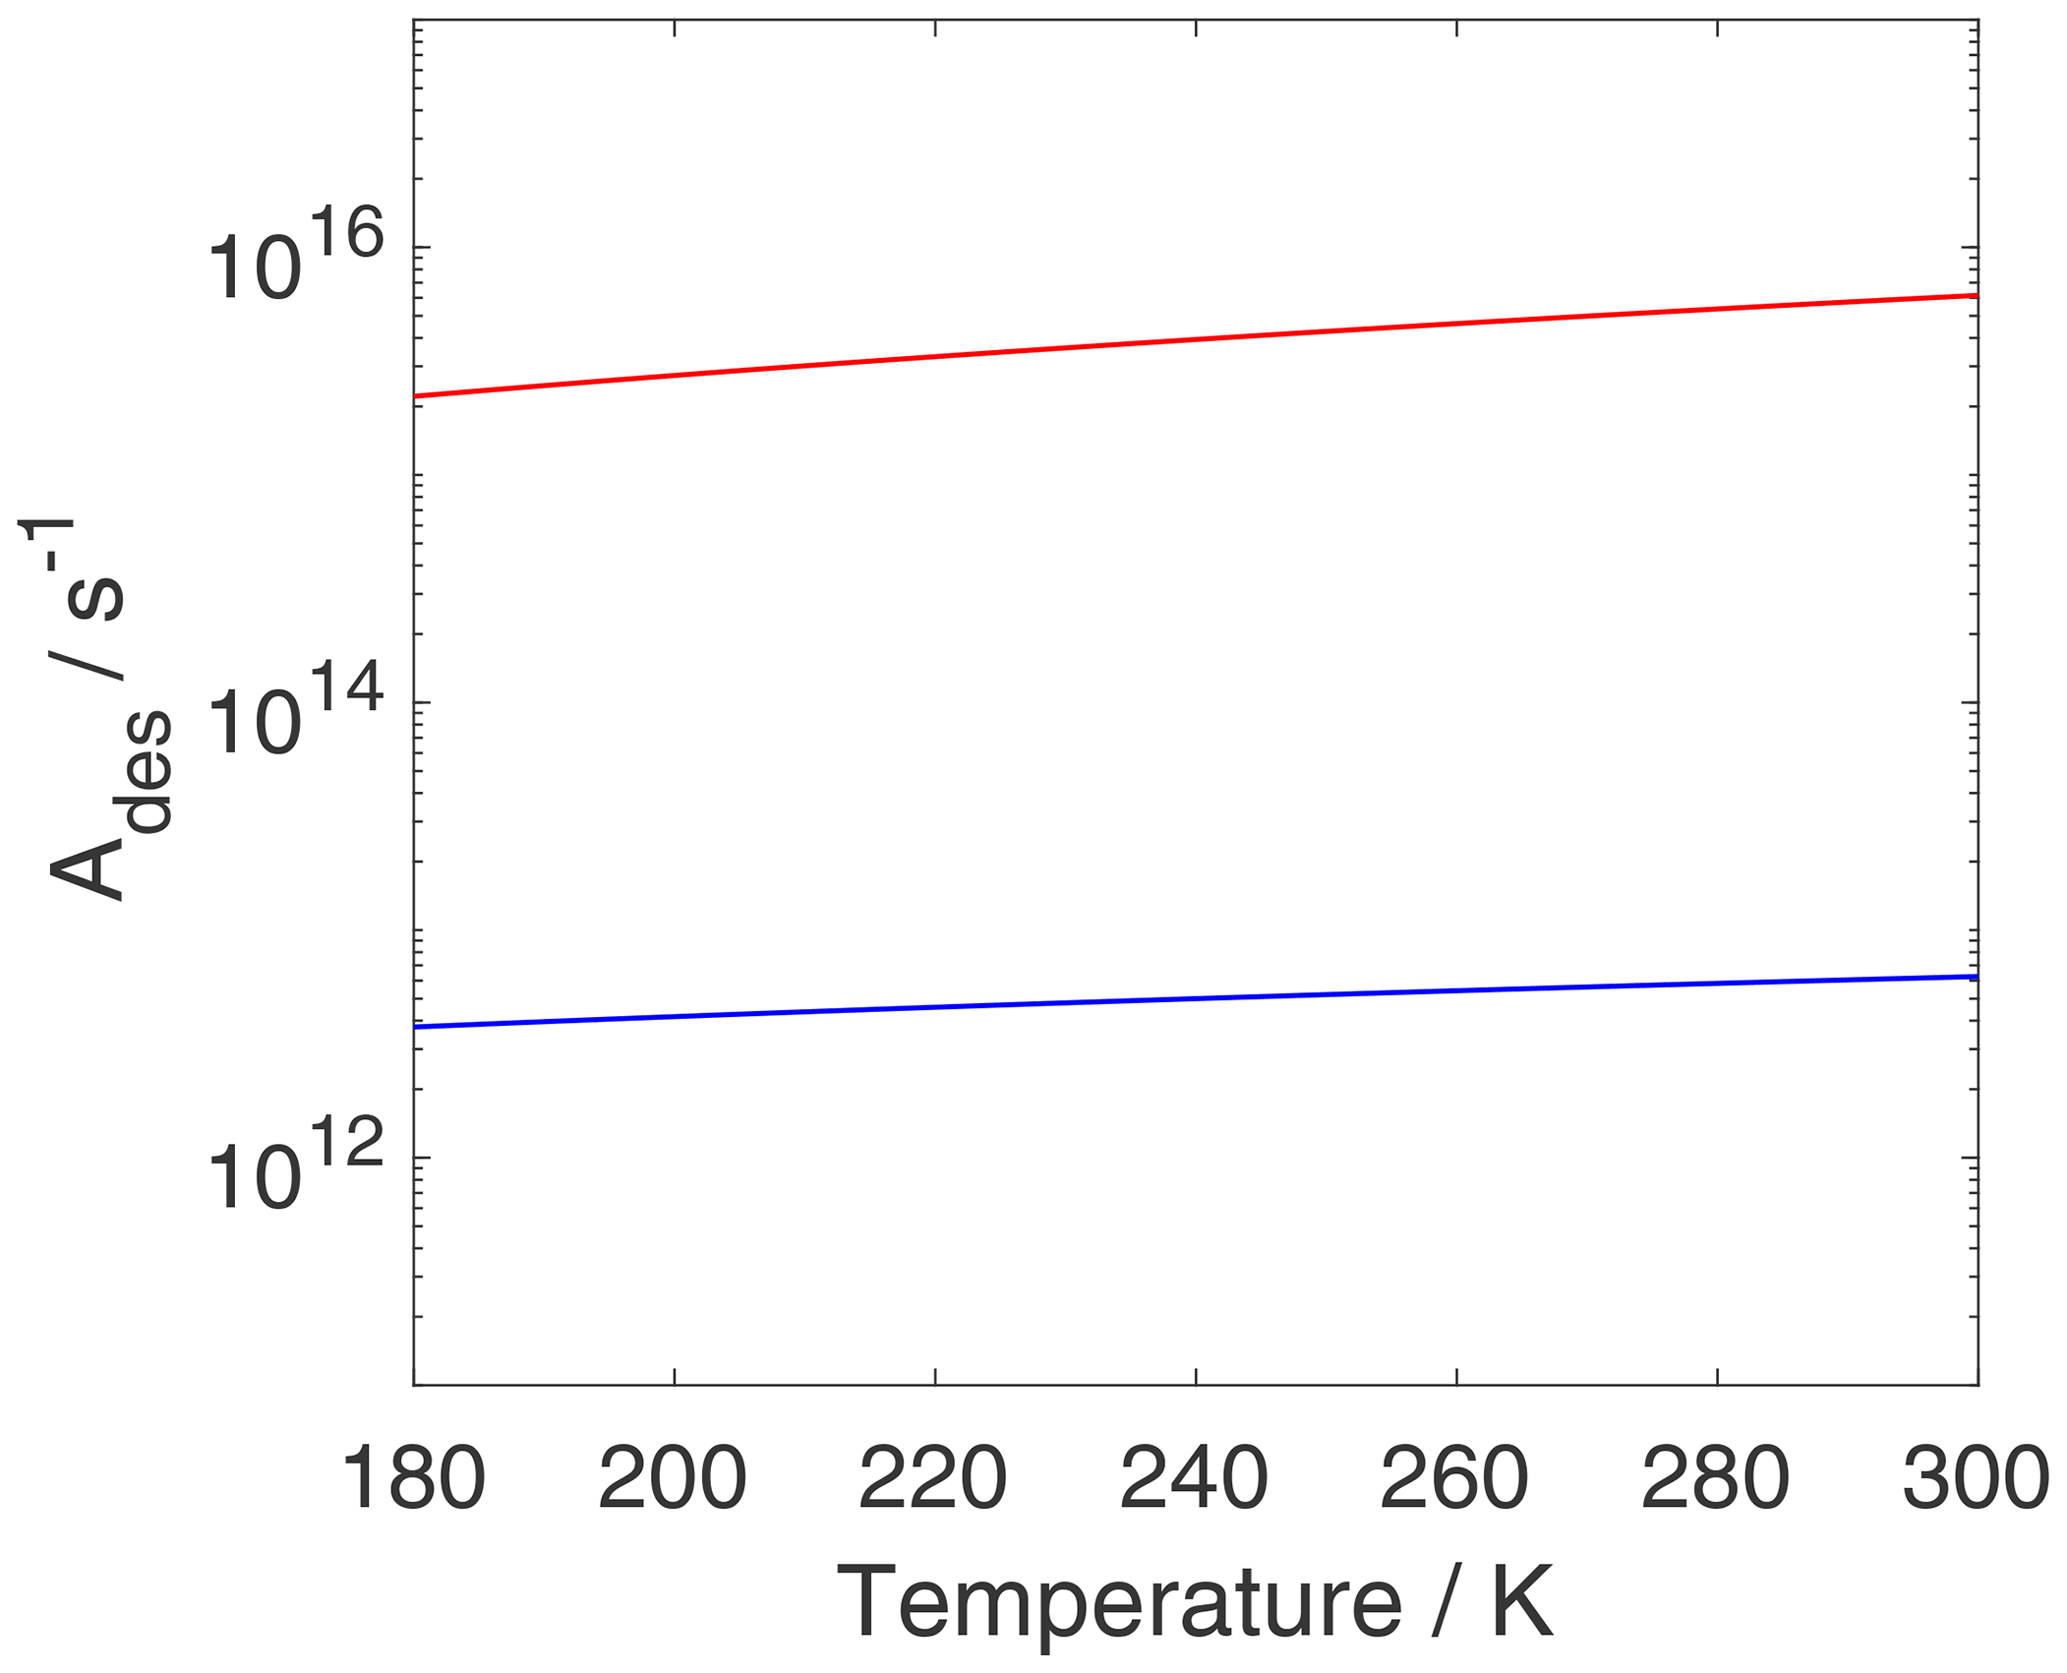
Figure 10The pre-exponential factor Ades as a function of temperature is plotted for the case of a 2D ideal gas (blue) and a 2D ideal lattice gas (red). Thermodynamic quantities and standard states necessary for calculation are given in Table S1.
Adsorption is treated as a physisorptive process but might exert a non-zero energy barrier for activated adsorption. We derive the adsorption rates of gas molecules transferring into the 2D ideal and 2D ideal lattice gas absorbates. The adsorption proceeds via the TS, which is treated as a 2D ideal gas, as in the case of desorption.
When considered from the gas-phase side, the equilibrium constant between the gas phase and the adsorbed state is given by the inverse ratio of activities compared to the case of desorption, as now the adsorbed state is the product:
and
The relationship to the equilibrium constant of desorption holds irrespective of whether the adsorbed state is a 2D ideal gas or 2D ideal lattice gas due to the reversible nature of the adsorption equilibrium.
In general, the adsorption rate can be expressed as
and
with
where kads represents the first-order rate coefficient for adsorption (in units of s−1), describing the rate of change of gas-phase concentration or activity. Considering the rate expression in terms of the gain in adsorbed molecules per unit area and time, the rate of loss from the gas phase needs to be multiplied by . Since adsorption proceeds via the TS that is assumed to be a 2D ideal gas, kads is the same first-order rate coefficient for the adsorption into the 2D ideal gas and 2D ideal lattice gas adsorbate model.
The rate of change of surface activity for the 2D ideal gas is given by
and for the 2D ideal lattice gas, it is given by
We note that although kads is the same for both gas adsorbate models, and will differ, as evident from Eqs. (104) and (105), respectively, and shown further below (Eqs. 126 and 127). As outlined above and in the Supplement (Sect. S2.3), the activity of the 2D ideal lattice gas scales with . To provide an analytical solution using our definitions, in Eq. (105), we make the assumption that , meaning that we consider rates of change small enough so that this condition is justified. Since describes the decay of the gas-phase activity, which is proportional to its concentration, it follows that . In turn, the factor needs to be normalized to the corresponding ratio of standard molar volume to surface area to convert from gas-phase activity change to surface activity change, in the last expression of Eq. (105).
TS theory for adsorption encompasses the same steps as those for desorption but starting from the gas-phase side. Considered from the gas phase, the equilibrium constant between the gas phase and the TS for adsorption is related to the free energy change between the gas and the TS, each expressed with the corresponding standard molar partition functions, as defined by (Eqs. S193–S199 in the Supplement)
Note that we treat the general case of activated adsorption here, meaning that the TS's internal energy is elevated by the barrier height above the reference level (), leading to the corresponding Arrhenius term in Eq. (106). The equilibrium constant is also related to the ratio of activities (Eq. S5 in the Supplement):
As in the case of desorption, the adsorption rate can be obtained by assuming that the TS has the same finite width d across which the molecule moves with its mean thermal velocity in the direction orthogonal to the surface:
where κ is the same transmission coefficient defining the probability with which the activated complex proceeds to adsorption as that for desorption due to microscopic reversibility (Kolasinski, 2012). The partition function for the translational motion of the TS in the direction of adsorption is
Solving this for d and inserting it into Eq. (108) allows us to express the adsorption rate as a function of this partition function:
The surface concentration of the TS can be derived from the equilibrium (Eq. 107):
Inserting Eq. (111) into Eq. (110) leads to
When defining the of adsorption as (Eqs. S193 and S207 in the Supplement) minus the TS's free energy associated with the motion along the adsorption coordinate, expressed by its molecular partition function, qTS,ads, we obtain
With this definition of , we can express the adsorption rate as
When using the definition of the adsorption rate coefficient linking the loss rate from the gas phase with the gain in adsorbed species on the surface, i.e.,
the adsorption rate coefficient becomes
Defining as the partition function for the TS after omitting motion in the direction of the reaction coordinate (Campbell et al., 2016), this leaves the partition function for a 2D ideal gas (Eqs. S60 and S118 in the Supplement):
Using Eq. (116) in Eq. (112), we obtain
and identifying Eq. (117) with Eq. (104) yields
This is the same result as in Eq. (115) when using thermodynamic quantities.
We can convert the standard molar partition functions back to the molecular ones. For that, we consider that
and
and we obtain
This yields
As in the case of desorption, we can compare the thermodynamic derivation of kads (left-hand side below) with the one based on the partition functions (right-hand side below):
With (Eq. S195 in the Supplement), we obtain
In the case of adsorption, the Arrhenius term is only driven by the barrier height. Therefore, the pre-exponential factor for adsorption is (since )
Thus, we can identify
This emphasizes the relationship between the entropy of activation and the ratio of the corresponding partition functions. Note that when neglecting vibrations,
which allows estimating the entropy of activation for adsorption. For the examples discussed here (see Table S1), .
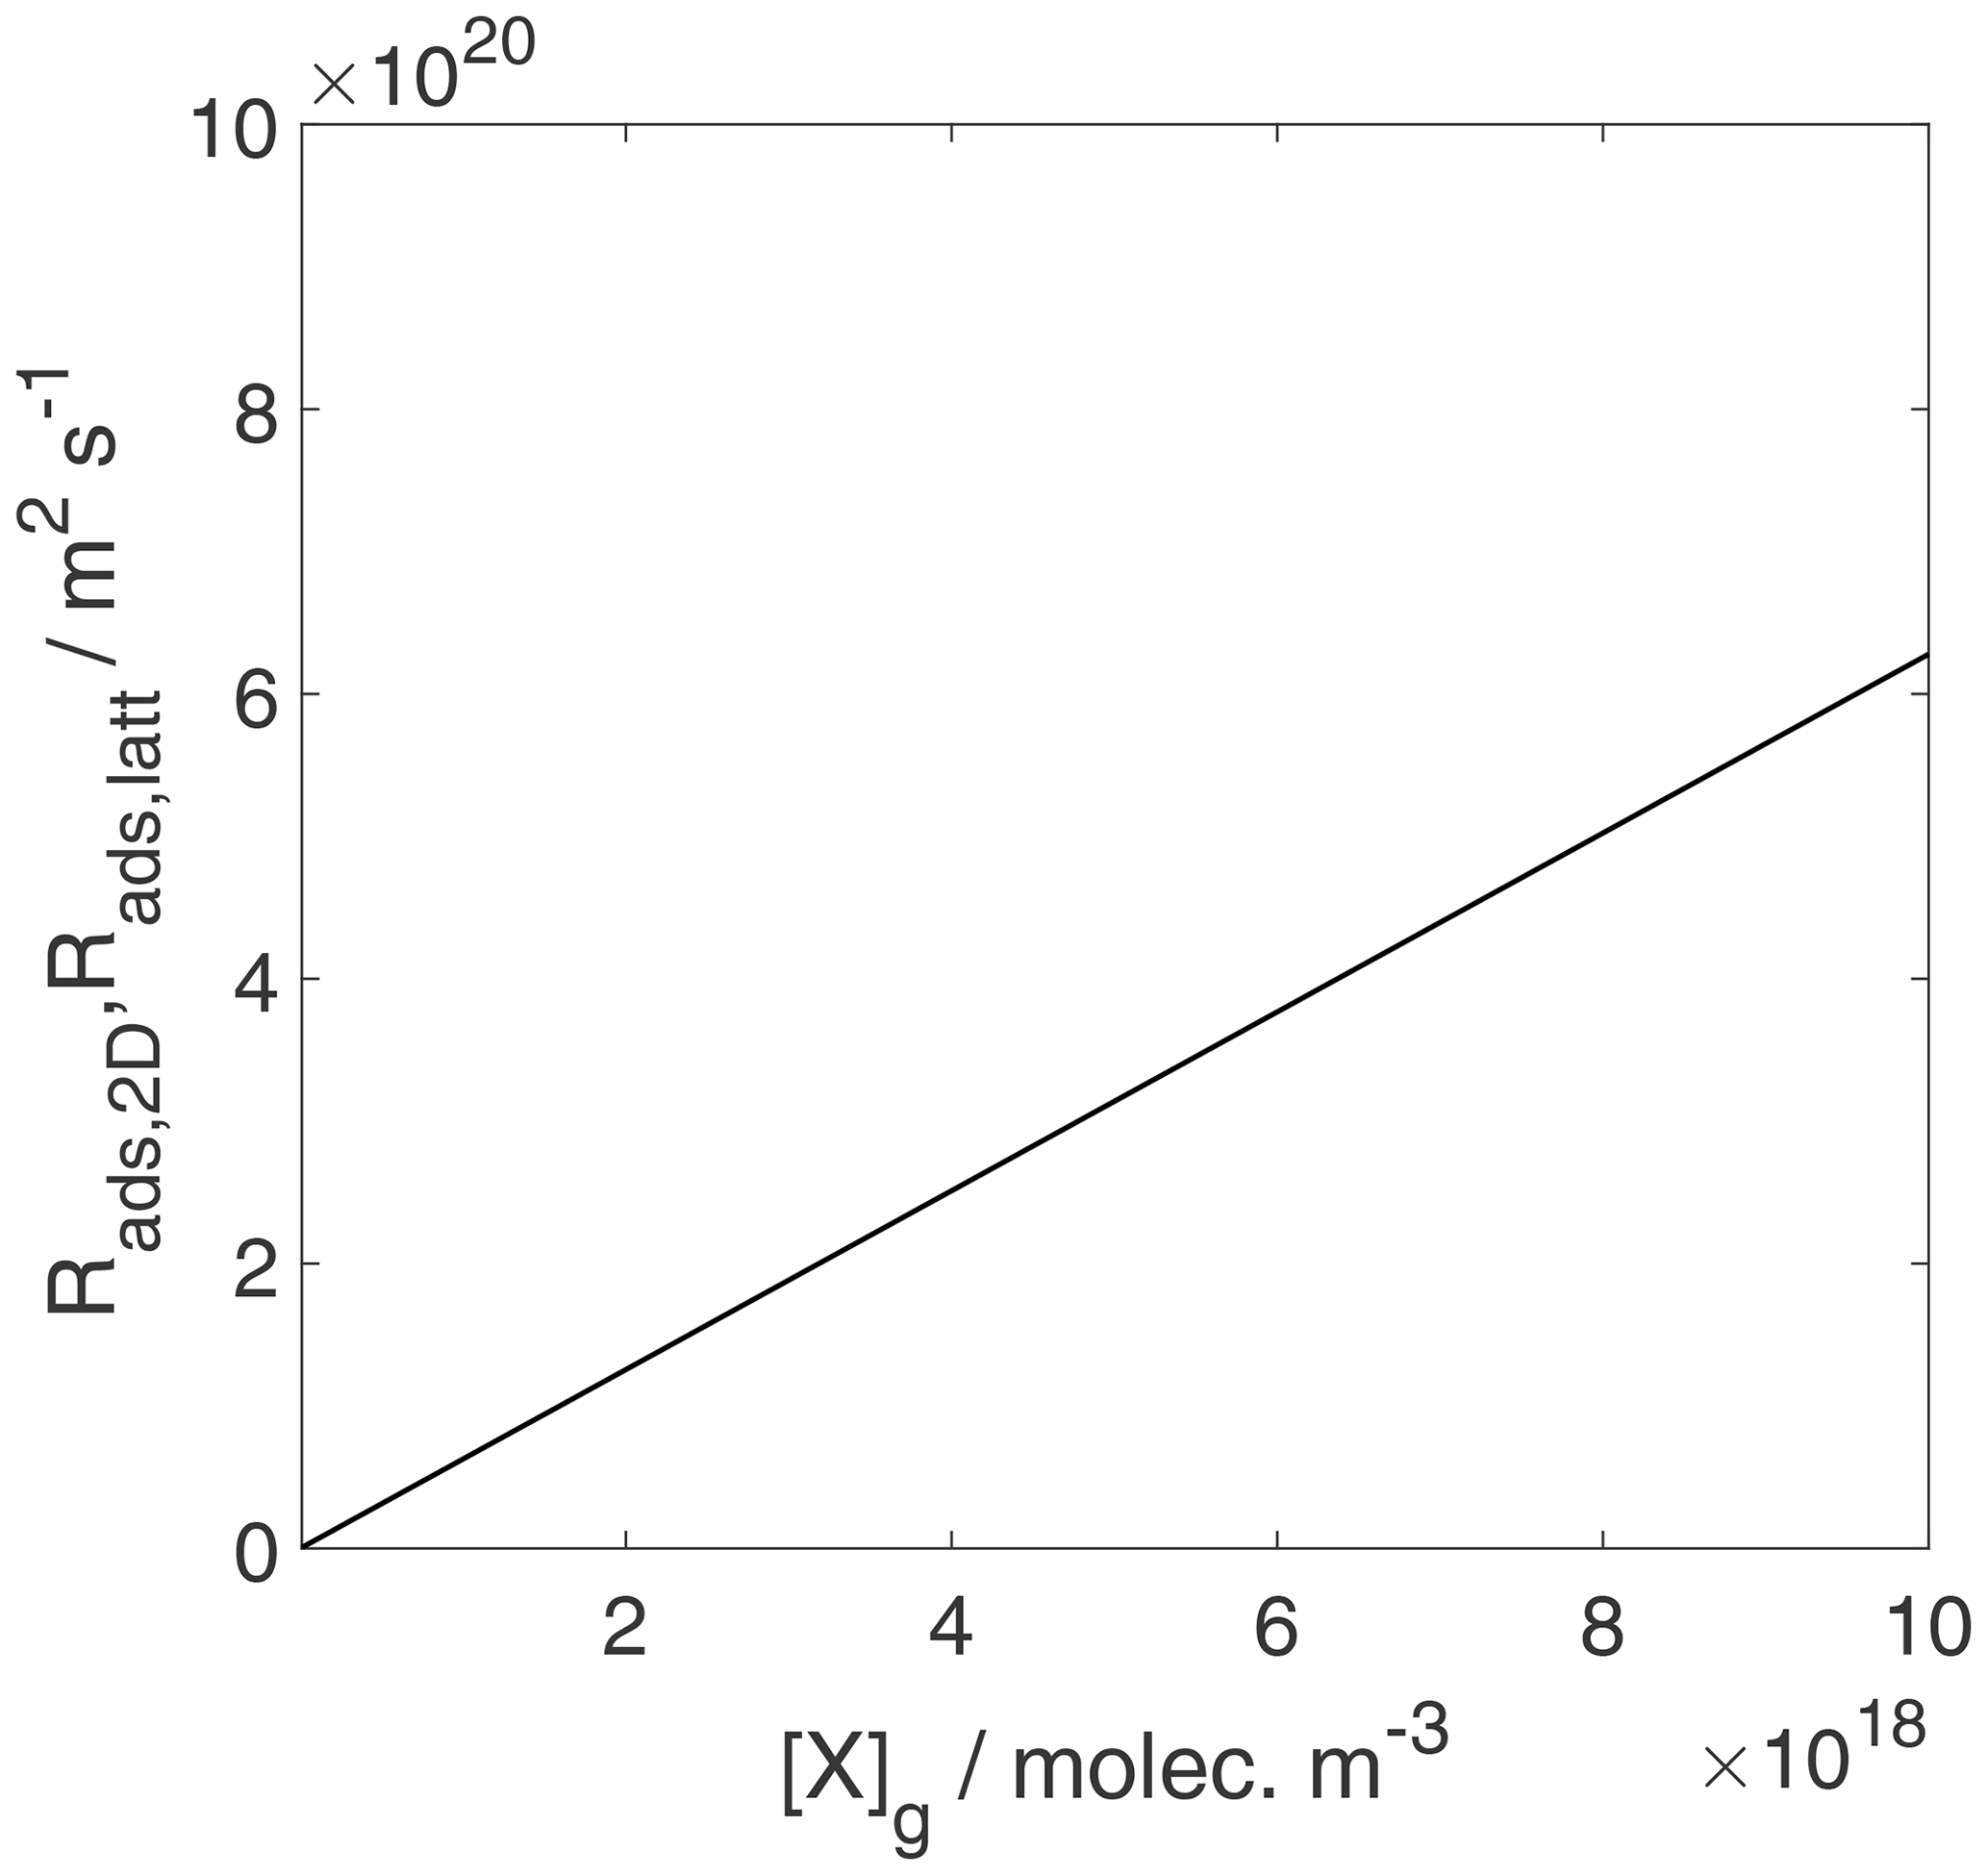
Figure 11The adsorption rate for the case of a 2D ideal gas and 2D ideal lattice gas is depicted. We assume a non-activated adsorption process: . Thermodynamic quantities and standard states necessary for calculation are given in Table S1.
Thus, essentially, the gas loses 1 translational degree of freedom, and the rate of adsorption (vibrations neglected) can be written as
For the case considering activities, we obtain
For the case of the 2D ideal lattice gas we can write, using the same definition as for kads,
represents the Hertz–Knudsen expression of the flux of molecules impinging on surface atoms. Thus, CTST is consistent with the collision rate multiplied with κ for the case that the activated complex associated with the TS is considered a 2D ideal gas, the barrier is negligible, and no internal vibrations are considered.
As discussed in the previous section, the TS for adsorption is the same as that for desorption and is considered a 2D ideal gas. This means that the adsorptive flux, i.e., the adsorption rate in terms of gain in molecules per surface area and time, is simply proportional to the gas-phase concentration, independent of the adsorption model used to describe the final state of adsorption, as shown in Fig. 11. For the same reason, the rate of change of surface activity is also linearly related to the gas-phase activity, as shown in Fig. 12. However, the meaning of the rate of change of surface activity is entirely different for the two adsorbate models, as discussed for the case of desorption. While for the 2D ideal gas model, the rate of change of surface activity is linearly related to the rate of change of surface coverage, for the 2D ideal lattice gas case, the same rate of change of surface activity is governed by a strongly non-linear relationship to the rate of change of surface coverage, thus depending on the actual coverage. This explains the slight visible deviations between and in Fig. 12 at high gas-phase activity values, reflecting in fact different rates of change of surface coverages.
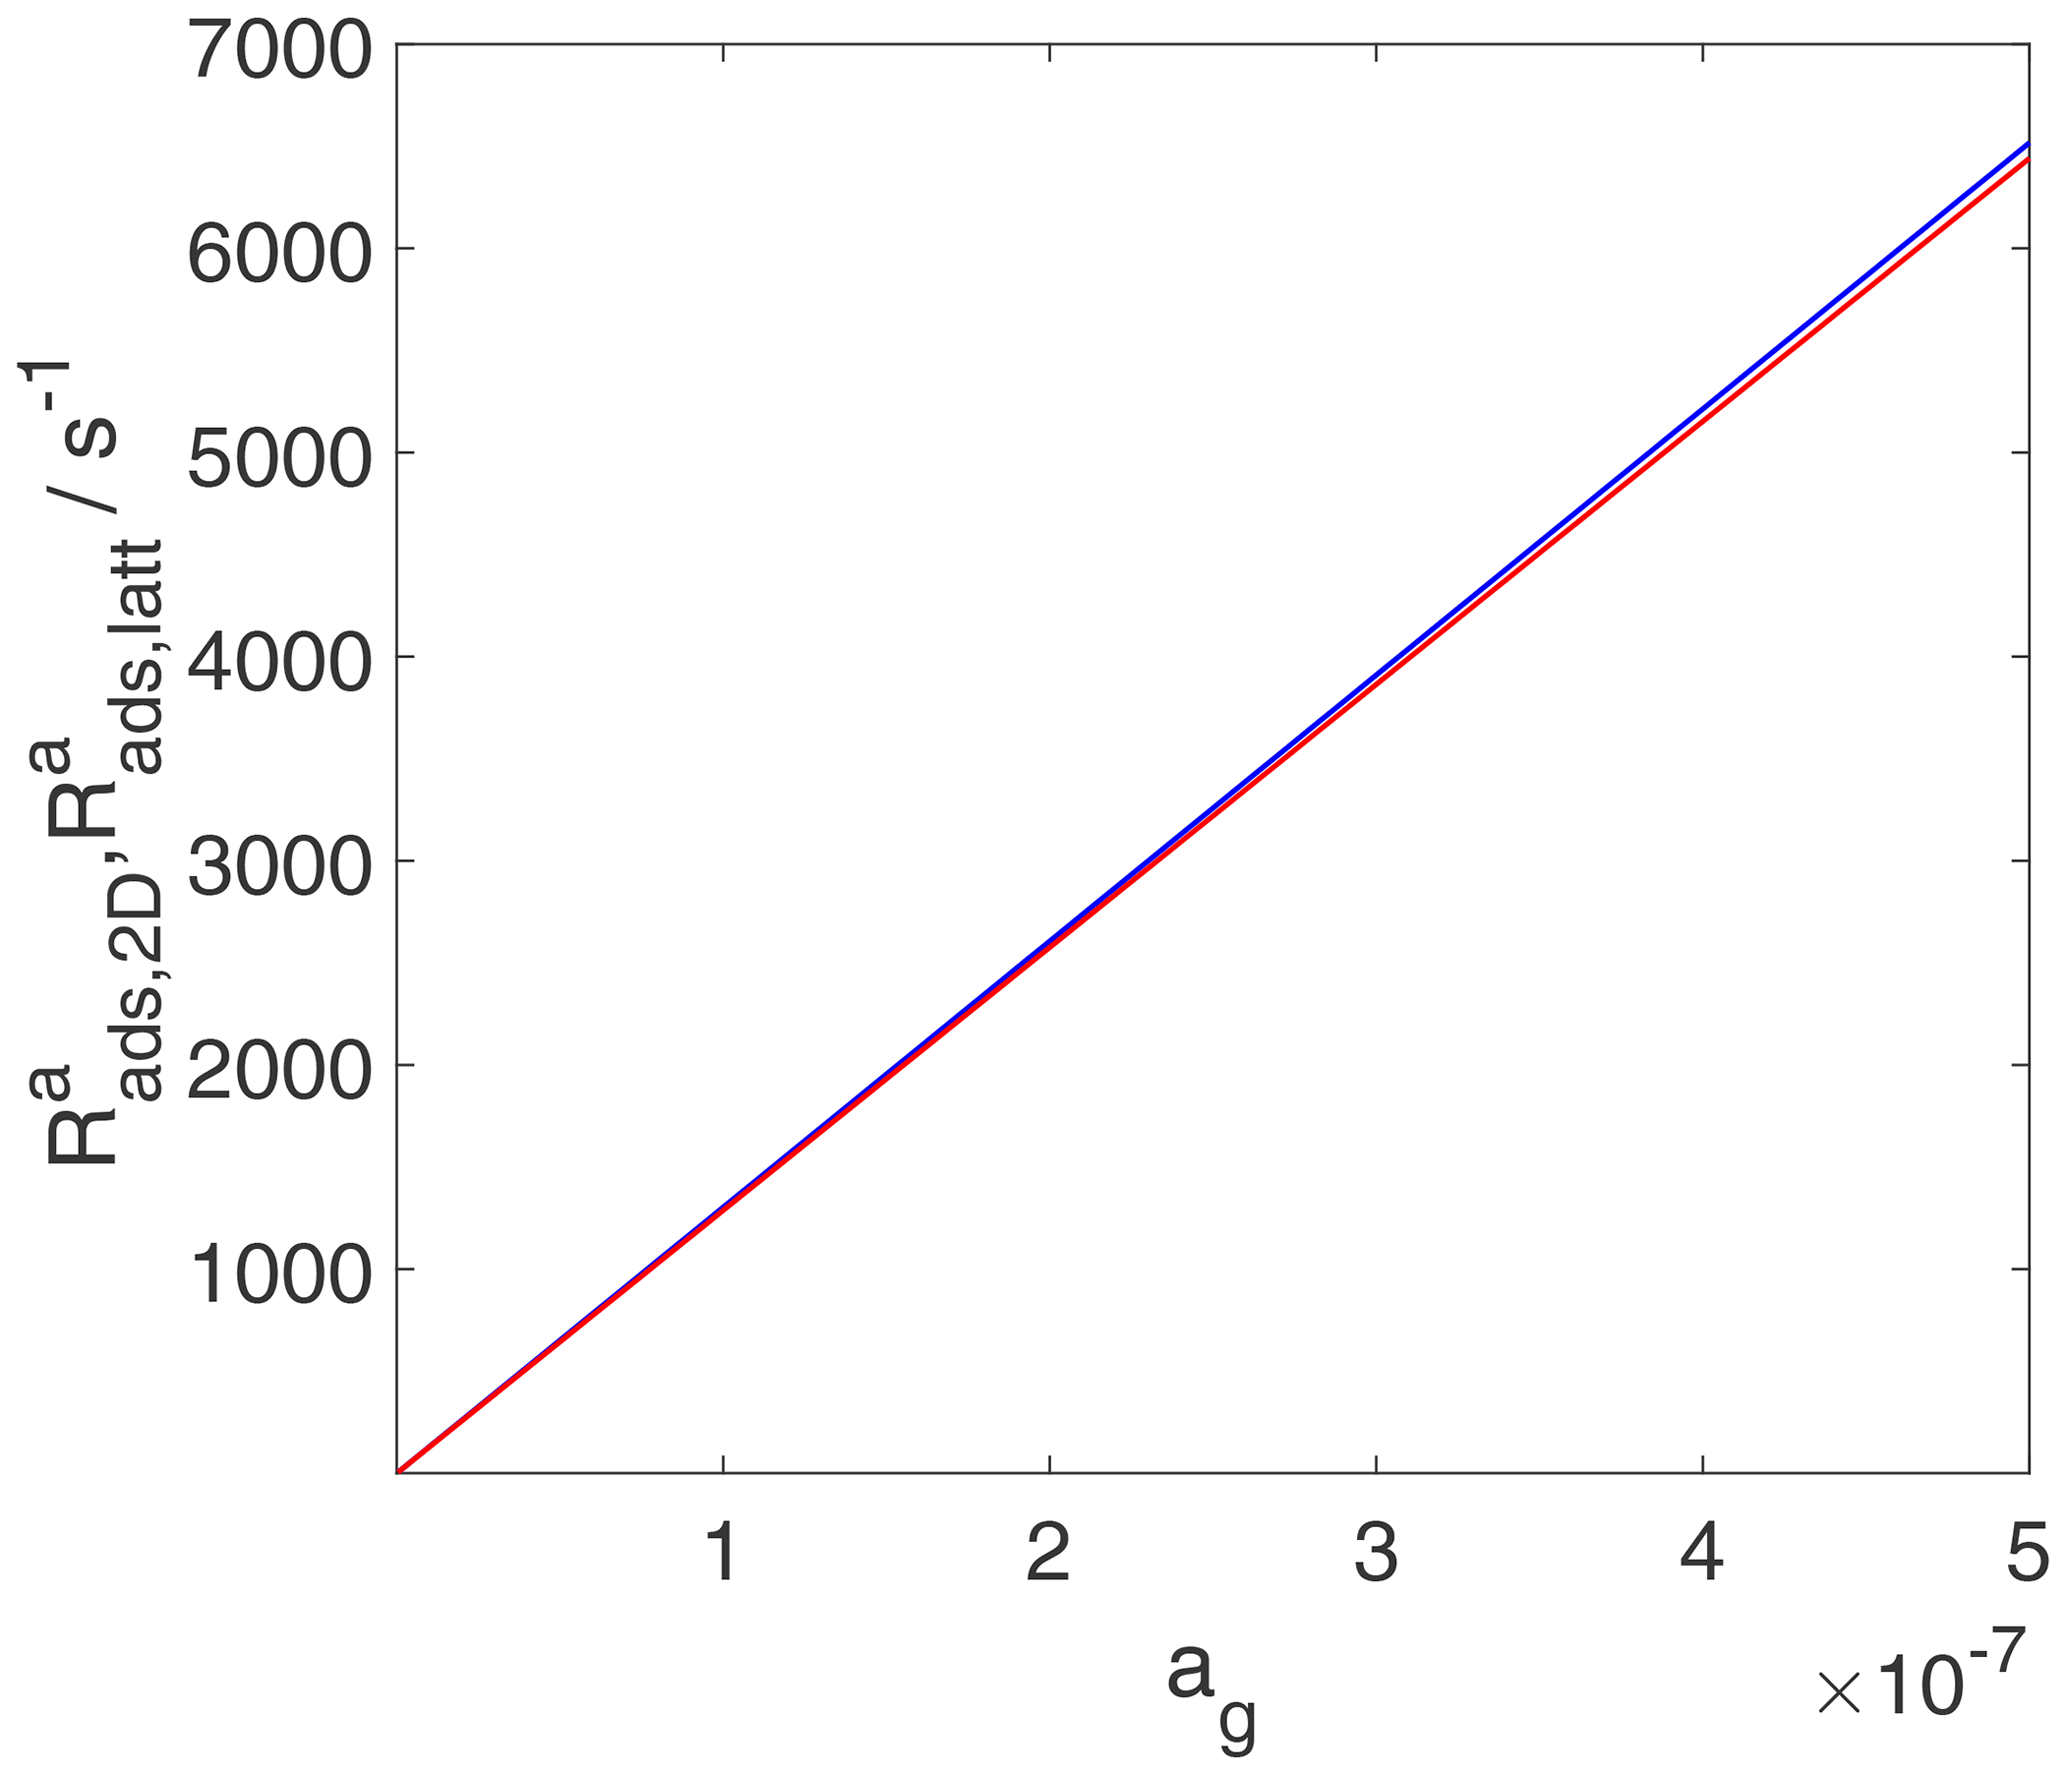
Figure 12The activity-based adsorption rates for the case of a 2D ideal gas (blue line) and 2D ideal lattice gas (red line) are depicted. We assume a non-activated adsorption process: . Thermodynamic quantities and standard states necessary for calculation are given in Table S1.
We can now look at the surface accommodation coefficient, αs, which is operationally defined as the ratio between the adsorption rate and the gas-kinetic collision rate (Kolb et al., 2010; Ammann et al., 2013; Crowley et al., 2013) considering only physisorptive processes, not accounting for possibly more complex configurations involving already-adsorbed molecules (Kisliuk, 1957; Tully, 1994; Campbell et al., 2016). The description of the adsorption rate follows as
where ω represents the thermal velocity of the gas species. Keeping with this definition but putting in the more general expression for the adsorption rate based on TS theory, the interpretation of αs becomes different as it is related to
Therefore, αs=κ (and αs=1 if κ=1) if
and , but it is different in the presence of a barrier or if other contributions are relevant in the partition functions of the activated complex associated with the TS or the gas-phase species (such as internal vibrations or rotations). As mentioned above, the ratio of the partition functions is also related to the corresponding entropy of activation (i.e., non-zero if αs deviates from κ).

Figure 13The dependency of the mass accommodation coefficient, αs, on the adsorption activation energy, . Thermodynamic quantities and standard states necessary for calculation are given in Table S1.
Figure 13 shows how αs depends on under the assumption of κ=1 and
(see Table S1). Hence, αs depends exponentially on the activation energy of adsorption. A transmission coefficient κ<1 will yield lower αs values. If the TS is more constrained than the assumed 2D ideal gas, expressed by
(Eqs. 124 and S197 in the Supplement), this will further lower αs.
We consider equilibrium between adsorption and desorption and demonstrate that this results in the proper equilibrium constants for gas adsorption into a 2D ideal gas and a 2D ideal lattice gas, proving that the CTST formulation of the rates leads back to the equilibrium definition, from which we started. We also show that this works when using both partition functions and thermodynamic expressions. Hence, the derivations of all thermodynamic functions are internally consistent.
Considering the equilibrium, for the case that the adsorbed state is a 2D ideal gas, at low coverage
This is the same result as given in Eq. (31) and consistent with the relation between Klin and the equilibrium constant. Performing the same derivation starting with the thermodynamic expressions is given in the Supplement (Eqs. S216–S220).
For the case of the activity-based adsorption and desorption rates, we obtain
This is the same result as in Eq. (130). The derivation using the thermodynamic expressions is outlined in Eqs. (S221)–(S225) in the Supplement.
For the case when the adsorbed state on the surface is treated as a 2D ideal lattice gas using Eqs. (92), (102), and (121),
with
we obtain
This is the expected result outlined in Eq. (44). The derivation starting with the thermodynamic expressions is given in Eqs. (S226)–(S230) in the Supplement.
For the case of the activity-based adsorption (Eq. 127) and desorption rates (Eq. 86), we obtain
This results in the same relationship as in Eq. (132). The derivation starting with the thermodynamic expressions is given in Eqs. (S231)–(S235) in the Supplement. Thus, equating the adsorption and desorption rates, both derived based on TS theory, correctly reproduces the corresponding equilibrium constant.
In previous studies (Bartels-Rausch et al., 2005; Tabazadeh and Turco, 1993) equilibrium thermodynamic data or equilibrium coverage data have been used to constrain kinetic parameters of either adsorption or desorption. If or is known as a function of temperature from measurements or extracted from fundamental thermodynamic data, the Arrhenius plot of its temperature dependence delivers or as a slope and or as an offset.
For the case of an adsorbed 2D ideal gas, we can derive the pre-exponential factor from equilibrium, , starting off with the molecular descriptions of respective rates (Eq. 131). In addition, we make use of αs and its relationship to microscopic properties (Eq. 129) and the definition of Ades,2D obtained from the derivation of the desorption rate (Eq. 78). By applying the thermodynamic equilibrium constant, we can then relate the microscopic picture to thermodynamic functions, obtaining Ades,2D under equilibrium conditions (the full derivation is given in Eq. S236 in the Supplement):
If the energy barrier is negligible, this simplifies to
Ades,2D derived from equilibrium is the same result as for Ades,2D derived from desorption using TS theory (Eq. 78). Thus, the pre-exponential factor of desorption can be calculated from the desorption entropy () and from the known value of αs but only if the standard state, which has been used to obtain the entropy, is known.
For the case of an adsorbed 2D ideal lattice gas, we can derive the pre-exponential factor from equilibrium, (Eq. 133), in a similar way to how it is derived for the 2D ideal gas discussed above, using Ades,latt from the derivation of the desorption rate (Eq. 97) and αs (Eq. 129) as follows (the full derivation is given in Eq. S244 in the Supplement):
If the energy barrier is negligible, this simplifies to
derived from equilibrium is the same result as for derived from desorption using TS theory (Eq. 97).
As can be seen, the activity-based does not depend on the surface coverage. However, the standard surface coverage θ0, for which has been derived, must be known (similarly to the case described in Eq. 97). Hence, the pre-exponential factor Ades,latt has a strong non-linear dependence on the standard surface coverage. When the underlying standard surface coverages are not known, additional uncertainties are introduced. When deriving the desorption rate (Eq. 82), the dependence on surface coverage is accounted for.
The thermodynamic derivations above indicate that the underlying adsorption model, i.e., 2D ideal gas or 2D ideal lattice gas, will have a significant impact on desorption rates and the pre-exponential factor and, thus, on the evaluation of and τd. This is particularly important for the case of the 2D ideal lattice gas model for which the desorption rate varies non-linearly with surface coverage, i.e., proportionally to (Eq. 82) since the surface activity is defined by (Eq. 28). This implies that for the same , values can vary significantly depending on adsorbate coverage. Vice versa, if the coverage is not well known, derivation of from measured is associated with large uncertainties.
Figure 5 displays the variation in for different θ values, covering a pristine surface to a fully occupied surface. As discussion of Fig. 7 alluded to (above), Fig. 5 demonstrates that the assumption of the underlying substrate model significantly impacts . The differences in when applying a 2D ideal gas or a 2D ideal lattice gas are of about 3 to 6 orders of magnitude over a typical θ range. Furthermore, variation in for the 2D ideal lattice gas is greater with θ due to its non-linear dependence on θ. The observed non-linearity of of the 2D ideal lattice gas, being proportional to , is a direct result of the non-linear increase in the configurational entropy (e.g., Eqs. 53 and 98). Figure 5 implies that the different sensitivities of the two adsorbate models to surface coverages can result in large differences in experimentally derived desorption rates besides uncertainties in the pre-exponential factor and .
As outlined above, Fig. 10 highlights how the underlying adsorbate model impacts the pre-exponential factor. If the actual adsorbate system behaves more like a 2D ideal lattice gas but is analyzed assuming a 2D ideal gas, significant uncertainties in Ades can arise which, in turn, increase the uncertainty in the derivation of and estimation of the desorption lifetime.
Figure 14 presents estimates of τd for given values as a function of temperature when applying a 2D ideal gas and 2D ideal lattice gas adsorbate model. For both adsorbate models, the temperature sensitivity of τd increases with increasing . For given τd values the difference in , when applying the different adsorbate models, can range from 10 to 15 kJ mol−1, where larger differences occur at higher temperatures. Hence, when deriving from τd values, in the absence of knowledge of the underlying adsorbate model, is likely uncertain by 10 to 15 kJ mol−1. Vice versa, the corresponding uncertainty in τd is up to about 3 orders of magnitude. As outlined in the Introduction, for experimental studies where τd is coupled to the surface reaction rate, the first-order surface reaction rate could also be uncertain by up to 3 orders of magnitude.
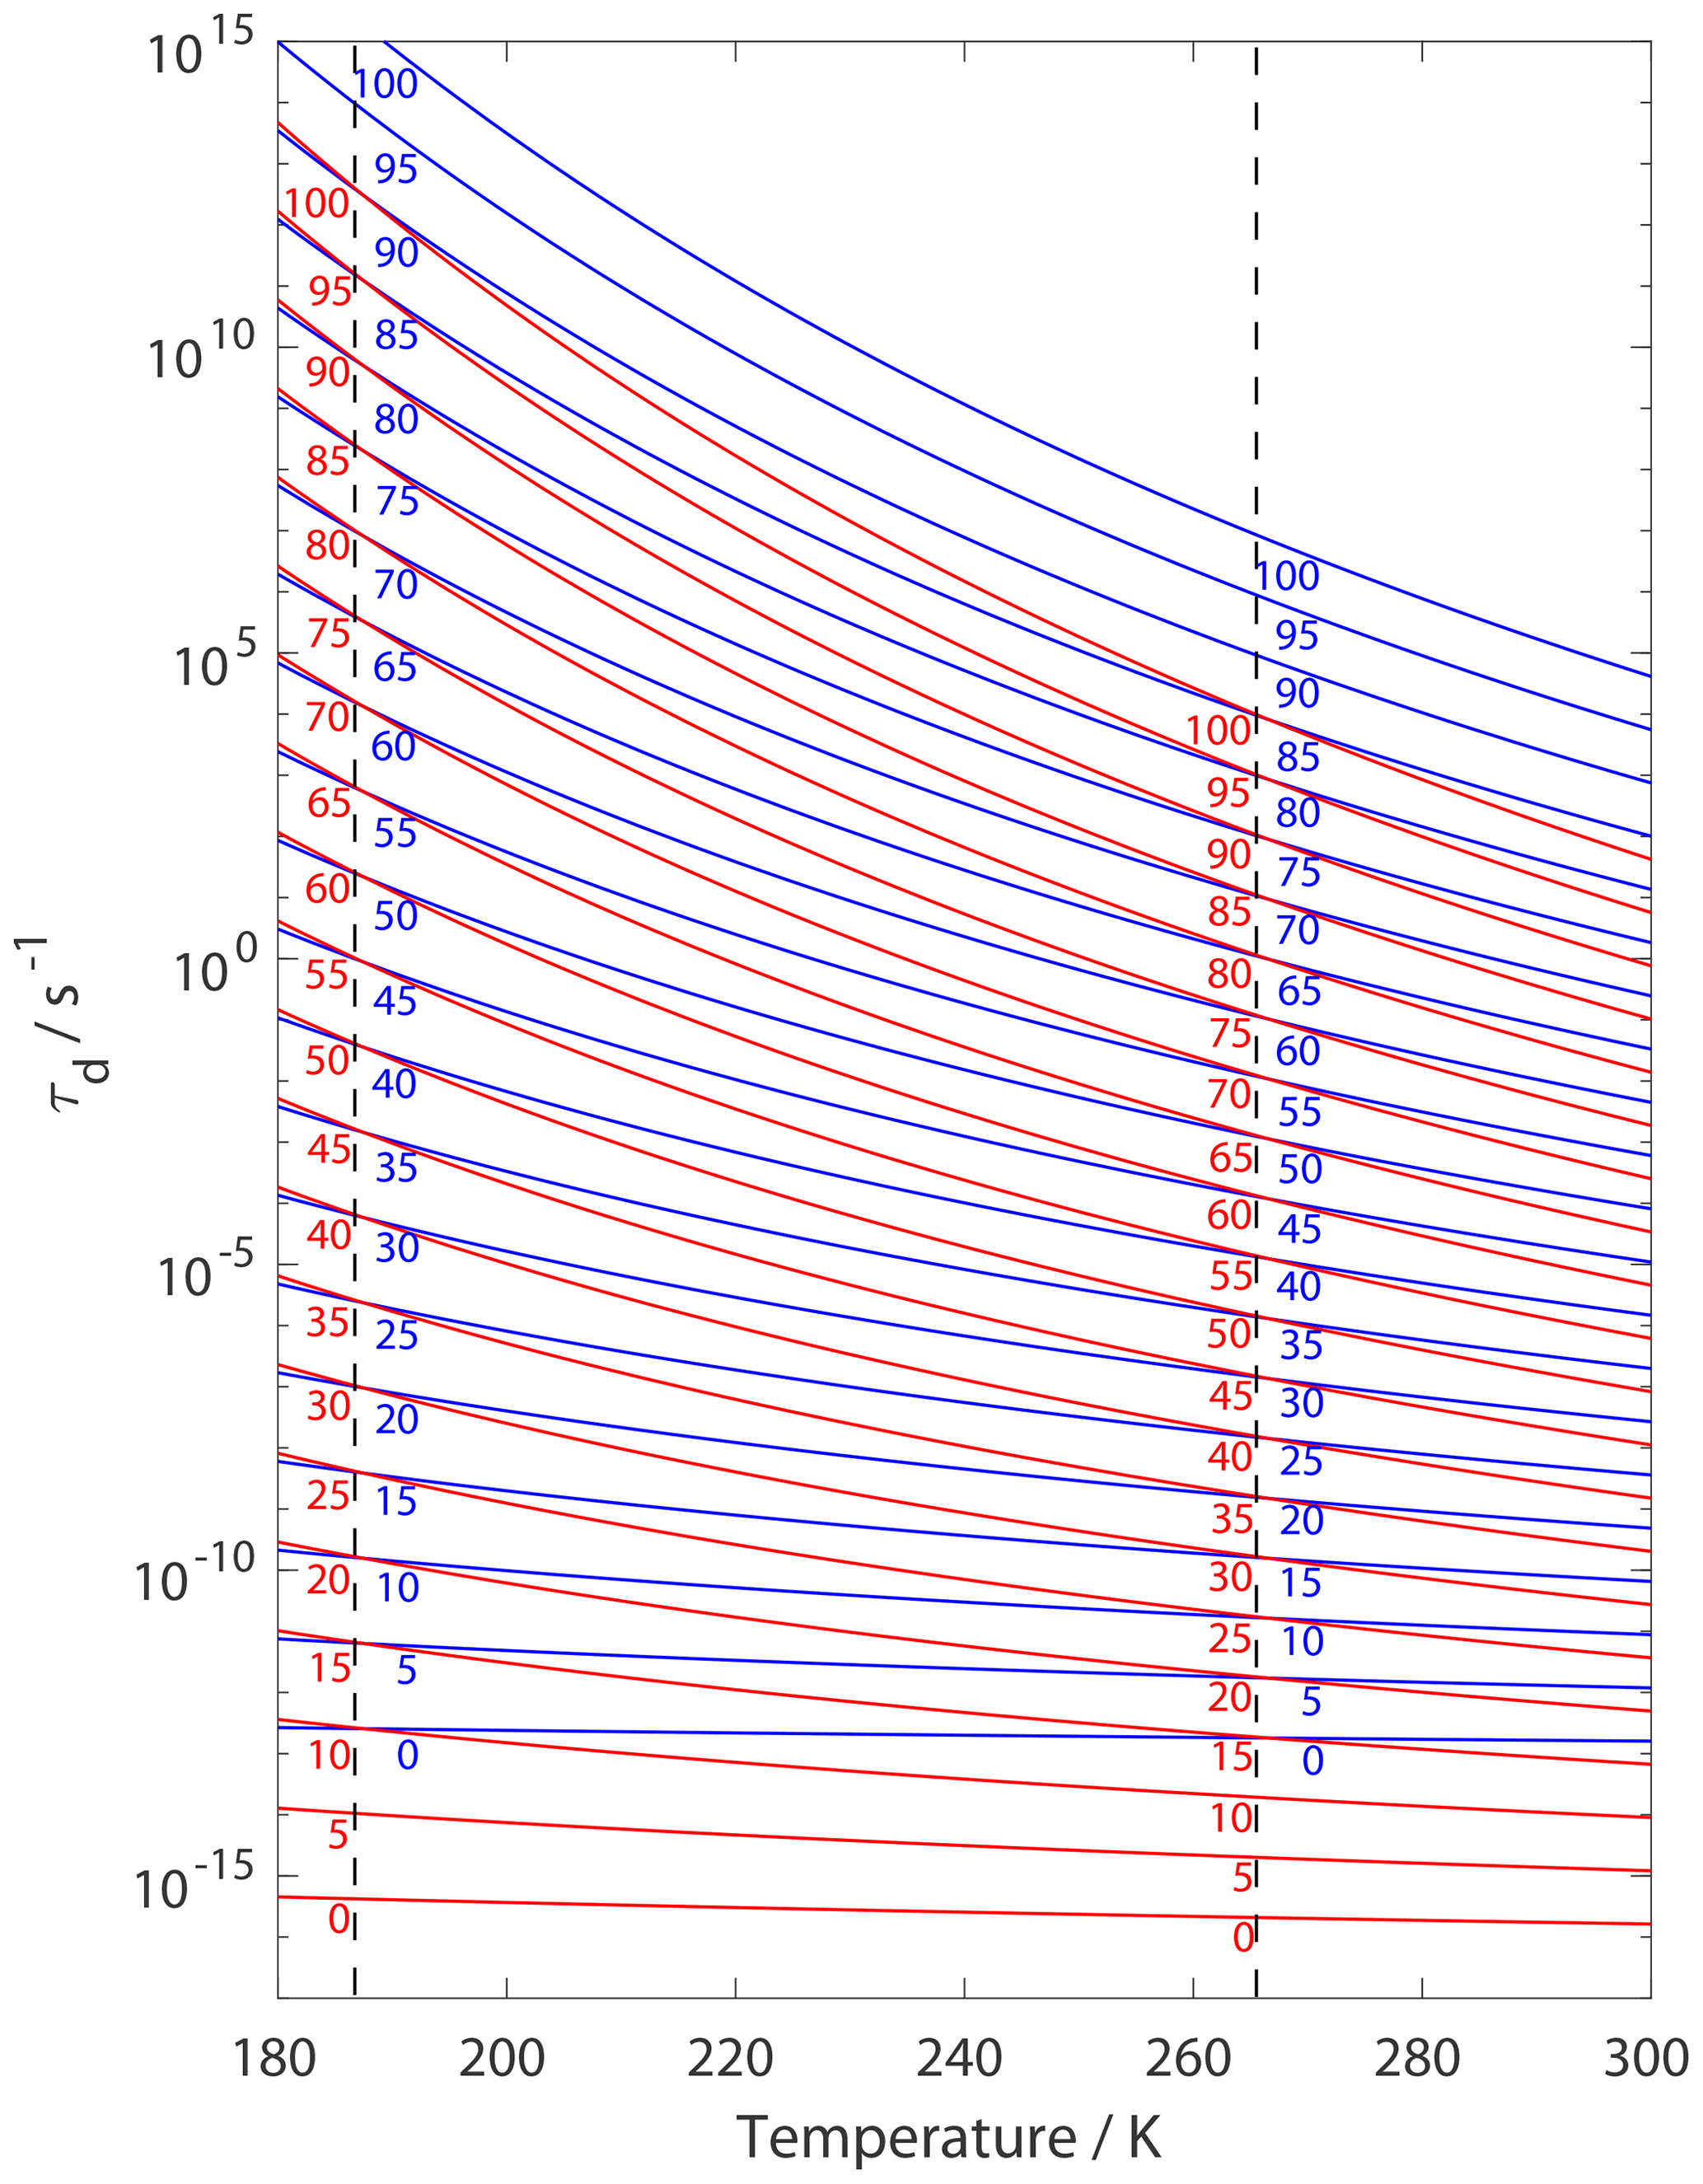
Figure 14Estimates of τd as a function of temperature applying results from Fig. 3. Blue and red lines represent the 2D ideal gas and 2D ideal lattice gas model, respectively. varies from 0 to 100 kJ mol−1 in 5 kJ mol−1 steps from bottom to top and is indicated by numbers on lines. We assume a desorption process without an additional barrier: . Thermodynamic quantities and standard states necessary for calculation are given in Table S1.
Figure 15 displays values derived from a variation in desorption rates applying a 2D ideal gas or 2D ideal lattice gas adsorbate model as a function of surface coverage θ. For example, for , reflected by the uppermost red and blue curves, it is evident that the chosen adsorbate model results in significantly different values differing by at least 20 kJ mol−1. These results further support the importance of accurate knowledge of θ. The values can vary by tens of kJ mol−1 if θ is incorrectly determined or assumed. For example, if the substrate surface is assumed to be pristine but in fact θ=0.2, can be overestimated by 10–20 kJ mol−1.
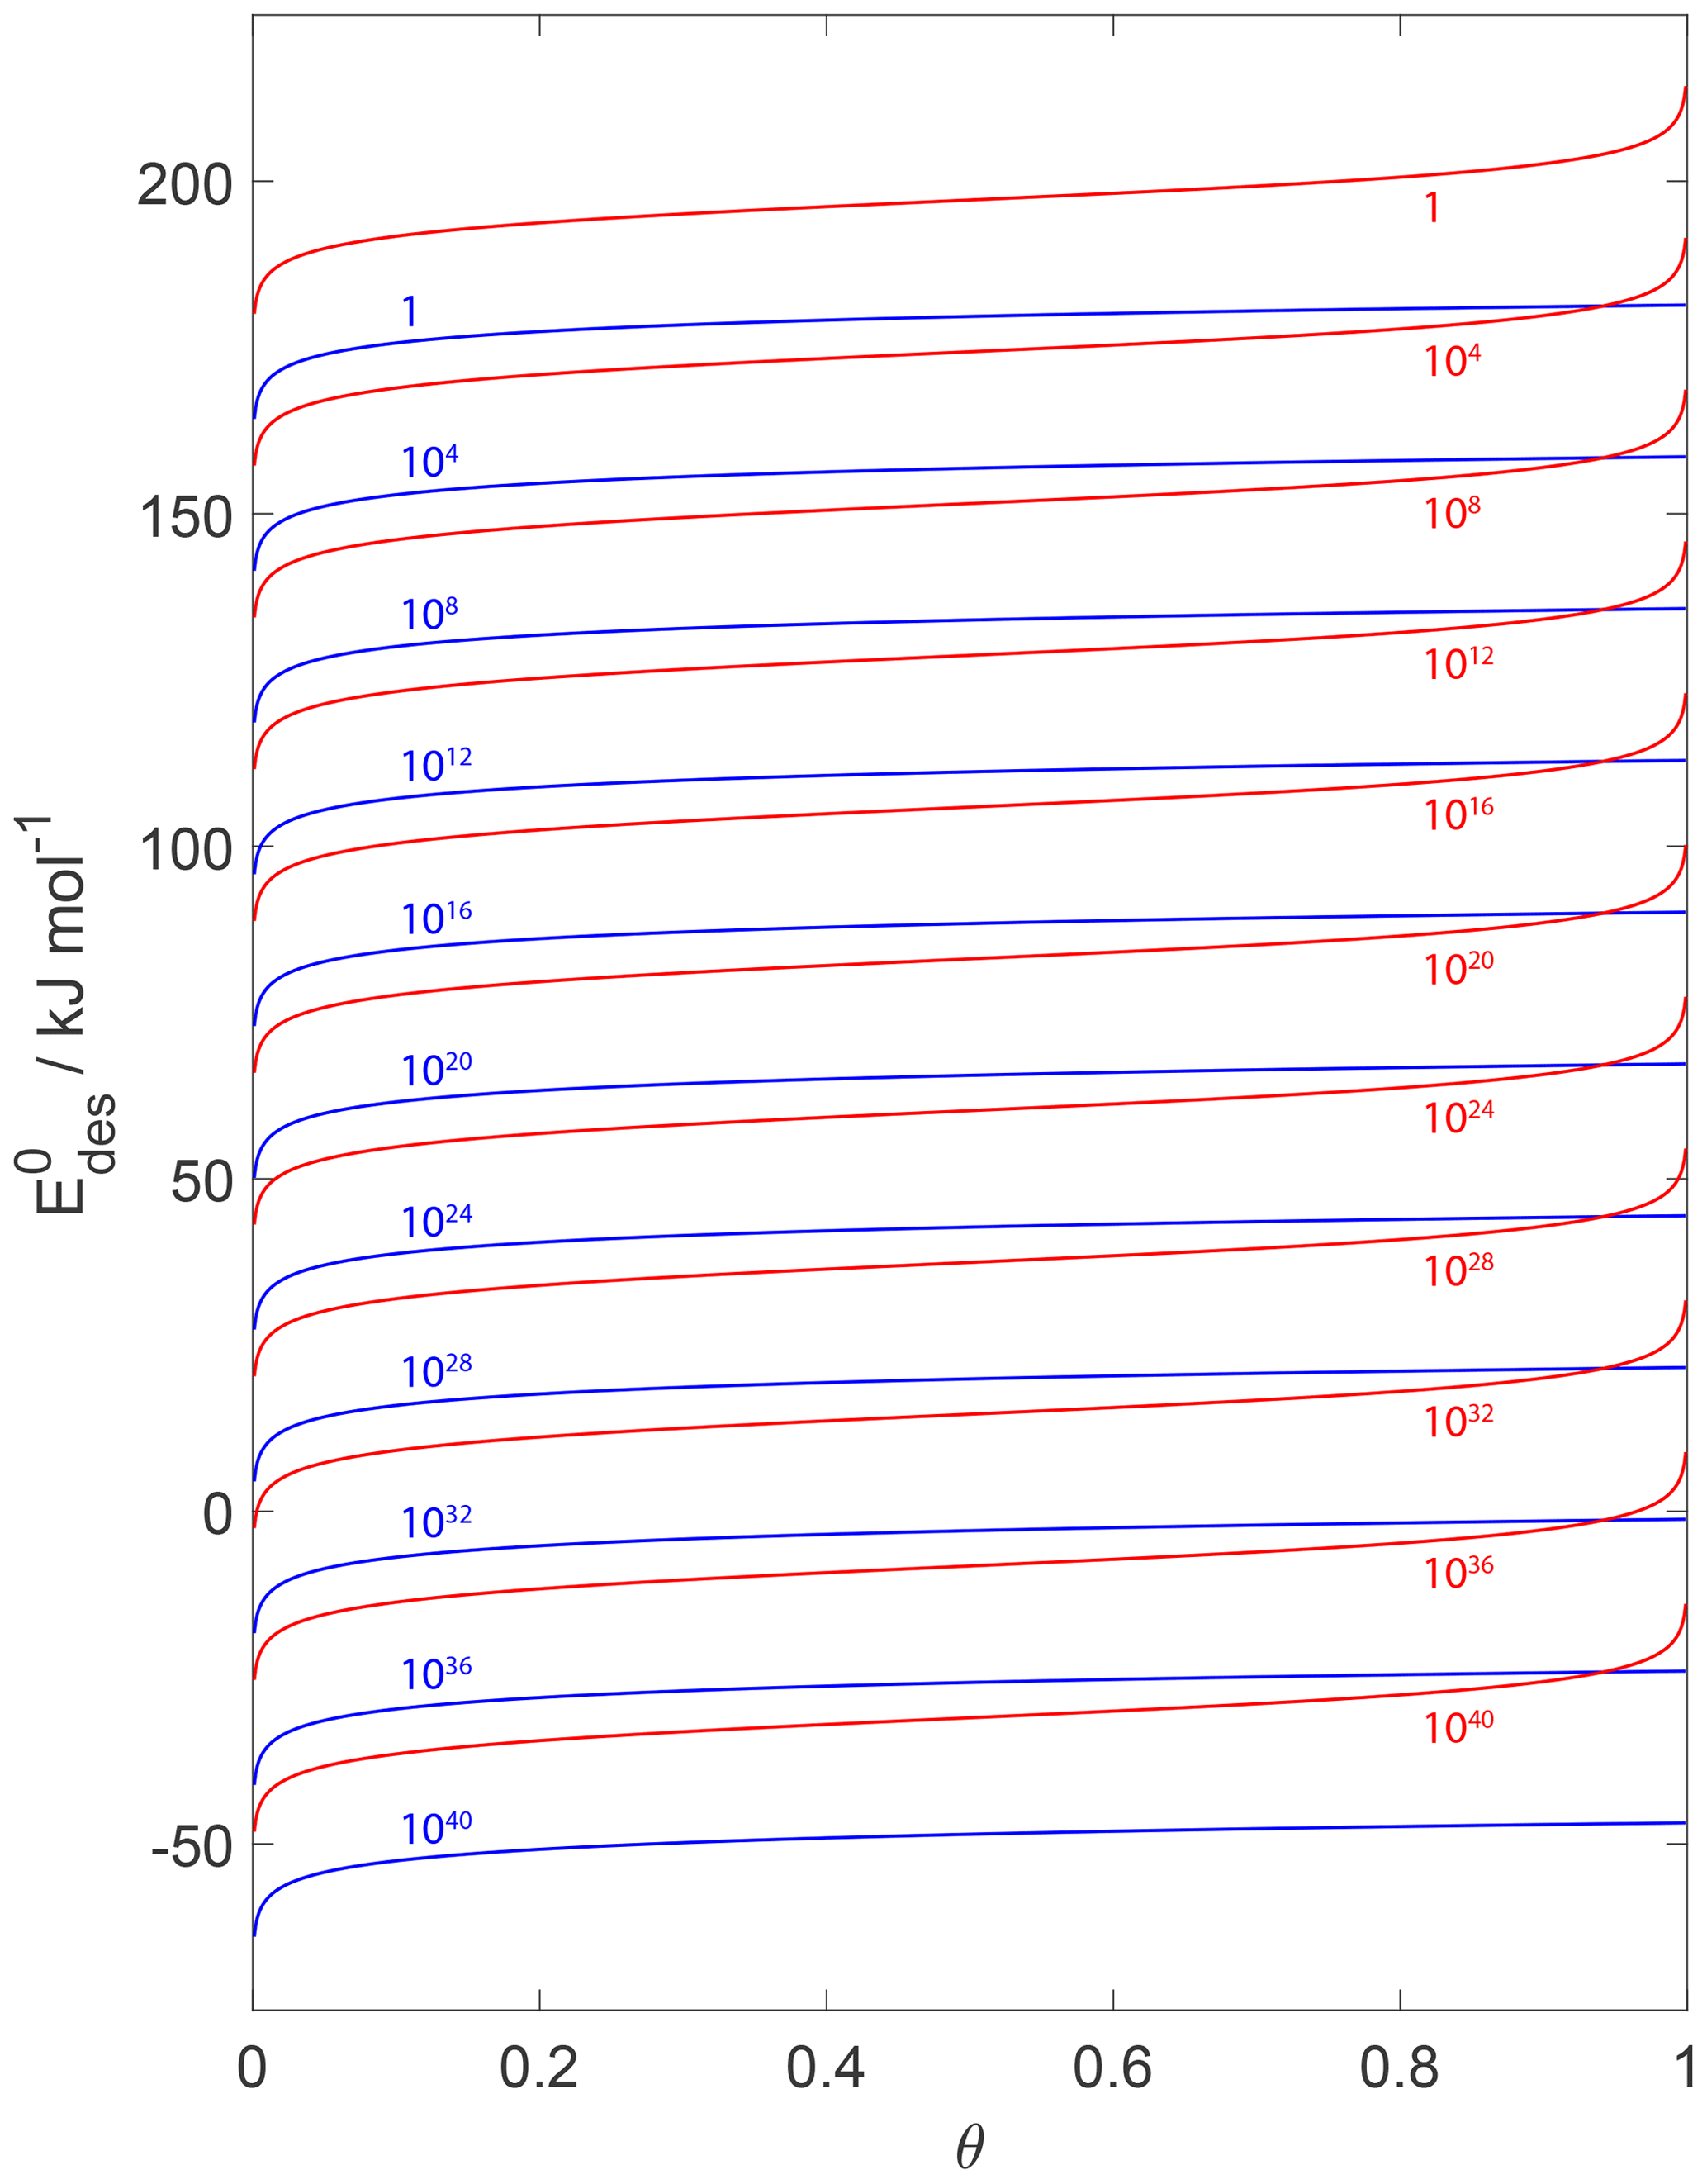
Figure 15Estimates of as a function of coverage for desorption rates from 1 to 1040 (from top to bottom and indicated by colored numbers) for T=298 K. Blue and red lines indicate the desorption model based on a 2D ideal gas and 2D ideal lattice gas, respectively. We assume a desorption process without an additional barrier: . Thermodynamic quantities and standard states necessary for calculation are given in Table S1.
Figures 5, 10, 14, and 15 highlight the potential uncertainties that arise by the choice of the absorbate models for derivation of . In addition to those uncertainties, standard states applied in adsorption and desorption studies are often not known or well documented. This can lead to additional uncertainties as also outlined above. Ades values shown in Fig. 10 will be the same for different choices of standard states as long as the latter have been consistently applied to the entropic contributions , , , and (Eqs. S150, S121, S173, and S134 in the Supplement, respectively) and are correctly included in the equations for Ades (Eqs. 78, 134, 97, 136). The standard molar volume, L mol−1 at 298 K and 1000 hPa, is the typically applied parameter, but one has to make sure to adjust this value to observational conditions, i.e., temperature and pressure, for both the entropic contribution and the derivation of the partition functions. The latter depends linearly on the molar volume (Eqs. S7 and S92 in the Supplement). The actual surface coverage and applied standard surface coverages are often less clear, and furthermore, different standard states may have been chosen for the entropic contributions and experimental conditions. To further complicate matters, standard surface coverages can be defined applying θ0=0.012 or 0.5, which both have their advantages as outlined above. If the standard surface coverage for the entropic contribution is based on θ0=0.012 but the remainder of thermodynamic functions on Ades will be erroneous and thus and τd will be too.
Reversible adsorption is a key process for any gas–condensed-phase interaction and is particularly important when environmental interfaces are involved including aerosol particles. This study provides a comprehensive treatment of the classic and statistical thermodynamics of the adsorption and desorption processes considering transition state theory for two typically applied adsorbate models, the 2D ideal gas and the 2D ideal lattice gas, which apply to solid or liquid substrate surfaces. We established thermodynamic and microscopic relationships for adsorption and desorption equilibrium constants, adsorption and desorption rates, first-order adsorption and desorption rate coefficients, and corresponding pre-exponential factors. These derivations allow the interpretation of thermodynamic functions such as equilibrium constants in terms of their molecular properties, as well as the calculation of explicit numeric expressions for the latter. This exercise demonstrates the importance of applied assumptions of the adsorbate model and standard states when analyzing and interpreting adsorption and desorption processes, the latter often being ill-defined in experimental studies (Donaldson et al., 2012). The derivations allow for a microscopic interpretation of the surface accommodation coefficient including the entropic contribution. Our treatment demonstrates that the pre-exponential factor, when deriving the desorption lifetime from the desorption energy, can differ by orders of magnitude depending on the choice of adsorbate model. Clearly, such a difference yields similar effects on the desorption lifetime, and when used to estimate desorption energies (e.g., from interfacial residence times estimated from molecular dynamics simulations or from measured desorption rates) significant uncertainties in the desorption energy are incurred. Furthermore, uncertainties in surface coverage and assumptions about standard surface coverage can lead to significant changes in desorption rates and thus in evaluated desorption energies for the rather common case of a 2D ideal lattice gas. The objective of providing this comprehensive thermodynamic and microscopic treatment of the adsorption and desorption processes is to guide the theoretical and experimental assessments of adsorption and desorption rates, desorption energies, and choice of standard states with implications for the corresponding desorption lifetimes. This in turn will improve, specifically, the analyses and interpretation of surface layer reaction rates and surface-to-bulk transport and, thus, bulk mass accommodation. More generally, this provides a better basis for the prediction of gas–particle partitioning, multiphase chemical reactions, and the chemical evolution of atmospheric aerosols.
All data needed to draw the conclusions in the present study are shown in the paper and/or the Supplement.
The supplement related to this article is available online at: https://doi.org/10.5194/acp-21-15725-2021-supplement.
DAK and MA envisioned this study and wrote this paper.
The authors are members of the editorial board of Atmospheric Chemistry and Physics. The authors have no other competing interests to declare.
Publisher's note: Copernicus Publications remains neutral with regard to jurisdictional claims in published maps and institutional affiliations.
Daniel A. Knopf acknowledges support from the National Science Foundation. Markus Ammann appreciates support by the Swiss National Science Foundation. This study came out of an ongoing collaborative project with Manabu Shiraiwa and Ulrich Pöschl, and we appreciate discussions with both of our colleagues.
This research has been supported by the National Science Foundation (grant no. AGS-1446286) and the Schweizerischer Nationalfonds zur Förderung der Wissenschaftlichen Forschung (grant no. 188662).
This paper was edited by Andreas Hofzumahaus and reviewed by two anonymous referees.
Ammann, M. and Pöschl, U.: Kinetic model framework for aerosol and cloud surface chemistry and gas-particle interactions – Part 2: Exemplary practical applications and numerical simulations, Atmos. Chem. Phys., 7, 6025–6045, https://doi.org/10.5194/acp-7-6025-2007, 2007.
Ammann, M., Cox, R. A., Crowley, J. N., Jenkin, M. E., Mellouki, A., Rossi, M. J., Troe, J., and Wallington, T. J.: Evaluated kinetic and photochemical data for atmospheric chemistry: Volume VI – heterogeneous reactions with liquid substrates, Atmos. Chem. Phys., 13, 8045–8228, https://doi.org/10.5194/acp-13-8045-2013, 2013.
Arangio, A. M., Slade, J. H., Berkemeier, T., Pöschl, U., Knopf, D. A., and Shiraiwa, M.: Multiphase Chemical Kinetics of OH Radical Uptake by Molecular Organic Markers of Biomass Burning Aerosols: Humidity and Temperature Dependence, Surface Reaction, and Bulk Diffusion, J. Phys. Chem. A, 119, 4533–4544, https://doi.org/10.1021/jp510489z, 2015.
Arrhenius, S. A.: Über die Dissociationswärme und den Einfluss der Temperatur auf den Dissociationsgrad der Elektrolyte, Z. Phys. Chem., 4, 96–116, 1889a.
Arrhenius, S. A.: Über die Reaktionsgeschwindigkeit bei der Inversion von Rohrzucker durch Säuren, Z. Phys. Chem., 4, 226–248, 1889b.
Atkins, P. and de Paula, J.: Physical Chemistry, 8th edn., W. H. Freeman and Company, New York, 1040 pp., 2006.
Bartels-Rausch, T., Huthwelker, T., Gäggeler, H. W., and Ammann, M.: Atmospheric pressure coated-wall flow-tube study of acetone adsorption on ice, J. Phys. Chem. A, 109, 4531–4539, https://doi.org/10.1021/jp045187l, 2005.
Bolis, V.: Fundamentals in Adsorption at the Solid-Gas Interface. Concepts and Thermodynamics, in: Calorimetry and Thermal Methods in Catalysis, vol. 154, edited by: Auroux, A., Springer-Verlag, Berlin, Heidelberg, 3–50, 2013.
Campbell, C. T., Arnadottir, L., and Sellers, J. R. V.: Kinetic Prefactors of Reactions on Solid Surfaces, Z. Phys. Chem., 227, 1435–1454, https://doi.org/10.1524/zpch.2013.0395, 2013.
Campbell, C. T., Sprowl, L. H., and Arnadottir, L.: Equilibrium Constants and Rate Constants for Adsorbates: Two-Dimensional (2D) Ideal Gas, 2D Ideal Lattice Gas, and Ideal Hindered Translator Models, J. Phys. Chem. C, 120, 10283–10297, https://doi.org/10.1021/acs.jpcc.6b00975, 2016.
Chorkendorff, I. and Niemantsverdriet, J. W.: Concepts of Modern Catalysis and Kinetics, 2nd edn., Wiley-VCH, Weinheim, 477 pp., 2007.
Crowley, J. N., Ammann, M., Cox, R. A., Hynes, R. G., Jenkin, M. E., Mellouki, A., Rossi, M. J., Troe, J., and Wallington, T. J.: Evaluated kinetic and photochemical data for atmospheric chemistry: Volume V – heterogeneous reactions on solid substrates, Atmos. Chem. Phys., 10, 9059–9223, https://doi.org/10.5194/acp-10-9059-2010, 2010.
Crowley, J. N., Ammann, M., Cox, R. A., Hynes, R. G., Jenkin, M. E., Mellouki, A., Rossi, M. J., Troe, J., and Wallington, T. J.: Corrigendum to “Evaluated kinetic and photochemical data for atmospheric chemistry: Volume V – heterogeneous reactions on solid substrates” published in Atmos. Chem. Phys. 10, 9059–9223, 2010, Atmos. Chem. Phys., 13, 7359–7359, https://doi.org/10.5194/acp-13-7359-2013, 2013.
Cussler, E. L.: Diffusion – Mass Transfer in Fluid Systems, Cambridge University Press, New York, 631 pp., 2009.
de Boer, J. H.: The Dynamical Character of Adsorption, Clarendon Press, Oxford, 240 pp., 1968.
Donahue, N. M., Epstein, S. A., Pandis, S. N., and Robinson, A. L.: A two-dimensional volatility basis set: 1. organic-aerosol mixing thermodynamics, Atmos. Chem. Phys., 11, 3303–3318, https://doi.org/10.5194/acp-11-3303-2011, 2011.
Donaldson, D. J., Ammann, M., Bartels-Rausch, T., and Pöschl, U.: Standard States and Thermochemical Kinetics in Heterogeneous Atmospheric Chemistry, J. Phys. Chem. A, 116, 6312–6316, https://doi.org/10.1021/jp212015g, 2012.
Eyring, H.: The activated complex in chemical reactions, J. Chem. Phys., 3, 107–115, https://doi.org/10.1063/1.1749604, 1935.
Finlayson-Pitts, B. J. and Pitts, J. N.: Chemistry of the Upper and Lower Atmosphere: Theory, Experiments and Applications, Academic Press, San Diego, CA, London, xxii, 969 pp., 2000.
Frenkel, J.: Theory of the adsorption and related occurrences, Z. Phys., 26, 117–138, https://doi.org/10.1007/bf01327320, 1924.
George, I. J. and Abbatt, J. P. D.: Heterogeneous oxidation of atmospheric aerosol particles by gas-phase radicals, Nat. Chem., 2, 713–722, https://doi.org/10.1038/Nchem.806, 2010.
Hanson, D. R. and Ravishankara, A. R.: The Loss of CF2O On Ice, NAT, and Sulfuric-Acid-Solutions, Geophys. Res. Lett., 18, 1699–1701, 1991.
Hill, T. L.: An Introduction to Statistical Thermodynamics, Dover Publications, New York, 501 pp., 1986.
Jimenez, J. L., Canagaratna, M. R., Donahue, N. M., Prevot, A. S. H., Zhang, Q., Kroll, J. H., DeCarlo, P. F., Allan, J. D., Coe, H., Ng, N. L., Aiken, A. C., Docherty, K. S., Ulbrich, I. M., Grieshop, A. P., Robinson, A. L., Duplissy, J., Smith, J. D., Wilson, K. R., Lanz, V. A., Hueglin, C., Sun, Y. L., Tian, J., Laaksonen, A., Raatikainen, T., Rautiainen, J., Vaattovaara, P., Ehn, M., Kulmala, M., Tomlinson, J. M., Collins, D. R., Cubison, M. J., Dunlea, E. J., Huffman, J. A., Onasch, T. B., Alfarra, M. R., Williams, P. I., Bower, K., Kondo, Y., Schneider, J., Drewnick, F., Borrmann, S., Weimer, S., Demerjian, K., Salcedo, D., Cottrell, L., Griffin, R., Takami, A., Miyoshi, T., Hatakeyama, S., Shimono, A., Sun, J. Y., Zhang, Y. M., Dzepina, K., Kimmel, J. R., Sueper, D., Jayne, J. T., Herndon, S. C., Trimborn, A. M., Williams, L. R., Wood, E. C., Middlebrook, A. M., Kolb, C. E., Baltensperger, U., and Worsnop, D. R.: Evolution of Organic Aerosols in the Atmosphere, Science, 326, 1525–1529, https://doi.org/10.1126/science.1180353, 2009.
Kemball, C. and Rideal, E. K.: The adsorption of vapours on mercury. 1. Non-polar substances, P. Roy. Soc. Lond. A Mat., 187, 53–73, https://doi.org/10.1098/rspa.1946.0065, 1946.
Kisliuk, P.: The sticking probabilities of gases chemisorbed on the surfaces of solids, J. Phys. Chem. Solids, 3, 95–101, https://doi.org/10.1016/0022-3697(57)90054-9, 1957.
Kolasinski, K. W.: Surface Science: Foundations of Catalysis and Nanoscience, 3rd edn., John Wiley & Sons, Ltd., West Sussex, United Kingdom, 556 pp., 2012.
Kolb, C. E., Worsnop, D. R., Zahniser, M. S., Davidovits, P., Keyser, L. F., Leu, M.-T., Molina, M. J., Hanson, D. R., Ravishankara, A. R., Williams, L. R., and Tolbert, M. A.: Laboratory Studies of Atmospheric Heterogeneous Chemistry, in: Progress and Problems in Atmospheric Chemistry, edited by: Barker, J. R., World Scientific, Singapore, 771–875, 1995.
Kolb, C. E., Cox, R. A., Abbatt, J. P. D., Ammann, M., Davis, E. J., Donaldson, D. J., Garrett, B. C., George, C., Griffiths, P. T., Hanson, D. R., Kulmala, M., McFiggans, G., Pöschl, U., Riipinen, I., Rossi, M. J., Rudich, Y., Wagner, P. E., Winkler, P. M., Worsnop, D. R., and O'Dowd, C. D.: An overview of current issues in the uptake of atmospheric trace gases by aerosols and clouds, Atmos. Chem. Phys., 10, 10561–10605, 2010.
Kroll, J. H., Donahue, N. M., Jimenez, J. L., Kessler, S. H., Canagaratna, M. R., Wilson, K. R., Altieri, K. E., Mazzoleni, L. R., Wozniak, A. S., Bluhm, H., Mysak, E. R., Smith, J. D., Kolb, C. E., and Worsnop, D. R.: Carbon oxidation state as a metric for describing the chemistry of atmospheric organic aerosol, Nat. Chem., 3, 133–139, https://doi.org/10.1038/NCHEM.948, 2011.
Laidler, K. J.: The mechanisms of some elementary surface reactions, J. Phys. Colloid Chem., 53, 712–732, https://doi.org/10.1021/j150470a010, 1949.
Laidler, K. J., Glasstone, S., and Eyring, H.: Application of the Theory of Absolute Reaction Rates to Heterogeneous Processes II. Chemical Reactions on Surfaces, J. Chem. Phys., 8, 667–676, https://doi.org/10.1063/1.1750737, 1940.
Langmuir, I.: A theory of adsorption, Phys. Rev., 6, 79–80, 1915.
Langmuir, I.: The evaporation, condensation and reflection of molecules and the mechanism of adsorption, Phys. Rev., 8, 149–176, https://doi.org/10.1103/PhysRev.8.149, 1916.
Langmuir, I.: The adsorption of gases on plane surfaces of glass, mica and platinum, J. Am. Chem. Soc., 40, 1361–1403, https://doi.org/10.1021/ja02242a004, 1918.
Langmuir, I.: Vapor pressures, evaporation, condensation and adsorption, J. Am. Chem. Soc., 54, 2798–2832, https://doi.org/10.1021/ja01346a022, 1932.
Li, J. and Knopf, D. A.: Representation of Multiphase OH Oxidation of Amorphous Organic Aerosol for Tropospheric Conditions, Environ. Sci. Technol., 55, 7266–7275, https://doi.org/10.1021/acs.est.0c07668, 2021.
Li, J., Forrester, S. M., and Knopf, D. A.: Heterogeneous oxidation of amorphous organic aerosol surrogates by O3, NO3, and OH at typical tropospheric temperatures, Atmos. Chem. Phys., 20, 6055–6080, https://doi.org/10.5194/acp-20-6055-2020, 2020.
McNaught, A. D. and Wilkinson, A.: IUPAC. Compendium of Chemical Terminology (the “Gold Book”), 2nd edn., Blackwell Scientific Publications, Oxford, 2014.
McQuarrie, D. A.: Statistical mechanics, University Science Books, Sausalito, CA, 631 pp., 2000.
Moise, T., Flores, J. M., and Rudich, Y.: Optical properties of secondary organic aerosols and their changes by chemical processes, Chem. Rev., 115, 4400–4439, https://doi.org/10.1021/cr5005259, 2015.
Pilling, M. J. and Seakins, P. W.: Reaction Kinetics, 2nd edn., Oxford Science Publications, Oxford University Press, New York, USA, 320 pp., 1996.
Pöschl, U. and Shiraiwa, M.: Multiphase Chemistry at the Atmosphere-Biosphere Interface Influencing Climate and Public Health in the Anthropocene, Chem. Rev., 115, 4440–4475, https://doi.org/10.1021/cr500487s, 2015.
Pöschl, U., Rudich, Y., and Ammann, M.: Kinetic model framework for aerosol and cloud surface chemistry and gas-particle interactions – Part 1: General equations, parameters, and terminology, Atmos. Chem. Phys., 7, 5989–6023, 2007.
Ravishankara, A. R.: Heterogeneous and multiphase chemistry in the troposphere, Science, 276, 1058–1065, 1997.
Rowland, F. S.: Stratospheric ozone depletion, Annu. Rev. Phys. Chem., 42, 731–768, https://doi.org/10.1146/annurev.physchem.42.1.731, 1991.
Rudich, Y., Donahue, N. M., and Mentel, T. F.: Aging of organic aerosol: Bridging the gap between laboratory and field studies, Annu. Rev. Phys. Chem., 58, 321–352, https://doi.org/10.1146/annurev.physchem.58.032806.104432, 2007.
Savara, A.: Standard States for Adsorption on Solid Surfaces: 2D Gases, Surface Liquids, and Langmuir Adsorbates, J. Phys. Chem. C, 117, 15710–15715, https://doi.org/10.1021/jp404398z, 2013.
Shiraiwa, M. and Pöschl, U.: Mass accommodation and gas–particle partitioning in secondary organic aerosols: dependence on diffusivity, volatility, particle-phase reactions, and penetration depth, Atmos. Chem. Phys., 21, 1565–1580, https://doi.org/10.5194/acp-21-1565-2021, 2021.
Shiraiwa, M. and Seinfeld, J. H.: Equilibration timescale of atmospheric secondary organic aerosol partitioning, Geophys. Res. Lett., 39, L24801, https://doi.org/10.1029/2012gl054008, 2012.
Shiraiwa, M., Pfrang, C., Koop, T., and Pöschl, U.: Kinetic multi-layer model of gas-particle interactions in aerosols and clouds (KM-GAP): linking condensation, evaporation and chemical reactions of organics, oxidants and water, Atmos. Chem. Phys., 12, 2777–2794, 2012.
Shiraiwa, M., Zuend, A., Bertram, A. K., and Seinfeld, J. H.: Gas-particle partitioning of atmospheric aerosols: interplay of physical state, non-ideal mixing and morphology, Phys. Chem. Chem. Phys., 15, 11441–11453, https://doi.org/10.1039/c3cp51595h, 2013.
Solomon, S.: Stratospheric ozone depletion: A review of concepts and history, Rev. Geophys., 37, 275–316, 1999.
Sprowl, L. H., Campbell, C. T., and Arnadottir, L.: Hindered Translator and Hindered Rotor Models for Adsorbates: Partition Functions and Entropies, J. Phys. Chem. C, 120, 9719–9731, https://doi.org/10.1021/acs.jpcc.5b11616, 2016.
Tabazadeh, A. and Turco, R. P.: A Model for Heterogeneous Chemical Processes on the Surfaces of Ice and Nitric-Acid Trihydrate Particles, J. Geophys. Res., 98, 12727–12740, 1993.
Tully, J. C.: The dynamics of adsorption and desorption, Surf. Sci., 299, 667–677, https://doi.org/10.1016/0039-6028(94)90688-2, 1994.
- Abstract
- Introduction
- Thermodynamic and microscopic considerations of the adsorption–desorption process
- Thermodynamic functions of the desorption equilibrium
- Derivation of the desorption rate and pre-exponential factor A
- Rate of adsorption
- Adsorption–desorption equilibrium
- Derivation of kinetic parameters from the equilibrium constants
- Implications for the assessment of the desorption energy and rate and pre-exponential factor
- Conclusions
- Data availability
- Author contributions
- Competing interests
- Disclaimer
- Acknowledgements
- Financial support
- Review statement
- References
- Supplement