the Creative Commons Attribution 4.0 License.
the Creative Commons Attribution 4.0 License.
 | 28 Sep 2021
The outflow of Asian biomass burning carbonaceous aerosol into the upper troposphere and lower stratosphere in spring: radiative effects seen in a global model
Prashant Chavan
Tanusri Chakroborty
Christopher E. Sioris
Sabine Griessbach
Rolf Müller
Biomass burning (BB) over Asia is a strong source of carbonaceous aerosols during spring. From ECHAM6–HAMMOZ model simulations and satellite observations, we show that there is an outflow of Asian BB carbonaceous aerosols into the upper troposphere and lower stratosphere (UTLS) (black carbon: 0.1 to 6 ng m−3 and organic carbon: 0.2 to 10 ng m−3) during the spring season. The model simulations show that the greatest transport of BB carbonaceous aerosols into the UTLS occurs from the Indochina and East Asia region by deep convection over the Malay Peninsula and Indonesia. The increase in BB carbonaceous aerosols enhances atmospheric heating by 0.001 to 0.02 K d−1 in the UTLS. The aerosol-induced heating and circulation changes increase the water vapor mixing ratios in the upper troposphere (by 20–80 ppmv) and in the lowermost stratosphere (by 0.02–0.3 ppmv) over the tropics. Once in the lower stratosphere, water vapor is further transported to the South Pole by the lowermost branch of the Brewer–Dobson circulation. These aerosols enhance the in-atmosphere radiative forcing (0.68±0.25 to 5.30±0.37 W m−2), exacerbating atmospheric warming, but produce a cooling effect on climate (top of the atmosphere – TOA: to W m−2). The model simulations also show that Asian carbonaceous aerosols are transported to the Arctic in the troposphere. The maximum enhancement in aerosol extinction is seen at 400 hPa (by 0.0093 km−1) and associated heating rates at 300 hPa (by 0.032 K d−1) in the Arctic.
- Article
(13212 KB) - Full-text XML
-
Supplement
(1106 KB) - BibTeX
- EndNote


There is growing concern about increasing aerosol amounts over South and East Asia, not only because of its contribution to air pollution and its harmful health effects (Chen et al., 2017; Thomas et al., 2019), but also because of its impact on the hydrological cycle (Meehl et al., 2008). Biomass burning (BB) accounts for ∼ 60 % of the total aerosol optical depth (AOD) globally (Cheng et al., 2009; Streets et al., 2003). It is one of the major sources of large carbonaceous aerosol (Ni et al., 2019). BB is responsible for the major fraction of global mean emissions of black carbon (BC, ∼ 59 %) and organic carbon (OC, ∼ 85 %) (Bond et al., 2013).
In Asia, China (25 %) is the largest contributor to the global BB aerosol emissions, followed by India (18 %), Indonesia (13 %), and Myanmar (8 %) (Streets et al., 2003). Among the sources, forest burning (anthropogenic and natural) contributes 45 %, burning of crop residues in the field 35 %, and burning grassland and savannah 20 % to the total BB aerosols in Asia (Streets et al., 2003). Asia emits a substantial amount of BC (∼ 0.45 Tg yr−1) and OC (∼ 3.3 Tg yr−1) from BB (Streets et al., 2003). These are significant fractions of the global BB emissions of BC (∼ 2.8–4.9 Tg yr−1) and OC (∼ 31–36 Tg yr−1), respectively (Andreae, 2019). Recently, Wu et al. (2018) and Singh et al. (2020a) reported that ∼ 83 % of the carbonaceous aerosol mass is emitted from open fires over South and East Asia. Within Asia, BB carbonaceous aerosol emissions from East Asia (BC: 110 Gg, OC: 730 Gg) are larger than over India (BC: 83 Gg, OC: 650 Gg) and the Indochina region (BC: 40 Gg, OC: 310 Gg) (Streets et al., 2003).
Biomass burning over Asia shows a strong seasonal cycle peaking in spring (Streets et al., 2003). Our analysis of MODIS fire counts over Asia also shows a pronounced peak in spring (Fig. 1a). The carbonaceous aerosols emitted from BB also peak in spring over the Indochina, South Asia, and East Asia regions (Fig. 1b). These aerosols will affect the regional radiative forcing. The literature shows that aerosols emitted from BB in spring produce a significant negative radiative forcing at the top of the atmosphere (TOA) and at the surface, but in-atmospheric radiative forcing (TOA–surface) is positive over Asia (Wang et al., 2007; Lin et al., 2014; Singh et al., 2020a).
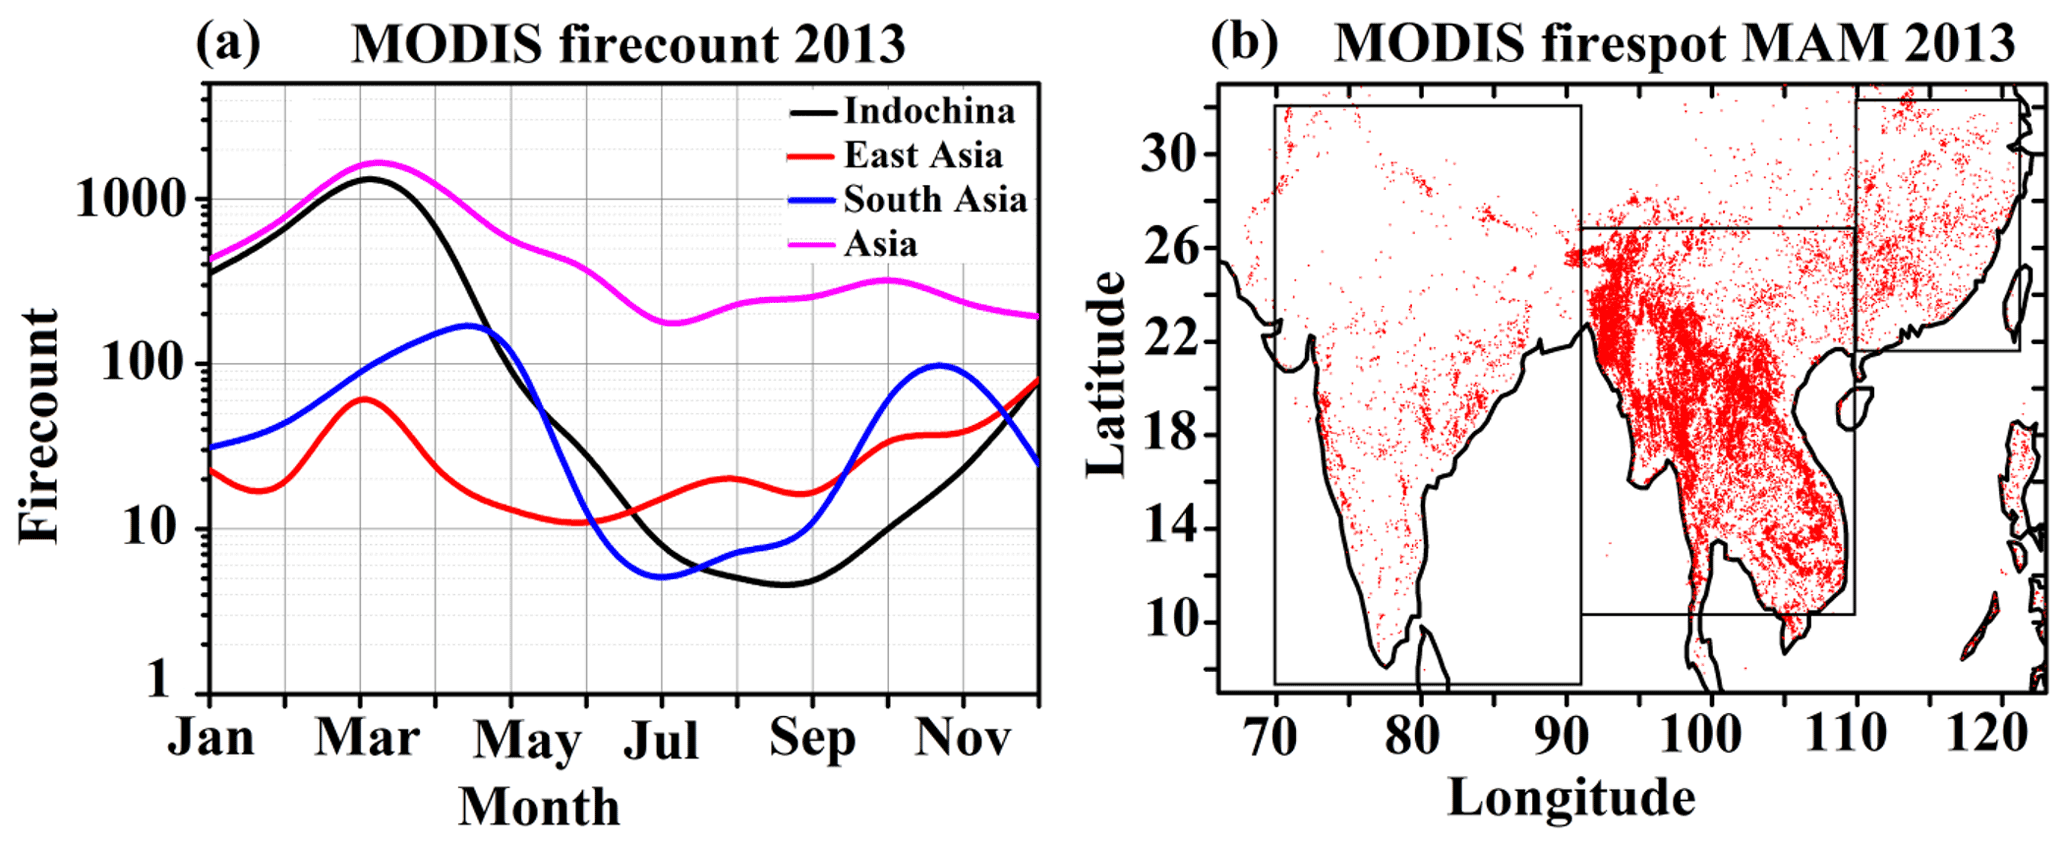
Figure 1(a) Monthly mean distribution of MODIS fire counts averaged over Indochina (91–107∘ E, 10–27∘ N), East Asia (108–123∘ E, 22–32∘ N), South Asia (70–90∘ E, 8–32∘ N) and Asia (60–130∘ E, 10∘ S–50∘ N). (b) Spatial distribution of fire spots over South Asia, Indochina and East Asia averaged for spring 2013. Boxes in (b) indicate the boundaries of South Asia, Indochina and East Asia.
Deep convection occurs over the Bay of Bengal, the South China Sea, and the Malay Peninsula during the spring and monsoon seasons (Randel et al., 2010; Fadnavis et al., 2013; Murugavel et al., 2012) that may transport Asian boundary layer pollutants to the upper troposphere and lower stratosphere (UTLS). Numerous airborne measurements show evidence of carbonaceous aerosol in the upper troposphere over Asia and adjoining outflow regions during the spring and monsoon seasons, e.g., measurements from the Civil Aircraft for Regular Investigation of the Atmosphere Based on an Instrument Container (CARIBIC) campaign in 2004, Stratospheric and upper tropospheric processes for better climate predictions (StratoClim) in 2017, Aerosol Radiative Forcing in East Asia (A-FORCE) in 2009, and Transport and Chemical Evolution over the Pacific (TRACE-P) in 2001 (Nguyen et al., 2008; Pozzoli et al., 2008; Oshima et al., 2012; Weigel et al., 2021; Brunamonti et al., 2018; Hanumanthu et al., 2020). There may be a significant contribution from BB to the observed carbonaceous aerosols in the UTLS, since BB accounts for ∼ 59 %–80 % of the carbonaceous aerosols globally (Bond et al., 2013) and, being fine-grained, these aerosols have long atmospheric residence times. Transport of Australian wildfire smoke into the stratosphere (∼ 35 km) is seen in satellite observations (Khaykin et al., 2020). The balloon-borne, lidar, and satellite observations showed pyrocumulonimbus events that injected smoke from Canadian forest fires into the stratosphere in August 2017 (Peterson et al., 2018; Hooghiem et al., 2020; Lestrelin et al., 2021). The carbonaceous aerosols were transported to the upper troposphere and produced significant heating locally (Fadnavis et al., 2017a). The heating of the upper troposphere induces an amplification of the vertical motion in the troposphere (Fadnavis et al., 2017b; Hooghiem, et al., 2020).
Numerous studies show the transport of boundary layer aerosols from Asia to the lower stratosphere during the monsoon season (Randel et al., 2010; Fadnavis et al., 2013). However, transport of Asian aerosol pollution into the UTLS during the spring season has not been reported hitherto when the deep convection occurs over the Malay Peninsula (Chang et al., 2005) and Indonesia and when biomass burning aerosol emissions show a peak (Streets et al., 2003; Fig. 1). In this study, we address these unexplored science questions: (1) transport pathways of Asian BB aerosols to the lower stratosphere during the spring season and (2) impacts of Asian BB carbonaceous aerosols on the lower stratosphere. For this purpose, we employ the state-of-the-art ECHAM6–HAMMOZ chemistry-climate model. The model is evaluated against satellite (MODIS) and ground-based remote sensing (AERONET). The paper is organized as follows: satellite data, ground-based data, and the experimental set-up are described in Sect. 2. Section 3 comprises a discussion of the distribution of fires and model evaluation; results are discussed in Sect. 4; conclusions are given in Sect. 5.
2.1 Model description and experimental set-up
The fully coupled chemistry-climate model ECHAM6.3–HAM2.3 is used in this study. It comprises the general circulation model ECHAM6 coupled to the aerosol sub-module “Hamburg Aerosol Model (HAM)” (Stier et al., 2005). HAM predicts the evolution of sulfate (SU), BC, OC, particulate organic matter (POM), sea salt (SS), and mineral dust (DU) aerosols. The size distribution of the aerosol population is described by seven lognormal modes with prescribed variance in the aerosol module (Stier et al., 2005). The anthropogenic and fire emissions were obtained from the ACCMIP-II (Emissions for Atmospheric Chemistry and Climate Model Intercomparison Project) emission inventories and are interpolated for the period 2000–2100 by using Representative Concentration Pathway 4.5 (RCP4.5) (Lamarque et al., 2010; van Vuuren et al., 2011). The biomass burning emissions dataset represents average conditions of the decade (Tegen et al., 2019). It should be noted that inter-annual variability of biomass burning is not considered in our simulations. Injection heights of biomass burning emissions are documented by Val Martin et al. (2010). The majority (75 %) of the emissions are evenly distributed within the planetary boundary layer (PBL), with 17 % in the first model level above the planetary boundary layer and 8 % in the second model level above the planetary boundary layer (Tegen et al., 2019). Biogenic emissions are derived from MEGAN (Guenther, 1995). In the model, biogenic OC is directly inserted via emissions. Secondary organic aerosol (SOA) emissions are as described by Dentener et al. (2006).
The model simulations are performed at a T63 spectral resolution corresponding to 1.875∘ × 1.875∘ horizontal resolution, while 47 hybrid σ-p levels provide the vertical resolution from the surface up to 0.01 hPa. The model has 12 vertical levels in the UTLS (300 to 50 hPa). The simulations have been carried out at a time step of 20 min. Atmospheric Model Inter-comparison Project (AMIP) monthly varying sea surface temperature (SST) and sea ice cover (SIC) were used as lower boundary conditions. We performed two sets of emission sensitivity experiments; in one set of the simulations, the aerosol emissions from biomass burning were kept on (referred to as BMaeroon simulations), and in another set of the simulations, the aerosol emissions from biomass burning were kept off (referred to as BMaerooff simulations). To assess the uncertainty caused by model imperfections, we adopted an ensemble mean approach (with 10 ensemble members) for the above two experiments. Ten spin-up simulations were performed from 1 to 10 January 2012 up to 28 February 2013 to generate stabilized initial fields for the 10 ensemble members. Emissions were the same in each of the 10 members during the spin-up period. In the BMaerooff simulations (10 ensemble members each), the biomass burning aerosols have been switched off since 1 March 2013. The BMaeroon and BMaerooff simulations ended on 31 December 2013. To investigate the effects of biomass burning aerosol emissions in spring (i.e., since 1 March 2013), we analyze the difference between BMaeroon and BMaerooff simulations for the spring season in 2013. The uncertainty estimates in simulated radiative forcing, heating rates, and aerosol extinction coefficient are obtained from the difference between the mean of (a) the 10 members for BMaeroon and (b) the 10 members for BMaerooff. Both sets were generated from initial conditions, with start times shifting by a day over the 10 d period of 1–10 January. The year 2013 was chosen for the analysis as this was a neutral year without a pronounced El Niño or Indian Ocean Dipole oscillation. Such large-scale coupled atmosphere–ocean oscillations substantially affect the transport processes to the UTLS (Fadnavis et al., 2017a, 2019).
2.2 MODIS fire counts and aerosol optical depth
In order to study spatio-temporal variations in the biomass burning activity, we analyzed the Terra/Aqua combined daily active fire location data (product mcd14dl) from the Moderate Resolution Imaging Spectroradiometer (MODIS) (https://firms.modaps.eosdis.nasa.gov/download/, last access: 1 January 2021) onboard Terra and Aqua (Earth Observing System). These MODIS collection-6, Level-2 global data are processed by NASA's Land, Atmosphere Near real-time Capability for EOS (LANCE) Fire Information for Resource Management System (FIRMS), using swath products (MOD14/MYD14). The thermal anomaly/active fire represents the center of a 1 km pixel that is flagged by the MODIS MOD14/MYD14 Fire and Thermal Anomalies algorithm as containing one or more fires within the pixel (Giglio et al., 2003). The fire detection algorithm uses the strong mid-infrared (IR) emissions from the fires (Matson and Dozier, 1981) and is based on the brightness temperatures derived from MODIS at the 4 and 11 µm channels. The retrieval algorithm classifies fire pixels into three categories: low confidence (0 %–30 %), nominal confidence (30 %–80 %), and high confidence (>80 %). This confidence limit allows the rejection of false fires (Giglio et al., 2016). Here, data with high or nominal confidence (≥70 %) are used.
For information on aerosol, we used monthly mean data from MODIS Terra (MOD08 M3 V6.1) at 1∘ × 1∘ horizontal resolution to study AOD variability over the Asian region during spring 2013. MODIS Terra measures radiance emanating from the surface and the atmosphere and provides images in 36 spectral bands between 0.415 and 14.235 µm, with a spatial resolution varying from 250 m to 1 km (Mhawish et al., 2019). Terra MODIS MOD08_M3 (V6.1) aerosol products (i.e., AOD) are retrieved using the Deep Blue (DB) algorithm. The algorithm calculates the column aerosol loading at 0.55 µm over land and ocean.
2.3 Multi-Angle Imaging Spectroradiometer (MISR), Aerosol Robotic NETwork (AERONET) and Optical Spectrograph and InfraRed Imaging System (OSIRIS) observations
The AOD retrievals from the Multi-Angle Imaging Spectroradiometer (MISR) at 550 nm wavelength and the Aerosol Robotic NETwork (AERONET) sunphotometer during spring 2013 are also used for comparison with the model simulations. Details of MISR are available at https://misr.jpl.nasa.gov/getData/accessData/ (last access: 1 January 2021) and AERONET at https://aeronet.gsfc.nasa.gov/ (last access: 1 January 2021). AERONET AOD observations are obtained at different stations in the Indochina region (Myanmar: 16.86∘ N–96.15∘ E, Vientiane: 17.99∘ N–102.57∘ E, Siplakorn University: 13.81∘ N–100.04∘ E, Ubon-Ratchathani: 15.24∘ N–104.87∘ E), South Asia (Gandhi College: 25.81∘ N–85.12∘ E, Lumbini: 27.49∘ N–83.28∘ E, Kathmandu Bode: 27.68∘ N–85.39∘ E, Dhaka University: 23.72∘ N–90.39∘ E), East Asia (Nghia-Do: 21.04∘ N–105.80∘ E, Hong Kong Polytechnic University: 22.30∘ N–114.18∘ E).
We compared simulated aerosol extinction coefficient vertical profiles with observations from the Optical Spectrograph and InfraRed Imaging System (OSIRIS) onboard the Odin satellite (Bourassa et al., 2012). We used version 7.0 vertical profiles of aerosol extinction at 750 nm for March–May 2013 (https://research-groups.usask.ca/osiris/data-products.php#Download, last access: 1 January 2021). The limb scatter measurements from OSIRIS show good agreement with the Stratospheric Aerosol and Gas Experiment (SAGE) II and Scanning Imaging Absorption spectrometer for Atmospheric Chartography (Rieger et al., 2018). To understand convective activity in spring 2013, we also analyzed outgoing longwave radiation (OLR) data for March–May 2013 from the National Center for Environmental Prediction (NCEP) Reanalysis-2 (https://psl.noaa.gov/data/gridded/data.ncep.reanalysis2.pressure.html, last access: 1 January 2021).
3.1 Seasonal distribution of fires over Asia
In this section, we discuss the seasonal variability of fire activity in Asia. The fire counts peak over Asia (10∘ S–50∘ N, 60–130∘ E) in the spring season. Figure 1a–b show that fires are clustered over three sub-regions: (1) the Indochina region (91–107∘ E, 10–27∘ N) (number of fire counts: 80 694), (2) East Asia (108–123∘ E, 22–32∘ N), (number of fire counts: 4770), and (3) South Asia (65–90∘ E, 8–32∘ N) (number of fire counts: 14 223) (Fig. 1b). Fire counts over the three sub-regions peak in spring, although the month varies; e.g., fire counts over East Asia show a peak in March, the Indochina region in March–April, and South Asia in May (Fig. 1a). The fire counts over South Asia show a secondary peak in October. In agreement with our results, Bhardwaj et al. (2016) also reported high fire activity in spring and the lowest fire activity during the monsoon (June–September) in the 2003–2013 time frame. Streets et al. (2003) reported that higher fire counts during the spring season over South Asia and East Asia are attributed to enhanced crop burning activity. Over the Indochina region, high fire counts are associated with forest fires along with crop burning. Intense biomass burning activity over Asia during the spring season is also reported by Zhang et al. (2020). Hence, we provide further analysis in spring.
3.2 Model evaluation
We compare simulated AOD (averaged for spring from BMaeroon simulations) with MODIS, MISR, and AERONET. Figure 2a–c show large AOD over the regions: Indochina (MODIS: ∼ 0.4 to 0.8, MISR: 0.27 to 0.6, model: 0.27 to 0.5), East Asia (MODIS: 0.5 to 1.3, MISR: 0.27 to 1, model: 0.5 to 1.4), and the Indo-Gangetic Plain in South Asia (23–30∘ N, 75–85∘ E) (MODIS: 0.24 to 0.8, MISR: 0.24 to 0.5, model: 0.3 to 0.6). The MISR AOD is comparatively less than MODIS AOD over all three study regions (Fig. 2a–b). There are differences in the spatial distribution of AOD among MODIS, MISR, and the model. Over East Asia, the model overestimates AOD relative to MISR (by 0.24) and MODIS (by 0.1). Over Indochina, the model shows an underestimation compared to MISR (by 0.1) and MODIS (by 0.2). The simulated AOD is overestimated over the Indo-Gangetic Plain in comparison with MISR (by 0.08) and underestimated compared to MODIS (0.2). The simulated AOD is underestimated south of 13∘ N compared to MISR and MODIS (MODIS: 0.4 to 0.7, MISR: 0.4 to 0.6, model: 0.21 to 0.3) and overestimated over central India (lat: 20–28∘ N, long: 75–88∘ E) compared to MODIS and MISR (MODIS: 0.16 to 0.4, MISR: 0.21 to 0.3, model: 0.3 to 0.5). These issues may be due to a higher amount of dust emission in the model over western Asia that is transported to India. In the past, a number of papers reported that transport of dust occurs from western Asia to the Indo-Gangetic Plain and the Tibetan Plateau region during spring (Lau et al., 2006; Fadnavis et al., 2017b, 2021a). Simulated AOD is also overestimated over the Tibetan Plateau and East Asian region (MODIS: 0.21 to 1.0, MISR: 0.16 to 0.6, model: 0.27 to 1.2). The distribution of dust AOD also shows high amounts over these regions (see Fig. S1 in the Supplement). This indicates that higher amounts of dust over the Tibetan Plateau and the East Asia region cause overestimation of AOD there. Tegen et al. (2019) also reported that in ECHAM6–HAMMOZ simulations the AOD is overestimated over East Asia in comparison with MISR. The model simulations underestimate the AOD over the Himalayas in comparison with MODIS (MODIS: 0.24 to 0.3, MISR: 0.1 to 0.21, model: 0.1 to 0.3). It should be noted that dust emission/parameterization is the same in both BMaeroon and BMaerooff simulations.
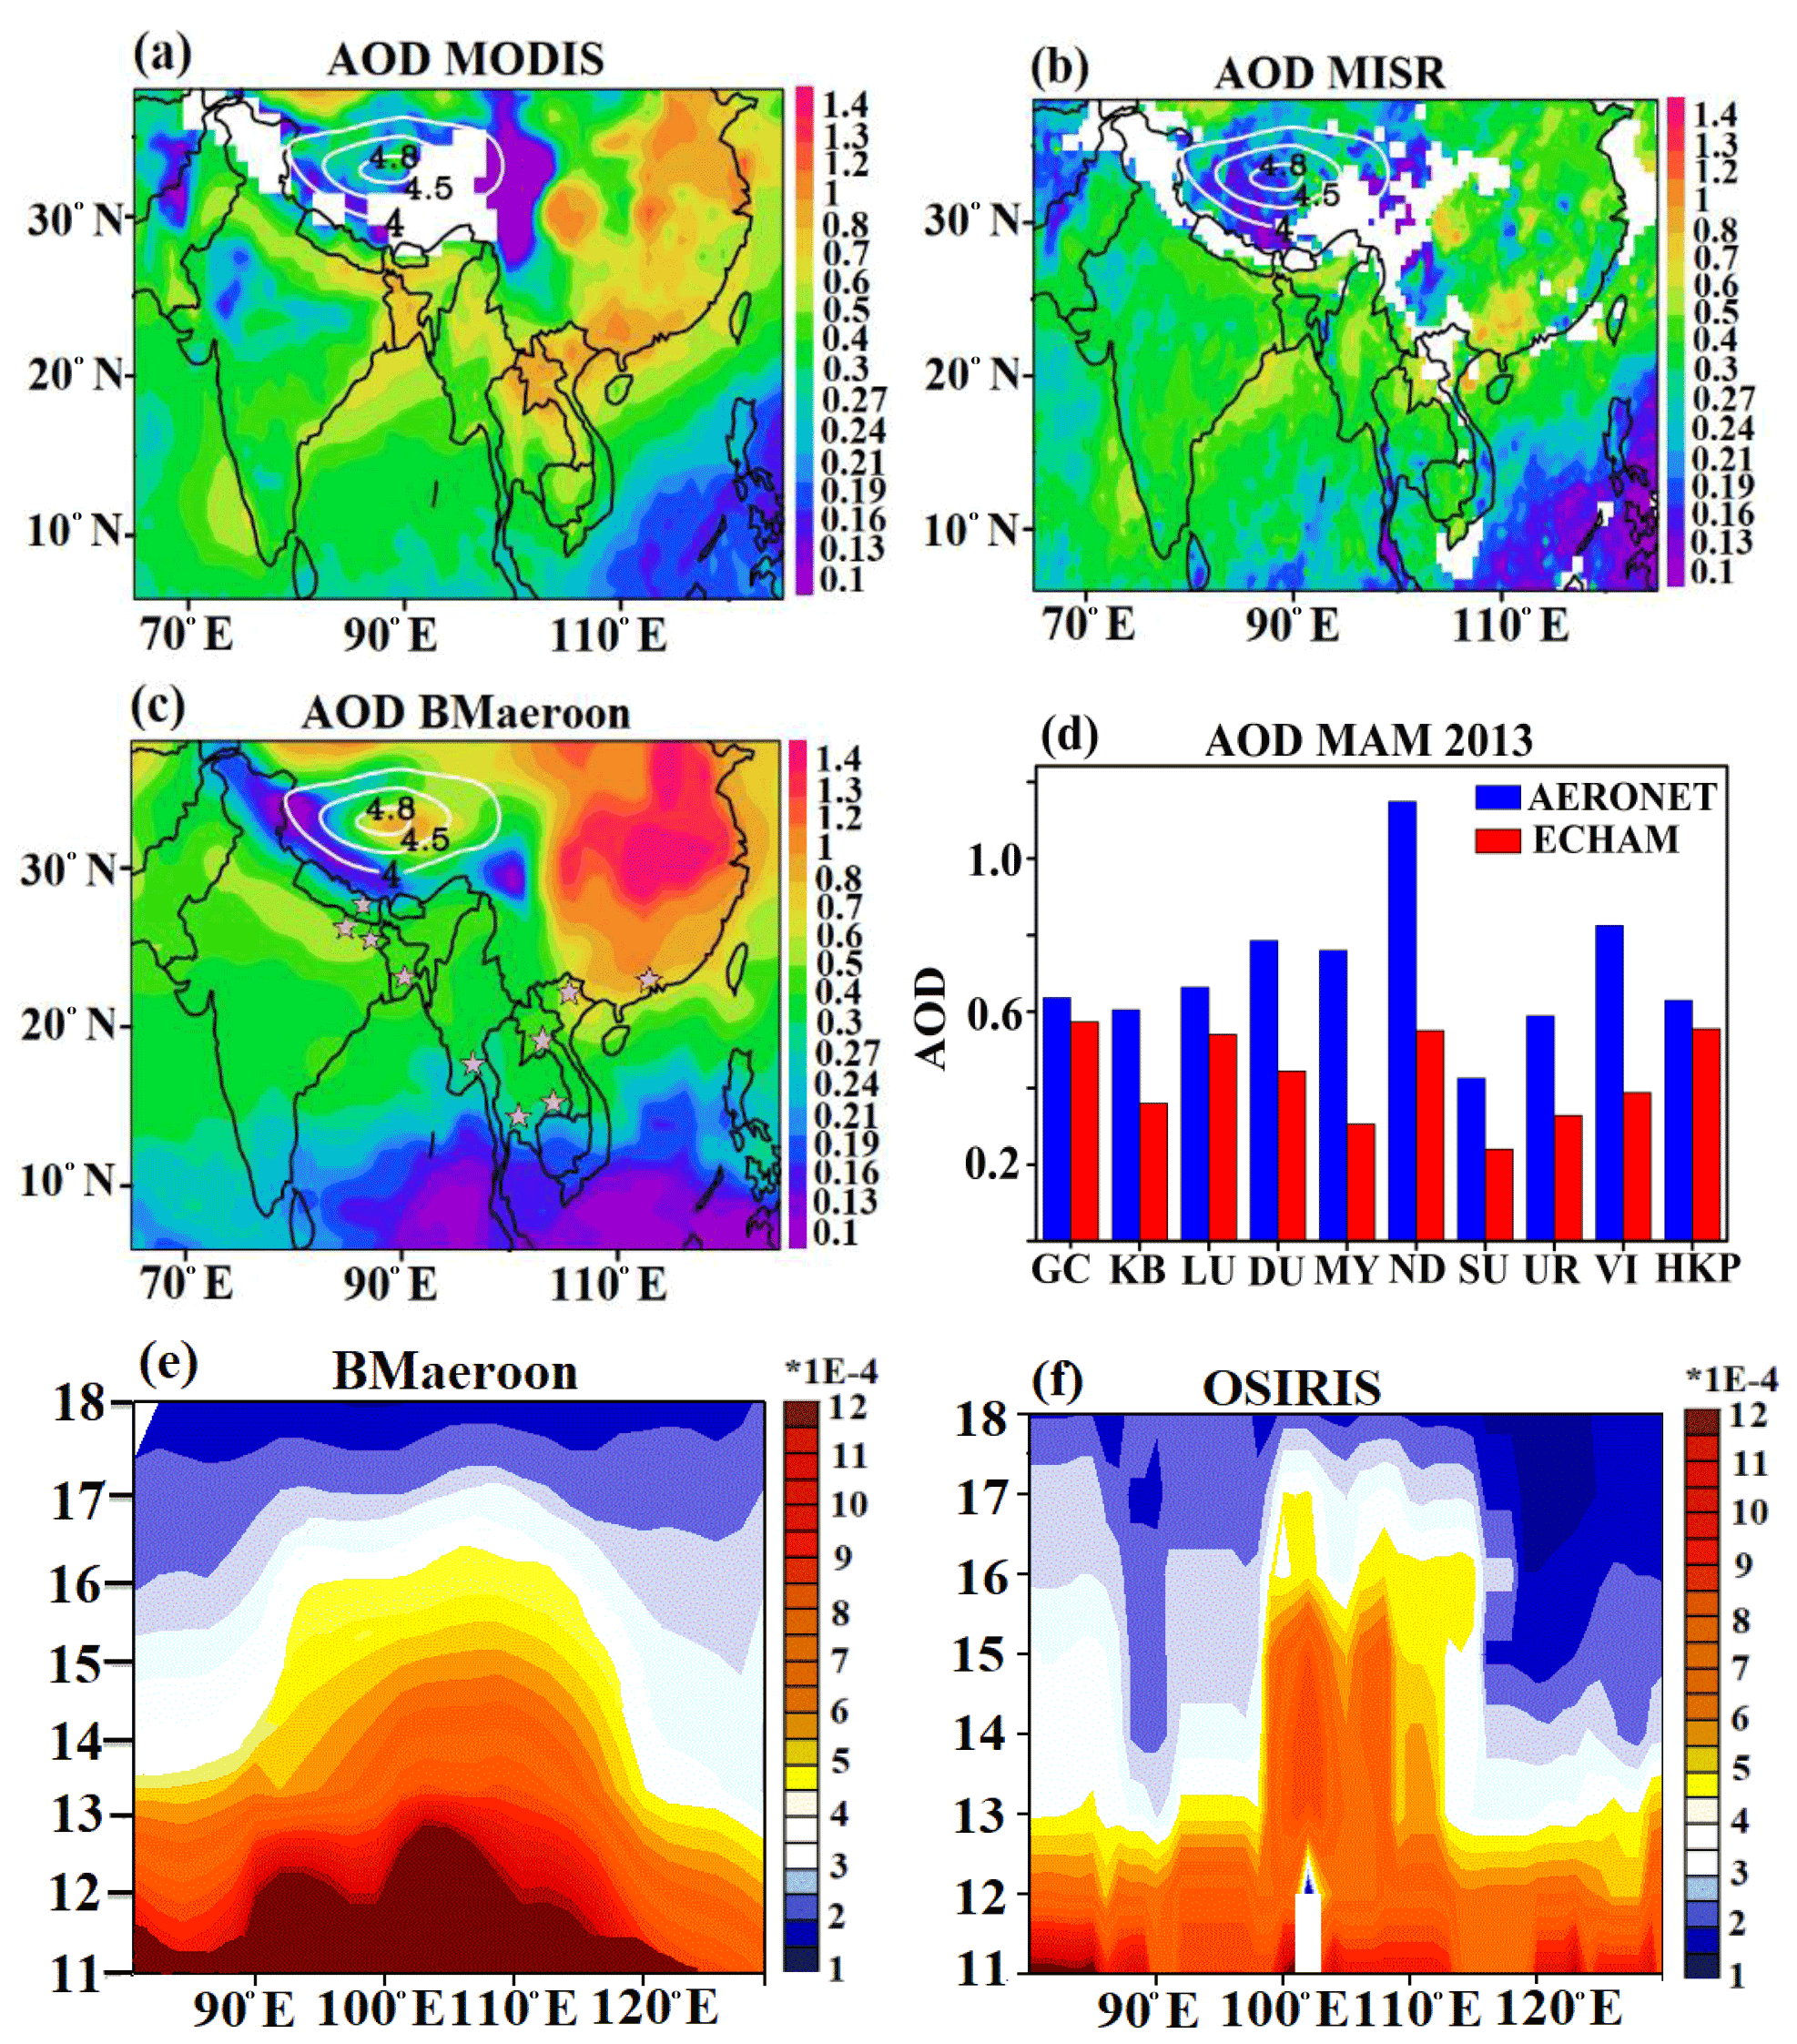
Figure 2(a) Aerosol optical depth (AOD) averaged for spring 2013 from MODIS, (b) same as (a) but from MISR, and (c) same as (a) but from ECHAM6–HAMMOZ BMaeroon simulation. White contours in (a)–(c) indicate the orography (km) of the Tibetan Plateau. (d) Comparison of simulated AOD (from BMaeroon) averaged for spring 2013 with AERONET observations at Gandhi College (GC; 25.81∘ N–85.12∘ E), Kathmandu Bode (BD; 27.68∘ N–85.39∘ E), Lumbini (LU; 27.49∘ N–83.28∘ E), Dhaka University (DU; 23.72∘ N–90.39∘ E), Myanmar (MY; 16.86∘ N–96.15∘ E), Nghia Do (ND; 21.04∘ N–105.80∘ E), Silpakorn University (SU; 13.81∘ N–100.04∘ E), Ubon Ratchathani (UR; 15.24∘ N–104.87∘ E), Vientiane (VI; 17.99∘ N–102.57∘ E), and Hong Kong Poly (HKP; 22.30∘ N–114.18∘ E). (e) Simulated (BMaeroon) aerosol extinction coefficient (865 nm) (km−1), averaged for 12–30∘ N and spring 2013. (f) Same as (e) but from OSIRIS measurements (750 nm).
Further, we compare simulated AOD with ground-based measurements at 10 AERONET stations during spring 2013 (Fig. 2d). Model results were sampled at each station at the same time. Comparison with AERONET observations also shows that the model underestimates AOD over all the stations. The simulated AOD (0.54) shows the highest underestimation at Nghia Do (21.04∘ N–105.80∘ E) in East Asia and the lowest underestimation at Gandhi college (25.81∘ N–85.12∘ E) in the Indo-Gangetic Plain, where the simulated 550 nm AOD is 0.57.
The differences in the magnitude of AOD between model, satellite remote sensing (MISR, MODIS), and ground-based AERONET observations may be caused by various factors; e.g., satellite remote sensing of AOD exhibits biases over certain surface types. The differences between MISR and MODIS may be due to differences in their calibration, algorithm assumptions, or the aerosol models in the lookup tables used in the retrieval algorithms (Abdou et al., 2005; Choi et al., 2019). There are uncertainties in the model emission inventories (Fadnavis et al., 2013, 2017a, 2019).
The vertical distributions of simulated aerosol extinction coefficient profiles (BMaeroon) averaged over the BB burning region (10–30∘ N) are compared with OSIRIS observations in spring 2013 (Fig. 2e–f). Our model could simulate vertical variations similar to those observed by OSIRIS. A plume rising from 90 to 120∘ E extending to 16 km is also evident in the OSIRIS data, although the model underestimates the aerosol extinction coefficient by 0.0002–0.0003 km−1. The sign of the difference is consistent with the slightly shorter wavelength of the OSIRIS extinction measurements. This underestimation may also be due to uncertainties in the model due to emission inventory and transport processes in the model. It should be noted that there may be biases in OSIRIS measurements due to assumptions made about the aerosol size distribution and chemical composition (Bourassa et al., 2012).
4.1 Impact of biomass burning on aerosol optical depth
Figure 3a shows the distribution of anomalies in simulated AOD (BMaeroon − BMaerooff). It shows enhanced AOD anomalies over the Indo-Gangetic Plain (∼ 0.22 to 0.8), the Tibetan Plateau, and the northeastern parts of East Asia (∼ 0.3 to 1.2). The distribution of anomalies in dust AOD shows high amounts over these regions. It indicates that dust enhancement over the Indo-Gangetic Plain (∼ 0.22 to 0.8), the Tibetan Plateau, and the northeastern parts of East Asia (0.8 to 1) (Fig. 3b) causes enhancement in AOD there. The simulated dust anomalies and circulation patterns also show transport of enhanced dust from western Asia to northern India and the Indo-Gangetic Plain region in the lower troposphere (Figs. 3b and S2a). Dust is also transported from the Tibetan Plateau–East Asia region to northern India in the mid/upper troposphere (Fig. S2b). The enhanced dust transport from western Asia and the Tibetan Plateau–East Asia region to South Asia is induced by atmospheric heating generated by biomass burning carbonaceous aerosols (discussed in Sect. 4.4). This atmospheric heating leads to enhanced dust emission over the respective desert regions. Dust being absorptive in nature contributes to a further increase in the atmospheric heating. The heating led to the formation of a low-pressure zone over eastern India in the lower troposphere (900 hPa) (Fig. 3b) and the Bay of Bengal and Myanmar in the mid-troposphere (500 hPa) (Figs. S2b and 7b). These circulation changes further enhanced the dust transport from western Asia and the Tibetan Plateau–East Asia region to South Asia.
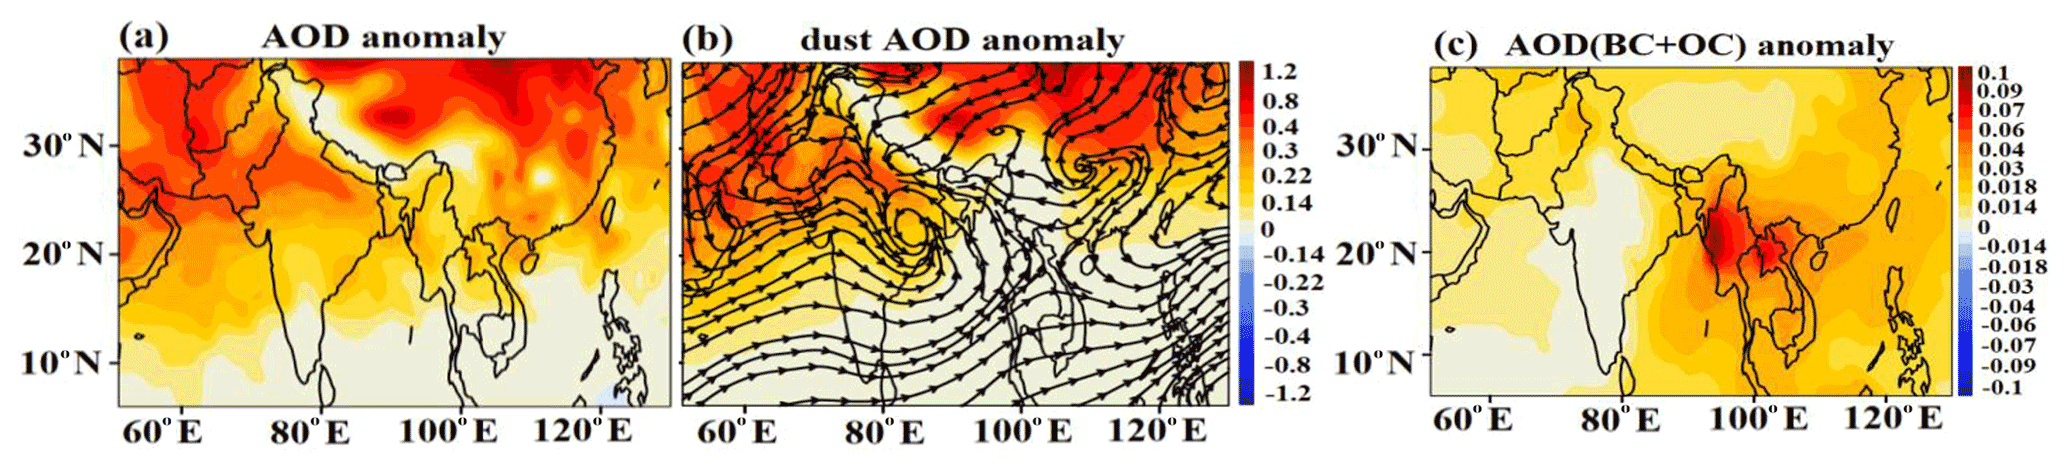
Figure 3Distribution of ECHAM6–HAMMOZ-simulated anomalies of (BMaeroon − BMaerooff) (a) AOD, (b) dust AOD, and (c) BC-AOD and OC-AOD, together, averaged for spring 2013. Streamlines in (b) indicate wind anomalies at 900 hPa (BMaeroon − BMaerooff).
Figure 3c shows the spatial distribution of the AOD for carbonaceous aerosols (BC + OC). The changes in concentration of total column carbonaceous aerosols are shown in Fig. S3a. Figures 3c and S3a show increases in aerosols over Indochina (AOD: +0.04–0.07, concentration: +40 %–80 %), the Indo-Gangetic Plain (AOD: +0.014–0.03, concentration: +10 %–50 %), and East Asia (AOD: +0.018–0.04, concentration: +20 %–60 %). It is evident that anomalies of carbonaceous aerosols AOD over the Indo-Gangetic Plain and East Asia are comparatively lower than over the Indochina region. In agreement with our results, Wang et al. (2015) also reported an abundant mixture of BC and OC particles due to BB over the Indochina region in spring 2014. Our model simulations show that the contribution of BB-emitted OC to AOD (Indochina 16 % to 35 %; East Asia: 4 % to 12 %; South Asia: 0.8 % to 4 %) is higher than that of BB-emitted BC (Indochina: 1.8 % to 6 %; East Asia: 0.8 % to 1.4 %; South Asia: 0.2 % to 0.8 %) (Fig. S3b–c). Figure 3c also shows high amounts of carbonaceous aerosols over the western Pacific, which may be due to transport from the Indochina region by westerly winds (discussed later in Sect. 4.3).
4.2 Impact of BB carbonaceous aerosol on radiative forcing
The carbonaceous aerosols emitted from biomass burning may significantly change radiative forcing by absorption and attenuation of solar and terrestrial radiation (Schill et al., 2020). The anomalies (averaged for spring) in net radiative forcing show negative radiative forcing at the surface and top of the atmosphere (TOA) over South Asia (surface: W m−2; TOA: W m−2), the Indochina region (surface: W m−2; TOA: W m−2), and East Asia (surface: W m−2; TOA: W m−2) (Fig. 4). The estimates of in-atmosphere radiative forcing show positive anomalies over South Asia (0.68±0.25 W m−2), the Indochina region (5.30±0.37 W m−2), and East Asia (3.73±0.20 W m−2), indicating an atmospheric warming. In agreement with our study, a number of studies showed a negative radiative impact at the TOA and surface but positive in-atmosphere radiative forcing due to BC and OC aerosols over the Indochina region. For example, Lin et al. (2014) reported a radiative forcing of −4.74 W m−2 at the TOA, −26.85 W m−2 at the surface, and thus +22.11 W m−2 in-atmosphere. Wang et al. (2007) estimated a radiative forcing of −1.4 to −1.9 W m−2 at the TOA and −4.5 to −6 W m−2 at the surface, yielding +2.6 W m−2 in-atmosphere during March 2001. Singh et al. (2020a) also reported a radiative forcing at the TOA of −1.91 and −42.76 W m−2 at the surface and 40.85 W m−2 in-atmosphere over Myanmar.
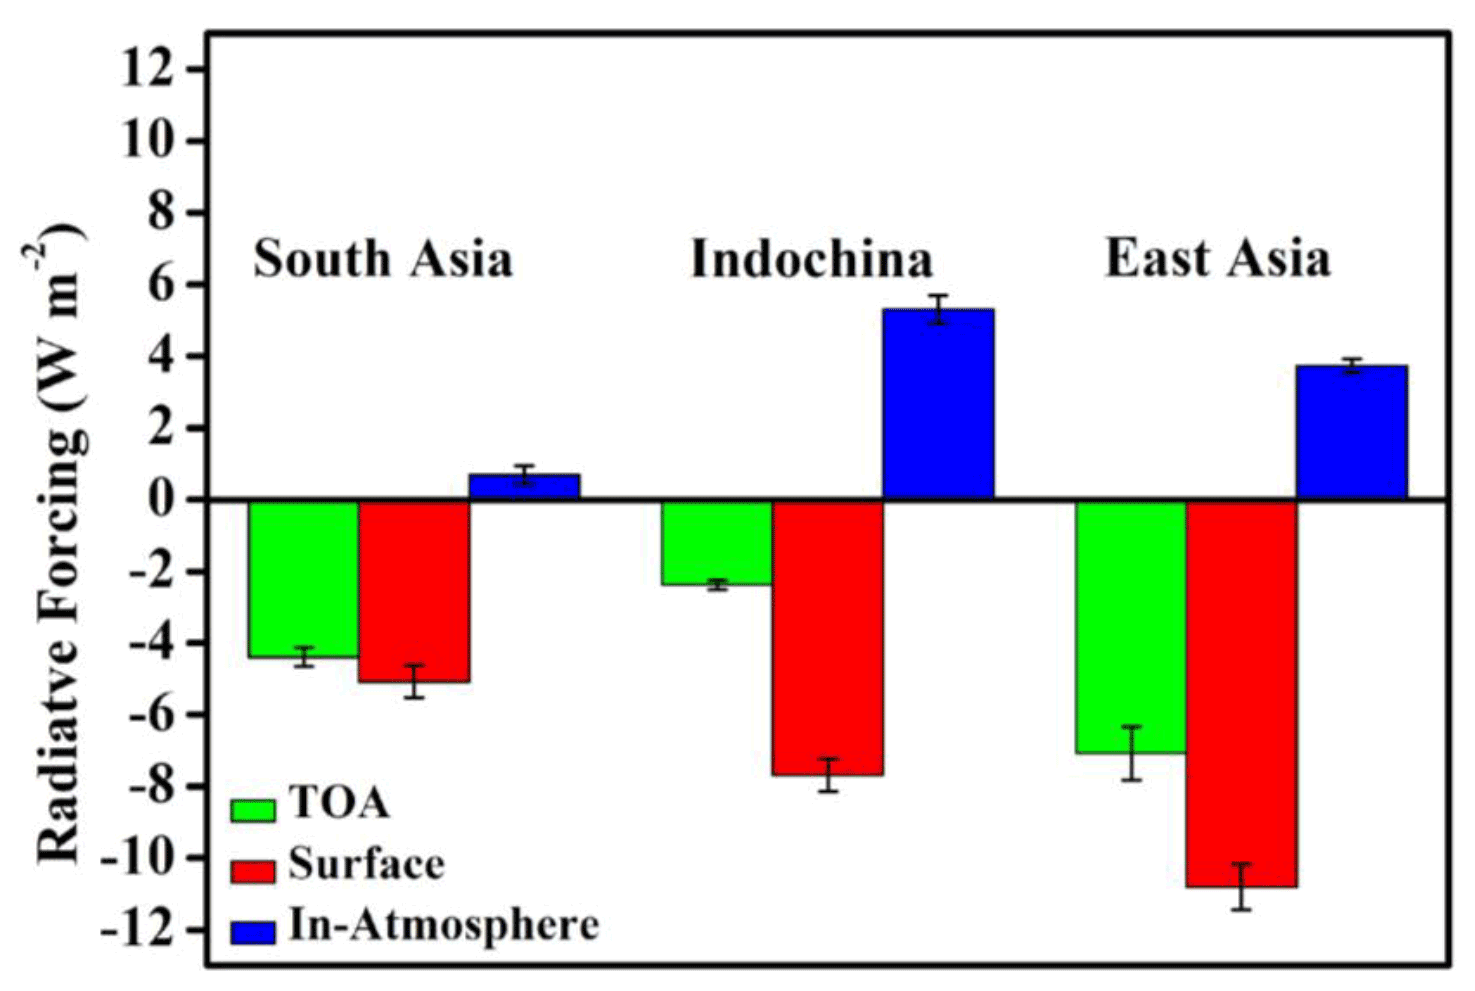
Figure 4Anomalies of radiative forcing (W m−2) from ECHAM6–HAMMOZ simulations (BMaeroon − BMaerooff) at the TOA, surface, and in-atmosphere (TOA–surface) averaged for spring 2013 and over South Asia, Indochina, and East Asia.
4.3 Transport of biomass burning aerosol into the upper troposphere and lower stratosphere
The stepwise evolution of the Asian summer monsoon begins in spring and contributes a significant amount of rainfall to the total annual precipitation over China (25 %–40 %) and over South Asia (∼ 11 %–20 %) due to deep convection over the Bay of Bengal, Tibetan Plateau, and South China Sea (Guhathakurta and Rajeevan, 2008; Li et al., 2016). The distribution of OLR from NCEP Reanalysis data during the spring season confirms that deep convection occurs over the maritime continent that extends to the South China Sea, Bay of Bengal, Malay Peninsula, and Indonesia (Fig. 5a). Our model simulation shows a distribution of OLR similar to the observations, although OLR is overestimated in the model (Fig. 5b). Figure 5c–d show the combined distribution of cloud droplet number concentration (CDNC), ice crystal number concentration (ICNC), and vectors of the resolved circulation, which exhibit a strong upwelling in equatorial Asia (10–20∘ N, 85–140∘ E; Fig. 5c–d). This upwelling associated with deep convection may transport pollutants from the boundary layer into the UTLS.
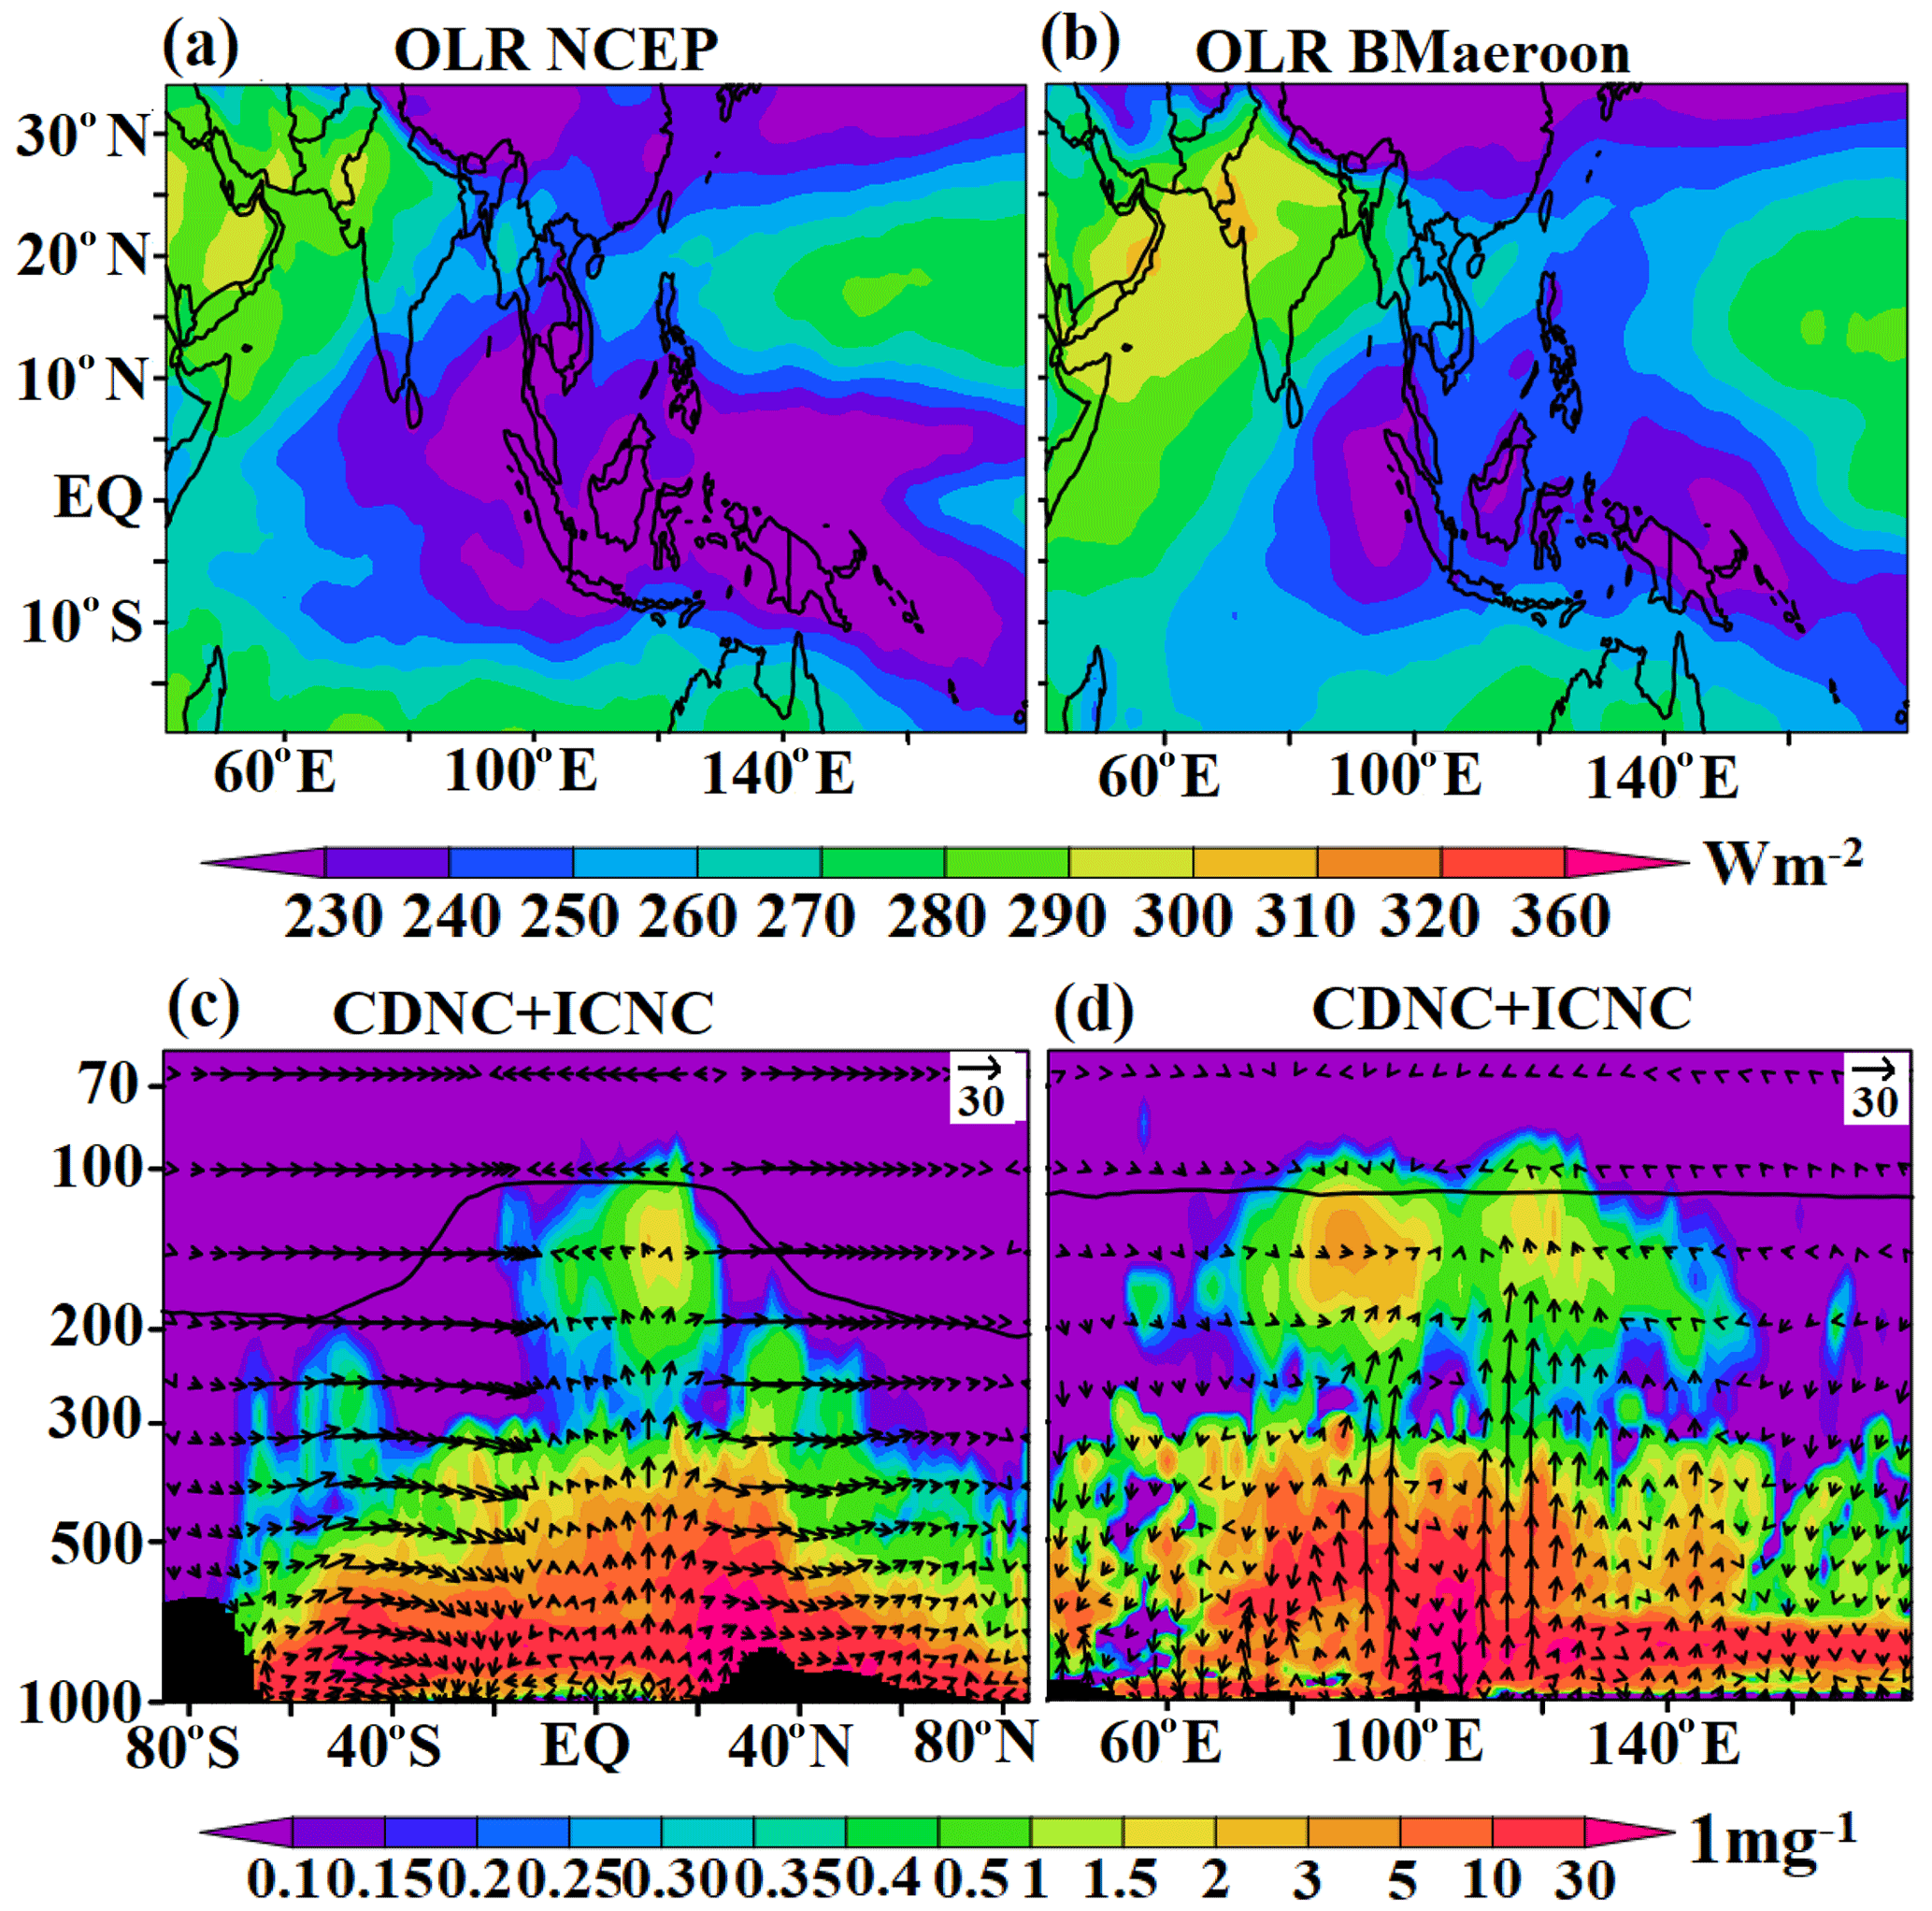
Figure 5(a) Distribution of outgoing longwave radiation (OLR) (W m−2) from NCEP Reanalysis-2 data averaged for spring 2013, (b) same as (a) but from the ECHAM6–HAMMOZ simulations (BMaeroon). Vertical distribution of cloud droplet number concentration (CDNC) and ice crystal number concentration (ICNC) (1 mg−1) averaged for spring 2013 from ECHAM6–HAMMOZ simulations (BMaeroon), and (c) latitude–pressure section (average for 85–140∘ E) and (d) longitude–pressure section (average for 10–20∘ N). Vectors of the circulation (BMaeroon) are shown in (c)–(d), with the vertical velocity field scaled by 300.
We analyzed the vertical distribution of simulated anomalies (BMaeroon − BMaerooff) of BB carbonaceous aerosols obtained over the high fire emission regions, i.e., Indochina, South Asia, and East Asia in spring 2013 (Fig. 1b). The simulated distribution of BC aerosols (Fig. 6a–b) and OC aerosols (Fig. 6c–d) over the Indochina region indicates an aerosol plume extending to the lowermost stratosphere. The ascent resolved in the wind vectors together with the distribution of cloud droplets and cloud ice indicates that the transport of these aerosols from the surface to the lowermost stratosphere occurs due to deep convection over the Malay Peninsula and Indonesia (Fig. 5a–b). There is an enhancement of BC aerosol concentration by 0.1–2 ng m−3 (Fig. 6a–b) and for OC by 0.2–5 ng m−3 (Fig. 6c–d) in the UTLS (300–90 hPa) over the Indochina region.

Figure 6Vertical cross section of anomalies of BC (ng m−3) (BMaeroon–Bmaerooff) averaged for the spring 2013 (a) latitude–pressure section (averaged for 91–107∘ E) and (b) longitude–pressure section (averaged for 18–24∘ N). (c–d) Same as (a)–(b) but for OC. (e) Same as (a) but averaged over 108–123∘ E and (f) same as (b) but averaged for 18–24∘ N. (g–h) Same as in (e)–(f) but for OC. The arrows in (a)–(h) indicate winds in m s−1, with the vertical velocity field scaled by 300. The black vertical bars show the topography, and the black line indicates the tropopause.
In the troposphere, biomass burning carbonaceous aerosols are transported to the Arctic (Fig. 6a and c). Some previous studies also show aerosol transport from South Asia and East Asia to the Arctic (Shindell et al., 2008; Fisher et al., 2011). The carbonaceous aerosols are also transported towards the western Pacific (Fig. 6b–d and f–h). In the Pacific (140∘ E–170∘ W), these aerosols are lifted to the UTLS. Transport of the aerosols from the Indochina region to the western Pacific has also been reported in the past (Dong and Fu, 2015).
Further, we show the distribution of BB carbonaceous aerosol over East Asia in Fig. 6e–h. It shows that the plume of BC and OC aerosol crosses the tropopause (BC: 0.2–6 ng m−3 and OC: 0.2 to 10 ng m−3). Figure 6e and g also show that the aerosol plume from the equatorial region is lifted to the UTLS associated with the Indonesian region (130–170∘ E). Similarly to the Indochina region, BC and OC aerosols also show poleward transport to the Arctic and horizontal transport towards the western Pacific (Fig. 6f and h). These aerosols are vertically transported in the western Pacific region (130–170∘ E). The distribution of anomalies of BC and OC near the tropopause (at 100 hPa) shows outflow of Asian carbonaceous aerosols in the UTLS over equatorial Asia and the western Pacific (5∘ S–20∘ N, 70–180∘ E) (Fig. S4).
BB in South Asia occurs in central India (70–90∘ E, 8–24∘ N) in spring (Fig. 1b and Singh et al., 2017). BC and OC emissions over South Asia during the spring season are reported in many studies (Talukdar et al., 2015; Guha et al., 2015). The vertical distribution of anomalies of BC and OC over South Asia shows that positive anomalies of BC and OC aerosols extend from the surface to the upper troposphere (300 hPa) (Fig. S5). CALIPSO-derived aerosol profiles in spring 2013 also show plumes reaching up to approximately 7 km (400 hPa) (Singh et al., 2020b). Unlike the Indochina region, BB carbonaceous aerosols over the Indo-Gangetic Plain do not reach the lowermost stratosphere during the spring season. Hence, hereafter we focus our discussion on the transport of BB carbonaceous aerosols and their impacts on the UTLS for Indochina and East Asia.
Further, we analyze the aerosol enhancement over the Arctic (65–85∘ N) due to the transport of Asian biomass burning BC and OC aerosols. The vertical distribution of anomalies of aerosol extinction shows an enhancement of 0–0.0093 km−1 in the Arctic (1000–100 hPa), with a peak at 400 hPa (Fig. 7a). Shindell et al. (2008) also showed seasonally varying transport of South Asian aerosols to the Arctic that maximizes in the spring season.
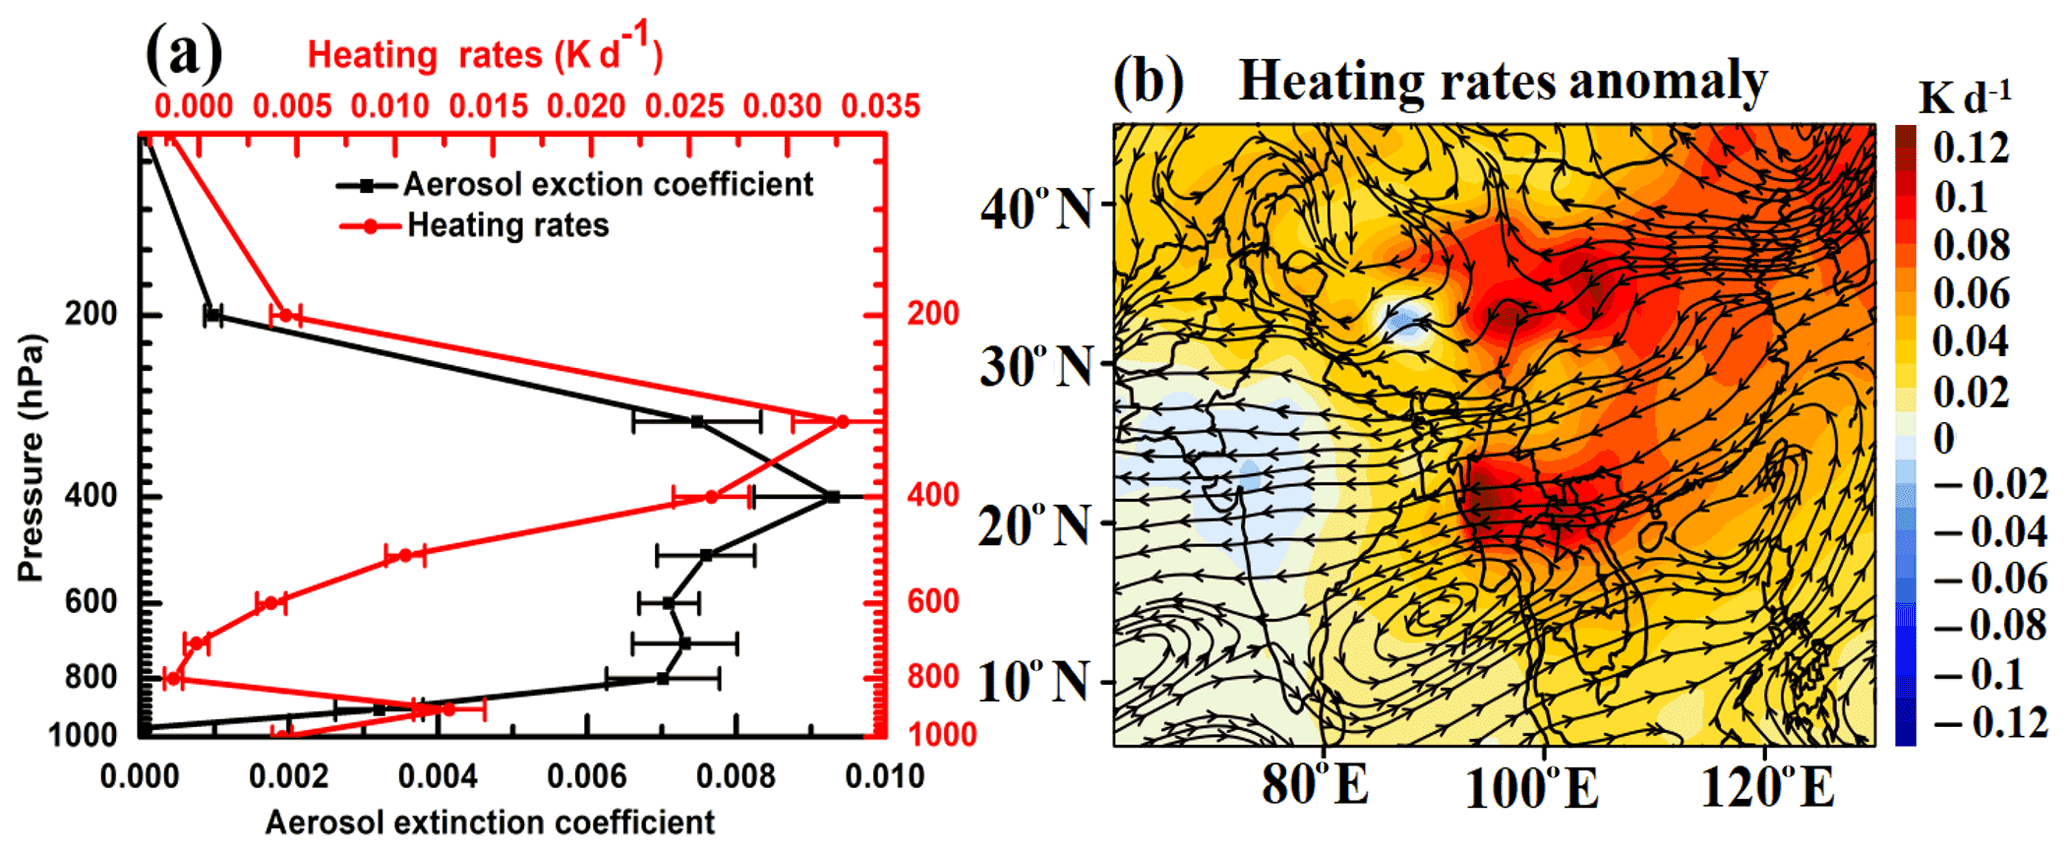
Figure 7(a) Vertical profile of anomalies of extinction (km−1) and heating rate (K d−1) over the Arctic region (65–85∘ N) from the ECHAM6–HAMMOZ simulations (BMaeroon − BMaerooff). The horizontal lines indicate the standard deviation within the 10 members of the different initial conditions; (b) spatial distribution of anomalies of heating rates (K d−1) (short and long waves together) averaged from the surface to the tropopause. Streamlines in Fig. 7b indicate wind anomalies at 500 hPa (BMaeroon − BMaerooff).
4.4 Impact of BB carbonaceous aerosol on heating rates
Carbonaceous aerosols in the atmosphere produce significant heating, leading to atmospheric warming (Fadnavis et al., 2017b). We obtained anomalies in heating rates (shortwave + longwave) due to carbonaceous aerosols (BMaeroon − BMaerooff). Figure 7b shows the spatial distribution of anomalies in tropospheric heating rates (averaged from surface to tropopause). It shows that carbonaceous aerosols have induced significant tropospheric heating over the location of dense fires: Indo-China/East Asia (0.02 to 0.12 K d−1). Significant heating is seen, namely, over the Mongolian desert (0.08–0.12 K d−1). The desert region of western Asia (Pakistan, Afghanistan, Turkistan, Kazakhstan) also shows slight heating (0.02–0.04 K d−1). The heating over the desert regions is associated with enhanced emission of dust, a positive feedback to atmospheric heating induced by the carbonaceous aerosols (Sect. 4.1). Heating is higher over the Mongolian desert than over western Asia due to the proximity of Mongolia to the location of dense fires.
Further, we show the vertical distribution of heating rates over the Indochina region and East Asia in Fig. 8a–d. It shows that enhanced BB carbonaceous aerosols have induced enhanced heating of the atmospheric column along the pathway through which they are transported (Fig. 6a–h). The carbonaceous aerosol emissions over the Indochina region and East Asia produced anomalous heating of ∼ 0.1 to 0.04 K d−1 in the lower troposphere (1000 to 400 hPa) and ∼ 0.008 to 0.001 K d−1 near the tropopause (200 to 80 hPa). Figure 6a, c, e, g show that descending winds transport BC and OC aerosols from above the tropopause downward and southward to 20∘ S. The positive anomalies in heating rates of ∼ 0.001 to 0.004 K d−1 in the upper troposphere at ∼ 200 hPa near 20∘ S may be due to heating by these aerosols. There may be dynamic changes in response to BB carbonaceous aerosol emission. The transported Asian carbonaceous aerosols and associated dynamical changes in the Arctic enhanced heating rates by 0–0.032 K d−1 between 1000 and 100 hPa (Fig. 7a). Also, transport of carbonaceous aerosol to the western Pacific (Fig. 6b, d, f, h) by the westerly winds has increased heating by 0.008 to 0.04 K d−1 and peaks at 250 hPa (0.04 K d−1) over the central Pacific (170–110∘ W).
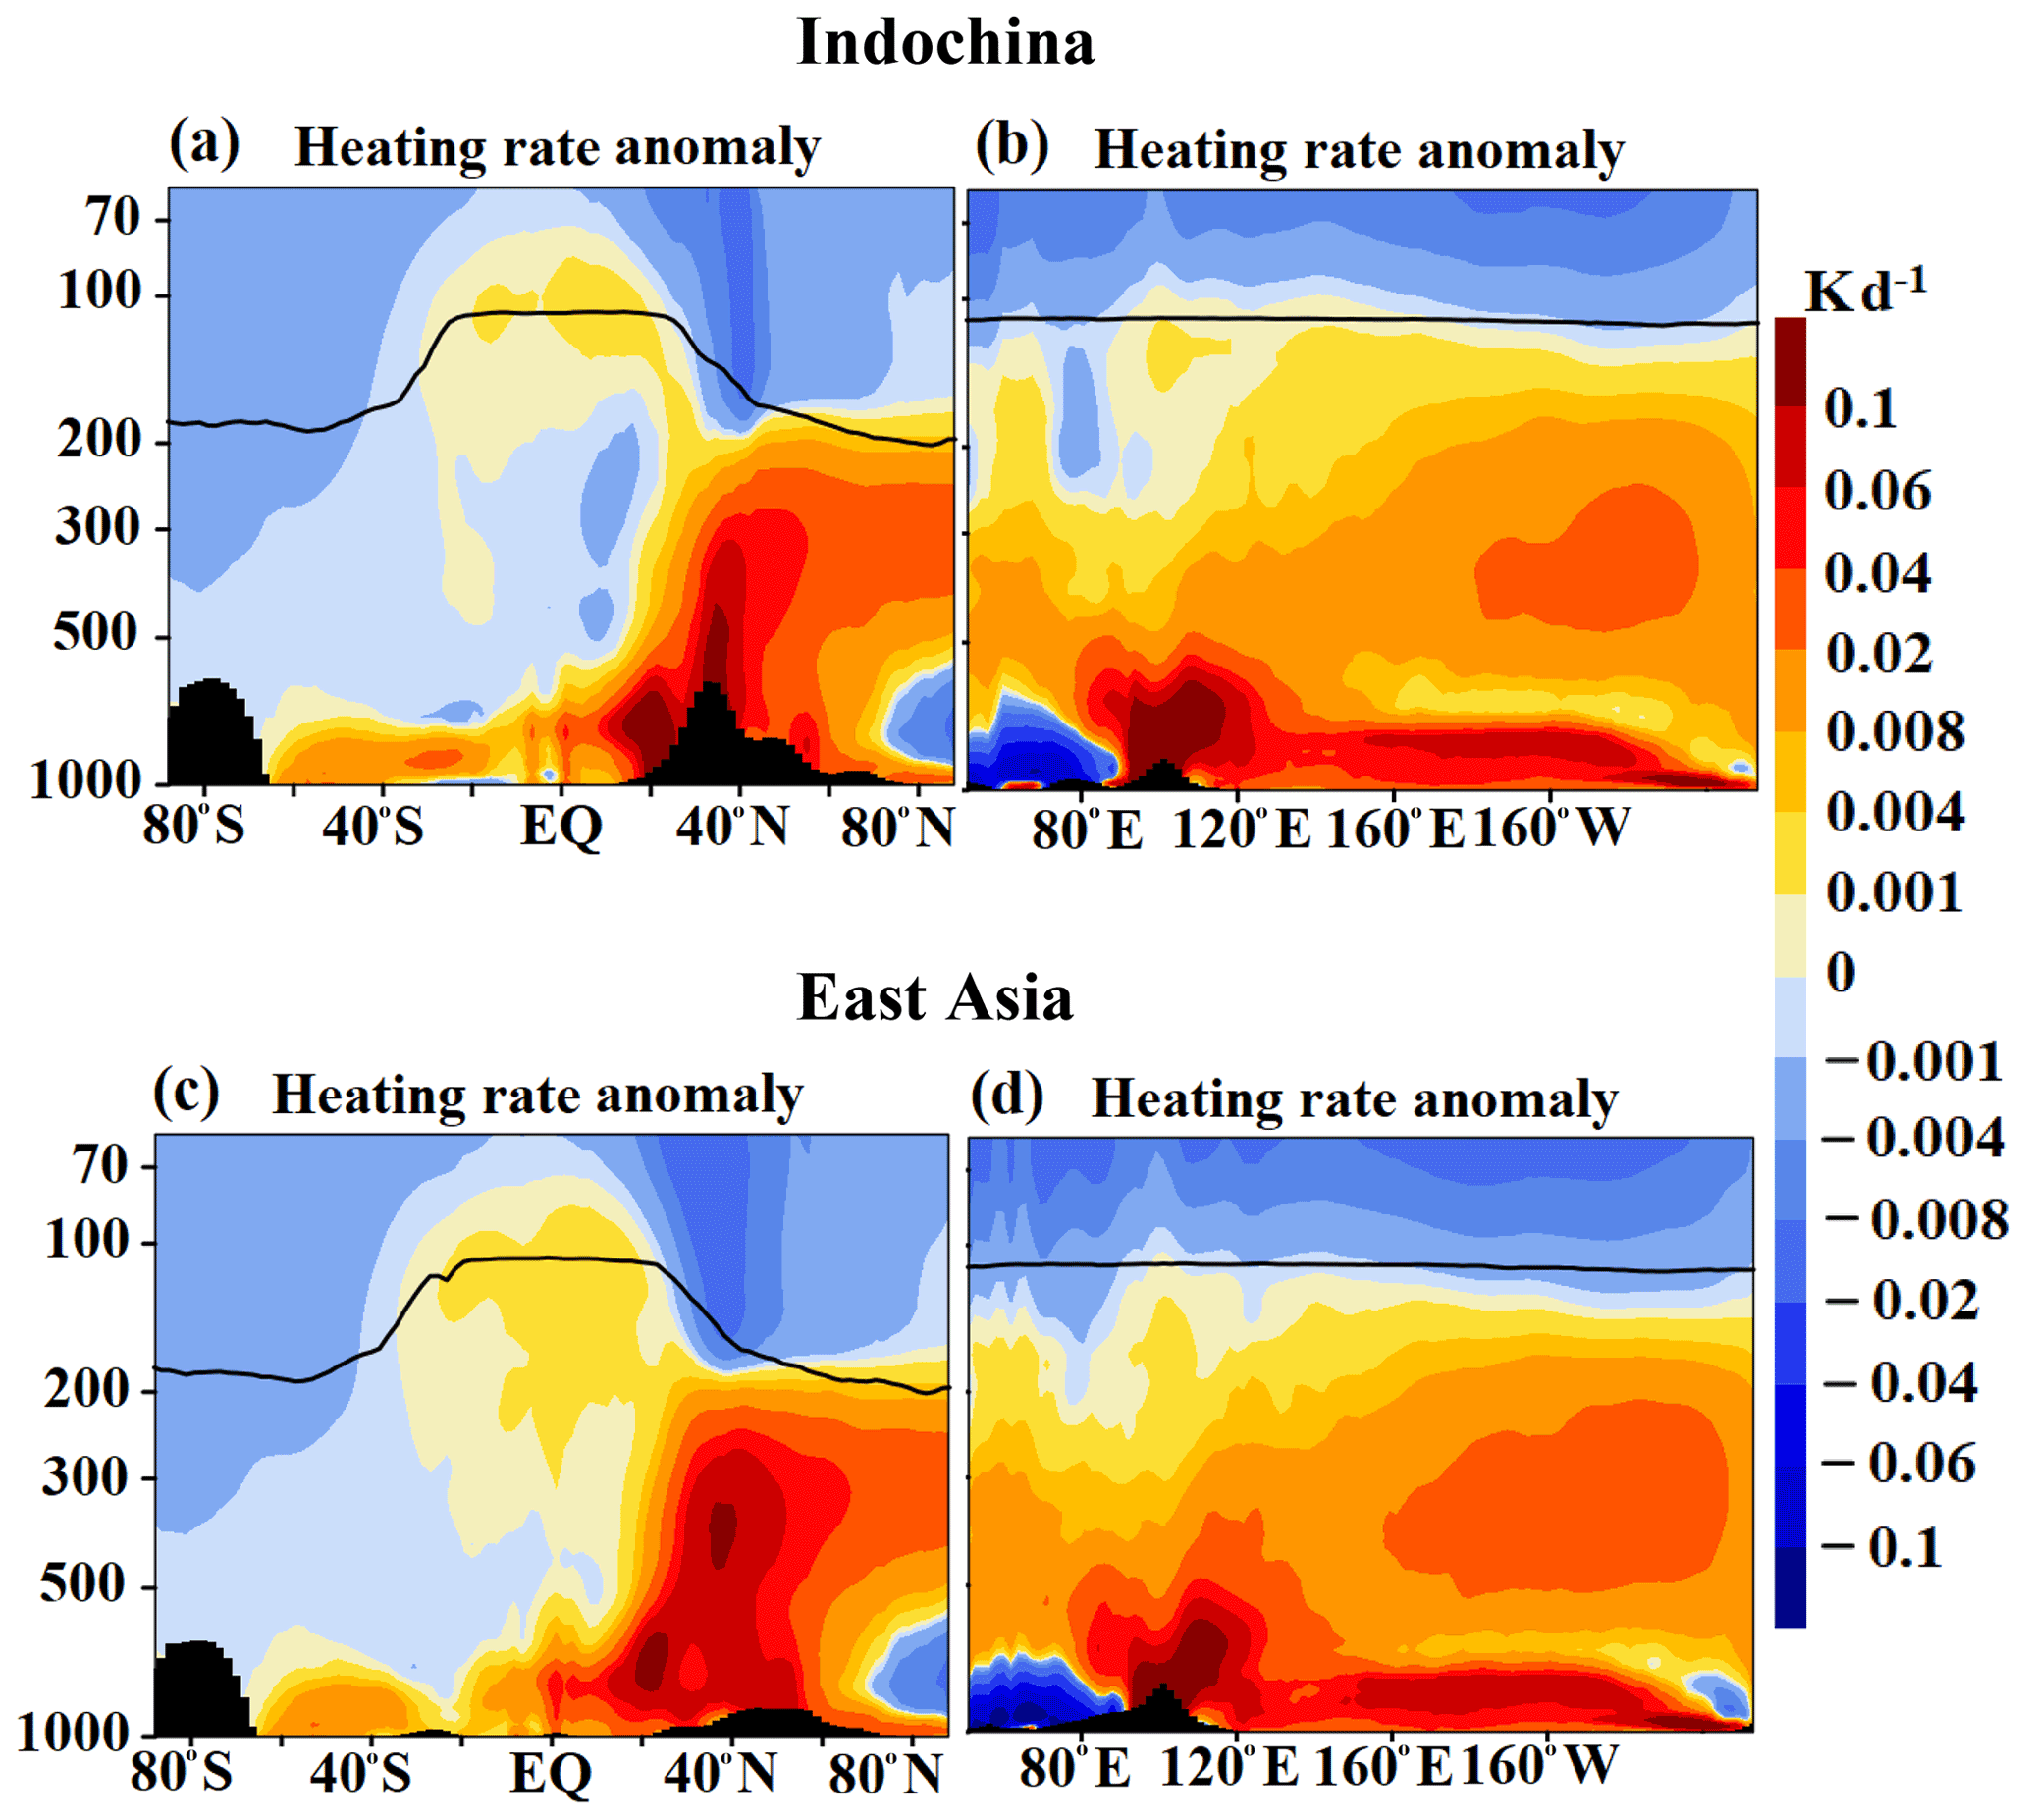
Figure 8Vertical section of heating rate anomalies (K d−1) for the spring season 2013 from ECHAM6–HAMMOZ simulations (BMaeroon − BMaerooff); (a) latitude–pressure section averaged for 91–107∘ E and (b) longitude–pressure section averaged for 18–24∘ N. (c) Same as (a) but averaged for 108–123∘ E. (d) Same as (b) but averaged for 22–27∘ N. The black vertical bars show the topography and the black line indicates the tropopause.
Figure 8a–d show positive anomalies in heating rates at the tropopause. Heating in the upper troposphere enhances the vertical motion that may enhance the transport into the lower stratosphere (Gettelman et al., 2004). Carbonaceous aerosols cross the tropopause (0.1 to 5 ng m−3) and enter the lowermost stratosphere (18–24∘ N) (Fig. 6a–h). The cross-tropopause transport is reinforced by enhanced vertical motion (Fig. S6a–b) produced by the heating generated by the carbonaceous aerosols.
4.5 Impact of BB carbonaceous aerosol on water vapor
The heating produced by the biomass burning carbonaceous aerosols may affect the distribution of water vapor in the troposphere and stratosphere. Figure 9a–b show anomalies in water vapor (BMaeroon − BMaerooff) over Indochina and East Asia. An interesting feature seen in Fig. 9a–b is the enhanced transport of water vapor (an anomaly of 0.02–0.5 ppmv) to the South Pole through the lower stratosphere from Indochina (91–107∘ E, 10–27∘ N) and East Asia (108–123∘ E, 20–35∘ N). The tropospheric heating might have caused elevated water vapor injection into the lower stratosphere. The water vapor in the lower stratosphere is further transported to the South Pole by the lower branch of the Brewer–Dobson circulation. The water vapor reaches the Antarctic within a month, indicating fast transport.
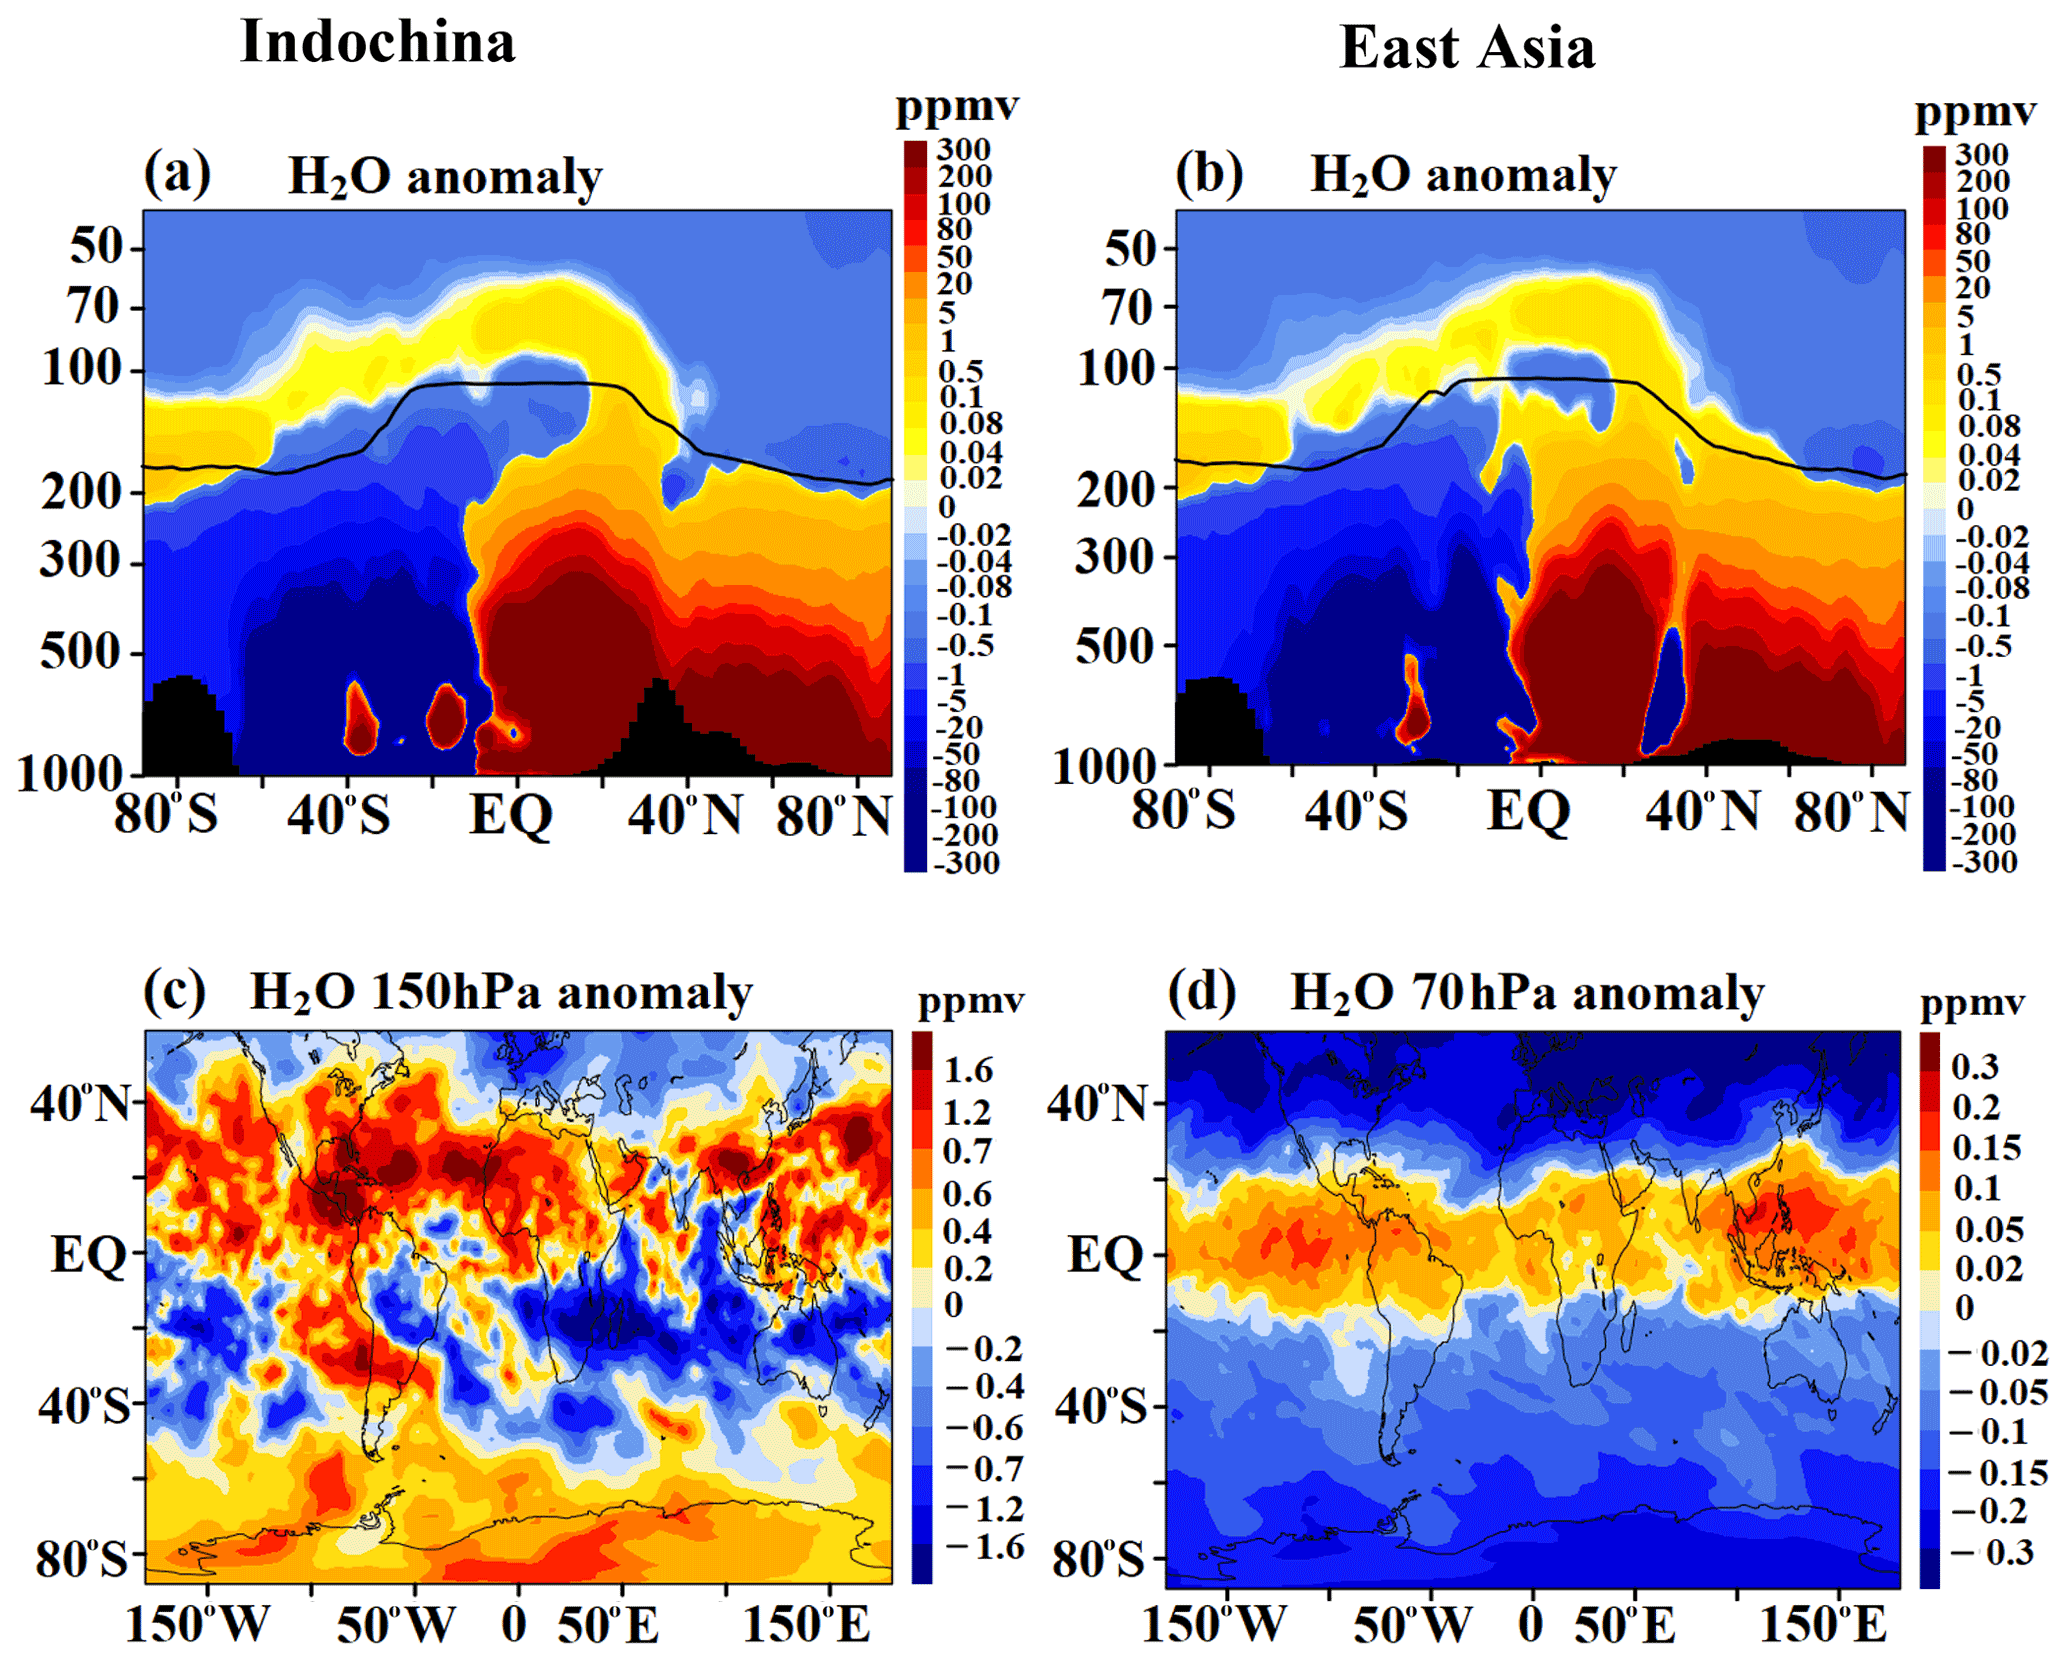
Figure 9Vertical and horizontal distributions of anomalies of water vapor (ppmv) for spring 2013 from the ECHAM6–HAMMOZ simulations (BMaeroon − BMaerooff); (a) latitude–pressure cross section averaged for 91–107∘ E and (b) longitude–pressure cross section averaged over 108–123∘ E, at (c) the 150 hPa level and (d) the 70 hPa level. In (a)–(b) the black vertical bars show the topography, and the black line indicates the tropopause.
The model simulations show noticeable enhancement of water vapor (0.4 to 1.6 ppmv) in the northern tropics near the tropopause (150 hPa) and by 0.2–0.7 ppmv in the Arctic lower stratosphere (150 hPa) (Fig. 9c). In the tropical lower stratosphere, it is increased by 0.02–0.3 ppmv (Fig. 9d). Water vapor, being a greenhouse gas, amplifies global warming, leading to positive feedback (e.g., Riese et al., 2012; Sherwood et al., 2018; Fadnavis et al., 2021b). The strong negative anomalies of OLR (Fig. S6c) induced by carbonaceous aerosols also indicate the positive feedback. Fadnavis et al. (2013) also reported an increase in water vapor in the UTLS in response to the enhancement of aerosols. Stratospheric water vapor plays a significant role in climate change (e.g., Oman et al., 2008; Wang and Dessler, 2020; Xie et al., 2020).
A 10-member ensemble of ECHAM6.3–HAM2.3 simulations for the spring season 2013, a neutral year, is analyzed to study the transport of carbonaceous aerosol injected by Asian biomass burning into the UTLS and its associated impacts on radiative forcing, heating rates, and water vapor. To validate the model simulations, we compare simulations with observations from (1) MODIS, (2) MISR, (3) AERONET, and (4) OSIRIS during spring 2013. The observational analysis shows reasonable agreement with the model simulations.
The BB emission increases the aerosol burden (AOD) over the Indochina region by 0.14 to 0.22 (carbonaceous aerosol concentration increase of +40 %–80 %), India by 0.22 to 0.38 (concentration of carbonaceous aerosol: +10 %–50 %), and East Asia by 0.18 to 0.26 (concentration of carbonaceous aerosol: +20 %–60 %). Our analysis shows that deep convection, which occurs over the Malay Peninsula and Indonesia, transports carbonaceous aerosols from the boundary layer of the Indochina and East Asia region into the lowermost stratosphere (BC: 0.1 to 6 ng m−3 for BC, OC: 0.2 to 10 ng m−3). In the UTLS, outflow occurs over equatorial Asia and the western Pacific (10∘ S–20∘ N, 70–180∘ E). Carbonaceous aerosols originating from Asian biomass burning are also transported to the Arctic. The maximum enhancement in aerosol extinction (by 0.0093 km−1) is seen at 400 hPa over the Arctic.
The enhanced carbonaceous BC and OC aerosol emitted from BB produces a negative net radiative forcing at the surface (India: W m−2, Indochina: W m−2, and East Asia: W m−2), at the TOA (India: W m−2, Indochina: W m−2, and East Asia: W m−2), and positive net radiative forcing in the atmosphere (India: 0.68±0.25 W m−2, Indochina: 5.30±0.37 W m−2, and East Asia: 3.73±0.20 W m−2), indicating atmospheric warming but a cooling of the climate at the surface.
The changes in BB carbonaceous aerosol induce a warming in the troposphere (0.008–0.1 K d−1) and in the UTLS (∼ 0.001 to 0.008 K d−1) over Asia. The aerosols transported to the Arctic enhance heating by 0–0.032 K d−1, peaking at 300 hPa. The outflow of the aerosols in the UTLS over the western Pacific by the westerly winds has increased heating by 0.008 to 0.04 K d−1. The atmospheric heating induced by Asian BB carbonaceous aerosols led to the transport of water vapor into the lower stratosphere (0.02–0.3 ppmv) over the tropics. In the lower stratosphere, water vapor is transported to the South Pole by the lower branch of the Brewer–Dobson circulation. Water vapor, being a greenhouse gas, amplifies atmospheric heating, leading to positive feedback (e.g., Riese et al., 2012; Sherwood et al., 2018). Our model simulations also show a positive feedback of dust aerosol on atmospheric heating induced by the enhancement of carbonaceous aerosols.
Furthermore, our analysis shows that Asian biomass burning carbonaceous aerosols lead to moistening of the troposphere in the Northern Hemisphere and lowermost stratosphere in the northern tropics and Southern Hemisphere. An increase in stratospheric water vapor is important, as it has an impact on stratospheric temperatures and thus indirectly on stratospheric dynamics (Maycock et al., 2013). The moistening of the stratosphere produces a positive feedback on the climate (Banerjee et al., 2019; Dessler et al., 2013).
The fire data observed by the Moderate Resolution Imaging Spectrodiometer (MODIS) can be downloaded from https://firms.modaps.eosdis.nasa.gov/download (NASA, 2021a). The AOD data observed by MODIS Terra can be downloaded from https://ladsweb.modaps.eosdis.nasa.gov/archive/allData/61/MODATML2/ (NASA, 2021b). The AOD data observed by the Multi-angle Imaging SpectroRadiometer (MISR) can be downloaded from https://misr.jpl.nasa.gov/getData/accessData/ (NASA, 2021c). The AOD data observed by the Aerosol Robotic NETwork (AERONET) can be downloaded from https://aeronet.gsfc.nasa.gov/ (NASA, 2021d). The National Centers for Environmental Prediction (NCEP) reanalysis-2 outgoing longwave radiation (OLR) can be downloaded from https://psl.noaa.gov/data/gridded/data.ncep.reanalysis2.pressure.html (NOAA/OAR/ESRL PSL, 2021). The Optical Spectrograph and InfraRed Imaging System (OSIRIS) aerosol extinction coefficient can be downloaded from https://research-groups.usask.ca/osiris/data-products.php#Download (University of Saskatchewan, 2021).
The supplement related to this article is available online at: https://doi.org/10.5194/acp-21-14371-2021-supplement.
SF initiated the idea. PC and TC performed model analysis. RM, SG, and CES contributed analysis and study design. CES and SG analyzed OSIRIS data. All the authors contributed to the writing and discussions of the manuscript.
Some authors are members of the editorial board of Atmospheric Chemistry and Physics. The peer-review process was guided by an independent editor, and the authors have also no other competing interests to declare.
Publisher’s note: Copernicus Publications remains neutral with regard to jurisdictional claims in published maps and institutional affiliations.
The authors thank the staff of the High Power Computing Centre (HPC) in IITM, Pune, India, for providing computer resources and the team members of MODIS, MISR, and AERONET for providing data. The authors are thankful to two anonymous reviewers for their valuable suggestions.
This paper was edited by Farahnaz Khosrawi and reviewed by two anonymous referees.
Abdou, W. A., Diner, D. J., Martonchik, J. V., Bruegge, C. J., Kahn, R. A., Gaitley, B. J., Crean, K. A., Remer, L. A., and Holben, B.: Comparison of coincident Multiangle Imaging Spectroradiometer and Moderate Resolution Imaging Spectroradiometer aerosol optical depths over land and ocean scenes containing Aerosol Robotic Network sites, J. Geophys. Res., 110, D10S07, https://doi.org/10.1029/2004JD004693, 2005.
Andreae, M. O.: Emission of trace gases and aerosols from biomass burning – an updated assessment, Atmos. Chem. Phys., 19, 8523–8546, https://doi.org/10.5194/acp-19-8523-2019, 2019.
Banerjee A., Chiodo, G., Previdi, M., Ponater, M., Conley, A. J., and Polvani, L. M.: Stratospheric water vapor: an important climate feedback, Clim. Dynam., 53, 1697–1710, https://doi.org/10.1007/s00382-019-04721-4, 2019.
Bhardwaj, P., Naja, M., Kumar, R., and Chandola, H. C.: Seasonal, interannual, and long-term variabilities in biomass burning activity over South Asia, Environ. Sci. Pollut. R., 23, 4397–4410, https://doi.org/10.1007/s11356-015-5629-6, 2016.
Bond, T. C., Doherty, S. J., Fahey, D. W., Forster, P. M., Berntsen, T., Deangelo, B. J., Flanner, M. G., Ghan, S., Kärcher, B., Koch, D., Kinne, S., Kondo, Y., Quinn, P. K., Sarofim, M. C., Schultz, M. G., Schulz, M., Venkataraman, C., Zhang, H., Zhang, S., Bellouin, N., Guttikunda, S. K., Hopke, P. K., Jacobson, M. Z., Kaiser, J. W., Klimont, Z., Lohmann, U., Schwarz, J. P., Shindell, D., Storelvmo, T., Warren, S. G., and Zender, C. S.: Bounding the role of black carbon in the climate system: A scientific assessment, J. Geophys. Res.-Atmos., 118, 5380–5552, https://doi.org/10.1002/jgrd.50171, 2013.
Bourassa, A. E., Rieger, L. A., Lloyd, N. D., and Degenstein, D. A.: Odin-OSIRIS stratospheric aerosol data product and SAGE III intercomparison, Atmos. Chem. Phys., 12, 605–614, https://doi.org/10.5194/acp-12-605-2012, 2012.
Brunamonti, S., Jorge, T., Oelsner, P., Hanumanthu, S., Singh, B. B., Kumar, K. R., Sonbawne, S., Meier, S., Singh, D., Wienhold, F. G., Luo, B. P., Boettcher, M., Poltera, Y., Jauhiainen, H., Kayastha, R., Karmacharya, J., Dirksen, R., Naja, M., Rex, M., Fadnavis, S., and Peter, T.: Balloon-borne measurements of temperature, water vapor, ozone and aerosol backscatter on the southern slopes of the Himalayas during StratoClim 2016–2017, Atmos. Chem. Phys., 18, 15937–15957, https://doi.org/10.5194/acp-18-15937-2018, 2018.
Chang, C. P., Zhuo, W., John, M., and Ching-Hwang, L.: Annual Cycle of Southeast Asia – Maritime Continent Rainfall and the Asymmetric Monsoon Transition, J. Climate, 18, 287–301, https://doi.org/10.1175/JCLI-3257.1, 2005.
Chen, J. C., Li, Z., Ristovski, A., Milic, Y., Gu, M., S., Islam, S., Wang, J., Hao, H., Zhang, C., He, H., Guo, H., Fu, B., Miljevic, L., Morawska, P., Thai, Y., Fat LAM, G., Pereira, A., Ding, X., Huang, and Dumka, U. C.: A review of biomass burning: Emissions and impacts on air quality, health and climate in China, Sci. Total Environ., 579, 1000–1034, 2017.
Cheng, Y. F., Berghof, M., Garland, R. M., Wiedensohler, A., Wehner, B., Müller, T., Su, H., Zhang, Y. H., Achtert, P., Nowak, A., Pöschl, U., Zhu, T., Hu, M., and Zeng, L. M.: Influence of soot mixing state on aerosol light absorption and single scattering albedo during air mass aging at a polluted regional site in northeastern China, J. Geophys. Res.-Atmos., 114, D00G10, https://doi.org/10.1029/2008JD010883, 2009.
Choi, M., Lim, H., Kim, J., Lee, S., Eck, T. F., Holben, B. N., Garay, M. J., Hyer, E. J., Saide, P. E., and Liu, H.: Validation, comparison, and integration of GOCI, AHI, MODIS, MISR, and VIIRS aerosol optical depth over East Asia during the 2016 KORUS-AQ campaign, Atmos. Meas. Tech., 12, 4619–4641, https://doi.org/10.5194/amt-12-4619-2019, 2019.
Dentener, F., Kinne, S., Bond, T., Boucher, O., Cofala, J., Generoso, S., Ginoux, P., Gong, S., Hoelzemann, J. J., Ito, A., Marelli, L., Penner, J. E., Putaud, J.-P., Textor, C., Schulz, M., van der Werf, G. R., and Wilson, J.: Emissions of primary aerosol and precursor gases in the years 2000 and 1750 prescribed data-sets for AeroCom, Atmos. Chem. Phys., 6, 4321–4344, https://doi.org/10.5194/acp-6-4321-2006, 2006.
Dessler, A. E., Schoeberl, M. R., Wang, T., Davis, S. M., and Rosenlof, K. H.: Stratospheric Water Vapor Feedback, P. Natl. Acad. Sci. USA, 110, 18087–18091, https://doi.org/10.1073/pnas.1310344110, 2013.
Dong, X. and Fu, J. S.: Understanding interannual variations of biomass burning from Peninsular Southeast Asia, part II: Variability and different influencesin lower and higher atmosphere levels, Atmos. Environ., 115, 9–18, https://doi.org/10.1016/j.atmosenv.2015.05.052, 2015.
Fadnavis, S., Semeniuk, K., Pozzoli, L., Schultz, M. G., Ghude, S. D., Das, S., and Kakatkar, R.: Transport of aerosols into the UTLS and their impact on the Asian monsoon region as seen in a global model simulation, Atmos. Chem. Phys., 13, 8771–8786, https://doi.org/10.5194/acp-13-8771-2013, 2013.
Fadnavis, S., Kalita, G., Kumar, K. R., Gasparini, B., and Li, J.-L. F.: Potential impact of carbonaceous aerosol on the upper troposphere and lower stratosphere (UTLS) and precipitation during Asian summer monsoon in a global model simulation, Atmos. Chem. Phys., 17, 11637–11654, https://doi.org/10.5194/acp-17-11637-2017, 2017a.
Fadnavis, S., Roy, C., Sabin, T. P., Ayantika, D. C., and Karumuri, A.: Potential modulations of pre-monsoon aerosols during El Niño: impact on Indian summer monsoon, Clim. Dynam., 49, 2279–2290, https://doi.org/10.1007/s00382-016-3451-6, 2017b.
Fadnavis, S., Müller, R., Kalita, G., Rowlinson, M., Rap, A., Li, J.-L. F., Gasparini, B., and Laakso, A.: The impact of recent changes in Asian anthropogenic emissions of SO2 on sulfate loading in the upper troposphere and lower stratosphere and the associated radiative changes, Atmos. Chem. Phys., 19, 9989–10008, https://doi.org/10.5194/acp-19-9989-2019, 2019.
Fadnavis, S., Sabin, T. P., Rap, A., Müller, R., Kubin, A., and Heinold, B.: The impact of COVID-19 lockdown measures on the Indian summer monsoon, Environ. Res. Lett., 16, 074054, https://doi.org/10.1088/1748-9326/ac109c, 2021a.
Fadnavis, S., Sioris, C. E., Wagh, N., Chattopadhyay, R., Tao, M., Chavan, P., and Chakroborty, T.: A rising trend of double tropopause s over South Asia in a warming environment: Implications for moistening of the lower stratosphere, Int. J. Climatol., 41, E200–E215, https://doi.org/10.1002/joc.6677, 2021b.
Fisher, J. A., Jacob, D. J., Wang, Q., Bahreini, R., Carouge, C. C., Cubison, M. J., Dibb, J. E., Diehl, T., Jimenez, J. L., Leibensperger, E. M., Lu, Z., Meinders, M. B. J., Pye, H. O. T., Quinn, P. K., Sharma, S., Streets, D. G., van Donkelaar, A., and Yantosca, R. M.: Sources, distribution, and acidity of sulfate-ammonium aerosol in the Arctic in winter–spring, Atmos. Environ., 45, 7301–7318, https://doi.org/10.1016/j.atmosenv.2011.08.030, 2011.
Gettelman, A., Piers, P. M., Fujiwara, M., Fu, Q., Vömel, H., Gohar, L. K., Johanson, C., and Ammerman, M.: Radiation balance of the tropical tropopause layer, J. Geophys. Res.-Atmos., 109, 1–12, https://doi.org/10.1029/2003jd004190, 2004.
Giglio, L., Descloitres, J., Justice, C. O., and Kaufman, Y. J.: An Enhanced Contextual Fire Detection Algorithm for MODIS, Remote Sens. Environ., 87, 273–282, 2003.
Giglio, L., Schroeder, W., and Justice, C. O.: The collection 6 MODIS active fire detection algorithm and fire products, Remote Sens. Environ., 178, 31–41, https://doi.org/10.1016/j.rse.2016.02.054, 2016.
Guenther, A.: A global model of natural volatile organic compound emissions, J. Geophys. Res., 100, 8873–8892, https://doi.org/10.1029/94JD02950, 1995.
Guha, A., Kumar De, B., Dhar, P., Banik, T., Chakraborty, M., Roy, R., Choudhury, A., Gogoi, M. M., Suresh Babu, S., and Krishna Moorthy, K.: Seasonal characteristics of aerosol black carbon in relation to long range transport over Tripura in Northeast India, Aerosol Air Qual. Res., 15, 786–798, https://doi.org/10.4209/aaqr.2014.02.0029, 2015.
Guhathakurta, P. and Rajeevan, M.: Trends in the rainfall pattern over India, Int. J. Climatol., 28, 1453–1469, https://doi.org/10.1002/joc.1640, 2008.
Hooghiem, J. J. D., Popa, M. E., Röckmann, T., Grooß, J.-U., Tritscher, I., Müller, R., Kivi, R., and Chen, H.: Wildfire smoke in the lower stratosphere identified by in situ CO observations, Atmos. Chem. Phys., 20, 13985–14003, https://doi.org/10.5194/acp-20-13985-2020, 2020.
Hanumanthu, S., Vogel, B., Müller, R., Brunamonti, S., Fadnavis, S., Li, D., Ölsner, P., Naja, M., Singh, B. B., Kumar, K. R., Sonbawne, S., Jauhiainen, H., Vömel, H., Luo, B., Jorge, T., Wienhold, F. G., Dirkson, R., and Peter, T.: Strong day-to-day variability of the Asian Tropopause Aerosol Layer (ATAL) in August 2016 at the Himalayan foothills, Atmos. Chem. Phys., 20, 14273–14302, https://doi.org/10.5194/acp-20-14273-2020, 2020.
Khaykin, S., Legras, B., Bucci, S., Sellitto, P., Isaksen, L., Tencé, F., Bekki, S., Bourassa, A., Rieger, L., Zawada, D., Jumelet, J., and Godin-Beekmann, S.: The 2019/20 Australian wildfires generated a persistent smoke-charged vortex rising up to 35 km altitude, Commun. Earth Environ., 1, 22, https://doi.org/10.1038/s43247-020-00022-5, 2020.
Lamarque, J.-F., Bond, T. C., Eyring, V., Granier, C., Heil, A., Klimont, Z., Lee, D., Liousse, C., Mieville, A., Owen, B., Schultz, M. G., Shindell, D., Smith, S. J., Stehfest, E., Van Aardenne, J., Cooper, O. R., Kainuma, M., Mahowald, N., McConnell, J. R., Naik, V., Riahi, K., and van Vuuren, D. P.: Historical (1850–2000) gridded anthropogenic and biomass burning emissions of reactive gases and aerosols: methodology and application, Atmos. Chem. Phys., 10, 7017–7039, https://doi.org/10.5194/acp-10-7017-2010, 2010.
Lau, K. M., Kim, M. K., and Kim, K. M.: Asian summer monsoon anomalies induced by aerosol direct forcing: The role of the Tibetan Plateau, Clim. Dynam., 26, 855–864, https://doi.org/10.1007/s00382-006-0114-z, 2006.
Lestrelin, H., Legras, B., Podglajen, A., and Salihoglu, M.: Smoke-charged vortices in the stratosphere generated by wildfires and their behaviour in both hemispheres: comparing Australia 2020 to Canada 2017, Atmos. Chem. Phys., 21, 7113–7134, https://doi.org/10.5194/acp-21-7113-2021, 2021.
Lin, C. Y., Zhao, C., Liu, X., Lin, N. H., and Chen, W. N.: Modelling of long-range transport of Southeast Asia biomass-burning aerosols to Taiwan and their radiative forcings over East Asia, Tellus B, 66, 1, https://doi.org/10.3402/tellusb.v66.23733, 2014.
Li, Z., Yang, S., He, B., and Hu, C.: Intensified Springtime Deep Convection over the South China Sea and the Philippine Sea Dries Southern China, Sci. Rep.-UK, 6, 30470, https://doi.org/10.3402/tellusb.v66.23733, 2016.
Matson, M. and Dozier, J.: Identification of Subresolution High Temperature Sources Using a Thermal IR Sensor, Photogramm. Eng. Remote Sens., 47, 1311–1318, 1981.
Maycock, A. C., Joshi, M. M., Shine, K. P., and Scaife, A. A.: The Circulation Response to Idealized Changes in Stratospheric Water Vapor, J. Climate, 26, 545–561, https://doi.org/10.1175/JCLI-D-12-00155.1, 2013.
Meehl, G. A., Arblaster, J., and Collins, W. D.: Effects of Black Carbon Aerosols on the Indian Monsoon, J. Climate, 21, 2869–2882, https://doi.org/10.1175/2007JCLI1777.1, 2008.
Mhawish, A., Banerjee, T., Sorek-Hamer, M., Lyapustin, A., Broday, D. M., and Chatfield, R.: Comparison and Evaluation of MODIS Multi-Angle Implementation of Atmospheric Correction (MAIAC) Aerosol Product over South Asia, Remote Sens. Environ., 224, 12–28, https://doi.org/10.1016/j.rse.2019.01.033, 2019.
Murugavel, P., Pawar, S. D., and Gopalakrishnan, V.: Trends of Convective Available Potential Energy over the Indian region and its effect on rainfall, Int. J. Climatol., 32, 1362–1372, https://doi.org/10.1002/joc.2359, 2012.
NASA: Resolution Imaging Spectrodiometer (MODIS), Fire Information for Resource Management System [data set], available at: https://firms.modaps.eosdis.nasa.gov/download, last access: 1 January 2021a.
NASA: MODATML2, LAADS DAAC [data set], available at: https://ladsweb.modaps.eosdis.nasa.gov/archive/allData/61/MODATML2/, last access: 1 January 2021b.
NASA: Multi-angle Imaging SpectroRadiometer (MISR), available at: https://misr.jpl.nasa.gov/getData/accessData/, last access: 1 January 2021c.
NASA: Aerosol Robotic NETwork (AERONET), available at: https://aeronet.gsfc.nasa.gov/, last access: 1 January 2021d.
Nguyen, H. N., Martinsson, B. G., Wagner, J. B., Carlemalm, E., Ebert, M., Weinbruch, S., Brenninkmeijer, C. A. M., Heintzenberg, J., Hermann, M., Schuck, T., van Velthoven, P. F. J., and Zahn, A.: Chemical composition and morphology of individual aerosol particles from a CARIBIC flight at 10 km altitude between 50∘ N and 30∘ S, J. Geophys. Res.-Atmos., 113, D23209, https://doi.org/10.1029/2008JD009956, 2008.
Ni, H., Huang, R.-J., Cao, J., Guo, J., Deng, H., and Dusek, U.: Sources and formation of carbonaceous aerosols in Xi'an, China: primary emissions and secondary formation constrained by radiocarbon, Atmos. Chem. Phys., 19, 15609–15628, https://doi.org/10.5194/acp-19-15609-2019, 2019.
NOAA/OAR/ESRL PSL: NCEP-DOE Reanalysis 2: Pressure Level, Physical Sciences Laboratory [data set], available at: https://psl.noaa.gov/data/gridded/data.ncep.reanalysis2.pressure.html, last access: 1 January 2021.
Oman, L., Waugh, D. W., Pawson, S., Stolarski, R. S., and Nielsen, J. E.: Understanding the changes of stratospheric water vapor in coupled chemistry-climate model simulations, J. Atmos. Sci., 65, 3278–3291, https://doi.org/10.1175/2008JAS2696.1, 2008.
Oshima, N., Kondo, Y., Moteki, N., Takegawa, N., Koike, M., Kita, K., Matsui, H., Kajino, M., Nakamura, H., Jung, J. S., and Kim, Y. J.: Wet removal of black carbon in Asian outflow: Aerosol Radiative Forcing in East Asia (A-FORCE) aircraft campaign, J. Geophys. Res.-Atmos., 117, D03204, https://doi.org/10.1029/2011JD016552, 2012.
Peterson, D. A., Campbell, J. R., Hyer, E. J., Fromm, M. D., Kablick, G. P., Cossuth, J. H., and DeLand, M. T.: Wildfire-driven thunderstorms cause a volcano-like stratospheric injection of smoke, npj Clim. Atmos. Sci., 1, 30, https://doi.org/10.1038/s41612-018-0039-3, 2018.
Pozzoli, L., Bey, I., Rast, S., Schultz, M. G., Stier, P., and Feichter, J.: Trace gas and aerosol interactions in the fully coupled model of aerosol-chemistry-climate ECHAM5-HAMMOZ: 1. Model description and insights from the spring 2001 TRACE-P experiment, J. Geophys. Res., 113, D07308, https://doi.org/10.1029/2007JD009007, 2008.
Randel, W. J., Park, M., Emmons, L., Kinnison, D., Bernath, P., Walker, K. A., Boone, C., and Pumphrey, H.: Asian monsoon transport of pollution to the stratosphere, Science, 328, 611–613, https://doi.org/10.1126/science.1182274, 2010.
Rieger, L. A., Malinina, E. P., Rozanov, A. V., Burrows, J. P., Bourassa, A. E., and Degenstein, D. A.: A study of the approaches used to retrieve aerosol extinction, as applied to limb observations made by OSIRIS and SCIAMACHY, Atmos. Meas. Tech., 11, 3433–3445, https://doi.org/10.5194/amt-11-3433-2018, 2018.
Riese, M., Ploeger, F., Rap, A., Vogel, B., Konopka, P., Dameris, M., and Forster, P.: Impact of uncertainties in atmospheric mixing on simulated UTLS composition and related radiative effects, J. Geophys. Res., 117, D16305, https://doi.org/10.1029/2012JD017751, 2012.
Schill, G. P., Froyd, K. D., Bian, H., Kupc, A., Williamson, C., Brock, C. A., Ray, E., Hornbrook, R. S., Hills, A. J., Apel, E. C., Chin, M., Colarco, P. R., and Murphy, D. M.: Widespread biomass burning smoke throughout the remote troposphere, Nat. Geosci., 13, 422–427, https://doi.org/10.1038/s41561-020-0586-1, 2020.
Sherwood, S., Dixit, V., and Salomez, C.: The Global Warming Potential of Near-Surface Emitted Water Vapour, Environ. Res. Lett., 13, 104006, https://doi.org/10.1088/1748-9326/aae018, 2018.
Shindell, D. T., Chin, M., Dentener, F., Doherty, R. M., Faluvegi, G., Fiore, A. M., Hess, P., Koch, D. M., MacKenzie, I. A., Sanderson, M. G., Schultz, M. G., Schulz, M., Stevenson, D. S., Teich, H., Textor, C., Wild, O., Bergmann, D. J., Bey, I., Bian, H., Cuvelier, C., Duncan, B. N., Folberth, G., Horowitz, L. W., Jonson, J., Kaminski, J. W., Marmer, E., Park, R., Pringle, K. J., Schroeder, S., Szopa, S., Takemura, T., Zeng, G., Keating, T. J., and Zuber, A.: A multi-model assessment of pollution transport to the Arctic, Atmos. Chem. Phys., 8, 5353–5372, https://doi.org/10.5194/acp-8-5353-2008, 2008.
Singh, N., Murari, V., Kumar, M., Barman, S. C., and Banerjee, T.: Fine particulates over South Asia: Review and meta-analysis of PM2.5 source apportionment through receptor model, Environ. Pollut., 223, 121–136, https://doi.org/10.1016/j.envpol.2016.12.071, 2017.
Singh, P., Sarawade, P., and Adhikary, B.: Carbonaceous aerosol from open burning and its impact on regional weather in South Asia, Aerosol Air Qual. Res., 20, 419–431, https://doi.org/10.4209/aaqr.2019.03.0146, 2020a.
Singh, P., Sarawade, P., and Adhikary, B.: Transport of black carbon from planetary boundary layer to free troposphere during the summer monsoon over South Asia, Atmos. Res., 235, 104761, https://doi.org/10.1016/j.atmosres.2019.104761, 2020b.
Stier, P., Feichter, J., Kinne, S., Kloster, S., Vignati, E., Wilson, J., Ganzeveld, L., Tegen, I., Werner, M., Balkanski, Y., Schulz, M., Boucher, O., Minikin, A., and Petzold, A.: The aerosol-climate model ECHAM5-HAM, Atmos. Chem. Phys., 5, 1125–1156, https://doi.org/10.5194/acp-5-1125-2005, 2005.
Streets, D. G., Yarber, K. F., Woo, J. H., and Carmichael, G. R.: Biomass Burning in Asia: Annual and Seasonal Estimates and Atmospheric Emissions, Global Biogeochem. Cy., 17, 1099, https://doi.org/10.1029/2003GB002040, 2003.
Talukdar, S., Jana, S., Maitra, A., and Gogoi, M. M.: Characteristics of black carbon concentration at a metropolitan city located near land-ocean boundary in Eastern India, Atmos. Res., 153, 526–534, https://doi.org/10.1016/j.atmosres.2014.10.014, 2015.
Tegen, I., Neubauer, D., Ferrachat, S., Siegenthaler-Le Drian, C., Bey, I., Schutgens, N., Stier, P., Watson-Parris, D., Stanelle, T., Schmidt, H., Rast, S., Kokkola, H., Schultz, M., Schroeder, S., Daskalakis, N., Barthel, S., Heinold, B., and Lohmann, U.: The global aerosol–climate model ECHAM6.3–HAM2.3 – Part 1: Aerosol evaluation, Geosci. Model Dev., 12, 1643–1677, https://doi.org/10.5194/gmd-12-1643-2019, 2019.
Thomas, A., Sarangi, C., and Kanawade, V. P.: Recent Increase in Winter Hazy Days over Central India and the Arabian Sea, Sci. Rep., 9, 17406, https://doi.org/10.1038/s41598-019-53630-3, 2019.
University of Saskatchewan: OSIRIS on Odin, available at: https://psl.noaa.gov/data/gridded/data.ncep.reanalysis2.pressure.html, last access: 1 January 2021.
Val Martin, M., Logan, J. A., Kahn, R. A., Leung, F.-Y., Nelson, D. L., and Diner, D. J.: Smoke injection heights from fires in North America: analysis of 5 years of satellite observations, Atmos. Chem. Phys., 10, 1491–1510, https://doi.org/10.5194/acp-10-1491-2010, 2010.
van Vuuren, D. P., Edmonds, J., Kainuma, M., Riahi, K., Thomson, A., Hibbard, K., Hurtt, G. C., Kram, T., Krey, V., Lamarque, J. F., Masui, T., Meinshausen, M., Nakicenovic, N., Smith, S. J., and Rose, S. K.: The representative concentration pathways: An overview, Clim. Change, 109, 5–31, https://doi.org/10.1007/s10584-011-0148-z, 2011.
Wang, S. H., Lin, N. H., Chou, M. D., and Woo, J. H.: Estimate of radiative forcing of Asian biomass-burning aerosols during the period of TRACE-P, J. Geophys. Res.-Atmos., 112, D10222, https://doi.org/10.1029/2006JD007564, 2007.
Wang, S. H., Welton, E. J., Holben, B. N., Tsay, S. C., Lin, N. H., Giles, D., Stewart, S. A., Janjai, S., Nguyen, X. A., Hsiao, T. C., Chen, W. N., Lin, T. H., Buntoung, S., Chantara, S., and Wiriya, W.: Vertical distribution and columnar optical properties of springtime biomass-burning aerosols over Northern Indochina during 2014 7-SEAS Campaign, Aerosol Air Qual. Res., 15, 2037–2050, https://doi.org/10.4209/aaqr.2015.05.0310, 2015.
Wang, X. and Dessler, A. E.: The response of stratospheric water vapor to climate change driven by different forcing agents, Atmos. Chem. Phys., 20, 13267–13282, https://doi.org/10.5194/acp-20-13267-2020, 2020.
Weigel, R., Mahnke, C., Baumgartner, M., Dragoneas, A., Vogel, B., Ploeger, F., Viciani, S., D'Amato, F., Bucci, S., Legras, B., Luo, B., and Borrmann, S.: In situ observation of new particle formation (NPF) in the tropical tropopause layer of the 2017 Asian monsoon anticyclone – Part 1: Summary of StratoClim results, Atmos. Chem. Phys., 21, 11689–11722, https://doi.org/10.5194/acp-21-11689-2021, 2021.
Wu, J., Kong, S., Wu, F., Cheng, Y., Zheng, S., Yan, Q., Zheng, H., Yang, G., Zheng, M., Liu, D., Zhao, D., and Qi, S.: Estimating the open biomass burning emissions in central and eastern China from 2003 to 2015 based on satellite observation, Atmos. Chem. Phys., 18, 11623–11646, https://doi.org/10.5194/acp-18-11623-2018, 2018.
Xie, F., Tian, W., Zhou, X., Zhang, J., Xia, Y., and Lu, J.: Increase in Lower Stratospheric Water Vapor in the Past 100 Years Related to Tropical Atlantic Warming, Geophys. Res. Lett., 47, e2020GL090539, https://doi.org/10.1029/2020GL090539, 2020.
Zhang, X., Liu, J., Han, H., Zhang, Y., Jiang, Z., Wang, H., Meng, L., Li, Y. C., and Liu, Y.: Satellite-Observed Variations and Trends in Carbon Monoxide over Asia and Their Sensitivities to Biomass Burning, Remote Sens. 12, 830, https://doi.org/10.3390/rs12050830, 2020.