the Creative Commons Attribution 4.0 License.
the Creative Commons Attribution 4.0 License.
 | 23 Jul 2021
Lightning occurrences and intensity over the Indian region: long-term trends and future projections
Rohit Chakraborty
Arindam Chakraborty
Ghouse Basha
Madineni Venkat Ratnam
Lightning activity constitute the major destructive component of thunderstorms over India. Hence, an understanding of the long-term variability in lightning occurrence and intensity and their interrelation with various causative factors is required. Long-term (1998–2014) Tropical Rainfall Measuring Mission (TRMM) satellite-based lightning observations depict the most frequent lightning occurrences along the Himalayan foothills, the Indo-Gangetic plains and coastal regions, while the intensity of these lightning strikes is found to be strongest along the coastal regions and in the Bay of Bengal. In addition, both of the abovementioned lightning properties show a very strong intensification (∼ 1 %–2.5 % annually) across all Indian regions during the 1998–2014 period with the maximum trends along the coasts. Accordingly, a detailed statistical dominance analysis is performed which reveals total column water vapor (TCWV) to be the dominant factor behind the intensification in lightning events, while instability, measured by the convective available potential energy (CAPE), and aerosol optical depth (AOD) jointly control the lightning frequency trends. An increase in surface temperatures has led to enhanced instability and, hence, stronger moisture transport to the upper-troposphere and lower-stratosphere regions, especially along the coasts. This transported moisture helps deplete the ozone concentration, leading to reduced temperatures and elevated equilibrium levels, which finally results in stronger and more frequent lightning events, as also evidenced by the trend analysis. Consequently, the relationships between lightning and its causative factors have been expressed in the form of multilinear regression equations, which are then employed in multiple global circulation models (GCMs) to understand the long-term impact of urbanization on lightning over the period from 1950 to 2100. The analysis reveals a uniform increase in lightning occurrence and intensity using both urbanization scenarios; however, accelerated growth is observed in the RCP8.5 projections after the year 2050, as also observed from the surface warming trends. As a result, lightning frequency and intensity values across the Indian region are expected to increase ∼ 10 %–25 % and 15 %–50 %, respectively, by the end of the century with the highest risk along the coasts; hence, this requires immediate attention from policymakers.
- Article
(4326 KB) - Full-text XML
-
Supplement
(1329 KB) - BibTeX
- EndNote


Intense thunderstorm events form a very common climatic feature over the Indian subcontinent. These phenomena are generally accompanied by widespread lightning, wind gusts and heavy rainfall which induce various socioeconomic hazards. However, among the abovementioned by-products of storms, lightning occurrences have been found to cause the greatest damage to life with a death toll of more than 2500 every year over the last 2 decades (Livemint, 2000). In addition, recent years have witnessed some of the most severe lightning calamities (according to available records) – for example, more than 100 lives were lost to lightning on 25 June 2020 (Washington Post, 2020).
Over the tropics, the noninductive (collision-based) charging interaction between ice crystals and graupel particles is found to be the major factor behind the evolution of lightning events during typical thunderstorms (Takahashi, 1978; Mansell and Ziegler, 2013). Accordingly, in this mechanism, the magnitude of charge generated per collision depends on the relative velocity of the colliding particles, the hydrometeor concentration of graupel and ice, and their corresponding size distributions (Shi et al., 2015); in turn, these factors are controlled by the atmospheric moisture content (total column water vapor), thermodynamic instability (convective available potential energy) and the possibility of cloud nucleation from aerosols. Additionally, Kumar and Kamra (2012) suggested that orographic lifting also has a strong influence on lightning, although only in limited high-altitude regions of the Indian subcontinent.
Lightning flashes have been found to be significantly correlated with convective rain, total column water vapor (TCWV), or surface relative humidity over both land and sea regions, according to previous studies (Price and Federmesser, 2006; Siingh et al., 2011; Shi et al., 2018). This is because higher humidity levels lead to stronger hydrometeor concentration and updraft velocities, both of which contribute to intense lightning. Moreover, high values of instability represented by convective available potential energy (CAPE) are essential for lifting the available moisture with strong updrafts above the freezing level where they form ice and graupel particles which collide to initiate charge separation and lightning; this has already been demonstrated both theoretically and statistically in various previous research attempts (Galanaki et al., 2015; Saha et al., 2017; Dewan et al., 2018).
Finally, coming to the impact of aerosol optical depth (AOD), a study by Shi et al. (2020) reported that the lightning flash rates are strongly correlated when AOD < 1 due to the cloud/ice condensation nuclei formation characteristics from sulfates (Jin et al., 2018), desert dust (Boose et al., 2019) or even sea salt aerosols (de Leeuw et al., 2011). Conversely, when AOD > 1, larger concentrations of cloud condensation nuclei normally result in more supercooled droplets, leading to stronger lightning (Williams and Stanfill, 2002). However, excessively high aerosol concentrations may also result in reduced cloud droplet size (Twomey et al., 1984) which reduces the efficiency of the noninductive charging process. In addition, an excess of absorptive aerosols (such as black carbon) warms the atmosphere and cools the surface (Kar et al., 2009; Talukdar et al., 2019) which further reduces the CAPE and lightning. Hence, the reported relationships between lightning and aerosols are still unclear, and further studies are required to unravel them (van den Heever and Cotton, 2007).
From a climatic point of view, a series of studies in recent years have shown that thunderstorm severity, lightning and its various controlling factors have been increasing prominently in the recent decades, and this has been attributed to the greenhouse-gas-emission-induced surface warming effects both over India and across the globe. A study by Shindell et al. (2006) reported that a minimum 10 % increase in lightning activity can be expected for every 1 ∘C increase due to global warming. Kandalgaonkar et al. (2005) suggested that a 1 ∘C rise in surface temperature over India leads to a 20 %–40 % enhancement in average lightning flash density. According to Riemann-Campe et al. (2009) and Prein et al. (2017), a recent increase in temperature has led to a rise in moisture ingress; consequently, the frequency and severity of intense convective activity have shown a steep rise globally.
Over India, Murugavel et al. (2012) and Chakraborty et al. (2019) showed a systematic increase in CAPE that was attributed to thermodynamic instability conditions and large-scale dynamics coupled with a decrease in upper-tropospheric temperatures during that period. Satellite measurements have also shown a prominent increase in aerosol concentrations over Asia due to the intense growth in urbanization and industrialization (Massie et al., 2004). Consequently, a new set of research attempts have tried to express lightning and thunderstorm severities in form of their causative factors which are employed in global climate models (GCMs) to provide future projections of extreme events (Diffenbaugh et al., 2013). Romps et al. (2014) expressed the lightning flash rate in terms of the product between CAPE and the precipitation rate which, when implemented in eight climate models, revealed a 12±5 % increase in lightning per 1 ∘C of warming over the USA. Later, a range of other proxies were also used over GCMs for lightning projections, but all of them also provided a similar increase in lightning both globally and over the USA (Banerjee et al., 2014; Romps, 2019). However, as already hinted by Michalon et al. (1999) many years ago, most of the modeling attempts are expected to fail in providing a holistic understanding of changing lightning climatology; interestingly, this is also found to be true at present, as evidenced from major disagreements in the magnitude of the projected trends among all of the abovementioned studies.
With reference to the previous sections, it is understood that (1) a very few studies on lightning have been carried out in the tropics, especially over the Indian region (Pereira et al., 2010), and none of the remaining attempts have tried to depict the future projections of lightning; (2) all of the abovementioned studies have utilized very poor-resolution lightning datasets and, hence, did not provide a holistic mechanism behind the climatological variations in lightning evolution; and (3) none of these attempts have focused on the variation in lightning radiance or intensity, which is expected to be much more connected with the underlying physical processes compared with the frequency values. Thus, in the present study, high-resolution lightning datasets of frequency and intensity are used over the Indian region, and an attempt is made to identify the most dominant factors affecting the spatiotemporal variability in the lightning properties in a complete manner. Finally, the results of this dominance analysis are expressed in the form of a multivariate regression analysis and subsequently applied on multi-model GCM datasets to generate reliable future projections of lightning occurrences and intensity over India for the next few decades subject to various urbanization scenarios.
The paper is structured as follows. A detailed illustration of the various datasets used in this study is given in Sect. 2. The results section is divided into four subsections: the first two subsections (Sects. 3.1 and 3.2) discuss the spatial distribution of lightning and its 17-year trends, and they also try to identify the dominant factors responsible for the multidecadal changes in lightning; Sect. 3.3 proposes a probable physical mechanism to relate how the recently accelerated global warming trends can modulate the climatic intensification and abundance of lightning; and Sect. 3.4 tries to implement the abovementioned hypothesis on multiple long-term global climate model datasets to provide reliable future projections of lightning intensity and occurrence subject to various degrees of urbanization. In conclusion, Sect. 4 summarizes all of the results to produce a simplified picture that tries to quantify the long-term impacts of global warming on lightning extremes over the Indian region for future policymakers.
Lightning observations for the present study are obtained from Lightning Imaging Sensors (LISs) aboard the Tropical Rainfall Measuring Mission (TRMM) satellite which orbits the Earth at 350 km elevation between 35∘ N and 35∘ S at a rate of 16 orbits d−1 (Christian et al., 2003). These LISs can detect both intra-cloud and cloud-to-ground discharges irrespective of day or night conditions with a flash detection efficiency of 73±11 % and 93±4 %, respectively (Boccippio et al., 2002). The lightning observations are done by monitoring illumination pulses along the 777.4 nm atomic oxygen multiplet with a very fine spatial (5.5 km) and temporal (2 ms) resolution. Every time an illumination pulse registers an intensity greater than the predefined background noise level, it is considered as a separate lightning event after which all such events occurring within an integration time of 330 ms are collectively considered as single lightning flashes. The view times of these flashes are also recorded separately in order to obtain the monthly flash rate climatological datasets. Here, it may be noted that most past studies have used preprocessed monthly averaged lightning flash rates after 2.5∘ and 99 d smoothing of the actual data which may have compromised the actual distribution of lightning properties in those cases. Hence, in this study, the actual lightning observations from ∼ 95 800 satellite passes have been utilized during the total availability period from 1998 to 2014. These lightning flash (km−2) datasets are compiled monthly and then averaged annually, whereas the lightning radiance values (J m−2 steradian−1 s1) are averaged directly on a yearly basis so that the magnitudes of both these parameters remain along the same 0–1 scale for simplicity with respect to analysis. However, for ease of region-wise analysis, the yearly time series of both of these parameters has been analyzed on a fixed grid resolution of 1∘.
As we utilize the lightning radiance measurements from satellite observations, it may be best to explain the importance of these data for weather and climate because this attribute has never been extensively discussed in past research attempts (unlike lightning frequency or flash rate). It is well known that lightning activity originates due to charge separation in mixed-phase clouds, but it requires a sufficient amount of electrostatic charge to shatter the insolation capacity of the atmosphere and descend to the Earth's surface, thereby causing widespread damage to life and property. However, a majority of these lightning occurrences are not strong enough; hence, they remain as inter-cloud lightning without any real impact on the climate or socio-economy. On the other hand, according to some novel studies like Uman (1986), only 10 %–20 % of total lightning activity remains strong enough to reach the ground, thereby inflicting widespread socioeconomic impacts. Consequently, the climatological variation in lightning intensity or radiance also needs to be monitored very closely by present policymakers in order to prevent any impending catastrophes in the future.
Next, the gridded datasets of the causative meteorological factors, namely CAPE and TCWV, are utilized from the Climate Forecast System Reanalysis (CFSR), developed by NOAA's National Center for Environmental Prediction (NCEP; https://psl.noaa.gov/data/gridded/data.ncep.reanalysis.html, last access: 16 July 2021) datasets (Kalnay et al., 1996) as provided by the Physical Sciences Division of NOAA Earth System Research Laboratory (ESRL PSD) for the period from 1948 to 2014. These datasets are provided at a coarse spatial resolution of for CAPE and for TCWV; hence, they had to be interpolated to a 1∘ resolution and averaged yearly for subsequent analysis. The datasets of aerosol optical density (AOD) over the maximum availability period of 2000–2014 are obtained from the Level-3 (L3) MODIS Terra Atmosphere Monthly Global Product MOD08_M3 at a 1 × 1 grid resolution (Platnick et al., 2015) over the Indian subcontinent. Further details can be obtained at https://ladsweb.modaps.eosdis.nasa.gov/archive/allData/61/MOD08_M3/ (last access: 16 July 2021). Gridded altitude datasets at a 0.25∘ resolution are taken from the GMTED2010 global digital elevation model within the framework of the TEMIS project (Danielsen and Gesch, 2011). Finally, the future projections of lightning properties for various urbanization scenarios are derived using gridded datasets of the temperature, humidity and ozone profiles with aerosol optical depth at 550 nm from 11 general circulation models (GCMs) in the Coupled Model Intercomparison Project (CMIP5) archive (https://esgf-node.llnl.gov/search/cmip5/, last access: 16 July 2021) during 1950–2100. Further details of these datasets are provided in Taylor et al. (2012) and in subsequent sections of this study.
3.1 Spatial distribution of lightning properties
The climatological average of lightning frequency shown in Fig. 1a depicts much higher values over the land regions compared with the Arabian Sea (AS) and the Bay of Bengal (BoB). This is due to the occurrence of stronger sensible heat fluxes over the land regions resulting in stronger updrafts and, hence, more lightning (Kumar and Kamra, 2012). The highest magnitude is observed along the foothills of Himalayas (72–95∘ E) which implies the effect of orographic convection on lightning events. In these regions, the high values of lightning flashes are found to be associated with the occurrence of a mountain breeze front during the afternoon hours (Boeck et al., 1999). The secondary spatial maximum of lightning is observed along the coastline and can be attributed to widespread moisture advection from the adjoining seas (Kumar and Kamra, 2012).

Figure 1Climatological mean (a) lightning flash rate and (b) lightning radiance over India averaged from 1998 to 2014; (c) altitude above mean sea level on a base 10 logarithmic scale (seas denoted by −1); and (d) the representation of the seven regions used in the study.
The BoB experiences moderately high lightning frequencies due to high sea surface temperatures (SSTs; above a critical threshold of 28 ∘C, according to Gadgil et al., 1984) which lead to frequent cyclonic storms and lows in this region. However, the AS experiences lower lightning frequencies due to lower SSTs in this region (Kumar and Kamra, 2012). Furthermore, low lightning frequencies are observed along the peninsular India due to reduced moisture supply, as it is geographical bounded by mountainous terrain along the coasts from both sides. In addition, moderately high lightning frequencies are observed along the Indo-Gangetic Plain (IGP), which can be due to the complex interactions among the moderate moisture supply from BoB, local instability, and the cloud condensation nuclei (CCN) effects from transported (Boose et al., 2019) and emitted aerosols. Finally, very low lightning occurrence values are seen over western and western central India (WCI), which can be due to a dearth moisture supply despite the contribution from transported dust aerosols here.
Contrary to the occurrence climatology, the lightning radiance values (Fig. 1b) are much lower over majority of land regions, which is solely due to higher moisture content values over the coastal regions leading to more graupel (ice and hail particle concentrations above the freezing layer), as shown in Murugavel et al. (2012). Yet, the maximum radiance values are observed exactly along the coastline regions and decrease gradually as one moves further into the seas. This indicates the importance of the thermal land–sea contrast which causes strong moisture advection from both land and sea breezes along the land–sea boundary (Pielke, 1974), resulting in more hydrometeors and, hence, the largest radiance. However, the presence of giant CCN marine aerosols, particularly in the AS (de Leeuw et al., 2011), may also act as a secondary factor. Nevertheless, the AS still experiences lower lightning radiance than the BoB, which is probably due to local meteorological factors as described earlier. Furthermore, the lightning radiance values are found to be distinctly lower over peninsular India (PI), western and western central India (WCI) and the Himalayan foothills (HIM), as they receive much less moisture than the rest of India. In addition, a secondary radiance maximum is observed over the IGP due to moderate moisture supply and aerosols which can act as potential ice condensation nuclei (ICN)/CCN, thereby increasing the number of colliding hydrometeors for more lightning radiance.
Thus, based on these spatial distributions of lightning occurrence and intensity, a group of seven regions are proposed for further analysis, as depicted in Fig. 1d: the two coastlines share high lightning occurrences as well as intensity and are hereafter referred as “Coasts”; PI is a landlocked region between the abovementioned coasts with moderate values of both lightning properties; regions 3 and 4 are the respective sea regions, namely the BoB and the AS, as their response to lightning occurrences and radiances are quite different; the Himalayan foothills are considered to observe the effect of orographic convection on lightning properties independently; the IGP is selected as it experiences quite high lightning occurrences and intensity due to complex aerosol, instability and moisture interactions; and, finally, WCI, a remote inland region, is considered, as it experiences lower lightning properties due to a dearth moisture supply despite an important contribution from land heating and aerosols.
The climatologically averaged distributions of lightning frequency and intensity along with the four most potential factors influencing them (TCWV, CAPE, AOD and altitude) are shown in Fig. S1 in the Supplement for different regions. For lightning frequency, the mean and percentiles are highest in the HIM and lowest in PI and the AS. However, the extreme values for the Coasts and WCI are found to be higher than HIM because of the frequent cyclonic and low-pressure systems that are prevalent in these regions (Fig. S1a). The lowest lightning frequency is observed over the AS. The radiance and CAPE follow similar variability (i.e., higher values are observed over the BoB and Coasts due to more moisture availability and thunderstorm occurrences, whereas the other regions experience low to moderate values; Fig. S1b). However, a lot of extremes are observed in the IGP and WCI which implies that the occurrence of surface heating leads to higher cloud-base heights and more ice-phase hydrometeors, resulting in more lightning in these regions, as also supported from previous studies (Price, 2009; Shindell et al., 2006).
The total moisture content (TCWV) is found to be highest along the Coasts and adjoining sea regions based on lightning occurrences and intensity. Incidentally, the remote inland locations like PI and WCI receive a much reduced moisture supply, which is the primary reason behind the lower lightning radiances in those regions. The IGP and WCI regions show the highest AOD values due to dust transport from the Thar and Sahara deserts along with large-scale emissions from various anthropogenic activities which have very complex impacts on convection. Likewise, the Coasts also receive a moderate aerosol supply from the adjoining seas, as previously described, which further supports lightning formation. The HIM region depicts the highest altitudinal variation among all of the regions, with a significant fraction of the area inside the HIM present above 4 km height, thereby supporting widespread orographic-lifting-induced lightning activity. In contrast, PI and IGP exhibit an infinitesimally small altitudinal variation (< 500 m) which may not be sufficient to support any orographic convection.In WCI, the altitude ranges are considerably higher which, in turn, provides a small but vital contribution towards lightning, as also supported by various past research attempts (Barros and Lang, 2003).
3.2 Temporal variation in lightning properties
3.2.1 Long-term trends in lightning frequency and intensity over the Indian region
The 17-year time series showing variations in the mean annual lightning frequency and radiance are depicted for seven regions as well as all of India in Fig. S2 along with their respective standard error values. Robust-fit regression analysis is employed to study whether there are any statistically significant trends in the lightning frequency and radiance. At the same time, a detailed description regarding the yearly trends (in percent) of lightning properties and their controlling factors (TCWV, CAPE and AOD) are depicted along with their corresponding correlation coefficients in Fig. 2. The trends in lightning frequency are found to be the highest over the Coasts, the BoB and the AS (with a total increase of ∼ 30 %) with reasonably high correlation coefficient values, which can again be attributed to an increase in both moisture content and instability in these regions. However, the other regions depict much weaker values of both of these quantities. Here, it is interesting to note that the IGP depicts a much weaker lightning trend which may be due to complex aerosol interactions, as explained before. However, in total, India has faced a ∼ 25 % increase in lightning frequency (with very high correlation values) in these 17 years, which is alarming and will be discussed in detail later in this paper.
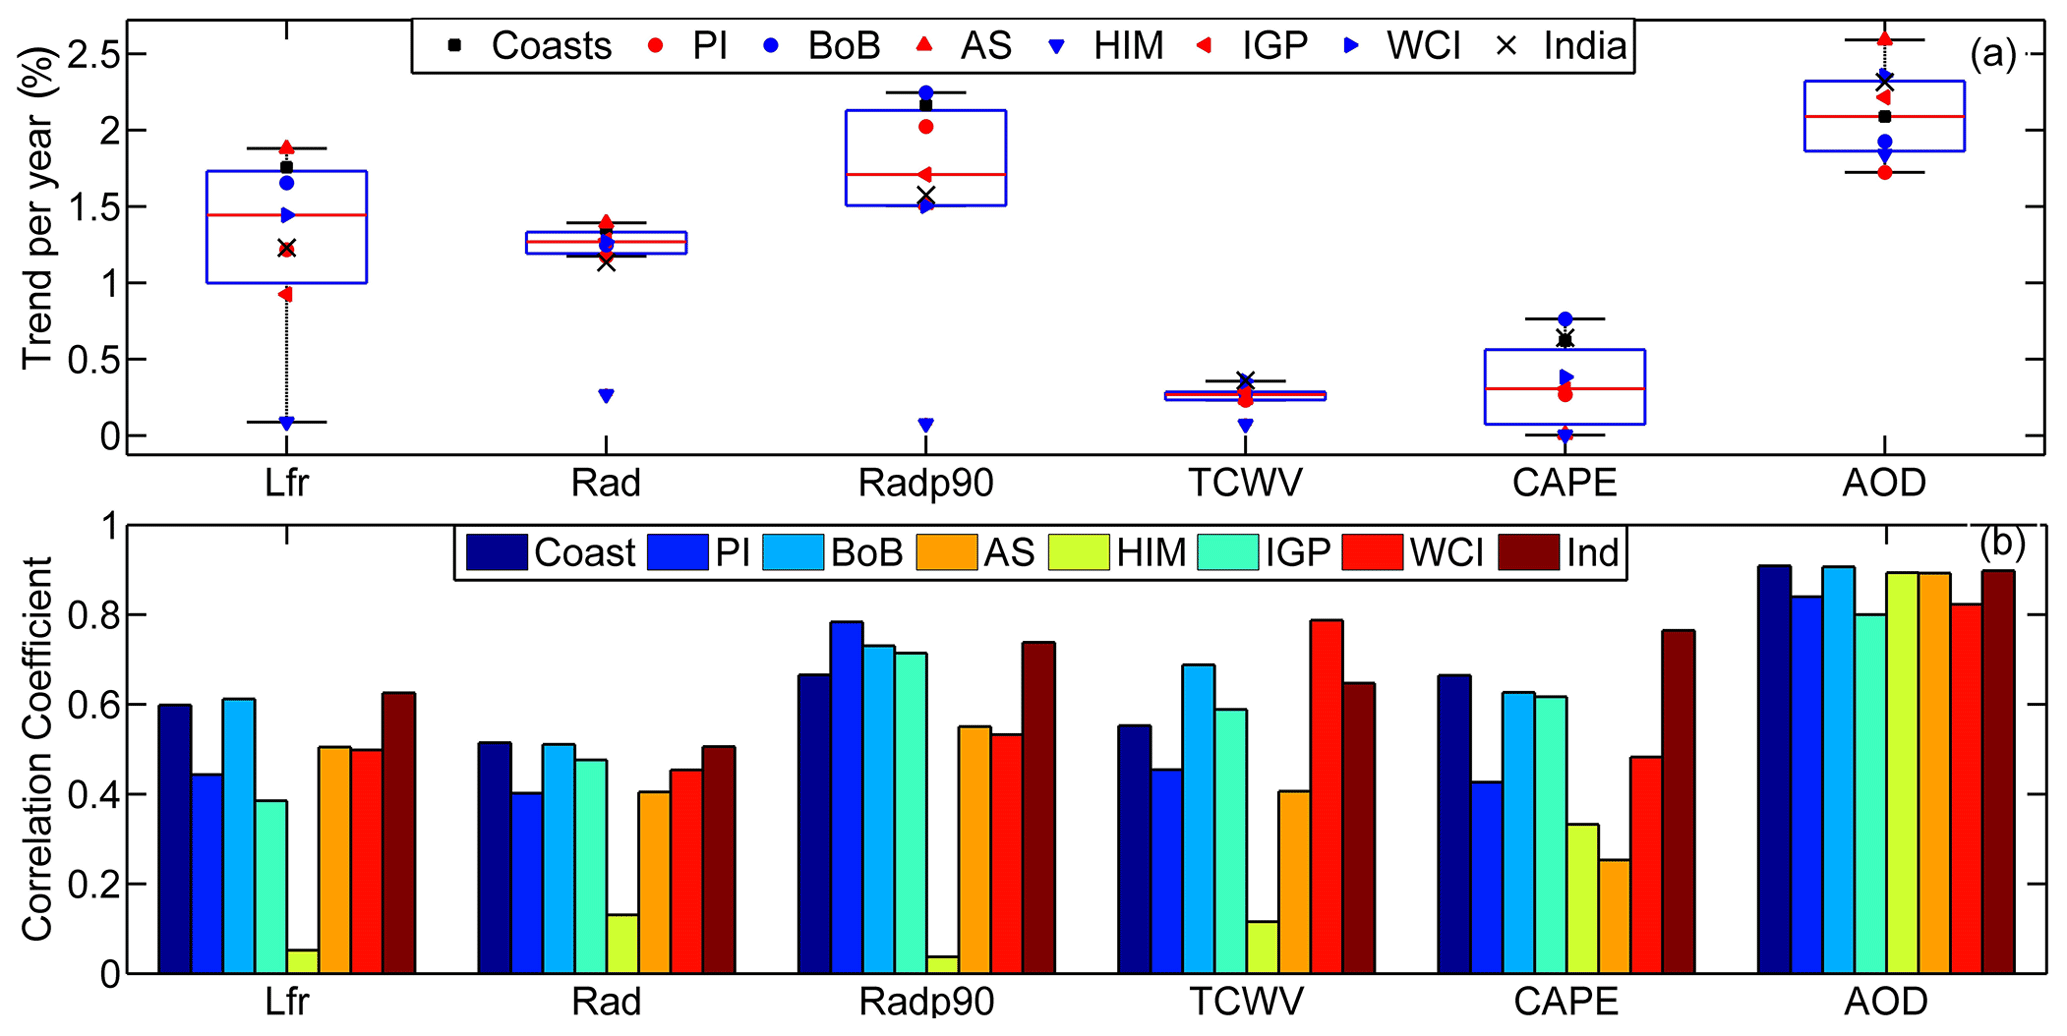
Figure 2(a) Yearly trends (in percent) in lightning flash rate (Lfr), average radiance (Rad) and 90th percentile of radiance (Radp90) with TCWV, CAPE and AOD over seven regions and over the entire Indian region; (b) correlation coefficients corresponding to these trend values.
The mean annual lightning radiances show gradually increasing trends (with a total increase of ∼ 20 %) in almost all regions. However, the magnitudes of the trends (in percent) as well as the correlation coefficients are much lower compared with the lightning frequency which implies that average radiance may not be a suitable parameter to investigate the future variations in lightning. It is known that, TRMM observes both cloud–cloud and cloud–ground types of lightning strikes together, and of these lightning strikes, only the strongest 10 % of the total strikes are intense enough to reach the ground in the tropics (Uman, 1986) and cause immense damage to life and property (Holle et al., 2019). Now, as it is more important to understand the trends in these extreme cases, the regional trends in 90th percentile of lightning radiances are examined (Fig. 2a). The trends depict a very prominent India-wide trend of ∼ 30 % with higher correlation values compared with the mean lightning radiance (Fig. 2b). Additionally, the coastal and sea regions depict much higher trends (> 40 %) than the rest of India, which is extremely alarming for policymakers at present. The HIM region, however, has not shown any change in lightning radiance which may due to the marginal increase in TCWV and CAPE there.
Further, we investigate whether the proposed 90th percentile of radiance also agrees well with the distribution of mean radiances over every Indian region; hence, the corresponding values of both the quantities for a total span of 68 seasons in 17 years are shown in Fig. S3. The figure depicts that the southern Indian regions, namely the BoB, Coasts, PI and AS (with stronger maritime influence), exhibit prominent correlation values between the two groups, the average ratio between the two is ∼ 1.2, and there is also a minimal amount of spreading, which indicates that there are no external factors affecting the average radiance distribution. However, the northern inland zones depict a prominent scattering between the groups (especially in IGP), and the ratio between them is also much higher (∼ 1.4), which indicates that some external factors such as aerosols may also exert an additional impact in intensifying the radiance values well above the average radiance distributions. Nevertheless, good overall agreement is seen between the lightning radiance groups, thereby supporting the suitability of using the 90th percentile (p90) of radiances only in the subsequent sections.
The trends in TCWV (Fig. 2a) are uniform (0.3 % yearly or 5 % in total) across all regions with decent correlation values; these trends are expected to increase in all regions due to the prominent greenhouse-gas-emission-induced global warming, as has already been observed in previous studies for all of the abovementioned Indian areas except HIM. CAPE, which represents the atmospheric instability, is the main reason for lightning evolution; hence, this parameter also depicts strong interzonal variability like lightning. The Coasts and sea regions experience a much stronger increase of ∼ 9 % in 17 years, implying more thunderstorm activity in the present due to a prominent global-warming-induced land–sea thermal contrast. However, the rest of the country exhibits a much weaker increase (∼ 5 %). Further, the trends in the IGP and WCI are even lower due to the complex aerosol effect. Finally, AOD is found to increase most significantly throughout India compared with the other parameters; however, the southern Indian maritime regions experience a much lower rise of ∼ 25 % compared with deep inland regions (WCI and IGP), with a ∼ 40 % increase indicating that aerosols may only play a more dominant role in modulating the trends in lightning properties in the continental northern Indian regions.
3.2.2 Investigation of the dominant factors affecting the lightning trends over India
The previous sections depict a series of spatially varying complex interactions among TCWV, CAPE and AOD that resulted in an increasing trend in both of the abovementioned lightning properties over the Indian region. In order to identify the most dominant factors affecting the trends in lightning, a clustering analysis was carried out for each Indian region. Hence, the lightning datasets are taken for a 15-year time span (as AOD data are absent before 2000) and are then sorted into three clusters based on magnitude. The mean and deviation of these clusters are depicted in Figs. S4 and S5 with respect to the corresponding values of TCWV, CAPE and AOD. Factors with a dominant influence are identified as those whose parameter mean increases sharply with the clusters with minimal mutual overlapping.
The analysis revealed that CAPE and AOD depict good clustering for occurrences, whereas TCWV shows the best results for radiances over the Coasts and BoB. The AS also behaves similarly, but in the case of occurrences, AOD fares slightly better than the others, implying a dominant contribution from CCN-forming marine aerosol transport in this region. PI experiences less moisture ingress (due to its inland location); hence, it relies more on dry convection which makes CAPE the major governing element for both of the lightning properties. No single factor is observed to be dominant for lightning frequency in HIM, as it mainly relies on orographic convection processes, as already explained in preceding sections. However, for radiance, TCWV still remains a dominant factor (Fig. S5). For the IGP, CAPE exhibits fair linear clustering in occurrence, whereas TCWV remains dependable for intensity. WCI behaves similarly to PI, but a secondary influence of AOD is also observed in this region, indicating the possible impact of transported dust (acting as ICN) which catalyzes the formation of ice-phase hydrometeors, leading to more frequent and stronger lightning events.
The clustering analysis is then performed over the entire Indian region and is shown in Fig. 3. Based on clustering and correlation analysis for lightning frequencies, CAPE emerges as the dominant factor, followed by AOD. This can be supported theoretically, as the generation of lightning events only requires the availability of ice-phase hydrometeors above the freezing level which is achieved mainly by the lifting mechanism due to CAPE followed by the aerosol CNN effect. On the other hand, in the case of p90 radiance, based on clustering and correlation coefficients, TCWV emerges as the single dominant feature behind the strong rise in lighting radiances all over India. This result can also be explained theoretically, as the inductive/noninductive charging density responsible for lightning radiance is far more dependent on the local hydrometeor concentrations (arising from moisture abundance) than on their relative vertical velocities (controlled by CAPE). Interestingly, AOD has consistently maintained a complex secondary impact on both the lightning properties with respect to its tendency to either favor lightning (by creating more ICN/CCN formation due to dust or sulfate aerosols) or disfavor lightning (by inducing a cloud burn-off effect due to black carbon aerosols), as already discussed in preceding sections. Thus, a detailed study needs to be undertaken to untangle the AOD effect in aerosol-sensitive zones like the IGP and WCI.
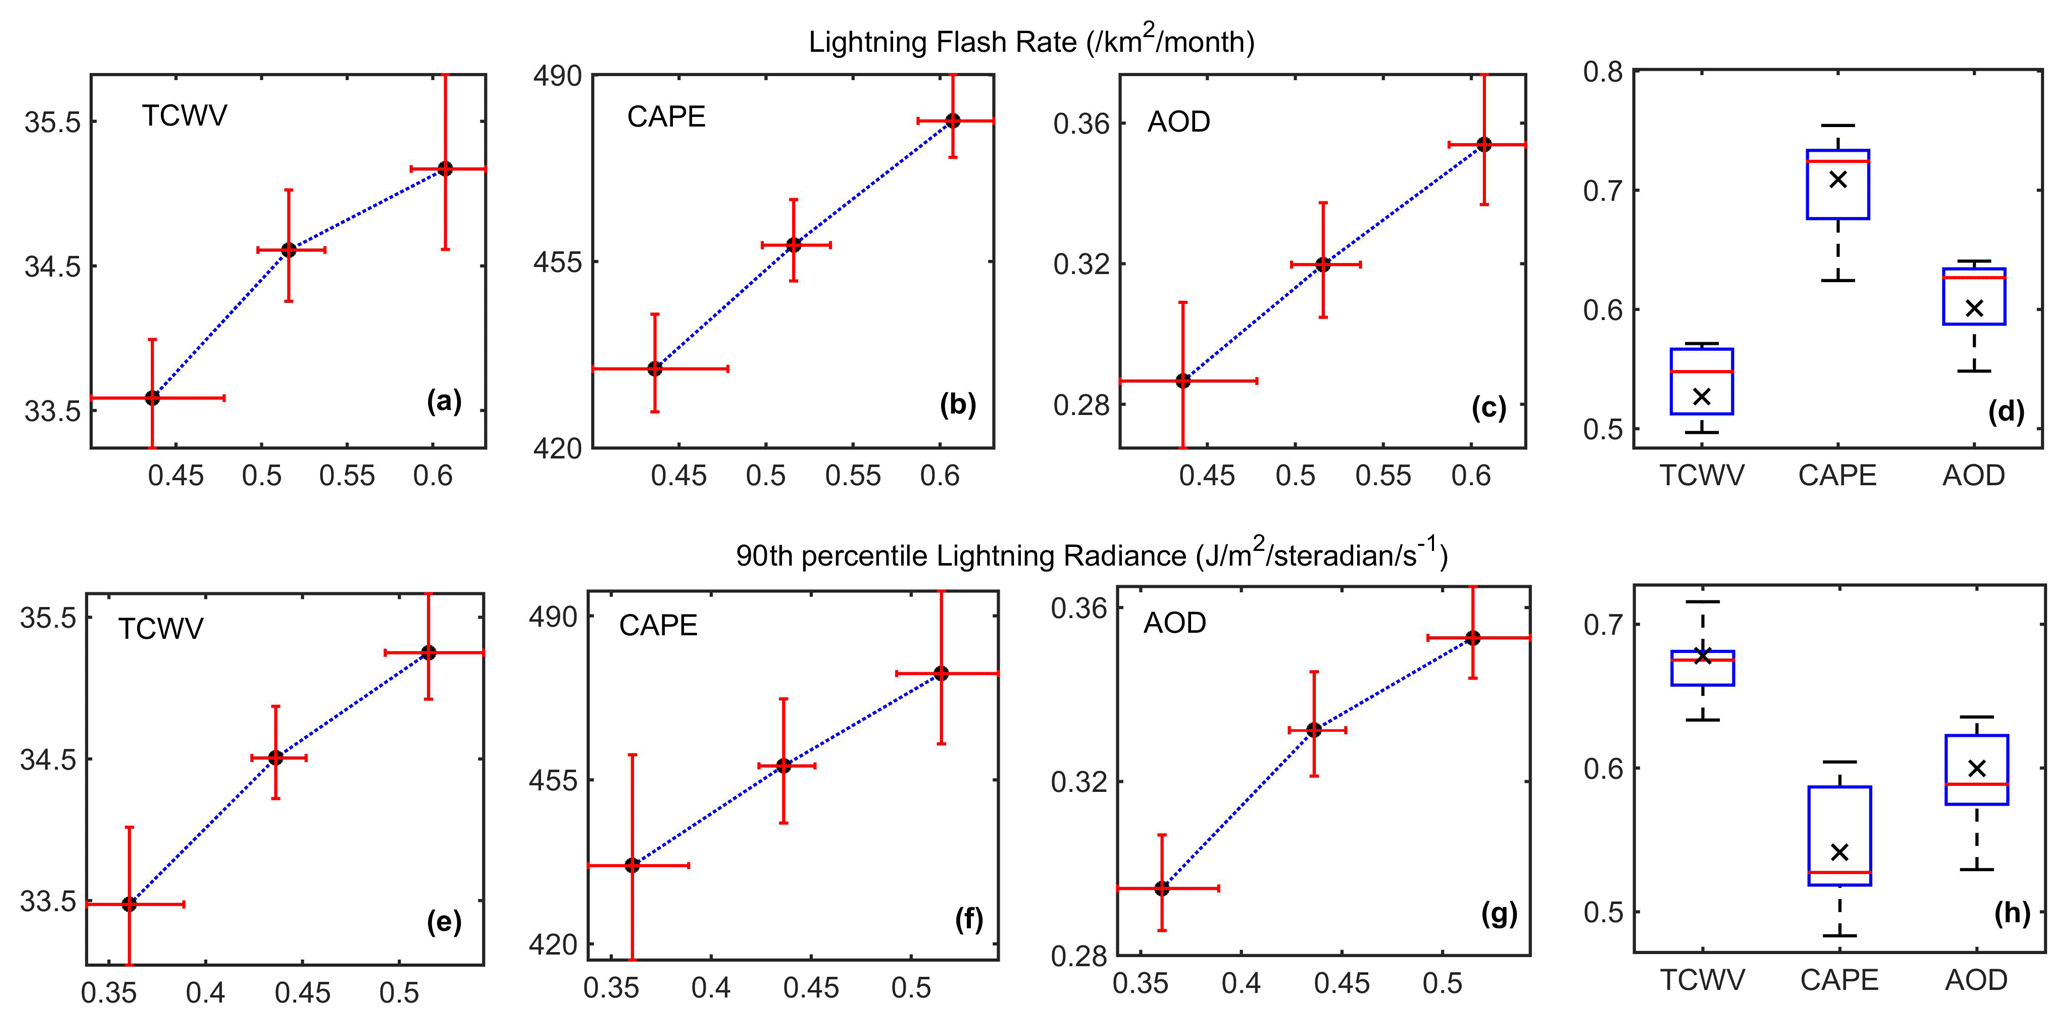
Figure 3Temporal dominance cluster analysis results of lightning frequency and extreme radiances with respect to (a, e) TCWV, (b, f) CAPE and (c, g) AOD over the entire Indian region; (d, h) the distribution of the correlation coefficient due to zonal clustering for both lightning parameters.
The temporal dominance analysis is then repeated quantitatively using a multilinear regression analysis. In this step, two equations are hypothesized where lightning frequency and radiance are expressed separately as a multilinear addition of all three controlling factors. The proposed equations can be expressed as follows:
Here, a, b and c represent the corresponding multiple linear regression (MLR) coefficients for the three factors, and the numbers 1 and 2 stand for lightning frequency and radiance, respectively. The corresponding variation in these MLR coefficients is shown in Fig. 4. CAPE is the most dominant factor in all of the regions except over the AS where the AOD influence is very high. AOD is the second most dominant parameter with respect to lighting frequency (except over the BOB and HIM). For radiances, the TCWV is the dominant factor in most regions (except over PI and WCI). The reasons for this were discussed in the previous section. Again, similar to the AS, AOD plays the most significant role in modulating both of the lightning properties over IGP due to the role of complex aerosol–cloud interactions.
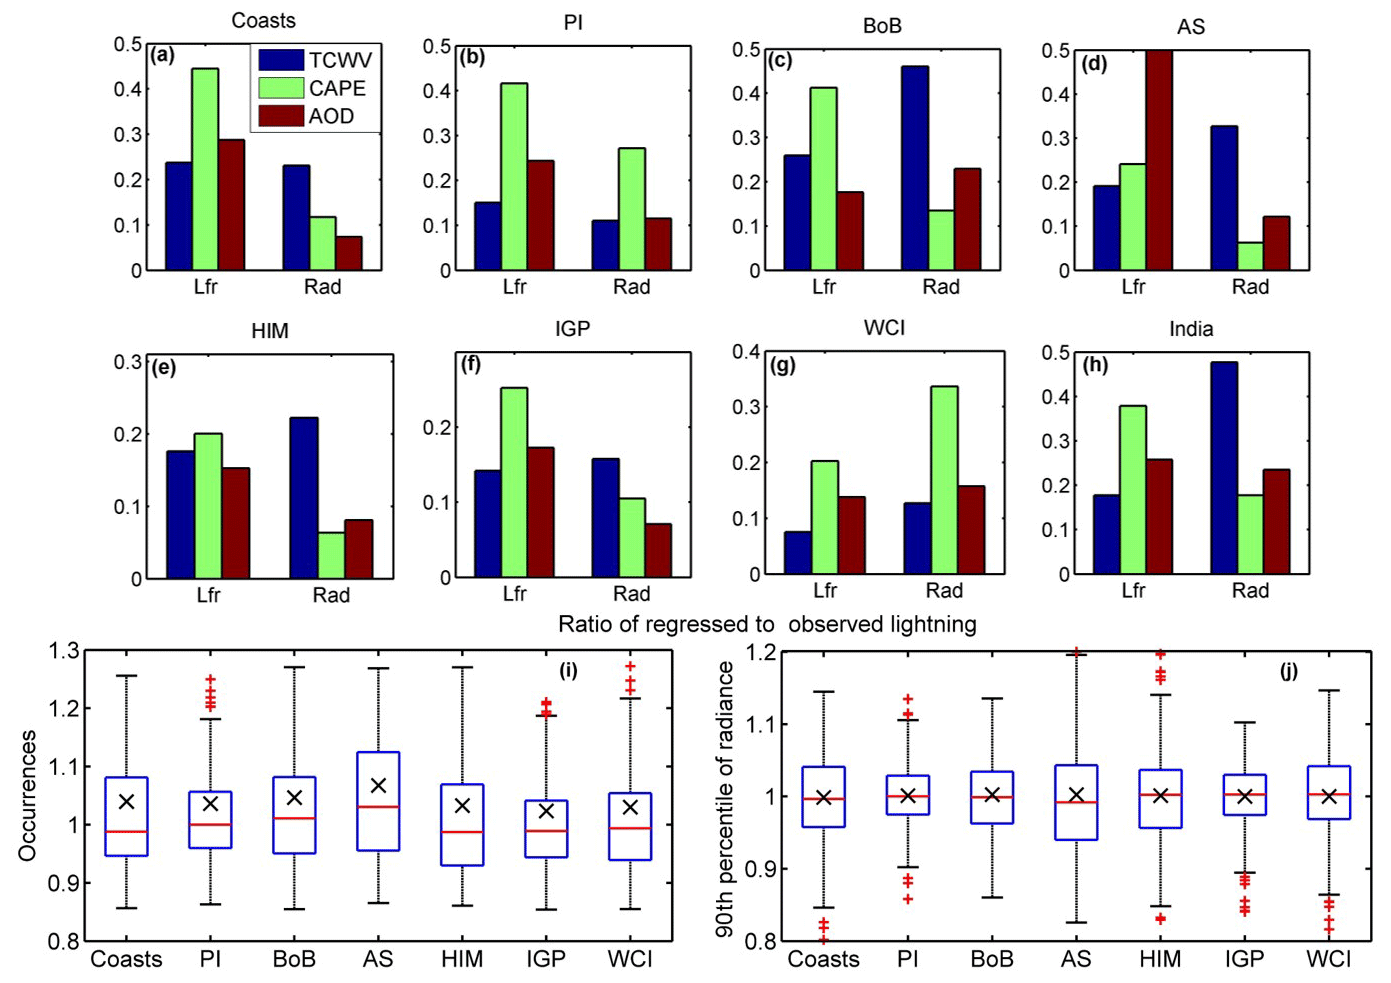
Figure 4Temporal dominance analysis MLR coefficients of TCWV, CAPE and AOD for lightning frequency and radiance over the (a) Coasts, (b) PI, (c) BoB, (d) AS, (e) HIM, (f) IGP, (g) WCI and (h) India-wide regions. (i, j) The zonal distribution of ratios between the regressed and observed lightning frequency (Lfr) and the 90th percentile of radiance (Radp90) over seven Indian regions.
Finally, over the India-wide region, TCWV arises as the dominant parameter controlling the climatic trends in radiances; however, for occurrence it is not that simple. Although CAPE is the principal factor with respect to occurrence, the relative contributions of AOD and TCWV cannot be neglected. Next, the applicability of the proposed MLR equations for long-term studies are validated by showing the ratio between the regressed and observed lightning properties (Fig. 4i, j). For occurrences, the ratio between the two is not perfect, and a small overestimation of ∼ 5 % is observed; hence, this bias has been corrected before using the data in the coming sections. The regressed values of radiance, in contrast, match perfectly with observations. Henceforth, these MLR equations have been utilized for deriving the long-term projections of lightning properties in the subsequent sections.
3.3 Physical mechanisms driving the increasing trends in lightning properties
In this section, the physical processes responsible for the increase in lightning occurrences and intensity over the Indian region will be discussed. Recent studies have shown a prominent increase in aerosols and greenhouse gas (GHG) emissions over the Coasts, IGP and WCI, as evidenced by the very strong increase in AOD in the recent years. This phenomenon resulted in widespread surface and atmospheric warming (Basha et al., 2017) and, consequently, stronger surface evaporation and moisture production. In addition, many recent research attempts have reported a net increase in the Hadley cell and Brewer–Dobson circulation strength (Liu et al., 2012; Fu et al., 2015), which also provide additional moisture supply. Consequently, the increased moisture in the atmosphere has further accelerated the warming effect and TCWV growth in the form of a positive feedback (IPCC TAR-07, 2001), primarily in the Coasts and neighboring sea regions like the BoB and AS. However, the increased moisture supply in IGP or PI is mainly due to the enhanced land–sea thermal contrast effect (due to GHG and aerosol emissions) which intensifies the moisture converges in these regions.
To explain how thermodynamic instability or CAPE has been increasing recently, the reader is referred to a previous study by Chakraborty et al. (2019) in which long-term multi-station radiosonde observations depicted strong increasing trends in CAPE and TCWV over the entire Indian region with the maximum values along the coasts and surrounding inland regions. However, out of the total column, the percentage trends in both instability and moisture integrals (CAPE or TCWV) are found to be particularly high above the 300 hPa pressure levels which can be associated with a gradually ascending level of neutral buoyancy (LNB/EL – level of neutral buoyancy/equilibrium level) during this period. As the EL comes very close to the 100 hPa level during intense convective events, an observed cooling in its immediate surroundings (135–95 hPa) is thought to be the main factor responsible for the EL ascent and CAPE increase in these regions. The main reason for considering this hypothesis is based on a study by Dhaka et al. (2010) in which a very prominent anticorrelation was observed between the yearly average values of CAPE and their corresponding upper-tropospheric temperatures at 100 hPa.
It has been well documented in past studies that ozone molecules act as the primary heat source component at the 100 hPa level (corresponding to the upper-troposphere–lower-stratosphere – UTLS – region) by absorbing ultraviolet radiation (Mohanakumar, 2008). The multi-station radiosonde observations from Chakraborty et al. (2019) depicted a clear rise in specific humidity and a decrease in ozone mixing ratios within the same height range. These results were analogous with the findings from Forster et al. (2007), who reported that the recent decades have experienced an upper-tropospheric cooling due to a decrease in ozone concentration. Thus, a cooling trend at this height level can be explained by the theory that excess moisture pumped to this height by intense convection becomes photolytically disassociated by reactive oxygen atoms to produce two OH radicals, which further decompose ozone to an oxygen molecule, and a reactive oxygen atom in the UTLS region (Guha et al., 2017), thereby continuing the process. Consequently, this feedback process would lead to a further ascent in EL and increase in CAPE; however, the magnitudes of the resultant CAPE intensification will be highest over the coasts and surrounding seas due to stronger moisture advection in those regions.
Thus, according to this hypothesis, the Coastal regions and seas experience more growth in TCWV and CAPE, leading to the formation of more ice-phase hydrometeors and, in turn, promoting an accelerated rise in lightning radiance. On the other hand, larger CAPE values favor higher updraft velocities in the ascending particles which further increase the probability of hydrometeor collisions, leading to an increased lightning frequency. However, an additional effect can also be cast by AOD via the facilitation of more CNN formation (from dust, sulfate or sea salt aerosols) which will strengthen the abovementioned physical mechanism, thereby leading to a stronger increase in both of the lightning properties over the aerosol-sensitive inland regions such as IGP, WCI and PI.
3.4 Generation of reliable future projections of lightning frequency and intensity
3.4.1 Selection of GCMs for future projection analysis
In this section, the MLR coefficients from the previous sections are employed to provide reliable projections of future lightning activity over the Indian region. Accordingly, the datasets of CAPE, AOD and TCWV are utilized over a period of 150 years: the first 55 years (1950–2005) from historical datasets and the rest (2006–2100) from two extreme future scenarios, namely RCP2.6 and RCP8.5. A set of eight global climate models (GCMs) from CMIP5 (depicted in Supplement Table S1) are selected for analysis, as all of them commonly provide the monthly mean estimates of TCWV and AOD with daily profiles of temperature, humidity and ozone. The monthly average values of CAPE are then calculated from daily T and RH profiles using the parcel approximation technique, as described in past studies (Chakraborty el al., 2018; Narendra Reddy et al., 2018). It may be noted that the surface-based CAPE (SB-CAPE) calculation technique has been used to obtain the current CAPE values in this study, as they measure the total buoyancy experienced by the parcel raised directly from the surface to any height in the atmosphere irrespective of the prevailing atmospheric conditions, seasonality or the region where it is being derived. The datasets from each of these models are interpolated to a uniform 1∘ × 1∘ resolution after which their performances are tested by comparing the simulated CAPE, TCWV and AOD values against the NCEP/NCAR Reanalysis datasets. The results of this test are represented using a Taylor diagram in Fig. 5.

Figure 5Taylor diagram representing the performance of the eight GCMs used in this study with respect to (a) TCWV, (b) CAPE and (c) AOD. (d, e) Covariation between regressed lightning properties from the model mean with respect to observations for average flash rate (km2 per month) and the 90th percentile of radiance (J m−2 steradian−1 s1).
The Taylor diagram results for TCWV, CAPE and AOD unanimously reveal that the ACCESS1.3, CSIRO MK3.6, MIROC5 and NOESM 1ME models (represented as A, B, F and H in Fig. 5) depict good correlations over the Indian region along with lower SD and rms values. In addition, the model-derived monthly inputs are also validated against NCEP data for all seven regions in Fig. S6. The correlation coefficients for all regions commonly show that the ACCESS1.3, CSIRO MK3.6, MIROC5 and NOESM 1ME models again display much better agreement with NCEP data. Hence, these four models are considered further for lightning projection analysis. The India-wide averaged regressed lightning occurrences and intensity values obtained from the models during the 2000–2014 period are then plotted against their corresponding observations to check the reliability of the MLR analysis on the modeled data. The results depict a fair agreement between the two sets (r= of 0.76 in occurrences and 0.7 in radiance) in both the cases. However, a very prominent underestimation bias has been observed (∼ 24 % in occurrences and ∼ 18 % in radiances) which is probably because the modeled datasets are of much coarser resolution than the actual observations; hence, they will always depict a much lower average or less variability compared with the former. However, the intercomparisons between the modeled and observed lightning properties over all of the regions commonly depict quite high correlation values with an overall underestimation bias of 17 %–25 %, thereby supporting the reliability of the MLR analysis. Nevertheless, the underestimation biases obtained from intercomparison tests must be added to the regressed climatic projections for both the zonal and India-wide cases to get the actual lightning trends in forthcoming sections.
3.4.2 Examination of the 150-year trends in various factors controlling lightning
The 150-year trends in various controlling factors associated with the climatic trends in lightning occurrences and intensity are shown in form of the normalized percentage change per decade for all seven Indian regions in Fig. S7. The surface temperature trends are first considered, as this parameter is closely associated with urbanization and GHG emissions, and it also acts as the primary driver behind the CAPE and TCWV trends. A moderate rise in RCP2.6 is observed (∼ 0.5 % per decade) which represents a total India-wide warming of ∼ 1.6 ∘C, whereas the RCP8.5 scenario exhibits an extremely severe warming of ∼ 5 ∘C in the Coasts, WCI, BoB and IGP regions which is also expected to cause a parallel increase in TCWV and CAPE in the future. In a similar fashion to surface warming trends, TCWV exhibits a moderate increase in the RCP2.6 scenario, but an alarming growth of ∼ 40 % is observed across India in RCP8.5 (with the largest increase noted in the Coasts, the BoB and the AS regions) that will definitely lead to a parallel huge change in extreme lightning radiances over the total span of 150 years.
In the case of AOD, contrary to the extremely large increase of ∼ 30 %–40 % between 2000 and 2014 from MODIS, a much smaller rise of only 20 % is seen during a much larger time span of 150 years. To understand the source of this discrepancy, the 150-year time series of AOD is observed. This time series reveals that the initially increasing trend in aerosols reverses to a strong negative trend after 2020, which results in an overall weak positive trend. The sudden decline in AOD can be explained by the fact that RCP2.6 scenarios are characterized by a stringent control on GHG emissions and aerosols after 2020. However, RCP8.5 scenarios exhibit a higher overall increasing trend amounting to 60 %. This improvement in the AOD trend from the latter case is due to the fact that the AOD value saturates after 2020 and then shows a weak negative trend, implying minor aerosol emission restrictions in the future; hence, the net cancellation of trends does not happen here. Moreover, the net increase in AOD is moderate in the Coasts but is much higher in aerosol-sensitive regions like IGP and WCI, even implying a doubling of AOD in these regions, which may again cast some vital influence on the lightning frequency trends in these regions in the future.
In accordance with the TCWV and temperature trends, CAPE and MLCAPE (mixed-layer CAPE) depict a respective 15 % and 8 % increase in total from RCP2.6 scenarios. Furthermore, the CAPE trends are much higher than in MLCAPE, indicating the validity of the upper-tropospheric intensification theory as explained earlier. Again, the trends in CAPE and MLCAPE are the highest over the Coasts and surrounding regions due to maximized moisture availability, as also shown in the previous studies. However, the RCP8.5 scenario shows alarmingly high total trends of ∼ 50 % and 20 % in CAPE and MLCAPE, respectively, due to intensified global warming and moisture availability, with the highest rise of ∼ 60 % over the Coasts and seas, implying the possibility of accelerated growth in lightning occurrence in these zones. However, inland regions (IGP and WCI) still show moderately high CAPE trends (due to strong surface heating and aerosol trends) which may also lead to stronger lightning frequencies there.
The trends in the EL pressure level show an expected depletion (implying an ascent in the EL) from the RCP2.6 scenario, with values between 0.5 % and 1 % per decade. However, in the RCP8.5 scenario, the trends are further enhanced with a range of 1 %–2 % per decade, with the largest changes occurring in the Coasts and BoB regions followed by IGP and WCI due to a stronger increase in CAPE and TCWV. Similarly, the temperature at 100 hPa (T100) cooling trends experience very similar behavior to the EL with ∼ 1∘ cooling in Coastal regions from the RCP2.6 scenario, whereas a drastic total cooling of up to ∼ 2 ∘C is observed in the RCP8.5 scenario that can highly invigorate the convective strength, leading to much stronger lightning events in the future. In the RCP2.6 scenario, the specific humidity (SHUM) at 100 hPa undergoes a ∼ 0.3 % increase per decade associated with a 1 % decrease in ozone. Here, it may be noted that the ozone depletion trends are only much higher than in SHUM because the photolytic disassociation of a single water vapor molecule with reactive oxygen atom produces two OH radicals which help in the decomposition of two ozone molecules. However, using the RCP8.5 scenario, this phenomena is further amplified where a −0.6 % per decade increase in SHUM and a (−2 %) depletion in ozone are observed, with the highest magnitudes noted in the Coasts. Hence, the results suggest that CAPE and TCWV will both increase under higher surface warming (RCP8.5) scenarios, as shown in Sect. 3.3, which ultimately results in a very strong increase in lightning properties over India.
Coexistent with the zonal decadal trends, the India-wide time series of all parameters are shown in Fig. 6. The surface temperatures depict an increase of 2 and 4 ∘C, while the TCWV and CAPE also rise by 10 % and 50 % and by 20 % and 40 %, respectively, for the two pathways. However, it may be noted that the main difference in TCWV trends between the RCP2.6 and RCP8.5 scenarios mainly arises from its drastic increase in the latter case after 2050, which is again attributed to the accelerated global warming conditions experienced using RCP8.5 scenarios during those decades. The AOD follows a dampened increasing trend in both scenarios with the increase in latter being slightly more prominent than the former. These dampened AOD trends are expected to reduce the net growth in lightning occurrences (owing to the prominent AOD contribution in the lightning frequency MLR coefficients), but such effects will not be discernible in the radiance trends as they primarily depend on TCWV. Now, due to the CAPE and TCWV trends, the EL has shown a prominent ascent coupled with strong UTLS cooling and increased moistening and ozone depletion trends in both urbanization scenarios. However, the trends in the RCP8.5 scenario are consistently much stronger than in the RCP2.6 case due to much stronger GHG-induced UTLS dynamics and the CAPE intensification feedback effect. In addition, the main difference between the trends from both scenarios is mostly prominent towards the end of 21st century, as explained previously.

Figure 6The 150-year multi-model India-wide average projections of various parameters using the RCP2.6 (blue) and RCP8.5 (red) scenarios for (a) the 2 m temperature, (b) TCWV, (c) AOD, (d) CAPE, (e) MLCAPE, (f) EL, (g) the temperature at 100 hPa, (h) the specific humidity and (i) the ozone mixing ratio at the same level. Legends indicate the 5-yearly linear significant trends in these parameters.
3.4.3 Expected overall trends in lightning frequency and intensity
The 150-year trends in lightning properties for all seven Indian zones are observed in Fig. S7. The lightning occurrences depict an overall increasing trend of ∼ 15 %–25 % for the total 150-year span which, after adjustment for underestimation bias (20 %–27 % as in Fig. S6), provides an actual trend of 19 %–31 %. However, this increase in lightning occurrence is rather low compared with the 17-year trends from observations. Hence, the lightning frequency time series for each zone is investigated separately. This investigation reveals that the lightning frequency increased until 2020 after which it became saturated; nevertheless, after 2050, it again started to increase up until 2100, thereby leading to much lower trend values (Fig. 6). This type of variation can be explained by the secondary influence of AOD on lightning occurrences which also shows a dampened increase, thereby compensating for the impact of increasing CAPE. In addition, among all of the areas, the strongest increase in lightning frequency is mainly observed in the Coasts, BoB, PI, IGP and WCI regions; this is primarily due to the influence of CAPE and the moisture supply in the first two areas and due to dry surface heating and the aerosol effect in the other regions. However, in the RCP8.5 scenarios, much larger trend values of 29 %–41 % are observed (after bias correction), which are mainly attributed to the stronger increase in CAPE and TCWV and the weaker decline in AOD in this case. However, the spatial distribution of the trends remains similar to the RCP2.6 case.
The 150-year zonal trends in lightning radiance from the RCP2.6 scenarios depict a prominent overall increasing trend of 35 %–54 % after zone-specific bias corrections. Here, the radiance trends are found to be much higher than those for occurrences, as the lightning radiance trends primarily depend on TCWV which also shows a prominent increase across the 150-year time span. However, the net radiances are still a bit lower than the expected trends from observations due to the small declining trend contribution from aerosols. Nevertheless, the RCP8.5 scenario depicts a very alarming increase of 56 %–97 % (after bias correction) that can be attributed to the stronger increase in both TCWV and CAPE, throughout the 150 years, coupled with a weaker decline in AOD. In addition, the lightning radiance trends are found to be the strongest in the Coasts and BoB regions, due to the accelerated rise in TCWV and CAPE, whereas a slightly weaker trend is observed over IGP and WCI, due to the compensating influence of AOD in addition to the TCWV and CAPE trends.
In a similar fashion to the zonal decadal lightning trends, the India-wide averaged time series of lightning occurrences and intensity are depicted in Fig. 7. The lightning occurrences from the RCP2.6 scenarios depict a weak increasing trend amounting to 26 % (after bias correction of 24 %) over the 150-year time span. As already explained, the weak trend observed is due to the cancellation effect between increasing trends of CAPE and TCWV against a declining trend in AOD. However, in the RCP8.5 scenario, a considerable increase in lightning frequency amounting to 35 % is observed, which is mainly due to a strong rise in CAPE and TCWV along with a weaker decline in AOD. For extreme radiances, the RCP2.6 scenario shows a moderate rise of ∼ 45 % throughout India (after a bias correction of 18 %). However, the RCP8.5 scenario depicts a much higher increase of ∼ 73 % due to the much stronger rise in TCWV and CAPE, followed by a minimal contribution from AOD. In addition, an exponential rise in both TCWV and CAPE are observed after 2060 because of excessive GHG-emission-induced global warming, thereby leading to the highest increase in lightning radiance over India after 2060.

Figure 7The 150-year multi-model, India-wide average projections of (a) lightning occurrences and (b) the 90th percentile radiance using the RCP2.6 and RCP8.5 scenarios. (c, d) The zonal distribution of trends in lightning occurrence and intensity between the present decade (2011–2020) and 2091–2100. Legends in the top panels indicate the 5-yearly linear and significant trends in these parameters.
Finally, an attempt is made to estimate the net percentage increase in lightning properties starting from the present (2010–2020) in order to describe the probable difference in lightning trends if two extreme GHG emission policies are adopted. Under these circumstances, the lightning frequencies depict a weak rise of ∼ 13 % assuming the RCP2.6 scenario, but this trend would increase to ∼ 19 % if the RCP8.5 scenario was adopted; in the Coasts region, the trends may be slightly higher, reaching a maximum of ∼ 22 % for the latter scenario. Nevertheless, these trend values are smaller and can, thus, be avoided quite easily in the future. For extreme radiance, however, the minimum possible increase considering stringent policy-making decisions from the RCP2.6 scenario is ∼ 22 % throughout India. But in the absence of such restrictions (RCP8.5) the overall increase in extreme radiance will be ∼ 37 % with respect to present. In addition, due to the impact of stronger TCWV and CAPE trends, the Coastal regions could even face up to a ∼ 50 % rise in extreme lightning intensities by 2100, which poses an extreme socioeconomic threat and, thus, requires immediate mitigation strategies from policymakers.
Lightning activity is considered an essential by-product of thunderstorms, and it has been responsible for significant loss of life every year for the last few decades. However, only a few studies have been reported over India or globally that have attempted to understand the general evolution and distribution of lightning processes and, thus, provide a reliable estimate of the future projections of lightning. Hence, the present study, attempts to utilize high-resolution lightning observations to explain its spatiotemporal variability over India and also to identify the most dominant factors responsible for the evolution of such extremes. In addition, the proposed interrelationships between lightning and its causative factors, namely moisture, instability and aerosols, are also implemented in multi-model GCM datasets to derive reliable future projections of lightning properties over the Indian regions for the 21st century. The main highlights obtained from the present study are outlined in the following.
The highest climatological average of lightning occurrences is observed along the Himalayan foothills, followed by the Coasts and the Indo-Gangetic Plain; this distribution is mainly attributed to the influence of orographic convection, moisture ingress (due to land–sea thermal contrast) and aerosol–cloud interactions.
Annual average values of lightning radiances are the strongest along the coastal regions and surrounding seas, which is primarily due to the dominance of hydrometeor concentrations on the lightning charge density equations caused by enhanced moisture availability in those regions.
During the period from 1998 to 2014, lightning frequencies exhibit a strong growth of ∼ 1 %–2 % annually across all Indian regions with a strong interregional variability. However, the trend values are invariant and lower in the average radiance trends. Therefore, the trends in 90th percentile radiances are estimated which show prominent spatial variation with a 2 %–2.5 % increase annually along the Coasts, BOB, PI and IGP regions. This zonal diversity in the lightning trends is also supported by the corresponding CAPE and AOD trends.
The clustering and multilinear regression dominance tests depict that atmospheric moisture (TCWV) is the principle factor controlling the lightning extreme radiance trends over India as a whole, while instability (CAPE) and aerosols (AOD) jointly play a strong role in the lightning frequency variation. However, in the latter, the proposed interrelationships are found to deviate from region to region due to complex aerosol–cloud interactions with thunderstorm genesis and lightning evolution.
Results from previous research attempts are employed to explain the underlying physical mechanism of these trends which inferred that an increase in surface temperatures has led to higher instability and moisture transport to the UTLS region. This moistening resulted in ozone depletion and cooling which further uplifted the equilibrium levels, leading to stronger CAPE and more ice-phase collisions above the freezing level; eventually this complex feedback procedure ultimately leads to stronger and more frequent lightning events. A schematic of these processes is depicted in Fig. 8.
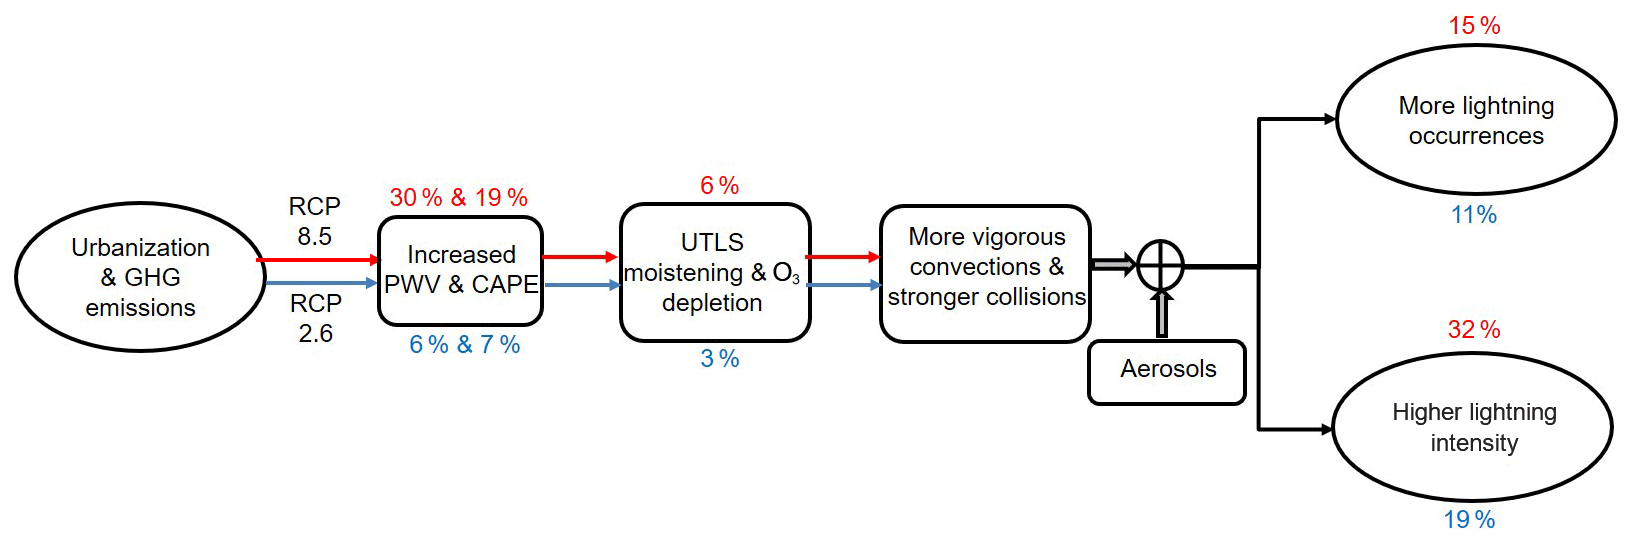
Figure 8Proposed hypothesis to explain the long-term growth in lightning properties over the Indian region between the present (2016–2020) and the distant future (2096–2100) assuming the RCP2.6 and RCP8.5 scenarios shown in blue and red, respectively.
The abovementioned hypothesis is found to be most prominent in the coasts and surrounding seas due to its high moisture abundance. However, in addition to these factors, this mechanism will also be further invigorated/inhibited based on the prevailing RCP scenarios and also depending on the region-specific aerosol input on convective processes, as discussed before.
These observed interrelationships are expressed as multilinear regression equations and then implemented on four suitable GCMs from the eight available models for the 1950–2100 period. The resulting multidecadal projections reveal prominent trends in surface temperatures, moisture, instability, and subsequent ozone and moisture concentrations in the UTLS, as proposed. However, a difference in urbanization rates led to much sharper trends in all parameters, particularly after 2050 in the RCP8.5 case.
Consequently, the regressed lightning projections also depict an increase in both occurrences and intensity. However, the increasing trends are consistently higher in the RCP8.5 case. In addition, the increase in lightning frequency is found to be much slower than that for the intensities due to the dominant impact of AOD trends, which also show a comparative saturation or decrease after 2020. This can be attributed to a probable increase in GHG emission restrictions by policymakers in the near future.
Finally, the net intensification in lightning properties by 2100 with respect to present values infers that the number of occurrences would increase moderately by 10 %–17 % and 16 %–23 % for the RCP2.6 and RCP8.5 scenarios, respectively. However, extreme lightning radiances will increase much faster – by 16 %–27 % and 32 %–50 % in the RCP2.6 and RCP8.5 scenarios, respectively – throughout India.
In addition to the overall trends, certain regions like the coasts and surrounding seas are prone to be at higher risk of lightning in the future, as they show much stronger increasing trends of ∼ 50 % (for radiance) in the absence of stringent GHG emission restrictions (as in the RCP8.5 scenario). This is extremely alarming and, hence, should be immediately addressed by policymakers.
It may be noted that this is the first ever study to use high-resolution observations of lightning radiance and lightning frequency over the Indian region, and a holistic interrelation between lightning and its causative factors has been proposed, tested and then implemented over a set of GCMs so as to provide a set of future projections for both lightning properties until the end of this century. The lightning projections laid out in this study can be considered as reliable for forthcoming research attempts as both the equations and the models have been repeatedly validated against observational datasets. Nevertheless, the projected lightning increase due to global warming in this study is found to be much lower than that obtained by simultaneous studies over the USA (as evidenced by Romps, 2019); this could possibly be attributed to either stronger urbanization conditions in those regions or the choice of lightning proxies and GCM datasets used in that study.
However, from a closer point of view, the present study still has certain shortcomings. The primary limitation is that it tries to provide an overall explanation for lightning trends over the whole Indian region. Nevertheless, for specific regions of the country, such as WCI, HIM or IGP, secondary mechanisms from orographic influence or aerosol effects (both radiative or microphysical) can also play a stronger role in the lightning trends; hence, another dedicated study is required to address these issues. Secondly, the observed trends may also vary strongly across all the seasons; thus, a further detailed investigation on the seasonality of lightning properties has been avoided here to provide a more focused investigation on the climatic trends in lightning. Finally, this study provides an overall mechanism of lightning; however, this procedure may not be followed for all types of thunderstorm events. Thus, in the future, a suite of numerical models and observations are required to explain how individual lightning events may be impacted by the complex aerosol, instability and moisture interactions within clouds over various meteorological conditions and Indian locations.
High-resolution lightning datasets for the present study have been obtained from LIS archives of the NASA Global Hydrology Resource Center DAAC, USA (https://ghrc.nsstc.nasa.gov/lightning/data/data_lis_trmm.html, GHRC DAAC, 2020). Gridded datasets of CAPE and TCWV are utilized from the CFSR reanalysis archives developed by NCEP (https://psl.noaa.gov/data/gridded/data.ncep.reanalysis.html; NOAA, ESRL, 2021). The AOD datasets are utilized from the Level-3 (L3) MODIS Terra Atmosphere Monthly Global Product MOD08_M3 (https://ladsweb.modaps.eosdis.nasa.gov/archive/allData/61/MOD08_M3/; Level-1 and Atmosphere Archive & Distribution System Distributed Active Archive Center, 2021). Finally, the future projections of lightning properties are derived from 11 general circulation models (GCMs) in the Coupled Model Intercomparison Project (CMIP5) archive (website: https://esgf-node.llnl.gov/search/cmip5/; Department of Energy, Lawrence Livermore National Laboratory, 2021).
The supplement related to this article is available online at: https://doi.org/10.5194/acp-21-11161-2021-supplement.
RC performed the complete analysis and wrote the first draft of the paper. MVR and SGB provided the initial concept and were primarily responsible for editing the paper. AC contributed to supervision, discussion and editing the paper.
The authors declare that they have no conflict of interest.
Publisher’s note: Copernicus Publications remains neutral with regard to jurisdictional claims in published maps and institutional affiliations.
Rohit Chakraborty is grateful to the Institute of Eminence Grant scheme and the Ministry of Science and Technology, Government of India, for providing support in the form of a CV Raman Post-Doc Fellowship and INSPIRE faculty research grant (registration no. DST/INSPIRE/04/2019/002096 and INSPIRE faculty code IFA19-EAS79). He also acknowledges the Indian Institute of Science for providing necessary support for this work. Arindam Chakraborty acknowledges funding from the National Monsoon Mission, Ministry of Earth Sciences, Government of India.
This paper was edited by Zhanqing Li and reviewed by three anonymous referees.
Banerjee, A., Archibald, A. T., Maycock, A. C., Telford, P., Abraham, N. L., Yang, X., Braesicke, P., and Pyle, J. A.: Lightning NOx, a key chemistry–climate interaction: impacts of future climate change and consequences for tropospheric oxidising capacity, Atmos. Chem. Phys., 14, 9871–9881, https://doi.org/10.5194/acp-14-9871-2014, 2014.
Barros, A. P. and Lang, T. J.: Exploring spatial modes of variability of terrain-atmosphere interactions in the Himalayas during monsoon onset, Hydrosci. Rep. Ser. 03–001, 51, Div. of Eng. and Appl. Sci., Harvard Univ., Cambridge, Mass., 2003.
Basha, G., Kishore, P., Ratnam, M. V., Jayaraman, A., Kouchak, A. A., Ouarda, T. B. M. J., and Velicogna, I.: Historical and Projected Surface Temperature over India during 20th and 21st century, Sci. Rep.-UK, 7, 2987, https://doi.org/10.1038/s41598-017-02130-3, 2017.
Boccippio, D. J., Koshak, W. K., and Blakeslee, R. J.: Performance assessment of optical transient detector and lightning imaging sensor, part I: diurnal variability, J. Atmos. Ocean. Tech., 19, 1318–1332, 2002.
Boeck, W. L., Mach, D., Goodman, S. J., and Christian Jr., H. J.: Optical observations of lightning in Northern India, Himalayan mountain countries and Tibet, in 11th International Conference on Atmospheric Electricity, NASA Conf. Publ., NASA/CP-1999-209261, 420–423, 1999.
Boose, Y., Baloh, P., Plötze, M., Ofner, J., Grothe, H., Sierau, B., Lohmann, U., and Kanji, Z. A.: Heterogeneous ice nucleation on dust particles sourced from nine deserts worldwide – Part 2: Deposition nucleation and condensation freezing, Atmos. Chem. Phys., 19, 1059–1076, https://doi.org/10.5194/acp-19-1059-2019, 2019.
Chakraborty, R., Basha, G., and Ratnam, M. V.: Diurnal and long-term variation of instability indices over tropical region in India, Atmos. Res., 207, 145–154, https://doi.org/10.1016/j.atmosres.2018.03.012, 2018.
Chakraborty, R., Venkat Ratnam, M., and Basha, S. G.: Long-term trends of instability and associated parameters over the Indian region obtained using a radiosonde network, Atmos. Chem. Phys., 19, 3687–3705, https://doi.org/10.5194/acp-19-3687-2019, 2019.
Christian, H. J., Blakeslee, R. J., Boccippio, D. J., Boeck, W. J., Buechler, D. E., Driscoll, K. T., Goodman, S. J., Hall, J. M., Koshak, W. J., Mach, D. M., and Stewart, M. F.: Global frequency and distribution of lightning observed from space optical transient detector, J. Geophys. Res., 108, 4005, https://doi.org/10.1029/2002JD002347, 2003.
Danielson, J. J. and Gesch, D. B.: Global multi-resolution terrain elevation data 2010 (GMTED2010): U.S. Geological Survey Open-File Report 2011-1073, 26 pp., 2011.
de Leeuw, G., Andreas, E. L., Anguelova, M. D., Fairall, C. W., Lewis, E. R., O'Dowd, C., Schulz, M., and Schwartz, S. E: Production flux of sea spray aerosol, Rev. Geophys., 49, RG2001, https://doi.org/10.1029/2010RG000349, 2011.
Department of Energy, Lawrence Livermore National Laboratory: Coupled Model Intercomparison Project Version5, available at: https://esgf-node.llnl.gov/search/cmip5/, last access: 16 July 2021.
Dewan, A., Ongee, E. T., Rafiuddin, M., Rahman, M. M., and Mahmood, R.: Lightning activity associated precipitation and CAPE over Bangladesh, Int. J. Climatol., 38, 1649–1660, https://doi.org/10.1002/joc.5286, 2018.
Dhaka, S. K., Sapra, R., Panwar, V., Goel, A., Bhatnagar, R., and Kaur, M.: Influence of large-scale variations in convective available potential energy (CAPE) and solar cycle over temperature in tropopause region at Delhi (28.3_N, 77.1_E), Kolkata (22.3_N, 88.2_E), Cochin (10_N, 77_E), and Trivandrum (8.5_N, 77.0_E) using radiosonde during 1980–2005, Earth Planets Space, 62, 319–331, 2010.
Diffenbaugh, N. S., Scherer, M., and Trapp, R. J.: Robust increases in severe thunderstorm environments due to greenhouse forcing, P. Natl. Acad. Sci. USA, 110, 16361–16366, 2013.
Forster, P. M., Bodeker, G., Schofield, R., Solomon, S., and Thompson, D.: Effects of ozone cooling in the tropical lower stratosphere and upper troposphere, Geophys. Res. Lett., 34, L23813, https://doi.org/10.1029/2007GL031994, 2007.
Fu, Q., Lin, P., Solomon, S., and Hartmann, D. L.: Observational evidence of strengthening of the Brewer-Dobson circulation since 1980, J. Geophys. Res.-Atmos., 120, 10214–10228, 2015.
Gadgil, S., Joseph, P. V., and Joshi, P. V.: Ocean–atmosphere coupling over monsoon regions, Nature, 312, 141–143, 1984.
Galanaki, E., Kotroni, V., Lagouvardos, K., and Argiriou, A.: A ten-year analysis of cloud-to-ground lightning activity over Eastern Mediterranean region, Atmos. Res., 166, 213–222, 2015.
GHRC DAAC: TRMM Lightning Image Sensor observation dataset, available at: https://ghrc.nsstc.nasa.gov/lightning/data/data_lis_trmm.html, last access: 16 December 2020.
Guha, B. K., Chakraborty, R., Saha, U., and Maitra, A.: Tropopause height characteristics with ozone over stratospheric moistening during intense convection over Indian sub-continent, Global Planet. Change, 158, 1–12, 2017.
Holle, R. L., Dewan, A., Said, R., Brooks, W. A., Hossain, M. F., and Rafiuddin, M.: Fatalities related to lightning occurrence and agriculture in Bangladesh, Int. J. Disast. Risk Re., 41, 101264, https://doi.org/10.1016/j.ijdrr.2019.101264, 2019.
IPCC TAR-07: Climate Change 2001: The Scientific Basis, https://www.ipcc.ch/site/assets/uploads/2018/03/TAR-07.pdf (last access: 16 July 2021), Cambridge University Press, 2018.
Jin, Q., Grandey, B. S., Rothenberg, D., Avramov, A., and Wang, C.: Impacts on cloud radiative effects induced by coexisting aerosols converted from international shipping and maritime DMS emissions, Atmos. Chem. Phys., 18, 16793–16808, https://doi.org/10.5194/acp-18-16793-2018, 2018.
Kalnay, E., Kanamitsu, M., Kistler, R., Collins, W., Deaven, D., Gandin, L., Iredell, M., Saha, S., White, G., Woollen, J., Zhu, Y., Leetmaa, A., Reynolds, B., Chelliah, M., Ebisuzaki, W., Higgins, W., Janowiak, J., Mo, K. C., Ropelewski, C., Wang, J., Roy, J., and Dennis, J.: The NCEP/NCAR 40-Year Reanalysis Project, B. Am. Meteorol. Soc., 77, 437–472, 1996.
Kandalgaonkar, S. S., Tinmaker, M. I. R., Kulkarni, J. R., Nath, A. S., and Kulkarni, M. K.: Spatio-temporal variability of lightning activity over the Indian region, J. Geophys. Res., 110, https://doi.org/10.1029/2004JD005631, D11108, 2005.
Kar, S. K., Liou, Y. A., and Ha, K. J,: Aerosol effects on the enhancement of cloud-to-ground lightning over major urban areas of South Korea, Atmos. Res., 92, 80–87, 2009.
Kumar, P. R. and Kamra, A. K.: Land–sea contrast in lightning activity over the sea and peninsular regions of South/Southeast Asia, Atmos. Res., 118, 52–67, 2012.
Level-1 and Atmosphere Archive & Distribution System Distributed Active Archive Center: Level-3 MODIS Atmosphere Monthly Global Product, available at: https://ladsweb.modaps.eosdis.nasa.gov/archive/allData/61/MOD08_M3/ last access: 16 July 2021.
Liu, J., Song, M., Hu, Y., and Ren, X.: Changes in the strength and width of the Hadley Circulation since 1871, Clim. Past, 8, 1169–1175, https://doi.org/10.5194/cp-8-1169-2012, 2012.
Livemint: Lightning's a bigger killer in India than you think, available at: https://www.livemint.com/Politics/ZhfsGYczjwDo22DtvdDKfN/Lightnings-a-bigger-killer-than-you-think.html, last access: 19 September 2020.
Mansell, E. R. and Ziegler, C. L.: Aerosol effects on simulated storm electrification and precipitation in moment microphysics model, J. Atmos. Sci., 70, 2032–2050, 2013.
Massie, S. T., Torres, O., and Smith, S. J.: Total Ozone Mapping Spectrometer (TOMS) observations of increases in Asian aerosol in winter from 1979 to 2000, J. Geophys. Res., 109, D18211, https://doi.org/10.1029/2004JD004620, 2004.
Michalon, N., Nassif, A., Saouri, T., Royer, J. F., and Pontikis, C. A.: Contribution to the climatological study of lightning, Geophys. Res. Lett., 26, 3097–3100, 1999.
Mohanakumar, K.: Stratosphere-troposphere interactions: introduction, Springer Science Business Media, the Netherlands, 416 pp., https://doi.org/10.1007/978-1-4020-8217-7, 2008.
Murugavel, P., Pawar, S. D., and Gopalakrishnan, V.: Trends of convective available potential energy over the Indian region and its effect on rainfall, Int. J. Climatol., 32, 1362–1372, 2012.
Narendra Reddy, N., Venkat Ratnam, M., Basha, G., and Ravikiran, V.: Cloud vertical structure over a tropical station obtained using long-term high-resolution radiosonde measurements, Atmos. Chem. Phys., 18, 11709–11727, https://doi.org/10.5194/acp-18-11709-2018, 2018.
NOAA, ESRL: National Centers for Environmental Prediction (NCEP) and National Center for Atmospheric Research (NCAR) Reanalysis Product, hosted by NOAA, ESRL, USA since 1994, available at: https://psl.noaa.gov/data/gridded/data.ncep.reanalysis.html, last access: 16 July 2021.
Pereira, F. B., Priyadarsini, G., and Girish, T. E.: A possible relationship between global warming and lightning activity India during period 1998–2009, [preprint] arXiv, arXiv:1012.3338 (last access: 17 July 2021), 2010.
Pielke, R. A.: A three-dimensional numerical model of the sea breezes over south Florida, Mon. Weather Rev., 102, 115–139, 1974.
Platnick, S., King, M., Meyer, K. G., Wind, G., Amarasinghe, N., Marchant, B., Arnold, G. T., Zhang, Z., Hubanks, P. A., Ridgway, B., and Riedi, J.: MODIS Atmosphere L3 Monthly Product, NASA MODIS Adaptive Processing System, Goddard Space Flight Center, USA, Vol. 20, 2015.
Prein, A. F., Rasmussen, R. M., Ikeda, K., Liu, C., Clark, M. P., and Holland, G. J.: Future intensification of hourly precipitation extremes, Nat. Clim. Change, 7, 48–52, 2017.
Price, C.: Will drier climate result in lightning?, Atmos. Res., 91, 479–484, 2009.
Price, C. and Federmesser, B.: Lightning-rainfall relationships in Mediterranean winter thunderstorms, Geophys. Res. Lett., 33, L07813, https://doi.org/10.1029/2005GL024794, 2006.
Riemann-Campe, K., Fraedrich, K., and Lunkeit, F.: A global climatology of convective available potential energy (CAPE) and convective inhibition (CIN) in ERA-40 reanalysis, Atmos. Res., 93, 534–545, 2009.
Romps, D. M.: Evaluating the future of lightning in cloud-resolving models, Geophys. Res. Lett., 46, 14863–14871, https://doi.org/10.1029/2019GL085748, 2019.
Romps, D. M., Seeley, J. T., Vollaro, D., and Molinari, J.: Projected increase in lightning strikes in the United States due to global warming, Science, 346, 6211, https://doi.org/10.1126/science.1259100, 2014.
Saha, U., Siingh, D., Kamra, A. K., Galanaki, E., Maitra, A., Singh, R. P., Singh, A. K., Chakraborty, S., and Singh, R.: On the association of lightning activity and projected change in climate over the Indian sub-continent, Atmos. Res., 183, 173–190, 2017.
Shi, Z., Tana, Y. B., Tang, H. Q., Sunc, J., Yanga, Y., Penga, L., and Guo, X. F.: Aerosol effect on land-ocean contrast in thunderstorm electrification and lightning frequency, Atmos. Res., 164–165, 131–141, 2015.
Shi, Z., Tan, Y. B., Liu, Y., Liu, J., Lin, X., Wang, M., and Luan, J.: Effects of relative humidity on electrification and lightning discharges in thunderstorms, Terr. Atmos. Ocean. Sci., 29, 695–708, https://doi.org/10.3319/TAO.2018.09.06.01, 2018.
Shi, Z., Wang, H. C., Tan, Y. B., Li, L. Y., and Li, C. S.: Influence of aerosols on lightning activities in central eastern China, Atmos. Sci. Lett., 21, e957, https://doi.org/10.1002/asl.957, 2020.
Shindell, D. T., Faluvegi, G., Unger, N., Aguilar, E., Schmidt, G. A., Koch, D. M., Bauer, S. E., and Miller, R. L.: Simulations of preindustrial, present-day, and 2100 conditions in the NASA GISS composition and climate model G-PUCCINI, Atmos. Chem. Phys., 6, 4427–4459, https://doi.org/10.5194/acp-6-4427-2006, 2006.
Siingh, D., Singh, R. P., Singh, A. K., Kulkarni, M. N., Gautam, A. S., and Singh, A. K.:. Solar activity, lightning and climate, Surv. Geophys., 32, 659–703, 2011.
Takahashi, T.: Riming electrification as a charge separation mechanism in thunderstorms, J. Atmos. Sci., 35, 1536–1548, 1978.
Talukdar, S., Venkat Ratnam, M., Ravikiran, V., and Chakraborty, R.: Influence of black carbon on atmospheric instability, J. Geophys. Res.-Atmos., 124, 5539–5554, 2019.
Taylor, K. E., Stouffer, R. J., and Meehl, G. A.: An Overview of CMIP5 and Experiment Design, B. Am. Meteorol. Soc., 93, 485–498, 2012.
Twomey, S. A., Piepgrass, M., and Wolfe, T. L.: An assessment of the impact of pollution on global cloud albedo, Tellus, 36, 356–366, 1984.
Uman, M.: All About Lightning chap. 8, Dover Publication Inc, p. 68, 1986.
van den Heever, S. C. and Cotton, W. R.: Urban aerosol impacts on downwind convective storms, J. Appl. Meteorol. Clim., 46, 828–850, 2007.
Washington Post: Lightning strikes kill nearly 120 in India, available at: https://www.washingtonpost.com/world/lightning-strikes-kill-more-than-100-in-india/2020/06/26/4c010886-b71c-11ea-9a1d-d3db1cbe07ce_story.html, last access: 19 September 2020.
Williams, E. and Stanfill, S.: The physical origin of the land–ocean contrast in lightning activity, C. R. Phys., 3, 1277–1292, 2002.