the Creative Commons Attribution 4.0 License.
the Creative Commons Attribution 4.0 License.
 | 22 Jul 2020
Aerosol radiative effects and feedbacks on boundary layer meteorology and PM2.5 chemical components during winter haze events over the Beijing-Tianjin-Hebei region
Jiawei Li
Yunfei Wu
Zhe Xiong
Xiangao Xia
Jie Li
Lin Liang
Renjian Zhang
An online coupled regional climate–chemistry–aerosol model (RIEMS-Chem) was developed and utilized to investigate the mechanisms of haze formation and evolution and aerosol radiative feedback during winter haze episodes in February–March 2014 over the Beijing-Tianjin-Hebei (BTH) region in China. Model comparison against a variety of observations demonstrated a good ability of RIEMS-Chem in reproducing meteorological variables, planetary boundary layer (PBL) heights, PM2.5, and its chemical components, as well as aerosol optical properties. The model performances were remarkably improved for both meteorology and chemistry by taking aerosol radiative feedback into account. The domain-average aerosol radiative effects (AREs) were estimated to be −57 W m−2 at the surface, 25 W m−2 in the atmosphere, and −32 W m−2 at the top of atmosphere (TOA) during a severe haze episode (20–26 February), with the maximum hourly surface ARE reaching −384 W m−2 in southern Hebei province. The average feedback-induced changes in 2 m air temperature (T2), 10 m wind speed (WS10), 2 m relative humidity (RH2), and PBL height over the BTH region during the haze episode were −1.8 ∘C, −0.5 m s−1, 10.0 %, and −184 m, respectively. The BTH average changes in PM2.5 concentration due to the feedback were estimated to be 20.0 µg m−3 (29 %) and 45.1 µg m−3 (39 %) for the entire period and the severe haze episode, respectively, which demonstrated a significant impact of aerosol radiative feedback on haze formation. The relative changes in secondary aerosols were larger than those in primary aerosols due to enhanced chemical reactions by aerosol feedback. The feedback-induced absolute change in PM2.5 concentrations was largest in the haze persistence stage, followed by those in the growth stage and dissipating stage. Process analyses on haze events in Beijing revealed that local emission, chemical reaction, and regional transport mainly contributed to haze formation in the growth stage, whereas vertical processes (diffusion, advection, and dry deposition) were major processes for PM2.5 removals. Chemical processes and local emissions dominated the increase in PM2.5 concentrations during the severe haze episode, whereas horizontal advection contributed to the PM2.5 increase with a similar magnitude to local emissions and chemical processes during a moderate haze episode on 1–4 March. The contributions from physical and chemical processes to the feedback-induced changes in PM2.5 and its major components were explored and quantified through process analyses. For the severe haze episode, the increase in the change rate of PM2.5 (9.5 µg m−3 h−1) induced by the feedback in the growth stage was attributed to the larger contribution from chemical processes (7.3 µg m−3 h−1) than that from physical processes (2.2 µg m−3 h−1), whereas, during the moderate haze episode, the increase in the PM2.5 change rate (2.4 µg m−3 h−1) in the growth stage was contributed more significantly by physical processes (1.4 µg m−3 h−1) than by chemical processes (1.0 µg m−3 h−1). In general, the aerosol–radiation feedback increased the accumulation rate of aerosols in the growth stage through weakening vertical diffusion, promoting chemical reactions, and/or enhancing horizontal advection. It enhanced the removal rate through increasing vertical diffusion and vertical advection in the dissipation stage, and had little effect on the change rate of PM2.5 in the persistence stage.
- Article
(13600 KB) - Full-text XML
-
Supplement
(1035 KB) - BibTeX
- EndNote


Aerosols affect radiation transfer by scattering or absorbing solar and infrared radiation, by acting as cloud condensation nuclei (CCN) to modify cloud properties, and by heating the atmosphere to alter cloud formation, termed as the aerosol direct radiative effect, indirect effect, and semi-direct effect, respectively (Twomey, 1974; Albrecht, 1989; Ramanathan et al., 2001). In addition, there exists a set of interactions between chemistry, radiation, and meteorology (Dawson et al., 2007; Zhang, 2008; Isaksen et al., 2009; Baklanov et al., 2014; Cai et al., 2017), which is highly complex and nonlinear, and this is currently one of the least understood mechanisms in the atmospheric science community. The above interactions are traditionally not included or simplified in meteorological or chemical models, but they have now been considered and treated with different degrees of complexity in a few online coupled models along with the advances in our knowledge and computer power; the coupling of meteorology and chemistry, and its feedbacks, remains one of the most challenging issues in air quality and climate change (Zhang, 2008; Baklanov et al., 2014).
Rapid and continuous growth of economy and energy consumption in the past decades has greatly elevated aerosol levels in China (Chan and Yao, 2008; Zhang et al., 2012; M. Li et al., 2017), resulting in a serious air pollution problem and a potentially significant influence on radiation and climate at multiple scales. Although emission control strategies have been gradually implemented in recent years, haze events still often occur in east China, especially in the Beijing-Tianjin-Hebei (BTH) region in wintertime due to both higher anthropogenic emissions and poorer meteorological conditions. The haze issue has attracted wide attention from the public, government, and scientific community in China, and a lot of monitoring and modeling studies have been carried out to explore the sources, characteristics, formation, and evolution mechanisms of haze events at both urban and regional scales (Chan and Yao, 2008; X. Y. Zhang et al., 2012; Che et al., 2014; Guo et al., 2014; Huang et al., 2014; Sun et al., 2014; Zheng et al., 2015; Cheng et al., 2016; Ding et al., 2016; Li and Han, 2016a; Cai et al., 2017; Fu and Chen, 2017; Z. Li et al., 2017; Wang et al., 2017; Huang et al., 2018; X. Zhang et al., 2018a; Zhong et al., 2018a, b; An et al., 2019; X. Li et al., 2019), through which our understanding of the haze issue has been improved. However, there is still a large gap in our knowledge about the haze formation mechanism, in particular the role of aerosol–radiation–meteorology feedback in haze formation and evolution (Fu and Chen, 2017; Zhong et al., 2018a; An et al., 2019).
The aerosol radiative feedbacks on air quality and meteorology have been studied in North America and Europe with regional online coupled meteorology–chemistry models, such as WRF-Chem (Zhang et al., 2010; Forkel et al., 2012), which demonstrates the important role of the feedbacks in both air quality and meteorology. Carslaw et al. (2010) also pointed out the complexity and significance of natural aerosol interactions and feedbacks within the Earth system.
In East Asia, Han et al. (2013) revealed a significant feedback of mineral dust on dust deflation and transport, atmospheric dynamics, cloud and precipitation in spring, and an improvement of model prediction for PM (particulate matter) concentration and surface meteorology by the inclusion of the feedback effect into an online coupled climate–chemistry–aerosol model. In recent years, given the increasing concerns about severe particulate matter (PM) pollution during haze days, some modeling studies have been conducted to investigate the effect of aerosol radiative feedback on meteorology and near-surface PM2.5 concentration, with a focus on winter haze events in North China (Z. Wang et al., 2014; J. Wang et al., 2014; B. Zhang et al., 2015; Y. Gao et al., 2015; M. Gao et al., 2016; Qiu et al., 2017; Zhao et al., 2017; X. Zhang et al., 2018; Chen et al., 2019; Wu et al., 2019). Most of the model results exhibited a positive feedback which tended to increase the PM2.5 level, but the magnitude of such a feedback differs largely, with the mean fractional change in PM2.5 concentration varying from just a few percent (Kajino et al., 2017; Wu et al., 2019) to around 30 % (Z. Wang et al., 2014). Some studies even show a negative feedback on PM2.5 in Beijing (Zhang et al., 2015; Gao et al., 2016). Recently, Gao et al. (2020) reported that the aerosol–radiation feedback-induced daytime changes in PM2.5 concentrations were less than 6 % during haze days in the BTH region in January 2010 from six applications of different online coupled meteorology–chemistry models under the international framework of MICS-Asia Phase III. There are some differences in the above modeling studies in terms of study period and haze level, although they were all for winter haze events in the BTH region. Zhong et al. (2018a) reported that over 70 % of PM2.5 increase during the cumulative explosive stage of haze event in Beijing in winter can be attributed to the feedback effect based on integrated analysis of observations. The above studies highlight the importance and large uncertainties in the aerosol radiative feedback, which requires further model development and investigation.
The diversity in the feedback effect among models could be associated with the differences in the predictions of aerosol chemical components and aerosol optical properties, the assumption of mixing state and hygroscopic growth scheme, and meteorological fields, all of which determine the direction and magnitude of the feedback effect. The majority of previous model studies underpredicted PM concentrations in the North China Plain, especially for aerosol components such as sulfate, nitrate, and secondary organic aerosol (SOA) concentrations, mainly due to incomplete understanding and unrealistic treatment of secondary aerosol formation through multiphase chemical processes. Gao et al. (2018) reported that most of the participating models (including WRF-Chem) in the MICS-Asia (Model Inter Comparison Study for Asia) project underpredicted inorganic and organic aerosol concentrations by up to a factor of 3. Besides aerosol mass concentration, the unrealistic representation of aerosol properties, such as composition, size distribution, mixing state, and hygroscopic growth, would also lead to model biases in aerosol optical properties and direct radiative effects. The low biases in the predicted aerosol compositions may lead to underpredictions of aerosol optical depth (AOD) and consequently of aerosol radiative effects and feedback. Che et al. (2014) reported a reduction of solar radiation by aerosols exceeding 200 W m−2 during a severe haze event in the North China Plain, much stronger than the estimations from models (around −100 W m−2). Therefore, a realistic treatment and an accurate representation of aerosol processes and properties are crucial to the estimation of aerosol radiative effects and feedback.
It has been well recognized that high aerosol loadings can apparently reduce incoming solar radiation at the surface, leading to surface cooling and inversion, associated with reduced wind speed and vertical diffusivity, and consequently an increase in surface aerosol concentrations. However, while we have gained considerable knowledge on the overall feedback effect of aerosols, the detailed processes involved in the feedback mechanism are still poorly understood and barely quantified; for example, how does the aerosol radiative effect modify meteorological variables, how do the radiative and meteorological changes affect physical and chemical processes and in turn affect the magnitude and distribution of aerosol components, and how can we quantify the relative contributions from various physical and chemical processes to the feedback effect.
In this study, an online coupled regional climate–chemistry–aerosol model (RIEMS-Chem) was developed and applied to explore the formation and evolution of haze events during February–March 2014, in which a week-long haze episode with the daily maximum PM2.5 concentration up to 400 µg m−3 (hourly mean up to 483 µg m−3) was observed. A wide variety of field measurements of aerosol chemical components, optical properties, and meteorological variables were conducted and applied to develop, constrain, and validate the model. The mechanisms of haze formation and evolution, aerosol radiative effects, and feedback on meteorology and chemistry were investigated and assessed. The overall aerosol feedback on PM2.5, its aerosol compositions, and the individual contributions to the feedback from physical and chemical processes (advection, diffusion, deposition, chemistry, etc.) during haze events were interpreted and quantified by a process analysis approach incorporated into the model. The results from this study are expected to provide new insights into the mechanism of aerosol–radiation–meteorology feedback, which is currently the source of one of the largest uncertainties in haze formation and evolution.
2.1 Model description
An online coupled regional climate–chemistry–aerosol model RIEMS-Chem was used in this study, which was developed based on the Regional Integrated Environmental Model System (RIEMS) (Fu et al., 2005; Wang et al., 2015). A series of modules and parameterizations were adopted to represent major physical processes, including a modified Biosphere-Atmosphere Transfer Scheme (BATS; Dickinson et al., 1993) to simulate land surface process, the Medium-Range Forecasts scheme (MRF) to represent the planetary boundary layer process (Hong and Pan, 1996), the cumulus convective parameterization scheme from Grell (1993), and a modified radiation package of the NCAR Community Climate Model, version CCM3 (Kiehl et al., 1996) to represent radiation transfer process including aerosol effect. RIEMS had been applied to investigate East Asian monsoon climate and the interactions among physical, biological, and chemical processes (Xiong et al., 2009; Zhao, 2013; Wang et al., 2015). RIEMS had participated in the Regional Climate Model Intercomparison Project (RMIP) for Asia, and it was one of the best models in predicting air temperature and precipitation over East Asia (Fu et al., 2005).
The online coupled model RIEMS-Chem has been developed in recent years by incorporating major atmospheric chemistry–aerosol processes into the host model. Transport of pollutants is driven by meteorological fields from RIEMS, and changes in pollutants exert feedbacks on the existing dynamic and physical modules (Han, 2010; Han et al., 2012). Major atmospheric processes including emission, advection, diffusion, multiphase chemistry, dry deposition, and wet scavenging of pollutants are considered. The advection and diffusion for pollutants are treated with the same scheme for substances (such as moisture). Gas-phase chemistry is represented by an updated Carbon Bond mechanism (CB-IV; Gery et al., 1989). The aerosol effect on photolysis rate is considered by using the Tropospheric Ultraviolet-Visible (TUV) radiation model (Lee-Taylor and Madronich, 2007). Thermodynamic processes are calculated by the ISORROPIA II model (Fountoukis and Nenes, 2007). Dry deposition velocity of aerosol is calculated by a size-dependent scheme which is expressed as the inverse of the sum of resistance plus a gravitational settling term, while below-cloud wet scavenging of aerosol is parameterized as a function of precipitation rate and collision efficiency of particles by hydrometeor (Han et al., 2004). Heterogeneous reactions between gases and mineral dust and sea salt aerosols have also been incorporated into RIEMS-Chem (Li and Han, 2010; J. W. Li et al., 2018). SOA formation is parameterized by a two-product model (Odum et al., 1997).
Current atmospheric chemistry models generally tend to underpredict sulfate concentrations, especially in source regions during wintertime, such as North China, which could be due to uncertainties in the treatment of chemical formation mechanism. Recent model studies suggested that heterogeneous reactions could be an important pathway in sulfate formation during winter haze episodes in North China (G. H. Li et al., 2017; J. Li et al., 2018). Therefore, heterogeneous reactions concerning the conversion of SO2 to sulfate on pre-existed hydrated aerosols were incorporated into RIEMS-Chem. The method by J. Li et al. (2018) was adopted, in which the uptake coefficient () was a stepwise function determined by the aerosol liquid water content (ALWC), which was predicted by the ISORROPIA II model. Accordingly, the upper bound of ALWC was set to 300 µg m−3 (), while the lower bound was 30 µg m−3 (). was linearly interpolated between the upper and lower bounds in terms of ALWC.
RIEMS-Chem treats nine aerosol types including sulfate, nitrate, ammonium, black carbon (BC), primary organic aerosol (POA), secondary organic aerosol (SOA), anthropogenic primary particulate matter (PM2.5 and PM10), dust, and sea salt. The size distribution of the different types of aerosols is previously prescribed based on the OPAC database (Optical Properties of Aerosols and Clouds) (Hess et al., 1998). In this study, measurements in Beijing are used to represent aerosol size distribution more realistically and to constrain the model. During the study period, a scanning mobility particle sizer (SMPS; TSI, Inc., Shoreview, MN, USA) was used to measure the aerosol size distribution (Ma et al., 2017), and the geometric mean radius of inorganic, black carbon, and organic carbon aerosols were estimated to be 0.1, 0.05, and 0.1 µm, with standard deviations of 1.65, 1.6, and 1.65, respectively. The above aerosol size information was incorporated into RIEMS-Chem. The deflation of mineral dust is represented by the scheme of Han et al. (2004) with five size bins (0.1–1.0, 1.0–2.0, 2.0–4.0, 4.0–8.0, 8.0–20.0 µm). Primary particulate matter from anthropogenic sources is also assigned to the five size bins.
Recent observational analyses of aerosol mixing state in Beijing (Ma et al., 2012; Wu et al., 2016) indicated that more than 80 % of aerosols were internally mixed with BC during haze days, whereas about 70 % of aerosols were externally mixed with BC in clean days; an internal mixing assumption was adopted for model simulation, because this study focuses on haze events. Recent measurements also exhibited that the geometric mean radius of a dry aerosol internal mixture during haze evolution from light or moderate to severe pollution stages just increased slightly from 0.10 to 0.12 µm (Ma et al., 2017), so an average of 0.11 µm is chosen for the geometric mean radius of internal mixture, with standard deviation of 1.65.
Aerosol optical parameters including extinction coefficient, single scattering albedo, and asymmetry factor were calculated by a Mie-theory-based method developed by Ghan and Zaveri (2007). In this method, the optical properties of different types of aerosols are precalculated by Mie theory and fitted by Chebyshev polynomials, which are functions of aerosol geometric mean diameter and refractive index:
where Q represents the aerosol optical properties (such as scattering efficiency). Tk(x) represents the Chebyshev polynomial of order k, which is related to particle size, and Ak represents the Chebyshev coefficients, which is related to refractive index. Dp is the geometric mean diameter, and Dmin and Dmax are the minimum and maximum Dp for obtaining the Chebyshev polynomials, with values of 0.001 and 10 µm, respectively. It has been proved that 40 groups of Dp in the range from Dmin to Dmax are sufficient to control errors below 10 % compared with classical Mie code calculation.
The effect of water uptake is treated by the κ-Köhler parameterization (Petters and Kreidenweis, 2007), which calculates aerosol wet diameter due to hygroscopic growth under different relative humidity. The bulk κ for internal mixture of aerosols is derived by the volume-weighted average of κ of each aerosol component, while the κ values for inorganic aerosols, BC, POA, SOA, dust, and sea salt were set to 0.65, 0, 0.1, 0.2, 0.01, and 0.98, respectively, according to previous observational and modeling studies (Riemer et al., 2010; Liu and Wang, 2010; Westervelt et al., 2012):
where Va is the total volume of dry aerosols and Vj is the volume of each aerosol component j.
The refractive index of internally mixed aerosols is calculated using the Maxwell-Garnett mixing rule:
where Rw is the refractive index of the internal mixture and Ri and Rs are the refractive index of insoluble components (BC and POA) and soluble components (inorganic aerosols, SOA, and water), respectively. Vi represents the volume of insoluble components and V represents the total volume of wetted aerosols.
After obtaining the wet diameter (Dp) and refractive index of the internally mixed aerosols (Rw), the aerosol optical properties (Q) can be derived from Eq. (1) with the Chebyshev fitting coefficients table. Then, aerosol optical parameters, such as extinction coefficient, can be obtained by multiplying Q by aerosol mass concentration from chemical module. The advantage of this optical module is the computational speed is much faster than that from the traditional Mie calculation, with a similar level of accuracy. This module has been successfully used in estimations of aerosol optical properties and direct radiative effects over East Asia (X. Han et al., 2011; Li and Han, 2016b; J. W. Li et al., 2019).
An empirical method from Hegg (1994) is applied to link cloud droplet number concentration, Nc, to mass concentration of hydrophilic aerosols (sulfate, nitrate, hydrophilic BC, and organic carbon (OC)) to represent the first indirect effect, while the parameterization of Beheng (1994) is used to represent the second indirect effect, in which the autoconversion rate converting from cloud water to rain water depends on Nc and cloud liquid water content WL. The cloud effective radius re is calculated based on Nc, WL, and the cube of the ratio of the mean volume radius and the effective radius of the cloud-droplet spectrum following Martin et al. (1994). The effect of aerosols on ice nuclei and convective clouds is not treated yet in this model because of the complexity and limitation in knowledge.
The aerosol optical parameters and Nc due to the aerosol activation calculated above are transferred to the radiation module to account for the perturbation of radiation and atmospheric heating rate due to aerosol direct and indirect effects. The subsequently called land surface module and boundary layer module calculate the changes in land–air fluxes of heat and moisture, turbulent diffusion coefficients, and meteorological variables in the boundary layer in response to the radiation change. Then, air temperature tendency is calculated in terms of the altered atmospheric heating rate and radiation, which further leads to changes in meteorological variables. These in turn affect physical and chemical processes and concentrations of aerosols, as well as their precursors represented in the chemical module. All the physical modules are called every 2.5 min, and the transfer of variables between chemical module and radiation–meteorological modules is made every 30 min.
RIEMS-Chem has been successfully applied in previous modeling studies of anthropogenic aerosols, mineral dust, and marine aerosols regarding spatiotemporal distributions, physical and chemical evolutions, and radiative and climatic effects over East Asia (Z. W. Han et al., 2011, 2012, 2013, 2019; Li et al., 2014; Li and Han, 2016b, c; J. W. Li et al., 2019). RIEMS-Chem has been participating in the MICS-Asia phase III and shows a good ability in predicting PM2.5 concentration and AOD over East Asia (Gao et al., 2018).
2.2 Process analysis
In RIEMS-Chem, a time-splitting scheme based on the continuity equation is applied to predict species concentrations; therefore, the species concentrations are the net results of successive changes in emissions, dynamic transport, and physical and chemical processes; the changes in species concentration by each process can be recorded, allowing for the quantification of individual contributions of each process to species variation. In this study, a process analysis (PA) scheme, which calculates the integrated process rates (IPRs) at each time step and each grid, was embedded in RIEMS-Chem to identify the contributions of physical and chemical processes to aerosol evolution. At each time step, the IPR for a certain process was calculated by subtracting the species concentrations at the beginning of this process from the ones after the process. The IPR method has been applied to study the formation and fate of particulate and gaseous pollutants in North America and China (e.g., Yu et al., 2008; Zhang et al., 2009; Liu et al., 2010). The processes involved in aerosol evolution include emissions of primary species, advection (horizontal and vertical), diffusion (horizontal and vertical), dry deposition, chemical processes (gas-phase chemistry, aqueous chemistry, thermodynamic equilibrium, and heterogeneous reactions), cloud processes, and wet deposition. Here the cloud process represents the effects of cloud attenuation of photolysis rate, aqueous-phase chemistry, and in-cloud mixing. In this study, PA is applied not only to quantify the contributions of individual physical and chemical processes to haze evolution but also to help interpret the processes involved in aerosol radiative feedback. In addition, unlike the previous PA application, chemical processes are further classified into gas-phase, thermodynamic, and heterogeneous reactions to provide more details on chemical pathways of secondary aerosol formation. The mass balance of IPR has been examined, assuring that the change in species concentration during one time step is equal to the sum of IPRs by each of the processes.
2.3 Emission inventories
Monthly-mean anthropogenic emissions of sulfur dioxide (SO2), nitrogen (NOx), ammonia (NH3), non-methane volatile organic compounds (NMVOCs), carbon monoxide (CO), black carbon (BC), primary organic carbon (POA), and other anthropogenic primary PM2.5 and primary PM10 in China for the year 2014 were obtained from the MEIC inventory (Multi-resolution Emission Inventory for China), which was developed by Tsinghua University (http://meicmodel.org, last access: 20 November 2018). Anthropogenic emissions outside China were taken from the MIX inventory (M. Li et al., 2017), which was developed to support the Model Inter-Comparison Study for Asia phase III (MICS-Asia III) and the Hemispheric Transport of Air Pollution (HTAP) projects. Both inventories, MEIC and MIX, have a horizontal resolution of 0.25∘. Biomass-burning emissions of aerosols and gas precursors for the year 2014 with a horizontal resolution of 0.25∘ were derived from the fourth version of the Global Fire Emissions Database (GFED4) (Giglio et al., 2013). Monthly-mean biogenic emissions of isoprene and monoterpene were derived from Global Emissions Inventory Activity (GEIA, http://www.geiacenter.org/, last access: 20 November 2018). The above emission data were bilinearly interpolated to the Lambertian projection of RIEMS-Chem.
2.4 Model configuration and numerical experiments
RIEMS-Chem was configured on a Lambertian conformal projection with horizontal resolution of 60 km, covering most areas of China, the Korean Peninsula, Japan, and part of Southeast Asia (Fig. 1). There are 16 vertical layers distributed vertically and unevenly in the terrain-following sigma coordinate, with the lowest 8 layers within the boundary layer. This study focused on the Beijing-Tianjin-Hebei (BTH) region with more attention to the Beijing metropolitan area. The study period was from 10 February to 12 March 2014, encountering several haze episodes. The first 7 d were taken as model spin-up and the results from 17 February to 12 March were used for analysis.
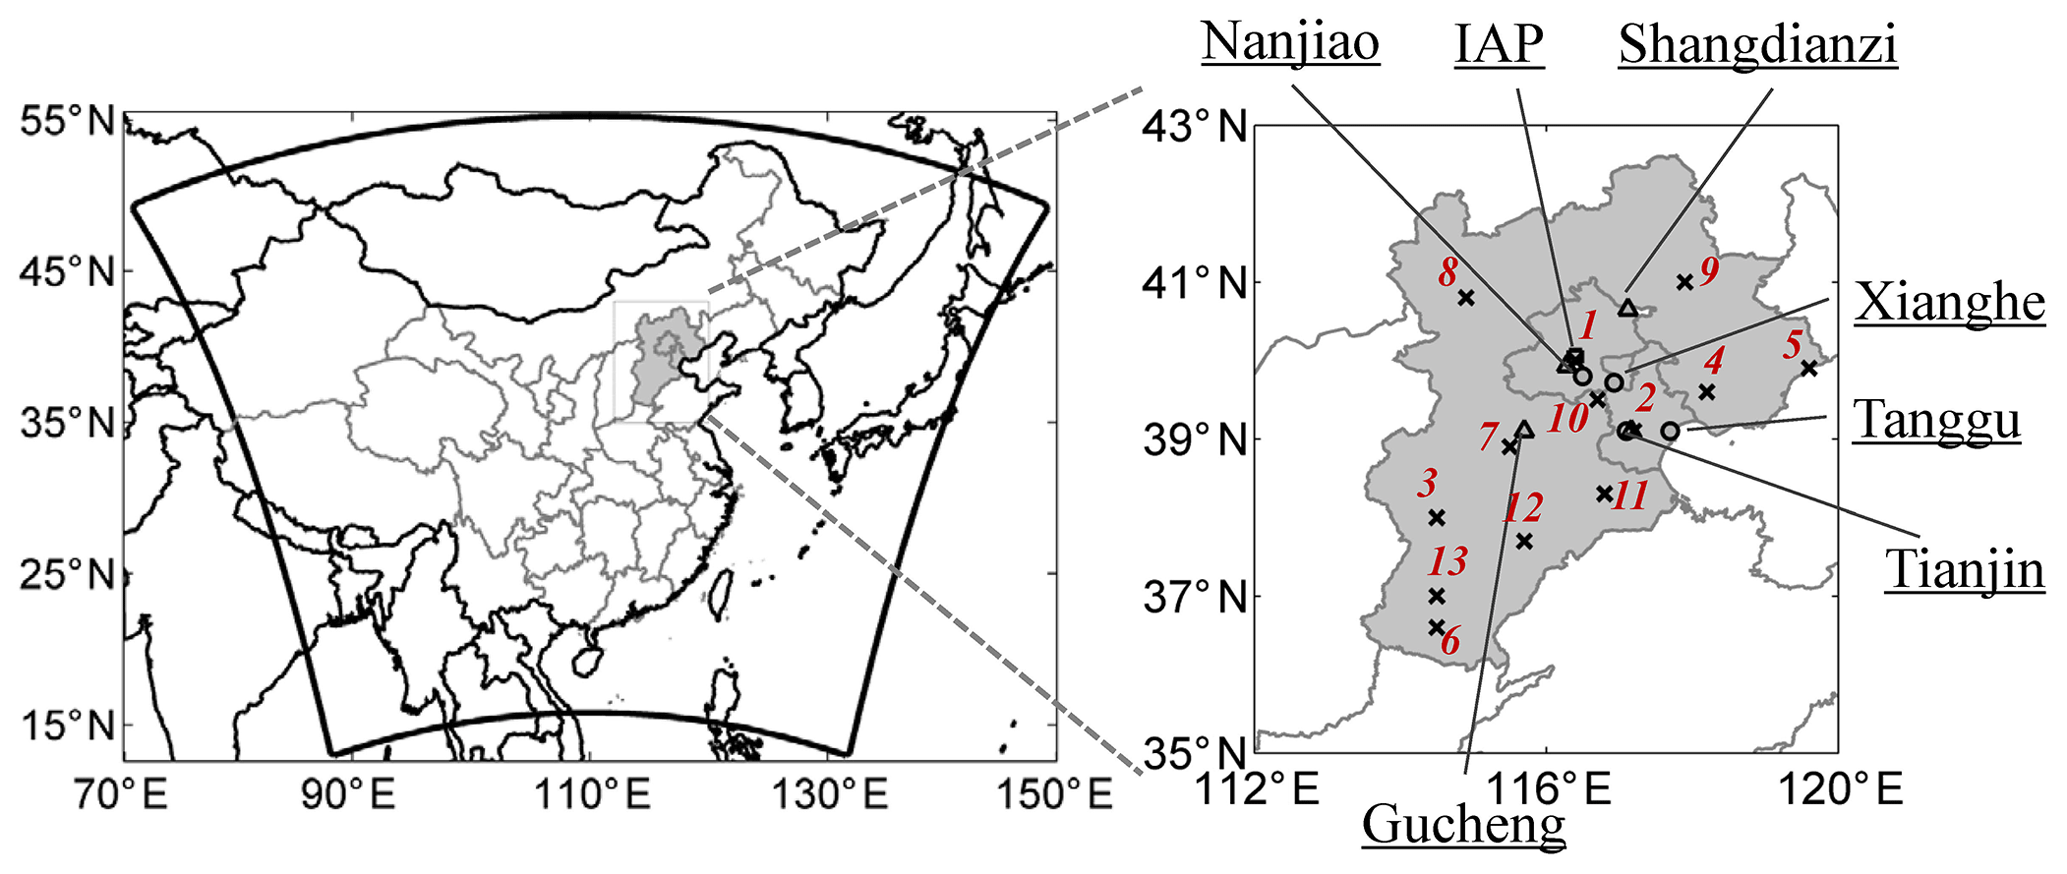
Figure 1The model study domain. The shaded areas indicate the Beijing-Tianjin-Hebei (BTH) region. Markers are observation sites (squares represent IAP observations of PM2.5, its chemical components, aerosol extinction coefficient (EXT), and aerosol absorption coefficient (ABS); circles represent observations of meteorological variables; and triangles represent aerosol optical depth (AOD)). The Xianghe site provides meteorological soundings and hourly surface shortwave radiation (SWDOWN) measurements; the Tianjin site provides both meteorological variables and AOD. Hourly O3, SO2, NO2, and PM2.5 measurements at 13 cities from the CNEMC (China National Environmental Monitoring Center, http://www.cnemc.cn/, last access: 31 August 2019) are labeled by crosses with numbers (1-Beijing, 2-Tianjin, 3-Shijiazhuang, 4-Tangshan, 5-Qinhuangdao, 6-Handan, 7-Baoding, 8-Zhangjiakou, 9-Chengde, 10-Langfang, 11-Cangzhou, 12-Hengshui, and 13-Xingtai).
Initial and boundary conditions for meteorological variables were provided by the final reanalysis data (FNL) with resolution and 6-hourly interval from the National Centers for Environmental Prediction (NOAA/NCEP, 2000). Lateral boundary conditions of chemical species at 6-hourly interval were derived from the simulations of the global chemical model MOZART-4 (Model for Ozone and Related chemical Tracers, version 4; Emmons et al., 2010).
To investigate the aerosol radiative effects and their potential feedback on solar radiation, meteorological variables, planetary boundary layer (PBL), and aerosol concentrations in the study domain, two simulations were designed. The FULL simulation (with aerosols) considered all aerosol direct and indirect effects and feedbacks, and the NoAFB simulation (no aerosol feedback) shuts off aerosol direct radiative effects and removes anthropogenic aerosols in aerosol indirect effects. In both simulations, the driving meteorological data, emissions, and model settings were exactly the same.
2.5 Observational data
Several observational datasets for meteorological variables, aerosol concentrations and aerosol optical parameters were obtained and used for model comparison and analysis.
In situ 3-hourly observations of temperature at 2 m (T2), wind speed at 10 m (WS10) and relative humidity at 2 m (RH2) from three meteorological monitoring sites around Beijing (Fig. 1) were collected from the China Meteorological Data Service Center (CMDS) (http://data.cma.cn/, last access: 28 November 2019).
To evaluate the model's ability to reproduce the evolution of planetary boundary layer (PBL), high-frequency sounding data measured around 14:00 LST at the Xianghe station (39∘45′ N, 116∘58′ E; approximately 63 km southeast of downtown Beijing) were collected, from which the PBL height can be determined based on the vertical gradients of virtual potential temperature and water mixing ratio according to the method from Heo et al. (2003). This sounding dataset provided a good indicator of mixing layer height, because the sounding was launched at 14:00 LST and lasts for about 1 h. The meteorological sounding was launched in Xianghe once a week (every Tuesday), and in total four soundings were available during the study period (18 and 25 February, 4 and 11 March). Fortunately, the four soundings encountered one severe haze episode, one moderate haze episode, and two clean days, providing robust evidence of day-to-day variation of mixing layer height under various atmospheric conditions. Hourly downward shortwave radiation flux (SWDOWN) at the surface was measured simultaneously at the Xianghe station by a pyranometer with sun shield and was used in this study.
The measurements of mass concentrations of PM2.5, and its components, and aerosol optical parameters were carried out at the tower division of the Institute of Atmospheric Physics (IAP), Chinese Academy of Sciences (CAS), in Beijing (39∘58′ N, 116∘22′ E) from 17 February to 12 March 2014. Real-time hourly PM2.5 mass concentrations were online measured by a hybrid beta attenuation particulate monitor (model 5030 Sharp, Thermo Scientific, USA). PM2.5 samples were collected in parallel by an R&P Partisol® model 2025 dichotomous sequential PM air sampler (Thermo, USA) and a MiniVol TAS PM sampler (Airmetrics, USA) between 24 February and 12 March 2014. Samples were collected twice per day with one during the daytime (from 07:00 to 19:00 LST) and the other at night (from 19:00 to 07:00 LST of the next day). In total, 33 half-day samples were collected. Aerosol chemical compositions including sulfate (), nitrate (), ammonium (), BC, and OC were analyzed by ion chromatography (Dionex ICS-90 for cations and ICS-1500 for anions) and a DRI-2100A carbonaceous aerosol analyzer. Real-time hourly aerosol extinction coefficient and aerosol absorption coefficient at dry condition (RH = 10 %) were synchronously measured by a nephelometer (Aurora3000) and an Aethalometer (AE-31), respectively. Detailed information about this experiment including the sampling site, instruments, measurement procedures, and sample analysis are well documented in Ma et al. (2017). The mass concentration of secondary organic carbon (SOC) was estimated using a revised elemental carbon (EC) tracer method (Zhao et al., 2013).
Measurements of AOD at the four sites (Nanjiao, Tianjin, Gucheng, and Shangdianzi) in the BTH region were obtained from the China Aerosol Remote Sensing Network (CARSNET) (Che et al., 2014). Nanjiao is an urban site located in southern Beijing. The Tianjin site is located in the center of Tianjin city, about 120 km to the southeast of Beijing. Gucheng, a suburban site in Hebei province, is about 130 km to the southwest of downtown Beijing. Shangdianzi is located 150 km to the northeast of Beijing, which is a background station since it is far away from anthropogenic sources. Daily-mean AOD was derived by temporally averaging the raw data measured by sun photometer during daytime. To compare with the model output, AOD at 550 nm was used.
3.1 Meteorological variables
Wind speed, temperature, and relative humidity are key meteorological factors affecting physical and chemical processes of atmospheric pollutants. The statistics for comparison between in situ observation and the FULL simulation for WS10, T2, and RH2 are presented in Table 1. At the three sites (Beijing, Tianjin, and Tanggu), the model performances were reasonably good, although wind speeds were somewhat overpredicted. The overall correlation coefficient (R) and normalized mean bias (NMB) at the three sites were 0.83 and −2 % for T2, 0.61 and −1 % for RH2 and 0.47 and 31 % for WS10. In all, RIEMS-Chem was able to reasonably reproduce the meteorological variables during the study period. The statistics for NoAFB simulation are also list in Table 1. It is noteworthy that the statistics for the FULL simulation are overall better than those for NoAFB simulation: the warm bias in the simulated air temperature and positive bias in wind speed are apparently reduced. This demonstrates that the inclusion of aerosol radiative effects does improve meteorological prediction in this study.
Table 1Performance statistics for meteorological variables at observation sites in the BTH region. Mean observation (Obs), mean simulation (Sim), correlation coefficient (R), and normalized mean bias (NMB in %) are given. WS10, T2, and RH2 are wind speed at 10 m, air temperature at 2 m, and relative humidity at 2 m, respectively. All the sample numbers are 207.
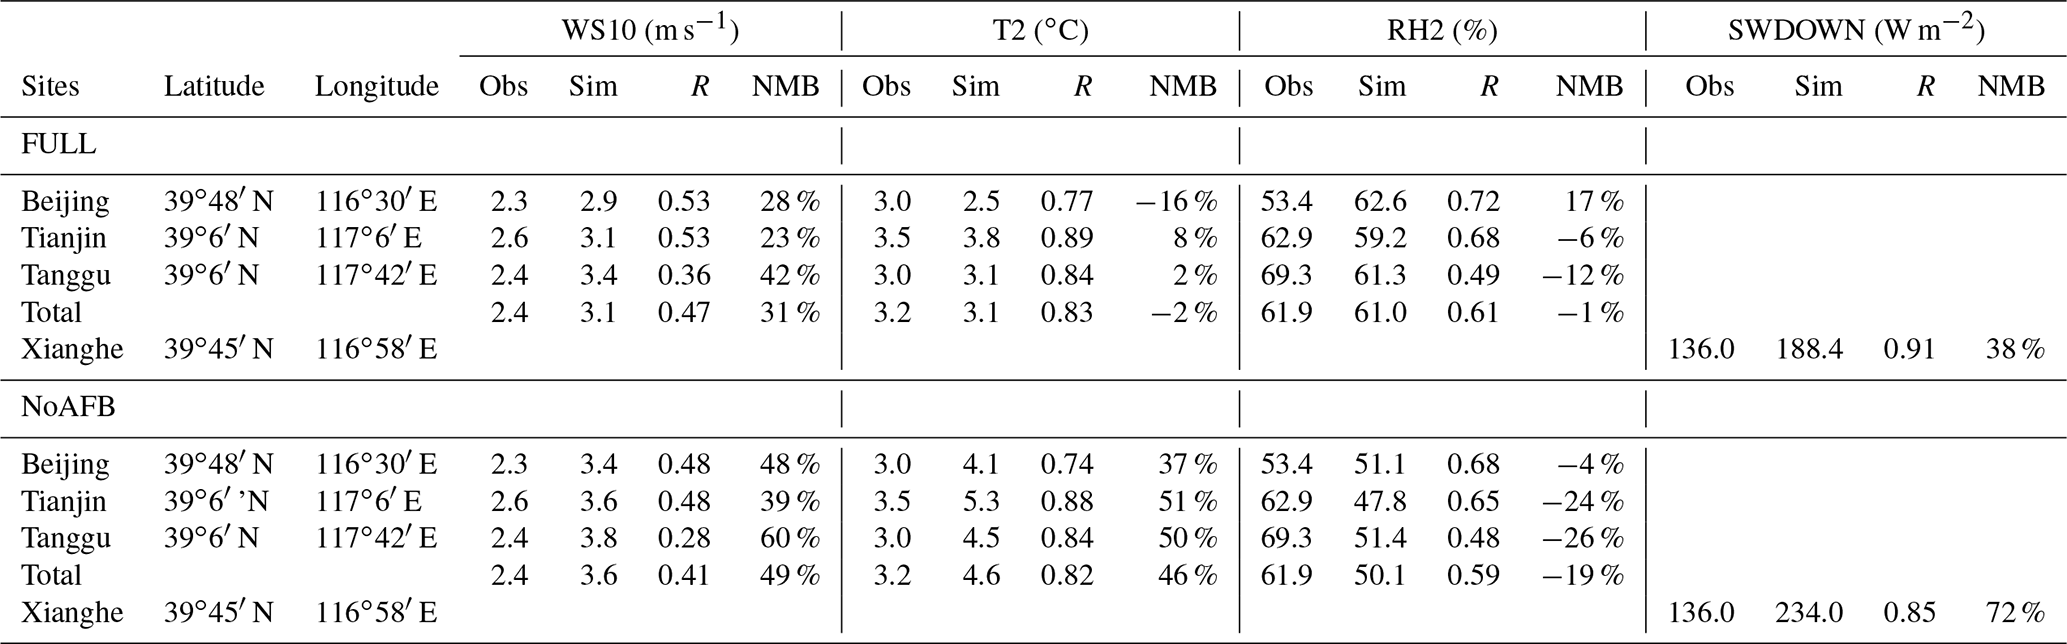
The observed hourly SWDOWN in Xianghe was compared with model simulation (Fig. 2a). In general, the FULL case well reproduced SWDOWN in clean days and light-to-moderate polluted days, but tended to overpredict observations in heavy haze days, such as the period from 20 to 26 February. Underpredictions of cloud amount and PM concentrations could be reasons for the high bias. For the entire study period, the observed and simulated (FULL) mean SWDOWN values were 136.0 and 188.4 W m−2, respectively, with R of 0.91 (Fig. 2a). If only days with low cloud cover were considered, the SWDOWN values were 183.3 and 213.7 W m−2 from observation and the FULL case, respectively, with an NMB of 16 %. In contrast, the NoAFB case failed to capture the decreasing tendency of SWDOWN during haze days, resulting in a larger bias (NMB of 72 %) than the FULL case.

Figure 2The model-simulated and observed (a) hourly SWDOWN at Xianghe, (b) hourly PBL height at 14:00 LST at Xianghe (note that observations are available in 4 d; numbers are observations and corresponding simulations), and (c) hourly PM2.5 concentration at IAP site in Beijing.
To examine the model performance for meteorology in the vertical direction, we collected meteorological sounding data at the Beijing observatory from the website of the University of Wyoming (http://weather.uwyo.edu/upperair/sounding.html, last access: 1 December 2018). Figures S1 and S2 in the Supplement present the average observed and simulated vertical profiles of air temperature, wind speed, and relative humidity at 08:00 and 20:00 LST during the two haze episodes of 20–26 February and 1–4 March 2014; the corresponding comparison statistics for these variables in the troposphere and at altitudes below 3 km are listed in Tables S1 and S2 in the Supplement. In general, the model is able to generally capture the major features of vertical distribution of key meteorological variables, although the model tends to predict higher relative humidity in the middle-to-upper troposphere. Such overpredictions are also found for the same region in previous studies, such as WRF-Chem simulations (Gao et al., 2016). The statistics indicate that the model-simulated vertical distribution of meteorological variables are within an acceptable accuracy range of current meteorological model predictions.
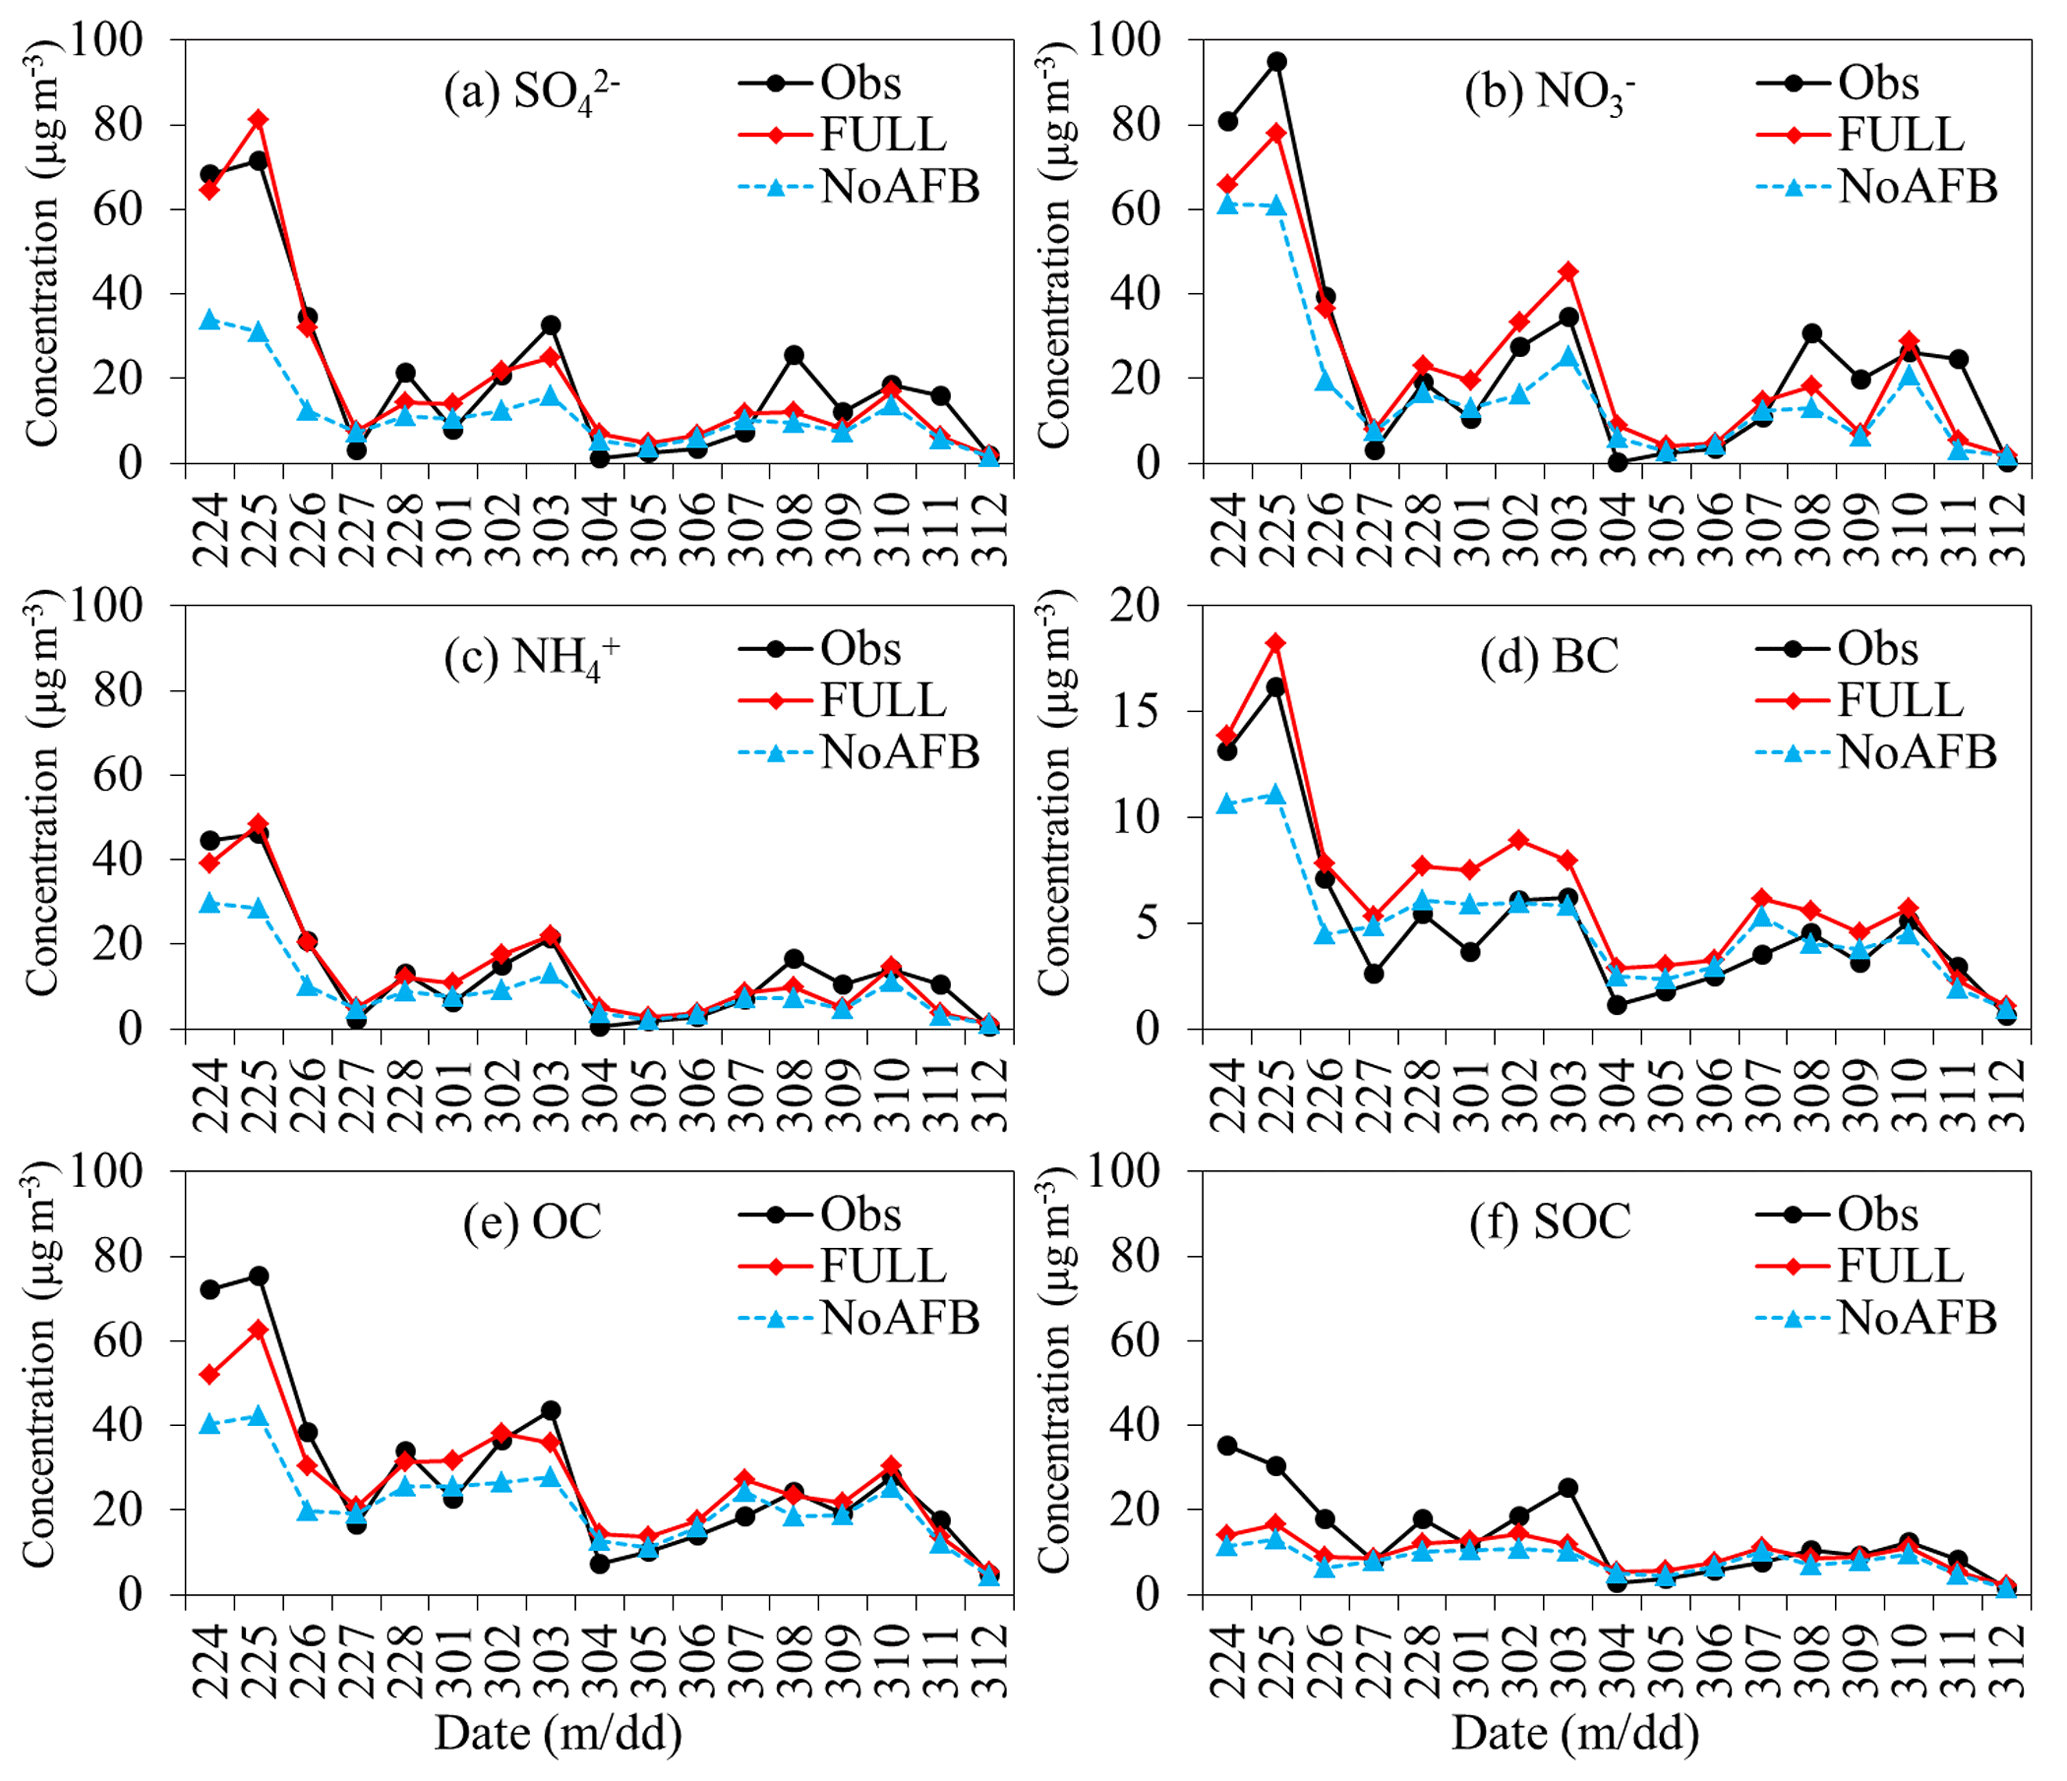
Figure 3The model-simulated and observed daily-mean concentrations of aerosol compositions in PM2.5 at the IAP site in Beijing.
3.2 Planetary boundary layer (PBL) height
Figure 2b shows the simulated PBL heights at 14:00 LST from the FULL case and NoAFB case during the study period and the observed PBL heights at 14:00 LST determined from air soundings on 18 February (clean), 25 February (severe haze), 4 March (clean), and 11 March (haze), 2014, respectively. There was large variation in PBL height in the afternoon, with higher PBL height in clean days and a lower one in haze days, inversely related to the PM2.5 level. The FULL case well reproduced the very low PBL height during the most severe haze episode on 25 February, with the observed and simulated PBL heights being 569 and 587 m, respectively. In clean days, the much higher mixing layer was also well captured, such as on 4 March; the observed and simulated PBL heights were 2305 and 2535 m, respectively. It is noteworthy that the simulated PBL heights in the NoAFB case were consistently higher than those in the FULL case, and the PBL height simulation from the FULL case (considering aerosol radiative effects) was apparently in a better agreement with observation than that from the NoAFB case, except for that on 18 February.
3.3 Mass concentrations of PM2.5 and aerosol components
Figure 2c shows the hourly PM2.5 mass concentrations observed at the IAP site and those from the FULL simulation and NoAFB simulation. The study period was characterized by three haze episodes, which were episode 1 on 20–26 February, episode 2 from 1 to 4 March, and episode 3 from 8 to 11 March. The first episode experienced the most severe pollution with the maximum hourly PM2.5 concentration exceeding 480 µg m−3 on 25 February. The second and third ones were moderately polluted in terms of magnitude and duration. In general, the model reproduced the hourly variation of PM2.5 concentrations reasonably well in the FULL case, although the peaks were somewhat underpredicted in some days, which could be partly due to the overprediction of wind speed (Table 1) and potential uncertainties in emission inventories. The low bias in PM2.5 concentrations could also contribute to the overprediction of SWDOWN during the first haze episode (20–26 February) discussed in Sect. 3.1. The average PM2.5 concentrations during the study period were 142.0 and 131.4 µg m−3 from observation and the FULL simulation, respectively, with R of 0.8 and NMB of −7 % (Table 2), which demonstrates a good model performance for PM2.5 predictions for the winter haze periods. A remarkable feature shown in Fig. 2 is the significant negative correlation between PM2.5 concentration and PBL height and SWDOWN.
Table 2Performance statistics for PM2.5 concentration, and its chemical components, and aerosol optical parameters at RH = 10 % (EXT, ABS, and SSA) at the IAP site in Beijing. Mean observation (Obs), mean simulation (Sim), correlation coefficient (R), and normalized mean bias (NMB in %) are listed.

The comparison between the simulated daily-mean surface aerosol components (sulfate (), nitrate (), ammonium (), BC, and OC) and observations at the IAP site are presented in Fig. 3. The daily-mean observation in the figure is an average of the half-day samples, while the original half-day samples are used for statistics calculation in Table 2. The model (from the FULL case) generally exhibits a good performance for inorganic aerosol (sulfate, nitrate, and ammonium) concentrations in terms of both daily variation and magnitude (Fig. 3a–c). It is encouraging that the maximum values on 25 February during the first haze episode and the moderate values on 3 March in the second haze episode are well reproduced, although some low biases occurred in the last few days. On average, the model simulations of 20.3, 24.3, and 13.9 µg m−3 are very close to the observations of 21.0, 26.0, and 14.1 µg m−3 for sulfate, nitrate, and ammonium, respectively, with R values of 0.92, 0.88, and 0.91 and NMBs of −4 %, −6 %, and −2 %, respectively (Table 2). Most of the online coupled models tended to underpredict sulfate concentration (Gao et al., 2016, 2018; Qiu et al., 2017), which led to an underestimation of aerosol optical depth and radiative effect. The model in this study improves the simulation of inorganic aerosols, mainly through the inclusion of heterogeneous chemical reactions for inorganic aerosols.
The model also reproduced the temporal variation and magnitude of BC (Fig. 3d) and OC (Fig. 3e) concentrations in Beijing reasonably well. However, the model tended to underpredict the peak OC values on 24–25 February and to overpredict BC concentrations from late February to early March. The low bias in OC simulation during the haze episodes could be attributed to the underprediction of SOC (Fig. 3f) due to potentially missing chemical pathways. Uncertainties in the emission inventory could also be a reason. M. Li et al. (2017) reported the uncertainties in BC and OC emissions for China could be ±200 %, which was larger than those of emissions for gases (<70 %) and primary PM (∼130 %). The period mean BC concentrations from observation and simulation were 5.2 and 6.7 µg m−3, respectively, with R of 0.92 and NMB of 28 % (Table 2). The period mean simulated and observed primary organic carbon (POC) concentrations were 18.4 and 15.5 µg m−3, respectively, with R of 0.93, whereas the simulated SOC concentration was 9.9 µg m−3, which is lower than observation (13.6 µg m−3) by 27 %, with a correlation coefficient of 0.56. For OC (sum of POC and SOC), the simulated value (28.3 µg m−3) was very close to the observation (29.1 µg m−3), with R of 0.88 and NMB of −3 %, respectively, which indicated a generally good model performance for the total OC concentration.
It is noteworthy that by considering aerosol radiative effects, the model apparently improved simulations for both PM2.5 and its chemical compositions, which is illustrated by comparing model results between the FULL and NoAFB cases (Figs. 2c, 3 and Table 2). Another important finding is that the duration of haze episode was prolonged by about 2–3 h by the aerosol radiative feedback compared with that without aerosol feedback (Fig. 2c).
To evaluate the overall model performance on PM2.5 and its gas precursors in the BTH region, we also collected observations at 80 surface stations in 13 cities of the BTH region from the website of the CNEMC (China National Environmental Monitoring Center) (http://www.cnemc.cn/, last access: 31 August 2019), and we made a detailed comparison between observations and model simulations for PM2.5, O3, NO2, and SO2. The observed and simulated hourly mass concentrations of these species in the typical cities are presented in Figs. S3–S8, and the statistics for each city, and for all the cities, are presented in Table S3. The overall model ability is generally satisfactory, with R values of 0.87, 0.81, 0.60, and 0.74 and NMBs of −0.4 %, −11 %, −17 %, and 0.5 % for PM2.5, O3, SO2, and NO2, respectively, for all the sites in the BTH region.
3.4 Aerosol optical parameters
Figure 4a and b show the measured and simulated hourly aerosol extinction coefficient (EXT) and aerosol absorption coefficient (ABS) at a RH of 10 % at the IAP site during the study period. It clearly shows that the model was able to well reproduce the magnitudes and temporal variations of EXT and ABS under dry condition in the FULL case, although the model tended to predict higher ABS in some days possibly due to the overprediction of BC concentration. Single scattering albedo (SSA), which is defined as the ratio of scattering coefficient (EXT minus ABS) to extinction coefficient, is also given in Fig. 4c. The FULL case generally simulated high SSA values during haze episodes, such as 0.92 on 20–26 February, 0.85–0.9 from 1 to 4 March, and 0.8–0.9 on 8–11 March, suggesting a dominant role of light-scattering aerosols in haze days. It is encouraging that the model reproduced SSA during the severe haze episode (on 20–26 February) quite well, with both the simulation and observation being approximately 0.92. However, SSA observation in clean days (such as on 5–7 March) was lower than that in haze days, and the model tended to overpredict SSA in clean days, which could be attributed to uncertainties in measurement. In clean days, both the denominator (EXT) and numerator (EXT minus ABS) were small; a subtle perturbation in EXT and/or ABS can result in a large variation in SSA. A previous observational study in Beijing suggested that SSA observations were more uncertain in clean days than in polluted days, because the observed aerosol extinction coefficient was too low in clean days (Jing et al., 2015). On average, the observed EXT, ABS, and SSA values were 0.51 km−1, 0.048 km−1, and 0.85, respectively, whereas the corresponding FULL simulations were 0.53 km−1, 0.052 km−1, and 0.88, with R values of 0.8, 0.7, and 0.7 and NMBs of 4 %, 10 %, and 5 %, respectively (Table 2). The above comparison demonstrates a good ability of the model to estimate aerosol optical properties during the study period, which could be attributed to both the good performance for aerosol compositions and the realistic representation of aerosol properties (aerosol size distribution, mixing state, hygroscopic growth, etc.), which is based on real-time measurements in Beijing.
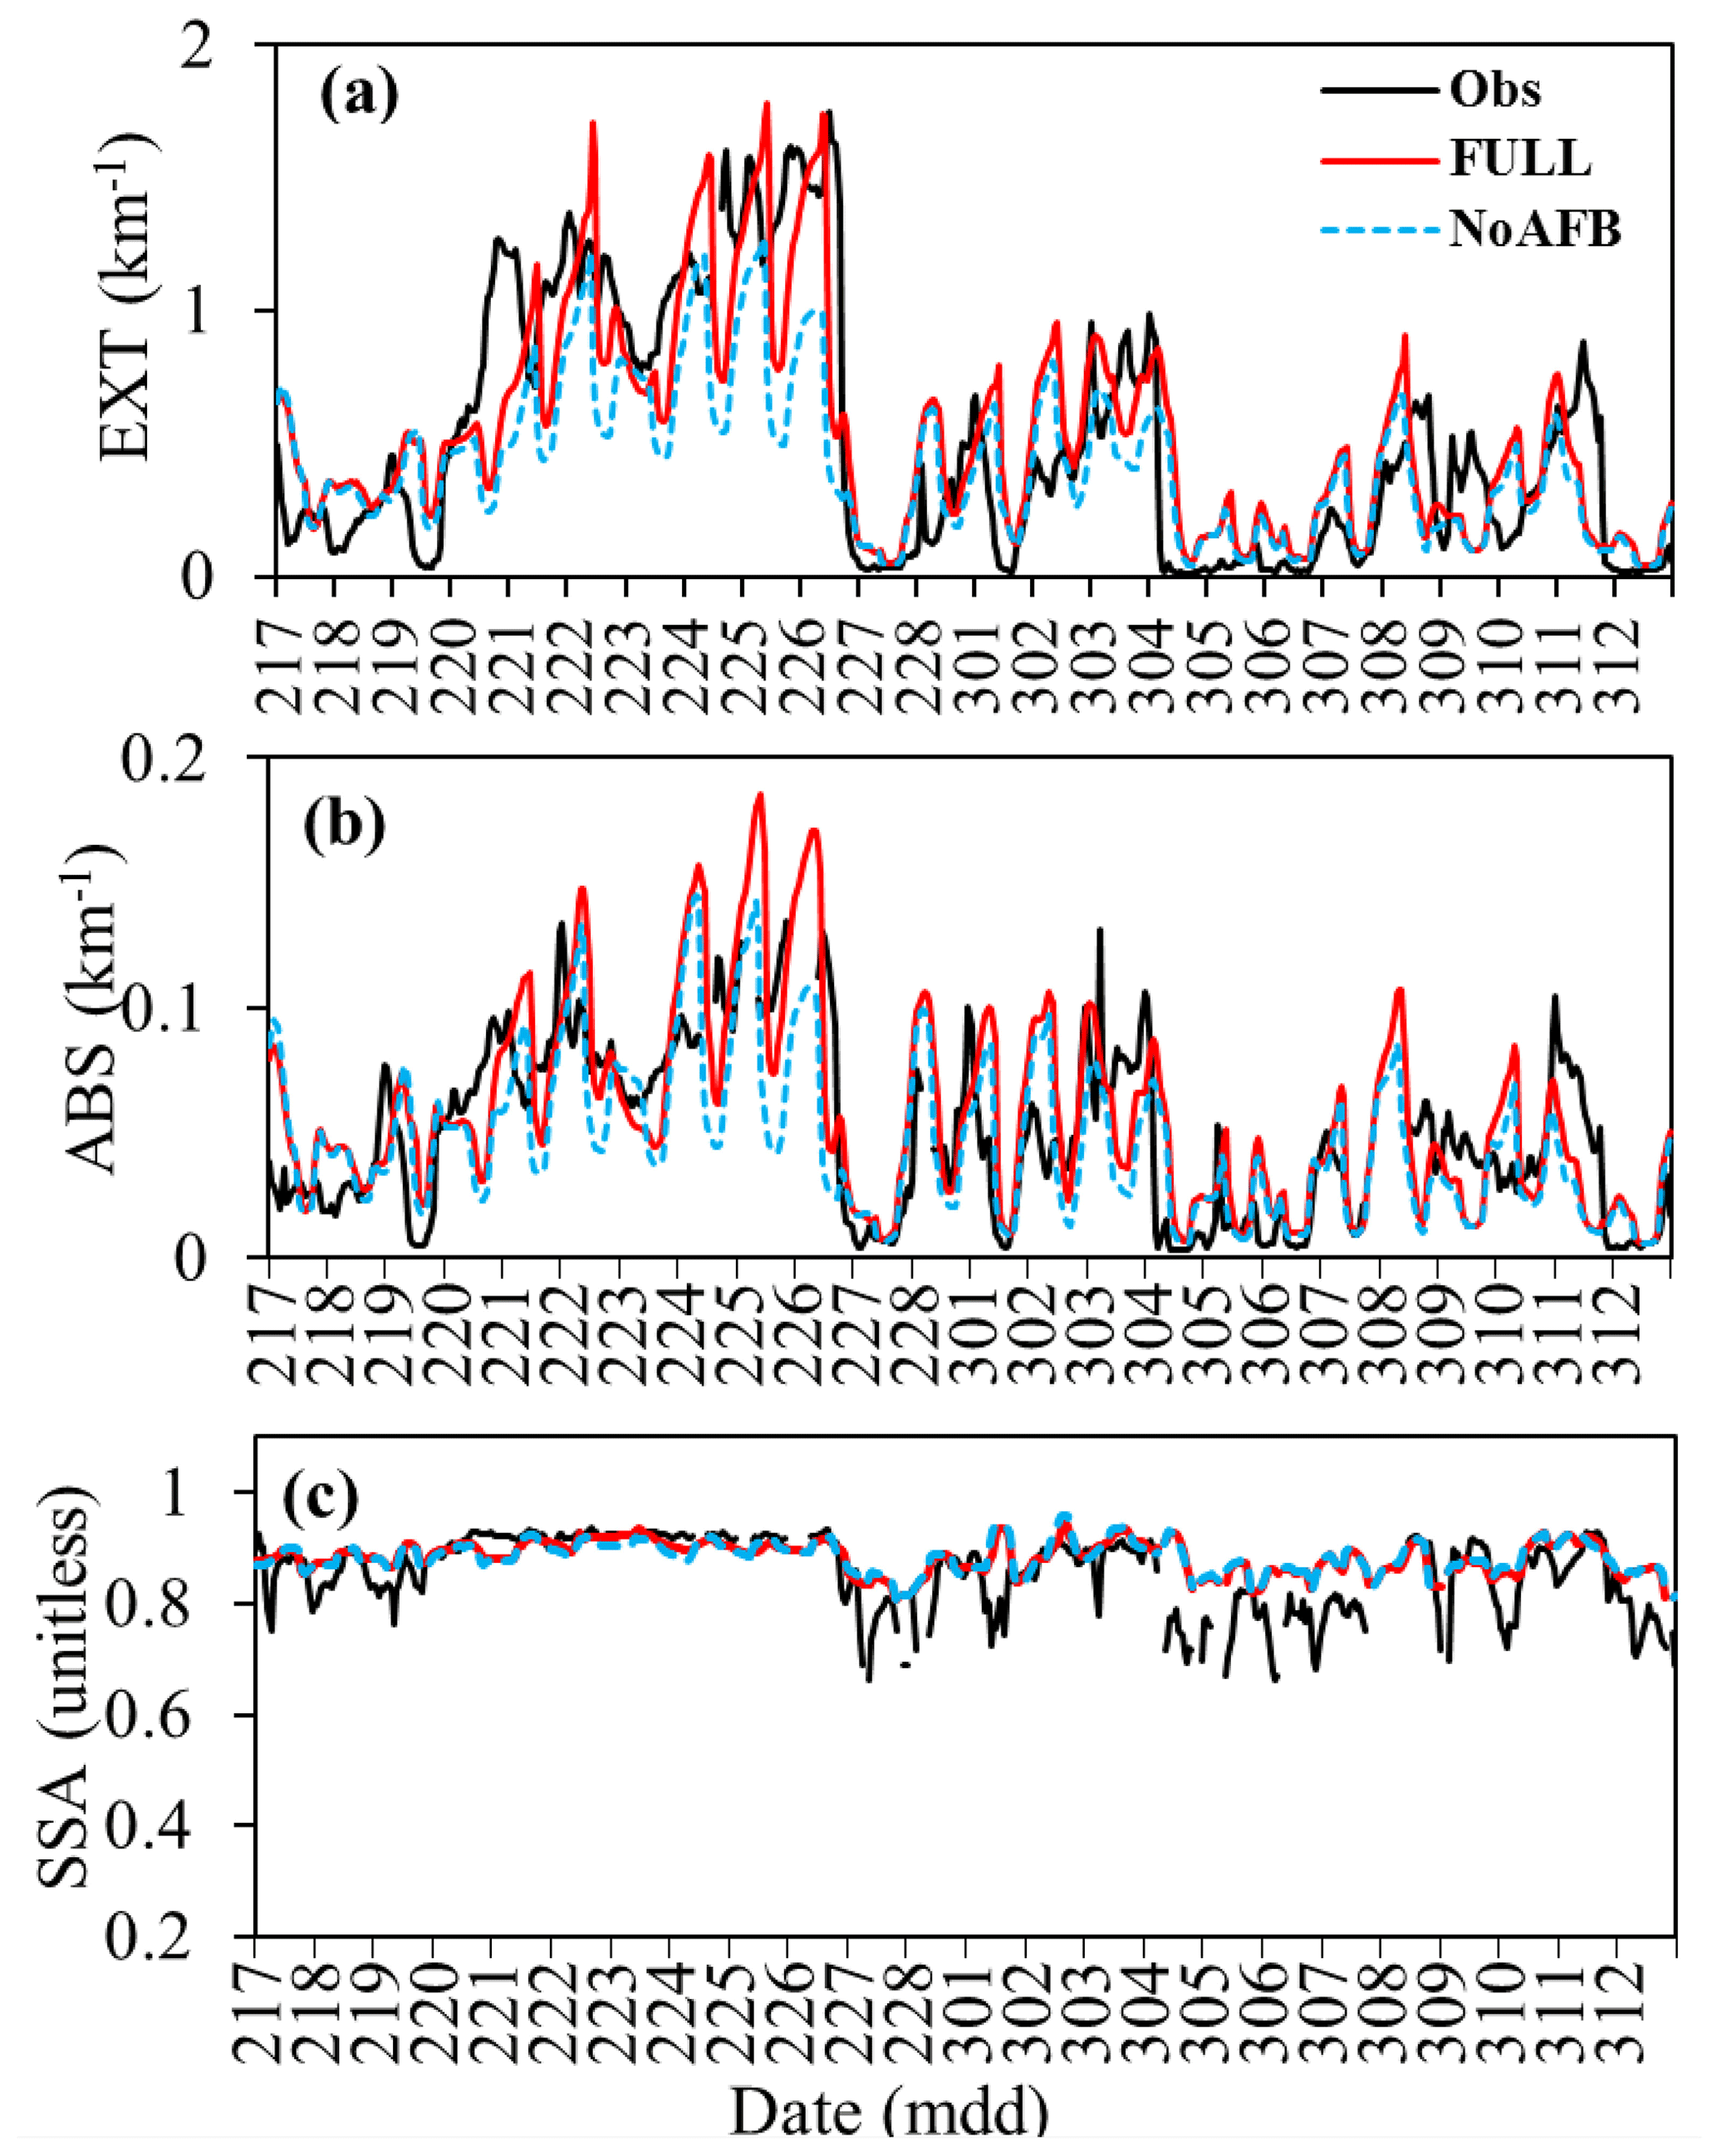
Figure 4The model-simulated and observed hourly (a) aerosol extinction coefficient (EXT), (b) absorption coefficient (ABS), and (c) single scattering albedo (SSA) at the IAP site in Beijing under dry conditions (RH = 10 %).
Besides EXT and ABS measured under dry conditions, measurements of AOD at the four CARSNET sites around Beijing (Nanjiao, Tianjin, Gucheng, and Shangdianzi) were also used to evaluate the model's ability to simulate aerosol optical parameters in real atmosphere (Fig. 5). At the Nanjiao site, which is about 50 km southeast of downtown Beijing (Fig. 5a), AOD measurements were unavailable in most days during the first haze episode (20–26 February), with only two datapoints (around 4.8) available on 25 February. The simulated daily AOD from the FULL case varied from 3.1 to 4.0 during 24–26 February, somewhat lower than the observation. The model tended to simulate lower AOD during the third haze episode (8–11 March), which can be partly attributed to the predicted lower aerosol concentrations. The measured AODs in Gucheng (southwest to Beijing) and Tianjin were similar in terms of variation and magnitude (Fig. 5b and c), showing high values during pollution periods with the maximum daily AOD exceeding 4.0 in Gucheng and 3.5 in Tianjin. The FULL case reproduced the AOD variations and magnitudes reasonably well at the two sites, although low biases still occurred during 8–11 March in Gucheng. For the regional background site Shangdianzi (Fig. 5d), the magnitude and variation of AOD were similar to those in Nanjiao, suggesting that the haze episodes were regionally distributed, because the temporal variations and magnitudes of AOD were generally consistent at the four sites.
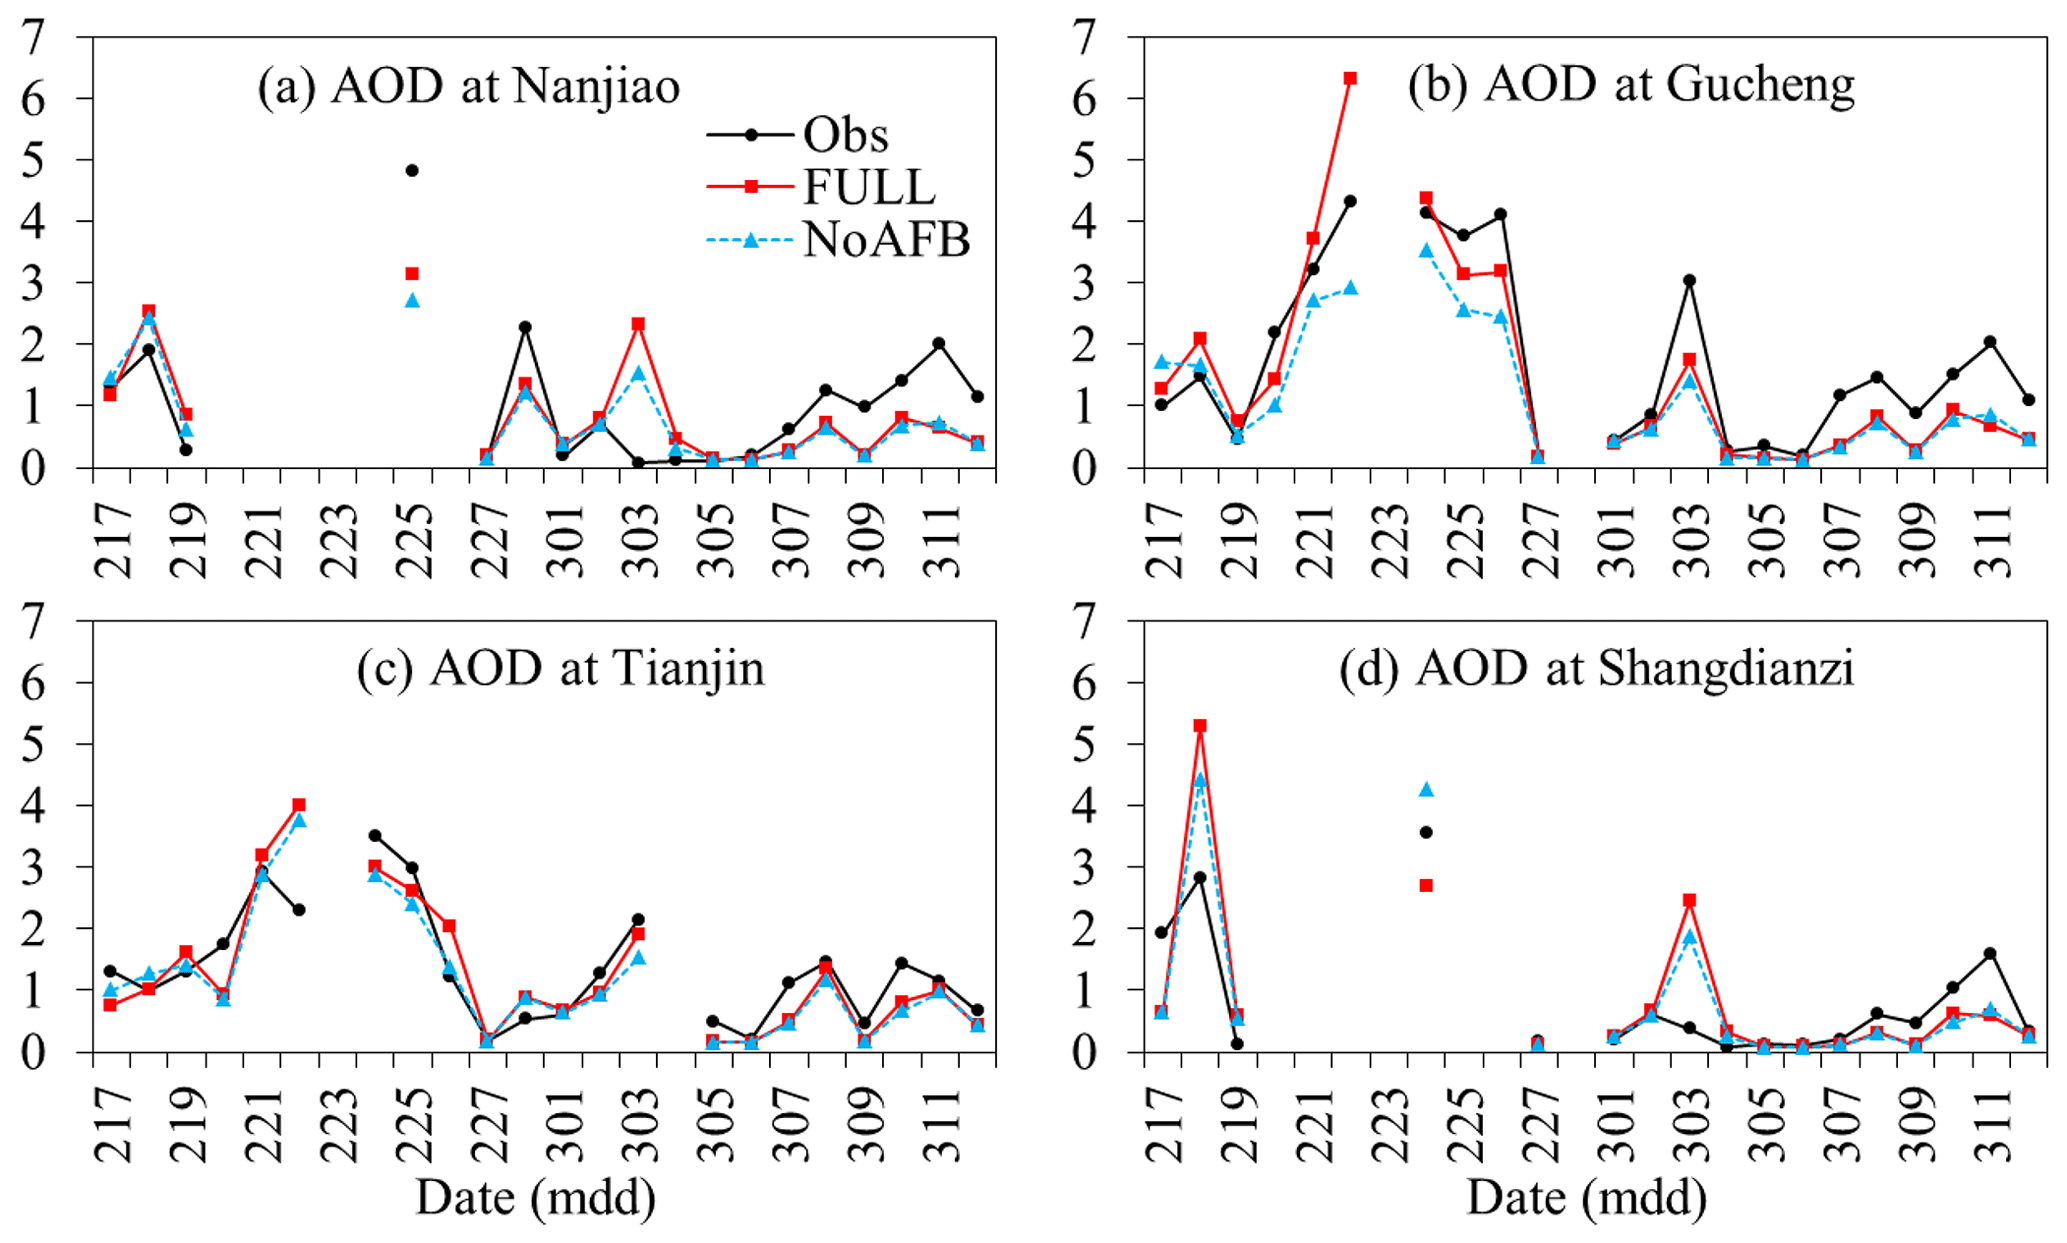
Figure 5The model-simulated and observed daily-mean AOD (at 550 nm) at the four sites of CARSNET.
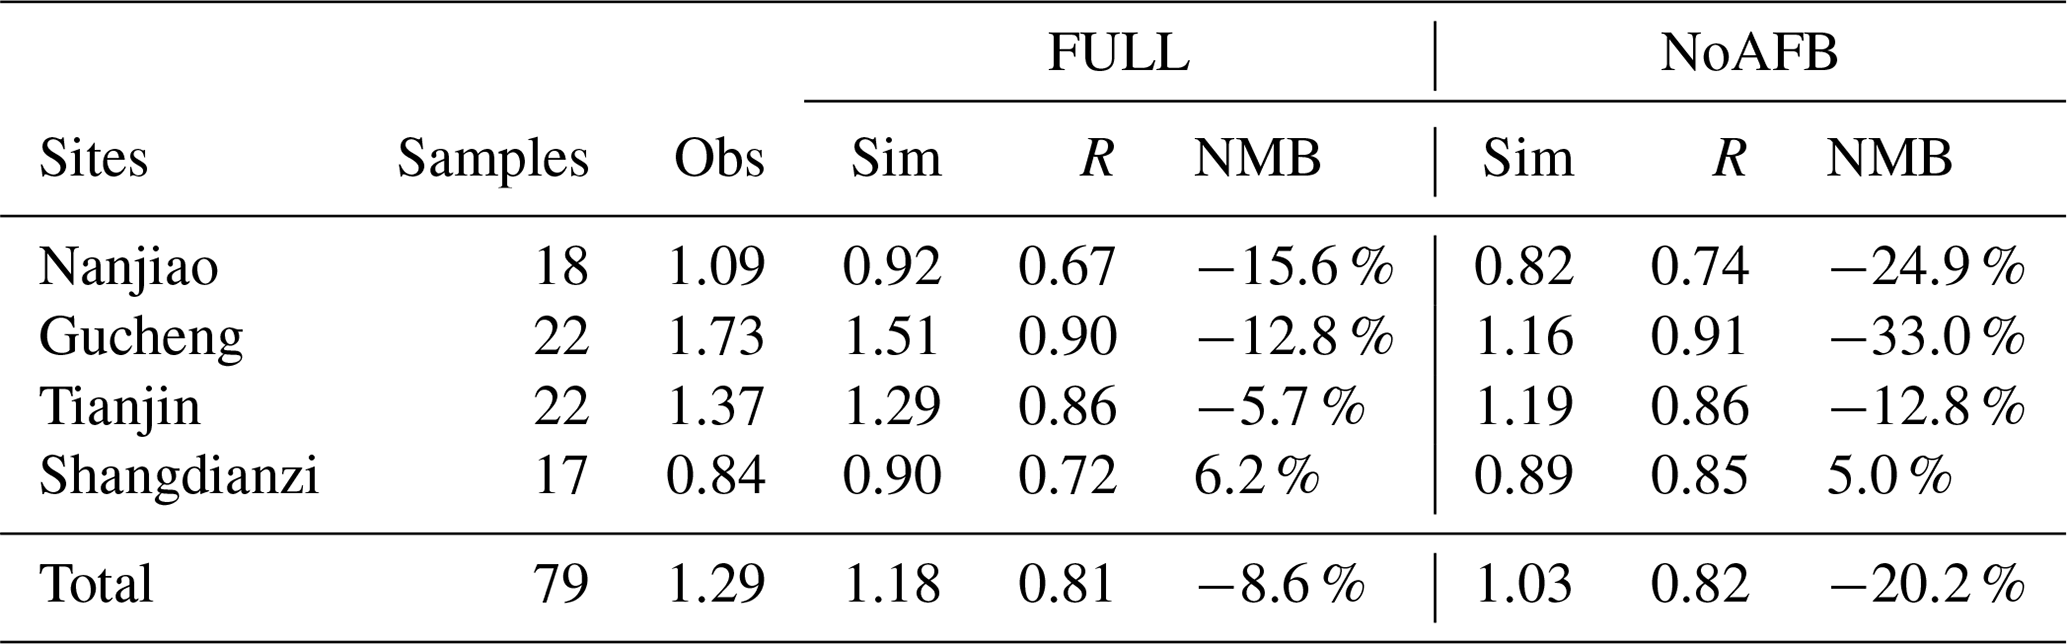
Table 3 summaries the performance statistics for daily-mean AOD. In general, the model reproduced the temporal variation and magnitude of AOD around Beijing reasonably well with the overall R of 0.81 (0.67 to 0.90) and NMB of −8.6 % (−15.6 % to 6.2 %). The low biases during the third haze episode (8–11 March) when inorganic aerosol concentrations were underestimated (Fig. 3a–c) mainly contributed to the underestimation. In addition, the limitation in AOD samples during the severe haze episode in Nanjiao and Shangdianzi could amplify the negative bias. At the Gucheng and Tianjin sites where more samples were available, the mean measured AODs were 1.7 and 1.4, respectively, agreeing well with the simulated values of 1.5 and 1.3 from the FULL case.
Table 3Performance statistics for daily-mean AOD at the four CARSNET sites in the BTH region. Mean observation (Obs), mean simulation (Sim), correlation coefficient (R), and normalized mean bias (NMB, in %) are listed.
In summary, the above comparisons demonstrate that RIEMS-Chem was capable of reproducing the spatial distribution and temporal variation of meteorological variables (air temperature, wind speed, surface shortwave radiation, PBL height, etc.); concentrations of total PM2.5 mass, and its chemical compositions; and aerosol optical properties during the winter haze periods around Beijing. It is also noteworthy that the inclusion of aerosol radiative effects apparently improved the overall model performance for both meteorological variables and aerosol physical and chemical properties, highlighting the necessity to develop online coupled chemistry–meteorology models for both air quality and climate research. The good agreement above increases confidence in the reliability of the following model results on aerosol radiative effects and feedback.
4.1 Distributions of meteorological variables and near-surface PM2.5 concentration
The period-mean distributions of near-surface wind speed (WS10), temperature (T2), relative humidity (RH2), PBL height, and PM2.5 concentration are shown in Fig. 6a to e. During the study period, westerly winds dominated the northwestern parts of the BTH region, while southeasterlies prevailed over the southeastern parts; as a result, the near-surface wind speeds were fairly weak over the convergence zone from southern Hebei province to Beijing (Fig. 6c). Such a wind pattern indicated that pollutants from southern parts of the domain (such as Shandong and Henan provinces) can be transported northward to Beijing, Tianjin, and Hebei, and air pollutants over the weak-wind regions were easily accumulated to a high level. Near-surface temperature showed an apparent south-to-north gradient, with surface air temperature in a range of 4 to 6 ∘C over the southern BTH region, −2 to 2 ∘C in the vicinity of Beijing and parts of central Hebei, and lower than −2 ∘C in northern parts of the domain (Fig. 6a). Relative humidity was higher (∼65 % to 75 %) over northern areas and lower (∼55 % to 65 %) over southern areas (Fig. 6b). PBL height also exhibited an apparent gradient in spatial distribution (Fig. 6d), ranging from 800–1000 m in northern Hebei and Inner Mongolia to about 600–700 m in southern Beijing, Tianjin, and southern Hebei. A belt of high PM2.5 concentration spread from southwest to northeast (Fig. 6e), with the maximum value up to 150 µg m−3 in the vicinity of Shijiazhuang and Beijing and Tianjin. The regions with high PM2.5 concentrations generally corresponded well to the weak-wind areas shown in Fig. 6c.
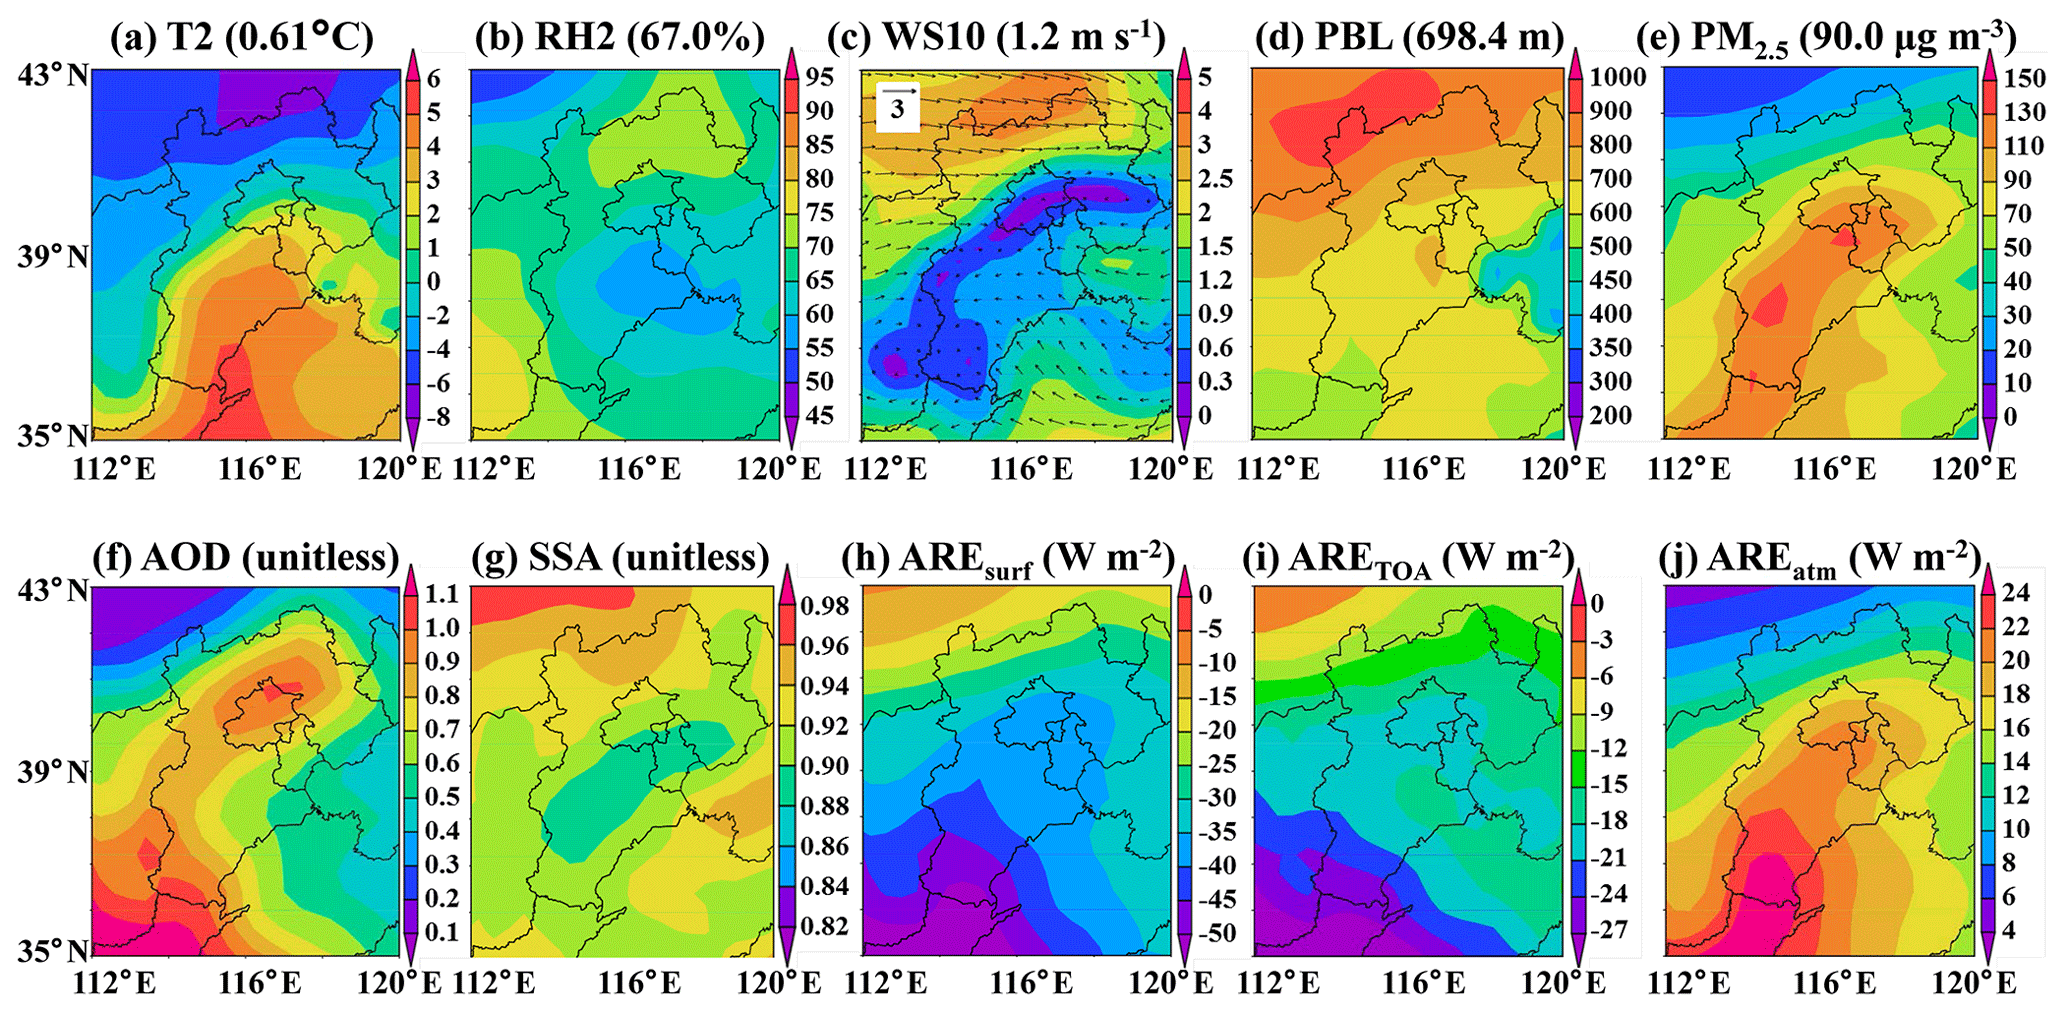
Figure 6The model-simulated (a) air temperature (T2), (b) relative humidity (RH2), (c) wind speed (WS10), (d) PBL height, (e) PM2.5 concentration, (f) AOD, (g) SSA, (h) all-sky aerosol radiative effect (ARE) at the surface, (i) all-sky ARE at the top of atmosphere and (j) all-sky ARE in the atmosphere from the FULL case. Numbers in the parentheses are averages over the BTH region during the entire study period.
Averaged over the BTH region and the entire study period, the simulated T2, WS10, RH2, PBL height, and PM2.5 concentration from the FULL case were 0.61 ∘C, 1.2 m s−1, 67.0 %, 698.4 m, and 90.0 µg m−3, respectively. According to the “Technical Regulation on Ambient Air Quality Index” prescribed by Chinese Ministry of Environmental Protection in 2012, a pollution event occurs when there is 24 h mean PM2.5 concentration ≥75 µg m−3. In total, there was 11 d with domain- and daily-average PM2.5 concentration exceeding 75 µg m−3 in the BTH region, with the maximum exceeding 136 µg m−3, indicating the severity of air pollution during the study period.
4.2 Distributions of AOD, SSA, and aerosol radiative effects
Figure 6f shows that high AODs mainly distributed from northern Beijing to the region of southwestern Hebei, southern Shanxi, and northern Henan provinces, with the maximum up to 1.1. As AOD was determined by vertical profiles of aerosol compositions and RH, the spatial distribution of AOD was somewhat different from that of PM2.5 concentration. During the study period, the regional mean AOD in the BTH region was 0.78 (Table 4), about twice the long-term observed value of about 0.4 in February and March in the same region (Song et al., 2018).
Table 4The model-simulated domain and period averages of AOD, SSA, and AREs from the FULL case over the BTH region.
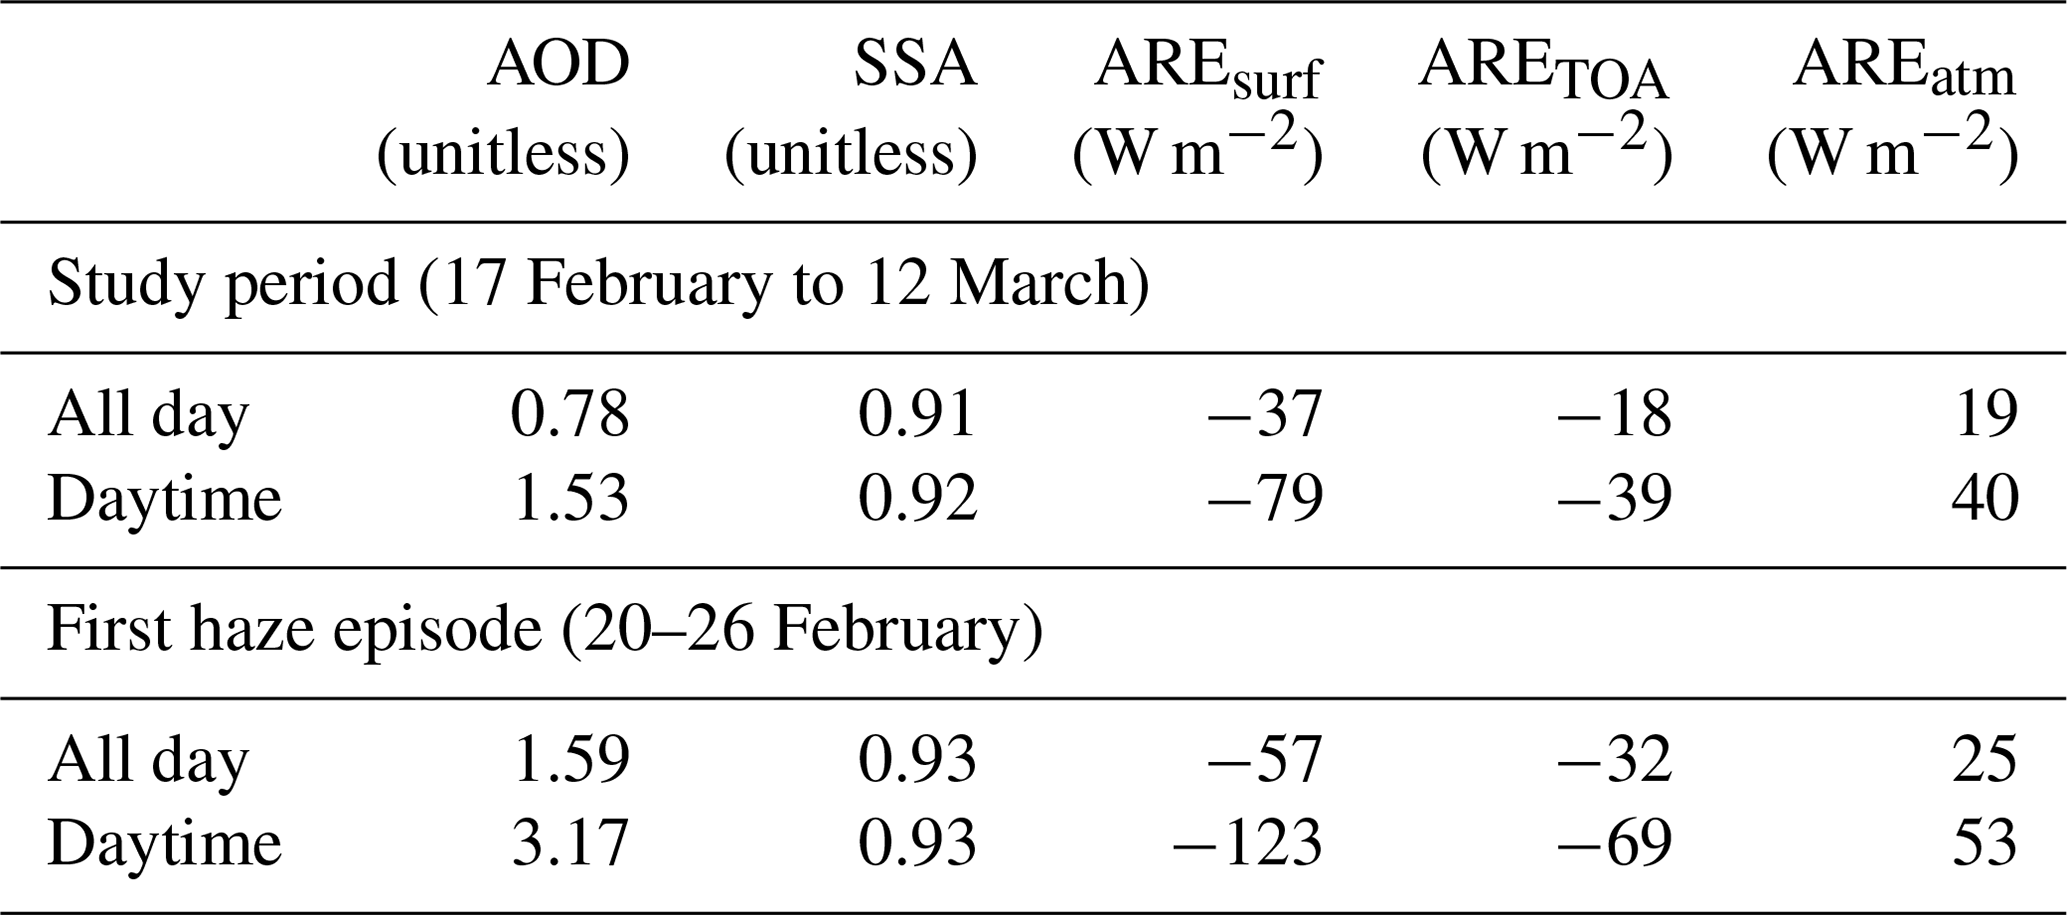
The simulated SSAs were above 0.88 in the BTH region (Fig. 6g), with relatively lower values (0.88–0.9) in the areas of high PM2.5 concentration and higher ones (0.92–0.98) in the relatively clean areas. On average, the simulated SSA in the BTH region was 0.91 (Table 4), within the range of 0.87–0.95 measured in the same region in January 2013 (Che et al., 2014) but slightly lower than the model-simulated annual mean of 0.95 over eastern China (Zhuang et al., 2013).
All-sky aerosol radiative effects at the surface (AREsurf), at the top of atmosphere (ARETOA), and in the atmosphere (AREatm) under all-sky conditions are presented in Fig. 6h to j. During the study period, aerosols induced a negative ARE at both the surface and TOA and a positive ARE in the atmosphere over the BTH region. The distribution of ARE resembles that of AOD, generally showing stronger effects over southwestern Hebei, Shanxi, and northern Henan provinces where high AOD occurred. Moderate AREs appeared over Beijing, Tianjin, and central Hebei, while relatively weak AREs appeared over the northern domain. The domain-average AREs in the BTH region during the period were estimated to be −37, 19, and −18 W m−2 at the surface, in the atmosphere, and at the TOA, respectively (Table 4). The indirect radiative effect was also estimated to be about −2 W m2 at the surface and the TOA on average, which was much smaller than the direct radiative effect; therefore, the total aerosol radiative feedback was predominated by the direct radiative effect during the study period.
The domain-average all-sky AREs during the first haze episode (20–26 February) were −57, 25, and −32 W m−2 at the surface, in the atmosphere, and at the TOA, respectively, and the values were further enhanced to −123, 53, and −70 W m−2 in terms of daytime mean. The maximum AREs at the surface and at TOA reached −384 and −231 W m−2, respectively, at 13:00 LST on 23 February in the vicinity of Shijiazhuang.
In Beijing, the estimated mean AREs were −70, 32, and −38 W m−2 at the surface, in the atmosphere, and at the TOA, respectively, during the first haze episode, whereas the maximum ARE at the surface reached −304 W m−2 at 13:00 LST on 22 February, which was associated with the high PM2.5 concentration (453 µg m−3) at that time.
Based on in situ surface measurements, Che et al. (2014) estimated that, during haze periods in January 2013, the mean daytime AREs at Nanjiao and Xianghe were approximately −42 and −50 W m−2 at TOA, and they were −120 W m−2 at the surface at both sites. In this study, the daytime AREs averaged over the severe haze period (20–26 February) at TOA were estimated to be −77 and −74 W m−2 at Nanjiao and Xianghe, while the corresponding AREs at the surface were −146 and −140 W m−2, respectively. Che et al. (2014) also reported the maximum daily-mean surface ARE of −220 W m−2 at Nanjiao during a severe haze episode in January 2013; in this study, the corresponding ARE was estimated to be approximately −200 W m−2 at the same site during the severe haze episode in February 2014. Therefore, the magnitudes of AREs during haze episodes simulated from this study agreed favorably with the above observation-based estimations around Beijing, despite the different time periods.
4.3 The feedback effects on meteorological variables and aerosols
Figure 7a–e show the mean differences in T2, RH2, wind speed, PBL height, and near-surface PM2.5 concentration induced by the radiative feedback due to all aerosols (FULL minus NoAFB) in the domain during the study period.
The aerosol radiative effects led to a reduction in surface shortwave radiation and thus surface air temperature in the entire domain. The magnitude of T2 variation decreased from south to north of BTH, with −1.6 to −2 ∘C in southern Hebei and −1.2 to −1.8 ∘C in southern Beijing, respectively. Correspondingly, RH2 increased by 10 %–16 % in the above regions. The changes in wind speed showed a patchy pattern, with decreases by ∼0.1 m s−1 in southern Hebei, increases by ∼0.2 m s−1 in central Hebei, and decreases in most parts of Beijing. Wind vectors show an anomalous northerly wind of ∼0.5 m s−1 in the BTH region. Due to the reduction in surface shortwave radiation, PBL height decreased over the entire region, with the maximums up to 240 m in southern Hebei and northern Tianjin. The changes in PBL height varied from −210 m in southern Beijing to −90 m in northern Beijing. PM2.5 concentrations were consistently enhanced over the entire region, with the maximum increase up to 33 µg m−3 in southern Hebei and portions of Beijing and Tianjin. In most of the BTH region, the percentage increase of PM2.5 exceeded 25 %, with the maximum increase exceeding 33 % in the vicinity of Shijiazhuang. It is of interest that the regions with the maximum increase of PM2.5 generally corresponded to those with the maximum decrease in PBL height. The presence of aerosols reduced solar radiation reaching the ground surface, resulting in decreases in surface air temperature and PBL height and an increase in relative humidity, all of which favored accumulation and formation of aerosols due to weakened vertical mixing and enhanced secondary aerosol formation.
The aerosol feedback during the first haze episode was further explored due to the much higher PM2.5 level than the period average. Figure 7f–j show the mean changes in meteorological variables and PM2.5 concentrations during the first haze episode (20–26 February). In general, the changes induced by aerosol feedback were larger during the severe haze episode than those over the entire study period. T2 decreased by 1.8 to 2.7 ∘C along with an increase up to 20 % in RH in southern Hebei and southern parts of Beijing and Tianjin. Unlike the entire period average, wind speed decreased consistently in BTH, with a maximum decrease of 1 m s−1. PBL height decreased by ∼300 m in southern Hebei, corresponding to the areas with large air temperature decrease. This resulted in a consistent increase in PM2.5 concentrations in the study domain, with the maximum increases exceeding 50 % around Shijiazhuang and approximately 40 % in Beijing and Tianjin, apparently higher than the entire period averages. For daytime mean, the percentage changes in PM2.5 in the above areas increased to 70 % and 60 %, respectively (figure not shown). It is striking that the simulated maximum increase in hourly PM2.5 concentration can be up to 372 µg m−3 (186 %) in the vicinity of Shijiazhuang at about 10:00 LST on 24 February during the first haze episode, which demonstrates the substantial impact of the radiative feedback on PM2.5 concentration and haze formation.
It is worthwhile to further explore the effect of aerosol feedback during haze evolution. We divided the haze episode into three stages: the growth stage is defined as the time period of PM2.5 increase from clean conditions to heavy pollution level, the persistence stage as the period of haze duration, and the dissipation stage as the period with a sharp decrease in PM2.5 concentration usually along with a cold front passage. During the first heavy haze episode (20–26 February) in Beijing, aerosol radiative feedback caused the increases in PM2.5 concentration of 55, 84, and 40 µg m−3, with the fractional changes of 31 %, 41 %, and 67 %, respectively, during the growth, persistence, and dissipation stages. The larger fractional change of PM2.5 in the dissipation stage is due to the relatively large feedback-induced increase and the lowest PM2.5 concentration in the NoAFB case in this stage. During the second haze episode (1–4 March), the increases in PM2.5 concentration due to aerosol feedback were 25, 45, and 24 µg m−3, with the fractional changes of 21 %, 35 %, and 34 %, respectively, which are lower than the feedback effect during the first haze episode. So, in terms of magnitude, the largest feedback effect on PM2.5 occurred in the persistence stage, followed by that in the growth stage, although the fractional change of PM2.5 was larger in the dissipation stage.
Table 5The model-simulated feedback-induced changes (FULL minus NoAFB) in T2, WS10, RH2, PBL height, PM2.5 concentration, and vertical diffusion coefficient (Kz) averaged over the BTH region during the entire period and the first haze episode. Inside the parentheses are percentage changes relative to the NoAFB case.
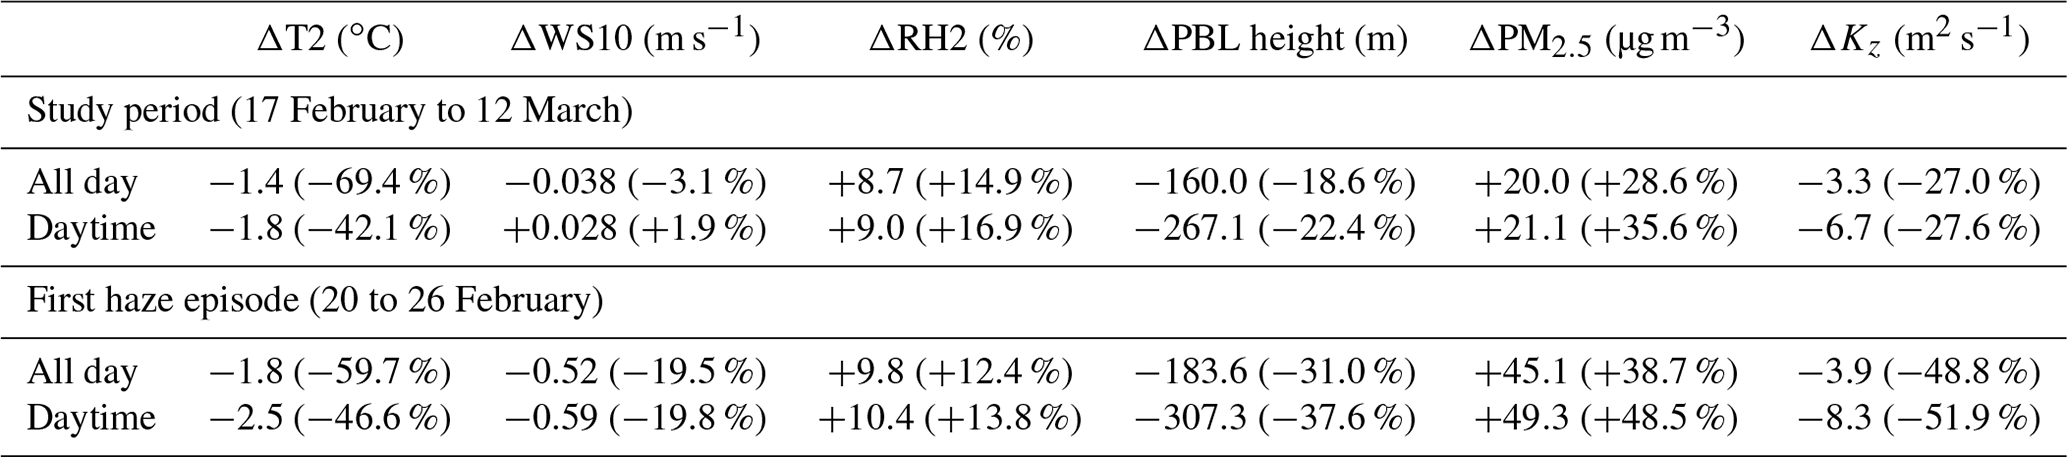
Table 5 summarizes the average feedback-induced changes in meteorological variables and PM2.5 concentrations over the BTH region during the entire period and the first haze period. During the study period, due to the radiative feedback by all aerosols (FULL minus NoAFB), surface air temperature and wind speed decreased by 1.4 ∘C and 0.04 m s−1, respectively, and RH increased by 8.7 % in BTH. PBL height was reduced by 160 m (or a percentage change of −18.6 %) on average, along with a reduction of 3.3 m2 s−1 (−27.0 %) in vertical diffusivity coefficient (Kz), resulting in an increase of PM2.5 level by 20.0 µg m−3 (28.6 %). It is noticed that the above changes were strengthened during the severe haze episode on 20–26 February, with the 7 d average decreases in T2, WS10, PBL height, and Kz being up to −1.8 ∘C, −0.5 m s−1, −183.6 m (−31.0 %), and 3.9 m2 s−1 (−48.8 %), respectively, and the PM2.5 concentration increased by 45.1 µg m−3 with a percentage increase of 38.7 %. Because aerosols affect solar radiation in daytime, in term of daytime mean, the 7 d mean changes in T2, WS10, and PBL height were estimated to be −2.5 ∘C, −0.6 m s−1, and −307.3 m (−37.6 %), respectively, leading to an increase of 49.3 µg m−3 (48.5 %) in PM2.5 concentration.
The impact of aerosol radiative feedback in Beijing (Table 6) was stronger than the regional mean. During the first haze episode, the 7 d average changes in T2, WS10, RH2, PBL, and PM2.5 were estimated to be −2.1 ∘C, −0.6 m s−1, 17.0 %, −195.6 m (−35.9 %), and 68.0 µg m−3 (39.1 %), respectively, and the daytime mean change in PM2.5 concentration increased to 83.2 µg m−3 (60 %).

Table 7The model-simulated feedback-induced changes (FULL minus NoAFB) in BC, sulfate (SO), and nitrate (NO) averaged over the BTH region and Beijing during the entire period and the first haze episode. Inside the parentheses are percentage changes relative to the NoAFB case.
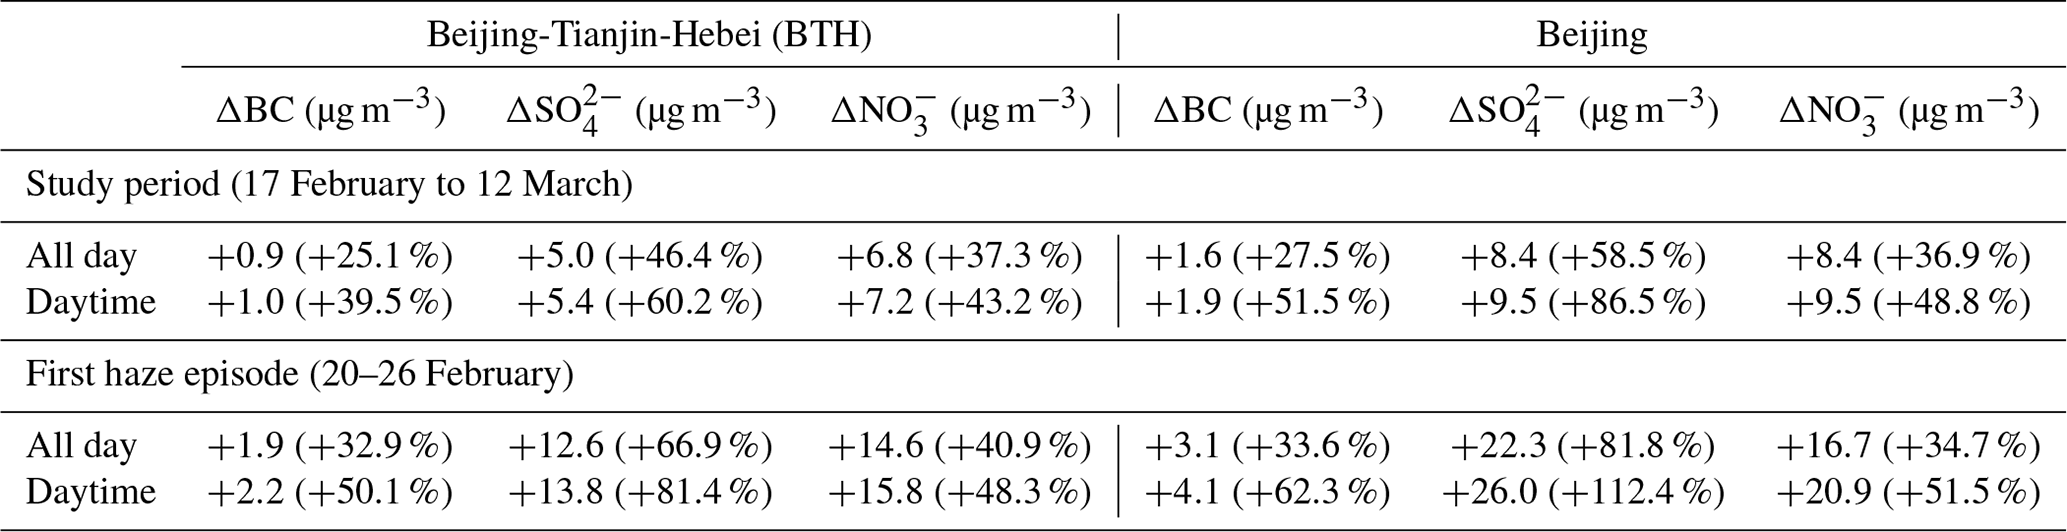
Table 7 presents the average changes in major aerosol components (BC, sulfate, and nitrate) in PM2.5 induced by the feedback effect. Over the BTH region, the feedback caused the average increases in sulfate and nitrate by 5.0 µg m−3 (46.4 %) and 6.8 µg m−3 (37.3 %), respectively, for the entire period and by up to 12.6 µg m−3 (66.9 %) and 14.6 µg m−3 (40.9 %) for the first haze episode. The feedback-induced increases in BC were 0.9 µg m−3 (25.1 %) and 1.9 µg m−3 (32.9 %), respectively, for the entire period and the first haze episode. It was noticed that the feedback-induced changes in sulfate and nitrate concentrations were larger than that in BC concentration. This was because the concentrations of secondary aerosols were increased not only by weakened vertical diffusivity but also by enhanced chemical reactions due to the radiative feedback, which will be discussed in detail in Sect. 5.2.
The above analysis demonstrates a significant impact of aerosol feedback on PM2.5 concentration during winter haze episodes in the BTH region. Previous modeling studies reported different degrees of aerosol radiative feedback in east China. Gao et al. (2015) simulated an increase of near-surface PM2.5 concentrations to be 10–50 µg m−3, or 5 %–25 %, in BTH during a severe haze episode on 10–15 January 2013 by using WRF-Chem. For the similar time period and region, Z. Wang et al. (2014) reported an increase in PM2.5 concentrations by 15–50 µg m−3, or 10 %–30 %, by using the regional coupled model NAQPMS. Wu et al. (2019) used WRF-Chem to investigate a haze episode from 5 December 2015 to 4 January 2016 in the North China Plain, and found that the aerosol radiative effects can enhance near-surface PM2.5 concentration by 10.2 µg m−3 (7.8 %) on average.
The results from this study demonstrate a stronger aerosol–radiation feedback than previous modeling studies, with an average increase in PM2.5 concentration by up to 45.1 µg m−3 (38.7 %) during a severe haze episode and further to 49.3 µg m−3 (48.5 %) for daytime mean over the BTH region. This study also highlights that the aerosol feedback effect can result in an increase in hourly PM2.5 concentrations by up to 372 µg m−3 (186 %) in the vicinity of Shijiazhuang during the severe haze episode. The stronger feedback effect in this study compared to previous model simulations is mainly due to the predicted higher concentration of aerosol components (especially inorganic aerosols) and aerosol optical properties, which are also in better agreement with observations. It is noticed that a recent study (Zhong et al., 2018a) reported that the aerosol feedback effect contributed over 70 % to PM2.5 increase during the cumulative explosive stage of the haze event in winter Beijing based on integrated analysis of observations from 2013 to 2016, which suggested a dominant role of the feedback effect in haze formation.
The process analysis (PA) method calculates the integrated process rates (IPRs) and is applied to quantify the individual contributions of different physical and chemical processes to variations of PM2.5 and its chemical components. These processes include emission, horizontal and vertical advection (HADV and VADV), horizontal and vertical diffusion (HDIF and VDIF), dry deposition (DDEP), cloud (CLD, including aqueous chemistry and wet scavenging), gas chemistry (GAS), thermodynamic chemistry (Thermo), and heterogeneous chemistry (HET). The focus of this study is Beijing, so the model grid cell near the surface for Beijing is selected for analysis.
5.1 The mechanism of haze evolution related to various processes
5.1.1 Haze evolution during 20–26 February
There was a severe haze event lasting for about 7 d, with the maximum hourly PM2.5 up to 482 µg m−3 on 26 February. This haze was initially formed on 20 February. The observed surface PM2.5 concentration was less than 50 µg m−3 on 19 February, it rapidly increased to 343 µg m−3 on 20 February, and it reached 482 µg m−3, followed by rapid haze dissipation, on 26 February due to the arrival of a cold front.

Figure 7The model-simulated feedback-induced changes (FULL minus NoAFB) in (a, f) air temperature (T2), (b, g) relative humidity (RH2), (c, h) wind speed (WS10), (d, i) PBL height and (e, j) PM2.5 concentration averaged over the entire study period (a–e) and over the first haze episode (20–26 February) (f–j). Units are given in the parentheses.
PA was used to provide insights into the evolution mechanism of the haze episode, which was divided into the clean, growth, persistence, and dissipation stages in this study. Figure 8 shows the average process budgets for changes in PM2.5 (which is the sum of sulfate, nitrate, ammonium, BC, OC, SOC, and primary PM2.5) and its major components in Beijing during the four stages of the first haze period (Fig. 8) from the FULL simulation. Figure 8a shows the hourly IPRs of PM2.5 by physical and chemical processes. The emission of primary aerosols was the largest contributor to the PM2.5 mass with a constant IPR of 29.8 µg m−3 h−1 (not shown in Fig. 8a for clarity) due to the use of a monthly based emission inventory. Chemical processes (GAS, Thermo, and HET) also contributed largely to PM2.5, with generally larger contributions in the growth and persistence stages. Thermodynamic equilibrium processes and gas chemistry accounted for over two-thirds of the chemical contributions, with the former process mainly accounting for the formation of nitrate and ammonium and the latter one for sulfate formation. The contribution from heterogeneous reactions was generally small, but when conditions were favorable (such as high RH and high aerosol concentration providing sufficient reaction surfaces), its contribution would also be significant, such as on the morning of 22 February, at nighttime from 23 to 24 February, and on the mornings of 25 and 26 February. Vertical diffusion and dry deposition consistently removed PM2.5 from the atmosphere. In general, the larger IPRs from both VDIF and DDEP during the clean and dissipation stages resulted in lower PM2.5 concentrations, whereas the lower IPRs from VDIF and DDEP in the growth stage favored aerosol accumulation. In the persistence stage, the IPRs of VDIF and DDEP were generally small. It should be noted that at every midday, when PBL was fully developed, the vertical diffusion reached the daily maximum, producing distinctly large negative IPRs of VDIF. Advection (HADV and VADV) and horizontal diffusion either contributed to the accumulation or loss of PM2.5. During this severe haze episode, horizontal diffusion served as a sink of PM2.5, producing a negative IPR of HDIF through the event. Horizontal advection served as a sink of PM2.5 for most of the time, leading to a negative IPR of HADV; however, when the removal of PM2.5 by vertical diffusion was strong at midday, aerosols were advected to Beijing from surrounding areas due to mass balance, resulting in a positive IPR of HADV. The positive IPR of VADV during the growth and persistence stages of this event indicated that the downward transport of aerosols from upper levels also contributed to the PM2.5 increase, such as on the mornings of 22 and 25 February. In general, the IPRs (represented the net effect of all processes, denoted by the red line in Fig. 8a) exhibited small positive values from evening to next morning on every day, indicating a gradually increasing PM2.5 concentration, whereas at every midday, relatively large negative IPRs occurred, indicating an apparent decrease in PM2.5 concentration at that time. It should be mentioned that even in the persistence stage, the diurnal variation of PM2.5 occurred, although the change rates were generally weaker than those in the growth and dissipation stages.
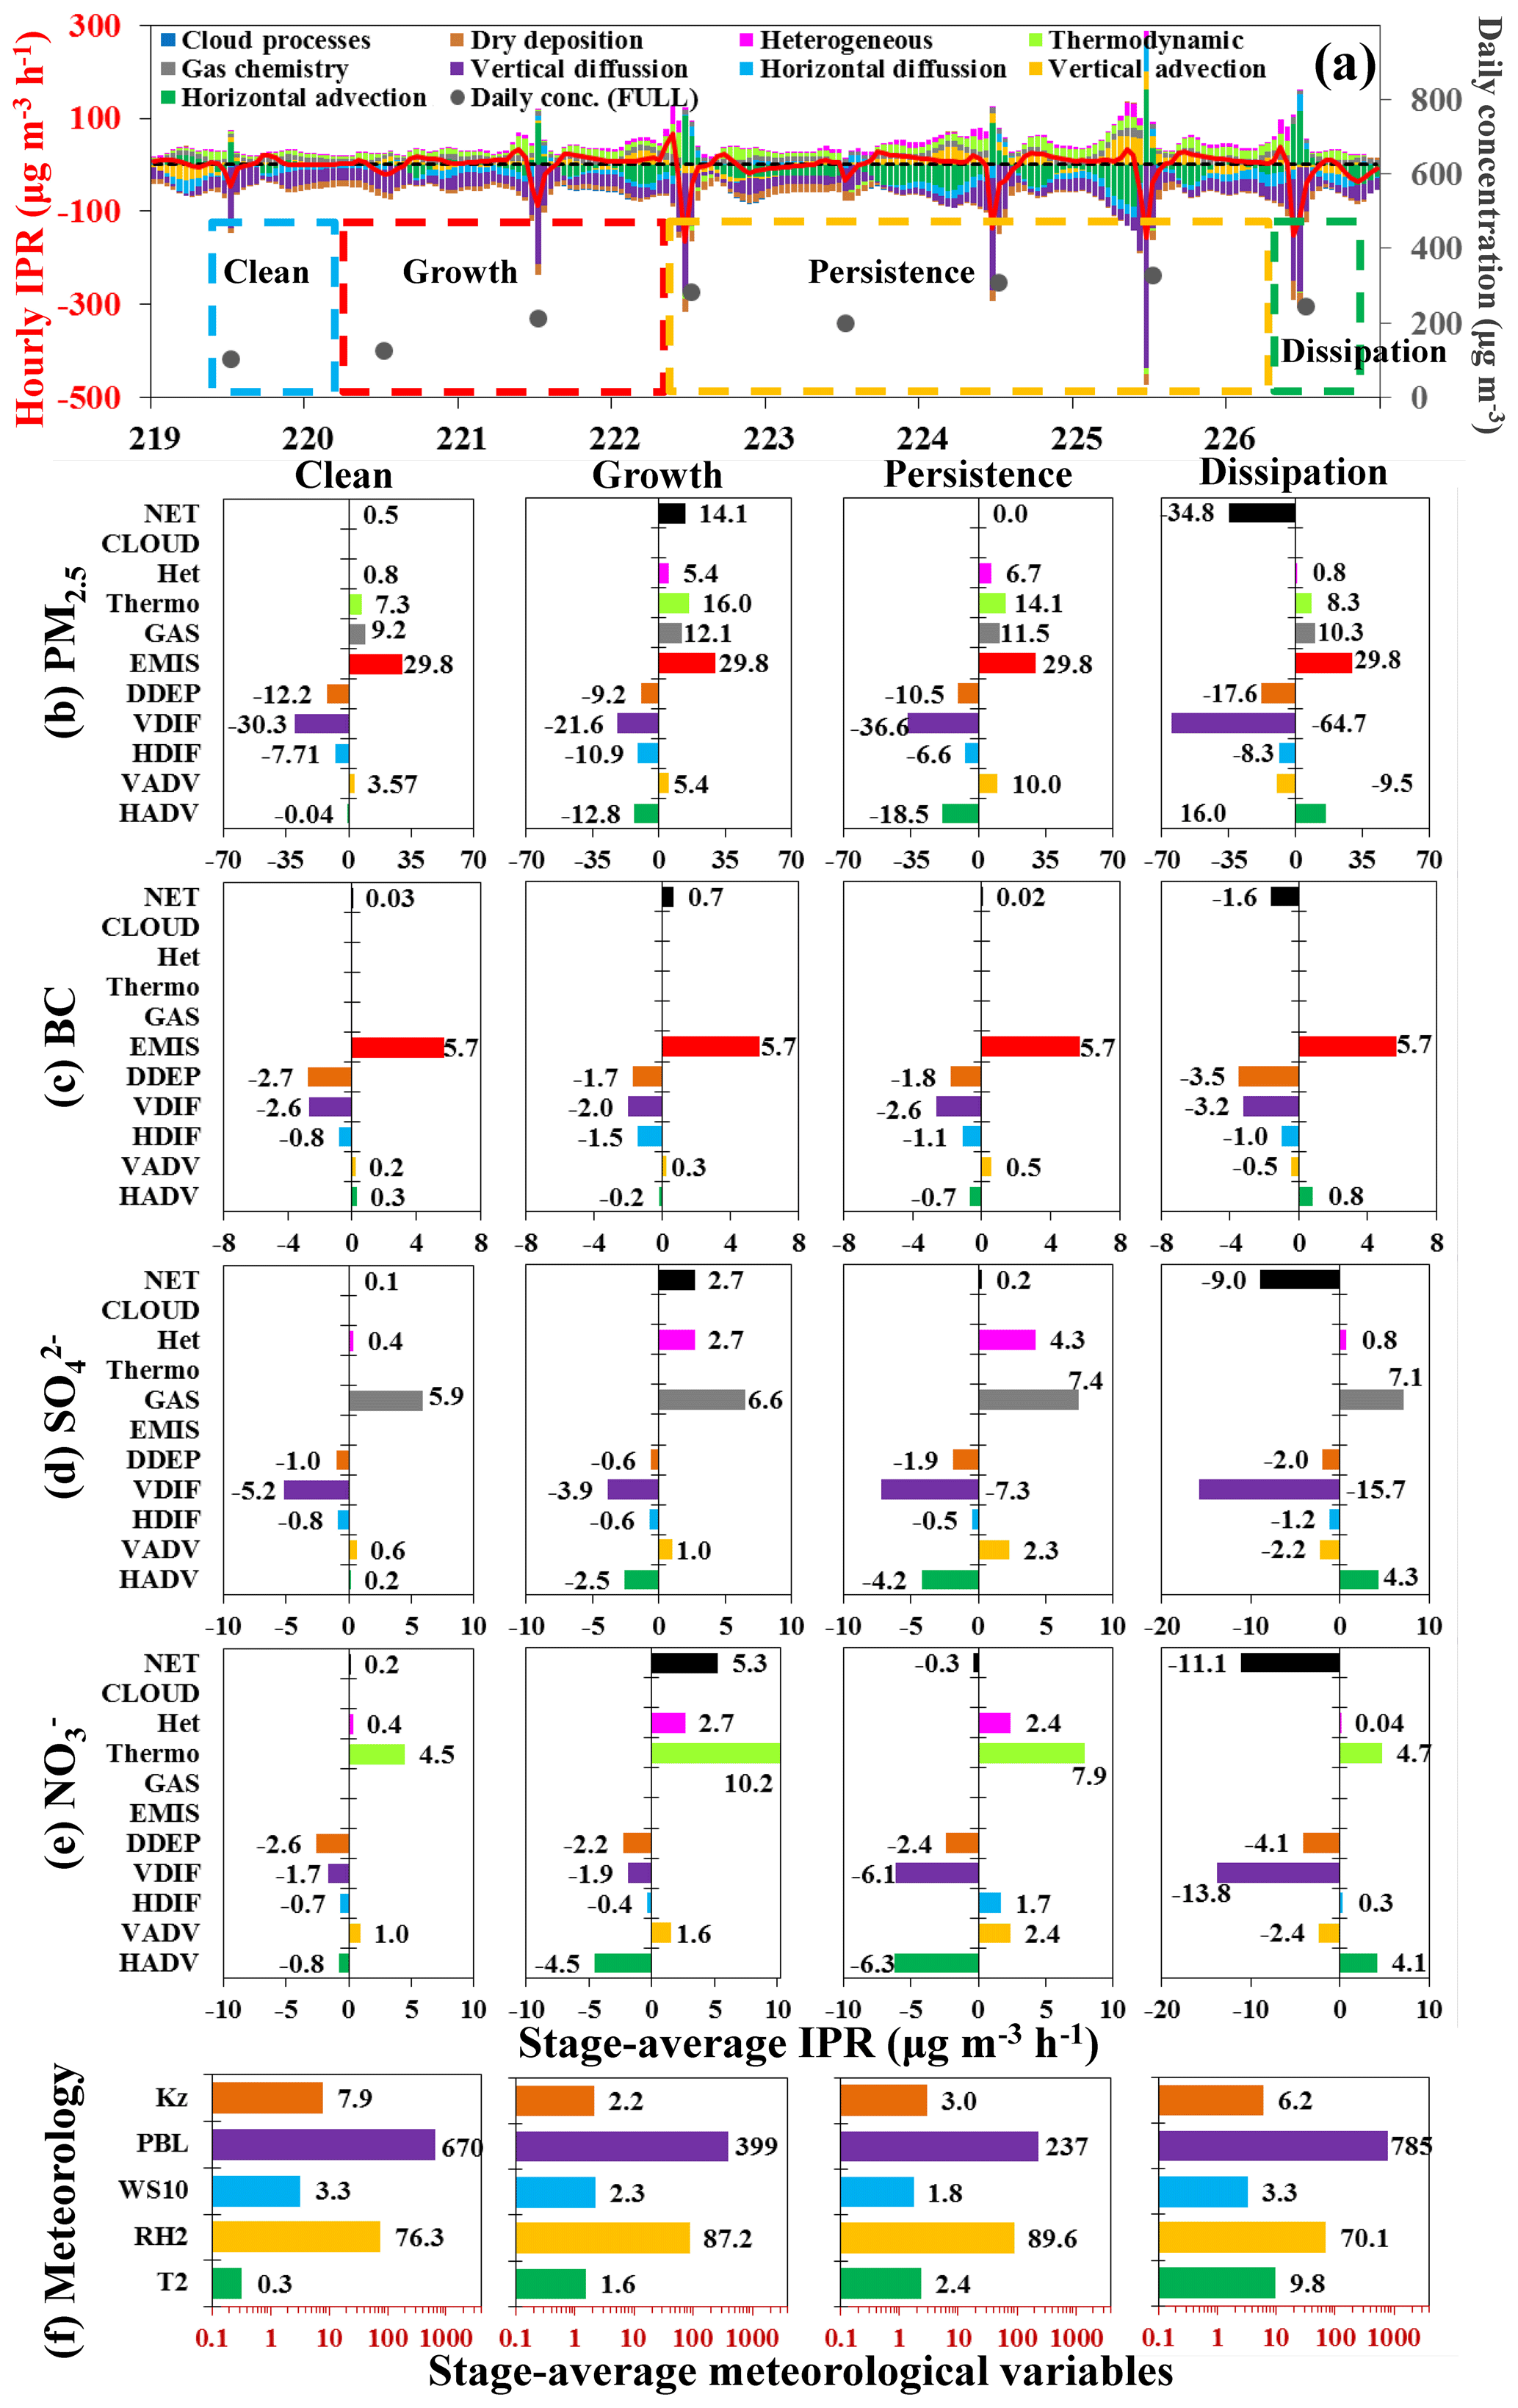
Figure 8The model-calculated integrated process rates (IPRs) for the first haze episode (20–26 February) in Beijing. (a) Hourly IPR, daily PM2.5 concentration, and the division of the four stages. The nearly constant IPRs of emissions are not shown for clarity. The mean IPRs for (b) PM2.5, (c) BC, (d) sulfate (SO), (e) nitrate (), and (f) mean meteorological variables are in the four stages. Note that zero IPR values are not listed. (Units of T2, RH2, WS10, PBL, and Kz are ∘C, %, m s−1, m, and m2 s−1, respectively.)
Figure 8b to f show the mean IPRs for PM2.5 and its major chemical components, as well as the key meteorological variables averaged over each stage, to help interpret the formation and evolution mechanism of this severe haze episode.
In the clean stage, emission and chemistry were the two major processes for PM2.5 production (Fig. 8b). Emission contributed predominately to PM2.5 production (IPR of 29.8 µg m−3 h−1), whereas the contributions of gas (9.2 µg m−3 h−1) and thermodynamic chemistry (7.3 µg m−3 h−1) were comparable. The most influential process for PM2.5 removal was vertical diffusion, with the IPR of −30.3 µg m−3h−1, comparable to that of emission. Dry deposition was the second most important process for PM2.5 loss (−12.2 µg m−3 h−1), followed by horizontal diffusion. Advection had a negligible effect on PM2.5 in this stage. In the growth stage, it is noteworthy that the contributions from vertical diffusion (VDIF) and dry deposition (DDEP) to PM2.5 removal decreased markedly from −30.3 and −12.2 µg m−3 h−1 in the clean stage to −21.6 and −9.2 µg m−3 h−1, respectively (Fig. 8b), mainly due to the decrease in wind speed and the increase in stability indicated by the reduced vertical diffusivity coefficient Kz (Fig. 8f), leading to increases in concentrations of all species. It is impressive that the contributions from chemical processes (GAS + Thermo + HET) apparently increased compared with those in the clean stage, with the IPRs from gas, thermodynamic, and heterogeneous chemistry increasing to 12.1, 16.0, and 5.4 µg m−3 h−1, respectively. The increase in the contribution from heterogeneous chemistry was mainly attributed to the increase in relative humidity and aerosol surfaces, upon which heterogeneous reactions took place. It is noticed that the contribution of thermodynamic chemistry increased with increasing relative humidity as well along with haze formation (Fig. 8f). The increase in the contribution of thermodynamic chemistry is remarkable (with IPR from 7.3 to 16 µg m−3 h−1), because gas precursors of aerosols that increased due to weakened vertical diffusivity and higher relative humidity during the haze period favored condensation from gas to aerosol phase. It is of interest that vertical advection also contributed to PM2.5 production (IPR of 5.4 µg m−3 h−1) in this stage, which indicated a potential downward import of PM2.5 from upper layers. It is also noticed that horizontal advection contributed to PM2.5 loss (−12.8 µg m−3 h−1). This is because the strong gradient between the increased PM2.5 level in Beijing caused by weakened vertical diffusivity and the relatively lower PM2.5 level in the surrounding areas, which led to an outflow of PM2.5. In the growth stage, the net variation rate (IPR) of PM2.5 concentration was 14.1 µg m−3 h−1, in which emissions, chemical processes (GAS + Therm + HET), and physical processes (HADV + VADV + HDIF + VDIF + DDEP) contributed 29.8, 33.5, and −49.2 µg m−3 h−1, respectively. In the persistence stage, the chemical production rate of PM2.5 changed slightly, and the production and loss rates of PM2.5 were similar, leading to an approximately zero IPR in this stage (Fig. 8b). In the dissipation stage, the contribution of vertical diffusion and dry deposition to PM2.5 loss increased largely, while the total chemical production rate decreased, which resulted in a net IPR of −34.8 µg m−3 h−1, indicating a substantial decrease in PM2.5 concentration (Fig. 8b). It was also noticed that HADV contributed to PM2.5 production in this stage, which was due to mass import to Beijing from upwind areas by northwesterlies.
It should be mentioned that the contribution of emission was unchanged, because the monthly based emission inventory from MEIC was used; the contribution of the cloud process was generally negligible throughout the period, because there was only few clouds and little precipitation during the study period.
We further use PA to interpret evolution processes of primary (BC) and secondary (sulfate and nitrate) aerosols.
Black carbon is considered to be inert and chemically inactive, so it is governed solely by physical processes. In the clean stage, BC production was contributed solely by emission (5.7 µg m−3 h−1), whereas vertical diffusion and dry deposition contributed equally to BC loss (−2.7 µg m−3 h−1), and other processes were negligible (Fig. 8c). In the growth stage, the contribution of vertical diffusion and dry deposition to BC loss decreased to −2.0 and −1.7 µg m−3 h−1, respectively, and the net rate of change was 0.7 µg m−3 h−1, indicating a rapid increase of BC concentration in this stage (Fig. 8c). In the persistence stage, the loss rate by vertical diffusivity and dry deposition further increased mainly due to the increased BC concentration (Fig. 8c). It is noticed that horizontal advection somewhat contributed to the loss of BC (−0.7 µg m−3 h−1), which indicated an increasing outflow of BC to surrounding areas. The IPR was near zero, indicating a balance of production and loss rate in this stage. In the dissipation stage, BC loss via vertical diffusion and dry deposition processes increased greatly, mainly due to increasing wind speed and vertical diffusivity, and the net IPR became −1.6 µg m−3 h−1. This absolute value was larger than that in the growth stage (0.7 µg m−3 h−1), which indicated a faster decrease in BC concentration than the BC increase in the growth stage (Fig. 8c).
As for secondary aerosols, like sulfate, the contribution from direct emission was near zero. In the clean stage, gas chemistry (5.9 µg m−3 h−1) was the predominant process for sulfate production, and vertical diffusion contributed most to the loss (−5.2 µg m−3 h−1) (Fig. 8d). In the growth stage, the contribution from vertical diffusion was reduced to −3.9 µg m−3 h−1, mainly due to the decreased vertical diffusivity (Fig. 8f), whereas the positive contribution from gas chemistry increased to 6.6 µg m−3 h−1, which resulted from competitive processes. For sulfate formation from gas chemistry (, followed by nucleation or condensation into particulate phase), the oxidation of SO2 to sulfate was weakened because of decreasing OH radicals due to increasing aerosol attenuation of solar radiation; however, SO2 increased due to weakened vertical diffusivity, leading to a slight net increase of sulfate concentration compared with the clean stage. It is noteworthy that the sulfate production rate from heterogeneous reactions increased to 2.7 µg m−3 h−1, mainly due to the increases in SO2, aerosol surfaces, and RH (as well as aerosol water content). All the processes led to a net sulfate production rate of 2.7 µg m−3 h−1, in which chemistry played a predominant role (IPR of 9.3 µg m−3 h−1). In the persistence stage, the contribution of gas and heterogeneous processes further increased to 7.4 and 4.3 µg m−3 h−1, indicating an increasing sulfate production through chemical processes (Fig. 8d). It is interesting to note that vertical diffusion contributed more to sulfate loss than in the growth stage, which was mainly due to the higher sulfate level than in the growth stage, while vertical diffusivity coefficients were almost the same. The net IPR in this stage was just 0.2 µg m−3 h−1, which indicated an approximate balance of production and loss. In the dissipation stage, increasing vertical diffusivity was the dominant process for sulfate loss, and chemical contribution decreased. It is noticed that there is a positive contribution to sulfate from horizontal advection (IPR of 4.3 µg m−3 h−1), which was due to an import of sulfate from upwind areas of Beijing by northwesterly winds, like those for PM2.5 and BC.
For nitrate, in the clean stage, the thermodynamic process (4.5 µg m−3 h−1) was the largest contributor to nitrate production (Fig. 8e). During the growth stage, the contribution of thermodynamic processes (10.2 µg m−3 h−1) increased by over a factor of 2, and was larger than the contribution from the heterogeneous process (Fig. 8e). The substantial increase in the contribution of thermodynamic processes to nitrate production was due to the combined effects of the increased level of nitrate precursors (HNO3 and NH3), resulting from weakened diffusivity, and the increased RH along with the decreased air temperature, which were favorable for gas to aerosol conversion. The contribution of heterogeneous reactions increased as well due to the increased aerosol surface and relative humidity. The net rate of nitrate change in this stage was 5.3 µg m−3 h−1. In the persistence stage, the contribution from heterogeneous reactions changed slightly, while the contribution from the thermodynamic process somewhat reduced (Fig. 8e). This is because more NH3 was consumed to neutralize the increased sulfate, leaving less NH3 to react with HNO3 and thus producing less nitrate. The near-zero net IPR of nitrate in this stage also indicated a balance of production and loss. In the dissipating stage, the contribution of chemical processes was almost the same as that in the clean stage, while physical processes dominated the loss and the net IPR of nitrate (Fig. 8e).
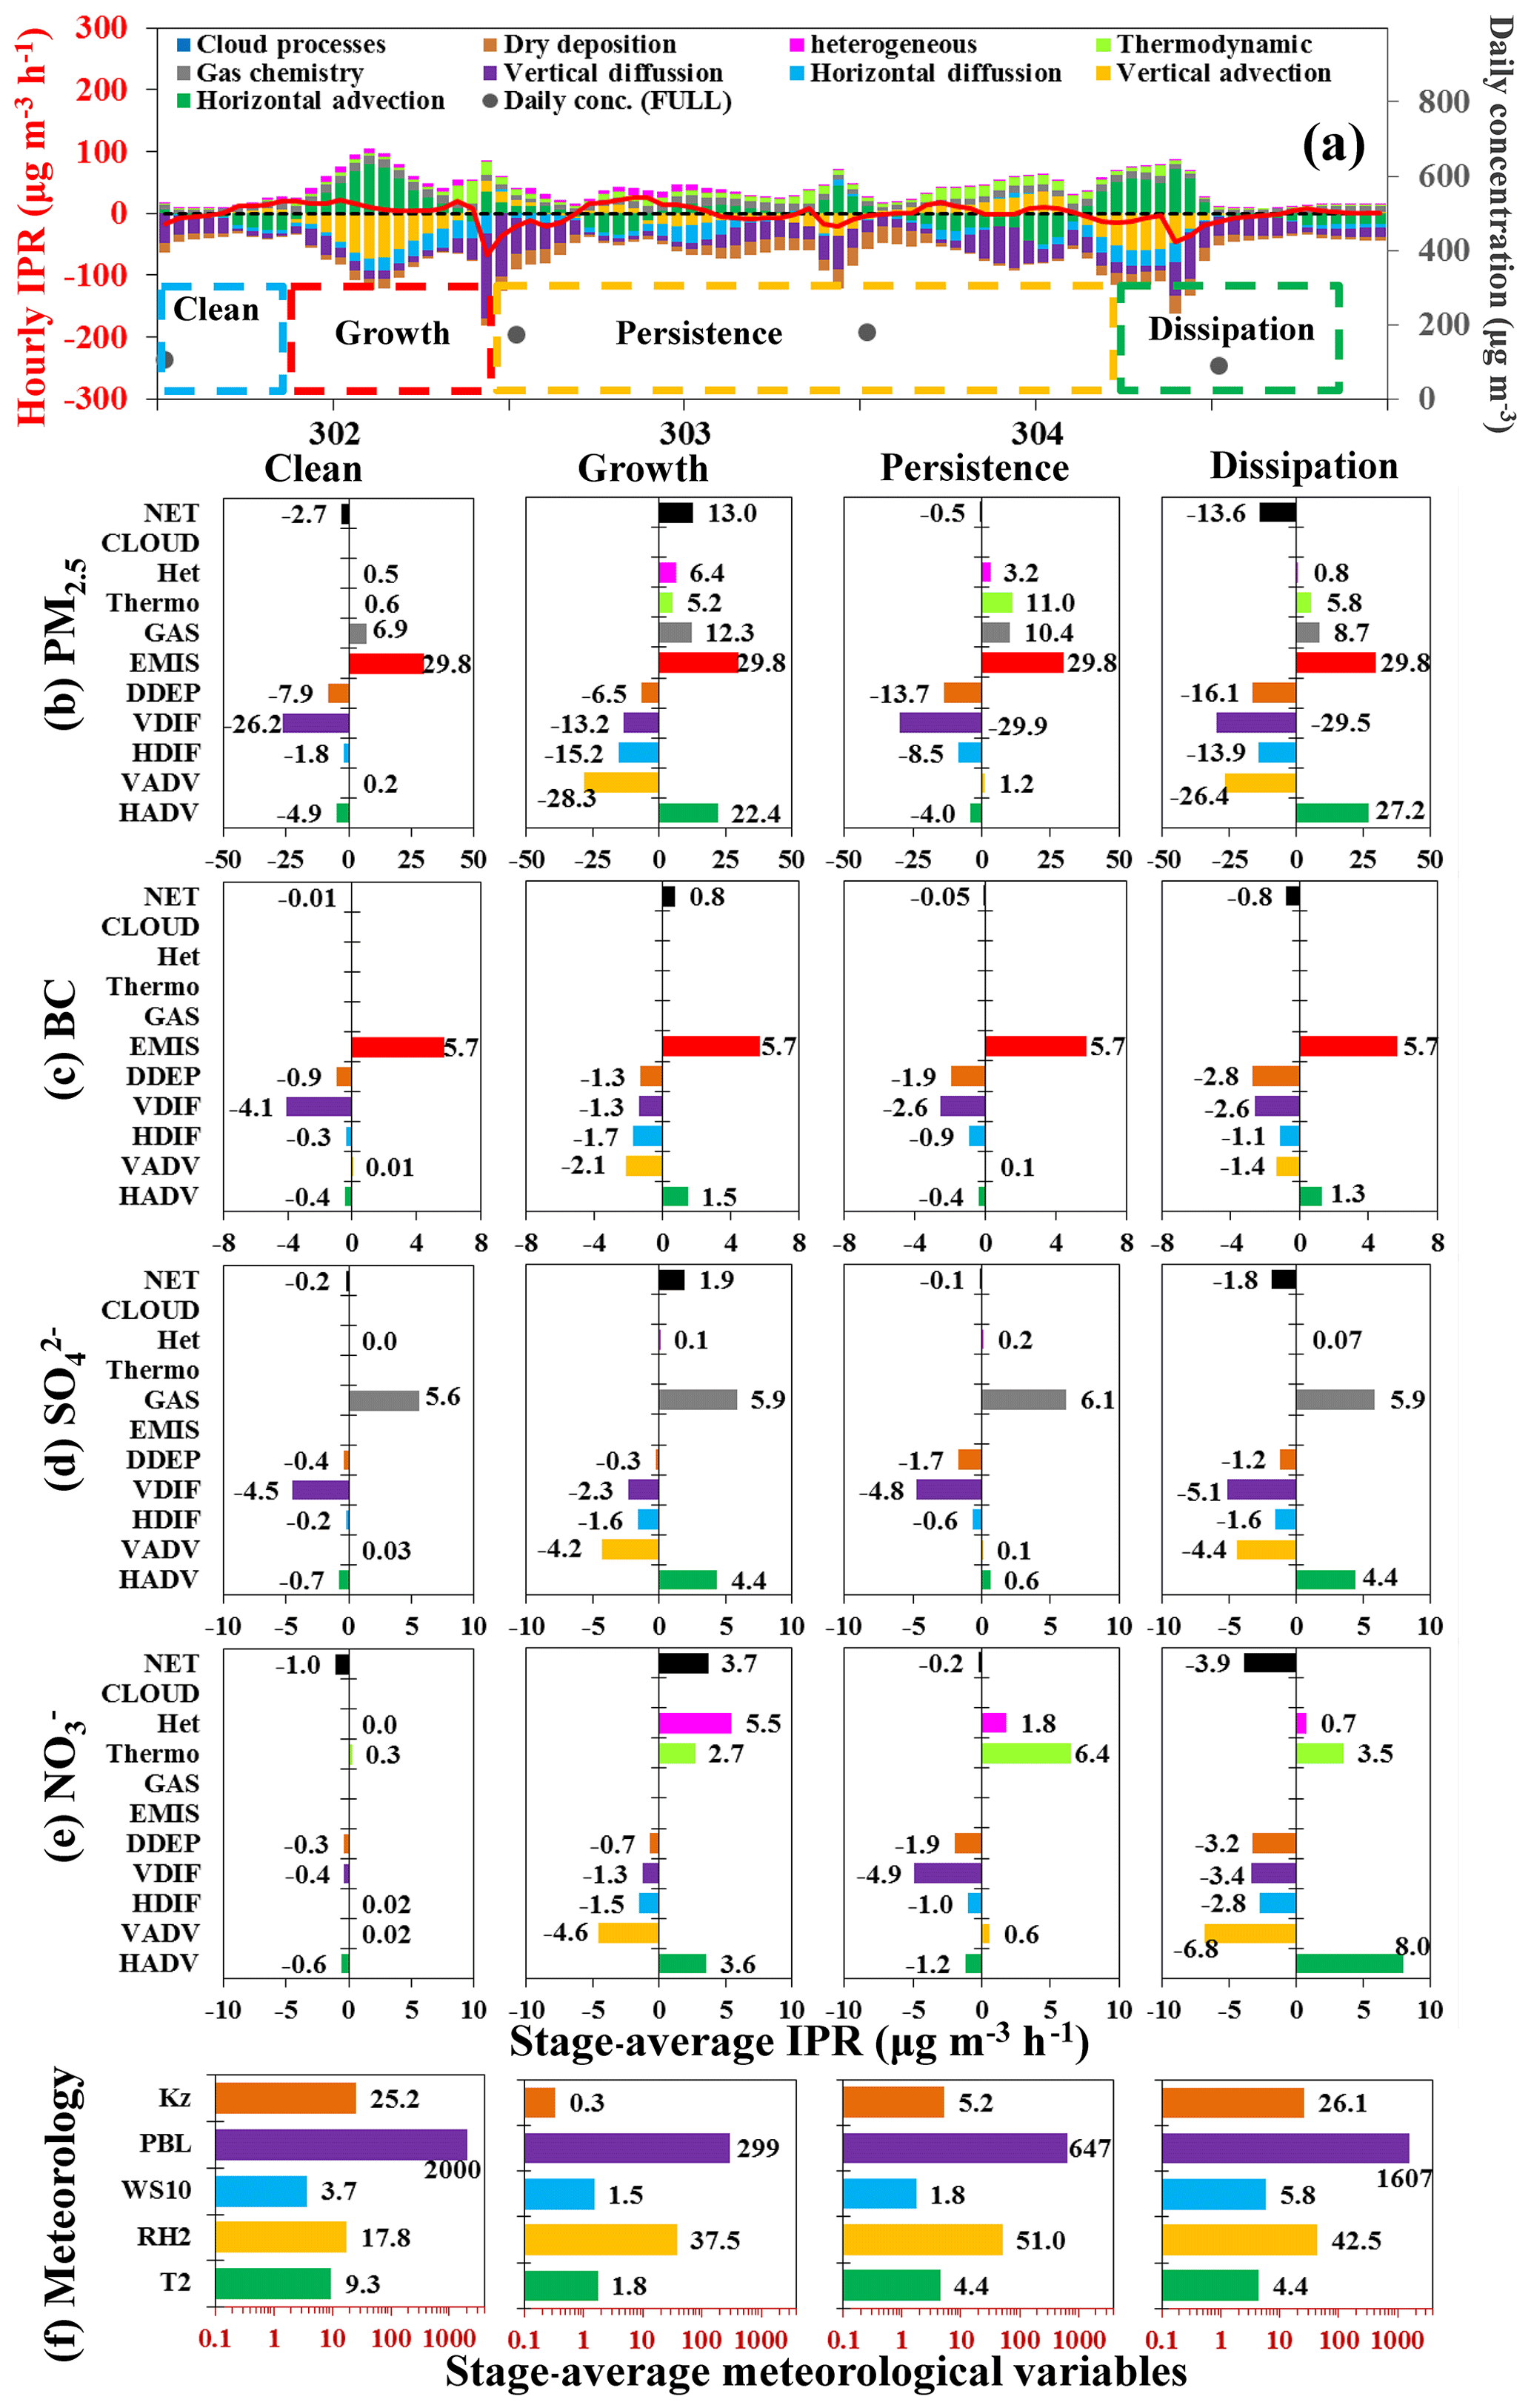
5.1.2 Haze evolution during 1–4 March
We also investigate another haze period of 1–4 March using PA (Fig. 9). The hourly IPRs by different processes are shown in Fig. 9a. An apparent difference between this episode and the first one was the positive IPRs of HADV during this episode, especially in the growth stage from 21:00 LST on 1 March to 09:00 LST on 2 March, which indicated that horizontal transport contributed to the haze formation. Another difference is that the chemical processes, especially heterogeneous reactions, contributed less to the PM2.5 mass during the persistence stage, such as from 10:00 LST on 2 March to 03:00 LST on 4 March, which will be discussed below.
The IPRs for PM2.5, and its components, and meteorological variables averaged over each stage during this episode are calculated and presented in Fig. 9b to f. For BC (Fig. 9c), the most evident difference from the first haze episode occurred in the growth stage, in which horizontal advection contributed 1.5 µg m−3 h−1 to BC production, which was comparable in magnitude to the negative contributions from vertical diffusion and dry deposition (−1.3 µg m−3 h−1), suggesting the import of BC into Beijing from surrounding areas. The wind direction in the south of Beijing at this stage was southerly and wind speed was about 2–3 m s−1, so the transport of pollutants from southern Hebei apparently contributed to the increase in BC level in Beijing. On the contrary, during the first haze event on 20–26 February, wind direction was easterly, bringing a less polluted air mass from the Bohai Sea and northern Tianjin, so horizontal advection contributed less to BC in Beijing. This transport feature was also reflected in the change rates of sulfate (Fig. 9d), nitrate (Fig. 9e), and PM2.5 (Fig. 9b) concentrations. An observational study for the same haze period in Beijing (Ma et al., 2017) also suggested the important role of regional transport from the south of Beijing in haze formation.
For sulfate (Fig. 9d), although chemical processes still contributed most to sulfate production in the growth stage (6.0 µg m−3 h−1), it is noticed that gas chemistry (5.9 µg m−3 h−1) accounted for most of the sulfate production, whereas the contribution from heterogeneous reactions was smaller than that in the first haze episode, mainly due to lower relative humidity. In the growth stage, the net IPR was 1.9 µg m−3 h−1, which is 30 % smaller than that for the first haze, indicating a weaker secondary aerosol formation during this haze episode. In the persistence stage, sulfate production from gas phase oxidation was almost balanced by the loss from dry deposition and vertical diffusion, resulting in a net IPR of −0.1 µg m−3 h−1, indicating a small variation of sulfate concentration during this stage on average.
For nitrate, in the growth stage, it is of interest to note that heterogeneous reactions (5.5 µg m−3 h−1) dominated over thermodynamic processes (2.7 µg m−3 h−1) in nitrate formation, which could be due to the low RH in this stage. Fountoukis and Nenes (2007) indicated that nitrate aerosol is hardly formed in the ISORROPIA II model when RH is below 40 %. The average RH is about 37 % during this haze episode, resulting in more nitrate formed by heterogeneous reactions. The net IPR in the growth stage was 3.7 µg m−3 h−1, approximately 30 % smaller than that in the first haze episode. In the persistence stage, when relative humidity increased to 51 %, nitrate formation via thermodynamic processes became important, and due to competition, nitrate formation from heterogeneous reactions was reduced.
For PM2.5 (Fig. 9b), in the growth stage, the IPR of PM2.5 concentration was 13.0 µg m−3 h−1, in which emission, chemical processes (GAS + Therm + HET), and physical processes (HADV + VADV + HDIF + VDIF + DDEP) contributed 29.8, 23.9, and −40.7 µg m−3 h−1, respectively. It is noteworthy that the horizontal advection process (HADV) contributed 22.4 µg m−3 h−1 to PM2.5 production in this episode, which was comparable to the total chemical production of 23.9 µg m−3 h−1. This reveals the comparable contributions to PM2.5 in Beijing from local sources and regional transport during this haze episode. In the persistence stage, because of the change in wind direction and lower wind speed, the regional transport of PM2.5 became weak. The IPRs were −4.0 µg m−3 h−1 for HADV and 1.2 µg m−3 h−1 for VADV, which were obviously smaller than those in the first haze episode. In the dissipation stage, physical processes except HADV all contributed to the loss of PM2.5. Compared with the first haze episode, the negative IPR of VADV decreased mainly due to the larger wind speeds in this episode; as more PM2.5 was removed by VADV, the remaining PM2.5 loss by vertical diffusion decreased; consequently, a weakened VDIF formed. The positive IPR of HADV increased as well due to higher wind speed than that in the first episode in this stage.
The above process analyses reveal that for the first haze episode (20–26 February) in Beijing, local emissions and chemical processes were the main contributors to the formation and persistence of the haze event. However, for the second haze event (1–4 March), regional transport or horizontal advection played a more important role in haze formation, with a similar magnitude to local emissions and chemical productions in the growth stage. In all, for both episodes, local emission, chemical reaction, and horizontal advection were major processes contributing to PM2.5 increase, whereas vertical processes (diffusion, dry deposition, and advection) were major processes for PM2.5 removal. As the pollution level increased, the contribution of secondary aerosols through chemical formation to PM2.5 increased apparently in Beijing.
5.2 Contributions of physical and chemical processes to the aerosol feedback
5.2.1 The first haze episode (20–26 February)
Figure 10 shows the contributions of each process to the feedback-induced difference in the change rates of PM2.5 and its major components (ΔIPR) during the first haze episode (20–26 February), which were derived from the difference between cases with and without aerosol radiative effects (FULL minus NoAFB).
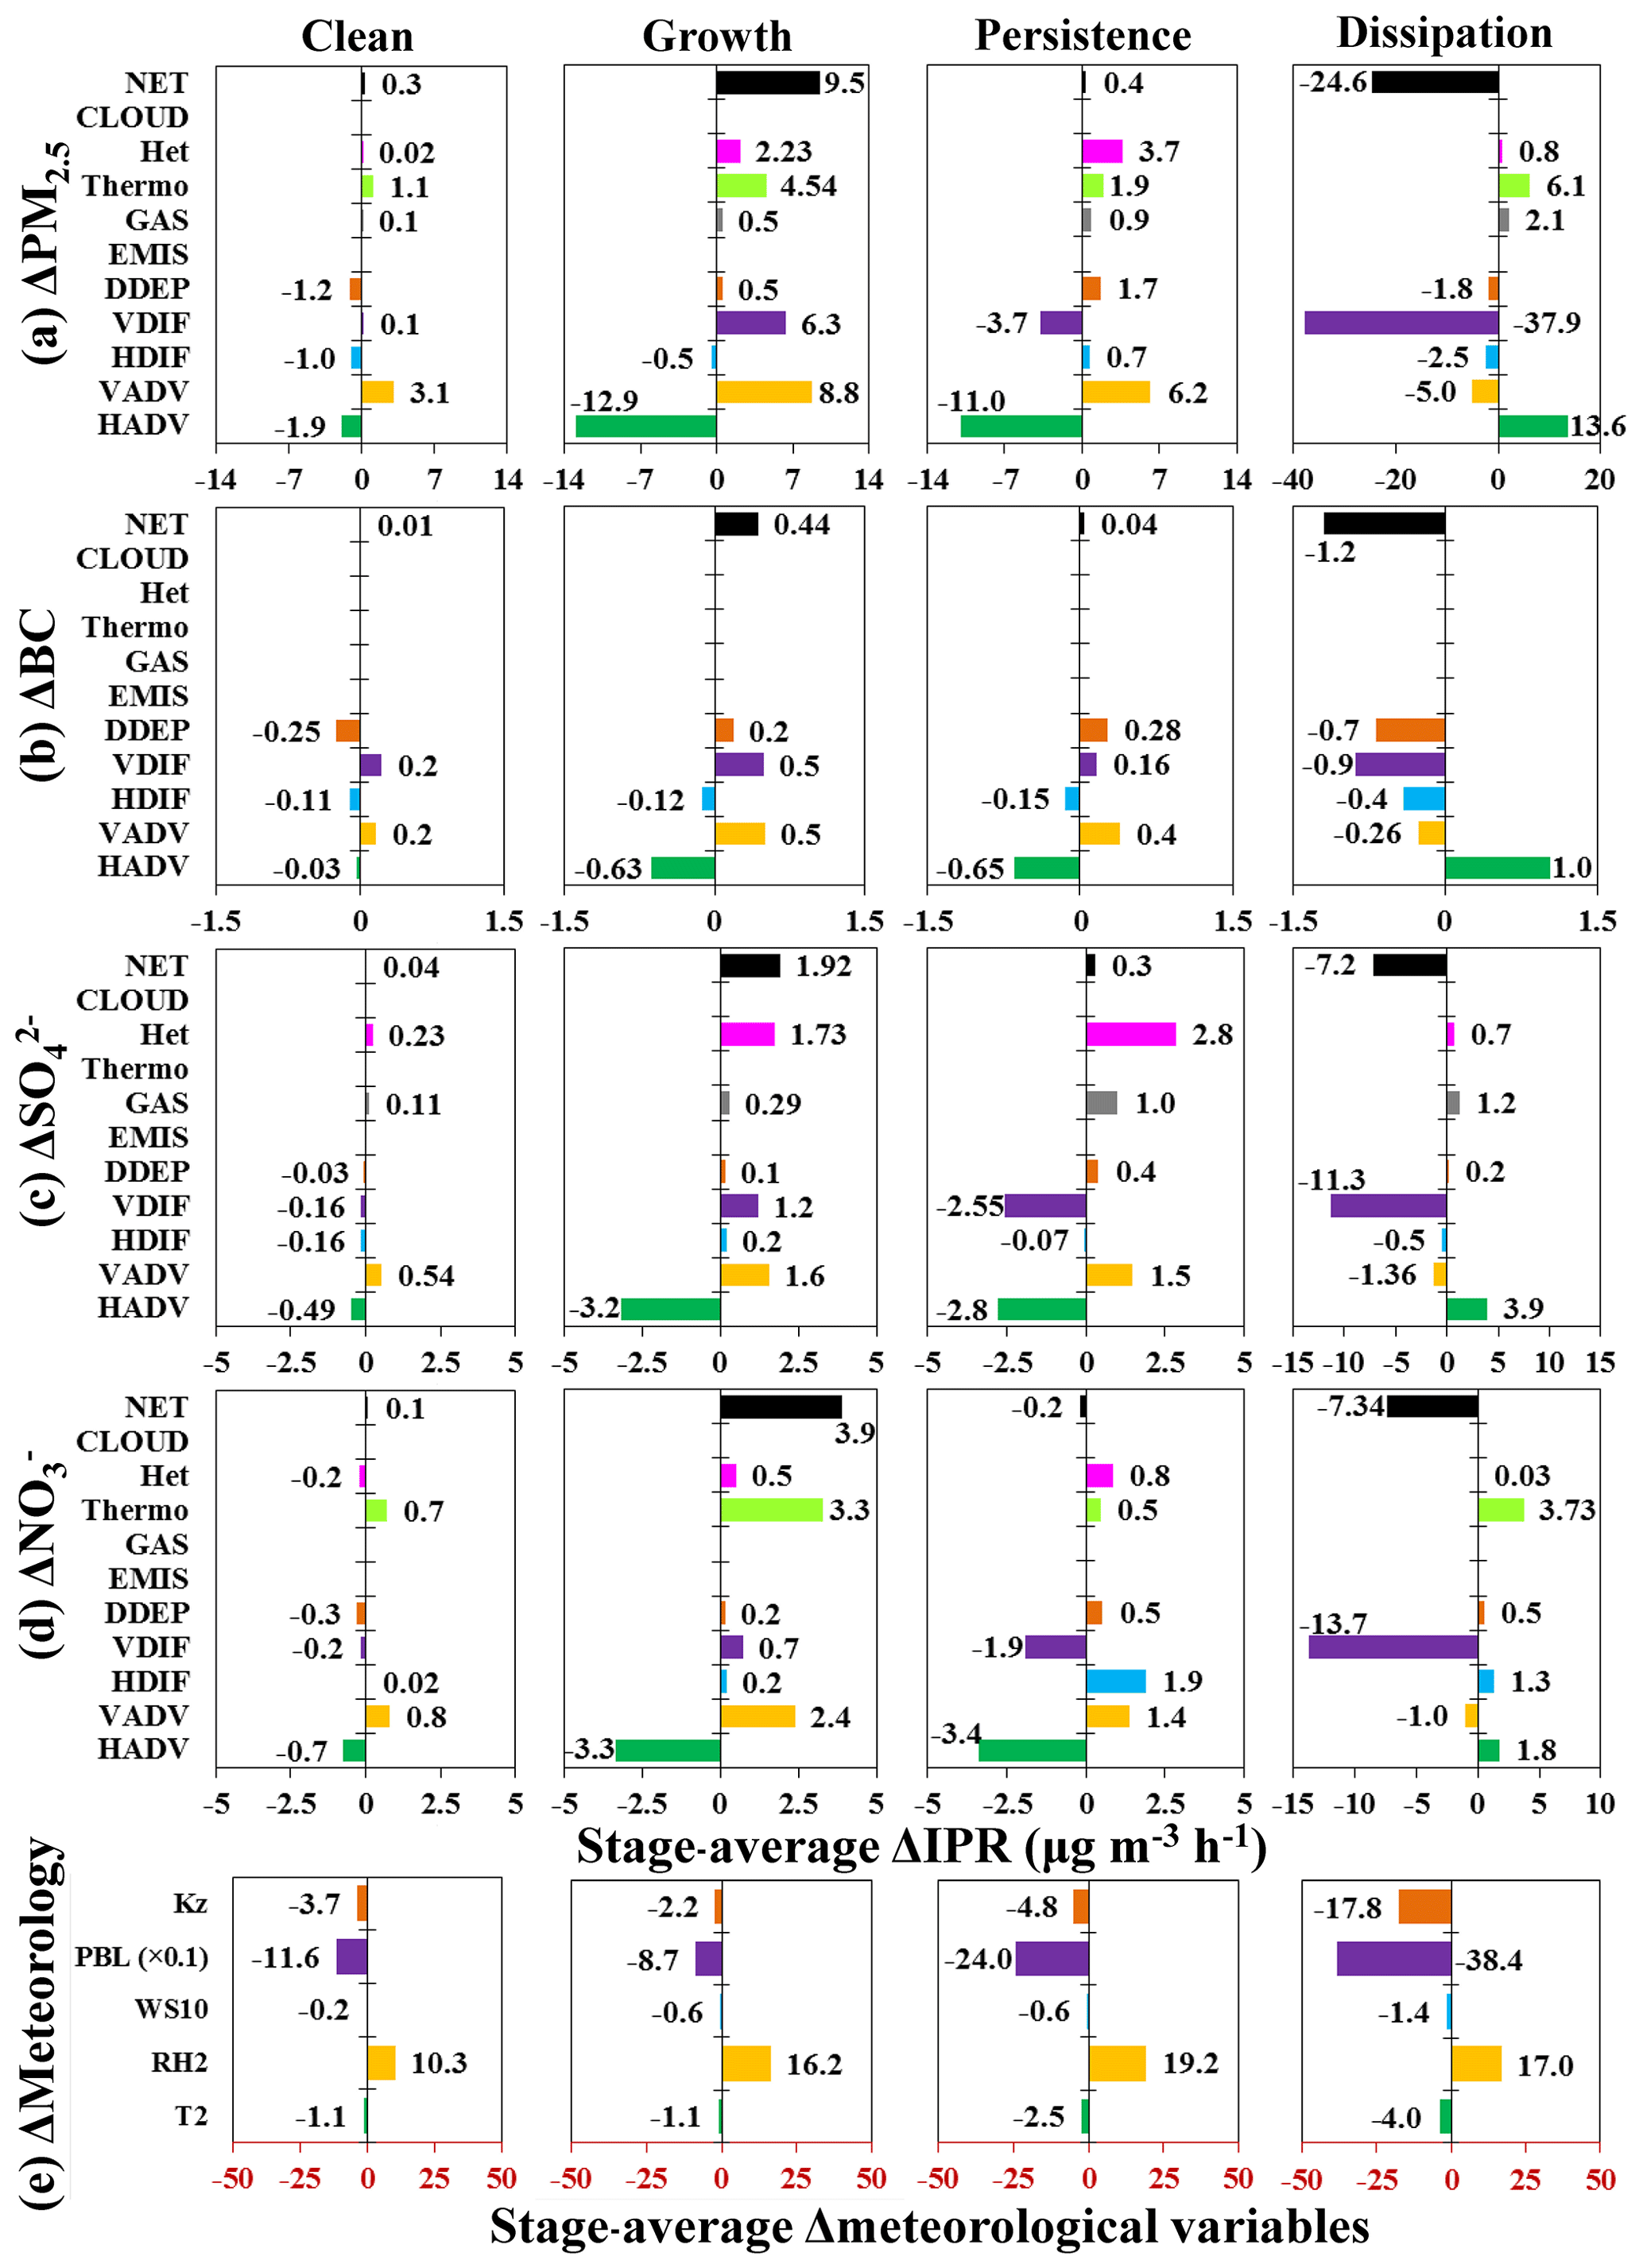
Figure 10The feedback-induced mean changes in IPRs (FULL minus NoAFB) for PM2.5 and its chemical components and meteorological variables during the first haze episode (20–26 February) in Beijing. ΔIPRs for PM2.5 and its chemical components and Δmeteorological variables are averages over the four stages. Note that zero ΔIPR values (no change) are not shown and the ΔPBL heights are scaled by 0.1. The division of the four stages and the units are the same as those in Fig. 8.
The definition of the four stages during haze evolution is the same as that in Sect. 5.1.1. For BC (Fig. 10b) in the clean stage, the aerosol feedback caused a decrease in vertical diffusion and advection (Fig. 10e), leading to an increase in BC concentration with the ΔIPR of 0.40 µg m−3 h−1 from VDIF+VADV, concurrently, the feedback caused an increased loss of BC through horizontal diffusion (HDIF), horizontal advection (HADV), and dry deposition (DDEP) due to the increased BC concentration, with the ΔIPR of −0.39 µg m−3 h−1 from HADV+HDIF+DDEP (Fig. 10b). The net ΔIPR was near zero, which indicated a negligible feedback effect during the clean stage. In the growth stage, the feedback caused a pronounced decrease in vertical diffusivity, advection, and dry deposition velocity, leading to apparent increases in BC level, with the contributions to ΔIPRs from VDIF, VADV, and DDEP being 0.50, 0.50, and 0.20 µg m−3 h−1, respectively (Fig. 10b). The increase in BC concentration consequently led to an increase in outflow via HADV and HDIF, with ΔIPRs of −0.63 and −0.12 µg m−3 h−1, respectively, which tended to reduce BC concentration. The total effect by summing the processes exhibited a net positive ΔIPR of 0.44 µg m−3 h−1, which indicated an apparent increase in BC concentration due to the feedback. In the persistence stage, the sign of ΔIPR for each process was the same as that in the growth stage, and the ΔIPR by vertical processes (0.84 µg m−3 h−1 from VADV + VDIF + DDEP) was generally balanced by that of horizontal processes (−0.80 µg m−3 h−1 from HADV + HDIF) and led to a net ΔIPR of 0.04 µg m−3 h−1 (Fig. 10b). This indicated that the difference in the BC change rate between the FULL and NoAFB cases was small in this stage. In the dissipating stage, ΔIPRs were negative for all the processes except for HADV. This was because of the higher BC levels due to the feedback, which caused more BC to be removed than without feedback, although the vertical diffusion coefficient was smaller due to the feedback. The positive ΔIPR from HADV suggested an enhanced BC import into Beijing from upwind regions due to the feedback. The sum of these processes produced a net ΔIPR of −1.20 µg m−3 h−1, which indicated a larger decreasing rate of BC concentration (from haze to clean level) due to aerosol feedback in this stage.
For sulfate (Fig. 10c), in the clean stage, the feedback-induced changes were as small as those for BC. In the growth stage, besides the positive ΔIPRs by VDIF, VADV, and DDEP as those for BC, the most impressive feature was the larger contributions from GAS and HET, with ΔIPRs being 0.29 and 1.73 µg m−3 h−1, respectively. These are much larger than those (0.11 and 0.23 µg m−3 h−1) in the clean stage because of the increased gas precursors, aerosol surfaces, and RH due to the feedback effect, which enhanced chemical formation (Fig. 10c, e). The sum of the ΔIPRs by all the processes was 1.92 µg m−3 h−1, indicating an apparent increase in sulfate concentration due to the feedback effect. In the persistence stage, the ΔIPRs by GAS and HET increased. However, the ΔIPR of VDIF became negative, which could be explained by the increased sulfate concentration due to aerosol feedback. This caused more sulfate to be removed through vertical diffusion, leading to a negative ΔIPR of VDIF, although the vertical diffusion coefficient was reduced by the feedback. In the dissipation stage, the ΔIPR by HET decreased because the feedback-induced differences in the concentrations of precursors and aerosols became smaller. The large negative ΔIPR by VDIF indicated a greater decreasing rate in sulfate concentration from the persistence to clean stages due to the feedback.
For nitrate (Fig. 10d), the feedback-induced IPR changes in the clean stage were similar to those for sulfate. In the growth stage, remarkable increases in nitrate formation from Thermo and HET processes occurred, with ΔIPRs of 3.30 and 0.50 µg m−3 h−1, respectively (Fig. 10d). The increased gas precursors and RH due to the aerosol feedback reinforced chemical formation processes. In this stage, the overall ΔIPR was 3.90 µg m−3 h−1, suggesting a faster increasing rate in nitrate concentration in consideration of aerosol feedback. In the persistence stage, the ΔIPR by Thermo was smaller than that in the growth stage (Fig. 10d). This could be explained by the fact that the apparent increase in sulfate concentration via HET and GAS due to the feedback (Fig. 10c) in this stage consumed more ammonia, which inhibited the formation of nitrate ammonium via thermodynamic processes. The net ΔIPR due to all the processes in this stage was near zero, which indicated that the radiative feedback exerted little effect on the change rate of nitrate concentration during this stage. In the dissipation stage, the attenuation of solar radiation by aerosols was weakened because of the decrease in aerosol concentration; meanwhile, the concentrations of gas precursors (NOx) were elevated due to the feedback; the combined effect resulted in an increase in photochemical production of HNO3; in addition, RH was increased due to the feedback as well; as a result, nitrate formation via the thermodynamic process was enhanced, leading to a positive ΔIPR of 3.73 µg m−3 h−1 by Thermo in this stage.
For PM2.5, the net ΔIPR due to aerosol feedback in the clean stage was 0.30 µg m−3 h−1, in which 1.22 µg m−3 h−1 was from chemical processes (GAS + Thermo + HET) and −0.90 µg m−3 h−1 from physical processes (HADV + VADV + HDIF + VDIF + DDEP) (Fig. 10a). In the growth stage, the net ΔIPR was 9.50 µg m−3 h−1, which meant in every hour approximately 9.50 µg m−3 of PM2.5 mass was elevated in Beijing due to the feedback effect. The above feedback-induced difference in the change rate of PM2.5 (ΔIPR) resulted from a combined effect from chemical processes (7.27 µg m−3 h−1) and physical processes (2.23 µg m−3 h−1), which suggested that chemical processes contributed more to the PM2.5 increase than physical processes. However, it was noted that the increased contribution from chemical processes was related to increasing gas precursors, which was partly associated with physical processes. It is noteworthy that both chemical processes (GAS, Thermo, and HET) and vertical movements (VADV, VDIF, and DDEP) contributed to the positive ΔIPRs (Fig. 10a). The sum of positive ΔIPRs was 22.88 µg m−3 h−1, in which 7.27 µg m−3 h−1 was from chemical processes and 15.61 µg m−3 h−1 was from vertical movements. This suggested a larger feedback-induced PM2.5 increase through vertical movements than via chemical processes. However, the outflow (HADV+HDIF) of PM2.5 was also enhanced due to the increased PM2.5 level by aerosol feedback, producing a negative ΔIPR (−13.38 µg m−3 h−1) and partly offsetting the positive ΔIPR (15.61 µg m−3 h−1) by vertical movements, resulting in a net ΔIPR of 2.23 µg m−3 h−1 from all the physical processes. In the persistence stage, the sign of ΔIPRs by different processes generally resembled those in the growth stage, except that of VDIF whose ΔIPR was negative, which indicated more removal though VDIF mainly due to the increased secondary aerosol concentrations by aerosol feedback. The net ΔIPR by all the processes was 0.40 µg m−3 h−1 in this stage, indicating a small influence of aerosol feedback on the change rate of PM2.5 concentration. In the dissipating stage (Fig. 10a), the large negative ΔIPR from VDIF indicated more PM2.5 mass was removed via vertical diffusion while considering aerosol feedback, although the feedback induced a smaller vertical diffusivity coefficient. The net ΔIPR of −24.60 µg m−3 h−1 indicated a larger decreasing rate of PM2.5 concentration in the FULL case than in the NoAFB case.
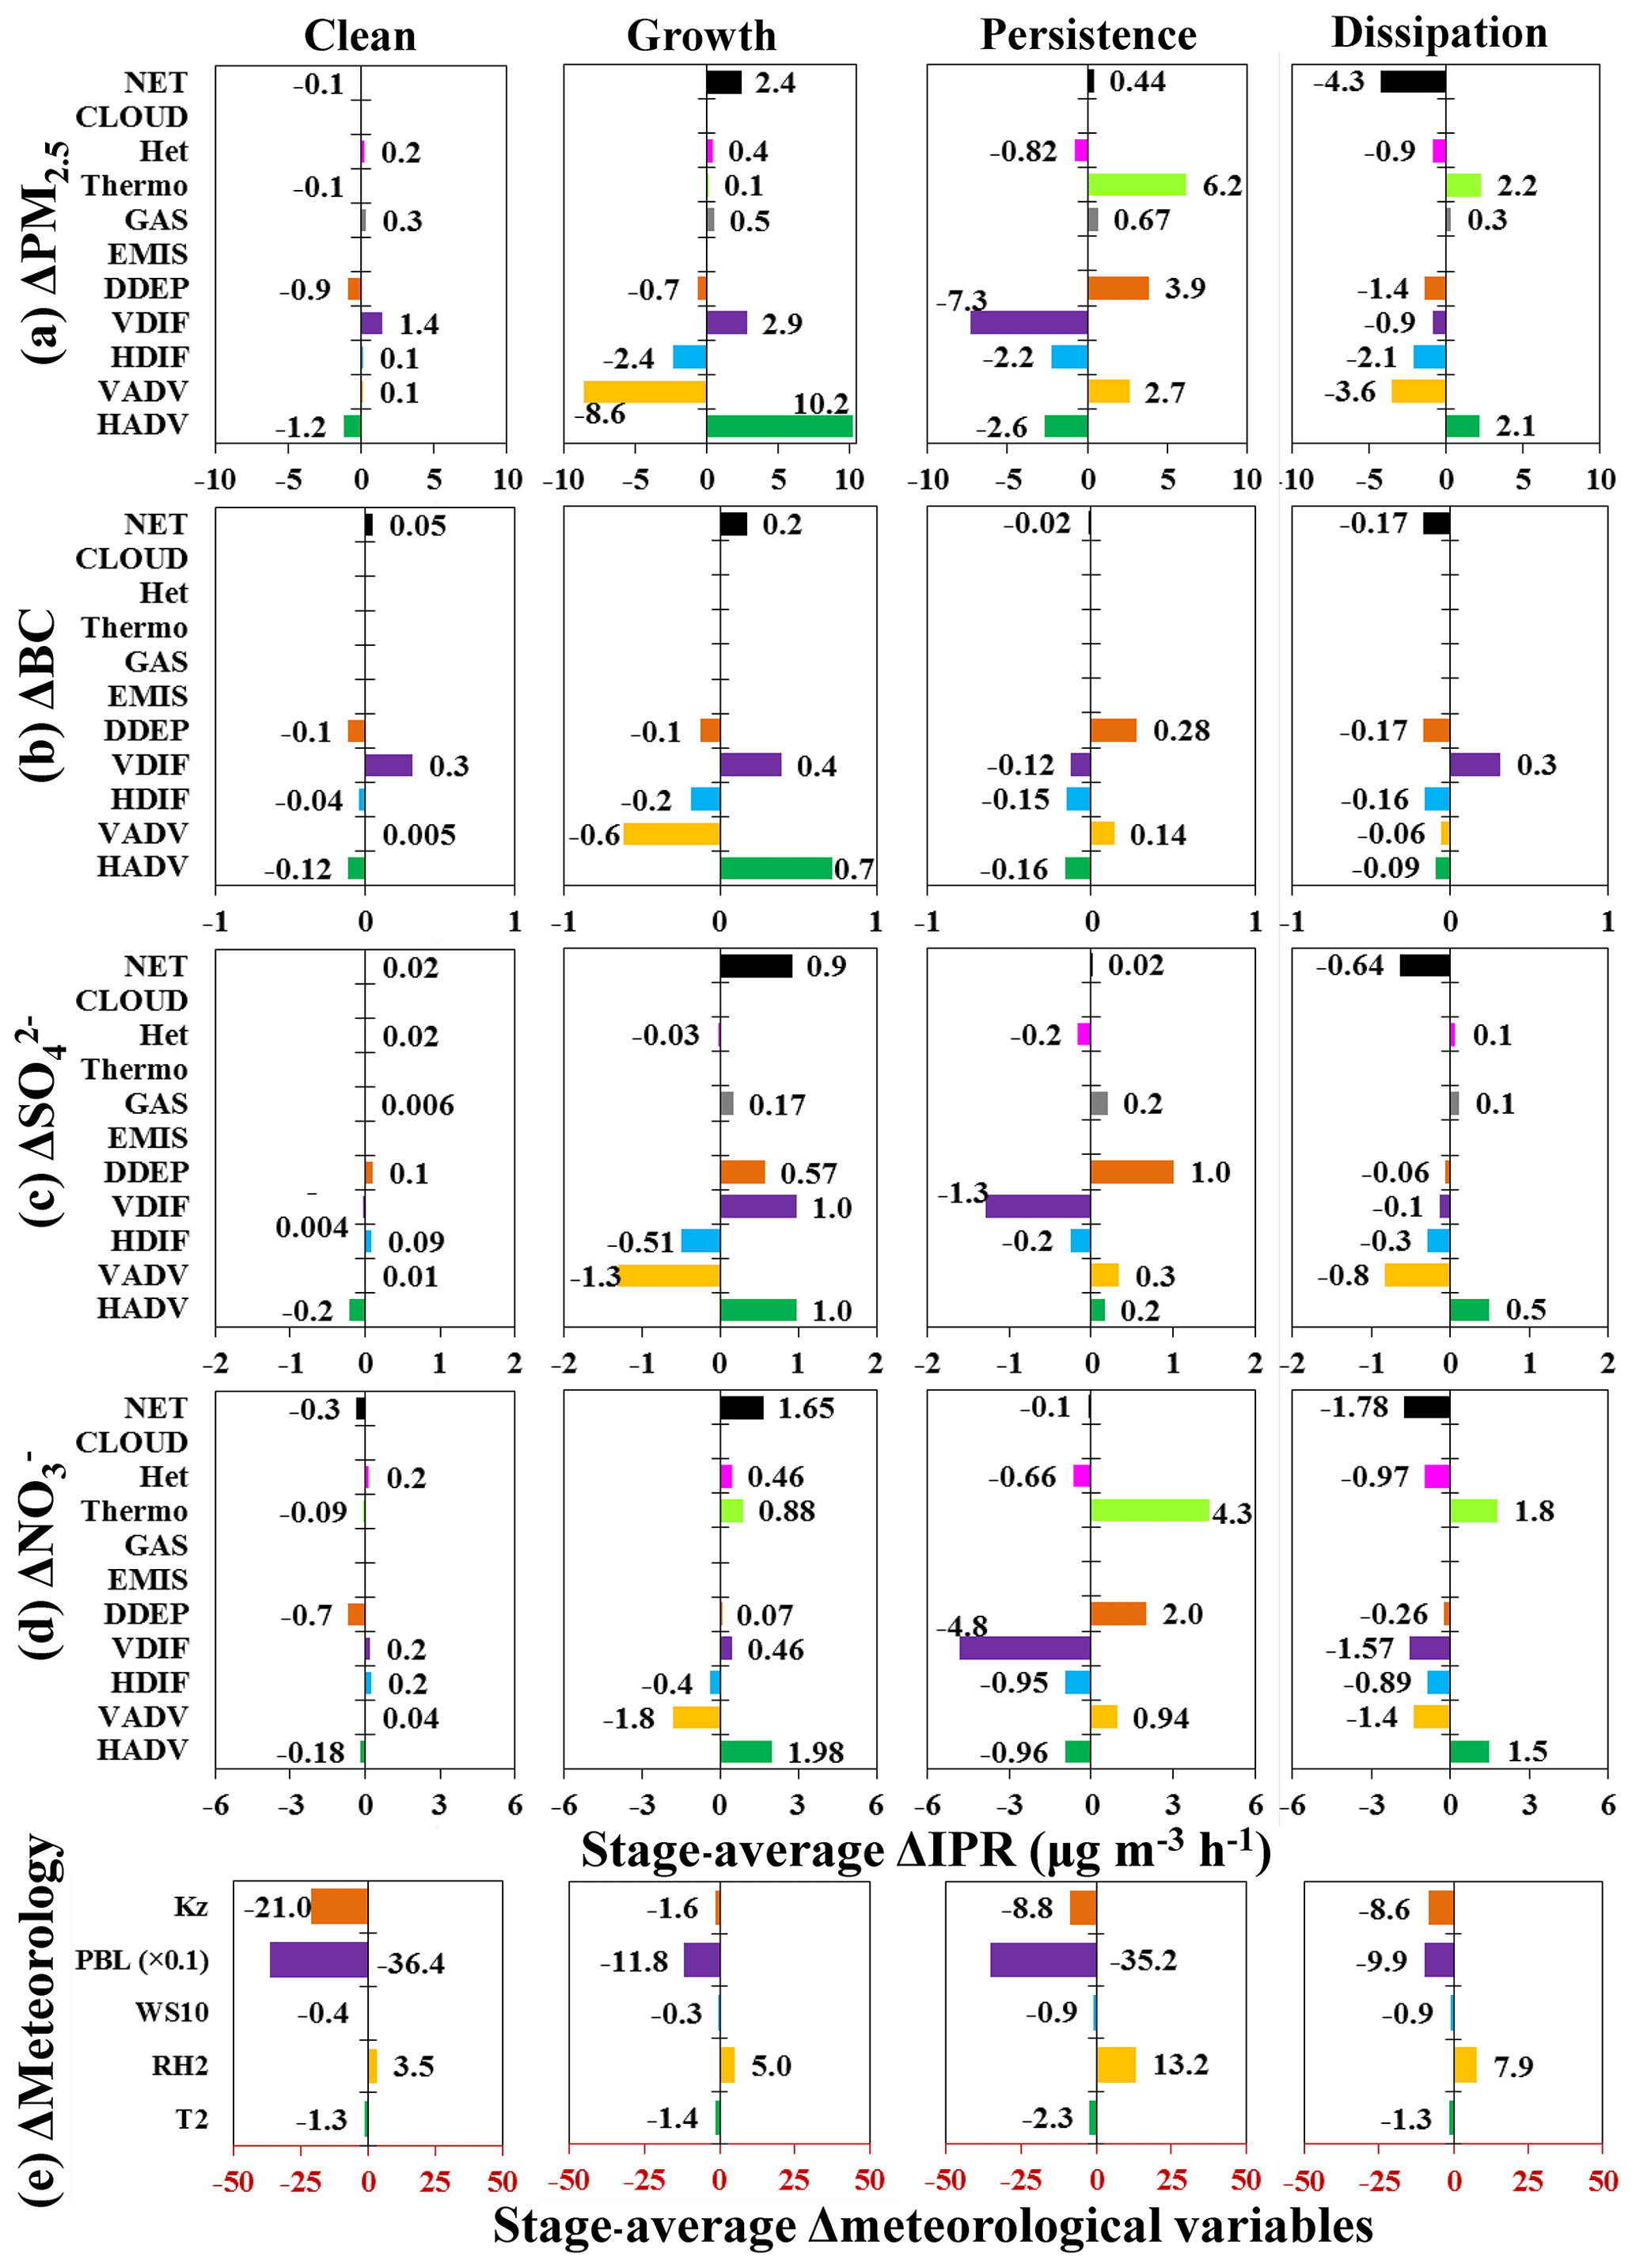
Figure 11Same as Fig. 10 but for the second haze episode (1–4 March). The division of the four stages is the same as that in Fig. 9.
5.2.2 The second haze episode (1–4 March)
For BC in the second haze episode (1–4 March), the most obvious difference from the first episode was in the growth stage, in which the ΔIPR by horizontal advection (HADV) was 0.70 µg m−3 h−1 (Fig. 11b). The radiative feedback led to a weakened vertical diffusivity and a decreased PBL height (Fig. 11e), which favored the accumulation of BC and caused a positive ΔIPR of 0.40 µg m−3 h−1 from VDIF. The winds in the growth stage were southerlies as discussed above, bringing aerosols from the south to Beijing. The aerosol feedback enhanced BC concentration in source regions through reducing vertical diffusivity, leading to an increased northward flux of BC and a positive ΔIPR from HADV. The higher BC concentration due to the feedback via HADV and VDIF consequently led to an increase in BC outflow out of Beijing via vertical advection (VADV) and horizontal diffusion (HDIF), with ΔIPRs of −0.60 and −0.20 µg m−3 h−1, respectively. In this stage, the net ΔIPR of BC was 0.20 µg m−3 h−1, in which 0.50 µg m−3 h−1 was from horizontal movements (HADV + HDIF) and −0.30 µg m−3 h−1 from vertical movements (VADV + VDIF + DDEP), indicating that the feedback effect strengthened the contribution of horizontal movements to surface BC concentration in Beijing. In the persistence stage (Fig. 11b), the net ΔIPR was also near zero (−0.02 µg m−3 h−1), indicating that the BC change rate was merely affected by the feedback in this stage. In the dissipation stage (Fig. 11b), ΔIPRs were negative for all the processes except for VDIF. This could be attributed to the higher BC levels due to the feedback, which caused more BC to be removed than without feedback through these processes. The net ΔIPR was −0.17 µg m−3 h−1, i.e., the same as that in the growth stage but with opposite sign.
For sulfate (Fig. 11c), in the growth stage, unlike the relatively large positive ΔIPR by chemical processes in the first haze episode, the feedback caused small IPR changes via chemical production. This is because the SO2 concentration in this episode was lower than that in the first one, and sulfate was mainly formed in upwind regions and transported to Beijing. Consequently, a relatively large sulfate concentration increase occurred due to HADV and VDIF in this episode. In this stage, the feedback caused a slight increase in sulfate concentration by GAS with ΔIPR of 0.17 µg m−3 h−1 due to slightly elevated precursors; however, because of the low relative humidity (mean RH was 38 %) and competitive processes, heterogeneous reactions were depressed. In terms of physical processes, due to the feedback effect, horizontal transport (HADV) was strengthened (ΔIPR of 1.0 µg m−3 h−1) due to the increased sulfate concentration to the south of Beijing; meanwhile, the weakened vertical diffusivity caused an increase in sulfate concentration by VDIF and DDEP, with ΔIPRs of 1.0 and 0.57 µg m−3 h−1, respectively; consequently, the outflow of sulfate out of Beijing was also increased via vertical advection (VADV) and horizontal diffusion (HDIF). The net ΔIPR in the growth stage was 0.90 µg m−3 h−1, indicating an apparent increase in sulfate concentration due to the feedback. In the persistence stage, ΔIPRs by GAS and HET changed slightly compared with those in the growth stage. The negative ΔIPR by VDIF indicated more loss of sulfate by vertical diffusion while considering aerosol feedback. The net ΔIPR in this stage was 0.02 µg m−3 h−1, indicating a negligible feedback effect on sulfate change rate in this stage. In the dissipation stage, the feedback-induced higher sulfate concentration caused more removal of sulfate via physical processes except HADV, resulting in a net ΔIPR of −0.64 µg m−3 h−1. The positive ΔIPR from HADV was due to the strengthened import from upwind areas due to the feedback.
For nitrate, in the growth stage, the feedback also induced an increase in nitrate concentration via horizontal advection like sulfate (Fig. 11d). The increases in gas precursors and aerosol surfaces due to the feedback enhanced nitrate formation, resulting in nitrate increases via Thermo and HET, with ΔIPRs of 0.88 and 0.46 µg m−3 h−1, respectively. In the persistence stage, the chemical production of nitrate increased largely, caused by the feedback, with the ΔIPR of Thermo being 4.30 µg m−3 h−1. The reason could be that the low RH in the growth stage (38 % shown in Fig. 9f) left most of the nitric acid in the gas phase, together with the increase in RH due to the feedback (13.2 % shown in Fig. 11e), drove its conversion from gas to aerosol phase. Due to the enhanced thermodynamics production, nitrate formation via heterogeneous reactions was depressed in this stage. The increased nitrate concentration via Thermo led to greater removal via vertical diffusion, resulting in a negative ΔIPR of −4.80 µg m−3 h−1 by VDIF and a net ΔIPR of −0.10 µg m−3 h−1. In the dissipation stage, like that in the first haze episode, the reduced aerosol attenuation of solar radiation and increased RH induced by aerosol feedback led to an increase in nitrate via thermodynamic process, with the ΔIPR of 1.80 µg m−3 h−1 by Thermo. Consequently, heterogeneous reactions were depressed due to competitive processes (ΔIPR of −0.97 µg m−3 h−1 by HET). In this stage, because of the higher nitrate concentration, the feedback led to greater removal by vertical processes (the ΔIPR of VADV + VDIF + DDEP was −3.23 µg m−3 h−1), with a net ΔIPR of −1.78 µg m−3 h−1, similar to the ΔIPR in the growth stage but with opposite sign.
For PM2.5 (Fig. 11a), the net ΔIPR due to aerosol feedback in the growth stage was 2.40 µg m−3 h−1, with 1.40 µg m−3 h−1 from physical processes (HADV + VADV + HDIF + VDIF + DDEP) and 1.0 µg m−3 h−1 from chemical processes (GAS + Thermo + HET), which indicated that the feedback-induced increase in PM2.5 concentration per hour was produced through larger contributions from physical processes than chemical processes in this episode. HADV contributed most to the PM2.5 increase (with ΔIPR of 10.20 µg m−3 h−1), followed by VDIF (with ΔIPR of 2.90 µg m−3 h−1). As mentioned above, the weakened vertical diffusivity caused by the feedback enhanced aerosol concentrations in the entire BTH region; meanwhile, the feedback induced a southeast wind anomaly with a slight change in wind speed in the regions south of Beijing. The combined effect of the elevated aerosol concentrations and southeast wind anomaly brought more aerosols to Beijing. In the persistence stage, the feedback increased PM2.5 concentration mainly through chemical processes, with a ΔIPR of 6.05 µg m−3 h−1, which mainly resulted from the enhanced thermodynamic production of ammonium nitrate; such an increase in aerosol mass due to feedback led more aerosols to be diffused than that without feedback, leading to a ΔIPR of −7.30 µg m−3 h−1 by VDIF. It was noticed that the signs of ΔIPRs by VDIF were opposite between the growth and persistence stages even though the vertical diffusivities were both decreased. In the growth stage, the PM2.5 concentration was gradually increasing, and the effect of the weakened vertical diffusivity dominated, resulting in a positive ΔIPR by VDIF which favored further accumulation of aerosols; in the persistence stage, the aerosol concentration had already been elevated to a high level and the effect of higher concentration surpassed that of weakened vertical diffusivity due to the feedback and led to a negative ΔIPR, which meant that the feedback caused more loss of PM2.5 via VDIF. In the persistence stage, the net ΔIPR was 0.44 µg m−3 h−1, in which −5.6 µg m−3 h−1 was from physical processes and 6.05 µg m−3 h−1 was from chemical processes, which indicated that the feedback-induced overall changes in the change rate of PM2.5 concentration in this stage were relatively small. In the dissipating stage, the removal of PM2.5 was enhanced by the feedback through all the processes except HADV mainly due to the increased PM2.5 concentration; the positive ΔIPR by HADV was caused by the enhanced import from upwind areas due to the feedback. In this stage, the feedback effect enhanced the removal of PM2.5, which was reflected by the net negative ΔIPR of −4.30 µg m−3 h−1.
The above analyses quantify the key processes contributing to the aerosol radiative feedback in Beijing during the two haze episodes. In the growth stage of the first haze episode, the feedback-induced PM2.5 enhancement was attributed to the positive contributions from chemical processes and vertical movements, but these were partly offset by the increased outflow of PM2.5 via horizontal advection, resulting in a larger increase in PM2.5 through chemical processes than that from physical processes. On the contrary, during the second haze episode, the feedback-induced PM2.5 enhancement in the growth stage was larger by physical processes than that by chemical processes, and horizontal advection contributed most to the PM2.5 enhancement. In all, the radiative feedback increased the cumulative rate of aerosols in the growth stage via promoting chemical formations, weakening vertical diffusions, and/or enhancing regional transport by horizontal advection. For both episodes, the radiative feedback exerted a small effect on the change rate of PM2.5 concentration during the persistence stage and reinforced the decreasing rate of PM2.5 in the dissipation stage.
Several severe haze events occurred in the winter of 2014, with the most severe one on 20–26 February. An online coupled regional climate–chemistry–aerosol model (RIEMS-Chem) was developed and utilized to investigate the mechanisms of haze formation and aerosol radiative feedback in the Beijing-Tianjin-Hebei (BTH) region. Two numerical experiments were conducted to explore the aerosol radiative effects (AREs) and feedbacks on meteorological fields and aerosol distributions. The process analysis technique was implemented in RIEMS-Chem to quantify the individual contributions from various physical and chemical processes to aerosol evolution and radiative feedback. Model performance was comprehensively evaluated by comparing with a variety of observations for meteorological variables, surface shortwave radiation, PBL heights, and PM2.5 (and its chemical components), as well as aerosol optical properties, in the BTH region. The comparisons demonstrated that RIEMS-Chem was able to represent the magnitudes and variations of the above variables reasonably well, improving in particular the simulation of inorganic aerosols and AOD, which was often underpredicted in current online coupled models. It is encouraging that by considering the aerosol radiative effects, the model apparently improved predictions for meteorological variables, PM2.5 (and its chemical compositions), and aerosol optical properties in the BTH region, underlining the importance and necessity for developing chemistry–climate online coupled models in both air quality and climate research.
During the study period, the meteorological conditions were characterized by weak southerly winds, high RH, and low PBL height, which favored aerosol accumulation and haze formation in the BTH region. The average T2, WS10, RH2, PBL height, and PM2.5 concentration from the FULL case were simulated to be 0.6 ∘C, 1.2 m s−1, 67.0 %, 698.4 m, and 90.0 µg m−3, respectively, over the BTH region during the study period.
The distribution pattern of AOD generally resembled that of PM2.5, with the domain-mean value of 0.78 and the maximum up to 1.1 during the study period. It was noteworthy that the simulated SSA averaged over the BTH region and the study period was 0.91, which indicated the dominance of scattering aerosols. The domain- and period-average AREs at the surface, in the atmosphere, and at the TOA were estimated to be −37, 19, and −18 W m−2, respectively, and they were enhanced to −57, 25, and −32 W m−2 during the most severe haze episode (20–26 February). It was striking that the maximum hourly AREs at the surface and at TOA reached −384 and −231 W m−2 around midday in the vicinity of Shijiazhuang during the first haze episode. The magnitude of the model-simulated AREs during the haze episode in this study agreed favorably with previous observation-based estimates.
The aerosol radiative effects generally led to a reduction in surface air temperature in the entire domain with a larger decrease in southern BTH (−1.2 to −2 ∘C), accompanied by an increase in RH2 (10 %–16 %) and a decrease in PBL height (−240 to −210 m). The changes in these meteorological variables were strengthened during the severe haze episode. Noticeably, PM2.5 concentrations were consistently increased over the BTH region due to the aerosol feedback, with the maximum average increase exceeding 33 µg m−3 (33 %) in southern Hebei and portions of Beijing and Tianjin during the study period, and the maximum hourly increase was up to 372 µg m−3 (186 %) in the vicinity of Shijiazhuang during the severe haze episode. In terms of domain and period average, the feedback-induced changes were −1.4 ∘C for T2, −0.04 m s−1 for WS10, 8.7 % for RH2, −3.3 m2 s−1 for vertical diffusion coefficient, −160.0 m (−19 %) for PBL height, and 20.0 µg m−3 (29 %) for PM2.5 concentration. The magnitude of the above changes were enhanced during the severe haze episode, with the 7 d mean changes in T2, WS10, RH2, PBL height, and PM2.5 concentration being −1.8 ∘C, −0.5 m s−1, 9.8 %, −183.6 m (−31 %), and 45.1 µg m−3 (39 %), respectively, which demonstrated the significant aerosol radiative feedback on PM2.5 accumulation and haze formation. The changes in sulfate and nitrate concentrations were larger than that in BC concentration, because secondary aerosols were increased not only by weakened vertical diffusivity but also by enhanced chemical reactions caused by the feedback.
The magnitude of the feedback effect varied remarkably during haze evolution. The absolute change in PM2.5 concentration caused by the feedback was largest in the persistence stage, followed by those in the growth stage and in the dissipating stage. In Beijing, the feedback-induced increases in PM2.5 concentration were 55, 84, and 40 µg m−3, respectively, during the growth, persistence, and dissipation stages of the severe haze episode.
PA method was applied to calculate the IPRs for quantifying the individual contributions from physical and chemical processes to variations of PM2.5 and its chemical components during haze episodes in Beijing. Two haze episodes were analyzed and compared to elucidate the mechanism of haze formation and evolution. For the first haze episode, the net IPR for PM2.5 was 14.1 µg m−3 h−1 in the growth stage, in which emissions, chemical processes, and physical processes contributed 29.8, 33.5, and −49.2 µg m−3 h−1, respectively, which indicated a remarkable PM2.5 increase that chemical processes contributed to in this stage. The most influential processes for PM2.5 loss and production were vertical diffusion and thermodynamic processes, respectively. Compared with the clean stage, the losses by vertical diffusion and dry deposition reduced largely, and the production by chemical processes increased, both leading to an evident increase in surface PM2.5 concentrations in the growth stage. In the persistence stage, the production and loss of PM2.5 were almost equal, resulting in an approximately zero IPR in this stage. In the dissipation stage, the loss of PM2.5 by vertical diffusion and dry deposition increased greatly, leading to a net IPR rate of −34.8 µg m−3 h−1, which meant a substantial decrease in PM2.5 concentration.
For the second haze episode, the net IPR for PM2.5 was 13.0 µg m−3 h−1 in the growth stage, in which emissions, chemical processes, and physical processes contributed 29.8, 23.9, and −40.8 µg m−3 h−1, respectively. It was noteworthy that the contribution of horizontal advection to PM2.5 was of a similar magnitude to the contributions from local emissions and chemical processes, with the mean IPR of 22.4 µg m−3 h−1, which indicated the important contribution of regional transport to haze formation in Beijing. Process analysis for the changes in PM2.5 components during haze evolution was also conducted.
The contribution of each physical and chemical process to the feedback-induced changes in PM2.5 and its major components were explored and quantified. For the first haze episode, the fast increase in PM2.5 (ΔIPR of 9.5 µg m−3 h−1) due to aerosol feedback in the growth stage was mainly attributed to the changes in vertical movements (VDIF and VADV) and chemical processes, but the increased outflow via horizontal advection (HADV) partly offset the increased PM2.5 due to vertical movements, which caused a larger contribution to the PM2.5 increase from chemical processes (ΔIPR of 7.27 µg m−3 h−1) than that from physical processes (ΔIPR 2.23 µg m−3 h−1). However, during the second haze episode, physical processes (ΔIPR of 1.40 µg m−3 h−1) mainly contributed to the feedback-induced PM2.5 increase (ΔIPR of 2.4 µg m−3 h−1) in the growth stage rather than by chemical processes (ΔIPR of 1.0 µg m−3 h−1); Among the physical processes, the PM2.5 increase was mainly attributed to the increased horizontal advection (ΔIPR of 10.2 µg m−3 h−1). In general, in the growth stage of haze episodes, the feedback increased the accumulation rate of aerosols mainly through enhancing chemical formations, weakening vertical diffusions, and/or enhancing regional transport by advection. The feedback-induced changes in the change rate of PM2.5 concentration were small during the persistence stage, and the feedback enhanced the removal rate of PM2.5 in the dissipation stage mainly through increasing vertical diffusion and/or vertical advection.
The results from this study demonstrated a significant impact of aerosol radiative feedback on meteorology, chemistry, aerosol distribution, and evolution during winter haze events in the BTH region. The mechanism and processes through which the feedback affected haze formation and evolution were elucidated and quantified. This study is still subject to some uncertainties. (1) An internal mixing was assumed for aerosol mixing in this study, but the mixing state of aerosols is always changing. While this assumption is generally realistic for haze days, it may overestimate the feedback effect for clean days. (2) A typical size distribution measured during haze days was used, whereas the size of aerosol internal mixture could change to some extent with aging processes. These uncertainties require further development of model treatment for evolution of aerosol mixing state and size distribution, which is poorly represented in current online coupled models. (3) The direct aerosol radiative effect dominated the feedback effect in this study, so more cases in different regions and seasons, when the indirect effect could be more important, are needed to elucidate the complete feedback mechanism at different spatial and temporal scales. (4) Finer model grid resolution is expected to be applied to look into details of the feedback effect at the urban scale along with finer-resolution emission inventories (Tao et al., 2020), vertical observations (Wilcox et al., 2016; Wang et al., 2018), and higher computational efficiency when available in the future. Finally, this study pointed out the significance and necessity of developing online coupled models for exploring chemistry–aerosol–weather–climate interactions and for improving meteorological and chemical predictions in both air quality and climate research in the future.
The observational data can be accessed by contacting the corresponding authors.
The supplement related to this article is available online at: https://doi.org/10.5194/acp-20-8659-2020-supplement.
ZH designed the study. JL performed the model simulation. JL and ZH processed and analyzed the modeling data. ZH and JL wrote the paper. JL and ZX contributed to the model development. YW provided and analyzed the chemical observation data. XX provided the meteorological sounding and aerosol optical observation data. JL and LL processed and analyzed the observational data, and RZ synthesized and analyzed the observation.
The authors declare that they have no conflict of interest.
This article is part of the special issue “Regional assessment of air pollution and climate change over East and Southeast Asia: results from MICS-Asia Phase III”. It is not associated with a conference.
This study was supported by the National Natural Science Foundation of China (no. 91644217), the National Key R&D Program of China (no. 2019YFA0606802), and the Jiangsu Collaborative Innovation Center for Climate Change.
This research has been supported by the National Natural Science Foundation of China (grant no. 91644217) and the National Key R&D Program of China (no. 2019YFA0606802).
This paper was edited by Jianzhong Ma and reviewed by two anonymous referees.
Albrecht, B.: Aerosols, cloud microphysics, and fractional cloudiness, Science, 245, 1227, https://doi.org/10.1126/science.245.4923.1227, 1989.
An, Z., Huang, R., Zhang, R., Tie, X., Li, G., Cao, J., Zhou, W., Shi, Z., Han, Y., Gu, Z., and Ji, Y.: Severe haze in northern China: A synergy of anthropogenic emissions and atmospheric processes, P. Natl. Acad. Sci. USA, 116, 8657–8666, 2019.
Baklanov, A., Schlunzen, K., Suppan, P., Baldasano, J., Brunner, D., Aksoyoglu, S., Carmichael, G., Douros, J., Flemming, J., Forkel, R., Galmarini, S., Gauss, M., Grell, G., Hirtl, M., Joffre, S., Jorba, O., Kaas, E., Kaasik, M., Kallos, G., Kong, X., Korsholm, U., Kurganskiy, A., Kushta, J., Lohmann, U., Mahura, A., Manders-Groot, A., Murizi, A., Moussiopoulos, N., Rao, S.T., Savage, N., Seigneur, C., Sokhi, R.S., Solazzo, E., Solomos, S., Sorenson, B., Tsegas, G., Vignati, E., Vogel, B., and Zhang, Y.: Online coupled regional meteorology chemistry models in Europe: current status and prospects, Atmos. Chem. Phys., 14, 317–398, https://doi.org/10.5194/acp-14-317-2014, 2014.
Beheng, K. D.: A parameterization of warm cloud microphysical conversion processes, Atmos. Res., 33, 193–206, 1994.
Cai, W., Li, K., Liao, H., Wang, H., and Wu, L.: Weather conditions conducive to Beijing severe haze more frequent under climate change, Nat. Clim. Change, 7, 257–262, https://doi.org/10.1038/nclimate3249, 2017.
Carslaw, K. S., Boucher, O., Spracklen, D. V., Mann, G. W., Rae, J. G. L., Woodward, S., and Kulmala, M.: A review of natural aerosol interactions and feedbacks within the Earth system, Atmos. Chem. Phys., 10, 1701–1737, https://doi.org/10.5194/acp-10-1701-2010, 2010.
Chan, C. and Yao, X.: Air pollution in megacities in China, Atmos. Environ., 42, 1–42, 2008.
Che H., Xia, X., Zhu, J., Li, Z., Dubovik, O., Holben, B., Goloub, P., Chen, H., Estelles, V., Cuevas-Agulló, E., Blarel, L., Wang, H., Zhao, H., Zhang, X., Wang, Y., Sun, J., Tao, R., Zhang, X., and Shi, G.: Column aerosol optical properties and aerosol radiative forcing during a serious haze-fog month over North China Plain in 2013 based on ground-based sunphotometer measurements, Atmos. Chem. Phys., 14, 2125–2138, https://doi.org/10.5194/acp-14-2125-2014, 2014.
Chen, L., Zhu, J., Liao, H., Gao, Y., Qiu, Y., Zhang, M., Liu, Z., Li, N., and Wang, Y.: Assessing the formation and evolution mechanisms of severe haze pollution in the Beijing–Tianjin–Hebei region using process analysis, Atmos. Chem. Phys., 19, 10845–10864, https://doi.org/10.5194/acp-19-10845-2019, 2019.
Cheng, Y., Zheng, G., Wei, C., Mu, Q., Zheng, Bo., Wang, Z., Gao, M., Zhang, Q., He, K., Carmichael, G., Pösch, U., and Su, H.: Reactive nitrogen chemistry in aerosol water as a source of sulfate during haze events in China, Sci. Adv., 2, e1601530, https://doi.org/10.1126/sciadv.1601530, 2016.
Dawson, J. P., Adams, P. J., and Pandis, S. N.: Sensitivity of PM2.5 to climate in the Eastern US: a modeling case study, Atmos. Chem. Phys., 7, 4295–4309, https://doi.org/10.5194/acp-7-4295-2007, 2007.
Dickinson, R. E., Henderson-Sellers, A., and Kennedy, P. J.: Biosphere-Atmosphere Transfer Scheme (BATS) Version 1e as coupled to NCAR Community Climate Model, NCAR Technical Note, NCAR/TN-387+STR, p. 72, 1993.
Ding, A., Huang, X., Nie, W., Sun, J., Kerminen, V. M., Petäjä, T., Su, H., Cheng, Y., Yang, X., Wang, M., Chi, X., Wang, J., Virkkula, A., Guo, W., Yuan, J., Wang, S., Zhang, R., Wu, Y., Song, Y., Zhu, T., Zilitinkevich, S., Kulmala, M., and Fu, C.: Enhanced haze pollution by black carbon in megacities in China, Geophys. Res. Lett., 43, 2873–2879, https://doi.org/10.1002/2016gl067745, 2016.
Emmons, L. K., Walters, S., Hess, P. G., Lamarque, J. F., Pfister, G. G., Fillmore, D., Granier, C., Guenther, A., Kinnison, D., Laepple, T., Orlando, J., Tie, X., Tyndall, G., Wiedinmyer, C., Baughcum, S. L., and Kloster, S.: Description and evaluation of the Model for Ozone and Related chemical Tracers, version 4 (MOZART-4), Geosci. Model. Dev., 3, 43–67, https://doi.org/10.5194/gmd-3-43-2010, 2010.
Forkel, R., Werhahn, J., Hansen, A. B., McKeen, S., Peckham, S., Grell, G., and Suppan, P.: Effect of aerosol–radiation feedback on regional air quality – a case study with WRF/Chem, Atmos. Environ., 53, 202–211, 2012.
Fountoukis, C. and Nenes, A.: ISORROPIA II: a computationally efficient thermodynamic equilibrium model for K+–Ca2+–Mg2+–NH–Na+–SO–NO–Cl−–H2O aerosols, Atmos. Chem. Phys., 7, 4639–4659, https://doi.org/10.5194/acp-7-4639-2007, 2007.
Fu, C. B., Wang, S. Y., Xiong, Z., Gutowski, W. J., Lee, D., Mcgregor, J. L., Sato, Y., Kato, H., Kim, J., and Suh, M.: Regional climate model intercomparison project for Asia, B. Am. Meteorol. Soc., 86, 257–266, 2005.
Fu, H. and Chen, J.: Formation, features and controlling strategies of severe haze-fog pollutions in China, Sci. Total. Environ., 578, 121–138, 2017.
Gao, M., Carmichael, G. R., Wang, Y., Saide, P. E., Yu, M., Xin, J., Liu, Z., and Wang, Z.: Modeling study of the 2010 regional haze event in the North China Plain, Atmos. Chem. Phys., 16, 1673–1691, https://doi.org/10.5194/acp-16-1673-2016, 2016.
Gao, M., Han, Z., Liu, Z., Li, M., Xin, J., Tao, Z., Li, J., Kang, J., Huang, K., Dong, X., Zhuang, B., Li, S., Ge, B., Wu, Q., Cheng, Y., Wang, Y., Lee, H., Kim, C., Fu, J. S., Wang, T., Chin, M., Woo, J., Zhang, Q., Wang, Z., and Carmichael G. R.: Air Quality and Climate Change, Topic 3 of the Model Inter-Comparison Study for Asia Phase III (MICS-Asia III), Part I: overview and model evaluation, Atmos. Chem. Phys., 18, 4859–4884, https://doi.org/10.5194/acp-18-4859-2018, 2018.
Gao, M., Han, Z., Tao, Z., Li, J., Kang, J.-E., Huang, K., Dong, X., Zhuang, B., Li, S., Ge, B., Wu, Q., Lee, H.-J., Kim, C.-H., Fu, J. S., Wang, T., Chin, M., Li, M., Woo, J.-H., Zhang, Q., Cheng, Y., Wang, Z., and Carmichael, G. R.: Air quality and climate change, Topic 3 of the Model Inter-Comparison Study for Asia Phase III (MICS-Asia III) – Part 2: aerosol radiative effects and aerosol feedbacks, Atmos. Chem. Phys., 20, 1147–1161, https://doi.org/10.5194/acp-20-1147-2020, 2020.
Gao, Y., Zhang, M., Liu, Z., Wang, L., Wang, P., Xia, X., Tao, M., and Zhu, L.: Modeling the feedback between aerosol and meteorological variables in the atmospheric boundary layer during a severe fog–haze event over the North China Plain, Atmos. Chem. Phys., 15, 4279–4295, https://doi.org/10.5194/acp-15-4279-2015, 2015.
Gery, M. W., Whitten, G. Z., Killus, J. P., and Dodge, M. C.: A photochemical kinetics mechanism for urban and regional scale computer modeling, J. Geophys. Res., 94, 12925–12956, 1989.
Ghan, S. and Zaveri R. A.: Parameterization of optical properties for hydrated internally mixed aerosol, J. Geophys. Res., 112, D10201, https://doi.org/10.1029/2006JD007927, 2007.
Giglio, L., Randerson, J. T., and van der Werf, G. R.: Analysis of daily, monthly, and annual burned area using the fourth generation Global Fire Emissions Database (GFED4), J. Geophys. Res.-Biogeo., 118, 317–328, https://doi.org/10.1002/jgrg.20042, 2013.
Grell, G. A.: Prognostic evaluation of assumptions used by cumulus parameterizations, Mon. Weather Rev., 121, 764–787, 1993.
Guo, S., Hu, M., Zamora, M. L., Peng, J., Shang, D., Zheng, J., Du, Z., Wu, Z., Shao, M., Zeng, L., Molina, M. J., and Zhang, R.: Elucidating severe urban haze formation in China, P. Natl. Acad. Sci. USA, 111, 17373–17378, https://doi.org/10.1073/pnas.1419604111, 2014.
Han, X., Zhang, M. G., Han, Z. W., Xin, J. Y., and Liu, X. H.: Simulation of aerosol direct radiative forcing with RAMS-CMAQ in East Asia, Atmos. Environ., 45, 6576–6592, 2011.
Han, Z. W., Ueda, H., Matsuda, K., Zhang, R. J., Arao, K., Kanai, Y., and Hasome, H.: Model study on particle size segregation and deposition during Asian dust events in March 2002, J. Geophys. Res., 109, D19205, https://doi.org/10.1029/2004jd004920, 2004.
Han, Z. W.: Direct radiative effect of aerosols over East Asia with a Regional coupled Climate/Chemistry model, Meteorol. Z., 19, 287–298, 2010.
Han, Z. W., Xiong, Z., and Li, J. W.: Direct climatic effect of aerosols and interdecadal variations over East Asia investigated by a regional climate/chemistry model, Atmos. Ocean. Sci. Lett., 4, 299–303, 2011.
Han, Z. W., Li, J. W., Xia, X. A., and Zhang, R. J.: Investigation of direct radiative effects of aerosols in dust storm season over East Asia with an online coupled regional climate-chemistry-aerosol model, Atmos. Environ., 54, 688–699, 2012.
Han, Z. W., Li, J. W., Guo, W. D., Xiong, Z., and Zhang, W.: A study of dust radiative feedback on dust cycle and meteorology over East Asia by a coupled regional climate-chemistry-aerosol model, Atmos. Environ., 68, 54–63, 2013.
Han, Z. W., Li, J. W., Yao, X. H., and Tan, S. C.: A regional model study of the characteristics and indirect effects of marine primary organic aerosol in springtime over East Asia, Atmos. Environ., 197, 22–35, 2019.
Hegg D. A.: Cloud condensation nucleus-sulfate mass relationship and cloud albedo, J. Geophys. Res.-Atmos., 99, 25903–25907, 1994.
Hess, M., Koepke, P., and Schuit, I.: Optical properties of aerosols and clouds: the software package OPAC, B. Am. Meteorol. Soc., 79, 831–844, 1998.
Heo, B.-H., Jacoby-Koaly, S., Kim, K.-E., Campistron, B., Benech, B., and Jung, E.-S.: Use of the Doppler Spectral Width to Improve the Estimation of the Convective Boundary Layer Height from UHF Wind Profiler Observations, J. Atmos. Ocean. Technol., 20, 408–424, 2003.
Hong, S. and Pan, H.: Nonlocal boundary layer vertical diffusion in a medium-range forecast model, Mon. Weather Rev., 124, 2322–2339, 1996.
Huang, R. J., Zhang, Y., Bozzetti, C., Ho, K. F., Cao, J. J., Han, Y., Daellenbach, K. R., Slowik, J. G., Platt, S. M., Canonaco, F., Zotter, P., Wolf, R., Pieber, S. M., Bruns, E. A., Crippa, M., Ciarelli, G., Piazzalunga, A., Schwikowski, M., Abbaszade, G., Schnelle-Kreis, J., Zimmermann, R., An, Z., Szidat, S., Baltensperger, U., El Haddad, I., and Prevot, A. S.: High secondary aerosol contribution to particulate pollution during haze events in China, Nature, 514, 218–222, https://doi.org/10.1038/nature13774, 2014.
Huang, X., Wang, Z. L., and Ding, A. J.: Impact of Aerosol-PBL Interaction on Haze Pollution: Multiyear Observational Evidences in North China, Geophys. Res. Lett., 45, 8596–8603, 2018.
Isaksen I. S. A., Granier, C., Myhre, G., Berntsen, T. K., Dalsøren, S. B., Gauss, M., Klimont, Z., Benestad, R., Bousquet, P., Collins, W., Cox, T., Eyring, V., Fowler, D., Fuzzi, S., Jöckel, P., Laj, P., Lohmann, U., Maione, M., Monks, P., Prevot, A. S. H., Raes, F., Richter, A., Rognerud, B., Schulz, M., Shindell, D., Stevenson, D.S., Storelvmo, T., Wang, W.-C., van Weele, M., Wild, M., and Wuebbles, D.: Atmospheric composition change: Climate–Chemistry interactions, Atmos. Environ., 43, 5138–5192, 2009.
Jing, J., Wu, Y., Tao, J., Che, H. Z., Xia, X., Zhang, X., Yan, P., Zhao, D. M., and Zhang, L. M.: Observation and analysis of near-surface atmospheric aerosol optical properties in urban Beijing, Particuology, 18, 144–154, 2015.
Kajino, M., Ueda, H., Han, Z. W., Kudo, R., Inomata, Y., and Kaku, H.: Synergy between air pollution and urban meteorological changes through aerosol-radiation-diffusion feedback – A case study of Beijing in January 2013, Atmos. Environ., 171, 98–110, 2017.
Kiehl, J. T., Hack, J. J., Bonan, G. B., Boville, B. A., Briegleb, B. P., Williamson, D. L., and Rasch, P. J.: Description of the NCAR Community Climate Model (CCM3), NCAR Technical Note, NCAR/TN-420+STR, p. 152, 1996.
Lee-Taylor, J. and Madronich, S.: Climatology of UV-A, UV-B, and Erythemal Radiation at the Earth's Surface, 1979–2000, NCAR Technical Note, NCAR/TN-474+STR, 1–52, 2007.
Li, G., Bei, N., Cao, J., Huang, R., Wu, J., Feng, T., Wang, Y., Liu, S., Zhang, Q., Tie, X., and Molina, L. T.: A possible pathway for rapid growth of sulfate during haze days in China, Atmos. Chem. Phys., 17, 3301–3316, https://doi.org/10.5194/acp-17-3301-2017, 2017.
Li, J., Chen, X. S., Wang, Z. F., Du, H. Y., Yang, W. Y., Sun, Y. L., Hu, B., Li, J. J., Wang, W., Wang, T., Fu, P. Q., and Huang, H. L.: Radiative and heterogeneous chemical effects of aerosols on ozone and inorganic aerosols over East Asia, Sci. Total. Environ., 622/623, 1327–1342 , 2018.
Li, J. W. and Han, Z. W.: A modeling study of the impact of heterogeneous reactions on mineral aerosol surfaces on tropospheric chemistry over East Asia, Particuology, 8, 433–441, 2010.
Li, J. W. and Han, Z. W.: A modeling study of severe winter haze events in Beijing and its neighboring regions, Atmos. Res., 170, 87–97, 2016a.
Li, J. W. and Han, Z. W.: Aerosol vertical distribution over east China from RIEMS-Chem simulation in comparison with CALIPSO measurements, Atmos. Environ., 143, 177–189, 2016b.
Li, J. W. and Han, Z. W.: Seasonal variation of nitrate concentration and its direct radiative forcing over East Asia, Atmosphere, 7, 105, https://doi.org/10.3390/atmos7080105, 2016c.
Li, J. W., Han, Z. W., and Zhang, R. J.: Influence of aerosol hygroscopic growth parameterization on aerosol optical depth and direct radiative forcing over East Asia, Atmos. Res., 140/141, 14–27, 2014.
Li, J. W., Han, Z. W., and Yao, X. H.: A modeling study of the influence of sea salt on inorganic aerosol concentration, size distribution, and deposition in the western Pacific Ocean, Atmos. Environ., 188, 157–173, 2018.
Li, J. W., Han, Z. W., Yao, X. H., Xie, Z. X., and Tan, S. C.: The distributions and direct radiative effects of marine aerosols over East Asia in springtime, Sci. Total. Environ., 651, 1913–1925, 2019.
Li, M., Zhang, Q., Kurokawa, J.-I., Woo, J.-H., He, K., Lu, Z., Ohara, T., Song, Y., Streets, D. G., Carmichael, G. R., Cheng, Y., Hong, C., Huo, H., Jiang, X., Kang, S., Liu, F., Su, H., and Zheng, B.: MIX: a mosaic Asian anthropogenic emission inventory under the international collaboration framework of the MICS-Asia and HTAP, Atmos. Chem. Phys., 17, 935–963, https://doi.org/10.5194/acp-17-935-2017, 2017a.
Li, X., Wu, J., Elser, M., Tong, S., Liu, S., Li, X., Liu, L., Cao, J., Zhou, J., El-Haddad, I., Huang, R., Ge, M., Tie, X., André S. H. Prévôt, and Li, G.: Wintertime secondary organic aerosol formation in Beijing–Tianjin–Hebei (BTH): contributions of HONO sources and heterogeneous reactions, Atmos. Chem. Phys., 19, 2343–2359, https://doi.org/10.5194/acp-19-2343-2019, 2019.
Li, Z., Guo, J., Ding, A., Liao, H., Liu, J., Sun, Y., Wang, T., Xue, H., Zhang, H., and Zhu, B.: Aerosol and boundary-layer interactions and impact on air quality, Natl. Sci. Rev., 4, 810–833, https://doi.org/10.1093/nsr/nwx117, 2017.
Liu, X. H. and Wang, J.: How important is organic aerosol hygroscopicity to aerosol indirect forcing?, Environ. Res. Lett., 5, 044010, https://doi.org/10.1088/1748-9326/5/4/044010, 2010.
Liu, X. H., Zhang, Y., Xing, J., Zhang, Q., Wang, K., Streets, D., Jang, C., Wang, W.-X., and Hao, J.-M.: Understanding of regional air pollution over China using CMAQ, part II. Process analysis and sensitivity of ozone and particulate matter to precursor emissions, Atmos. Environ., 44, 3719–3727, 2010.
Ma, N., Zhao, C. S., Müller, T., Cheng, Y. F., Liu, P. F., Deng, Z. Z., Xu, W. Y., Ran, L., Nekat, B., van Pinxteren, D., Gnauk, T., Müller, K., Herrmann, H., Yan, P., Zhou, X. J., and Wiedensohler, A.: A new method to determine the mixing state of light absorbing carbonaceous using the measured aerosol optical properties and number size distributions, Atmos. Chem. Phys., 12, 2381–2397, https://doi.org/10.5194/acp-12-2381-2012, 2012.
Ma, Q. X., Wu, Y. F., Zhang, D. Z., Wang, X. J., Xia, Y. J., Liu, X. Y., Tian, P., Han, Z. W., Xia, X. A., Wang, Y., and Zhang, R. J.: Roles of regional transport and heterogeneous reactions in the PM2.5 increase during winter haze episodes in Beijing, Sci. Total. Environ., 599/600, 246–253, 2017.
Martin, G. M., Johnson, D. W., and Spice, A.: The Measurements and Parameterization of Effective Radius of Droplets in Warm Stratocumulus Clouds, J. Atmos. Sci., 51, 1823–1842, 1994.
NOAA/NCEP.: NCEP FNL Operational Model Global Tropospheric Analyses, continuing from July 1999. Research Data Archive at the National Center for Atmospheric Research, Computational and Information Systems Laboratory, Dataset, https://doi.org/10.5065/D6M043C6 (last access: 12 April 2019), 2000.
Odum, J. R., Jungkamp, T. P. W., Griffin, R. J., Flagan, R. C., and Seinfeld, J. H.: The atmospheric aerosol-forming potential of whole gasoline vapor, Science, 276, 96–99, 1997.
Petters, M. D. and Kreidenweis, S. M.: A single parameter representation of hygroscopic growth and cloud condensation nucleus activity, Atmos. Chem. Phys., 7, 1961–1971, https://doi.org/10.5194/acp-7-1961-2007, 2007.
Qiu, Y., Liao, H., Zhang, R., and Hu, J.: Simulated impacts of direct radiative effects of scattering and absorbing aerosols on surface layer aerosol concentrations in China during a heavily polluted event in February 2014, J. Geophys. Res.-Atmos., 122, 5955–5975, https://doi.org/10.1002/2016jd026309, 2017.
Ramanathan, V., Crutzen, P. J., Kiehl, J. T., and Rosenfeld, D.: Aerosols, climate, and the hydrological cycle, Science, 294, 2119–2124, https://doi.org/10.1126/science.1064034, 2001.
Riemer, N., West, M., Zaveri, R., and Easter, R.: Estimating black carbon aging time-scales with a particle-resolved aerosol model, J. Aerosol Sci., 41, 143–158, 2010.
Song, Z. J., Fu, D. S., Zhang, X. L., Wu, Y. F., Xia, X. A., He, J. X., Han, X. L., Zhang, R. J., and Che, H. Z.: Diurnal and seasonal variability of PM2.5 and AOD in North China plain: Comparison of MERRA-2 products and ground measurements, Atmos. Environ., 191, 70–78, 2018.
Sun, Y., Jiang, Q., Wang, Z., Fu, P., Li, J., Yang, T., and Yin, Y.: Investigation of the Sources and Evolution Processes of Severe Haze Pollution in Beijing in January 2013, J. Geophys. Res., 119, 4380–4398, 2014.
Tao, Z., Chin, M., Gao, M., Kucsera, T., Kim, D., Bian, H., Kurokawa, J., Wang, Y., Liu, Z., Carmichael, G. R., Wang, Z., and Akimoto, H.: Evaluation of NU-WRF model performance on air quality simulation under various model resolutions – an investigation within the framework of MICS-Asia Phase III, Atmos. Chem. Phys., 20, 2319–2339, https://doi.org/10.5194/acp-20-2319-2020, 2020.
Twomey, S.: Pollution and the planetary albedo, Atmos. Environ., 8, 1251–1256, 1974.
Wang, J., Wang, S., Jiang, J., Ding, A., Zheng, M., Zhao, B., Wong, D. C., Zhou, W., Zheng, G., and Wang, L.: Impact of aerosol-meteorology interactions on fine particle pollution during China's severe haze episode in January 2013, Environ. Res. Lett., 9, 094002, https://doi.org/10.1088/1748-9326/9/9/094002, 2014.
Wang, S. Y., Fu, C. B., Wei, H. L., Qian, Y., Xiong, Z., Feng, J. M., Zhao, D. M., Dan, L., Han, Z. W., Su, B. K., Zhao, M., Zhang, Y. C., Tang, J. P., Liu, H. N., Wu, J., Zeng, X. M., Chen, M., and Wang, L. Z.: Regional integrated environmental modeling system: development and application, Climate Change, 129, 499–510, 2015.
Wang, Y., Bao, S., Wang, S., Hu, Y., Shi, X., Wang, J., Zhao, B., Jiang, J., Zheng, M., Wu, M., Russell, A. G., Wang, Y., and Hao, J.: Local and regional contributions to fine particulate matter in Beijing during heavy haze episodes, Sci. Total. Environ., 580, 283–296, https://doi.org/10.1016/j.scitotenv.2016.12.127, 2017.
Wang, Z., Huang, X., and Ding, A.: Dome effect of black carbon and its key influencing factors: a one-dimensional modelling study, Atmos. Chem. Phys., 18, 2821–2834, https://doi.org/10.5194/acp-18-2821-2018, 2018.
Wang, Z., Li, J., Wang, Z., Yang, W., Tang, X., Ge, B., Yan, P., Zhu, L., Chen, X., Chen, H., Wand, W., Li, J., Liu, B., Wang, X., Wand, W., Zhao, Y., Lu, N., and Su, D.: Modeling study of regional severe hazes over mid-eastern China in January 2013 and its implications on pollution prevention and control, Sci. China. Earth. Sci., 57, 3–13, https://doi.org/10.1007/s11430-013-4793-0, 2014.
Westervelt, D. M., Moore, R. H., Nenes, A., and Adams, P. J.: Effect of primary organic sea spray emissions on cloud condensation nuclei concentrations, Atmos. Chem. Phys., 12, 89–101, https://doi.org/10.5194/acp-12-89-2012, 2012.
Wilcox, E. M., Thomas, R. M., Praveen, P. S., Pistone, K., Bender, F. A., and Ramanathan, V.: Black carbon solar absorption suppresses turbulence in the atmospheric boundary layer, P. Natl. Acad. Sci. USA, 113, 11794–11799, 2016.
Wu, J., Bei, N., Hu, B., Liu, S., Zhou, M., Wang, Q., Li, X., Liu, L., Feng, T., Liu, Z., Wang, Y., Cao, J., Tie, X., Wang J., Molina, L. T., and Li, G.: Aerosol–radiation feedback deteriorates the wintertime haze in the North China Plain, Atmos. Chem. Phys., 19, 8703–8719, https://doi.org/10.5194/acp-19-8703-2019, 2019.
Wu, Y. F., Zhang, R. J., Tian, P., Tao, J., Hsu, S.-C., Yan, P., Wang, Q. Y., Cao, J. J., Zhang, X. L., and Xia, X. A.: Effect of ambient humidity on the light absorption amplification of black carbon in Beijing during January 2013, Atmos. Environ., 124, 217–223, 2016.
Xiong, Z., Fu, C. B., and Yan, X. D.: Regional Integrated environmental model system and its simulation of East Asia summer monsoon, Chinese, Sci. Bull., 54, 4253–4261, 2009.
Yu, S., Mathur, R., Schere, K., Kang, D., Plein, J., Young, J., Tong, D., Pouliot, G., Mckeen, S. A., and Rao, S. T.: Evaluation of real-time PM2.5 forecasts and process analysis for PM2.5 formation over the eastern United States using the Eta-CMAQ forecast model during the 2004 ICARTT study, J. Geophys. Res., 113, D06204, https://doi.org/10.1029/2007JD009226, 2008.
Zhang, B., Wang, Y., and Hao, J.: Simulating aerosol–radiation–cloud feedbacks on meteorology and air quality over eastern China under severe haze conditions in winter, Atmos. Chem. Phys., 15, 2387–2404, https://doi.org/10.5194/acp-15-2387-2015, 2015.
Zhang, X. Y., Wang, Y. Q., Niu, T., Zhang, X. C., Gong, S. L., Zhang, Y. M., and Sun, J. Y.: Atmospheric aerosol compositions in China: spatial/temporal variability, chemical signature, regional haze distribution and comparisons with global aerosols, Atmos. Chem. Phys., 12, 779–799, https://doi.org/10.5194/acp-12-779-2012, 2012.
Zhang, X., Zhong, J., Wang, J., Wang, Y., and Liu, Y.: The interdecadal worsening of weather conditions affecting aerosol pollution in the Beijing area in relation to climate warming, Atmos. Chem. Phys., 18, 5991–5999, https://doi.org/10.5194/acp-18-5991-2018, 2018a.
Zhang, X., Zhang, Q., Hong, C., Zheng, Y., Geng, G., Tong, D., Zhang, Y., and Zhang, X.: Enhancement of PM2.5 Concentrations by Aerosol-Meteorology Interactions Over China, J. Geophys. Res.-Atmos., 123, 1179–1194, https://doi.org/10.1002/2017JD027524, 2018b.
Zhang, Y.: Online-coupled meteorology and chemistry models: history, current status, and outlook, Atmos. Chem. Phys., 8, 2895–2932, https://doi.org/10.5194/acp-8-2895-2008, 2008.
Zhang, Y., Wen, X.-Y., Wang, K., Vijayaraghavan, K., and Jacobson, M. Z.: Probing into regional O3 and PM pollution in the U.S., Part II, An examination of formation mechanisms through a process analysis technique and sensitivity study, J. Geophys. Res., 114, D22305, https://doi.org/10.1029/2009JD011900, 2009.
Zhang, Y., Wen, X. Y., and Jang, C. J.: Simulating chemistry-aerosol-cloud-radiation-climate feedbacks over the continental U.S. using the online-coupled weather research forecasting model with chemistry (WRF/Chem), Atmos. Environ., 44, 3568–3582, 2010.
Zhao, B., Liou, K. N., Gu, Y., Li, Q., Jiang, J. H., Su, H., He, C., Tseng, H. R., Wang, S., Liu, R., Qi, L., Lee, W. L., and Hao, J.: Enhanced PM2.5 pollution in China due to aerosol-cloud interactions, Sci. Rep., 7, 4453, https://doi.org/10.1038/s41598-017-04096-8, 2017.
Zhao, D. M.: Performance of Regional Integrated Environment Modeling System (RIEMS) in precipitation simulations over East Asia, Clim. Dynam., 40, 1767–1787, 2013.
Zhao, P., Dong, F., Yang, Y., He, D., Zhao, X., and Zhang, W.: Characteristics of carbonaceous aerosol in the region of Beijing, Tianjin, and Hebei, China, Atmos. Environ., 71, 389–398, 2013.
Zheng, B., Zhang, Q., Zhang, Y., He, K. B.,Wang, K., Zheng, G. J., Duan, F. K., Ma, Y. L., and Kimoto, T.: Heterogeneous chemistry: a mechanism missing in current models to explain secondary inorganic aerosol formation during the January 2013 haze episode in North China, Atmos. Chem. Phys., 15, 2031–2049, https://doi.org/10.5194/acp-15-2031-2015, 2015.
Zhong, J., Zhang, X., Dong, Y.,Wang, Y., Liu, C.,Wang, J., Zhang, Y., and Che, H.: Feedback effects of boundary-layer meteorological factors on cumulative explosive growth of PM2.5 during winter heavy pollution episodes in Beijing from 2013 to 2016, Atmos. Chem. Phys., 18, 247–258, https://doi.org/10.5194/acp-18-247-2018, 2018a.
Zhong, J., Zhang, X., Wang, Y., Liu, C., and Dong, Y.: Heavy aerosol pollution episodes in winter Beijing enhanced by radiative cooling effects of aerosols, Atmos. Res., 209, 59–64, https://doi.org/10.1016/j.atmosres.2018.03.011, 2018b.
Zhuang, B. L., Li, S., Wang, T. J., Deng, J. J., Xie, M., Yin, C. Q., and Zhu, J. L.: Direct radiative forcing and climate effects of anthropogenic aerosols with different mixing states over China, Atmos. Environ., 79, 349–361, 2013.
- Abstract
- Introduction
- Model and data
- Model validations
- Aerosol radiative effects and feedbacks
- Process analysis of haze evolution and aerosol radiative feedback
- Conclusions
- Data availability
- Author contributions
- Competing interests
- Special issue statement
- Acknowledgements
- Financial support
- Review statement
- References
- Supplement