the Creative Commons Attribution 4.0 License.
the Creative Commons Attribution 4.0 License.
 | 03 Jun 2020
Ensemble daily simulations for elucidating cloud–aerosol interactions under a large spread of realistic environmental conditions
Philip Stier
Aerosol effects on cloud properties and the atmospheric energy and radiation budgets are studied through ensemble simulations over two month-long periods during the NARVAL campaigns (Next-generation Aircraft Remote-Sensing for Validation Studies, December 2013 and August 2016). For each day, two simulations are conducted with low and high cloud droplet number concentrations (CDNCs), representing low and high aerosol concentrations, respectively. This large data set, which is based on a large spread of co-varying realistic initial conditions, enables robust identification of the effect of CDNC changes on cloud properties. We show that increases in CDNC drive a reduction in the top-of-atmosphere (TOA) net shortwave flux (more reflection) and a decrease in the lower-tropospheric stability for all cases examined, while the TOA longwave flux and the liquid and ice water path changes are generally positive. However, changes in cloud fraction or precipitation, that could appear significant for a given day, are not as robustly affected, and, at least for the summer month, are not statistically distinguishable from zero. These results highlight the need for using a large sample of initial conditions for cloud–aerosol studies for identifying the significance of the response. In addition, we demonstrate the dependence of the aerosol effects on the season, as it is shown that the TOA net radiative effect is doubled during the winter month as compared to the summer month. By separating the simulations into different dominant cloud regimes, we show that the difference between the different months emerges due to the compensation of the longwave effect induced by an increase in ice content as compared to the shortwave effect of the liquid clouds. The CDNC effect on the longwave flux is stronger in the summer as the clouds are deeper and the atmosphere is more unstable.
- Article
(2662 KB) - Full-text XML
-
Supplement
(350 KB) - BibTeX
- EndNote


Cloud droplets form on suitable aerosols which can serve as cloud condensation nuclei. Thus, for vertical velocities which are sufficient to sustain aerosol activation, cloud droplet number concentration (CDNC) increases with increasing aerosol concentrations. Concomitantly with the increase in the CDNC, and assuming constant liquid water content, the initial cloud hydrometeor (liquid and ice particles) size distribution shifts to smaller sizes and becomes narrower, which may modulate cloud micro- and macro-physical properties (Khain et al., 2005; Koren et al., 2005, 2014; Heikenfeld et al., 2019; Chen et al., 2017; Altaratz et al., 2014; Seifert and Beheng, 2006a; Dagan et al., 2017, 2018b), the rain production (Levin and Cotton, 2009; Albrecht, 1989; Tao et al., 2012; Dagan et al., 2015b), and the clouds' radiative effect (Koren et al., 2010; Storelvmo et al., 2011; Twomey, 1977; Albrecht, 1989). Anthropogenic aerosol emissions may thus perturb Earth's radiation budget both directly, by scattering and absorption, and also indirectly, through these cloud-mediated mechanisms. However, despite decades of effort of trying to better understand the processes involved, cloud–aerosol interactions are still considered one of the most uncertain anthropogenic effects on climate (Boucher et al., 2013).
The aerosol effect on clouds has been previously shown to be cloud regime dependent (Altaratz et al., 2014; Lee et al., 2009; Mülmenstädt and Feingold, 2018; van den Heever et al., 2011; Rosenfeld et al., 2013; Glassmeier and Lohmann, 2016; Gryspeerdt and Stier, 2012; Christensen et al., 2016). In addition, even for a given cloud regime, small changes in the meteorological conditions may change the sign and magnitude of the aerosol effect (Dagan et al., 2015b; Fan et al., 2007, 2009; Kalina et al., 2014; Khain et al., 2008; Liu et al., 2019).
The fact that the aerosol effect on clouds and precipitation is dependent on the cloud regime and meteorological conditions makes the quantification of its global effect challenging and uncertain (Mülmenstädt and Feingold, 2018; Bellouin et al., 2019). One way to overcome this challenge is by examining the aerosol effect for an ensemble of realistic co-varying initial conditions (as opposed to perturbing each environmental condition separately). This can be done by conducting ensemble or routine numerical simulations (such as those conducted in previous studies, Gustafson and Vogelmann, 2015; Gustafson et al., 2017; Klocke et al., 2017) focusing on aerosol effects. This methodology enables identifying, using large statistics, clouds and radiative properties that respond in a consistent manner to aerosol (noting that in single case studies some of the differences between different simulations could be just due to different realizations of the model; Grabowski, 2015). This methodology also enables the investigation of the aerosol effect on cloud and precipitation as a function of the initial conditions.
In a recent paper, focusing on two specific cases (each one for 2 d) and a relatively large domain (), the physical processes controlling the aerosol effect on the atmospheric energy budget were investigated (Dagan et al., 2020). It was shown that the total column atmospheric radiative warming (, defined as the rate of net atmospheric diabatic warming due to radiative shortwave (SW) and longwave (LW) fluxes at the surface (SFC) and top of the atmosphere (TOA), with all fluxes positive downwards) is substantially increased with CDNC in a deep-cloud-dominated case (by ∼10 W m−2), while a much smaller increase (∼1.6 W m−2) is shown in a shallow-cloud-dominated case. This trend is caused by an increase in the upward mass flux of ice and water vapour to the upper troposphere that leads to reduced outgoing longwave radiation (Fan et al., 2012). The increase in mass flux is caused partially by an increase in vertical velocities (Koren et al., 2005; Rosenfeld et al., 2008; Dagan et al., 2018a) and mostly by an increase in the water content at the mid-troposphere (due to warm rain suppression) that increases the upward mass flux, even for a give vertical velocity. The change in net radiative fluxes at the TOA () was shown to be −5.2 W m−2 for the shallow-cloud-dominated case and −1.9 W m−2 for the deep-cloud-dominated case. Dagan et al. (2020) also show that the cloud fraction responds in opposite ways to CDNC perturbations in the different cases, increasing in the deep-cloud-dominated case and decreasing in the shallow-cloud-dominated case. However, it is unclear how representative these results are as they are based on two specific cases. The ensemble simulations presented in this study could be used to examine the robustness of these aerosol effects using large statistics.
The focus of this study is on clouds over the Atlantic Ocean near Barbados (Fig. 1). Barbados is located north of the mean Intertropical Convergence Zone (ITCZ) location, in a way that samples both the trade region, dominated by shallow cumulus during the boreal winter, and the transition to deep convection as the ITCZ migrates northward during boreal summer (Stevens et al., 2016). Hence, this location enables the investigation of different cloud regimes and different meteorological conditions. In addition, the clouds near Barbados have been shown to be representative of clouds across the trade winds region (Medeiros and Nuijens, 2016).
Ensemble daily simulations using the Icosahedral Nonhydrostatic (ICON) atmospheric model (Zängl et al., 2015) in a limited area configuration are conducted. ICON's dynamical core has been validated against several idealized cases as well as against numerical weather prediction skill scores (Zängl et al., 2015). The domain is located east of Barbados island and covers (Fig. 1). The simulations are aligned with the NARVAL (Next-generation Aircraft Remote-Sensing for Validation Studies; Klepp et al., 2014; Stevens et al., 2016, 2019) campaigns, which took place during December 2013 (NARVAL 1) and August 2016 (NARVAL 2) in the northern tropical Atlantic. We use existing NARVAL convection-permitting simulations (Klocke et al., 2017) as initial and boundary conditions for our simulations and a two-moment bulk microphysical scheme (Seifert and Beheng, 2006b). For each day during these 2 months, two different simulations are started with identical initial conditions with different CDNC of 20 (clean) and 200 cm−3 (polluted), resulting in an ensemble of 124 simulations. The different CDNC scenarios serve as proxy for different aerosol concentration conditions and are chosen as they represent the range typically observed over the ocean (Rosenfeld et al., 2019; Gryspeerdt et al., 2019). Using fixed CDNC avoids the uncertainties involved in the representation of aerosol processes in numerical models (Rothenberg et al., 2018); however, it limits potential feedbacks between clouds and aerosols, such as through aerosol scavenging (Yamaguchi et al., 2017). In addition, we note that use of a microphysical scheme which assumes saturation adjustment reduces the sensitivity of the clouds to some of the aerosol effect (Koren et al., 2014; Dagan et al., 2015a; Heiblum et al., 2016; Fan et al., 2018).
Each simulation is conducted for 24 h, starting from 12:00 UTC – 12 h after the original simulations of Klocke et al. (2017) were initialized from reanalysis data, to reduce spin-up effects. Using initial and boundary conditions based on ICON simulations with similar resolution, as in Klocke et al. (2017), reduces the spin-up effects. The horizontal resolution is set to 1200 m and 75 vertical levels are used. The temporal resolution is 12 s and the output interval is 30 min. Interactive radiation is calculated every 12 min using the RRTM-G scheme (Clough et al., 2005; Iacono et al., 2008; Mlawer et al., 1997). The simulations include an interactive surface flux scheme and a fixed (for each day) sea surface temperature. As in Dagan et al. (2020), the simulations include representation of the Twomey effect, calculated with diagnosed cloud droplet effective radii from the microphysical scheme (Twomey, 1977). However, due to the large uncertainty involved in the ice microphysics and morphology, no Twomey effect due to changes in the ice particles size distribution was considered.
In addition, the domain is set up to include the Barbados Cloud Observatory (BCO; Stevens et al., 2016) while minimizing the island effect of Barbados (most of the domain is east of the island and only the eastern part of the island, which includes the BCO (13∘ N, 59∘ W), is included in the domain). Observations from the BCO are used for model evaluation (Figs. S1 and S2 in the Supplement), and they demonstrate that the model performs well for low-surface-SW-flux days but underestimates the flux for high-SW-flux days (usually under low cloud fraction).
We note that although a domain is larger than the domains used in many previous studies, it is still possible that the use of fixed boundary conditions for the different simulations under different CDNC conditions reduces some of the sensitivity as compared to simulations with larger domains such as in Dagan et al. (2020) ().
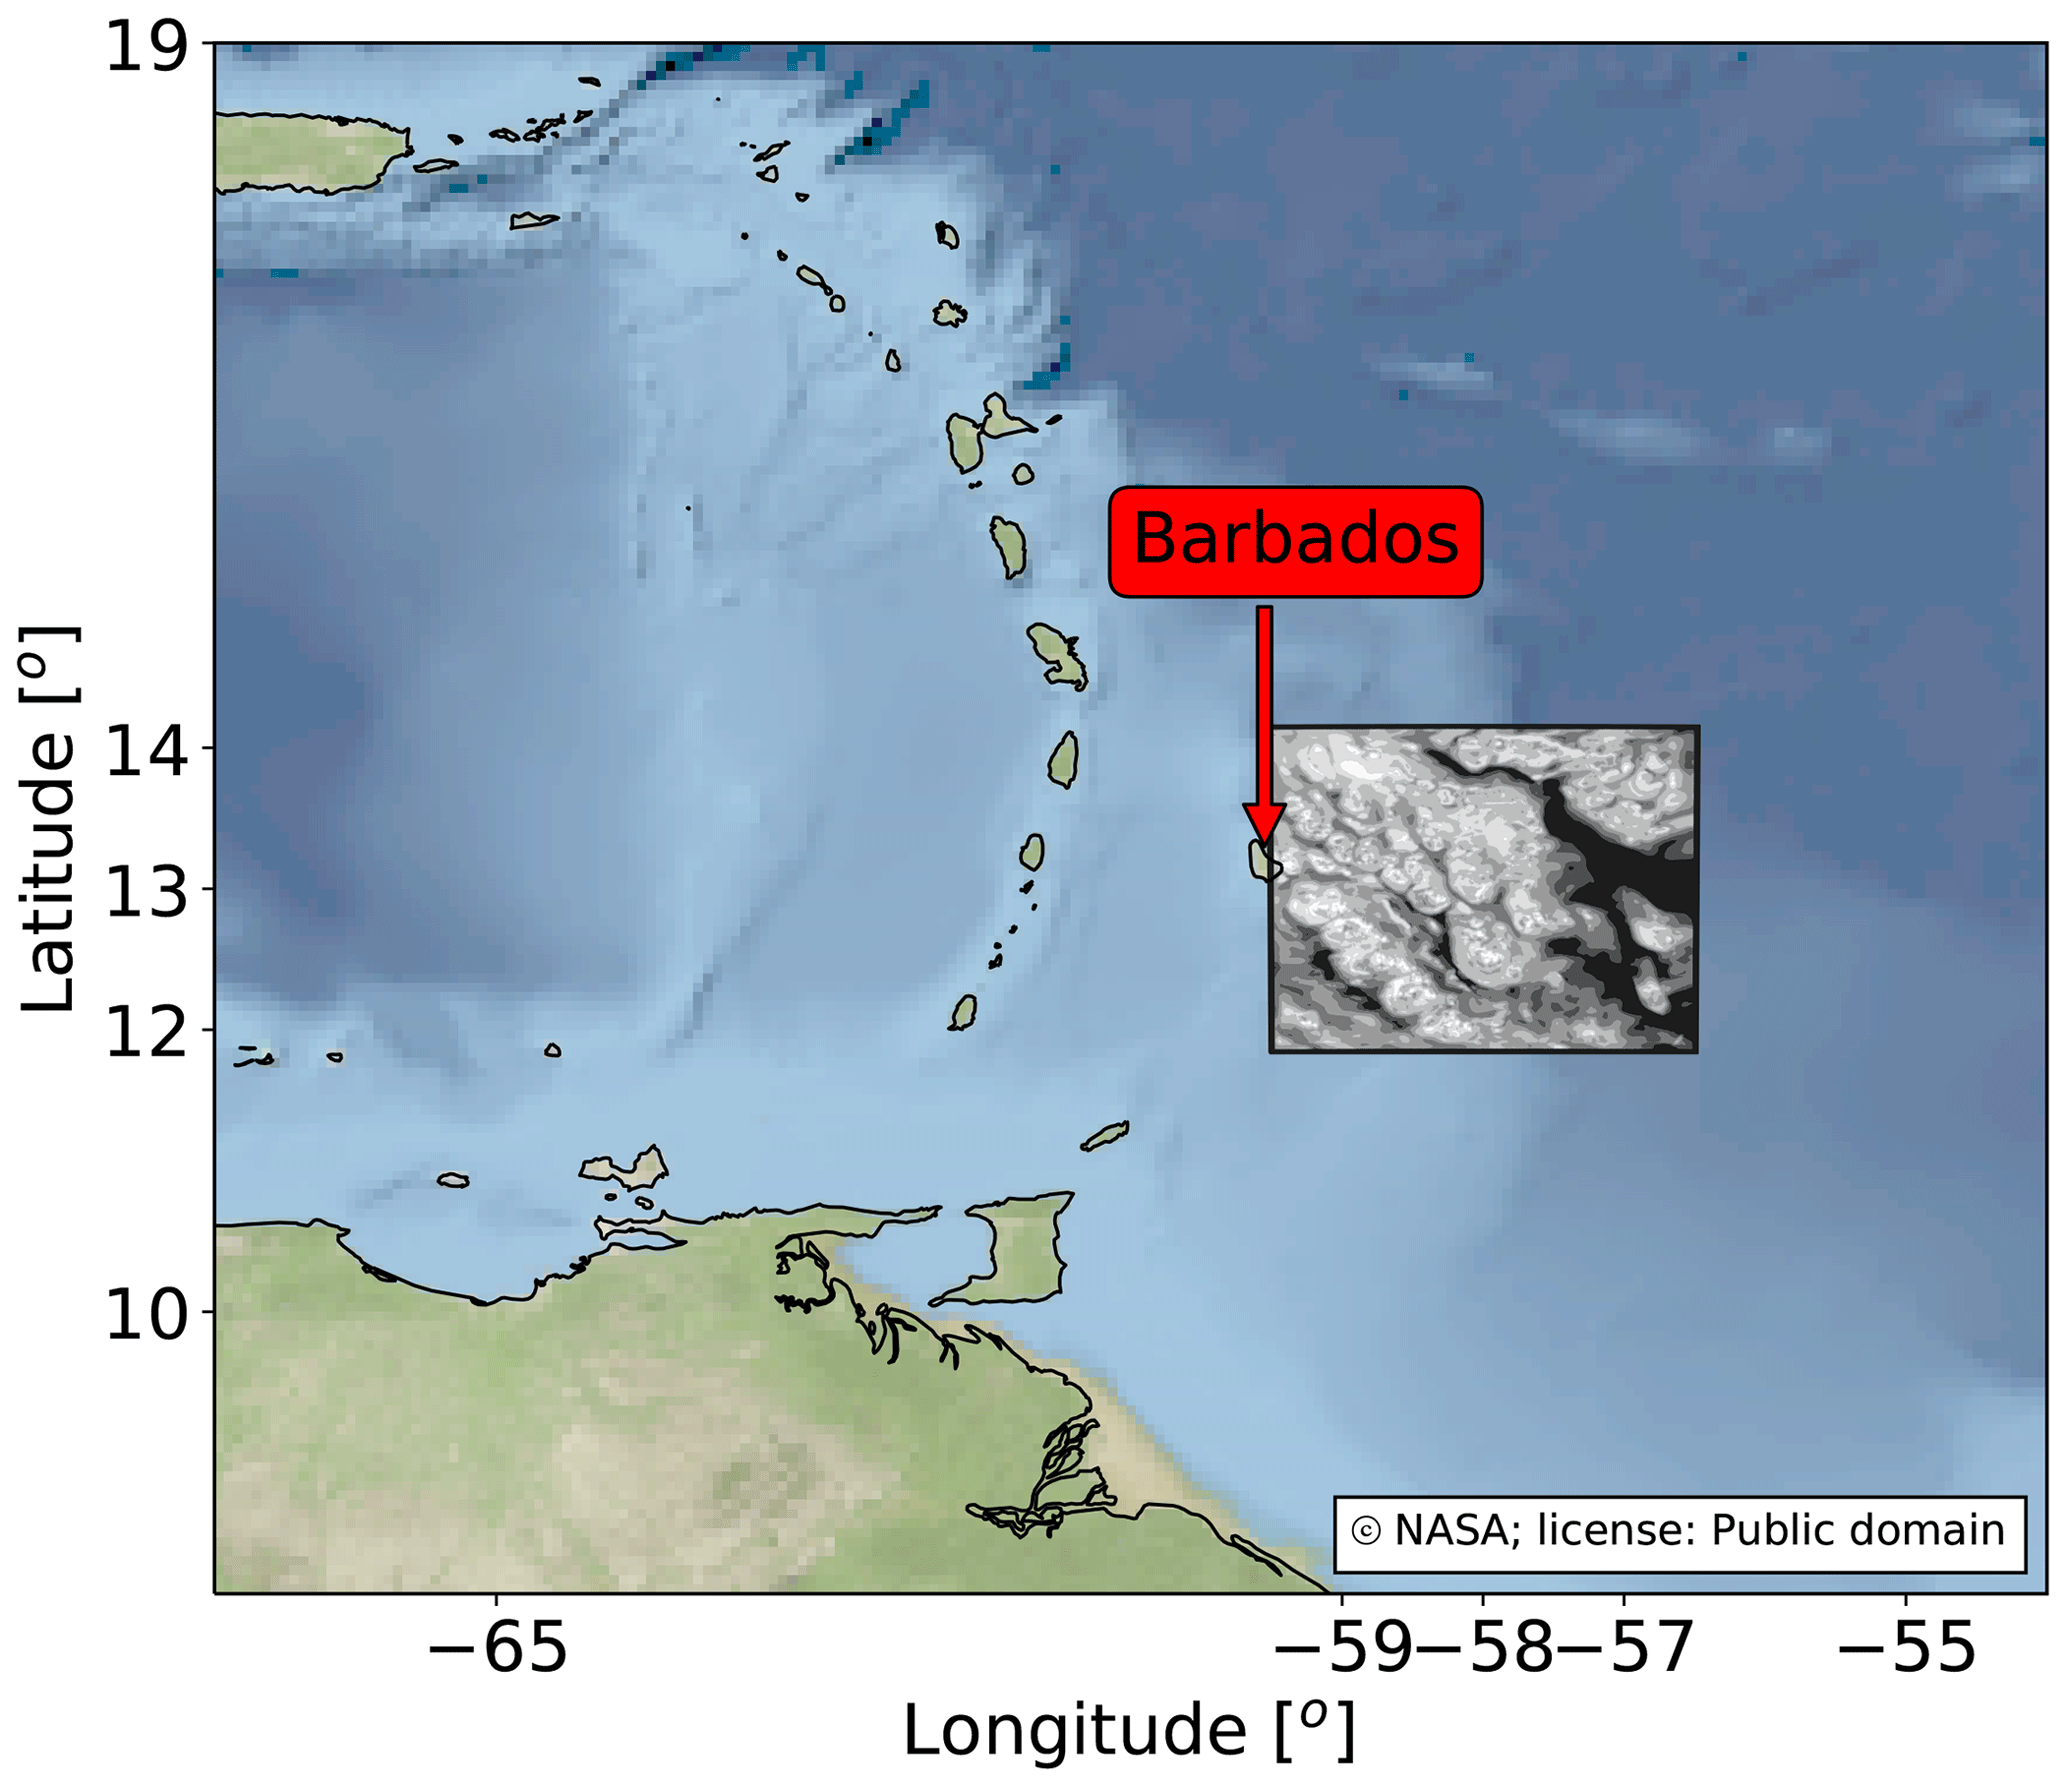
Figure 1The domain of the simulations (the box in the middle) and the area around it. Inside the domain the average cloud fraction over the first 30 min of the simulation for 1 August 2016 is presented; CDNC = 20 cm−3. The island of Barbados is marked with a red arrow.
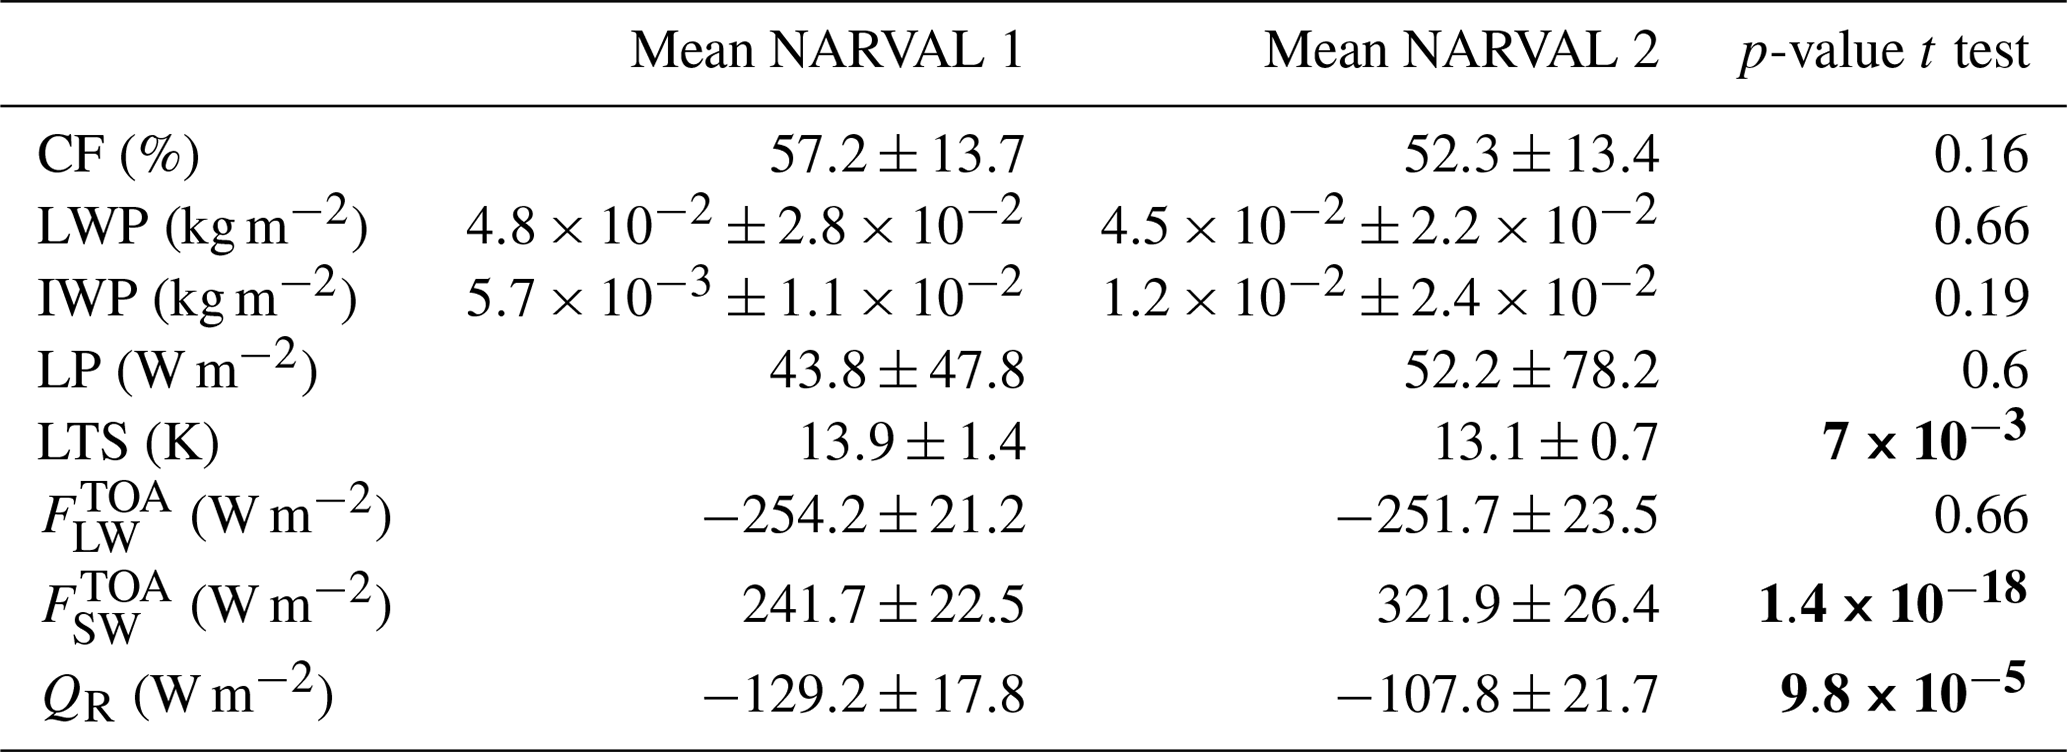
Conducting daily simulations over 2 months at different seasons allows us to sample a large ensemble of initial conditions and cloud types (see Fig. 2 and Table 1). To identify statistically significant differences between the 2 months, we conduct independent t test (p values are presented in Table 1). This demonstrates that the lower-tropospheric stability (LTS), top-of-atmosphere shortwave flux (), and the atmospheric column radiative term (QR) are different in a statistically significant manner (p value < 0.05) between the 2 different months. The differences in other parameters (cloud fraction – CF, liquid water path - LWP, ice water path – IWP, latent heat of precipitation – LP, and top-of-atmosphere longwave flux – ) are not statistically significant (Table 1).
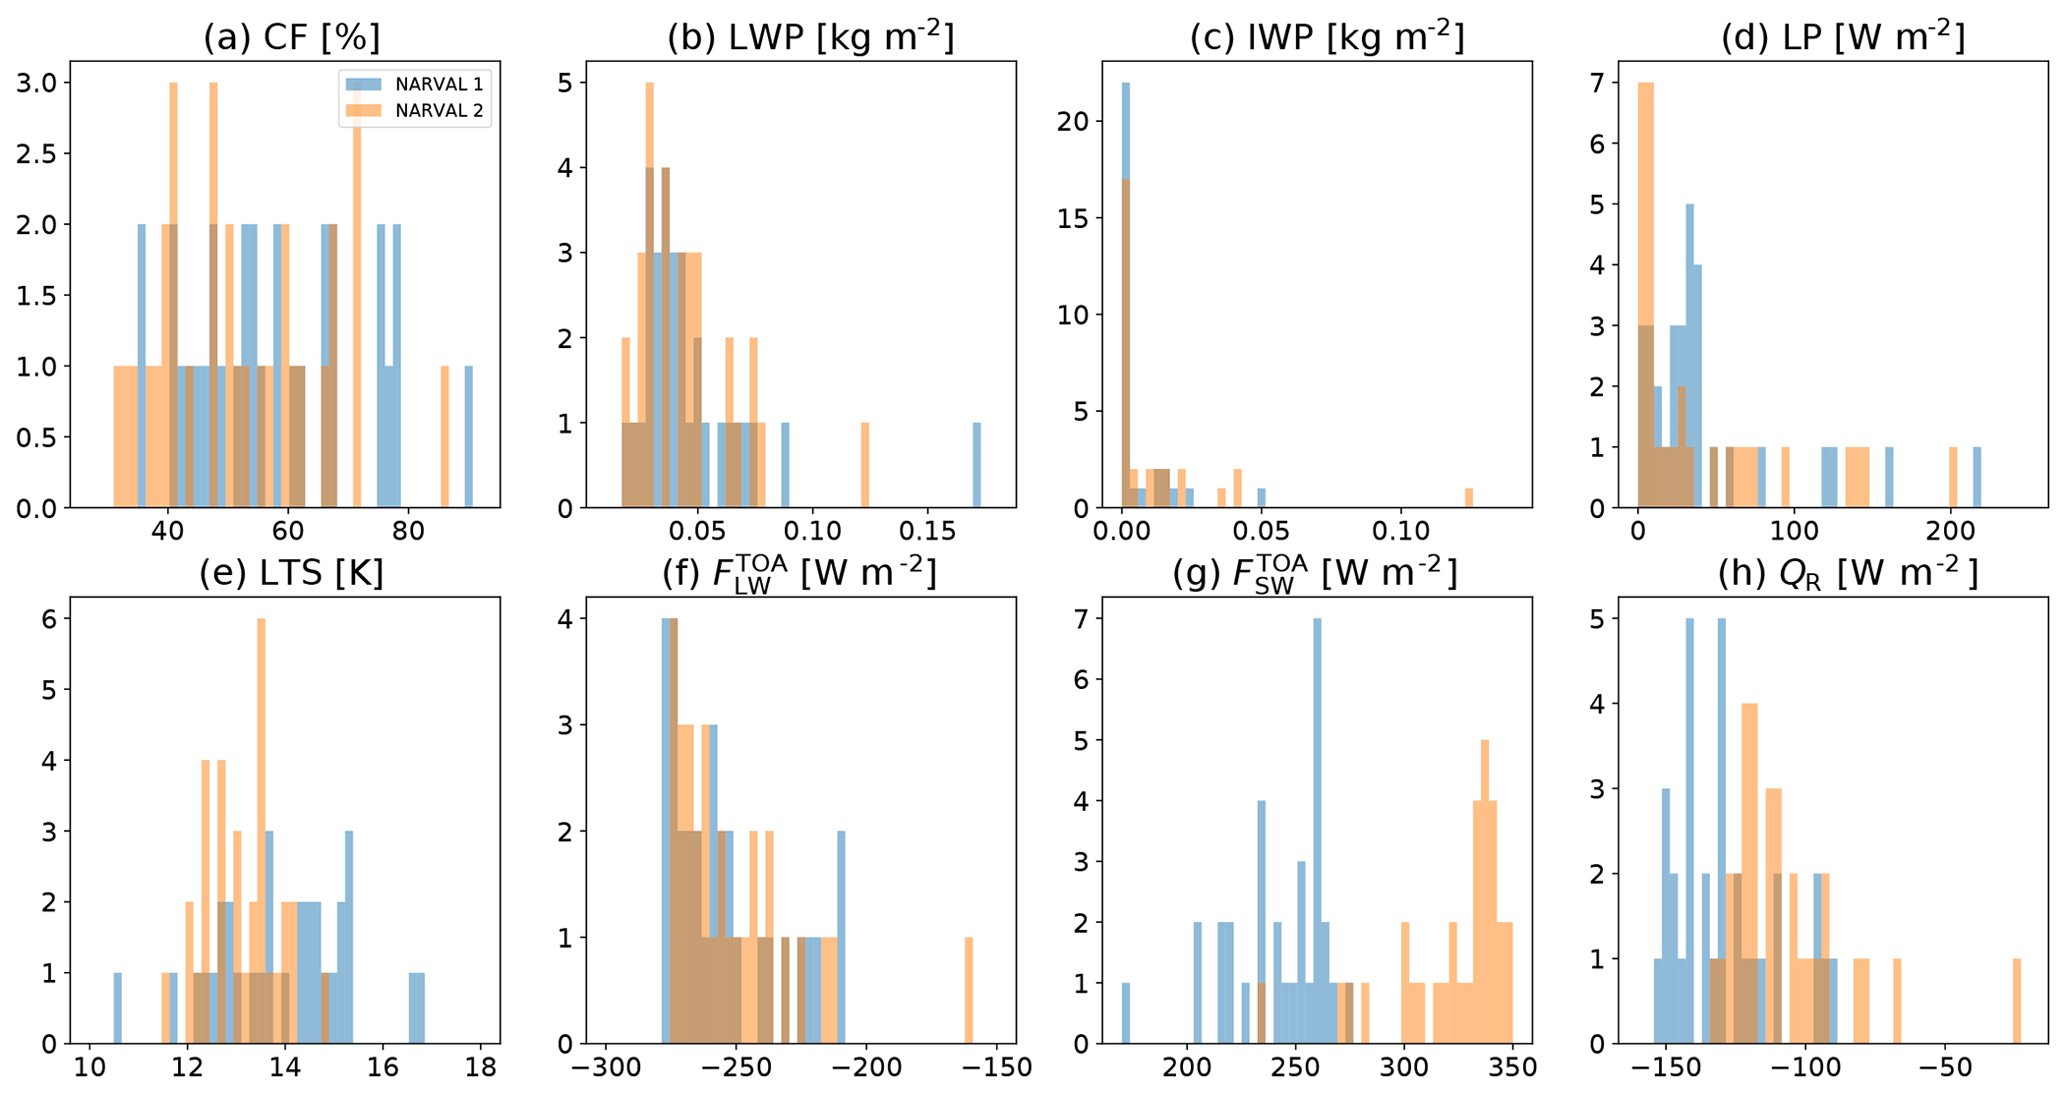
Figure 2Histograms of mean (time and space) cloud and atmospheric properties for the base simulations with CDNC = 20 cm−3 (clean simulations) for each day of the 2 months that were simulated. Blue represents the NARVAL 1 month (December 2013), while orange the NARVAL 2 month (August 2016). (a) Cloud fraction – CF, (b) liquid water path – LWP, (c) ice water path – IWP, (d) precipitation latent heat flux – LP, (e) lower-tropospheric stability – LTS, (f) top-of-atmosphere longwave flux – , (g) top-of-atmosphere shortwave flux – , and (h) atmospheric column radiative term – QR.
Table 1The monthly-mean value of each of the properties presented in Fig. 2 ±1 standard deviation for each month and the p value of the two-sample independent t test. The p values which demonstrate a significant difference between the months (<0.05) are presented in bold.
Figures 3 and 4 present vertical profiles of the total water (liquid and ice) mixing ratio from the different simulations during NARVAL 2 (August 2016) and NARVAL 1 (December 2013), respectively. Generally, during the winter month (NARVAL 1), the clouds are shallower than in the summer month (NARVAL 2), although there is significant variability. This is expected due to the seasonality of the ITCZ location (Stevens et al., 2016). The simulated days are manually separated into three different cloud regimes based on the domain and time mean total water mixing ratio vertical profiles. The cloud regimes considered here are the following: shallow clouds (shallow-cloud-dominated days), two-layer clouds (shallow cloud layer and a cirrus cloud layer), and deep clouds (deep-cloud-dominated days).
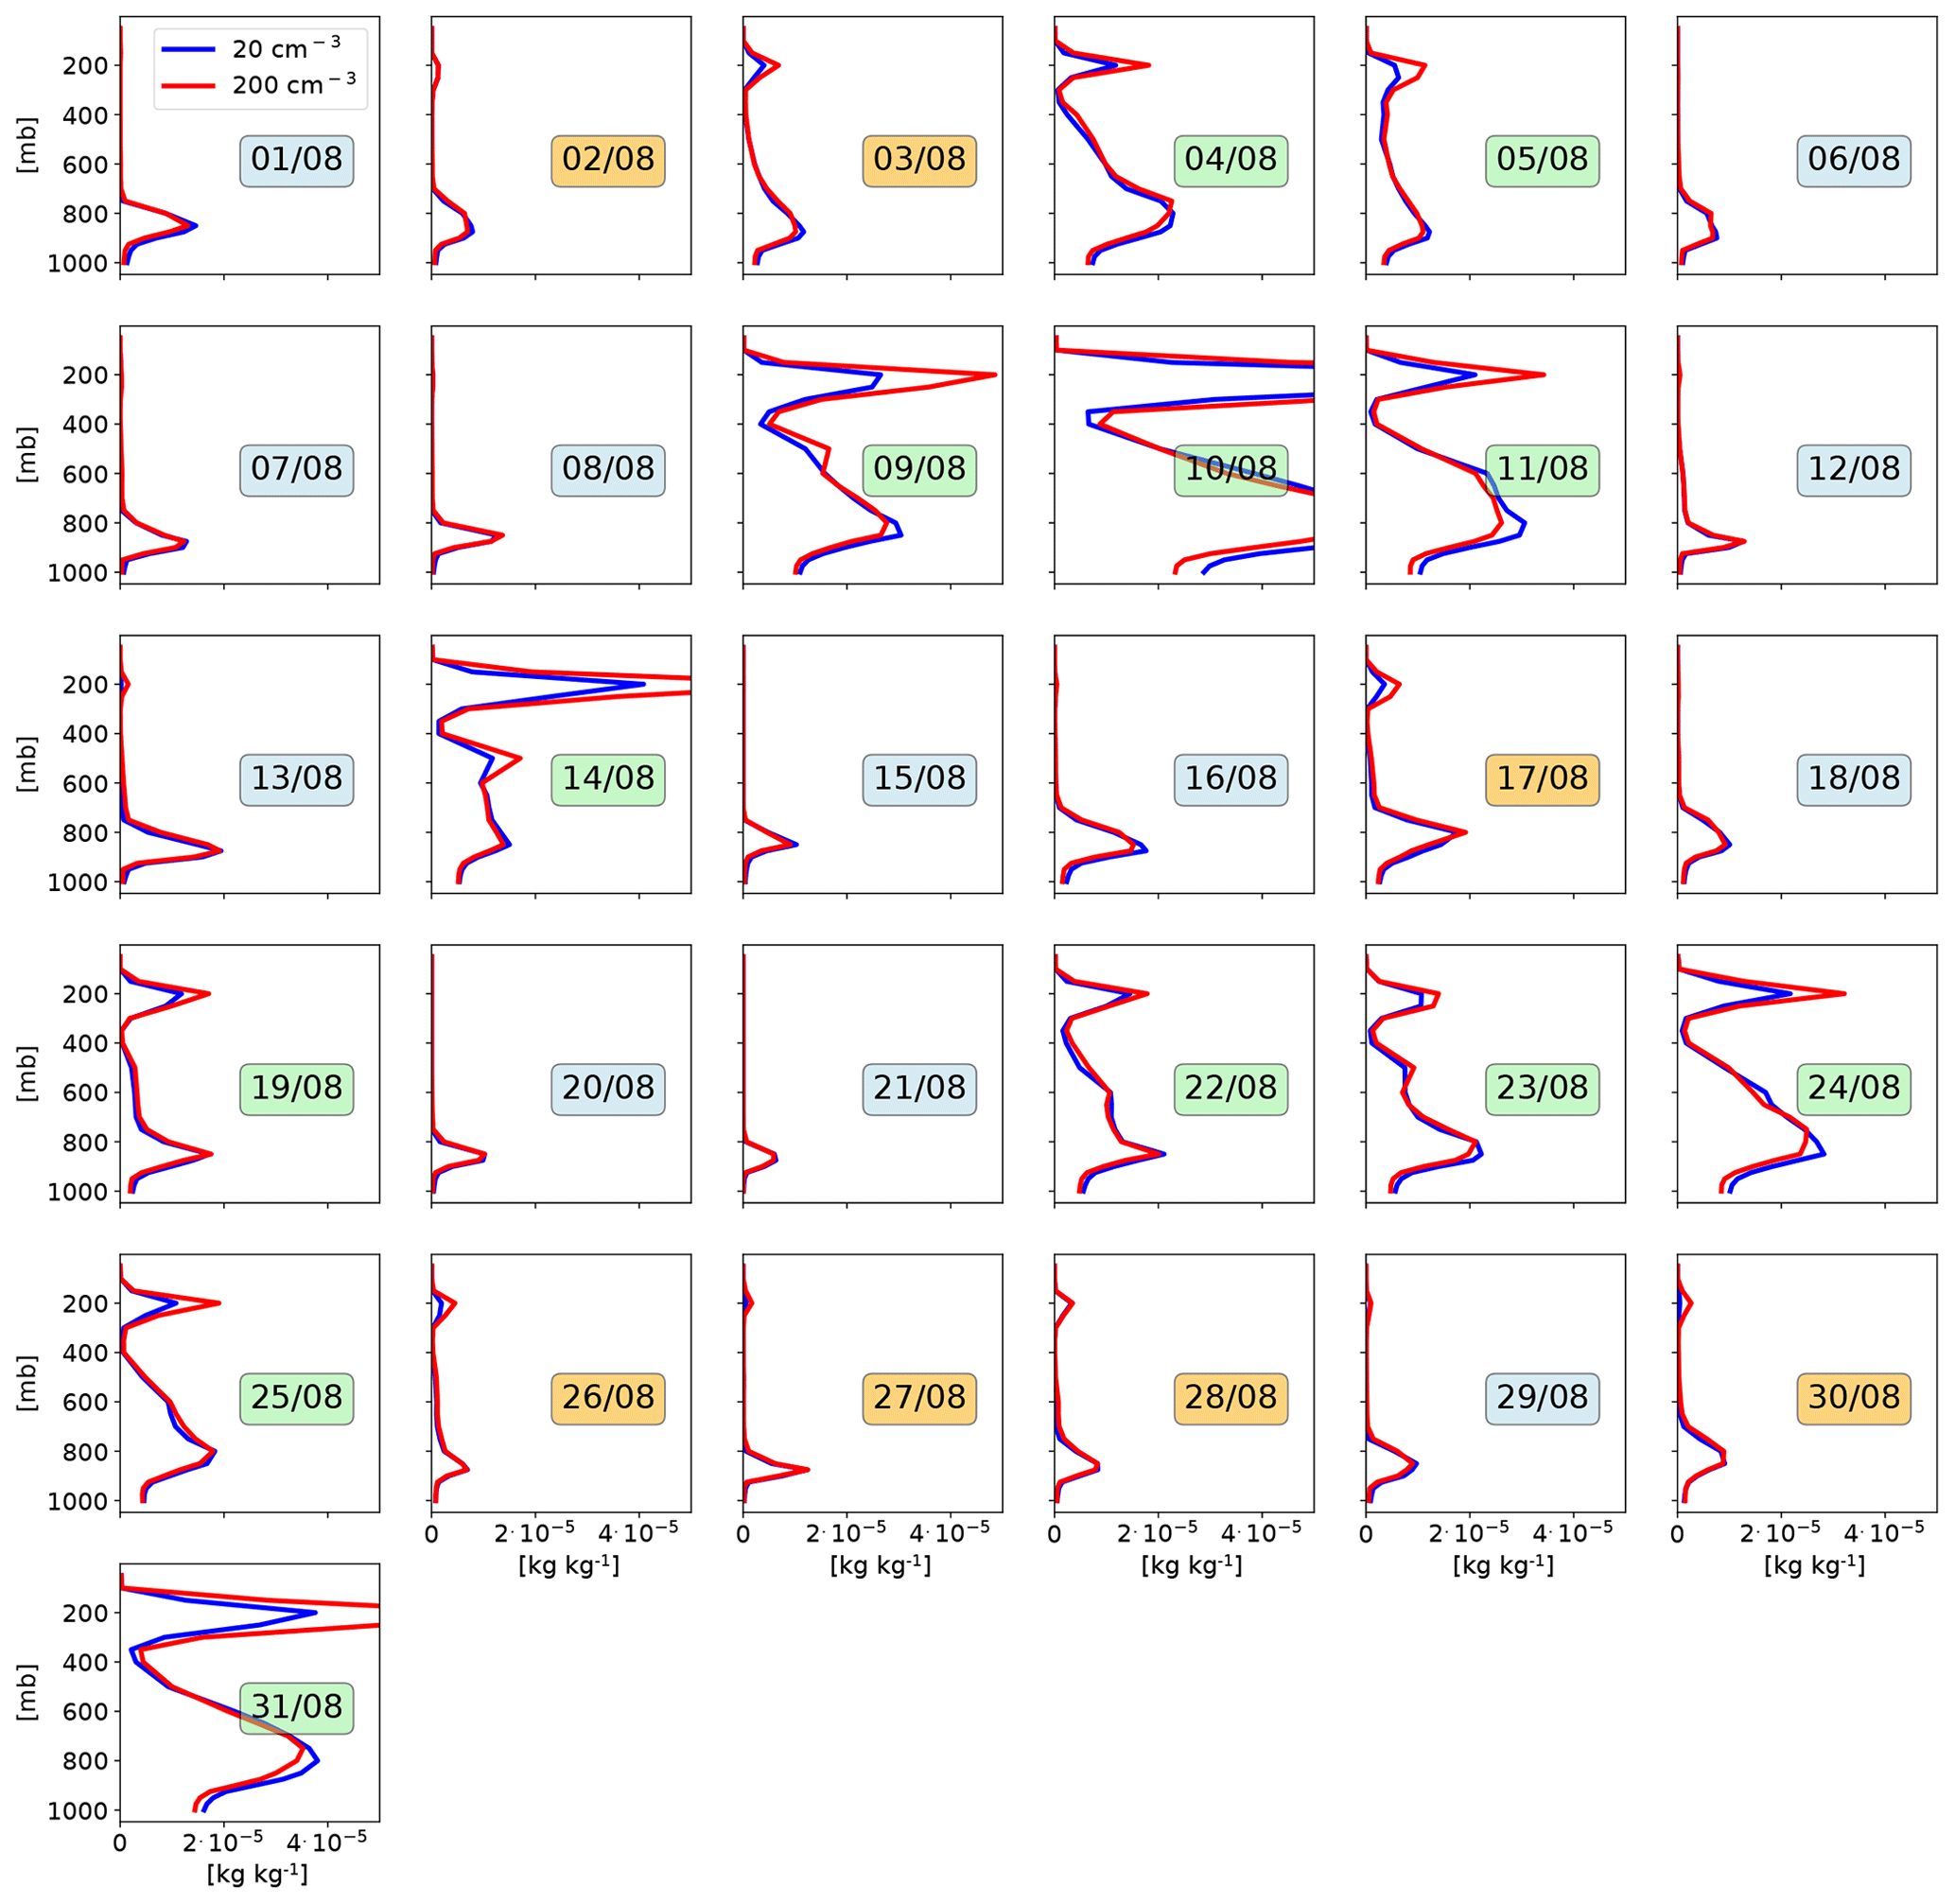
Figure 3Mean (time and space) vertical profiles of the total water (liquid and ice) mixing ratio in each simulation (each last for 24 h) for the NARVAL 2 month (August 2016). Blue: clean conditions (20 cm−3), red: polluted conditions (200 cm−3). The simulated days are separated into three different cloud regimes: shallow clouds (blue date box), two-layer clouds (shallow cloud layer and a cirrus cloud layer – orange date box), and deep clouds (green date box).

Figure 5 presents histograms of aerosol effects (polluted minus clean) for the different simulations. The distribution of changes in cloud fraction (Fig. 5a) demonstrate small mean values for both months (−0.3 % and 0.1 % for the winter month and summer month, respectively), which is slightly more skewed to positive values in the summer. Examining the significance of these trends with a t test demonstrates that only the winter month response is statistically significant (Table 2). The CDNC effect on the LWP (Fig. 5b) and the IWP (Fig. 5c) is shown to be almost entirely positive (or zero) in both months and differs from zero in a statistically significant manner. The mean change in precipitation (Fig. 5d) is small and negative (slightly more negative during the winter month). However, during the summer month it is not statistically significant and can be either positive or negative. We note that the mean precipitation decreases during the winter month (which is statistically significant) is small and equivalent to 0.07 mm d−1 (−1.8 W m−2). Increasing CDNC systematically decreases LTS (Fig. 5e), representing deepening of the boundary layer (Dagan et al., 2016; Lebo and Morrison, 2014; Seifert et al., 2015; Stevens and Feingold, 2009). This trend is statistically significant for both months (Table 2).
The CDNC effect on is positive and small (average of 0.24 W m−2) in the winter month (but still statistically significant) and larger (average of 2.16 W m−2) in the summer month (Fig. 5f – positive flux downwards), primarily due to an increase in ice water content under polluted conditions (see also Figs. 3, 4, and 5c). We previously showed that an increase in CDNC drives an increase in the ice content at the upper troposphere and hence a reduction in the outgoing LW radiation (Dagan et al., 2020); here we show that this trend is statistically significant (Fig. 5c). However, during the winter, when deep convective clouds are less abundant and the atmosphere is more stable, the LW flux is less affected.
The CDNC effect on is always negative (Fig. 5g) and is on average −3.6 and −3.8 W m−2 in the winter month and summer month, respectively (the difference between the 2 months is not statistically significant; however, both differ from zero in a statistically significant manner – Table 2). The negative effect is caused mostly due to the Twomey effect (Twomey, 1977) and the LWP/IWP effect (Albrecht, 1989; Koren et al., 2010; Malavelle et al., 2017) (Fig. 5b and c), as the CF changes are small (Fig. 5a). For exploring the relative role of the Twomey and IWP/LWP effects, we ran all simulations again with the Twomey effect turned off. Without the Twomey effect, the SW effect is reduced by up to a factor of 10 (−0.35 W m−2 compared with −3.6 W m−2 in the winter month and −1.0 W m−2 compared with −3.8 W m−2 in the summer month). This demonstrates that the Twomey effect is the dominant factor underlying the changes. Radiative effects due to changes in ice size distribution are not considered due to uncertainties in the evolution of ice morphology. Accounting for this effect would likely further increase the relative role of the Twomey effect compared to the cloud adjustment effects (CF and LWP/IWP adjustments).
The change in the atmospheric column radiative warming term QR is shown to be small for the winter month (−0.26 W m−2 on average) but much larger and positive for the summer month (1.8 W m−2 on average). The increase in QR during the summer is caused by the effect of deep ice-containing clouds on the outgoing LW flux (Fig. 5f). SW flux changes due to CDNC perturbations (Fig. 5g) have a much smaller effect on QR as the SW absorption of clouds is small (Dagan et al., 2020).
Examining the similarity between the response of the different properties to the CDNC perturbation in the two different months (Table 2) reveals that the responses of the IWP, , QR, and (the net TOA LW and SW effects – Fig. 10 below) are different in a statistically significant manner between the 2 months. As will be shown below, this is related to the response of the ice content.
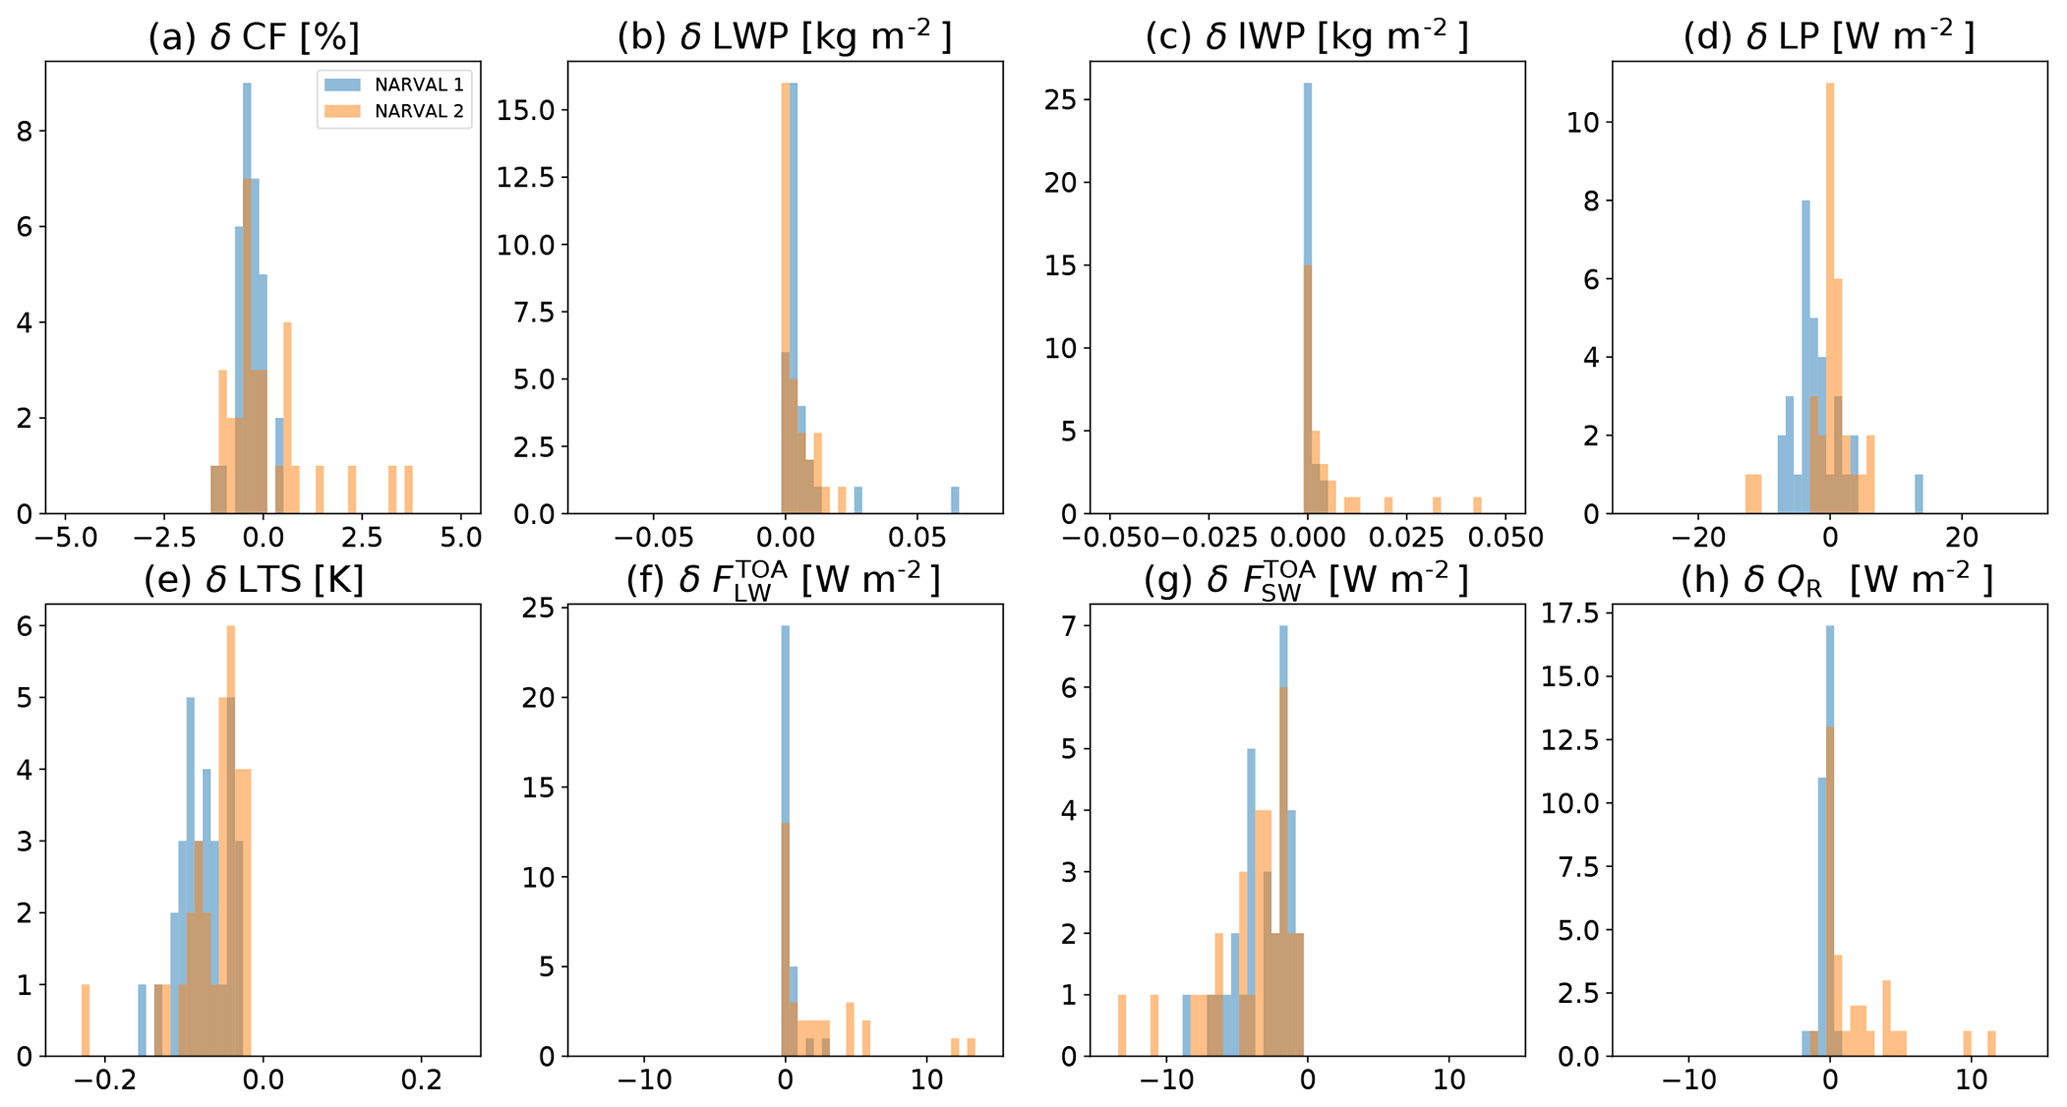
Figure 5Histograms of the domain and time mean response of cloud and atmospheric properties to CDNC perturbation (polluted simulations minus clean simulations) for each day of the 2 months that were simulated. Blue represents the NARVAL 1 month (December 2013), while orange the NARVAL 2 month (August 2016). (a) Cloud fraction – CF, (b) liquid water path – LWP, (c) ice water path – IWP, (d) precipitation latent heat flux – LP, (e) lower-tropospheric stability – LTS, (f) top-of-atmosphere longwave flux – , (g) top-of-atmosphere shortwave flux – , and (h) atmospheric column radiative term – QR.
Table 2Summary of monthly mean response of cloud and atmospheric properties (presented in Fig. 5) to the CDNC perturbation (polluted simulations minus clean simulations) ±1 standard deviation for each month. In addition, the p values of the two-sample independent t test are presented, as well as the p values for comparing the CDNC response in each month to zero. The p values which demonstrate a significant difference (<0.05) are presented in bold.

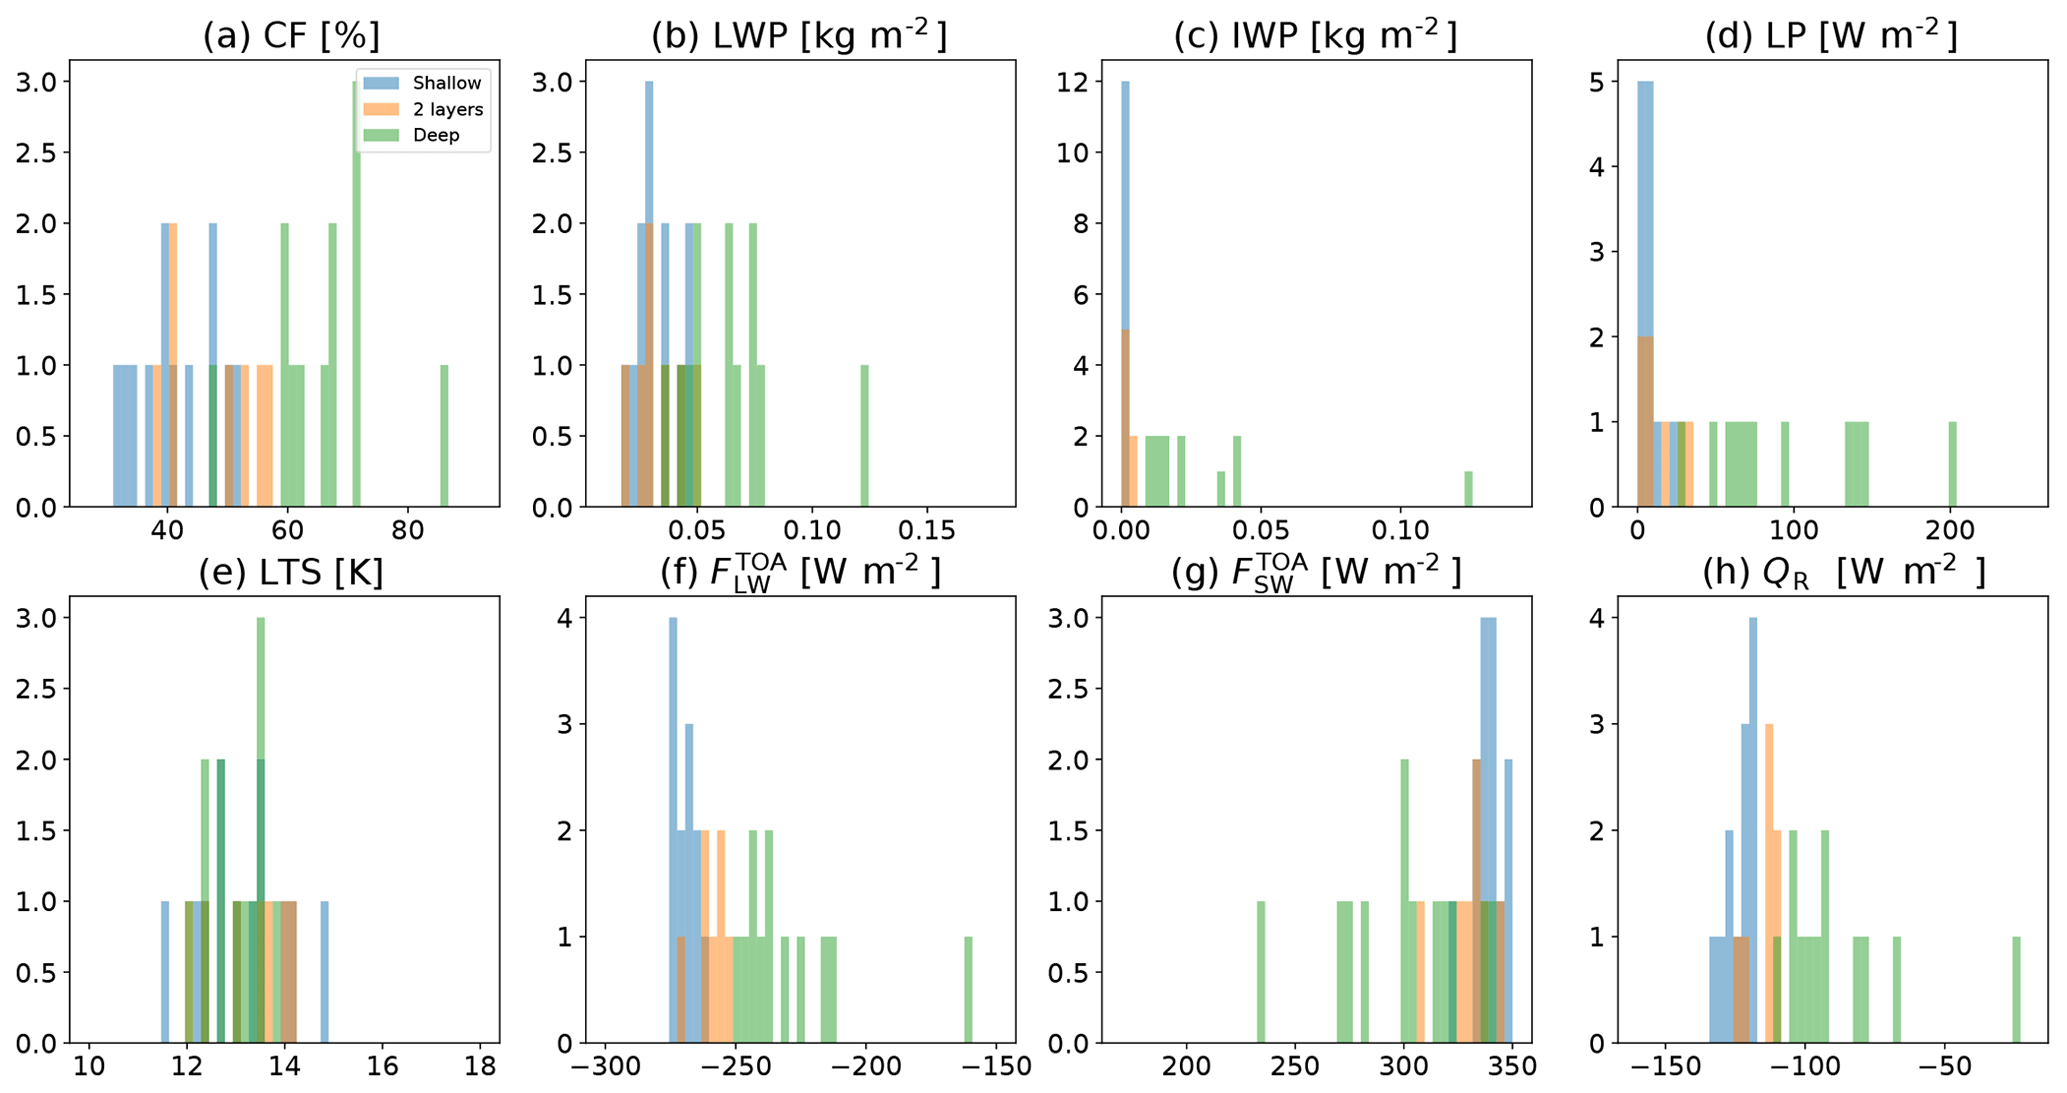
For better understanding the trend demonstrated in Fig. 5 and Table 2, we split the simulated days into different dominant cloud types or regimes (see Figs. 3 and 4). Figures 6 and 7 present histograms of the same atmospheric properties presented in Fig. 2 but separated by different cloud regimes – shallow clouds, two-layer clouds (shallow clouds with cirrus cloud layer above), and deep clouds. These figures demonstrate that the cloud fraction, LWP, IWP, precipitation, , and QR are generally higher on days dominated by deep clouds as compared to days dominated by shallow clouds, while the LTS and are lower in the deep-cloud-dominated days compared to shallow-cloud-dominated days (with the two-layer-cloud days generally between them). The separation into different cloud regimes also demonstrates that more deep-cloud days are occurring during the summer month as compared to the winter month (12 compared to 8) and that the deep clouds during summer are deeper and contain more water. The larger occurrence of deep convection during the summer month is consistent with the statistically significant reduction in LTS (Fig. 2 and Table 1) and is expected based on the local seasonality (Stevens et al., 2016).
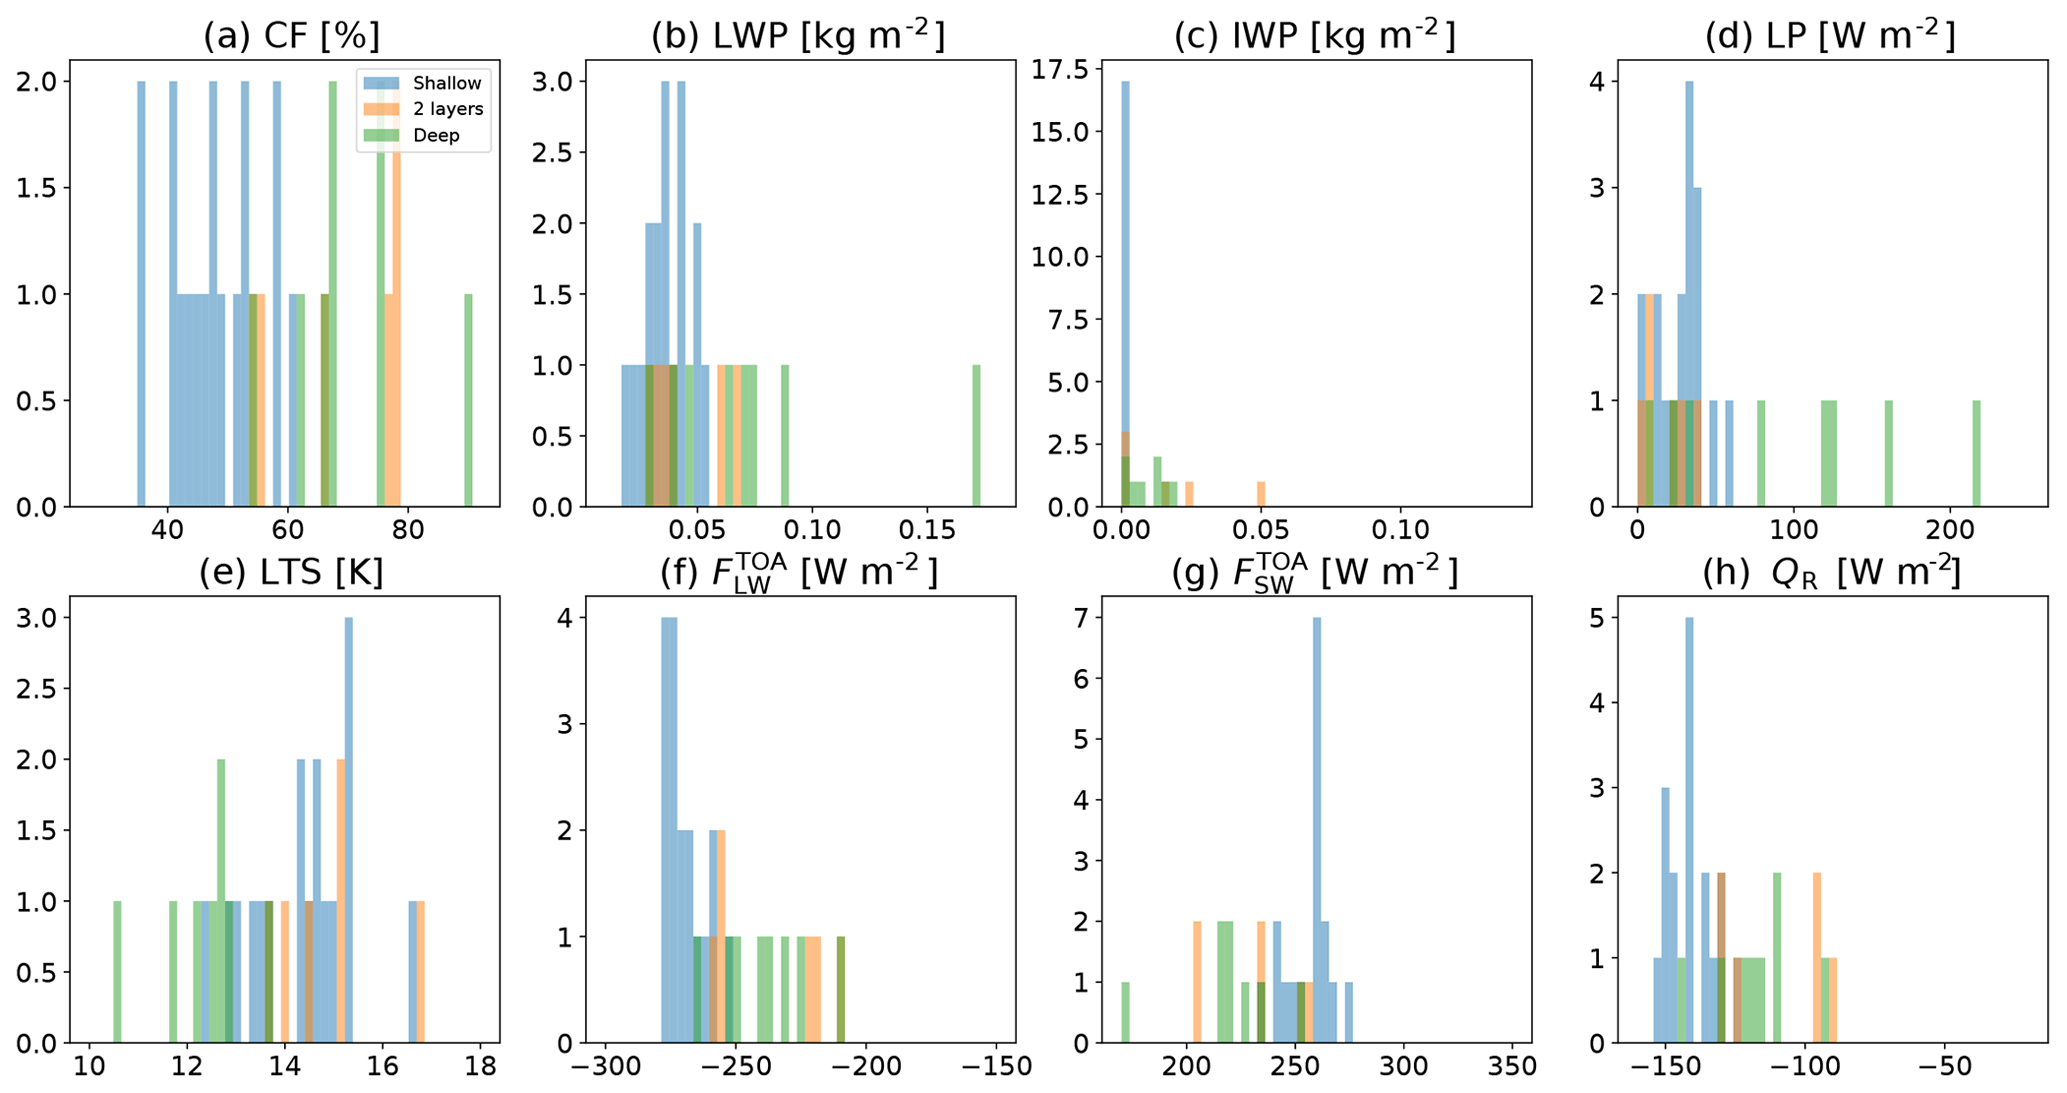
Figure 6Histograms of mean (time and space) cloud and atmospheric properties for the base simulations with CDNC = 20 cm−3 (clean simulations) for each day of the NARVAL 1 month (December 2013) separated into different cloud regimes: shallow clouds (blue), two-layer clouds (shallow clouds with cirrus clouds layer above – orange), and deep clouds (green). (a) Cloud fraction – CF, (b) liquid water path – LWP, (c) ice water path – IWP, (d) precipitation latent heat flux – LP, (e) lower-tropospheric stability – LTS, (f) top-of-atmosphere longwave flux – , (g) top-of-atmosphere shortwave flux – , and (h) atmospheric column radiative term – QR.
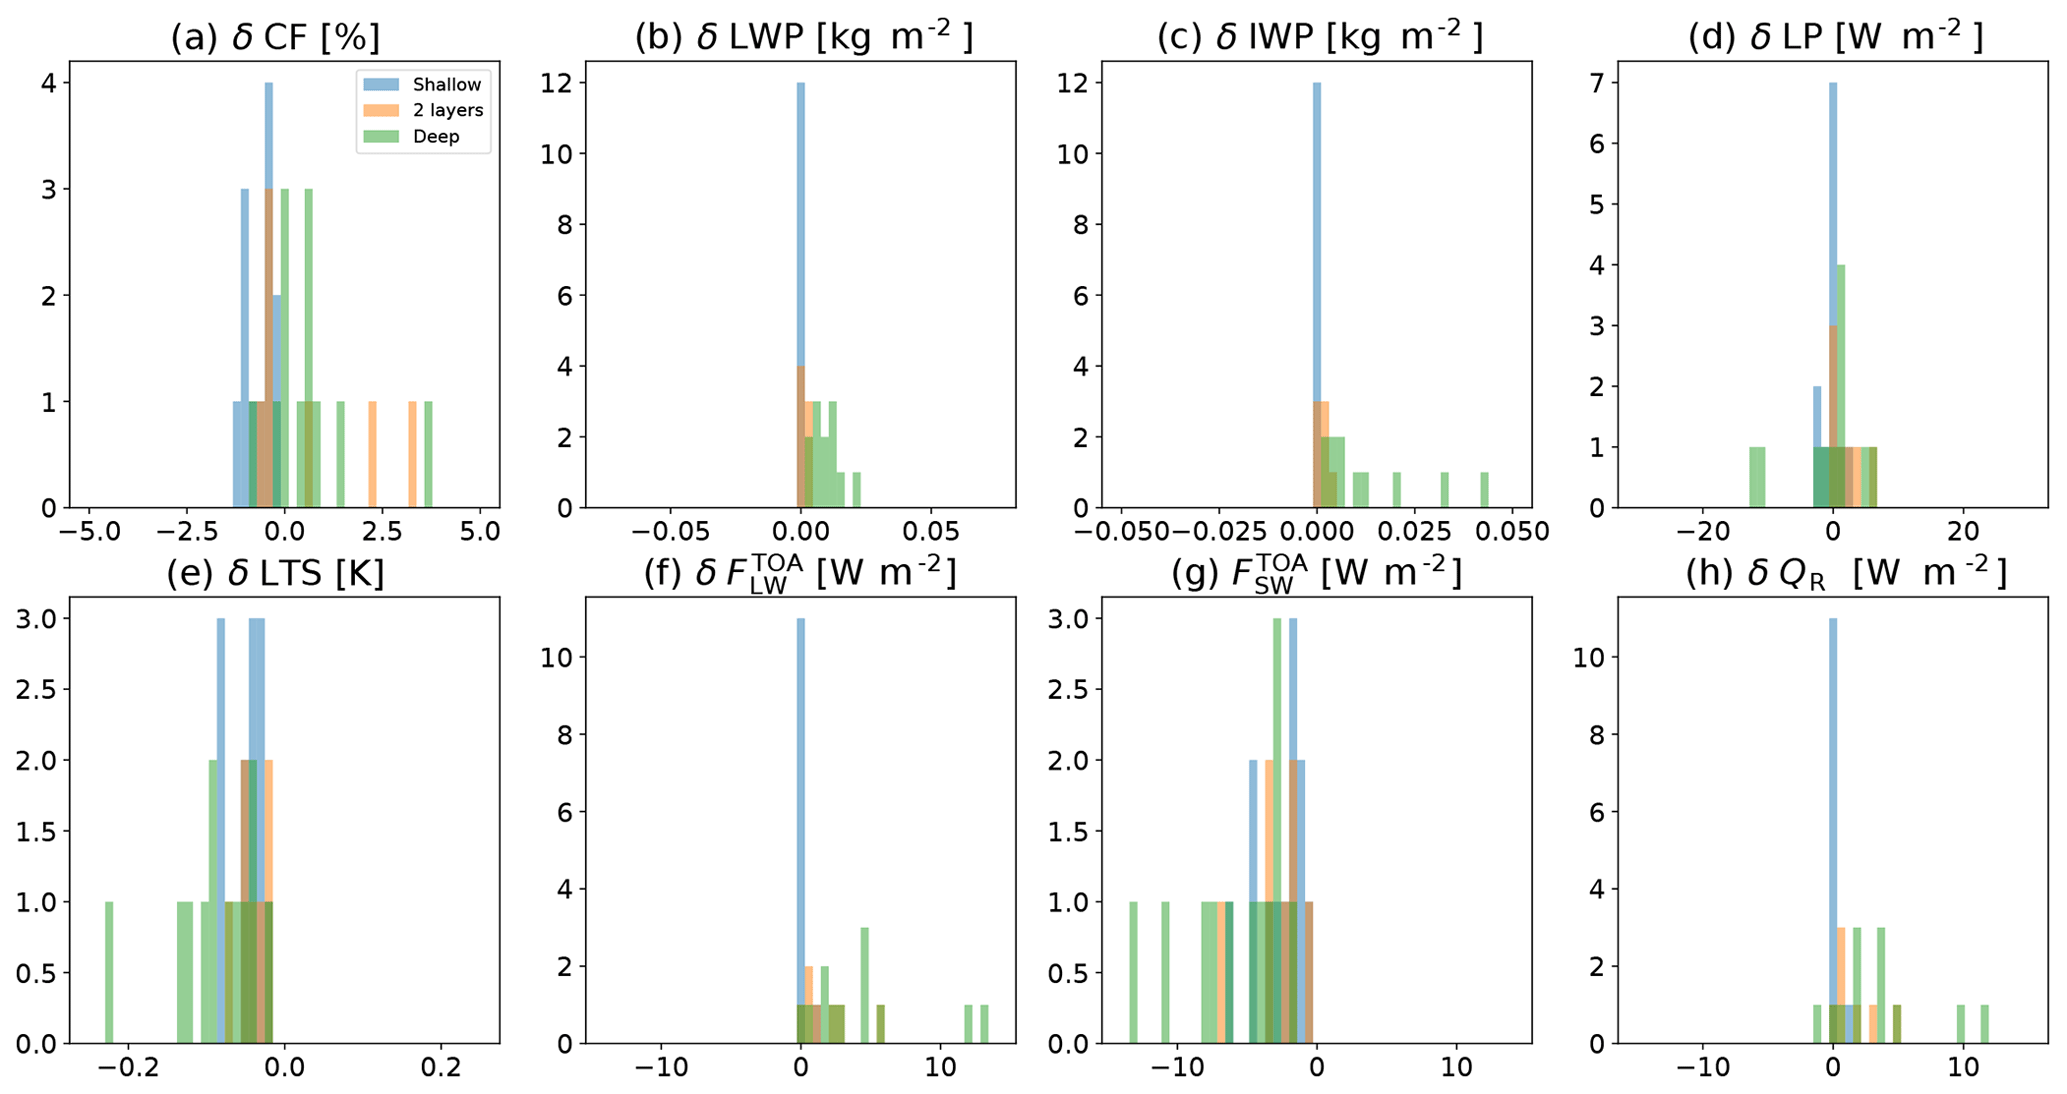
Examining the response of the different cloud regimes to the CDNC perturbation (Figs. 8 and 9) demonstrates that the response of the cloud fraction, LWP, IWP, and in the deep-cloud days is generally more positive, while the response of and LTS is generally more negative. These trends are more pronounced during the summer month as compared to the winter month. The response of QR is more positive in the deep-cloud-dominated days in the summer month but does not show any different trend in the winter month. The precipitation response does not show any distinctly different trend for the different cloud types in both months.
The findings presented in Figs. 8 and 9 demonstrate that the IWP response in the deep-cloud-dominated days is generally stronger in the summer month as compared to the winter month. The increase in the IWP with the increase in CDNC drives a reduction in and hence increase in QR (Dagan et al., 2020). We note that the largest difference between the 2 months emerges due to the stronger response of the ice content in the summer month as compared to the winter month. This fact can explain the statistically significant different response of the IWP, , and QR shown in Table 2.
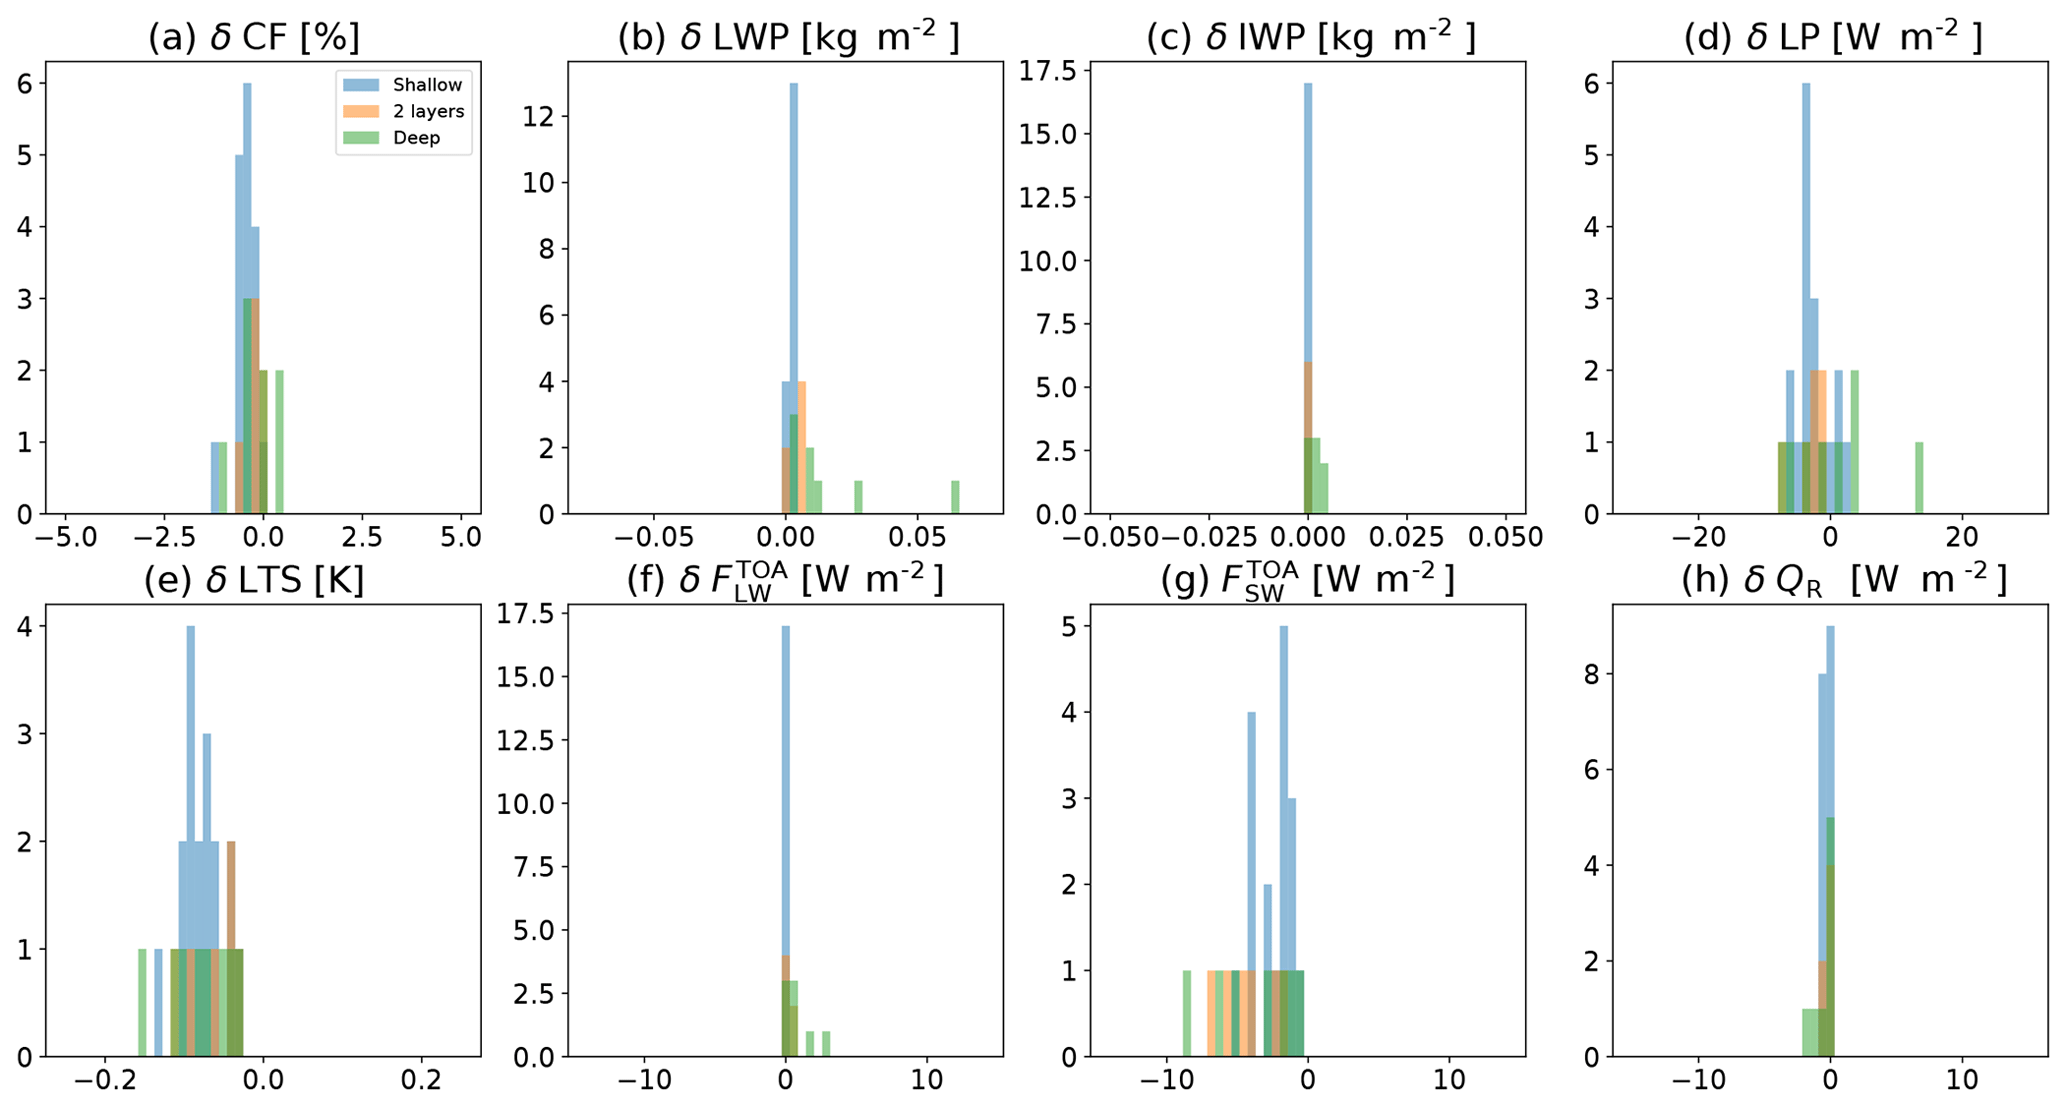
Figure 8Histograms of the domain and time mean response of cloud and atmospheric properties to the CDNC perturbation (polluted simulations minus clean simulations) for each day of the NARVAL 1 month (December 2013) separated into the different cloud regimes: shallow clouds (blue), two-layer clouds (shallow clouds with cirrus clouds layer above – orange), and deep clouds (green). (a) Cloud fraction – CF, (b) liquid water path – LWP, (c) ice water path – IWP, (d) precipitation latent heat flux – LP, (e) lower-tropospheric stability – LTS, (f) top-of-atmosphere longwave flux – , (g) top-of-atmosphere shortwave flux – , and (h) atmospheric column radiative term – QR.
The combined CDNC effect on the total net TOA radiation () is shown in Fig. 10. It demonstrates that during the winter month the effect on is always negative and has a mean value of −3.4 W m−2. However, during the summer month, the mean effect is less negative (−1.7 W m−2), and for some of the days it could even be positive due to the effect of the CDNC on the ice water content (Fig. 5 and Table 2). The difference between the 2 months in is statistically significant (Table 2). We note that during the summer month all days for which are deep-cloud-dominated days, supporting the hypothesis that the difference between the different months are driven by the different response of the deep clouds, which are deeper and contain more water in the summer month.
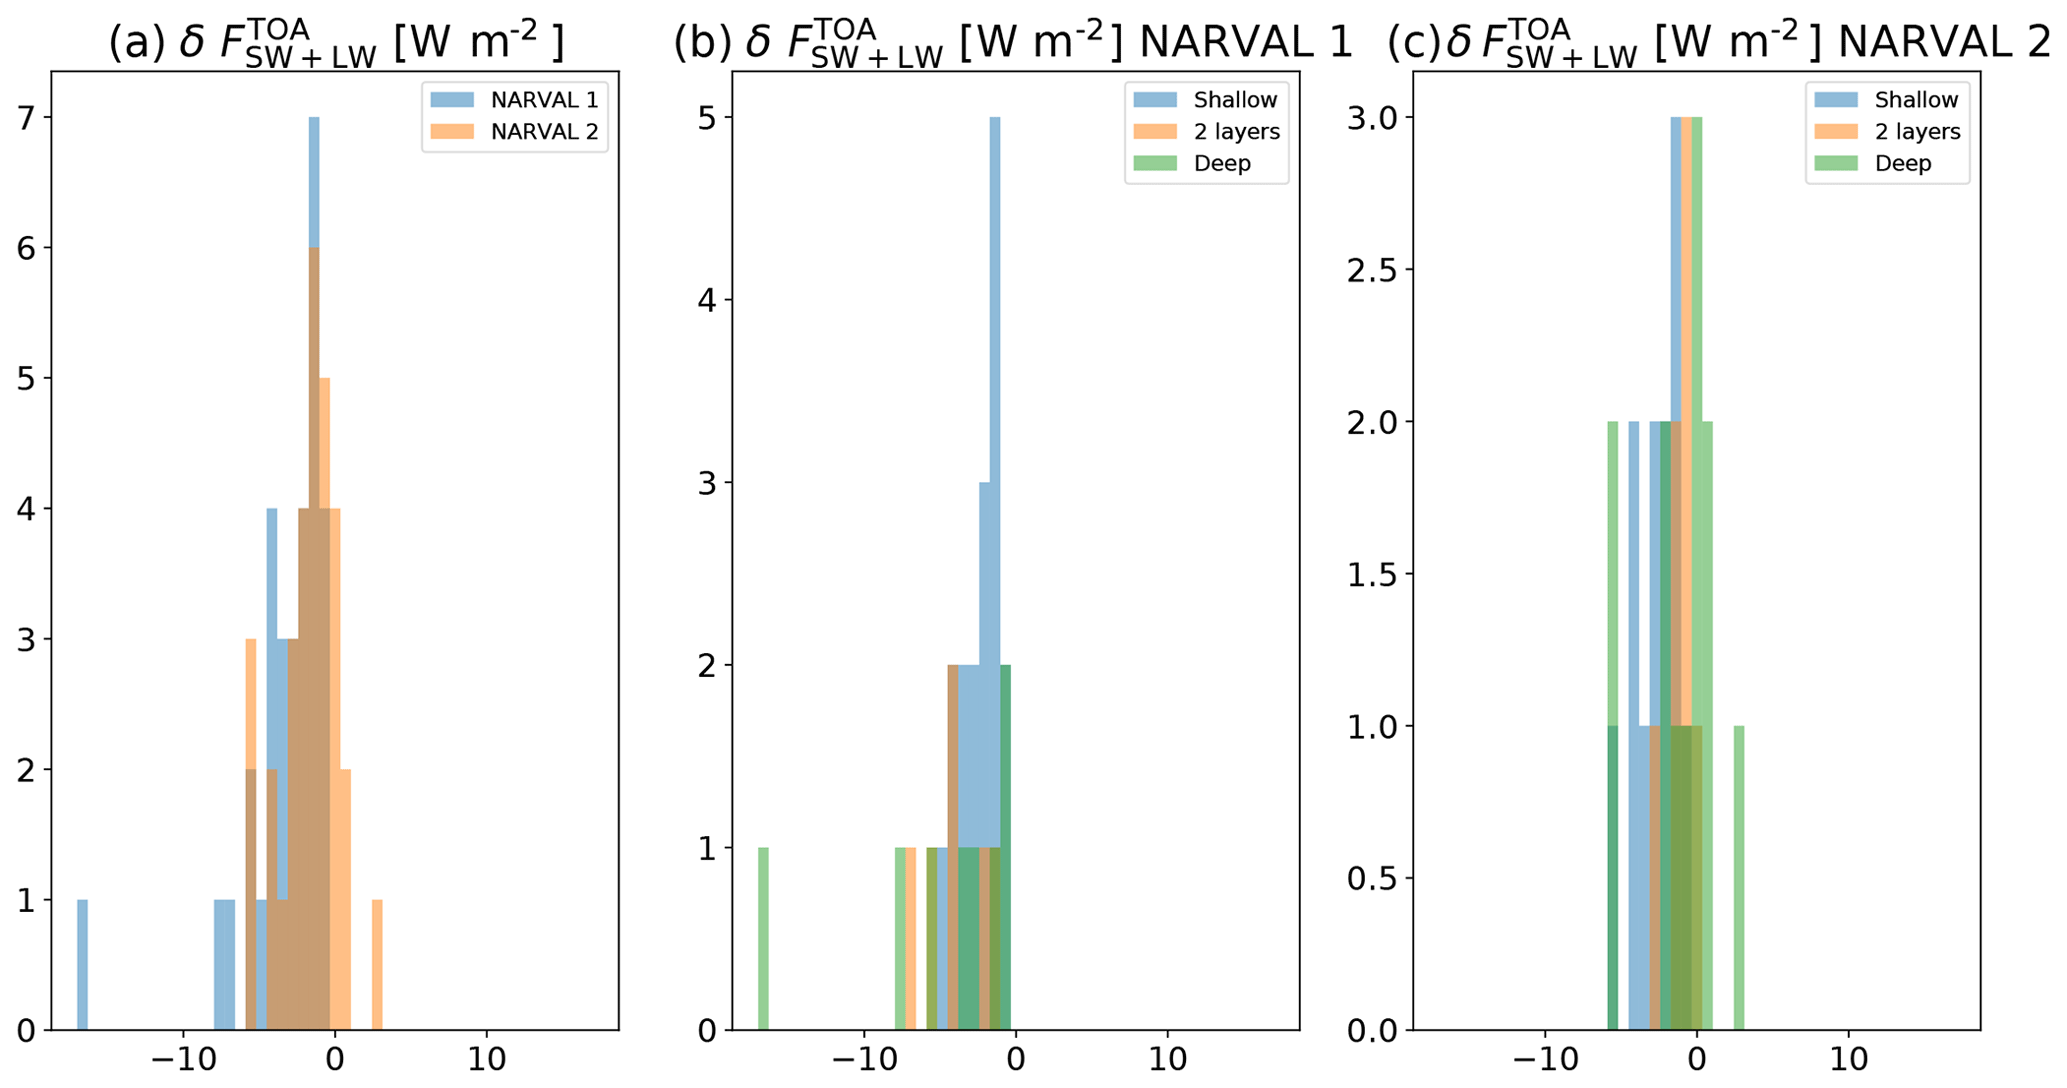
Figure 10Histograms of the response of the net (shortwave + longwave) top-of-atmosphere radiative flux ) to the CDNC perturbation (polluted simulations minus clean simulations) for each of the simulated days. In (a) blue represents the NARVAL 1 month (December 2013), while orange the NARVAL 2 month (August 2016). In (b) and (c) the NARVAL 1 and the NARVAL 2 months are separated into the different cloud regimes: shallow clouds (blue), two-layer clouds (shallow clouds with cirrus clouds layer above – orange), and deep clouds (green).
Ensemble daily simulations over a region near Barbados for two separate month-long periods were conducted to investigate aerosol effects on cloud properties and the atmospheric energy budget. For each day, two simulations were conducted with low and high CDNC representing clean and polluted conditions, respectively. These simulations are used to distinguish between properties that are robustly affected by changes in CDNC and those that are not. For example, we have shown that, for the entire set of simulations (62 different days), an increase in CDNC always drives a reduction in the lower-tropospheric stability (Fig. 5). In addition, is always reduced by an increase in CDNC, representing more SW reflection. However, changes in cloud fraction or precipitation are not as robust, and, despite the fact that for a given day they could be large, they are on average not distinguishable from zero (at least for the summer month). However, we note that the aerosol response we present here may be underestimated due to the effect of the fixed boundary conditions. In addition, using a microphysical scheme that assumes saturation adjustment reduces the sensitivity of the clouds to aerosol perturbation (Koren et al., 2014; Dagan et al., 2015a; Heiblum et al., 2016; Fan et al., 2018). However, this might be a small effect in our case as the phase change relaxation time of condensation and evaporation is usually of the order of a few seconds (Pinsky et al., 2013). Hence, even if we would use a microphysical scheme that explicitly resolves condensation and evaporation, the humidity is expected to get back to saturation on shorter timescales then the temporal resolution of the model (12 s), and hence practically we will be in “saturation adjustment” conditions anyway. We also note that using 1200 m horizontal resolution does not properly resolve all shallow cumulus clouds (Naumann and Kiemle, 2019).
The use of two month-long periods, covering different seasons dominated by different meteorological conditions and cloud types, demonstrates again (Altaratz et al., 2014; Lee et al., 2009; Mülmenstädt and Feingold, 2018; van den Heever et al., 2011; Rosenfeld et al., 2013; Glassmeier and Lohmann, 2016; Gryspeerdt and Stier, 2012; Dagan et al., 2015a) that the aerosol effect on clouds is strongly dependent on cloud regimes and meteorological conditions. For our simulations, we demonstrate that the top-of-atmosphere net radiative effect in this region is twice as large during the winter month as compared to the summer month (Fig. 10).
To better understand these differences, we have split the simulated days into three different dominant cloud regimes. The results demonstrate that most of the differences in the response to CDNC increases between the 2 months are driven by the response of the ice content in deep convective clouds. During the summer month, the atmosphere is less stable and the deep convective clouds in the baseline simulations are more abundant, reach higher levels in the atmosphere, and contain more water. These more developed clouds respond stronger to the CDNC perturbations and develop more ice content than the shallower clouds during the winter month. The increased ice is driven by an increase in mass flux to the upper levels. The added ice content reduces the outgoing LW flux at the TOA and hence compensates some of the SW effect, which itself is similar between the summer and winter months.
Our results highlight the need to use large ensembles of initial conditions for cloud–aerosol interaction studies, even in large domain simulations, and suggest that caution is needed when trying to draw conclusions from a single case study and short-term observations.
The data presented in the paper can be found at: https://doi.org/10.5281/zenodo.3785602 (Dagan and Stier, 2020).
The supplement related to this article is available online at: https://doi.org/10.5194/acp-20-6291-2020-supplement.
GD carried out the simulations and analyses presented. PS assisted with the design and interpretation of the analyses. GD prepared the article with contributions from PS.
The authors declare that they have no conflict of interest.
The simulations were performed using the ARCHER UK National Supercomputing Service. We acknowledge MPI, DWD, and DKRZ for the NARVAL simulations.
This research was supported by the European Research Council (ERC) project constRaining the EffeCts of Aerosols on Precipitation (RECAP) under the European Union's Horizon 2020 research and innovation programme with grant agreement no. 724602.
This paper was edited by Pedro Jimenez-Guerrero and reviewed by Michael Diamond and two anonymous referees.
Albrecht, B. A.: Aerosols, cloud microphysics, and fractional cloudiness, Science, 245, 1227, https://doi.org/10.1126/science.245.4923.1227, 1989.
Altaratz, O., Koren, I., Remer, L., and Hirsch, E.: Review: Cloud invigoration by aerosols – Coupling between microphysics and dynamics, Atmos. Res., 140, 38–60, 2014.
Bellouin, N., Quaas, J., Gryspeerdt, E., Kinne, S., Stier, P., Watson-Parris, D., Boucher, O., Carslaw, K., Christensen, M., and Daniau, A.-L.: Bounding aerosol radiative forcing of climate change, Rev. Geophys., 58, e2019RG000660, https://doi.org/10.1029/2019RG000660, 2019.
Boucher, O., Randall, D., Artaxo, P., Bretherton, C., Feingold, G., Forster, P., Kerminen, V., Kondo, Y., Liao, H., and Lohmann, U.: Clouds and aerosols, Climate Change, in: Climate change 2013: the physical science basis. Contribution of Working Group I to the Fifth Assessment Report of the Intergovernmental Panel on Climate Change 2013, Cambridge University Press, 571–657, 2013.
Chen, Q., Koren, I., Altaratz, O., Heiblum, R. H., Dagan, G., and Pinto, L.: How do changes in warm-phase microphysics affect deep convective clouds?, Atmos. Chem. Phys., 17, 9585–9598, https://doi.org/10.5194/acp-17-9585-2017, 2017.
Christensen, M. W., Chen, Y. C., and Stephens, G. L.: Aerosol indirect effect dictated by liquid clouds, J. Geophys. Res.-Atmos., 121, 14636–14650, https://doi.org/10.1002/2016JD025245, 2016.
Clough, S., Shephard, M., Mlawer, E., Delamere, J., Iacono, M., Cady-Pereira, K., Boukabara, S., and Brown, P.: Atmospheric radiative transfer modeling: a summary of the AER codes, J. Quant. Spectros. Ra., 91, 233–244, 2005.
Dagan, G. and Stier, P.: Data of the paper: Ensemble daily simulations for elucidating cloud–aerosol interactions under a large spread of realistic environmental conditions, Zenodo, https://doi.org/10.5281/zenodo.3785603, 2020.
Dagan, G., Koren, I., and Altaratz, O.: Competition between core and periphery-based processes in warm convective clouds – from invigoration to suppression, Atmos. Chem. Phys., 15, 2749–2760, https://doi.org/10.5194/acp-15-2749-2015, 2015a.
Dagan, G., Koren, I., and Altaratz, O.: Aerosol effects on the timing of warm rain processes, Geophys. Res. Lett., 42, 4590–4598, https://doi.org/10.1002/2015GL063839, 2015b.
Dagan, G., Koren, I., Altaratz, O., and Heiblum, R. H.: Aerosol effect on the evolution of the thermodynamic properties of warm convective cloud fields, Sci. Rep., 6, 38769, https://doi.org/10.1038/srep38769, 2016.
Dagan, G., Koren, I., Altaratz, O., and Heiblum, R. H.: Time-dependent, non-monotonic response of warm convective cloud fields to changes in aerosol loading, Atmos. Chem. Phys., 17, 7435–7444, https://doi.org/10.5194/acp-17-7435-2017, 2017.
Dagan, G., Koren, I., and Altaratz, O.: Quantifying the effect of aerosol on vertical velocity and effective terminal velocity in warm convective clouds, Atmos. Chem. Phys., 18, 6761–6769, https://doi.org/10.5194/acp-18-6761-2018, 2018a.
Dagan, G., Koren, I., Kostinski, A., and Altaratz, O.: Organization and oscillations in simulated shallow convective clouds, J. Adv. Model. Earth Syst., 10, 2287–2299, https://doi.org/10.1029/2018MS001416, 2018b.
Dagan, G., Stier, P., Christensen, M., Cioni, G., Klocke, D., and Seifert, A.: Atmospheric energy budget response to idealized aerosol perturbation in tropical cloud systems, Atmos. Chem. Phys., 20, 4523–4544, https://doi.org/10.5194/acp-20-4523-2020, 2020.
Fan, J., Zhang, R., Li, G., and Tao, W.-K.: Effects of aerosols and relative humidity on cumulus clouds, J. Geophys. Res.-Atmos., 112, D14204, https://doi.org/10.1029/2006jd008136, 2007.
Fan, J., Yuan, T., Comstock, J. M., Ghan, S., Khain, A., Leung, L. R., Li, Z., Martins, V. J., and Ovchinnikov, M.: Dominant role by vertical wind shear in regulating aerosol effects on deep convective clouds, J. Geophys. Res.-Atmos., 114, D22206, https://doi.org/10.1029/2009jd012352, 2009.
Fan, J., Rosenfeld, D., Ding, Y., Leung, L. R., and Li, Z.: Potential aerosol indirect effects on atmospheric circulation and radiative forcing through deep convection, Geophys. Res. Lett., 39, L09806, https://doi.org/10.1029/2012GL051851, 2012.
Fan, J., Rosenfeld, D., Zhang, Y., Giangrande, S. E., Li, Z., Machado, L. A., Martin, S. T., Yang, Y., Wang, J., Artaxo, P., and Barbosa, H. M.: Substantial convection and precipitation enhancements by ultrafine aerosol particles, Science, 359, 411–418, 2018.
Glassmeier, F. and Lohmann, U.: Constraining precipitation susceptibility of warm-, ice-, and mixed-phase clouds with microphysical equations, J. Atmos. Sci., 73, 5003–5023, 2016.
Grabowski, W. W.: Untangling microphysical impacts on deep convection applying a novel modeling methodology, J. Atmos. Sci., 72, 2446–2464, 2015.
Gryspeerdt, E. and Stier, P.: Regime-based analysis of aerosol-cloud interactions, Geophys. Res. Lett., 39, L21802, https://doi.org/10.1029/2012GL053221, 2012.
Gryspeerdt, E., Goren, T., Sourdeval, O., Quaas, J., Mülmenstädt, J., Dipu, S., Unglaub, C., Gettelman, A., and Christensen, M.: Constraining the aerosol influence on cloud liquid water path, Atmos. Chem. Phys., 19, 5331–5347, https://doi.org/10.5194/acp-19-5331-2019, 2019.
Gustafson Jr., W. and Vogelmann, A.: LES ARM Symbiotic Simulation and Observation (LASSO) Implementation Strategy, DOE Office of Science Atmospheric Radiation Measurement (ARM) Program, Pacific Northwest National Lab. (PNNL), Richland, WA, USA, available at: https://www.osti.gov/biblio/1232664 (last access: 26 May 2020), 2015.
Gustafson, W. I., Vogelmann, A. M., Cheng, X., Endo, S., Krishna, B., Li, Z., Toto, T., and Xiao, H.: Description of the LASSO Alpha 2 Release, DOE Office of Science Atmospheric Radiation Measurement (ARM) Program, USA, https://doi.org/10.2172/1376727, 2017.
Heiblum, R. H., Altaratz, O., Koren, I., Feingold, G., Kostinski, A. B., Khain, A. P., Ovchinnikov, M., Fredj, E., Dagan, G., Pinto, L., and Yaish, R.: Characterization of cumulus cloud fields using trajectories in the center of gravity versus water mass phase space: 2. Aerosol effects on warm convective clouds, J. Geophys. Res.-Atmos., 121, 6356–6373, 2016.
Heikenfeld, M., White, B., Labbouz, L., and Stier, P.: Aerosol effects on deep convection: the propagation of aerosol perturbations through convective cloud microphysics, Atmos. Chem. Phys., 19, 2601–2627, https://doi.org/10.5194/acp-19-2601-2019, 2019.
Iacono, M. J., Delamere, J. S., Mlawer, E. J., Shephard, M. W., Clough, S. A., and Collins, W. D.: Radiative forcing by long-lived greenhouse gases: Calculations with the AER radiative transfer models, J. Geophys. Res.-Atmos., 113, D13103, https://doi.org/10.1029/2008JD009944, 2008.
Kalina, E. A., Friedrich, K., Morrison, H., and Bryan, G. H.: Aerosol effects on idealized supercell thunderstorms in different environments, J. Atmos. Sci., 71, 4558–4580, 2014.
Khain, A., Rosenfeld, D., and Pokrovsky, A.: Aerosol impact on the dynamics and microphysics of deep convective clouds, Q. J. Roy. Meteorol. Soc., 131, 2639–2663, https://doi.org/10.1256/qj.04.62, 2005.
Khain, A. P., BenMoshe, N., and Pokrovsky, A.: Factors determining the impact of aerosols on surface precipitation from clouds: An attempt at classification, J. Atmos. Sci., 65, 1721–1748, https://doi.org/10.1175/2007jas2515.1, 2008.
Klepp, C., Ament, F., Bakan, S., Hirsch, L., and Stevens, B.: The NARVAL Campaign Report, Reports on Earth System Science/Max Planck Institute for Meteorology Humbureg 2014, available at: https://pure.mpg.de/rest/items/item_2129055/component/file_2129139/content (last access: 29 May 2020), 2014.
Klocke, D., Brueck, M., Hohenegger, C., and Stevens, B.: Rediscovery of the doldrums in storm-resolving simulations over the tropical Atlantic, Nat. Geosci., 10, 891–896, https://doi.org/10.1038/s41561-017-0005-4, 2017.
Koren, I., Kaufman, Y. J., Rosenfeld, D., Remer, L. A., and Rudich, Y.: Aerosol invigoration and restructuring of Atlantic convective clouds, Geophys. Res. Lett., 32, L14828, https://doi.org/10.1029/2005gl023187, 2005.
Koren, I., Remer, L. A., Altaratz, O., Martins, J. V., and Davidi, A.: Aerosol-induced changes of convective cloud anvils produce strong climate warming, Atmos. Chem. Phys., 10, 5001–5010, https://doi.org/10.5194/acp-10-5001-2010, 2010.
Koren, I., Dagan, G., and Altaratz, O.: From aerosol-limited to invigoration of warm convective clouds, Science, 344, 1143–1146, 2014.
Lebo, Z. J. and Morrison, H.: Dynamical effects of aerosol perturbations on simulated idealized squall lines, Mon. Weather Rev., 142, 991–1009, 2014.
Lee, S. S., Donner, L. J., and Phillips, V. T. J.: Sensitivity of aerosol and cloud effects on radiation to cloud types: comparison between deep convective clouds and warm stratiform clouds over one-day period, Atmos. Chem. Phys., 9, 2555–2575, https://doi.org/10.5194/acp-9-2555-2009, 2009.
Levin, Z. and Cotton, W. R.: Aerosol pollution impact on precipitation: A scientific review, Springer, 205–276, 2009.
Liu, H., Guo, J., Koren, I., Altaratz, O., Dagan, G., Wang, Y., Jiang, J. H., Zhai, P., and Yung, Y. L.: Non-Monotonic Aerosol Effect on Precipitation in Convective Clouds over Tropical Oceans, Sci. Rep., 9, 7809, https://doi.org/10.1038/s41598-019-44284-2, 2019.
Malavelle, F. F., Haywood, J. M., Jones, A., Gettelman, A., Clarisse, L., Bauduin, S., Allan, R. P., Karset, I. H. H., Kristjánsson, J. E., and Oreopoulos, L.: Strong constraints on aerosol–cloud interactions from volcanic eruptions, Nature, 546, 485–491, 2017.
Medeiros, B. and Nuijens, L.: Clouds at Barbados are representative of clouds across the trade wind regions in observations and climate models, P. Natil. Acad. Sci. USA, 113, E3062–E3070, 2016.
Mlawer, E. J., Taubman, S. J., Brown, P. D., Iacono, M. J., and Clough, S. A.: Radiative transfer for inhomogeneous atmospheres: RRTM, a validated correlated-k model for the longwave, J. Geophys. Res.-Atmos., 102, 16663–16682, 1997.
Mülmenstädt, J., and Feingold, G.: The Radiative Forcing of Aerosol–Cloud Interactions in Liquid Clouds: Wrestling and Embracing Uncertainty, Curr. Clim. Chang. Rep., 4, 23–40, 2018.
Naumann, A. K. and Kiemle, C.: The vertical Structure and spatial Variability of lower tropospheric Water Vapor and Clouds in the Trades, Atmos. Chem. Phys. Discuss., https://doi.org/10.5194/acp-2019-1015, in review, 2019.
Pinsky, M., Mazin, I., Korolev, A., and Khain, A.: Supersaturation and diffusional droplet growth in liquid clouds, J. Atmos. Sci., 70, 2778–2793, 2013.
Rosenfeld, D., Lohmann, U., Raga, G. B., O'Dowd, C. D., Kulmala, M., Fuzzi, S., Reissell, A., and Andreae, M. O.: Flood or drought: How do aerosols affect precipitation?, Science, 321, 1309–1313, https://doi.org/10.1126/science.1160606, 2008.
Rosenfeld, D., Wood, R., Donner, L. J., and Sherwood, S. C.: Aerosol cloud-mediated radiative forcing: highly uncertain and opposite effects from shallow and deep clouds, in: Climate Science for Serving Society, Springer, 105–149, 2013.
Rosenfeld, D., Zhu, Y., Wang, M., Zheng, Y., Goren, T., and Yu, S.: Aerosol-driven droplet concentrations dominate coverage and water of oceanic low-level clouds, Science, 363, eaav0566, https://doi.org/10.1126/science.aav0566, 2019.
Rothenberg, D., Avramov, A., and Wang, C.: On the representation of aerosol activation and its influence on model-derived estimates of the aerosol indirect effect, Atmos. Chem. Phys., 18, 7961–7983, https://doi.org/10.5194/acp-18-7961-2018, 2018.
Seifert, A. and Beheng, K.: A two-moment cloud microphysics parameterization for mixed-phase clouds, Part 2: Maritime vs. continental deep convective storms, Meteorol. Atmos. Phys.s, 92, 67–82, 2006a.
Seifert, A. and Beheng, K. D.: A two-moment cloud microphysics parameterization for mixed-phase clouds, Part 1: Model description, Meteorol. Atmos. Phys., 92, 45–66, 2006b.
Seifert, A., Heus, T., Pincus, R., and Stevens, B.: Large-eddy simulation of the transient and near-equilibrium behavior of precipitating shallow convection, J. Adv. Model. Earth Syst., 7, 1918–1937, https://doi.org/10.1002/2015MS000489, 2015.
Stevens, B. and Feingold, G.: Untangling aerosol effects on clouds and precipitation in a buffered system, Nature, 461, 607–613, https://doi.org/10.1038/nature08281, 2009.
Stevens, B., Farrell, D., Hirsch, L., Jansen, F., Nuijens, L., Serikov, I., Brügmann, B., Forde, M., Linne, H., and Lonitz, K.: The Barbados Cloud Observatory: Anchoring investigations of clouds and circulation on the edge of the ITCZ, Bull. Am. Meteorol. Soc., 97, 787–801, 2016.
Stevens, B., Ament, F., Bony, S., Crewell, S., Ewald, F., Gross, S., Hansen, A., Hirsch, L., Jacob, M., and Kölling, T.: A high-altitude long-range aircraft configured as a cloud observatory–the NARVAL expeditions, Bull. Am. Meteorol. Soc., 100, 1061–1077, https://doi.org/10.1175/BAMS-D-18-0198.1, 2019.
Storelvmo, T., Hoose, C., and Eriksson, P.: Global modeling of mixed-phase clouds: The albedo and lifetime effects of aerosols, J. Geophys. Res.-Atmos., 116, D05207, https://doi.org/10.1029/2010JD014724, 2011.
Tao, W.-K., Chen, J.-P., Li, Z., Wang, C., and Zhang, C.: Impact of aerosols on convective clouds and precipitation, Rev. Geophys., 50, RG2001, https://doi.org/10.1029/2011RG000369, 2012.
Twomey, S.: The influence of pollution on the shortwave albedo of clouds, J. Atmos. Sci., 34, 1149–1152, 1977.
van den Heever, S. C., Stephens, G. L., and Wood, N. B.: Aerosol Indirect Effects on Tropical Convection Characteristics under Conditions of Radiative-Convective Equilibrium, J. Atmos. Sci., 68, 699–718, https://doi.org/10.1175/2010jas3603.1, 2011.
Yamaguchi, T., Feingold, G., and Kazil, J.: Stratocumulus to Cumulus Transition by Drizzle, J. Adv. Model. Earth Syst., 9, 2333–2349, https://doi.org/10.1002/2017MS001104, 2017.
Zängl, G., Reinert, D., Rípodas, P., and Baldauf, M.: The ICON (ICOsahedral Non-hydrostatic) modelling framework of DWD and MPI-M: Description of the non-hydrostatic dynamical core, Q. J. Roy. Meteor. Soc., 141, 563–579, 2015.