the Creative Commons Attribution 4.0 License.
the Creative Commons Attribution 4.0 License.
 | 28 Feb 2020
Pathway dependence of ecosystem responses in China to 1.5 °C global warming
Hong Liao
Huijun Wang
Tianyi Zhang
Nadine Unger
Stephen Sitch
Zhaozhong Feng
Jia Yang
China is currently the world's largest emitter of both CO2 and short-lived air pollutants. Ecosystems in China help mitigate a part of the country's carbon emissions, but they are subject to perturbations in CO2, climate, and air pollution. Here, we use a dynamic vegetation model and data from three model inter-comparison projects to examine ecosystem responses in China under different emission pathways towards the 1.5 ∘C warming target set by the Paris Agreement. At 1.5 ∘C warming, gross primary productivity (GPP) increases by 15.5±5.4 % in a stabilized pathway and 11.9±4.4 % in a transient pathway. CO2 fertilization is the dominant driver of GPP enhancement and climate change is the main source of uncertainties. However, differences in ozone and aerosols explain the GPP differences between pathways at 1.5 ∘C warming. Although the land carbon sink is weakened by 17.4±19.6 % in the stabilized pathway, the ecosystems mitigate 10.6±1.4 % of national emissions in the stabilized pathway, more efficient than the fraction of 6.3±0.8 % in the transient pathway. To achieve the 1.5 ∘C warming target, our analysis suggests a higher allowable carbon budget for China under a stabilized pathway with reduced emissions in both CO2 and air pollutants.
- Article
(4444 KB) - Full-text XML
-
Supplement
(5107 KB) - BibTeX
- EndNote


The past decade has seen record-breaking warming largely related to anthropogenic greenhouse gas emissions (Mann et al., 2017). This warming trend presents a challenge to achieving the temperature control target of 1.5 ∘C above the pre-industrial (PI) level set by the 2015 Paris Agreement. Many studies have shown that a conservative level of warming such as 1.5 ∘C is necessary to limit climatic extremes (Nangombe et al., 2018), avoid heat-related mortality (Mitchell et al., 2018), reduce economic loss (Burke et al., 2018), and alleviate ecosystem risks (Warszawski et al., 2013) compared to stronger anthropogenic warming. To achieve this target, each country must aim to control its greenhouse gas emissions. A full understanding of regional ecosystem response to the changing climate and environmental stress is essential to reduce uncertainties in allowable carbon budget estimates at 1.5 ∘C (Mengis et al., 2018). China is covered with a wide range of terrestrial biomes (Fang et al., 2012). While China's ecosystem response to possible future climate has been explored (Wu et al., 2009; He et al., 2017; Dai et al., 2016), impacts on the regional carbon budget of differing pathways to the 1.5 ∘C target are not known.
There are two distinct pathways to the 1.5 ∘C global warming. One is a fast process in which global temperature passes 1.5 ∘C and continues to increase (scenarios assuming high CO2 emissions and no climate mitigation) while the other is a stabilized process with an equilibrium warming right below 1.5 ∘C that lasts for decades before the end of 21st century (scenarios including climate mitigation; James et al., 2017). The stabilized pathway is the one proposed by the 2015 Paris Agreement. However, the unprecedented warming in 2016 results in an increase of global average temperature by 1.1 ∘C above PI (https://public.wmo.int/, last access: 27 February 2019), suggesting that the 1.5 ∘C limit may be broken in the near future under a transient pathway (Henley and King, 2017). A few studies have compared allowable carbon budgets between these two pathways (Collins et al., 2018; Millar et al., 2017), but none has estimated the mitigation potential of regional ecosystems with joint impacts of changes in climate, CO2, and air pollution under different pathways.
Here, we apply the Yale Interactive terrestrial Biosphere (YIBs) model (Yue and Unger, 2015, 2018) to investigate the response of terrestrial ecosystem productivity in China to both stabilized and transient global warming of 1.5 ∘C relative to the PI period. We focus on the changes of gross primary productivity (GPP) and net ecosystem exchange (NEE). GPP represents total canopy photosynthesis through gross carbon assimilation. NEE is the residue after subtraction of GPP from ecosystem (plant + soil) respiration (Reco − GPP), indicating the net carbon sink from land to atmosphere. The larger the GPP values, the stronger the carbon assimilation by ecosystems. In contrast, the more negative the NEE, the stronger the carbon sink of the land. The YIBs model is driven with meteorology from an ensemble of climate models in Climate Model Intercomparison Project Phase 5 (CMIP5). The stabilized global warming pathway is represented by the RCP2.6 low-emissions scenario that yields an equilibrium change in global mean temperature (ΔGMT) of 1.49 ∘C by 2050–2070 with selected climate models (Fig. S1 in the Supplement). The transient pathway is represented by RCP8.5 high-emission scenario in which ΔGMT grows rapidly and realizes a transient 1.5 ∘C around the years 2021–2041. We select the present-day period of 1995–2015 as a reference.
2.1 Datasets
2.1.1 CMIP5 data
We use both daily and monthly meteorology predicted by CMIP5 models (https://esgf-node.llnl.gov/, last access: 1 February 2020). The daily data are used as input for YIBs. In total, we select 15 climate models (Table S1 in the Supplement) with all available daily meteorology, including surface air temperature, precipitation, specific humidity, surface downward shortwave radiation, surface pressure, and surface wind speed, for a historical scenario and two future scenarios (RCP2.6 and RCP8.5). These two scenarios assume distinct emission pathways of both CO2 and air pollutants, with the RCP2.6 scenario projecting much lower CO2 and pollution concentrations than RCP8.5. Simulated annual GMT is smoothed with a 21-year window to remove decadal variations. The ensemble changes of GMT relative to PI period (1861–1900) from two scenarios are examined (Fig. S1a). The low-emission scenario RCP2.6 yields an equilibrium ΔGMT of 1.85 ∘C by 2100. We remove eight climate models predicting stabilized ΔGMT higher than 1.85 ∘C by the end of century. The seven remaining models yield an ensemble warming close to 1.5 ∘C (1.49 ∘C for 2050–2070, Fig. S1b). Meanwhile, ΔGMT in the high-emission scenario RCP8.5 grows fast and realizes a transient 1.5 ∘C warming around the years 2021–2041. Daily meteorology from seven selected models (Table S1) are then interpolated to the uniform 1∘ × 1∘ resolution and used to drive YIBs to simulate terrestrial carbon fluxes in China for 1850–2100. Due to the large data storage, we retain only the domain of (15–60∘ N, 60–150∘ E) covering Chinese territory. We bias correct modeled meteorology with WFDEI (WATCH Forcing Data methodology applied to ERA-Interim reanalysis) data (Weedon et al., 2014):
Here Vd is the original daily variables and is the scaled value. Sw is the two-dimensional WFDEI value averaged for 1980–2004 and Sm is the modeled values averaged for the same period. In this case, the average climate from each individual model matches observations at present day; meanwhile, climate variability from models are retained to estimate uncertainties in carbon fluxes.
2.1.2 TRENDY-v6 data
We acquire the global GPP and NEE datasets from 1901 to 2016 simulated by 14 dynamic global vegetation models (DGVMs) participating in the TRENDY project (Table S2). All DGVMs are implemented following the same simulation protocol and are driven by consistent input datasets, including CRU-NCEP climate data, and atmospheric CO2 concentrations, but fixed present-day land use (Le Quéré et al., 2018).
2.1.3 ACCMIP O3 data
We use monthly output of surface O3 concentrations from 12 models joining the Atmospheric Chemistry and Climate Model Intercomparison Project (ACCMIP, Lamarque et al., 2013; Table S3). The ACCMIP models have a wide range of horizontal and vertical resolutions, natural emissions, chemistry schemes, and interaction with radiation and clouds. However, these models apply the same anthropogenic and biomass burning emissions specified for CMIP5 RCP scenarios (e.g., RCP2.6 or RCP8.5), though different models perform simulations at different time slices. Here, we use surface O3 and interpolate the original output to 1∘ × 1∘ resolution. We fill the temporal gaps between two adjacent time slices using a linear fitting approach. In this way, we derive the monthly O3 from 1850 to 2100 for each model and their ensemble average at each grid point.
2.1.4 Diffuse radiation data
The original CMIP5 archive does not provide a diffuse component of shortwave radiation. Here, we use empirical relations between total and diffuse radiation from 11 studies to calculate hourly diffuse radiation (Table S4). The diffuse fraction kd in all equations depends on clearness index kt, which is defined as the ratio between global solar radiation It and extra-terrestrial solar radiation I0 (Ghosh et al., 2017):
Here Isc=1367 W m−2 is solar constant, N is Julian day of the year, and φ is solar zenith. The empirical equations are evaluated using hourly total and diffuse radiation from Modern-Era Retrospective Analysis for Research and Applications (MERRA; Rienecker et al., 2011) during 2008–2012. For each grid in China, we calculate hourly diffuse radiation (Dc) using MERRA total radiation and compare it with the standard output (Dm). Statistical metrics including correlation, normalized mean bias (NMB), and normalized root mean square error (NRMSE) are used to evaluate the performance of empirical equations:
Here and are mean values of calculated and MERRA diffuse radiation, respectively. The evaluation is performed month by month for 2008–2012 and n is the number of daytime samples (grids with total radiation > 5 W m−2). The value of n varies from month to month with a minimum of 540 000 in December 2010. Evaluation shows that the empirical model M01 (Lam and Li, 1996) yields the highest correlation and the lowest NRMSE (Fig. S2). As a result, we use the M01 model to derive diffuse radiation from CMIP5 models.
2.2 Model
We apply the YIBs model (Yue and Unger, 2015; Yue et al., 2017) to simulate historical and future (1850–2100) ecosystem productivity. The YIBs model dynamically calculates leaf area index (LAI) and tree height based on carbon assimilation and allocation. Leaf-level photosynthesis is calculated hourly using the well-established Farquhar et al. (1980) scheme and is upscaled to canopy level by the separation of sunlit and shaded leaves (Spitters, 1986). Sunlit leaves can receive both direct and diffuse radiation, while shaded leaves receive only the diffuse component (Yue and Unger, 2017). The assimilated carbon is in part used for maintenance and growth respiration, and the rest is allocated among leaf, stem, and root for plant growth (Clark et al., 2011). Soil respiration is calculated as the loss of carbon flows among 12 soil carbon pools (Schaefer et al., 2008). The YIBs model considers nine plant functional types (PFTs) including evergreen needleleaf forest (ENF), deciduous broadleaf forest (DBF), evergreen broadleaf forest (EBF), shrubland, tundra, C3 grassland, C4 grassland, C3 cropland, and C4 cropland. The land cover is prescribed based on satellite retrievals from the Moderate Resolution Imaging Spectroradiometer (MODIS; Hansen et al., 2003) and the Advanced Very High Resolution Radiometer (AVHRR; Defries et al., 2000). For this study, we fix the land cover to isolate impacts of CO2 and climatic changes. Other studies also show only moderate changes in vegetation fraction and composition at a low warming level (Warszawski et al., 2013). The YIBs model can be applied at the site, regional, and global scales. The site-level model has been evaluated with measured carbon fluxes from 145 FLUXNET sites (Yue and Unger, 2015). For this study, all simulations are performed at the 1∘ × 1∘ resolution over China. During the period of 1982–2011, YIBs predicts an average GPP of 7.17 Pg C yr−1 in China (Fig. S3), close to the 7.25 Pg C yr−1 estimated in the benchmark product (Jung et al., 2009).
YIBs calculates O3 damage to plant photosynthesis using a flux-based parameterization (Sitch et al., 2007). The inhibition rate of GPP is dependent on both ambient O3 concentrations and stomatal conductance. Compared to meta-analyses of hundreds of data sources from China (Table S5) and the world (Yue and Unger, 2018), the scheme shows good performance in estimating GPP responses to O3 for DBF, EBF, C3, and C4 herbs (Fig. S4). The predicted O3 damaging effects on ENF might be underestimated. The YIBs model separates the effects of diffuse and direct light on plant photosynthesis (Spitters, 1986). Simulated GPP responses to direct and diffuse radiation show good agreement with observations at 24 global flux tower sites from FLUXNET network (Yue and Unger, 2018). In general, diffuse radiation is more efficient at enhancing canopy photosynthesis compared to the same level of direct radiation.
2.3 Simulations
We perform two main groups of simulations, one for RCP2.6 and the other for RCP8.5. For each group, seven sub-groups are designed with varied climatic or CO2 forcings (Table S6). In each sub-group, separate runs are conducted for the YIBs model driven with climate variables from seven selected CMIP5 models (Table S1), making a total of 98 runs. A baseline group simulation (HIST_2000) is performed with fixed meteorology and CO2 after the year 2000. Another four sub-group simulations are performed to quantify O3 effects on photosynthesis (Table S7). These simulations are driven with both CMIP5 meteorology and monthly O3 concentrations from an ensemble of 12 ACCMIP models. The runs are distinguished with different O3 damaging sensitivity (high or low) and scenario projections (RCP2.6 or RCP8.5). Monthly O3 concentrations are downscaled to an hourly time step using the diurnal cycle simulated by a chemistry–climate model NASA ModelE2 (Schmidt et al., 2014). The O3-affected GPP or NEE are calculated as the average of simulations with low and high sensitivities.
For each run, a 251-year simulation is performed with the historical climate for 1850–2000 and the future climate for 2001–2100. For simulations driven with meteorology from the same climate model, all sensitivity tests apply the same climate forcing during the historical period but utilize varied forcings after the year 2000. For example, RCP26_CO2 is identical to RCP26_MET for the period of 1850–2000. However, after the year 2000, the former runs fixed climatic conditions for the year 2000 but allows changes in CO2 concentrations year by year for 2001–2100 following the pathway projection, while the latter fixes the CO2 level for the year 2000 but continues to use day-to-day meteorology after 2000. For all simulations, we initialize vegetation and soil carbon pools in the YIBs model with a 200-year spin-up by recycling meteorology for the year 1850. Contributions of individual factors are calculated as the differences between sensitivity and baseline group (e.g., RCP26_CO2–HIST_2000 for CO2 fertilization in RCP2.6 scenario).
The main focus of this study is to quantify how the differences of anthropogenic emissions, including both CO2 and air pollution, which are usually associated, will cause different responses in the land carbon budget to the same global warming target. We highlight that the role of air pollution on the land carbon cycle has always been ignored. The assumptions of land use can be quite uncertain between future pathways (Stehfest et al., 2019), and these assumptions are not necessarily associated with CO2 and air pollution emissions. As a result, for this study, we consider fixed land cover in all simulations. We do not consider ecosystem–climate interactions as in earlier studies (e.g., Yue et al., 2017), so as to take advantage of climate projections from multiple models.
3.1 Changes of atmospheric compositions and radiation
The ensemble concentrations of ACCMIP O3 show good agreement with ground-based observations from 1580 sites in China (Fig. 1). The spatial correlation is R=0.80 (p<0.01) between observations and the ensemble O3 concentrations ([O3]), though the latter is higher by 25 % (Fig. 1a–c). Such overestimation can likely be attributed to the high [O3] at night in the models, because the evaluation of maximum daily 8 h average (MDA8) [O3], which mainly occurs in the daytime, shows more reasonable predictions with a lower bias of 10 % (Fig. 1d–f). Since O3 vegetation damage in general occurs in the daytime, when both plant photosynthesis and [O3] are at high levels, the ACCMIP [O3] can be used as input for YIBs to derive long-term O3 inhibition effects on ecosystem productivity.
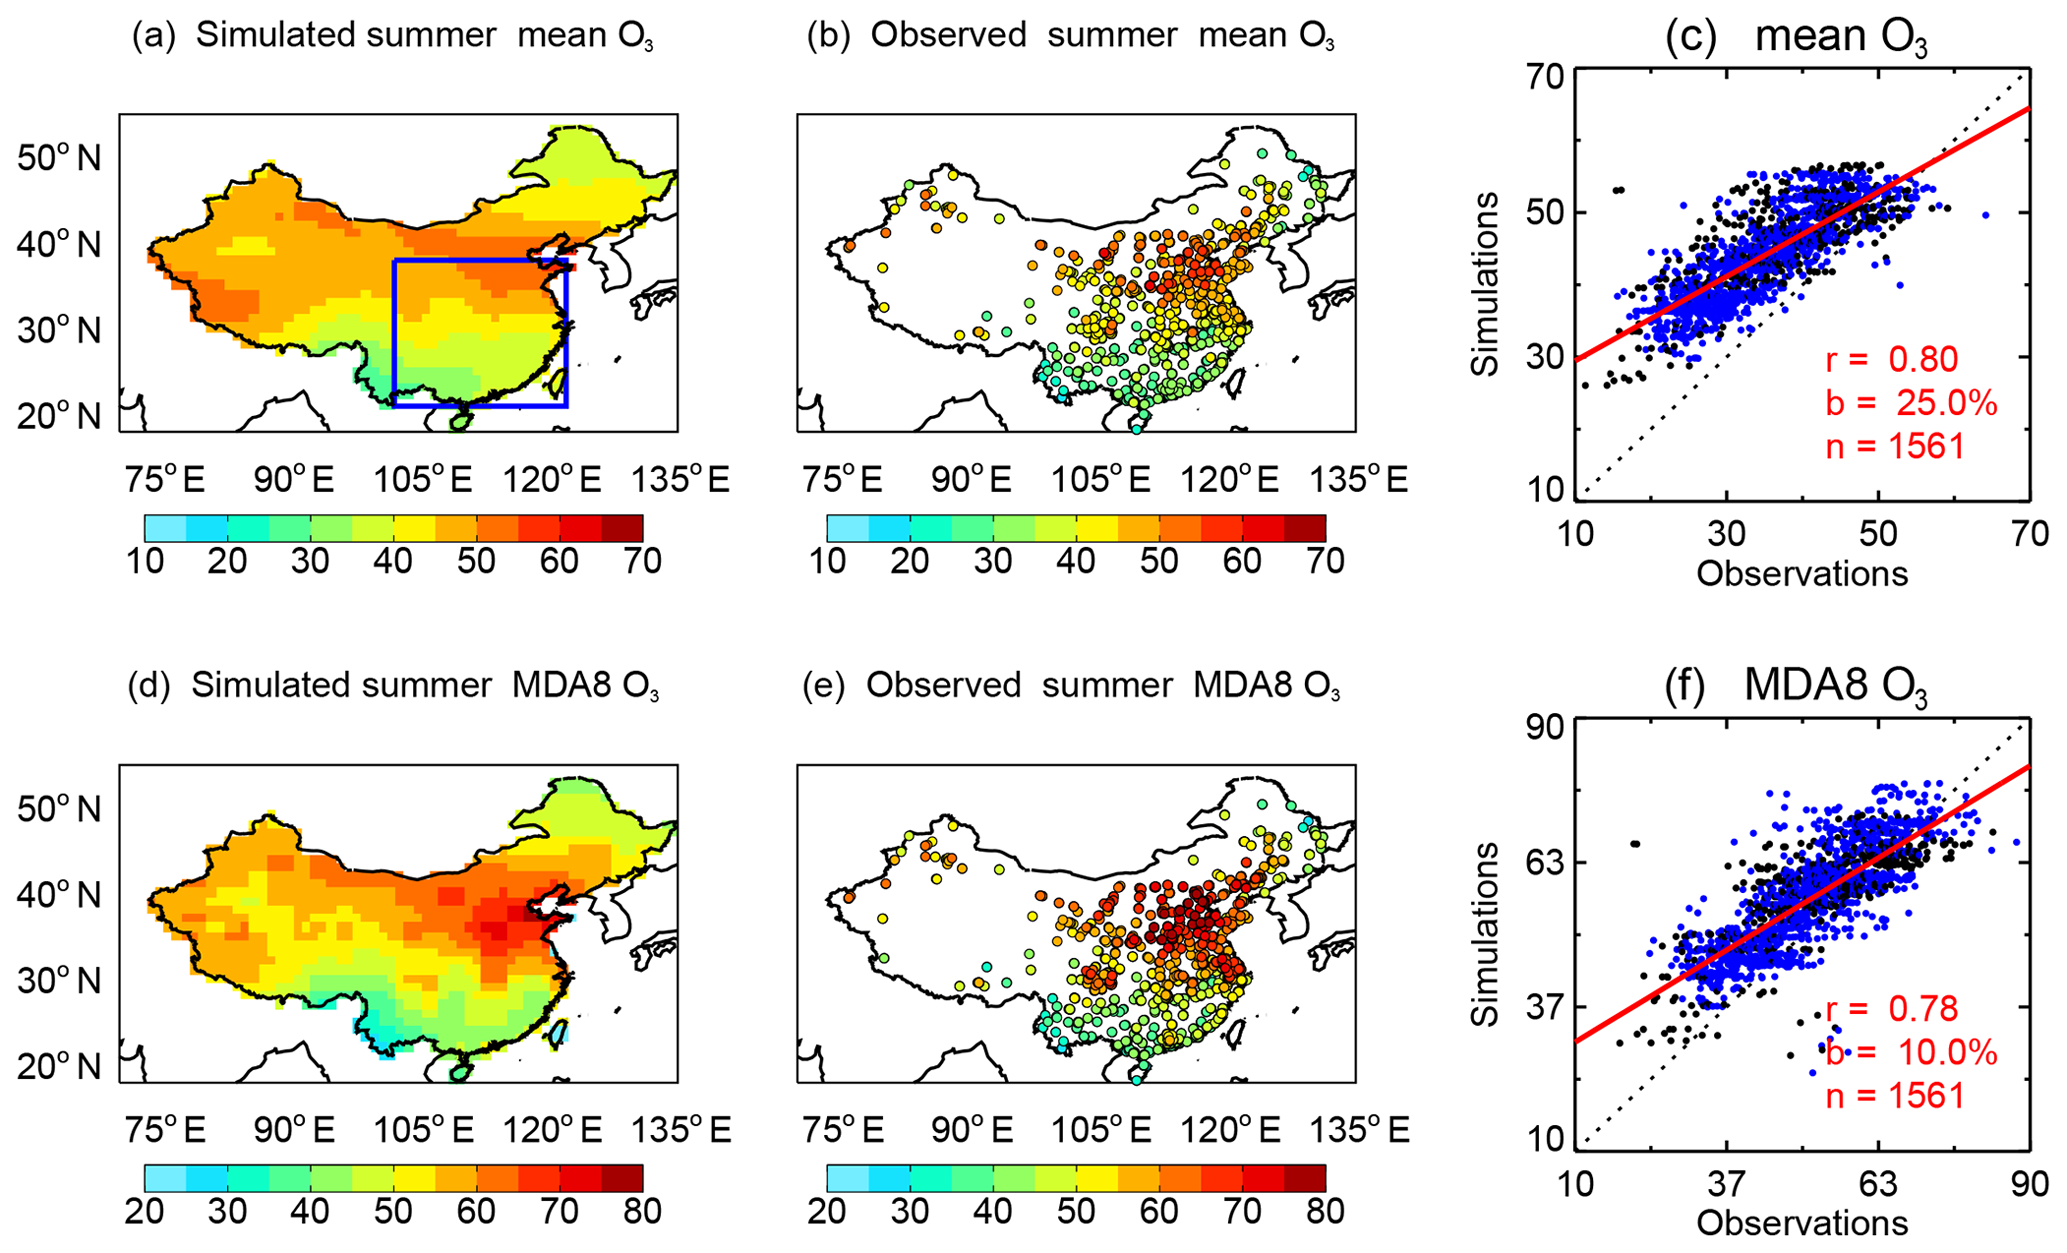
Figure 1Evaluation of surface O3 with site-level observations. Simulations are ensemble (a) mean and (d) daily maximum 8 h average (MDA8) O3 for the period of 2005–2015 from 12 ACCMIP models. Observations (b, e) are the average during 2015–2018 from 1580 sites operated by Ministry of Ecology and Environment, China. The correlation coefficients (r), relative biases (b), and number of sites (n, excluding sites lacking data) are shown in the scatter plots (c, f). The blue points in the scatter plots represent sites located within the box regions in eastern China as shown in (a). The dashed line represents the 1:1 ratio. The red line is the linear regression between simulations and observations.
The ensemble radiation from CMIP5 models matches observations at 106 sites in China (Fig. 2). For total shortwave radiation, the model prediction shows high values in the west and low values in the southeast, consistent with observations for a correlation coefficient of R=0.79 (p<0.01) and a mean bias of 8.9 %. The derived diffuse radiation is highest in the southeast, where the total radiation is lowest. Observed diffuse radiation is available only at 17 sites. Compared to these sites, predictions show reasonable spatial distribution with a correlation of R=0.65 (p<0.01) and a low bias of 7.1 %. Both the total radiation and derived diffuse radiation are used as input for YIBs to estimate GPP responses to joint changes in direct and diffuse radiation caused by aerosol removal.
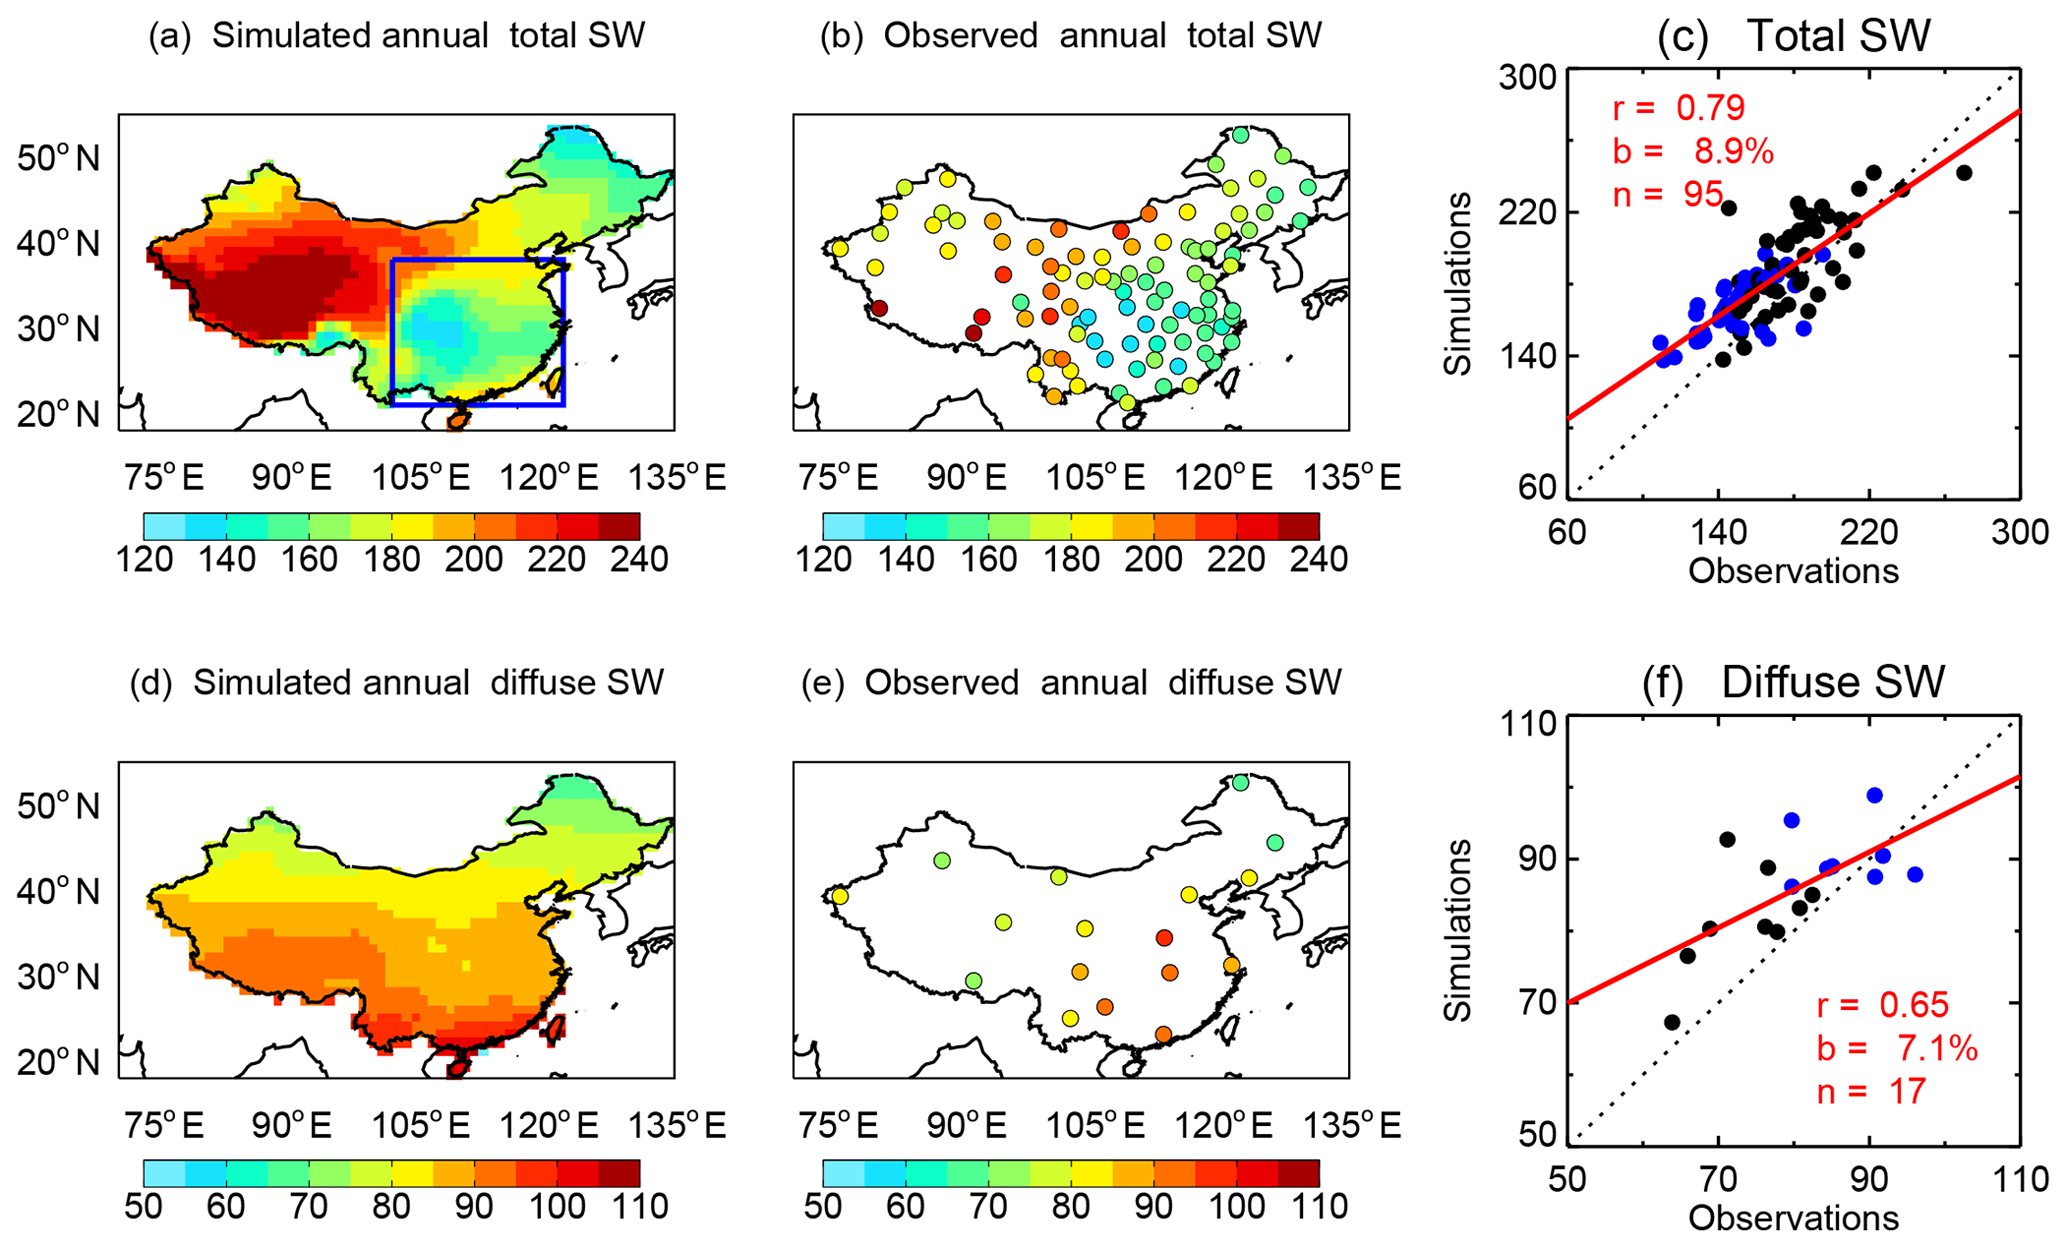
Figure 2Evaluation of radiation fluxes with site-level observations. Simulations are surface (a) total shortwave radiation (W m−2) and (d) diffuse radiation derived with method M01 (Table S4) for the period of 2005–2015 from an ensemble of seven CMIP5 climate models. Observations (b, e) are the average during 2009–2011 from 106 sites operated by the Climate Data Center, Chinese Meteorological Administration. The correlation coefficients (r), relative biases (b), and number of sites (n, excluding sites lacking data) are shown in the scatter plots (c, f). The blue points in the scatter plots represent sites located within the box regions in eastern China as shown in (a). The dashed line represents the 1:1 ratio. The red line is the linear regression between simulations and observations.
Atmospheric compositions and radiation show varied changes in different scenarios. The GMT changes mainly follow those in CO2 concentrations, which show fast growth in RCP8.5 but slow changes in RCP2.6 (Fig. 3a). The latter assumes a large reduction of carbon emissions globally after the year 2020 (Meinshausen et al., 2011). Global CO2 levels reduce slightly after the year 2030 in RCP2.6, while GMT continues growing until 2050 due to air–sea interactions (Solomon et al., 2009). As a low-emission scenario, RCP2.6 experiences a slow growth in nitrogen oxide (NOx) emissions and a continuous reduction after the year 2020 (Fig. S5), resulting in a decline of 6.4 ppb (15.2 %) in surface O3 over eastern China under 1.5 ∘C warming at 2060 (Fig. 3b). In contrast, RCP8.5 assumes fast growth of NOx emissions with delayed controls after the year 2030, leading to surface O3 enhancements of 6.6 ppb (15.7 %) under 1.5 ∘C warming at 2030. The lower emissions in RCP2.6 also result in smaller aerosol optical depth (AOD) than RCP8.5 (Fig. S6), leading to higher surface total radiation (Fig. 3c), with lower diffuse radiation (Fig. 3d) due to reducing light extinction (Yu et al., 2006).
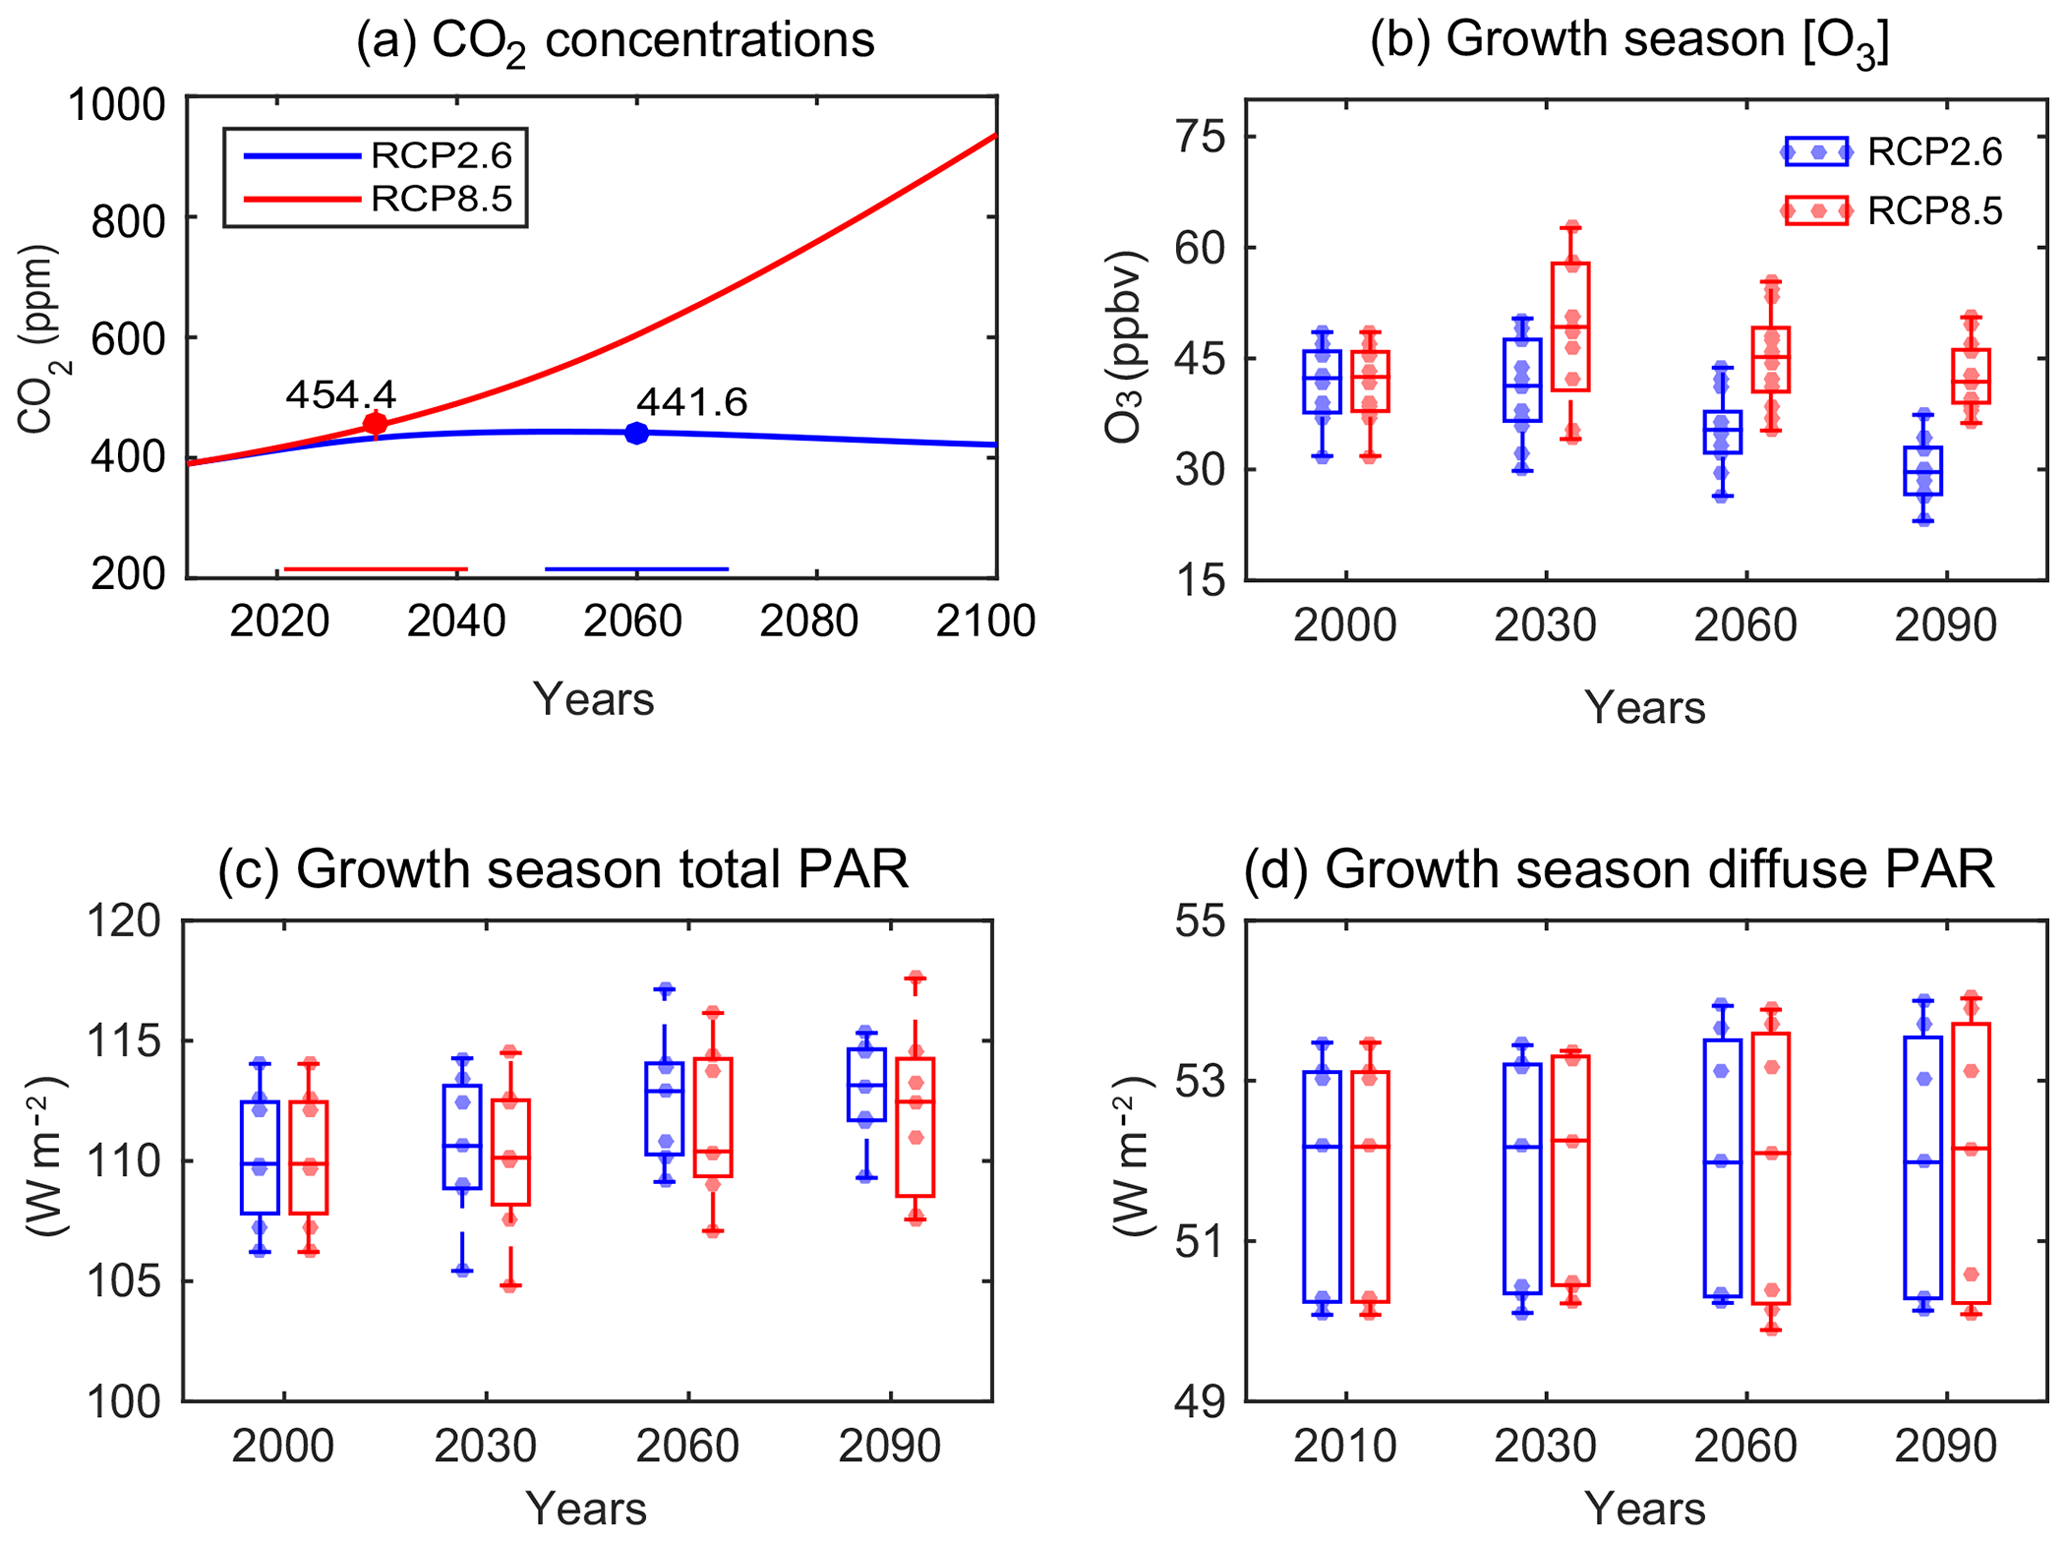
Figure 3Changes in atmospheric compositions and radiation. Results shown are projected future (a) global CO2 concentrations, and (b) surface O3 concentrations, (c) total photosynthetically active radiation (PAR), and (d) diffuse PAR at growth season in China. The average (a) CO2 concentrations at the global warming of 1.5 ∘C are 442 ppm for RCP2.6 scenario (blue, 2050–2070) and 454 ppm for RCP8.5 scenario (red, 2021–2041). The (b) O3 concentrations are averaged over east of 110∘ E in China from 12 ACCMIP models for RCP2.6 (blue) and RCP8.5 (red) scenarios. Each dot represents the value averaged for May to September from a chemistry model. The (c, d) PAR values are averaged over China from seven CMIP5 models for RCP2.6 (blue) and RCP8.5 (red) scenarios. Diffuse PAR is calculated using hourly total PAR and solar zenith angle based on the parameterization M01. Each dot represents the value averaged for May to September from a climate model. For each selected year in (b–d), a period of 11 years (5 years before and 5 years after) is used to derive the decadal mean values.
3.2 Historical ecosystem productivity in China
The ensemble simulations show an increasing trend in GPP in China of 0.011 Pg C yr−2 over the historical period 1901–2016 (Fig. 4a). A stronger trend of 0.022 Pg C yr−2 is found after 1960. Such a change is much faster than the trend of 0.013 Pg C yr−2 estimated by a benchmark product (Jung et al., 2009) for 1982–2011 but close to a recent estimate of 0.02 Pg C yr−2 from combined machine learning algorithms and eddy flux measurements from 40 sites in China (Yao et al., 2018). The simulated trend is also consistent with the TRENDY ensemble, which predicts trends of 0.013±0.006 Pg C yr−2 (ensemble ± inter-model uncertainty) for 1901–2016 and 0.022±0.01 Pg C yr−2 for 1961–2016. The YIBs simulations show variabilities of 0.41±0.23 Pg C yr−1 (6.2±3.9 %, blue shading in Fig. 4a) due to uncertainties in climate from CMIP5 models, much smaller than the value of 1.33±0.16 Pg C yr−1 (19.2±2.6 %, red shading in Fig. 4a) caused by structural uncertainties across different vegetation models.
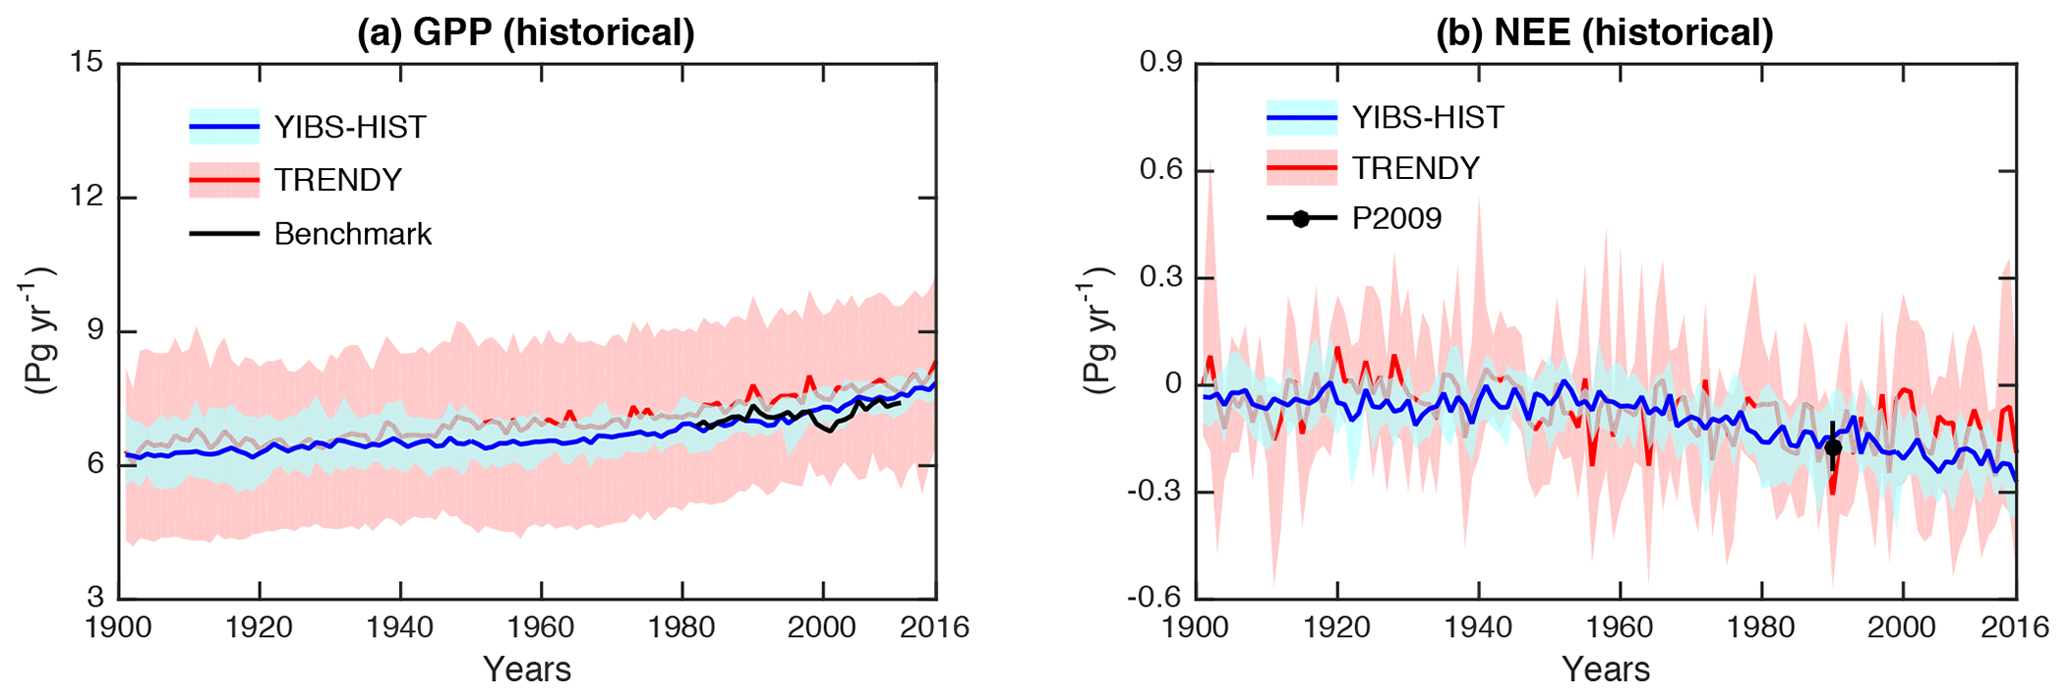
Figure 4Historical carbon fluxes in China. Results shown are simulated (a) gross primary productivity (GPP) and (b) net ecosystem exchange (NEE) during the historical period (1901–2016) using YIBs (blue), and the comparison with predictions of 14 terrestrial models from TRENDY project (red). The bold lines are ensemble means with red shadings for inter-vegetation-model uncertainties and blue shadings for inter-climate-model uncertainties. All YIBs simulations are driven with daily meteorology from CMIP5 models. All TRENDY simulations are driven with CRU-NCEP meteorology. The black line in (a) represents benchmark results of 1980–2011 from Jung et al. (2009). The black point with an error bar in (b) represents the synthesis of ground- and model-based estimates of NEE in China by Piao et al. (2009).
NEE in China is negative, suggesting a regional land carbon sink (Fig. 4b). This sink is −94.7 Tg C yr−1 with a trend of −1.7 Tg C yr−2 during 1901–2016. Such change matches TRENDY simulations, which predict a multi-model mean carbon sink of Tg C yr−1 (uncertainties due to inter-model variations) and a trend of Tg C yr−2 for the same period. During 1980–1989, the ground-based estimate (Piao et al., 2009) suggests a sink of 177±73 Tg C yr−1 in China, consistent with the sink intensity of 149±20 Tg C yr−1 from the YIBs ensemble prediction. For the recent period of 1980–2000, YIBs estimates a strengthened sink of 154±30 Tg C yr−1 in China, weaker than the estimate of 198±114 Tg C yr−1 with the Dynamic Land Ecosystem Model (DLEM; Tian et al., 2011) but within the estimates of 137–177 Tg C yr−1 based on both ground and satellite data (Fang et al., 2007). The interannual variability in YIBs simulations is much weaker than the estimates in other studies, because the ensemble approach largely dampen variations among different runs. Similar to GPP, the NEE simulations exhibit smaller variability of 62±50 Tg C yr−1 among different YIBs runs than that of 122±57 Tg C yr−1 among different TRENDY models.
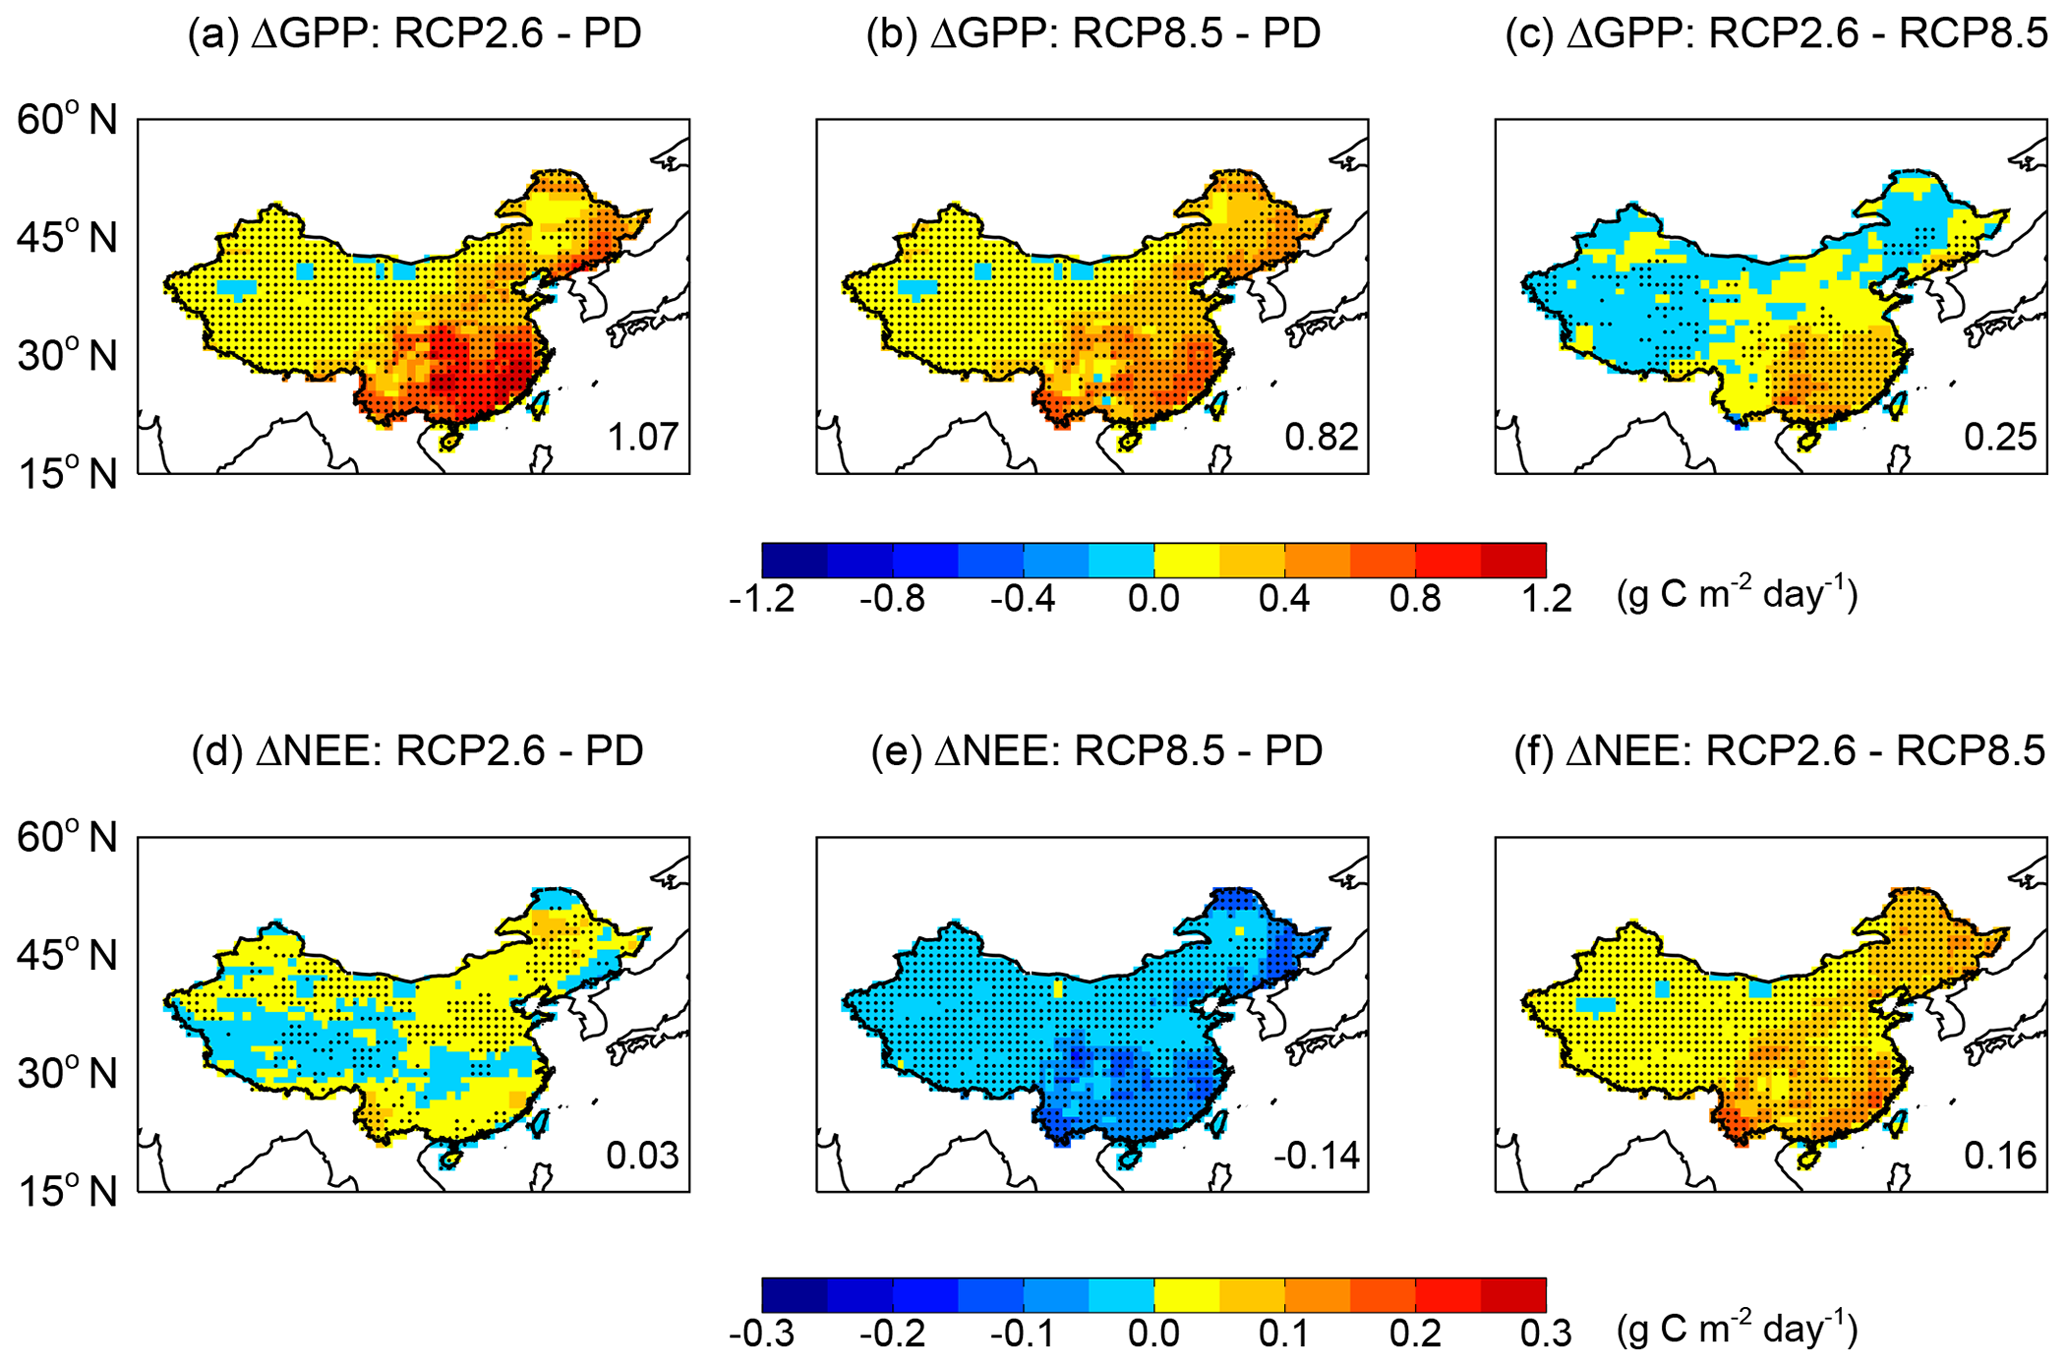
Figure 5Changes in carbon fluxes by global warming of 1.5 ∘C. Results shown are simulated (a–c) GPP and (d–f) NEE over China between the period of global warming of 1.5 ∘C and present day (1995–2015) under (a, d) RCP2.6 scenario, (b, e) RCP8.5 scenario, and (c, f) their differences. The period of global warming of 1.5 ∘C is set to 2050–2070 for RCP2.6 and 2021–2041 for RCP8.5. Simulations are performed using the YIBs vegetation model driven with daily meteorology from seven CMIP5 models. The O3 damaging effect is included with predicted ensemble O3 concentrations from 12 ACCMIP models. For each grid, significant changes at p<0.05 are marked with dots. The total changes (Pg C yr−1) over China are shown in each panel.
3.3 Future changes of carbon fluxes
Projected GPP continues to increase in both RCP2.6 and RCP8.5 scenarios after the year 2016 (Fig. S7a). With global warming of 1.5 ∘C, GPP increases significantly in China, especially over eastern and northeastern parts (Fig. 5). Compared to the present day, GPP with O3 effects increases by 1.07±0.38 Pg C yr−1 (15.5±5.4 %) in the RCP2.6 scenario (Fig. 5a) and 0.82±0.30 Pg C yr−1 (11.9±5.4 %) in RCP8.5 (Fig. 5b). The spatial pattern of the GPP changes is similar in the two pathways (correlation coefficient R=0.93), except that ΔGPP in RCP2.6 is higher than in RCP8.5 by 30 %, with a positive center over eastern China (Fig. 5c). Projected NEE continues to be more negative in the RCP8.5 scenario after the year 2016 (Fig. S7b). Meanwhile, future NEE reaches the minimum value (or the maximum sink strength) around the year 2025 and then reverses to be less negative in the RCP2.6 scenario (Fig. S7b). By the time of 1.5 ∘C global warming, NEE changes in China show opposite tendencies between the two pathways. Compared to the present day, NEE increases by 0.03±0.03 Pg C yr−1 ( %) in RCP2.6 (Fig. 5d) but decreases by 0.14±0.04 Pg C yr−1 (94.4±24.9 %) in RCP8.5 (Fig. 5e), suggesting that the land carbon sink is slightly weakened in the former but strengthened in the latter. Their differences exhibit widespread positive values in China with high centers in the east (Fig. 5f).
The changes in carbon fluxes follow the variations in atmospheric composition and climate (Figs. 6 and S8–S11). With global warming of 1.5 ∘C, a dominant fraction of GPP enhancement in China is attributed to CO2 fertilization (Fig. 6a). For the RCP2.6 scenario, CO2 alone contributes 0.83 Pg C yr−1 (77 %) to ΔGPP, with the highest enhancement of 0.8 g C m−2 d−1 over the southeast coast (Fig. S8a). For RCP8.5, CO2 fertilization increases GPP by 0.95 Pg C yr−1, even higher than the total ΔGPP of 0.82 Pg C yr−1. The larger CO2-induced ΔGPP in RCP8.5 is due to the higher CO2 concentrations (454 ppm) than RCP2.6 (442 ppm) at the same 1.5 ∘C warming (Fig. 3a). The 12 ppm differences in CO2 concentrations lead to a change of 0.12 Pg C yr−1 (1.7 %) in GPP. This sensitivity of GPP to CO2, 0.14 % ppm−1, falls within the range of 0.05–0.21 % ppm−1 as predicted by 10 terrestrial models (Piao et al., 2013) and that of 0.01 %–0.32 % ppm−1 as observed from multiple free-air CO2 enrichment (FACE) sites (Ainsworth and Long, 2005). The higher ΔGPP in RCP2.6 instead yields a weakened NEE (more positive) due to the CO2 effects (Fig. 6b). The stabilization of CO2 concentrations in this scenario (Fig. 3a) results in a stabilized GPP after the year 2040 (Fig. S7a). Meanwhile, the 55-year (from 2005 to 2060) carbon accumulation enhances soil carbon storage by 10.5±1.3 Pg C and promotes soil respiration to 0.71±0.19 Pg C yr−1. The stabilized GPP with enhanced soil respiration (NEE = Reco − GPP; Reco includes both soil and plant respiration) together lead to a weakened carbon sink (less negative NEE) in the 1.5 ∘C warming period (Fig. 7b). In contrast, soil carbon storage increases only 5.2±0.5 Pg C in RCP8.5 due to relatively short time period (from 2005 to 2031) for carbon accumulation, leading to lower soil respiration of 0.41±0.15 Pg C yr−1 in the fast warming pathway. The continuous increase of GPP and lower soil respiration jointly strengthen the land carbon sink (more negative NEE) in China by 0.1 Pg C yr−1 under the RCP8.5 scenario (Fig. 6a).
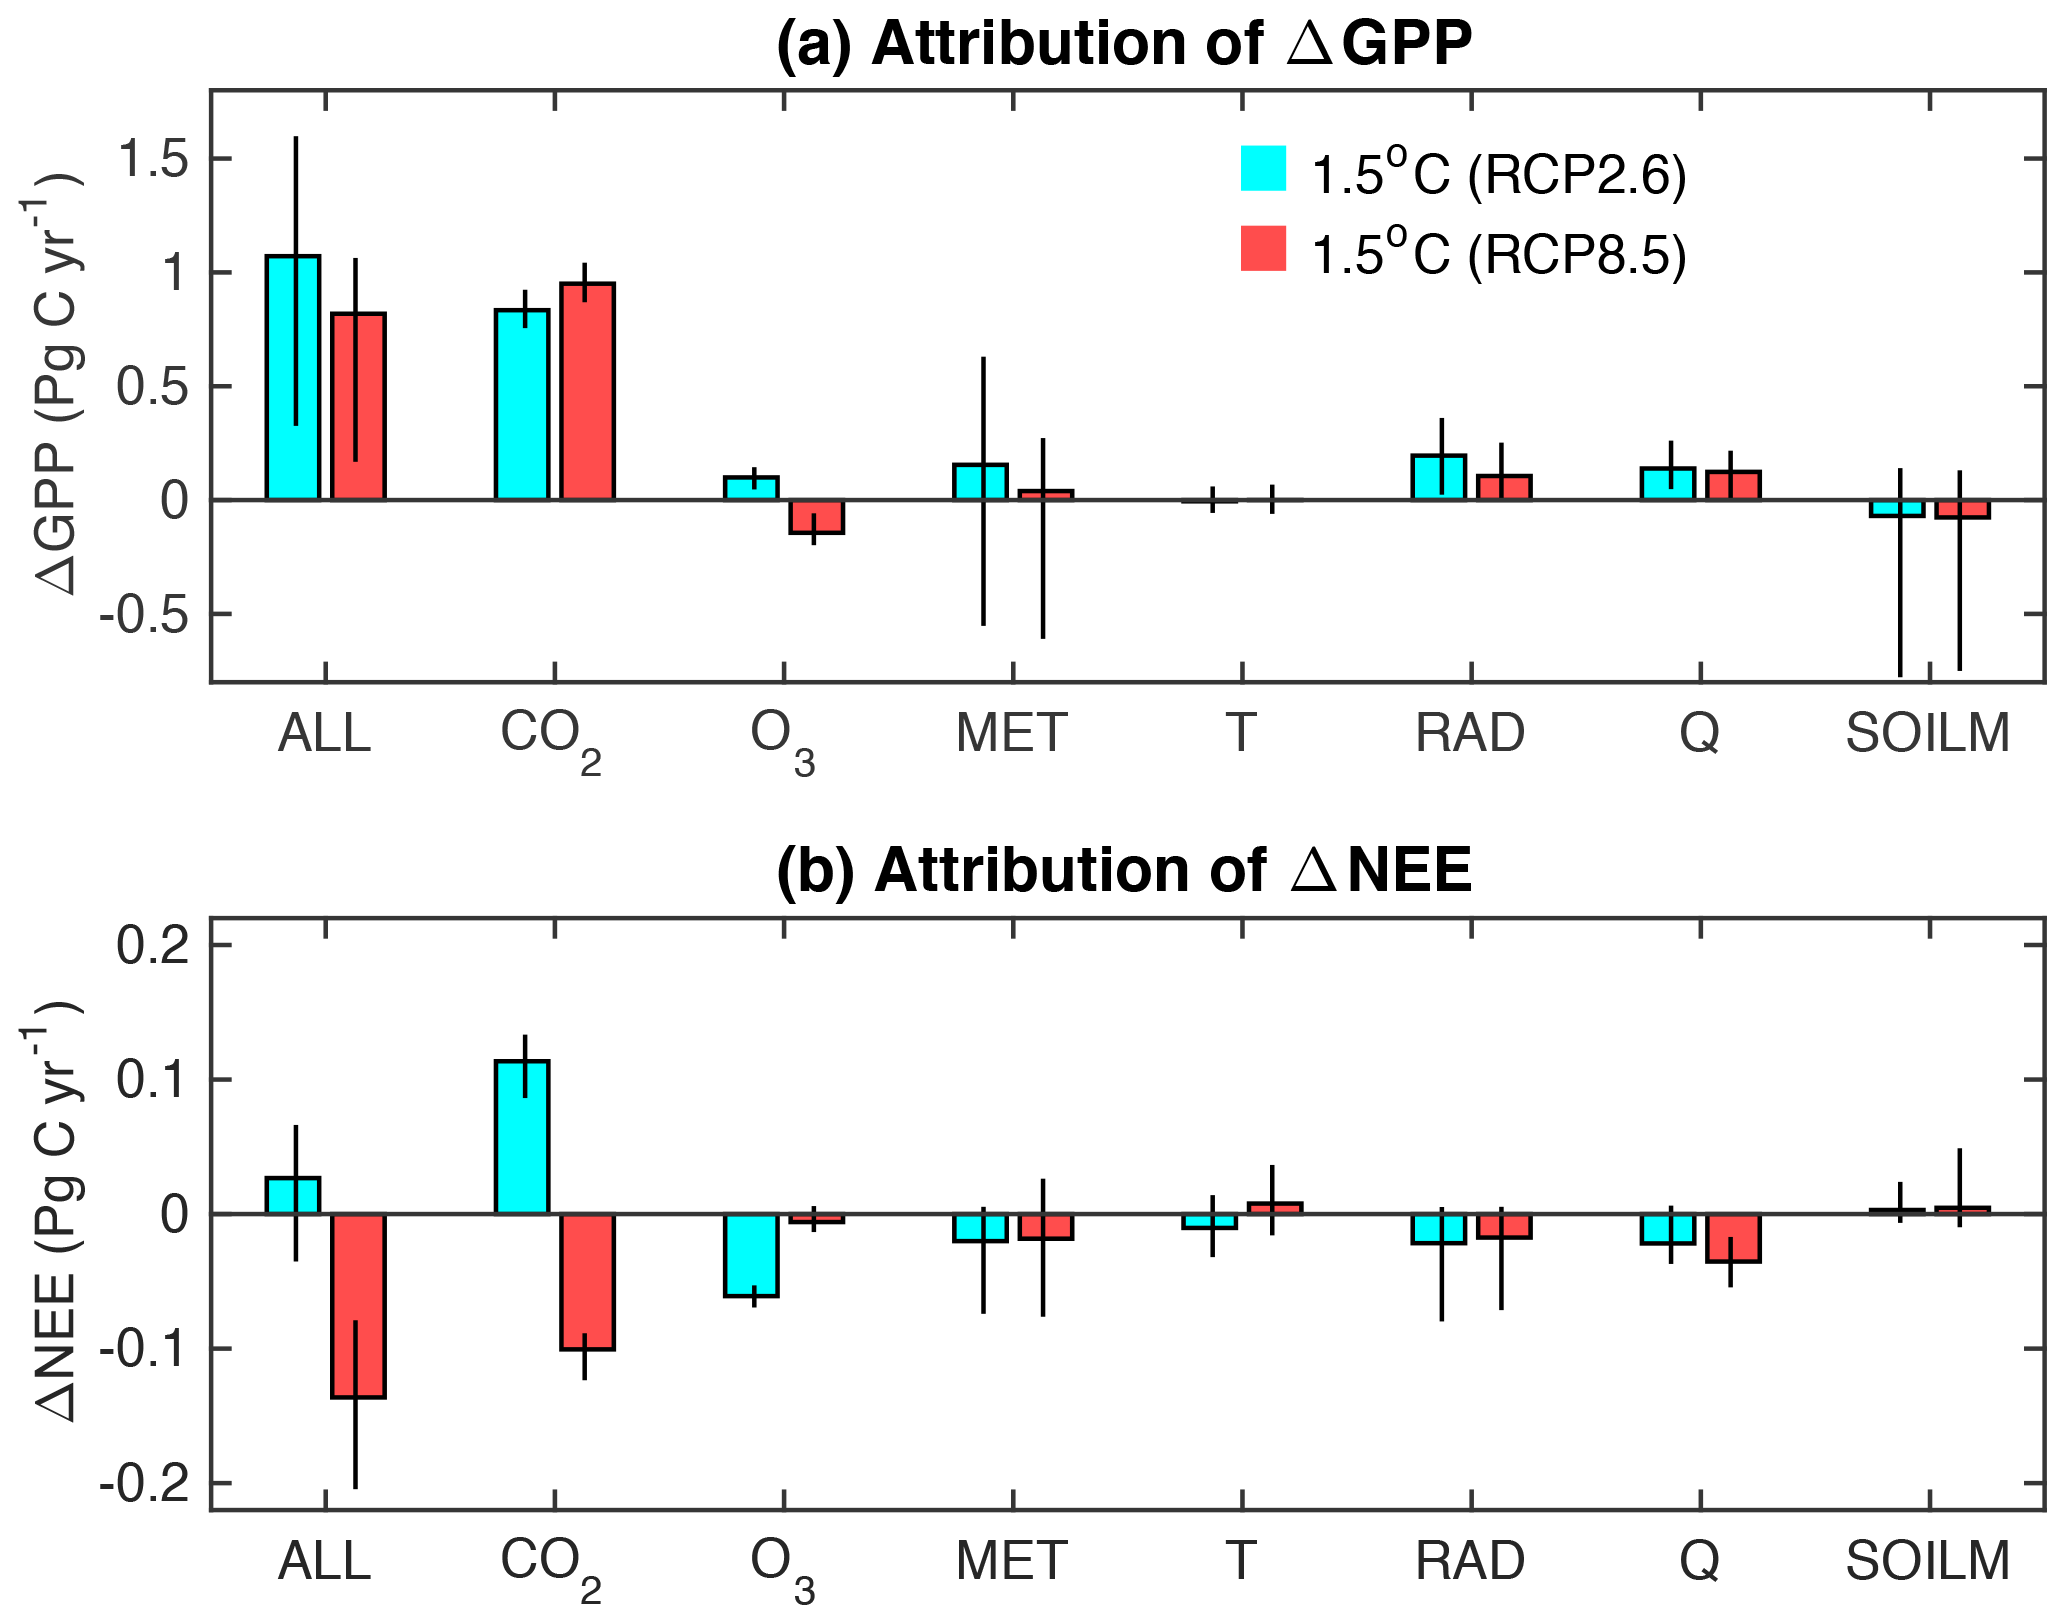
Figure 6Attribution of changes in GPP and NEE to individual driving factors. Results shown are the predicted GPP changes in China between the period of global warming of 1.5 ∘C and present day (1995–2015) caused by all (ALL) or individual driving factors, including CO2 fertilization, O3 damage, and meteorological changes (MET). The perturbations from meteorology is a combination of those of temperature (T), radiation (RAD), specific humidity (Q), and soil moisture (SOILM). The contrast is shown between the scenarios of RCP2.6 (blue, 2050–2070) and RCP8.5 (red, 2021–2041). The error bars indicate uncertainties of YIBs simulations using different future meteorology from seven CMIP5 models.
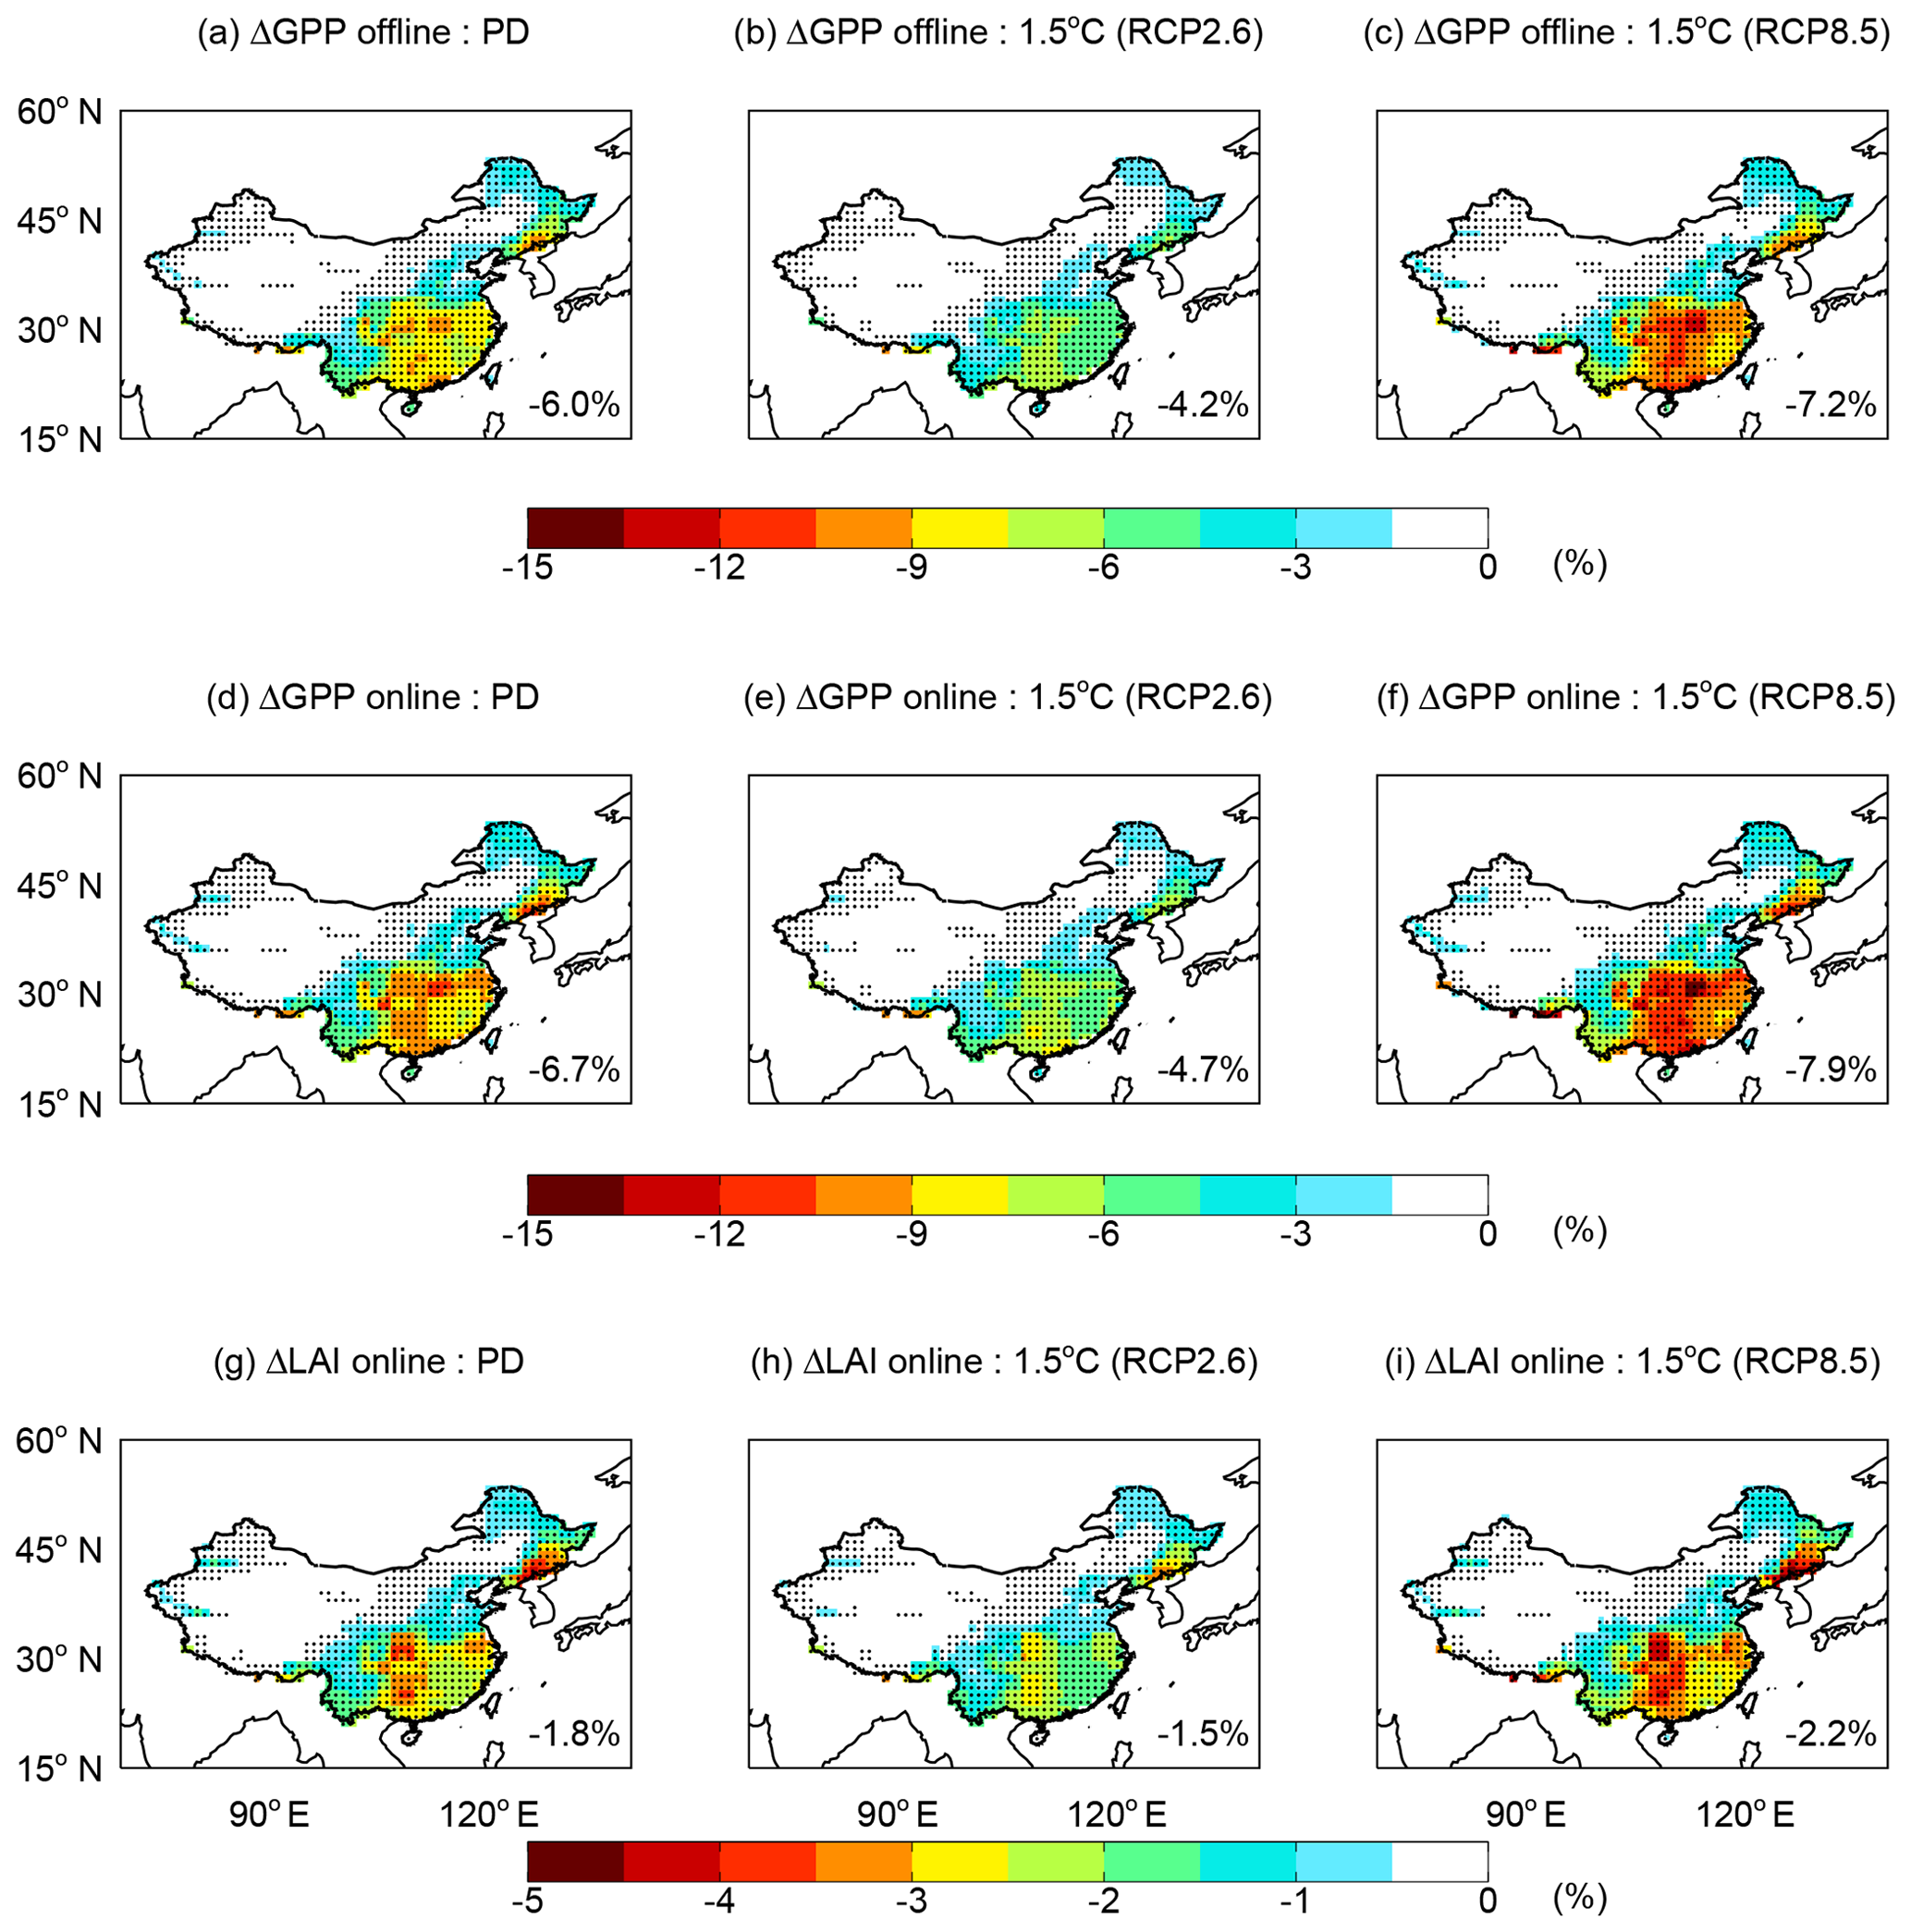
Figure 7Damaging effects of O3 to photosynthesis and plant growth. Results shown are ensemble mean changes in (a–c) offline GPP, (d–f) online GPP, and (g–i) leaf area index (LAI) caused by O3 in the (a, d, g) present day (1995–2015) and 1.5 ∘C warming under (b, e, h) RCP.6 (2050–2070) and (c, f, i) RCP8.5 (2021–2041) scenarios. The simulations are performed with the YIBs vegetation model driven with meteorology from 7 CMIP5 models and hourly ozone derived from 12 ACCMIP models. The damaging effect is averaged for high and low O3 sensitivities. For each grid, significant changes at p<0.05 are marked with dots. The mean changes over China are shown in each panel.
Ozone (O3) damages plant photosynthesis and the land carbon sink (Sitch et al., 2007; Yue and Unger, 2018). In the present day, O3 decreases GPP by 6.7±2.6 % (uncertainties ranging from low to high damaging sensitivities) in China (Fig. 7d), because of the direct inhibition of photosynthesis by 6±2.4 % (Fig. 7a) and the consequent reduction of 1.8±0.8 % in leaf area index (LAI, Fig. 7g). For 1.5 ∘C global warming, this weakening effect shows opposite tendencies in the two RCP scenarios, with a reduced GPP loss of 4.7±2.0 % in RCP2.6 (Fig. 7e) but an increased loss of 7.9±3.0 % in RCP8.5 (Fig. 7f). These impacts are predominantly driven by the variations of surface O3 concentrations in the two scenarios, as predicted O3 at 1.5 ∘C warming decreases by 15.2 % in the low-emission pathway but increases by 15.7 % in the high-emission pathway (Fig. 3b). Consequently, changes in O3 help increase GPP by 0.1±0.03 Pg C yr−1 in RCP2.6 but decrease GPP by 0.14±0.04 Pg C yr−1 in RCP8.5 for the same 1.5 ∘C warming. Following the benefits to GPP, the lower O3 decreases NEE (strengthens the sink) by 0.06±0.02 Pg C yr−1 in RCP2.6, offsetting more than half of the negative effect (weakening the sink) from CO2 (Fig. 6b). For RCP8.5, O3 impacts make limited contributions to ΔNEE.
Changes in meteorology account for the rest of the perturbations in the carbon fluxes. With global warming of 1.5 ∘C, the temperature in China increases by 0.90 ∘C for RCP2.6 and 0.91 ∘C for RCP8.5 (Fig. S12a and b) compared to the present-day climate. The spatial pattern of these changes is very similar without significant differences (Fig. S12c), leading to almost identical GPP responses (Figs. S8d and S9d). Generally, higher temperature is not beneficial for plant photosynthesis at low latitudes (Piao et al., 2013), where regional summer climate is already warmer than the optimal temperature threshold for leaf photosynthesis (Corlett, 2011). As a result, warming leads to negative changes in GPP over the east. Surface specific humidity exhibits widespread enhancement in eastern China (Fig. S13a and b). Air humidity may rise in a warmer climate because the corresponding enhancement of saturation pressure allows the atmosphere to hold more water vapor. On average, surface specific humidity increases by 0.34 g kg−1 in RCP2.6 and 0.31 g kg−1 in RCP8.5, leading to a promotion of GPP by 0.14 Pg C yr−1 in the former and a similar value of 0.12 Pg C yr−1 in the latter (Figs. S8e and S9e). Precipitation increases by 0.14 mm d−1 (4.6 %) over eastern China in RCP2.6 but decreases by 0.03 mm d−1 (1.2 %) in RCP8.5 (Fig. S12d and e), leading to higher soil moisture in eastern China for RCP2.6 (Fig. S13d and e). Nevertheless, most vegetation in eastern China is not water stressed, leaving moderate GPP responses to soil moisture changes in both RCP scenarios (Figs. S8f and S9f).
For the RCP2.6 scenario, the net effect of climate change causes an increase of 0.15 Pg C yr−1 in GPP with a range from −0.54 to 0.62 Pg C yr−1 (Fig. 6a). Such large variability in ΔGPP is related to the uncertainties in meteorology from different climate models. For RCP8.5, climate-induced GPP change is only 0.04 Pg C yr−1 with a range from −0.6 to 0.26 Pg C yr−1. The discrepancy of ΔGPP for the two pathways is mainly caused by the different radiation impacts, which enhance GPP by 0.2 Pg C yr−1 in RCP2.6 but only 0.11 Pg C yr−1 in RCP8.5 (Fig. 6a). Photosynthetically active radiation (PAR) is higher by 2.8 W m−2 in RCP2.6 than in RCP8.5 (Fig. 3c). The distinct changes in radiation are related to aerosol radiative effects, because global analyses also show radiation enhancement in regions (e.g., USA and Europe) with aerosol removal (Fig. S14). The lower AOD in RCP2.6 helps increase solar insolation at the surface by reducing light extinction (Yu et al., 2006), and promote precipitation with weaker aerosol semi-direct and indirect effects (Lohmann and Feichter, 2005). Although lower aerosols in RCP2.6 slightly decrease diffuse radiation (Fig. 3d), which is more efficient in increasing photosynthesis (Mercado et al., 2009; Yue and Unger, 2018), the overall enhancement in total radiation helps boost GPP. Climate-induced ΔNEE is −0.02 Pg C yr−1 (strengthened sink) for both pathways (Fig. 6b), resulting from comparable responses of NEE to changes in radiation (R=0.82), temperature (R=0.71), air humidity (R=0.91), and soil moisture (R=0.73) between the two pathways (Figs. S10 and S11).
3.4 Impacts on allowable carbon budget
For a warming target of 1.5 ∘C, our analyses suggest that a simultaneous reduction of CO2 and air pollution emissions enhances the efficiency of land carbon uptake compared to a pathway without air pollution emission control. The increased light availability from aerosol removal and decreased surface O3 jointly promote GPP in China by 0.3 Pg C yr−1, equivalent to 36 % of the CO2 fertilization. In contrast, air pollution results in a net GPP inhibition of 0.03 Pg C yr−1 under the high-emission pathway, suggesting a detrimental environment for plant health. Compared to RCP8.5, the timing of 1.5 ∘C warming is delayed by 30 years in RCP2.6, leading to weaker carbon sink in the latter. However, even with the longer period of accumulation, the total carbon loss by O3 damage is smaller by 3 %–16 % in RCP2.6 relative to RCP8.5 at the same warming level (Fig. 8a).
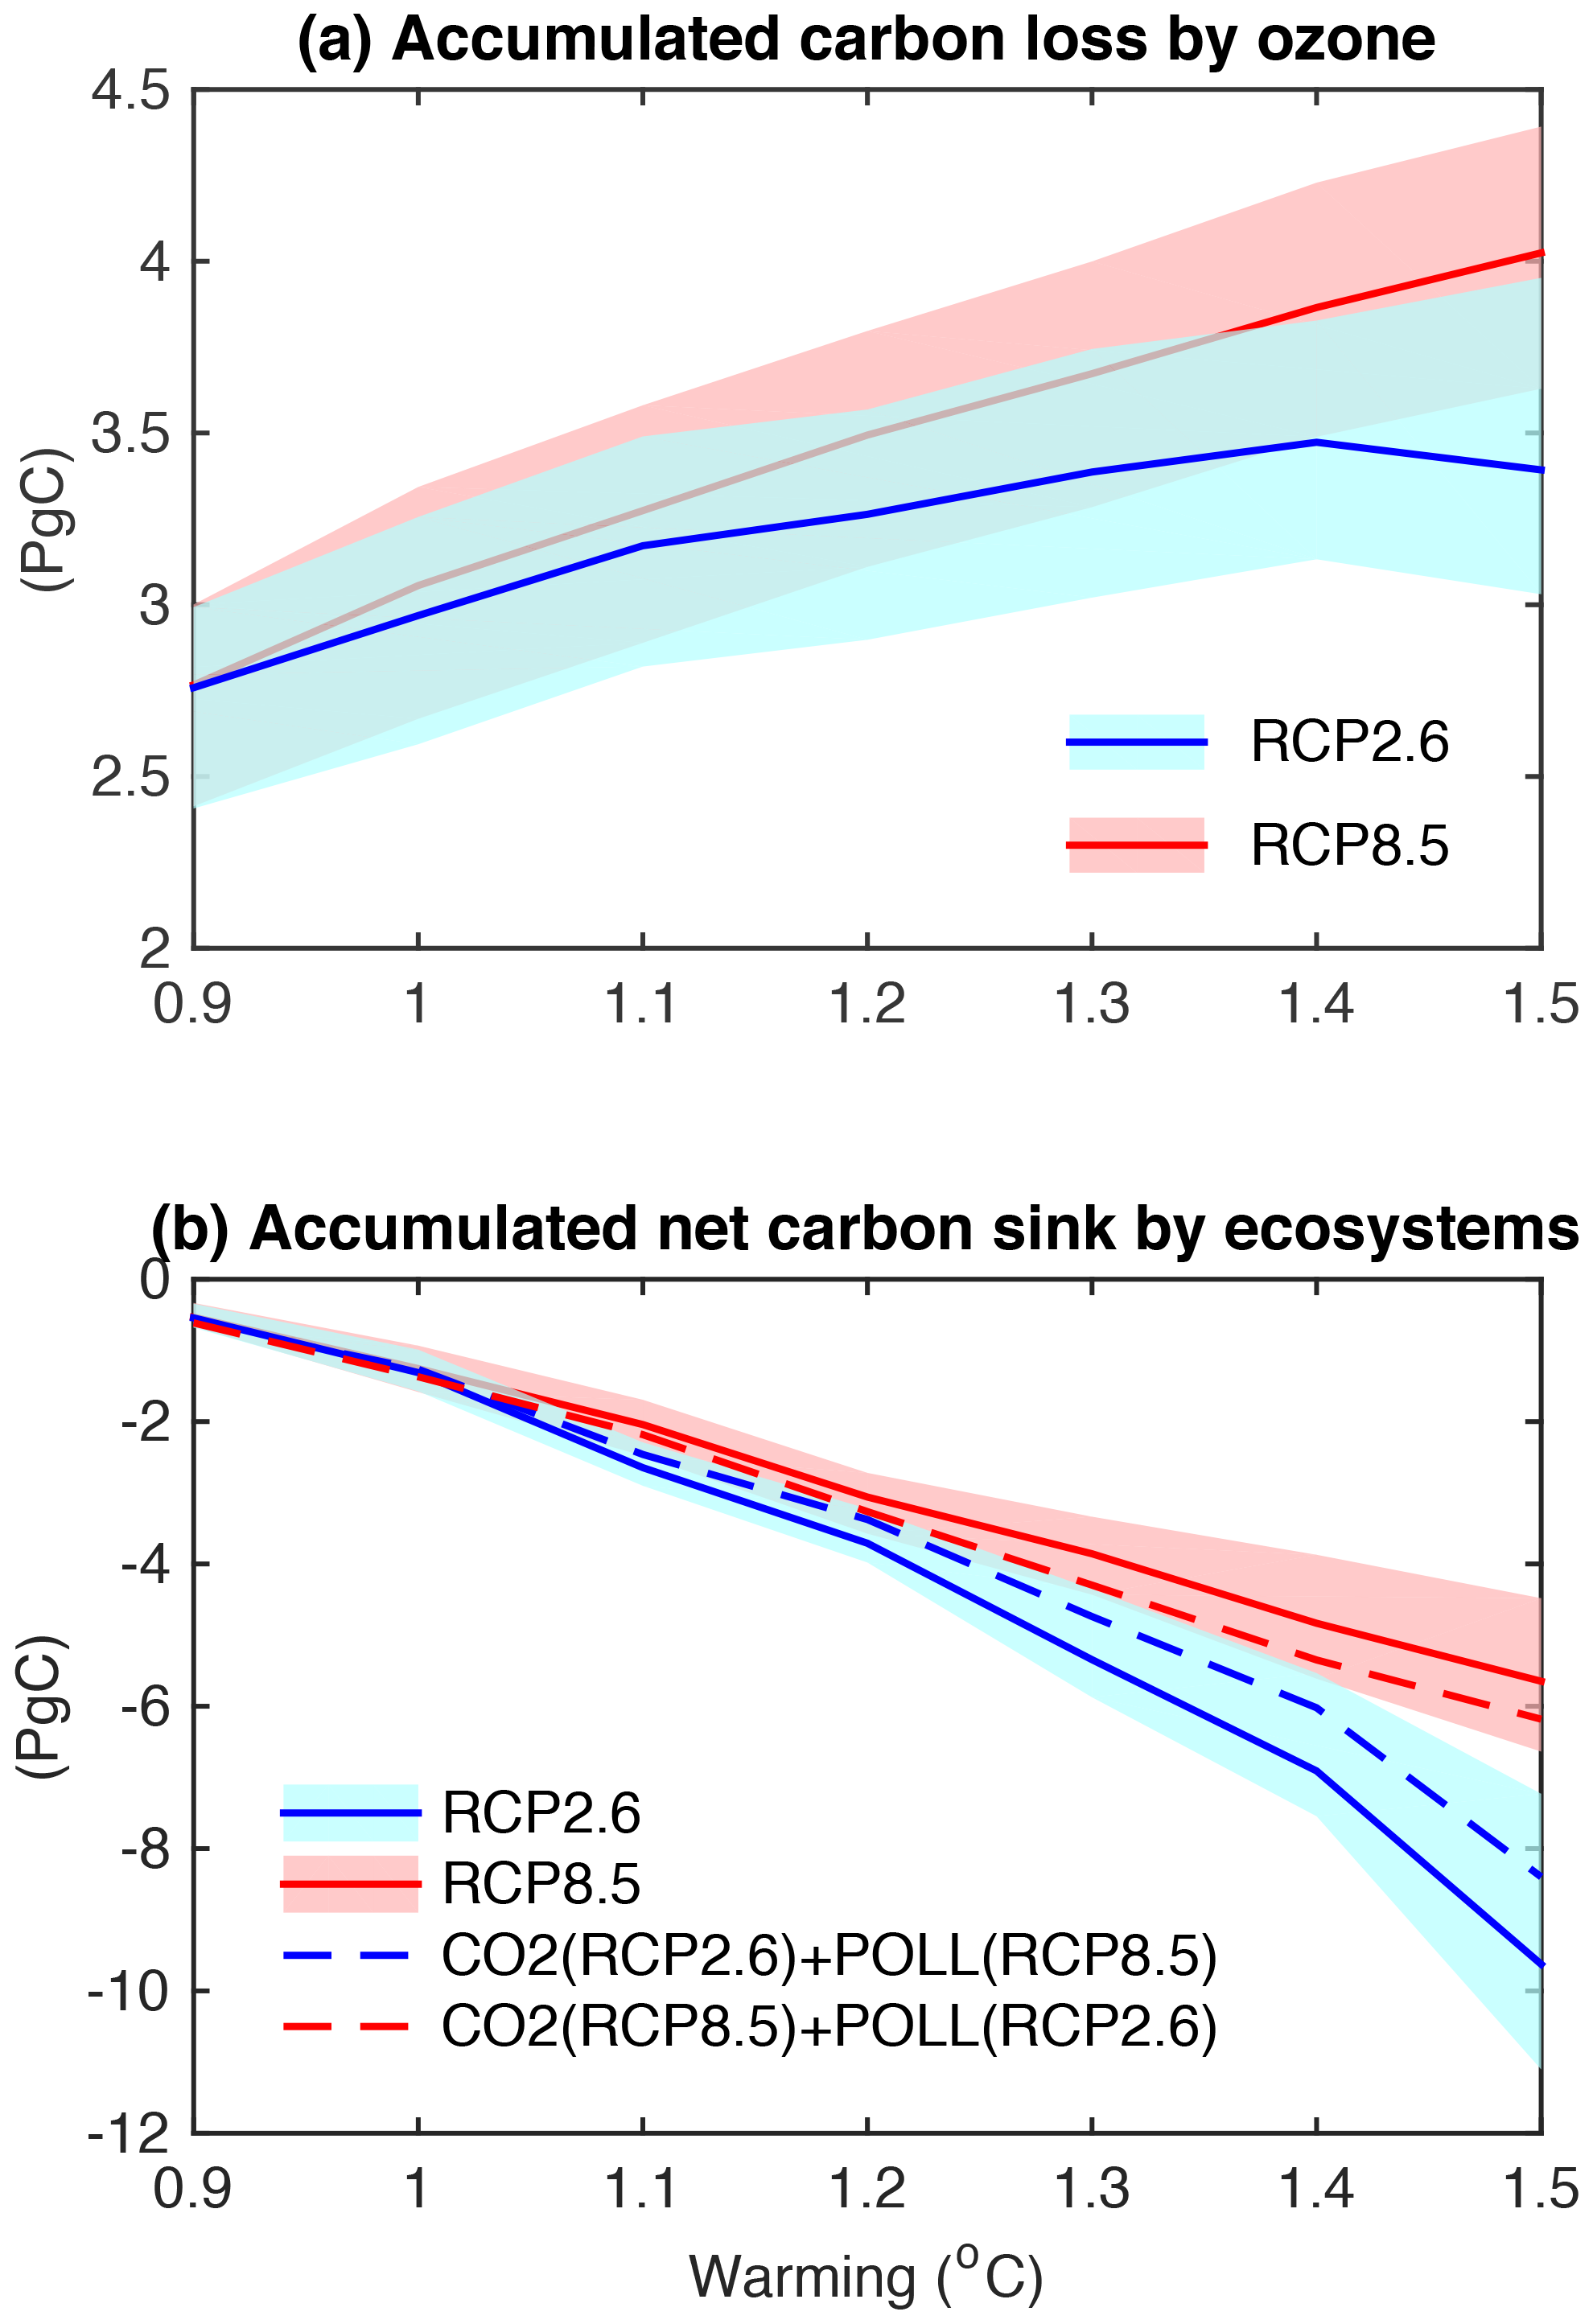
Figure 8Accumulated carbon budget in China under 1.5 ∘C global warming. (a) shows the total carbon loss of ecosystems caused by O3 damaging effects at different warming thresholds for two emission pathways. The bottom panel shows the accumulated net carbon sink by ecosystems in China at the 1.5 ∘C global warming. The two solid lines represent emissions of CO2 and pollutants from the same scenario, either RCP2.6 (blue) or RCP8.5 (red). The dashed lines represent sensitivity experiments with inconsistent CO2 and pollutants, with the blue (red) line driven with CO2 from RCP2.6 (RCP8.5) but air pollution from RCP8.5 (RCP2.6). The warming of 1.0 ∘C is the year 2010 for both RCP2.6 and RCP8.5 scenarios.
The slow warming increases the allowable cumulative anthropogenic carbon emissions. Assuming China's carbon emission fraction of 27 % of the world (the level at year 2017; Le Quéré et al., 2018), the total national emissions allowed are 80.4 Pg C in RCP2.6 and 71.9 Pg C in RCP8.5 from the year 2010 to the 1.5 ∘C warming, following the global emission rates defined for these scenarios. The ensemble simulations show that ecosystems in China help mitigate 8.5±1.1 Pg C in RCP2.6 and 4.5±0.6 Pg C in RCP8.5 (Fig. 8b). Sensitivity experiments with either reduced CO2 (but retaining high pollution) or reduced pollution (but retaining high CO2) reveal land carbon uptakes of 7.3±0.9 and 5.0±0.6 Pg C, respectively. These values are both lower than that in RCP2.6, suggesting that simultaneous control of carbon and air pollution emissions can maximize the mitigation potential of ecosystems. The higher ecosystem assimilation rate in a low-emission pathway (10.6±1.4 % in RCP2.6 vs. 6.3±0.8 % in RCP8.5) over China, which is not considered in CMIP5 models, further buffers the pace of warming to 1.5 ∘C.
Projection of future ecosystem productivity is subject to uncertainties in climate forcing and biophysical responses. The multi-model ensemble is a good approach to reduce the uncertainty in climate (Flato et al., 2013). In this study, we employ daily meteorology from seven CMIP5 models. A comparison with more CMIP5 models is performed (not shown) and confirms that the changes in meteorology from the seven selected climate models are robust and representative of future projections. As for ecosystem responses, future projections generally showed increasing GPP in China (Mu et al., 2008; Ji et al., 2008; Ju et al., 2007); however, climate change alone usually reduces productivity by inducing hot and drought conditions. In contrast, the YIBs simulations reveal a net positive effect of climate change on GPP though with large uncertainties (Fig. 6a). Such discrepancies are related to structural uncertainties across different vegetation models. Evaluations suggest that biophysical responses to environmental forcings in the YIBs model are generally reasonable as compared to the TRENDY ensemble (Fig. 4).
The YIBs simulations do not consider the nitrogen cycle and its limitation on carbon uptake. Inter-model comparisons show that models without nutrient constraints tend to overestimate GPP responses to CO2 fertilization (Smith et al., 2016). As a result, the difference of CO2 contributions in RCP scenarios would be smaller than predicted (Fig. 6a), suggesting that GPP enhancement in RCP2.6 might be even higher than RCP8.5 if the nitrogen cycle is included. In contrast, nitrogen deposition in RCP2.6 would be much smaller than that in RCP8.5 due to emission controls (Fig. S5), leading to lower nitrogen supply for the ecosystem in the former scenario. Consequently, plant photosynthesis is confronted with a stronger nutrient limit in RCP2.6 than that in RCP8.5, resulting in lower CO2 fertilization efficiency in the former scenario. The net effect of the nitrogen cycle on the land carbon cycle is very uncertain (Zaehle et al., 2014; Huntzinger et al., 2017; Xiao et al., 2015).
For a warming target of 1.5 ∘C, our analyses suggest that an associated reduction of CO2 and pollution emissions brings greater benefits to ecosystems in China than a pathway without emission controls. The slow changes of temperature and other environmental variables due to slow growth of CO2 are helpful for plant adaptation and limit biome shift (Warszawski et al., 2013), and the lower O3 and higher solar radiation from aerosol removal increase plant photosynthesis. Consequently, China's ecosystems mitigate 10.6±1.4 % of national emissions in the stabilized pathway, more efficient than the fraction of 6.3±0.8 % in the transient pathway, allowing for a larger carbon budget for economic development.
Data used in this study can be provided upon request by contacting the corresponding author, Xu Yue (yuexu@nuist.edu.cn). Due to limited disk space, simulation results used for analyses (up to 2 TB) will be removed one year after publication.
The supplement related to this article is available online at: https://doi.org/10.5194/acp-20-2353-2020-supplement.
XY, HL, and HW designed the research and wrote the manuscript. XY downloaded CMIP5 data, set up models, and performed all simulations. TZ evaluated diffuse radiation models. NU provided ACCMIP data. SS provided TRENDY data. ZF provided O3 damage meta-analysis data in China. JY analyzed TRENDY results over China. All authors contributed to the interpretation of the results and improvement of the paper.
The authors declare that they have no conflict of interest.
This work is supported by the National Key Research and Development Program of China (grant no. 2017YFA0603802) and National Natural Science Foundation of China (grant nos. 91744311 and 41975155).
This paper was edited by Alex B. Guenther and reviewed by two anonymous referees.
Ainsworth, E. A. and Long, S. P.: What have we learned from 15 years of free-air CO2 enrichment (FACE)? A meta-analytic review of the responses of photosynthesis, canopy, New Phytol., 165, 351–371, https://doi.org/10.1111/J.1469-8137.2004.01224.X, 2005.
Burke, M., Davis, W. M., and Diffenbaugh, N. S.: Large potential reduction in economic damages under UN mitigation targets, Nature, 557, 549–553, https://doi.org/10.1038/s41586-018-0071-9, 2018.
Clark, D. B., Mercado, L. M., Sitch, S., Jones, C. D., Gedney, N., Best, M. J., Pryor, M., Rooney, G. G., Essery, R. L. H., Blyth, E., Boucher, O., Harding, R. J., Huntingford, C., and Cox, P. M.: The Joint UK Land Environment Simulator (JULES), model description – Part 2: Carbon fluxes and vegetation dynamics, Geosci. Model Dev., 4, 701–722, https://doi.org/10.5194/gmd-4-701-2011, 2011.
Collins, W. J., Webber, C. P., Cox, P. M., Huntingford, C., Lowe, J., Sitch, S., Chadburn, S. E., Comyn-Platt, E., Harper, A. B., Hayman, G., and Powell, T.: Increased importance of methane reduction for a 1.5 degree target, Environ. Res. Lett., 13, 054003, https://doi.org/10.1088/1748-9326/aab89c, 2018.
Corlett, R. T.: Impacts of warming on tropical lowland rainforests, Trends Ecol. Evol., 26, 606–613, https://doi.org/10.1016/j.tree.2011.06.015, 2011.
Dai, E. F., Wu, Z., Ge, Q. S., Xi, W. M., and Wang, X. F.: Predicting the responses of forest distribution and aboveground biomass to climate change under RCP scenarios in southern China, Global Change Biol., 22, 3642–3661, https://doi.org/10.1111/gcb.13307, 2016.
Defries, R. S., Hansen, M. C., Townshend, J. R. G., Janetos, A. C., and Loveland, T. R.: A new global 1-km dataset of percentage tree cover derived from remote sensing, Global Change Biol., 6, 247–254, https://doi.org/10.1046/J.1365-2486.2000.00296.X, 2000.
Fang, J. Y., Guo, Z. D., Piao, S. L., and Chen, A. P.: Terrestrial vegetation carbon sinks in China, 1981–2000, Sci. China Ser. D, 50, 1341–1350, https://doi.org/10.1007/s11430-007-0049-1, 2007.
Fang, J. Y., Shen, Z. H., Tang, Z. Y., Wang, X. P., Wang, Z. H., Feng, J. M., Liu, Y. N., Qiao, X. J., Wu, X. P., and Zheng, C. Y.: Forest community survey and the structural characteristics of forests in China, Ecography, 35, 1059–1071, https://doi.org/10.1111/j.1600-0587.2013.00161.x, 2012.
Farquhar, G. D., Caemmerer, S. V., and Berry, J. A.: A Biochemical-Model of Photosynthetic Co2 Assimilation in Leaves of C-3 Species, Planta, 149, 78–90, https://doi.org/10.1007/Bf00386231, 1980.
Flato, G., Marotzke, J., Abiodun, B., Braconnot, P., Chou, S. C., Collins, W., Cox, P., Driouech, F., Emori, S., Eyring, V., Forest, C., Gleckler, P., Guilyardi, E., Jakob, C., Kattsov, V., Reason, C., and Rummukainen, M.: Evaluation of Climate Models, in: Climate Change 2013: The Physical Science Basis, Contribution of Working Group I to the Fifth Assessment Report of the Intergovernmental Panel on Climate Change, edited by: Stocker, T. F., Qin, D., Plattner, G. K., Tignor, M., Allen, S. K., Boschung, J., Nauels, A., Xia, Y., Bex, V., and Midgley, P. M., Cambridge University Press, Cambridge, UK and New York, NY, USA, 2013.
Ghosh, A., Norton, B., and Duffy, A.: Effect of sky clearness index on transmission of evacuated (vacuum) glazing, Renew. Energy, 105, 160–166, https://doi.org/10.1016/j.renene.2016.12.056, 2017.
Hansen, M. C., DeFries, R. S., Townshend, J. R. G., Carroll, M., Dimiceli, C., and Sohlberg, R. A.: Global Percent Tree Cover at a Spatial Resolution of 500 Meters: First Results of the MODIS Vegetation Continuous Fields Algorithm, Earth Interact., 7, 1–15, https://doi.org/10.1175/1087-3562(2003)007<0001:GPTCAA>2.0.CO;2, 2003.
He, N. P., Wen, D., Zhu, J. X., Tang, X. L., Xu, L., Zhang, L., Hu, H. F., Huang, M., and Yu, G. R.: Vegetation carbon sequestration in Chinese forests from 2010 to 2050, Global Change Biol., 23, 1575–1584, https://doi.org/10.1111/gcb.13479, 2017.
Henley, B. J. and King, A. D.: Trajectories toward the 1.5 degrees C Paris target: Modulation by the Interdecadal Pacific Oscillation, Geophys. Res. Lett., 44, 4256–4262, https://doi.org/10.1002/2017gl073480, 2017.
Huntzinger, D. N., Michalak, A. M., Schwalm, C., Ciais, P., King, A. W., Fang, Y., Schaefer, K., Wei, Y., Cook, R. B., Fisher, J. B., Hayes, D., Huang, M., Ito, A., Jain, A. K., Lei, H., Lu, C., Maignan, F., Mao, J., Parazoo, N., Peng, S., Poulter, B., Ricciuto, D., Shi, X., Tian, H., Wang, W., Zeng, N., and Zhao, F.: Uncertainty in the response of terrestrial carbon sink to environmental drivers undermines carbon-climate feedback predictions, Scient. Rep., 7, 4765, https://doi.org/10.1038/s41598-017-03818-2, 2017.
James, R., Washington, R., Schleussner, C. F., Rogelj, J., and Conway, D.: Characterizing half-a-degree difference: a review of methods for identifying regional climate responses to global warming targets, Wires Clim. Change, 8, e457, https://doi.org/10.1002/wcc.457, 2017.
Ji, J. J., Huang, M., and Li, K. R.: Prediction of carbon exchanges between China terrestrial ecosystem and atmosphere in 21st century, Sci. China Ser. D, 51, 885–898, https://doi.org/10.1007/s11430-008-0039-y, 2008.
Ju, W. M., Chen, J. M., Harvey, D., and Wang, S.: Future carbon balance of China's forests under climate change and increasing CO2, J. Environ. Manage., 85, 538–562, https://doi.org/10.1016/j.jenvman.2006.04.028, 2007.
Jung, M., Reichstein, M., and Bondeau, A.: Towards global empirical upscaling of FLUXNET eddy covariance observations: validation of a model tree ensemble approach using a biosphere model, Biogeosciences, 6, 2001–2013, https://doi.org/10.5194/bg-6-2001-2009, 2009.
Lam, J. C. and Li, D. H. W.: Correlation between global solar radiation and its direct and diffuse components, Build. Environ., 31, 527–535, https://doi.org/10.1016/0360-1323(96)00026-1, 1996.
Lamarque, J. F., Shindell, D. T., Josse, B., Young, P. J., Cionni, I., Eyring, V., Bergmann, D., Cameron-Smith, P., Collins, W. J., Doherty, R., Dalsoren, S., Faluvegi, G., Folberth, G., Ghan, S. J., Horowitz, L. W., Lee, Y. H., MacKenzie, I. A., Nagashima, T., Naik, V., Plummer, D., Righi, M., Rumbold, S. T., Schulz, M., Skeie, R. B., Stevenson, D. S., Strode, S., Sudo, K., Szopa, S., Voulgarakis, A., and Zeng, G.: The Atmospheric Chemistry and Climate Model Intercomparison Project (ACCMIP): overview and description of models, simulations and climate diagnostics, Geosci. Model Dev., 6, 179–206, https://doi.org/10.5194/gmd-6-179-2013, 2013.
Le Quéré, C., Andrew, R. M., Friedlingstein, P., Sitch, S., Pongratz, J., Manning, A. C., Korsbakken, J. I., Peters, G. P., Canadell, J. G., Jackson, R. B., Boden, T. A., Tans, P. P., Andrews, O. D., Arora, V. K., Bakker, D. C. E., Barbero, L., Becker, M., Betts, R. A., Bopp, L., Chevallier, F., Chini, L. P., Ciais, P., Cosca, C. E., Cross, J., Currie, K., Gasser, T., Harris, I., Hauck, J., Haverd, V., Houghton, R. A., Hunt, C. W., Hurtt, G., Ilyina, T., Jain, A. K., Kato, E., Kautz, M., Keeling, R. F., Goldewijk, K. K., Kortzinger, A., Landschutzer, P., Lefevre, N., Lenton, A., Lienert, S., Lima, I., Lombardozzi, D., Metzl, N., Millero, F., Monteiro, P. M. S., Munro, D. R., Nabel, J. E. M. S., Nakaoka, S., Nojiri, Y., Padin, X. A., Peregon, A., Pfeil, B., Pierrot, D., Poulter, B., Rehder, G., Reimer, J., Rodenbeck, C., Schwinger, J., Seferian, R., Skjelvan, I., Stocker, B. D., Tian, H. Q., Tilbrook, B., Tubiello, F. N., van der Laan-Luijkx, I. T., van der Werf, G. R., van Heuven, S., Viovy, N., Vuichard, N., Walker, A. P., Watson, A. J., Wiltshire, A. J., Zaehle, S., and Zhu, D.: Global Carbon Budget 2017, Earth Syst. Sci. Data, 10, 405–448, https://doi.org/10.5194/essd-10-405-2018,2018.
Lohmann, U. and Feichter, J.: Global indirect aerosol effects: a review, Atmos. Chem. Phys., 5, 715–737, https://doi.org/10.5194/acp-5-715-2005, 2005.
Mann, M. E., Miller, S. K., Rahmstorf, S., Steinman, B. A., and Tingley, M.: Record temperature streak bears anthropogenic fingerprint, Geophys. Res. Lett., 44, 7936–7944, https://doi.org/10.1002/2017gl074056, 2017.
Meinshausen, M., Smith, S. J., Calvin, K., Daniel, J. S., Kainuma, M. L. T., Lamarque, J. F., Matsumoto, K., Montzka, S. A., Raper, S. C. B., Riahi, K., Thomson, A., Velders, G. J. M., and van Vuuren, D. P. P.: The RCP greenhouse gas concentrations and their extensions from 1765 to 2300, Climatic Change, 109, 213–241, https://doi.org/10.1007/S10584-011-0156-Z, 2011.
Mengis, N., Partanen, A.-I., Jalbert, J., and Matthews, H. D.: 1.5 ∘C carbon budget dependent on carbon cycle uncertainty and future non-CO2 forcing, Scient. Rep., 8, 5831, https://doi.org/10.1038/s41598-018-24241-1, 2018.
Mercado, L. M., Bellouin, N., Sitch, S., Boucher, O., Huntingford, C., Wild, M., and Cox, P. M.: Impact of changes in diffuse radiation on the global land carbon sink, Nature, 458, 1014–1087, https://doi.org/10.1038/Nature07949, 2009.
Millar, R. J., Fuglestvedt, J. S., Friedlingstein, P., Rogelj, J., Grubb, M. J., Matthews, H. D., Skeie, R. B., Forster, P. M., Frame, D. J., and Allen, A. R.: Emission budgets and pathways consistent with limiting warming to 1.5 degrees C, Nat. Geosci., 10, 741–747, https://doi.org/10.1038/Ngeo3031, 2017.
Mitchell, D., Heaviside, C., Schaller, N., Allen, M., Ebi, K. L., Fischer, E. M., Gasparrini, A., Harrington, L., Kharin, V., Shiogama, H., Sillmann, J., Sippel, S., and Vardoulakis, S.: Extreme heat-related mortality avoided under Paris Agreement goals, Nat. Clim. Change, 8, 551–553, https://doi.org/10.1038/s41558-018-0210-1, 2018.
Mu, Q. Z., Zhao, M. S., Running, S. W., Liu, M. L., and Tian, H. Q.: Contribution of increasing CO2 and climate change to the carbon cycle in China's ecosystems, J. Geophys. Res.-Biogeo., 113, G01018, https://doi.org/10.1029/2006jg000316, 2008.
Nangombe, S., Zhou, T., Zhang, W., Wu, B., Hu, S., Zou, L., and Li, D.: Record-breaking climate extremes in Africa under stabilized 1.5 ∘C and 2 ∘C global warming scenarios, Nat. Clim. Change, 8, 375–380, https://doi.org/10.1038/s41558-018-0145-6, 2018.
Piao, S. L., Fang, J. Y., Ciais, P., Peylin, P., Huang, Y., Sitch, S., and Wang, T.: The carbon balance of terrestrial ecosystems in China, Nature, 458, 1009–1082, https://doi.org/10.1038/nature07944, 2009.
Piao, S. L., Sitch, S., Ciais, P., Friedlingstein, P., Peylin, P., Wang, X. H., Ahlstrom, A., Anav, A., Canadell, J. G., Cong, N., Huntingford, C., Jung, M., Levis, S., Levy, P. E., Li, J. S., Lin, X., Lomas, M. R., Lu, M., Luo, Y. Q., Ma, Y. C., Myneni, R. B., Poulter, B., Sun, Z. Z., Wang, T., Viovy, N., Zaehle, S., and Zeng, N.: Evaluation of terrestrial carbon cycle models for their response to climate variability and to CO2 trends, Global Change Biol., 19, 2117–2132, https://doi.org/10.1111/Gcb.12187, 2013.
Rienecker, M. M., Suarez, M. J., Gelaro, R., Todling, R., Bacmeister, J., Liu, E., Bosilovich, M. G., Schubert, S. D., Takacs, L., Kim, G. K., Bloom, S., Chen, J. Y., Collins, D., Conaty, A., Da Silva, A., Gu, W., Joiner, J., Koster, R. D., Lucchesi, R., Molod, A., Owens, T., Pawson, S., Pegion, P., Redder, C. R., Reichle, R., Robertson, F. R., Ruddick, A. G., Sienkiewicz, M., and Woollen, J.: MERRA: NASA's Modern-Era Retrospective Analysis for Research and Applications, J. Climate, 24, 3624–3648, https://doi.org/10.1175/Jcli-D-11-00015.1, 2011.
Schaefer, K., Collatz, G. J., Tans, P., Denning, A. S., Baker, I., Berry, J., Prihodko, L., Suits, N., and Philpott, A.: Combined Simple Biosphere/Carnegie-Ames-Stanford Approach terrestrial carbon cycle model, J. Geophys. Res., 113, G03034, https://doi.org/10.1029/2007jg000603, 2008.
Schmidt, G. A., Kelley, M., Nazarenko, L., Ruedy, R., Russell, G. L., Aleinov, I., Bauer, M., Bauer, S. E., Bhat, M. K., Bleck, R., Canuto, V., Chen, Y. H., Cheng, Y., Clune, T. L., Del Genio, A., de Fainchtein, R., Faluvegi, G., Hansen, J. E., Healy, R. J., Kiang, N. Y., Koch, D., Lacis, A. A., LeGrande, A. N., Lerner, J., Lo, K. K., Matthews, E. E., Menon, S., Miller, R. L., Oinas, V., Oloso, A. O., Perlwitz, J. P., Puma, M. J., Putman, W. M., Rind, D., Romanou, A., Sato, M., Shindell, D. T., Sun, S., Syed, R. A., Tausnev, N., Tsigaridis, K., Unger, N., Voulgarakis, A., Yao, M. S., and Zhang, J. L.: Configuration and assessment of the GISS ModelE2 contributions to the CMIP5 archive, J. Adv. Model. Earth Syst., 6, 141–184, https://doi.org/10.1002/2013ms000265, 2014.
Sitch, S., Cox, P. M., Collins, W. J., and Huntingford, C.: Indirect radiative forcing of climate change through ozone effects on the land-carbon sink, Nature, 448, 791–794, https://doi.org/10.1038/Nature06059, 2007.
Smith, W. K., Reed, S. C., Cleveland, C. C., Ballantyne, A. P., Anderegg, W. R. L., Wieder, W. R., Liu, Y. Y., and Running, S. W.: Large divergence of satellite and Earth system model estimates of global terrestrial CO2 fertilization, Nat. Clim. Change, 6, 306–310, https://doi.org/10.1038/Nclimate2879, 2016.
Solomon, S., Plattner, G.-K., Knutti, R., and Friedlingstein, P.: Irreversible climate change due to carbon dioxide emissions, P. Natl. Acad. Sci. USA, 106, 1704–1709, https://doi.org/10.1073/pnas.0812721106, 2009.
Spitters, C. J. T.: Separating the Diffuse and Direct Component of Global Radiation and Its Implications for Modeling Canopy Photosynthesis. 2. Calculation of Canopy Photosynthesis, Agr. Forest Meteorol., 38, 231–242, https://doi.org/10.1016/0168-1923(86)90061-4, 1986.
Stehfest, E., v. Zeist, W.-J., Valin, H., Havlik, P., Popp, A., Kyle, P., Tabeau, A., Mason-D'Croz, D., Hasegawa, T., Bodirsky, B. L., Calvin, K., Doelman, J. C., Fujimori, S., Humpenöder, F., Lotze-Campen, H., v. Meijl, H., and Wiebe, K.: Key determinants of global land-use projections, Nat. Commun., 10, 2166, https://doi.org/10.1038/s41467-019-09945-w, 2019.
Tian, H. Q., Xu, X. F., Lu, C. Q., Liu, M. L., Ren, W., Chen, G. S., Melillo, J., and Liu, J. Y.: Net exchanges of CO2, CH4, and N2O between China's terrestrial ecosystems and the atmosphere and their contributions to global climate warming, J. Geophys. Res., 116, G02011, https://doi.org/10.1029/2010jg001393, 2011.
Warszawski, L., Friend, A., Ostberg, S., Frieler, K., Lucht, W., Schaphoff, S., Beerling, D., Cadule, P., Ciais, P., Clark, D. B., Kahana, R., Ito, A., Keribin, R., Kleidon, A., Lomas, M., Nishina, K., Pavlick, R., Rademacher, T. T., Buechner, M., Piontek, F., Schewe, J., Serdeczny, O., and Schellnhuber, H. J.: A multi-model analysis of risk of ecosystem shifts under climate change, Environ. Res. Lett., 8, 044018, https://doi.org/10.1088/1748-9326/8/4/044018, 2013.
Weedon, G. P., Balsamo, G., Bellouin, N., Gomes, S., Best, M. J., and Viterbo, P.: The WFDEI meteorological forcing data set: WATCH Forcing Data methodology applied to ERA-Interim reanalysis data, Water Resour. Res., 50, 7505–7514, https://doi.org/10.1002/2014wr015638, 2014.
Wu, S., Yin, Y., Zhao, D., Huang, M., Shao, X., and Dai, E.: Impact of future climate change on terrestrial ecosystems in China, Int. J. Climatol., 30, 866–873, https://doi.org/10.1002/joc.1938, 2009.
Xiao, J. F., Zhou, Y., and Zhang, L.: Contributions of natural and human factors to increases in vegetation productivity in China, Ecosphere, 6, 233, https://doi.org/10.1890/Es14-00394.1, 2015.
Yao, Y. T., Wang, X. H., Li, Y., Wang, T., Shen, M. G., Du, M. Y., He, H. L., Li, Y. N., Luo, W. J., Ma, M. G., Ma, Y. M., Tang, Y. H., Wang, H. M., Zhang, X. Z., Zhang, Y. P., Zhao, L., Zhou, G. S., and Piao, S. L.: Spatiotemporal pattern of gross primary productivity and its covariation with climate in China over the last thirty years, Global Change Biol., 24, 184–196, https://doi.org/10.1111/gcb.13830, 2018.
Yu, H., Kaufman, Y. J., Chin, M., Feingold, G., Remer, L. A., Anderson, T. L., Balkanski, Y., Bellouin, N., Boucher, O., Christopher, S., DeCola, P., Kahn, R., Koch, D., Loeb, N., Reddy, M. S., Schulz, M., Takemura, T., and Zhou, M.: A review of measurement-based assessments of the aerosol direct radiative effect and forcing, Atmos. Chem. Phys., 6, 613–666, https://doi.org/10.5194/acp-6-613-2006, 2006.
Yue, X. and Unger, N.: The Yale Interactive terrestrial Biosphere model: description, evaluation and implementation into NASA GISS ModelE2, Geosci. Model Dev., 8, 2399–2417, https://doi.org/10.5194/gmd-8-2399-2015, 2015.
Yue, X. and Unger, N.: Aerosol optical depth thresholds as a tool to assess diffuse radiation fertilization of the land carbon uptake in China, Atmos. Chem. Phys., 17, 1329–1342, https://doi.org/10.5194/acp-17-1329-2017, 2017.
Yue, X. and Unger, N.: Fire air pollution reduces global terrestrial productivity, Nat. Commun., 9, 5413, https://doi.org/10.1038/s41467-018-07921-4, 2018.
Yue, X., Unger, N., Harper, K., Xia, X., Liao, H., Zhu, T., Xiao, J., Feng, Z., and Li, J.: Ozone and haze pollution weakens net primary productivity in China, Atmos. Chem. Phys., 17, 6073–6089, https://doi.org/10.5194/acp-17-6073-2017, 2017.
Zaehle, S., Medlyn, B. E., De Kauwe, M. G., Walker, A. P., Dietze, M. C., Hickler, T., Luo, Y. Q., Wang, Y. P., El-Masri, B., Thornton, P., Jain, A., Wang, S. S., Warlind, D., Weng, E. S., Parton, W., Iversen, C. M., Gallet-Budynek, A., McCarthy, H., Finzi, A. C., Hanson, P. J., Prentice, I. C., Oren, R., and Norby, R. J.: Evaluation of 11 terrestrial carbon-nitrogen cycle models against observations from two temperate Free-Air CO2 Enrichment studies, New Phytol., 202, 803–822, https://doi.org/10.1111/Nph.12697, 2014.