the Creative Commons Attribution 4.0 License.
the Creative Commons Attribution 4.0 License.
 | 11 Sep 2020
The impact of ship emissions on air quality and human health in the Gothenburg area – Part II: Scenarios for 2040
Martin O. P. Ramacher
Lin Tang
Jana Moldanová
Volker Matthias
Matthias Karl
Erik Fridell
Lasse Johansson
Shipping is an important source of air pollutants, from the global to the local scale. Ships emit substantial amounts of sulfur dioxides, nitrogen dioxides, and particulate matter in the vicinity of coasts, threatening the health of the coastal population, especially in harbour cities. Reductions in emissions due to shipping have been targeted by several regulations. Nevertheless, effects of these regulations come into force with temporal delays, global ship traffic is expected to grow in the future, and other land-based anthropogenic emissions might decrease. Thus, it is necessary to investigate combined impacts to identify the impact of shipping activities on air quality, population exposure, and health effects in the future.
We investigated the future effect of shipping emissions on air quality and related health effects considering different scenarios of the development of shipping under current regional trends of economic growth and already decided regulations in the Gothenburg urban area in 2040. Additionally, we investigated the impact of a large-scale implementation of shore electricity in the Port of Gothenburg. For this purpose, we established a one-way nested chemistry transport modelling (CTM) system from the global to the urban scale, to calculate pollutant concentrations, population-weighted concentrations, and health effects related to NO2, PM2.5, and O3.
The simulated concentrations of NO2 and PM2.5 in future scenarios for the year 2040 are in general very low with up to 4 ppb for NO2 and up to 3.5 µg m−3 PM2.5 in the urban areas which are not close to the port area. From 2012 the simulated overall exposure to PM2.5 decreased by approximately 30 % in simulated future scenarios; for NO2 the decrease was over 60 %. The simulated concentrations of O3 increased from the year 2012 to 2040 by about 20 %. In general, the contributions of local shipping emissions in 2040 focus on the harbour area but to some extent also influence the rest of the city domain. The simulated impact of onshore electricity implementation for shipping in 2040 shows reductions for NO2 in the port of up to 30 %, while increasing O3 of up to 3 %. Implementation of onshore electricity for ships at berth leads to additional local reduction potentials of up to 3 % for PM2.5 and 12 % for SO2 in the port area. All future scenarios show substantial decreases in population-weighted exposure and health-effect impacts.
- Article
(7037 KB) - Full-text XML
-
Supplement
(2084 KB) - BibTeX
- EndNote


Shipping is an important source of air pollutants, from the global to the local scale. Nearly 70 % of ship emissions occur within 400 km of coastlines (Corbett et al., 1999), causing air quality problems through emissions of sulfur dioxide (SO2), nitrogen dioxides (NOx), and particulate matter (PM). An increase in shipping activity in the North Sea and the Baltic Sea has resulted in higher emissions of air pollutants and subsequently concentrations of pollutants in air, in particular of NOx, especially in and around several major ports (Kalli et al., 2013). The high contribution of shipping to emissions of sulfur and consequently to acid deposition and air pollution with particulate matter, mainly originating from the oxidation of the SO2 emissions, has been targeted by the International Maritime Organization (IMO) by setting limits on the maximum sulfur content of marine fuels (IMO, 2008). While on the global level a fuel sulfur content limit of 0.5 %, from previously 3.5 %, came into force on 1 January 2020, the Baltic Sea and the North Sea were declared Sulfur Emission Control Areas (SECAs) in 2006, gradually decreasing the fuel sulfur limit to 1.5, 1, and 0.1 % in 2006, 2010, and 2015, respectively (IMO, 2008). Additionally, a fuel sulfur limit of 0.1 % applies for ships at berth in all European harbours since 2010 (EU, 2005), and a limit of 1.5 % applies for all passenger ships in regular line traffic in European waters outside the SECA (EU, 2012). To face the rising NOx emissions, the IMO has designated the North Sea and Baltic Sea NOx Emission Control Areas (NECAs) starting from 1 January 2021 onwards (IMO, 2017). The NECA regulation applies to all vessels built after 2021 and requires approx. 80 % NOx emission reductions (IMO, 2014). Due to the long lifetime of ships, it will take at least 30 years until the entire ship fleet is renewed, which means that NOx emissions will only decrease gradually. In combination with the increasing ship traffic, which grows by roughly 2 % per year, and the future foreseeable significant decrease in emissions from other anthropogenic sectors (e.g. traffic, heating), the relative importance of NOx emissions from shipping for urban air quality will thus likely remain high.
To control emissions of greenhouse gases IMO has adopted a package of technical measures including the Energy Efficiency Design Index (EEDI). The EEDI regulation entered into force in 2013 and included requirements on minimum mandatory energy efficiency performance levels, increasing over time through different phases (IMO, 2011). In 2018 IMO adopted a resolution on the “Initial IMO Strategy on reduction in GHG emissions from ships” stating the objective to reduce the total annual greenhouse gas (GHG) emissions from international shipping by at least 50 % by 2050 compared to 2008 (IMO, 2018). Reaching this objective implies both efficiency gains and an increased use of renewable fuels. There is still a great potential for efficiency gains through better ship and engine design and through operational measures, mainly lower speeds. State of the art ships can be almost 50 % more efficient than ships that are 10–20 years old. Biofuels, wind power, and electrification could play an important part in closing the gap between the potential of an improved engine design together with operational measures and the 50 % target for the entire sector, which, on the other hand, is expected to continue to grow in terms of transported volume in the upcoming decades.
An important effect of the emission reductions in SOx and NOx is the resulting reduction in atmospheric concentrations of PM, especially secondary particulate sulfate and nitrate. Sofiev et al. (2018) have shown that the global limit on sulfur content in ship fuels decreases concentrations of particulate sulfate by 2–4 µg m−3 in the vicinity of busy ship lanes on a global scale, leading to significant reductions in PM2.5 (particles with a diameter of less than 2.5 µm). The burden of PM2.5 over the Baltic Sea region is predicted to decrease by 35 %–37 % between 2012 and 2040 as a result of the regulation of SOx and NOx emissions and due to energy savings in shipping (Karl et al., 2019a). Importantly, the atmospheric transformation of NOx emitted from shipping is also relevant for ozone (O3) formation (Eyring et al., 2010). The introduction of a NECA is thus critical for reducing concentrations of NO2, O3, and PM2.5 at the same time.
In this study we investigate impacts of shipping on urban air quality and the associated health of the population in several future scenarios. We combine the development of emissions due to the implementation of the IMO rules on air pollutants and energy efficiency with changes in traffic volumes, fleet composition, and fuel types used. In addition, the impact of a wide use of shoreside electricity by ships at berth is investigated. Only few studies considering impacts of shipping in future scenarios specifically relevant for the Baltic Sea region can be found in the literature (Cofala et al., 2018; Karl et al., 2019b, 2019a; Jonson et al., 2019, 2015). However, the abatement measures considered as well as the methods used differ from our approach. The first part of our study (Tang et al., 2020) gives a brief overview of previous studies about the impacts of shipping emissions on air quality and health on the Swedish west coast. It provides discussion on how the legislation changed between the base year used in our study (2012) and the situation today. Also, different methods of health impact assessment used in these studies are briefly reviewed. In Tang et al. (2020) we discuss that shipping in Gothenburg in 2012 was a significant source of air pollution, contributing 35 % and 12.5 % to the annual exposure to NO2 and PM2.5, respectively, and that the regional shipping outside the city was responsible for 20 % and 10 % of the NO2 and PM2.5 exposure, contributing more than the local shipping in and around the harbours. According to the study of Karl et al. (2019a), the introduction of the SECA with a fuel sulfur limit of 0.1 % decreased the exposure to PM2.5 on the Swedish west coast by approximately 35 %. This can be seen as the regional part of the shipping contribution because the maximum fuel sulfur content for ships at berth was limited to 0.1 % already in 2010. Sofiev et al. (2018) assessed the impact of the currently introduced global 0.5 % fuel sulfur content (FSC) limit on a global scale in terms of health benefits and found that the introduction of the global 0.5 % FSC cap in 2020 leads to an avoidance of ∼2000 (5 % of cases due to shipping without the 0.5 % cap) premature deaths annually in Europe and ∼137 000 (38 % of cases) globally. The impact on the west coast of Sweden was, however, found to be very small because the North and Baltic seas have been SECAs with a maximum FSC of 0.1 % since 2015.
Cofala et al. (2018) assessed impacts of the implementation of emission control areas for SOx and NOx in all European seas in several alternative scenarios studying the years 2030, 2040, and 2050 and also provided cost–benefit analyses for these different alternatives. Different options of emission control areas in southern Europe had very limited impact in northern Europe; the study, however, also considered two different base scenarios, one of them including climate policy options for shipping. A comparison of the data supplement in Cofala et al. (2018) shows that the PM2.5-related mortalities caused by shipping decreased in the “climate measures” scenario compared to the “no-climate-measures” scenario. The decrease was 0.8 % and 2 % (4 and 13 cases) in 2030 and 2050, respectively, in Sweden and 1 % and 3.7 % (3000 and 12 000 cases) in all of Europe. Cofala et al. (2018) also show the overall impact of shipping on the urban scale for the model grid cells including Mediterranean harbours. In the scenario without climate measures in 2030 the shipping contributions to annual mean PM2.5 concentrations vary from ∼0.2 to 2 µg m−3, while an introduction of additional SECA and NECA rules as in the North and Baltic seas has the potential to avoid approximately 50 % of PM2.5. In 2050 the shipping contributions to PM2.5 were higher, with concentrations of up to 3 µg m−3. The reduction potential of the SECA plus NECA introduction is about 65 %. This is more than in 2030 because the NECA effects move forward at a slow pace.
The health benefit of cleaner ship fuels and other emission reduction techniques in densely populated harbour cities is estimated to be much greater than on the open sea. In order to quantify the future impact of shipping, scenarios for transported cargo volumes, composition of the fleet, and energy efficiency improvements need to be developed and put into perspective with probable emission reductions on land.
The goal of the present study is to investigate the future effect of shipping emissions on air quality and related health effects considering the development of shipping under current regional trends of economic growth and already decided regulations in the Gothenburg urban area in 2040. Additionally, we investigate the impact of a large-scale implementation of shore electricity in the Port of Gothenburg. For this purpose, we established a one-way nested chemistry transport modelling (CTM) system from the global to the urban scale. This paper is the second part of a study about the current and future air quality situation in the Gothenburg urban area. Part 1 by Tang et al. (2020) is published in the same special issue.
2.1 The city of Gothenburg
The city of Gothenburg (Fig. 1) is located on the western coast of Sweden, with about 0.57 million inhabitants and an area of 450 km2. The dominant wind direction in Gothenburg is south-west with an average wind speed of 3.5 m s−1, indicating the major transport path from the sea to the land, especially in summer. The geomorphology of the Gothenburg area is described as a fissure valley landscape dominated by a few large valleys in north–south and east–west directions. The major air pollution sources in Gothenburg are above all road traffic and industry, wood burning, shipping, agriculture, working machines, and long-range transport (LRT) from the European continent and other parts of Sweden. The harbour and shipping activities are important emission sources and directly influence the urban air quality. The centre of the city is situated on the southern shore of the Göta älv. The Port of Gothenburg receives between 6000 and 6500 calls per year and an additional 600–700 ships pass to and from ports upstream and on the Göta älv. The port annually handles approximately 900 000 containers, 20×6 t of petroleum, and half a million roll-on/roll-off (RoRo) units (Fridell et al., 2015). Passenger traffic in Gothenburg is also very busy with 1.5 million passengers who ferry to and from Gothenburg to Denmark, Germany, etc., on Stena Line ferries each year. This makes the port the largest cargo port in Scandinavia. Annual analyses of air quality monitoring data by the Environmental Administration of City of Gothenburg show exceedances of both the target and the limit values for NO2 at several stations in Gothenburg in 2012 with decreasing trends towards exceedances of only the limit value at traffic stations in 2019. For PM10 the levels were well below the limit value but exceeded the target value in 2012 without any significant trend towards the present with exception of the urban background, where a slightly decreasing trend was observed and the annual mean was below the target value of 15 µg m−3 for the last 4 years. The measured concentration levels of PM2.5 have been below the target value without any significant trend at Gothenburg monitoring stations. Concentrations of ozone have a slightly increasing trend from the year 2012 onwards and tend to exceed the limit values for maximum hourly and 8 h means on a number of occasions each year (Miljöförvaltningen, 2019).
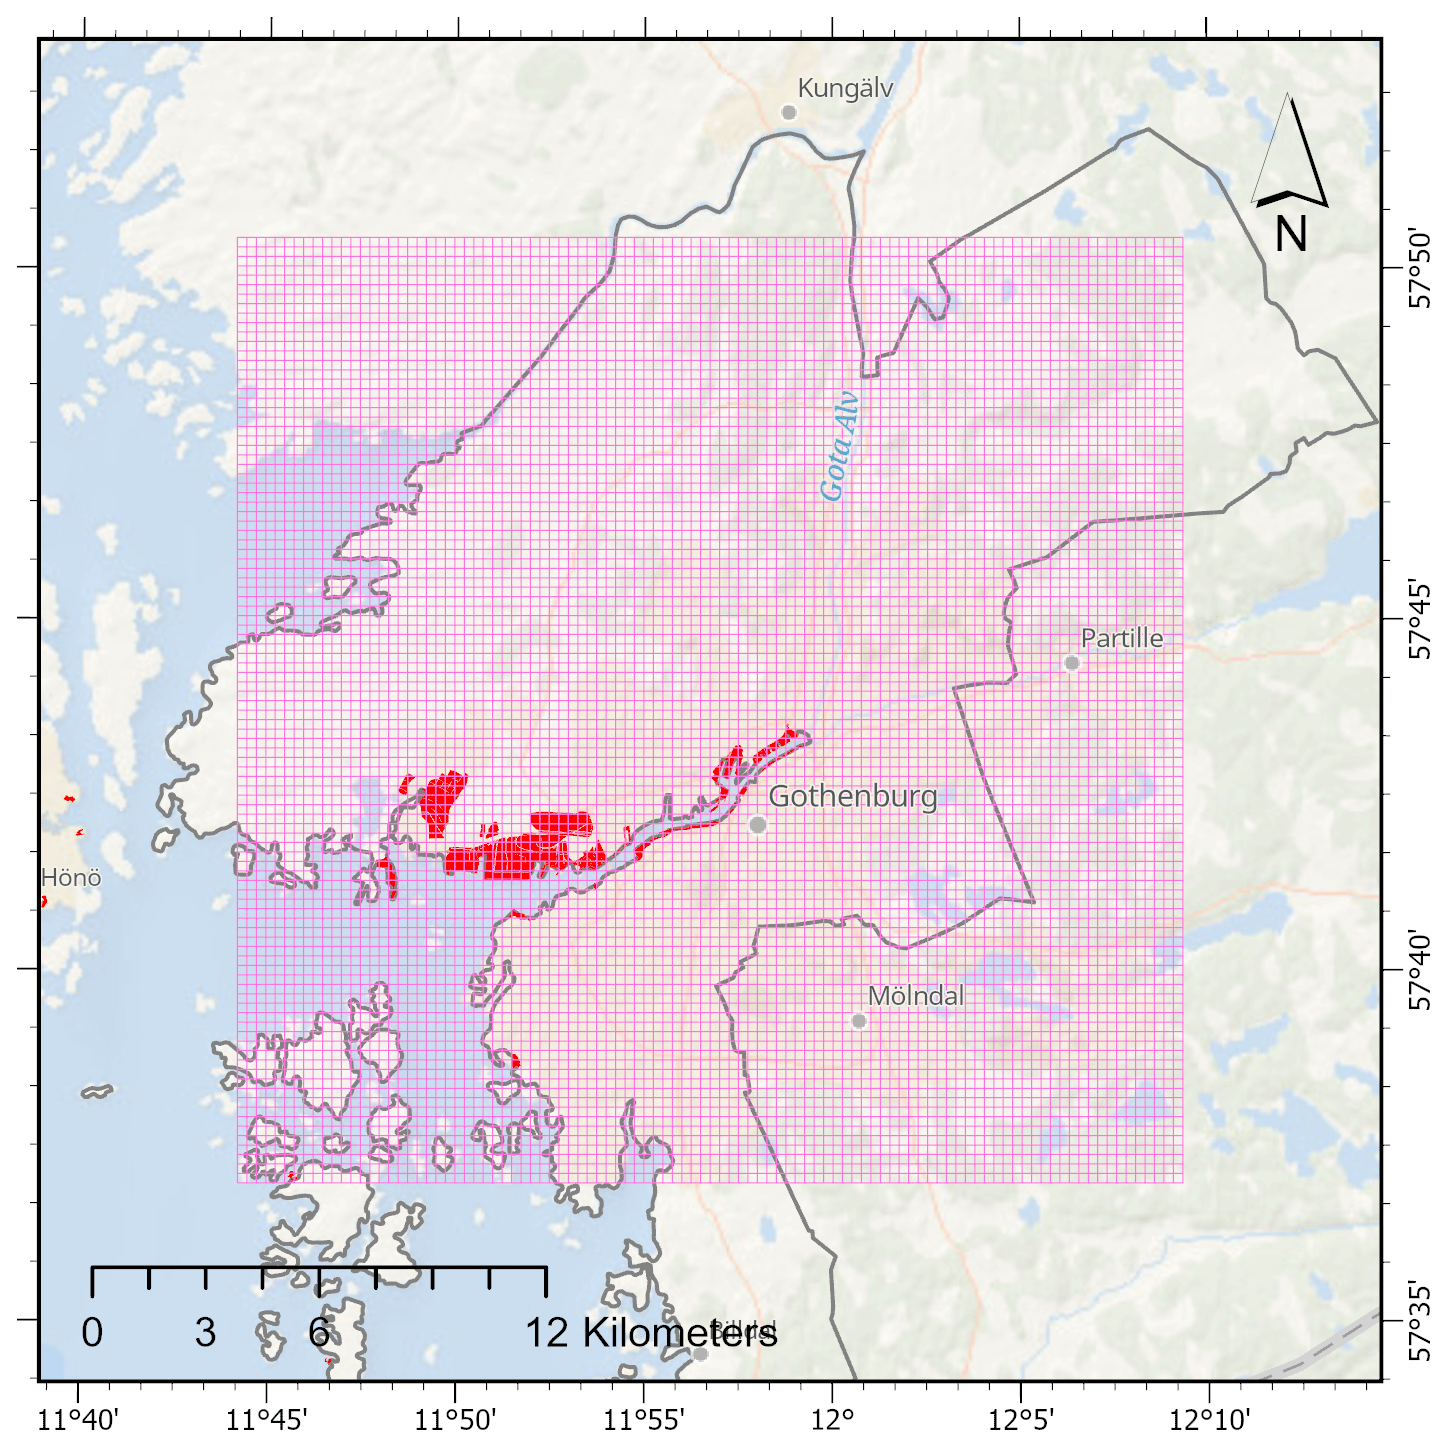
Figure 1The Gothenburg research domain. The light red grid indicates the domain extent and the horizontal grid-cell size of 250 m. Red areas indicate port areas and grey lines indicates the city boundaries as given by the Copernicus Urban Atlas 2012 dataset. Maps are created with ArcGIS with the underlying basemap sources Esri, HERE, Garmin, GEBCO, National Geographic, NOAA, and GIS User Community.
2.2 Global- to urban-scale CTM system setup
For the urban-scale, the prognostic meteorology dispersion model TAPM (The Air Pollution Model; Hurley et al., 2005) was used as part of a one-way nested CTM system from the global to the urban scale (Fig. 2). TAPM has been successfully applied to investigate urban air quality and scenarios in coastal urban areas all over the world (e.g. Matthaios et al., 2018; Ramacher et al., 2020; Gallego et al., 2016; Fridell et al., 2014). TAPM consists of a meteorological component and an air quality component. The meteorological component of TAPM is an incompressible, non-hydrostatic, primitive equation model with a terrain-following vertical sigma coordinate system for 3-D simulations. In the meteorological component, it is possible to assimilate wind observations to add a nudging term to the horizontal momentum equations. The air pollution component uses data from the meteorological component and consists of three modules: first, the Eulerian grid module solves prognostic equations for mean and variance of concentrations; second, the Lagrangian particle module can be used to represent near-source dispersion more accurately; and third, the plume rise module is used to account for plume momentum and buoyancy effects for point sources. The model also includes gas-phase reactions based on a generic reaction set (Azzi et al., 1984) to represent the basic photochemical cycle of NO2, NO, and O3, gas- and aqueous-phase chemical reactions for sulfur dioxide and particles, and a dust mode for total suspended particles (PM2.5, PM10, PM20, and PM30). Wet and dry deposition effects are also included.
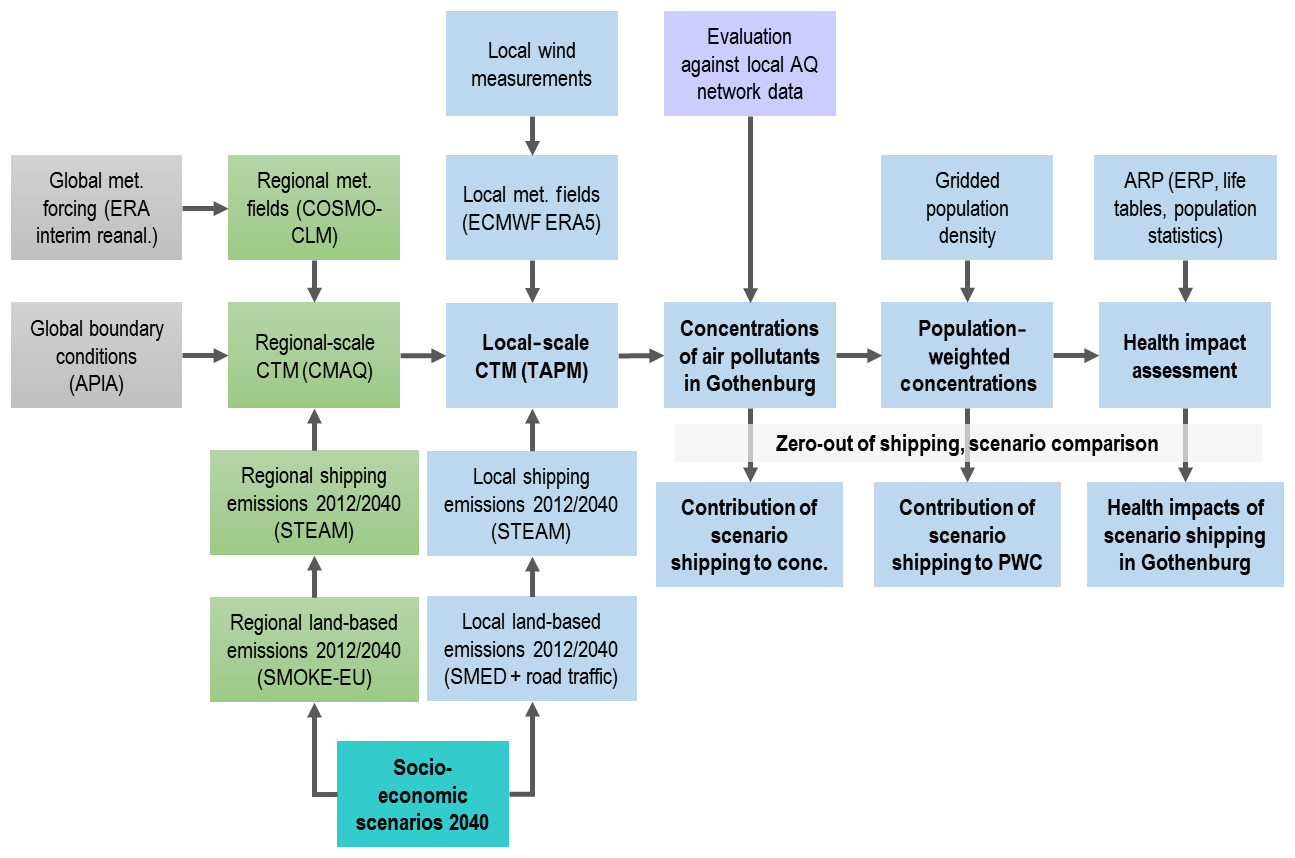
Figure 2Study design to calculate future concentrations, population exposure, and health effects.
2.2.1 Boundary conditions
For the Gothenburg urban area, we coupled TAPM offline to regional CTM simulations with the Community Multi-scale Air Quality (CMAQ) model v5.0.1 (Byun and Schere, 2006) as performed by Karl et al. (2019a) for the Baltic Sea region in 2012. Karl et al. (2019a) used global hemispheric pollutant concentrations from APTA global reanalysis (Sofiev et al., 2018) to consider global chemical boundaries and accounted for meteorological conditions with meteorological fields calculated for the Consortium for Small-scale Modelling (COSMO) Climate Limited-area Modelling Community (CLM) mesoscale meteorological model version 5.0 (Rockel et al., 2008) for the year 2012 using the ERA-Interim reanalysis as forcing data (Geyer, 2014). Furthermore, they accounted for regional land-based emissions in 2012, represented by hourly gridded emissions of NOX, sulfur oxides, carbon monoxide (CO), NH3, PM2.5, coarse PM, and non-methane volatile organic compounds (NMVOCs) with the Sparse Matrix Operator Kernel Emissions for Europe model (SMOKE-EU; Bieser et al., 2011). Regional Shipping emissions for the Baltic Sea and North Sea with high spatial and temporal resolution were obtained from the Ship Traffic Emission Assessment Model (STEAM; Jalkanen et al., 2009; Jalkanen et al., 2012; Johansson et al., 2013). Fridell et al. (2015) also accounted for future emission conditions with future scenarios for land-based and shipping emissions in the Baltic Sea in 2040 which are consistent with the scenarios used in this study. Details of the regional air quality simulation setup including shipping emissions, the evaluations of simulated pollutant concentrations in 2012, and results for the year 2040 scenarios in the Baltic Sea region are described in Karl et al. (2019a).
These simulations are used to interpolate chemical boundary conditions for TAPM. Concentrations simulated with CMAQ for the vertical model layer 7 with a mid-layer height of approximately 385 m above ground are used for this purpose. Since TAPM allows only one single boundary concentration value for the entire urban domain, these values are calculated every hour using horizontal wind components on each of the four lateral boundaries to give more weight to the concentrations upwind of the urban domain (Fridell et al., 2014). CMAQ simulations with and without ship emissions for 2012 and 2040 in the Baltic Sea and the North Sea were used as boundary conditions in the respective TAPM simulation runs with and without ship emissions for 2012 and 2040. This procedure allows for an analysis of regional influences on the Gothenburg area.
2.2.2 Meteorological fields
The spatial resolution of the urban domain for the TAPM air pollution component is 250 m×250 m. With an extent of 25 km×25 km this domain covers the city of Gothenburg and the harbour area along the shores of the Göta river running through the city. The urban domain for the TAPM air pollution component is nested in 30 km×30 km (500 m horizontal resolution) hourly meteorological fields taken from the innermost domain of nested simulations with the meteorological component of TAPM. We chose a smaller domain for the TAPM air pollution component because of a higher efficiency in computing time while having all important city features covered.
TAPM includes a nested approach for meteorology, which allows us to zoom-in to a local region of interest, while the outer boundaries of the grid are driven by synoptic-scale analyses. We applied the meteorological component with four nested domains from a 480×480 km2 extent at the outer domain (D1) to a 30×30 km2 extent at the inner domain (D4). The outer domain (D1) was forced by ECMWF ERA5 synoptic meteorological reanalyses ensemble means with 30 vertical layers, and horizontal and 3-hourly temporal resolution. Additionally, hourly local wind fields of four measurement stations (Femman, Gothenburg, Landvetter, Vinga) operated by the Swedish Meteorological and Hydrological Institute (SMHI) have been assimilated in the meteorological component to force the meteorological fields to be closer to the measurements. Since this study focuses on the impact of changes in shipping emissions in 2040 and not on meteorological effects, the 2040 simulations also use 2012 meteorological fields. Details on meteorological and chemical component configurations in TAPM as well as air quality results and their evaluation for 2012 can be found in the accompanying paper by Tang et al. (2020). Based on the temperature anomalies and precipitation anomalies for the decade 2004–2014 for the Baltic Proper, the year 2012 was chosen as the meteorological reference year for the CTM simulations in Part I of the Gothenburg study as well as in regional studies for current (2012) and future (2040) conditions and shipping scenarios (Karl et al., 2019b; Tang et al., 2020).
2.2.3 Current and future land-based emission inventories
A bottom–up emission inventory for the Gothenburg urban area has been created to account for road traffic, industrial processes, and other sources of land-based emissions in 2012. The road traffic emissions are calculated with traffic activity data from the database of the Environmental Administration, City of Gothenburg (Miljöförvatningen), and a set of emission factors for the Swedish road vehicle fleet in 2035 (latest year available) by HBEFA v. 3.2 (Hand Book of Emission Factors for Road Transport; Keller et al., 2017). The traffic sources are treated as line emission sources in TAPM. For the 10 biggest industrial sources, emission fluxes assigned with coordinates and emission heights were obtained from the Swedish Environmental Emission Data (SMED) for 2012 and modelled as area sources in TAPM. The remaining sources, which are non-road activities, waste and sewage, domestic heating, energy production, combustion in industry for energy purposes, non-road working machinery, domestic aviation, and solvents from product use and agriculture, are gathered from the SMED gridded inventory. They are geographically distributed on a 1 km×1 km grid and modelled as gridded area sources. The land-based emission inventory created in this way takes into account all relevant emission sources for SO2, NOx, PM10, PM2.5, and volatile organic compounds (VOCs) in 2012. For land-based emissions in 2040, the 2012 emission inventory was scaled to 2040 conditions using source-specific approaches. The road traffic emission inventory in 2040 uses detailed activity data for 2012 scaled with a traffic volume development scenario in Sweden specific for light- and heavy-duty vehicles and busses (Transport administration, 2016, 2018). Combined with emission factors, which were calculated for the expected Swedish car fleet in 2035 using the HBEFA v.3.2 database (the year 2040 was not available), a road traffic emission inventory for 2040 was calculated. The annual road traffic emissions in 2040 are 265 t NOx yr−1, 193 t VOC yr−1, and 141 t PM10 yr−1 and thus about 89 %, 62 %, and 12 % lower than in 2012 in the Gothenburg area (Fig. 2).
The area emissions, covering all emission sectors except road traffic and shipping, are scaled from 2012 to 2040 with factors which describe the change in Swedish emissions between 2010 and 2040. These factors were calculated with emissions obtained from the Greenhouse Gas – Air Pollution Interactions and Synergies (GAINS) model using the emission scenario ECLIPSE_V5a_CLE_base (Kiesewetter et al., 2014) and can be found in Supplement 1. The scenario emissions for the time period 2000–2040 were provided as national emissions for European countries, including Sweden, specified for GAINS emission sector categories by Zbigniew Klimont, IIASA (personal communication, 3 March 2016). These categories were translated into the emission categories of Swedish Environmental Emission Data (SMED), and the 2040/2010 factors were applied to the 2012 area emission sectors to derive a land-based emissions scenario for 2040 (CLE2040). The year 2012 is not available for ECLIPSE_V5a_CLE_base, but the change between 2010 and 2012 is small on the 30-year horizon. Based on these factors, the annual industrial emissions in 2040 are 468 t NOx yr−1, 9958 t VOC yr−1, 85 t PM10 yr−1, and 189 t SO2 yr−1 and thus about 19 % lower, 45 % higher, 7 % lower, and 2 % lower than in 2012 in the Gothenburg area (Fig. 2). The reason for an increase in VOC emissions in the future is a scaling factor of 1.45 for the sector “Combustion in industry for energy purposes”, which 6 out of 10 industrial sources in the Gothenburg area belong to. As part of the CTM chain, the treatment of area emissions for the urban area of Gothenburg is consistent with the method used in the regional-scale CMAQ simulations. Thus, the boundary conditions in the local TAPM runs were taken from corresponding regional-scale simulations of the CMAQ model with consistently derived emissions for 2012 and 2040 (Karl et al., 2019a).
2.3 Exposure and health impact assessment
The impacts of exposure to air pollutants on the health of people living in the Gothenburg region were assessed with the ALPHA-RiskPoll model (ARP; Holland et al., 2013), which calculates a wide range of air-pollutant-specific health effects in the assessed year. The RAINS methodology, which calculates years of life lost over the expected lifetime of a population (Amman et al., 2004), has been used as well to enable a comparison with other studies. Both methods are based on national population statistics for European countries and on a forecast of the age distribution of the population, as well as mortality and morbidity data for 2040. In addition, effect-specific dose–response relationships are taken into account. In the case of the RAINS methodology only all-cause mortality from PM2.5 exposure has been considered. In the ARP analysis, impacts of exposure to PM2.5, ozone, and NO2 have been considered (Heroux et al., 2013). Only the most serious impacts, i.e. losses of lives, are presented, taking into account impacts of chronic exposure to PM2.5, short-term exposure to ozone, and short-term exposure to NO2, i.e. the impacts marked A* in the HRAPIE (Health risks of air pollution in Europe) study (Heroux et al., 2013). For ozone, the indicator SOMO35 is used, standing for the annual sum of the daily maximum of the 8 h mean ozone concentrations above a threshold of 35 ppb. The health impacts of some pollutants are correlated, and that is why the premature deaths attributed to each pollutant cannot simply be added up. The concentration-response functions (CRFs) for all-cause mortality used in ARP are those from the WHO (Heroux et al., 2013): 6.2 % (95 % confidence interval 4.0 %–8.3 %) relative risk increase per 10 µg m−3 increased exposure for the long-term PM2.5 exposure, 0.29 % (95 % confidence interval 0.14 %–0.43 %) relative risk increase per 10 µg m−3 increased exposure for the short-term ozone exposure, and 0.27 % (95 % confidence interval 0.16 %–0.38 %) relative risk increase per 10 µg m−3 increased exposure for the short-term NO2 exposure. The RAINS methodology uses 5.8 % relative risk increase per 10 µg m−3 increased exposure to PM2.5. The health impacts of some pollutants are correlated, and that is why the premature deaths attributed to each pollutant cannot simply be added up. In particular, it has been estimated that adding premature deaths attributed to PM2.5 to those attributed to NO2 could result in double counting of around 30 % (Heroux et al., 2013). More details on the methodology can be found in Part 1 of these papers (Tang et al., 2020).
The exposure calculation was based on the concentration fields of PM2.5, O3, and NO2 calculated for the examined future scenarios by the modelling system described above. Annual means and SOMO35 were calculated from hourly ozone concentration fields. Population data at a 1 km×1 km resolution were obtained from Statistics Sweden (SCB) for 2015, with a population of 572 779 in the city of Gothenburg, and used for calculating the population-weighted average concentrations (PWCs) for the model domain in 2012 (Tang et al., 2020). For the 2040 scenarios the PWCs were calculated using the same population data for 2015 since a geographically resolved prognosis for 2040 was not available. In ARP the PWCs are applied to the population statistics for Sweden for the year 2040 and scaled to the population of Gothenburg with the help of the year 2012 “Gothenburg population”∕“total Swedish population” ratio. This approach neglects any potential trend of increase in urbanization in the country, which would lead to higher impacts than calculated with our approach.
With the introduced study design, it is possible to estimate the impact of shipping-related air pollution on the health of citizens in the Gothenburg area regarding current and future emission scenarios and to identify the effectiveness of several air pollution abatement measures. For this purpose, it is necessary to create a set of scenarios with emphasis on shipping activities in the future, translate them into emission inventories, and simulate the health effects with the introduced CTM–exposure–health-effect modelling system.
3.1 Ship emission inventories for the Gothenburg area
A shipping emission inventory for the area of Gothenburg with high temporal and spatial resolution was calculated with STEAM for the year 2012, representing the present situation (Tang et al., 2020) and giving a baseline to be compared with future scenarios. In STEAM, position data of individual ships taken from reports from the Automatic Identification System (AIS) is used to model fuel consumption and emissions as a function of vessel activity, engine, and fuel type. The calculation of ship emission inventories for the Gothenburg area follows the approach that has been applied for the North and Baltic Sea region and which is described in Karl et al. (2019a). The emission inventory in this work is therefore consistent with the one in Karl et al. (2019a). Nevertheless, the regional shipping emission inventory contains hourly updated emission data on a 2 km×2 km grid, while the local emission inventory comes with a resolution of 250 m×250 m for the local research domain. The ship emissions in the Gothenburg area include combustion emissions from all ship engines (boilers, auxiliary, and main engines) for the compounds NOx, SOx, CO, CO2, NMHC, and PM. Tang et al. (2020) used STEAM shipping emission inventory in the Gothenburg area and applied it in the presented global-to-local CTM system to identify the impact of shipping on urban air quality in the year 2012. In 2012, the local ship emissions in Gothenburg hold with 308 t SO2 yr−1, 2089 t NOx yr−1, 91 t PM10 yr−1, and 23 t VOC yr−1 for about 60 % of SO2, 40 % of NOx, 25 % of PM10, and 1 % of VOC, respectively, to the total emission situation (Fig. 3). Thus, shipping emissions are a major contributor to the urban air quality in Gothenburg in 2012.
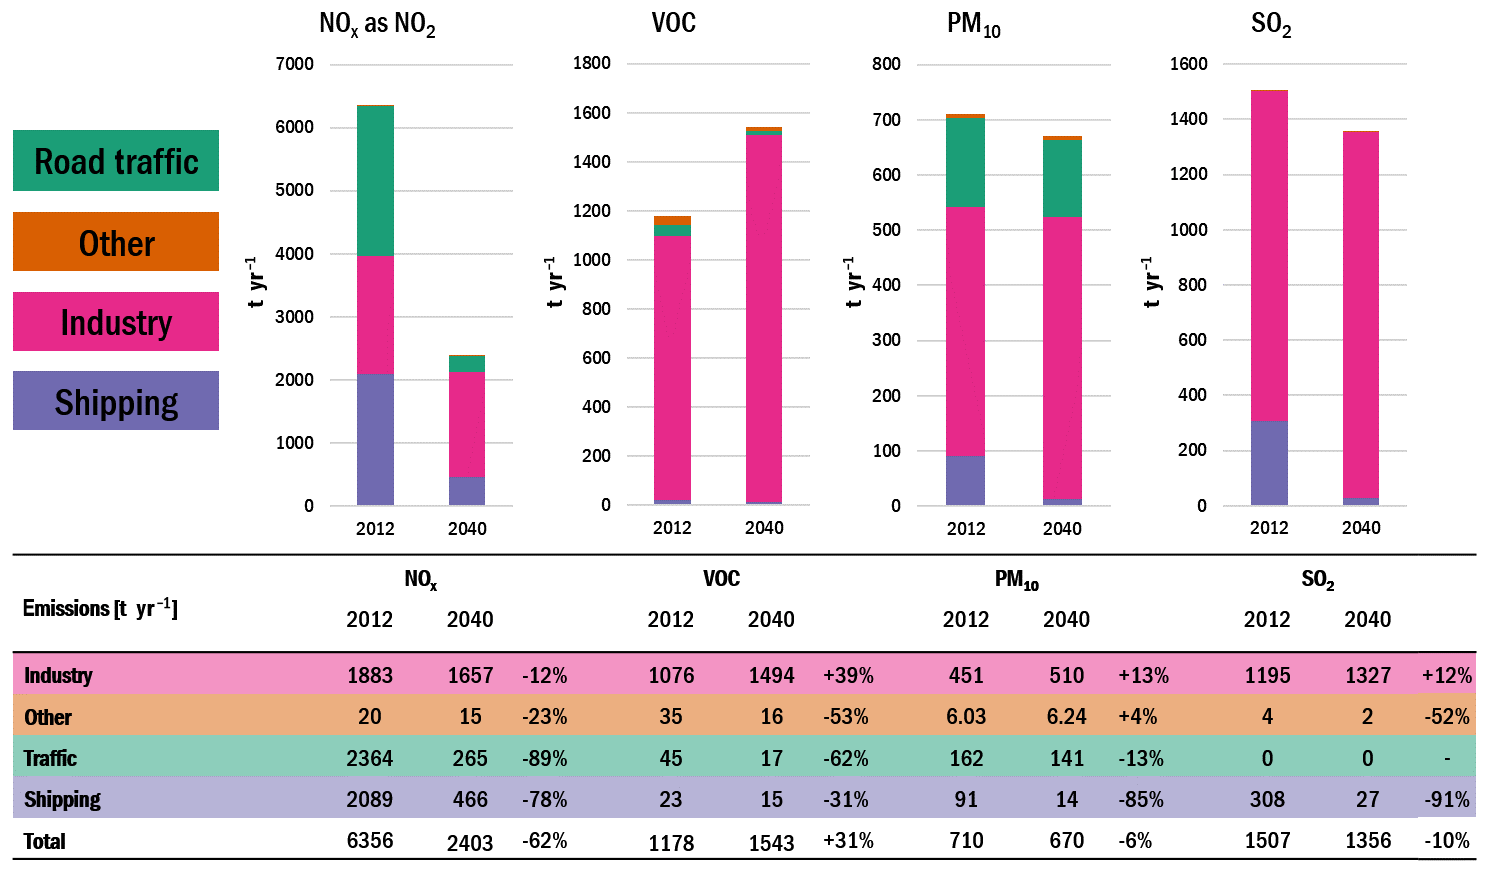
Figure 3Present-day and future 2040BAU scenario emission inventories for the local CTM simulation in Gothenburg.
3.2 Future scenarios for shipping emissions
The scenarios used in this work describe future developments of policy and technology regarding energy efficiency and exhaust gas emissions from ships in the North and Baltic Sea region as well as in the Port of Gothenburg all taking the following into account:
-
the development of ship traffic and transport volumes,
-
fleet development of different ship types,
-
changes in fuel mixture,
-
the use of abatement measures and other technologies that influence emissions from shipping,
-
regulations influencing emissions and fuel consumption,
-
possible local port actions in Gothenburg, e.g. the use of shoreside electricity for ships at berth.
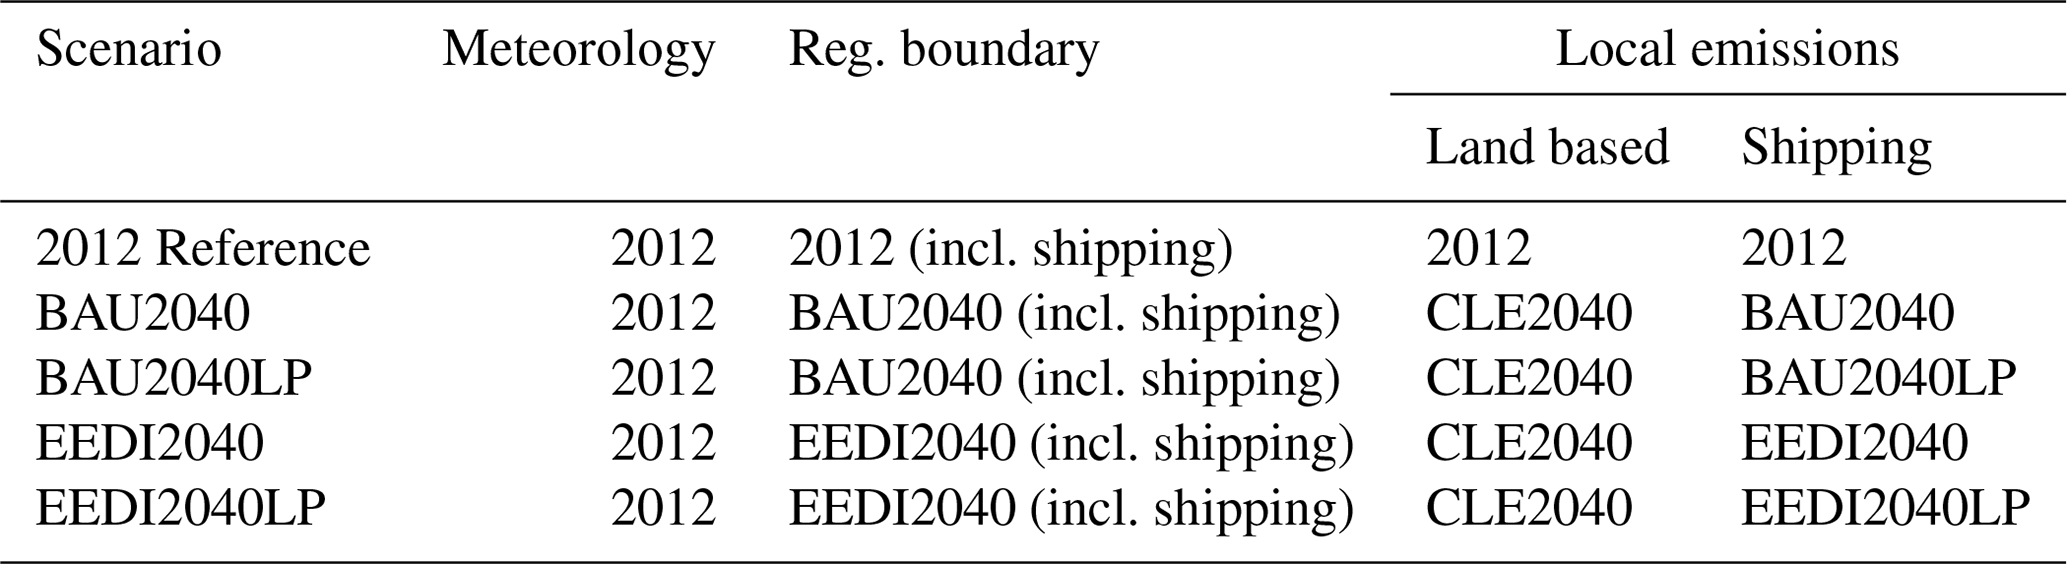
The scenarios were created in the BONUS SHEBA (Sustainable Shipping and Environment of the Baltic Sea Region) project and are based on literature reviews and expert and stakeholder consultations to assess shipping in the future within different developments (Fridell et al., 2015; Karl et al., 2019a). The ship traffic volumes are expected to continue to grow with about 1 % per year on average (it varies with ship type); the current trend of using larger vessels is expected to continue as well (Kalli et al. (2013). The trends in cargo volumes, passenger numbers, and ship sizes are described in detail in Fridell et al. (2015) and translated to emission scenarios in Karl et al. (2019). The overall goal was to investigate changes in impacts of shipping on the marine and terrestrial environment as well as on human health in the Baltic Sea region. The scenario results have been used to assess urban-scale impacts on air quality and human health in the Gothenburg area and several other Baltic Sea harbour cities (Ramacher et al., 2019). In this work shipping in the urban area of Gothenburg in the future is modelled in four scenarios for 2040:
-
BAU2040 – business as usual 2040, this scenario is the future reference scenario including all currently adopted regulations including climate measures with high energy improvements in energy efficiency (Kalli et al., 2013) (still not achieving the IMO 2018 Initial Strategy to reduce CO2 emissions by 50 % relative to 2008 by the year 2050);
-
BAU2040LP – BAU2040 with additional implementation of shoreside electricity;
-
EEDI2040 – as BAU2040, but fuel efficiency just follows the Energy Efficiency Design Index regulation of the IMO;
-
EEDI2040LP – EEDI2040 with additional implementation of shoreside electricity.
3.2.1 Future reference scenario BAU2040
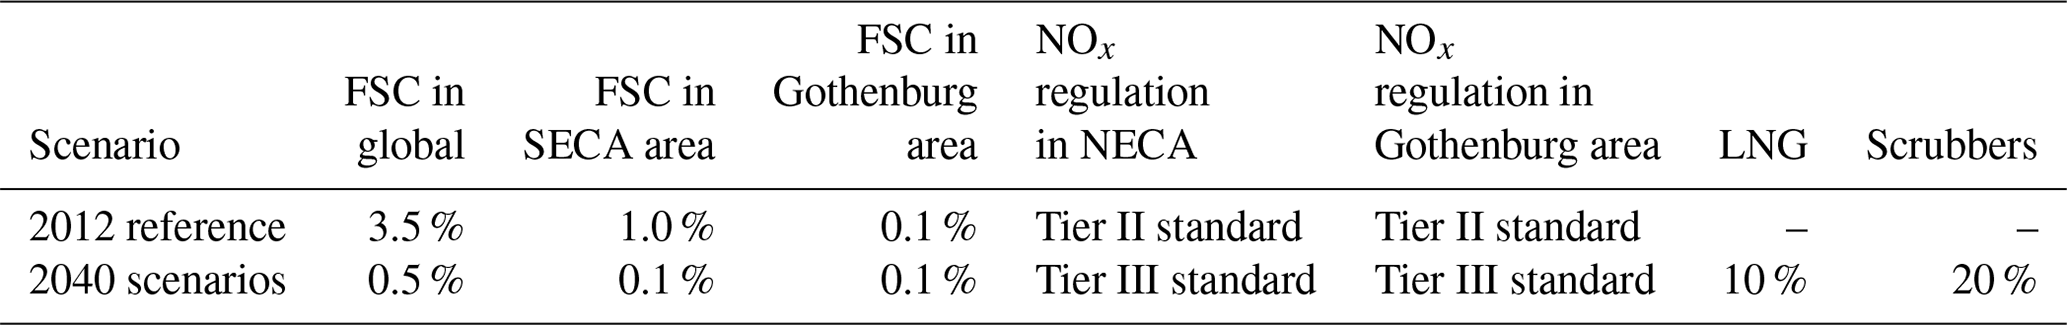
The BAU2040 scenario is based on current trends in shipping and takes into account already decided policy measures (Table 1). This represents a conservative development of shipping in line with the Shared Socioeconomic Pathway (SSP) II “Middle of the Road” scenario (Zandersen et al., 2019), which is developed for the climate community and adapted for shipping in the Baltic Sea. The trends in shipping were analysed from AIS data from recent years and combined with an analysis of the different shipping sectors to obtain the development regarding transport work, ship size, ship speed, and number of ships for different ship types as done for the regional scale by Karl et al. (2019a). In combination with assumptions on ship age distribution and upcoming regulations (Fridell et al., 2015), this allows for the calculation of emissions to air. The following regulations affecting emissions to air were applied in BAU2040 (Table 1).
-
Sulfur regulation: the Baltic and North seas are SECAs, where the maximum allowed sulfur content in marine fuel was lowered from 1 % to 0.1 % in 2015. For sea areas outside SECAs the maximum fuel sulfur content is 0.5 % from 2020 onwards. For ships berthing in EU ports the maximum allowed fuel sulfur content is 0.1 %; these regulations directly influence the emissions of SOX and have a strong impact on the PM emissions. These regulations are also applied in the EEDI2040 scenarios.
-
NOx regulation: NOx emissions from marine engines have been regulated with Tier I for new ships since 2000 and Tier II since 2011. Tier III is applied in NOx Emission Control Areas for new ships operating in the Baltic and North seas from 2021. These regulations are also applied in the EEDI2040 scenarios.
-
Energy efficiency: the regulation by IMO regarding the EEDI (IMO, 2018) requires new ships to become gradually more fuel-efficient. The improvements in energy efficiency, fuel use reductions and emissions are assumed to be proportional.
The BAU2040 scenario assumes a share of ships driven by liquefied natural gas (LNG) of about 10 % in the ship fleet in 2040. This is modelled as a fraction of new ships introduced each year that will use LNG since retrofitting of existing ships from fuel oil to LNG is assumed less likely due to high costs. Since LNG is used as a means to comply with the sulfur and NOx regulations, ship types that operate mainly within SECAs are modelled as being more likely to use LNG. The BAU2040 scenario also assumes that on average 20 % of the ships in the Baltic Sea use scrubbers. This measure, however, does not affect emissions to air in our study since the scrubbers are required to reach SOX emissions equivalent to using magnesium oxide (MGO) and that the PM emissions are similar as for MGO (Fridell and Salo, 2016). The energy efficiency for new ships in BAU2040 is assumed to improve further than what is required from the EEDI regulation, following recent trends and assumptions from Kalli et al. (2013), assuming annual efficiency increases of 1.3 % to 2.25 %, depending on ship type (corresponding efficiency increase values required by the IMO EEDI regulation are 0.65 % to 1.04 %), which significantly reduces shipping fuel consumption.
Based on these assumptions scaling factors for 2040/2012 were calculated by applying fleet development, fuel mix, abatement technology implementation, and improvements in energy efficiency trends to fleet composition in the Gothenburg area calculated with STEAM for the year 2012. These have been applied to the 2012 gridded shipping emissions inventory to calculate the BAU2040 emission scenario. Compared to the present situation in 2012, the annual shipping emissions in BAU2040 are decreased to 466 t NOx yr−1 (−78 %), 23 t VOC yr−1 (−31 %), 91 t PM10 yr−1 (−85 %), 27 t SO2 yr−1 (−91 %) (Fig. 4). While the shipping emissions in 2012 were a major contributor to the overall air pollution (Fig. 3), in 2040 the relevance of shipping emissions decreases in comparison to industry, road traffic, and other sources to 19 % for NOx, 1 % for VOC, and 2 % for PM10 and SO2.
3.2.2 Future scenario EEDI2040
As the scenario work revealed that energy effectivization has large impact on emissions in the target year, encompassing at the same time great uncertainty, we have chosen to include an alternative scenario with a different effectivization level. In the EEDI2040 scenario, improvements in fuel efficiency strictly follow the requirements of the EEDI regulation of the International Maritime Organization. Annual efficiency increases of 0.65 % to 1.04 %, depending on ship type, are assumed in the EEDI2040 scenario, while the corresponding values in the BAU2040 scenario are 1.3 % to 2.25 %. From the difference between BAU2040 and EEDI2040, the effect of the higher fuel efficiency increase than required by the EEDI regulation can be deduced.
Based on these assumptions, scaling factors have been calculated in the same manner as for the BAU2040 scenario and applied to the 2012 shipping emissions inventory. Compared to the present situation in 2012, the annual shipping emissions in EEDI2040 are decreased to 666 t NOx yr−1 (−68 %), 22 t VOC yr−1 (−2 %), 19 t PM10 yr−1 (−79 %), and 38 t SO2 yr−1 (−88 %) (Fig. 4). In comparison to 2012, the relevance of shipping emissions in the EEDI2040 scenario decreases in comparison to industry, road traffic, and other sources to 26 % for NOx, 1 % for VOC, and 3 % for PM10 and SO2.
3.2.3 Future shoreside electricity scenarios – BAU2040LP and EEDI2040LP
In addition to regional developments and regulations, which are reflected in the BAU2040 and EEDI2040 scenarios, large-scale implementation of shoreside electricity (or land power, LP) in the Port of Gothenburg was studied in both scenarios. Concerns about air quality in port cities as well as policies on greenhouse gas emissions have led to measures aimed at reducing the use of auxiliary engines by ships at berth and thereby reducing emissions of air pollutants and greenhouse gases as well as noise through the use of shoreside electricity.
A gridded emission inventory with large-scale shoreside electricity use in 2040 was calculated with STEAM in the following way: all RoRo, RoPax, and cruise ships and 50 % of all other ships use shoreside electricity. Scaling factors have been calculated in the same way as for the future scenarios BAU2040 and EEDI2040, except that emission from ships at berth were reduced as described. These factors were then applied in the gridded emission inventories, resulting in 165 t NOx yr−1, 5 t VOC yr−1, 5 t PM10 yr−1, and 17 t SO2 yr−1 emissions in Gothenburg in the BAU2040LP scenario (Fig. 4). The EEDI2040LP annual shipping emissions result in 234 t NOx yr−1, 7 t VOC yr−1, 7 t PM10 yr−1, and 24 t SO2 yr−1. Compared to the BAU2040 and EEDI2040 scenario, the annual emissions in both the BAU2040LP and EEDI2040LP scenario are 65 % lower for NOx, 68 % lower for VOC, 62 % lower for PM10, and 37 % lower for SO2. While the shipping emissions in 2012 have been a major contributor to the overall air pollution (Fig. 3), in 2040 the relevance of shipping emissions decreases in comparison to industry, road traffic, and other sources to 19 % for NOx, 1 % for VOC, and 2 % for PM10 and SO2 in the BAU2040LP scenario.
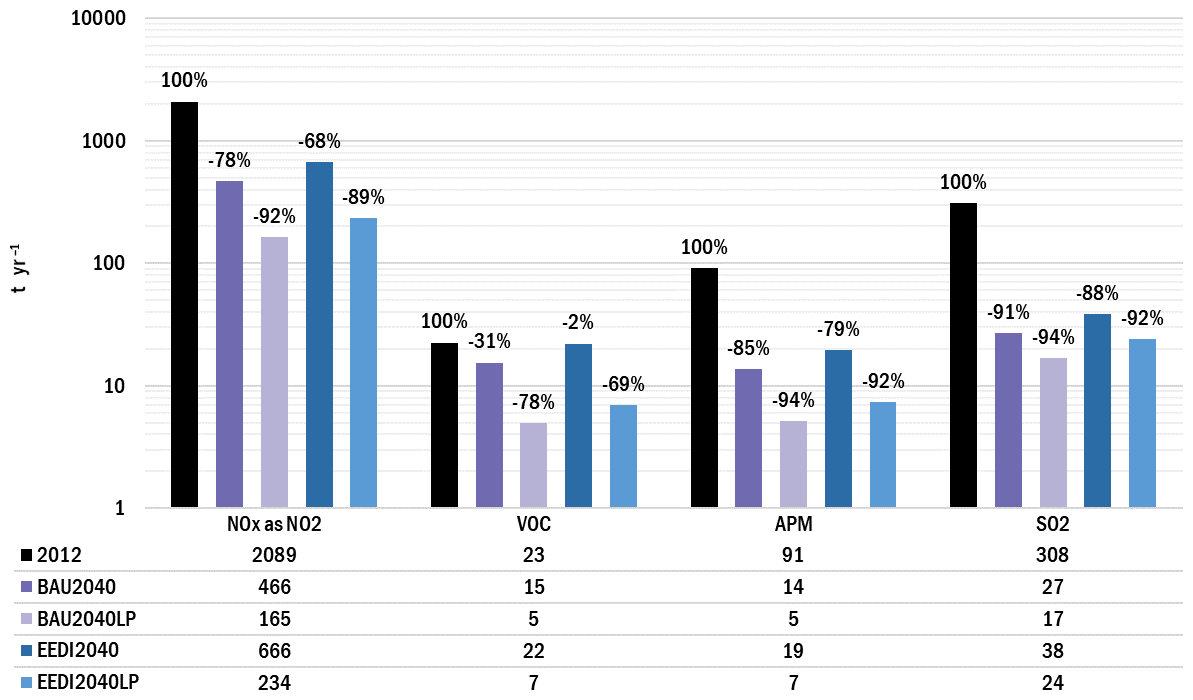
Figure 4Annual shipping emissions of NOx, VOC, PM10, and SO2 for the local CTM simulation in Gothenburg for 2012, BAU2040, and BAU2040LP emissions scenarios.
3.3 Scenario setup
The introduced land-based (CLE2040) and shipping (BAU2040, BAU2040LP, EEDI2040, and EEDI2040LP) emission inventories for 2040 have been applied in the established global-to-local CTM system to identify
-
the impact on air quality in Gothenburg through a change in total emissions from 2012 to 2040,
-
the impact of local shipping activities in 2040 in two different scenarios, and
-
the additional impact of local port measures (shoreside electricity) in scenarios for 2040.
Moreover, simulations for all months in 2012 have been performed as described in Tang et al. (2020). The meteorological conditions were held constant for all regional and local CTM runs as our focus is on the impact of changing emissions. The regional boundary conditions applied to the local-scale TAPM simulations for the BAU2040LP and EEDI2040LP were taken from regional CTM simulations with BAU2040 and EEDI2040 emissions including shipping emissions (Table 2). By using the local land-based emissions in line with the regional land-based emissions and varying the local shipping emissions, this scenario setup allows for the assessment of local shipping impacts in different local scenarios. To derive the contribution of ships to the selected pollutant concentrations, two model runs for each scenario – one including and one excluding local shipping emissions in TAPM simulations – were performed. The difference is regarded as the contribution of ships to the individual pollutant. For the scenarios, the difference between two model runs with different shipping emissions is regarded as the change in the contribution of ships between the respective scenarios. In the discussion of the results, the BAU2040 scenario will be discussed as the future reference scenario. Consequently, we will show results for the BAU2040 scenario in the main paper, while results for EEDI2040 are available in Supplement 3.
Table 2Meteorology, regional boundary conditions, and emissions setup for the calculated scenarios.
BAU2040 serves as a reference scenario all other scenarios are compared to. It was first compared to the present-day air quality situation in 2012, which is discussed in detail in the accompanying paper by Tang et al. (2020). Ship activities in Gothenburg 2012 contribute to peak values, in particularly in the north of the city port and the river Göta due to the dominant SW wind. The local shipping contribution to NO2 concentrations in Gothenburg was about 14 % (around 0.5 ppb) to the annual mean averaged over the entire model domain. These contributions were higher in summer due to higher ship activities. Emissions of NOx from ships added up with land-based NOx emissions and enhanced the local ozone loss by NO titration. The negative effect of NOx emissions from local shipping on O3 concentrations in summer was −2 % (around −0.5 ppb) on average. For PM2.5, the local ship emissions contributed about 2 % (around 0.07 µg m−3) to the annual mean, while the annual average SO2 concentrations from local shipping were the major contributor to local SO2 emissions with 0.2–0.5 ppb along major shipping lanes. In the following, maps illustrating changes in annually averaged concentrations of NO2, O3, PM2.5, and SO2 are shown for the total change in ambient air concentrations from 2012 to 2040BAU (Fig. 5), the impact of change in shipping emissions from 2012 to BAU2040 on shipping contribution to ambient concentrations of these air pollutants (Fig. 6), and impact of a large-scale introduction of shoreside electricity in the BAU2040LP and EEDI2040LP scenarios on the contribution of shipping compared to BAU2040 and EEDI2040, respectively (Fig. 7 for BAU2040 results; Supplement 3 for EEDI2040 results). Seasonal plots for summer and winter months can be found in Supplements 2 and 3.
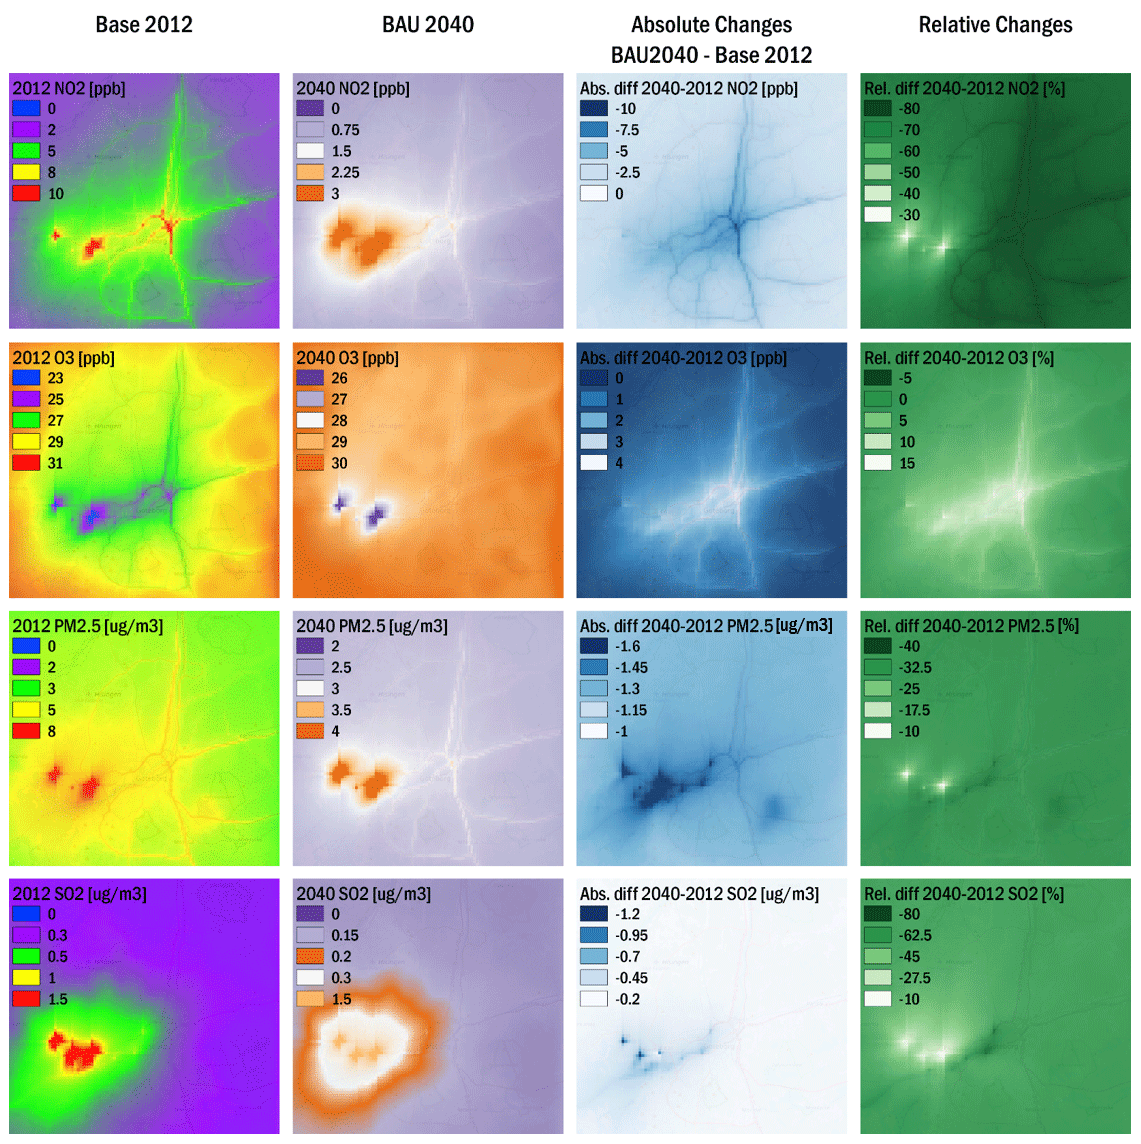
Figure 5The total modelled present-day concentration for NO2, O3, PM2.5, and SO2 (column 1), as well as the concentration in BAU2040 (column 2) and the difference between the present day and BAU2040 in absolute (column 3) and relative (column 4) values. ©OpenStreetMap contributors 2019. Distributed under a Creative Commons BY-SA License.
4.1 Air quality changes in 2040 compared to the present day
The local concentration of NO2, given as an annual average over the model domain, decreased by 74 % (around 2.8 ppb) from about 3.7 ppb in 2012 to 0.9 ppb in the future reference scenario BAU2040. The highest changes in NO2 are located in the centre of Gothenburg with an average NO2 reduction of up to 80 % (and 8 ppb) next to major roads. Besides the high reductions due to road traffic, a reduction in NO2 concentration due to the reduction in emissions from industrial sources is visible in the western part of the Gothenburg domain with reductions of up to 7 ppb (∼30 %). The smaller relative reduction in industrial areas is due to the comparatively low change in industrial NO2 emissions and their already high contribution to NO2 concentration in the western part of the city in 2012, on one side, and the high reduction in road traffic emissions and a high density of highways and road traffic in the eastern part of the Gothenburg domain, on the other side. The port area, which is located westward of the centre, shows a comparably high reduction potential with up to 70 %. The nearby industrial sources might hide reductions in NO2 from other sources due to their high absolute contributions and relatively low reduction from 2012 to BAU2040.
When it comes to changes in O3 concentrations, there is an increase in the city centre by up to 15 % (about 4 ppb) from 2012 to BAU2040, especially near major roads. This contrary trend follows the principles of ground-level ozone formation, which is produced in photochemical reaction cycles involving the precursors NOx and VOCs. The ozone–precursor relationship in urban environments is a consequence of the fundamental division into an NOx-sensitive and a VOC-sensitive regime (Sillman, 1999). VOC-sensitive regimes in dense urban areas with many emission sources lead to higher O3 with increasing VOC and lower O3 with increasing NOx (Karl et al., 2019a). Therefore, the contribution of local ship emissions with ozone precursors NOx and VOCs can selectively be very significant, in terms of both increasing the O3 levels in urban areas and decreasing them in the outskirts. Figure 5 shows that both the absolute and the relative change in impact of shipping activities between 2012 and BAU2040 becomes more visible for O3 than for NO2 in the western parts of the city, due to the higher ozone formation in the absence of NOx sources in the BAU2040 scenario.
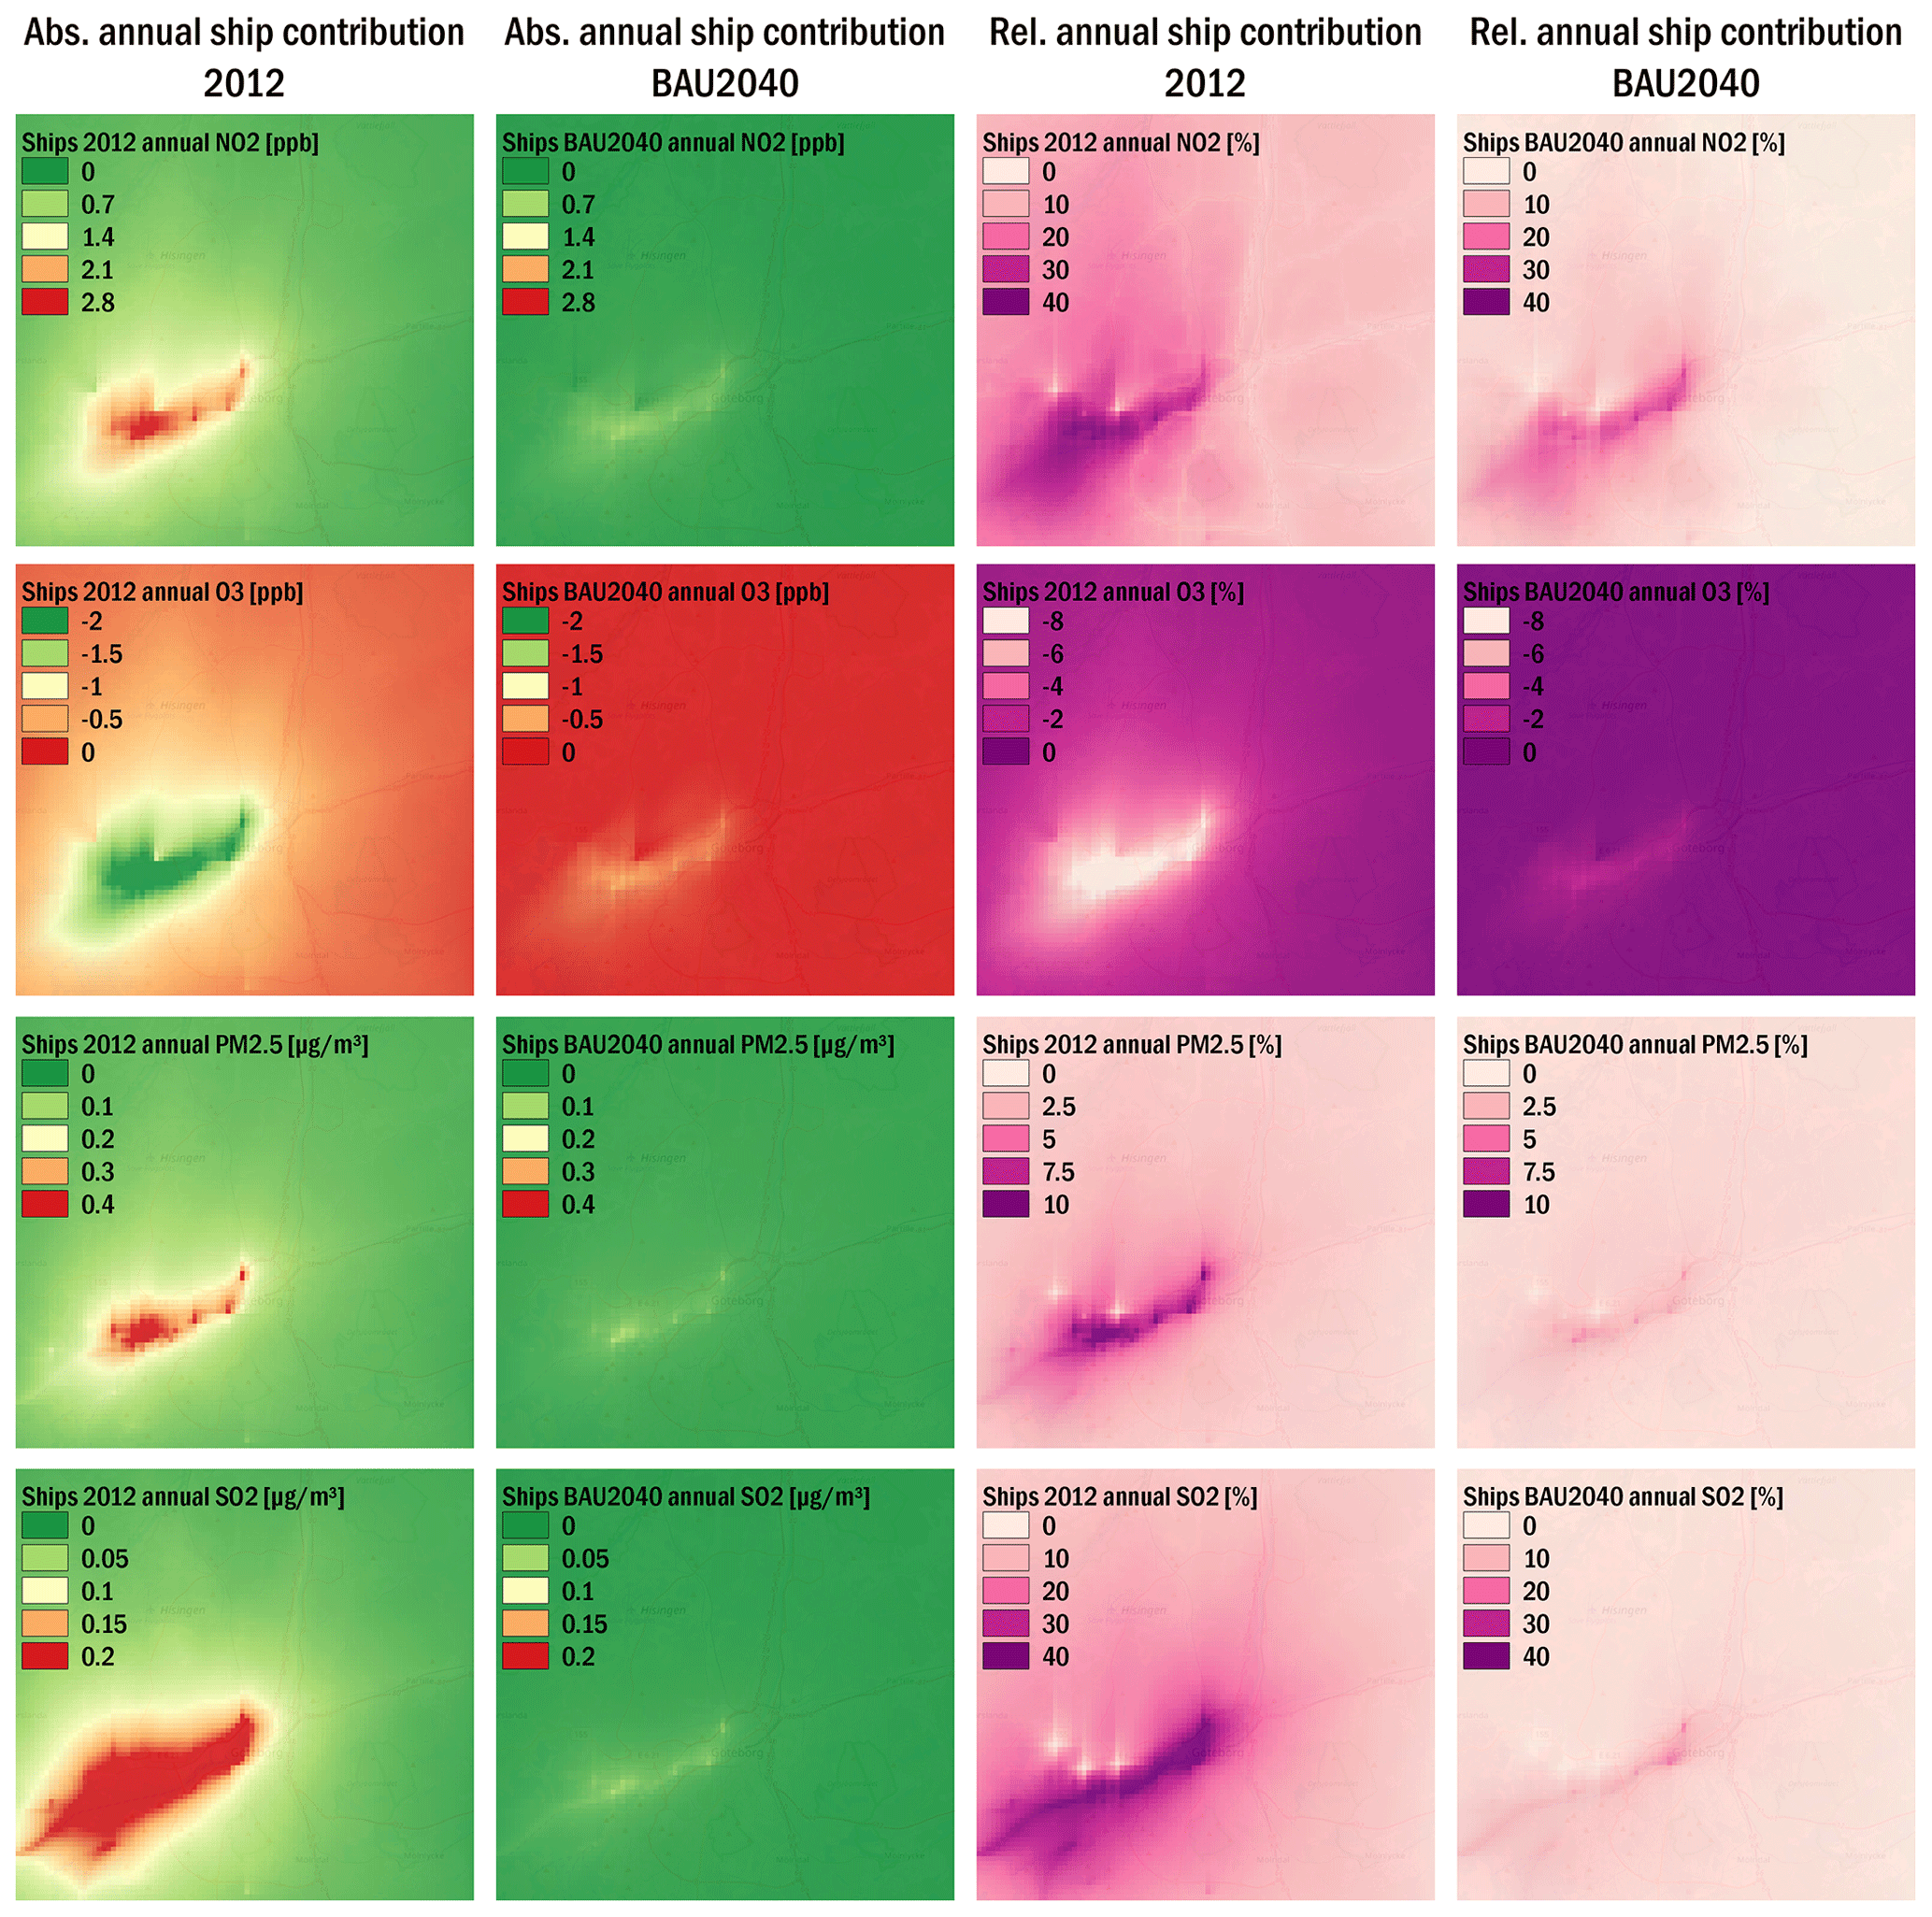
Figure 6Absolute contributions of local ship emissions to annual mean concentration levels in Gothenburg in 2012 (column 1) and BAU2040 (column 2), as well as the relative contributions (columns 3 and 4). ©OpenStreetMap contributors 2019. Distributed under a Creative Commons BY-SA License.
For PM2.5 and SO2 the high impact of some industrial sources in the west of Gothenburg is even more visible. While in 2012 the average PM2.5 concentrations peak at 53 µg m−3 in the vicinity of the largest point sources, in BAU2040 they peak at 48 µg m−3. The domain-averaged PM2.5 concentrations are much lower with 4 µg m−3 in 2012 and 2.7 µg m−3 in BAU2040; thus they are reduced by 33 % on average. Slightly higher reductions close to roads are caused by lower PM2.5 road traffic emissions. Reductions in the northeast of the urban area of Gothenburg are probably due to less secondary particle formation. This pattern also holds true for SO2. There is an absolute reduction potential for SO2 of up to 1 µg m−3 and a relative reduction potential of up to 75 % in the port area, following shipping routes. Nevertheless, the characteristic industrial point sources bear the highest absolute SO2 reductions and therefore partly diminish the relative SO2 reduction potential in the port area of Gothenburg.
In total, the air quality situation with respect to NO2, PM2.5, and SO2 is clearly improving in the urban area of Gothenburg in the BAU2040 scenario. However, the large industrial point sources, such as three refineries (Preem Gothenburg, St1 Refinery AB, Nynäs Gothenburg), are identified as large contributors to spatially selective high concentrations of NO2, PM2.5, and SO2 and still contain a high reduction potential compared to all other sources of air pollution in the urban area of Gothenburg. When it comes to ozone there is an average increase of up to 1 ppb in summer, probably due to a lower background concentration and consequently less ozone titration by the lower NOx emission in 2040.
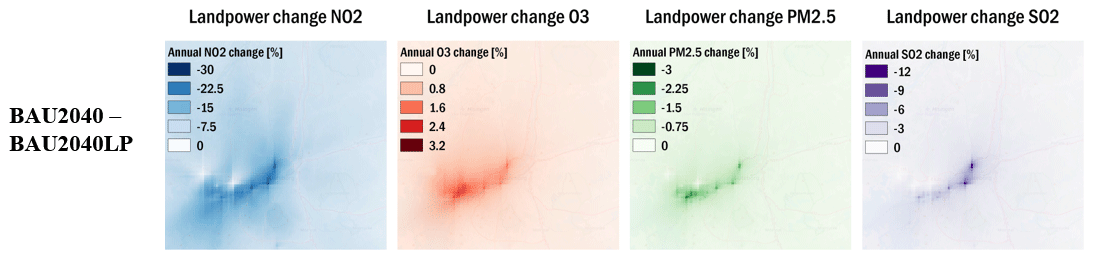
Figure 7Relative changes in annual mean NO2, PM2.5, and O3 concentrations for BAU2040LP compared to 2040BAU scenario. © OpenStreetMap contributors 2019. Distributed under a Creative Commons BY-SA License.
Table 3Population-weighted exposure in the Gothenburg area to NO2 (in ppb), PM2.5 (in µg m−3), and ozone (as sum of hourly means over 35 ppb) in 2012 and in the BAU2040 and EEDI2040 scenarios. The exposure caused by local shipping, local and regional shipping, and ships at berth is given separately.
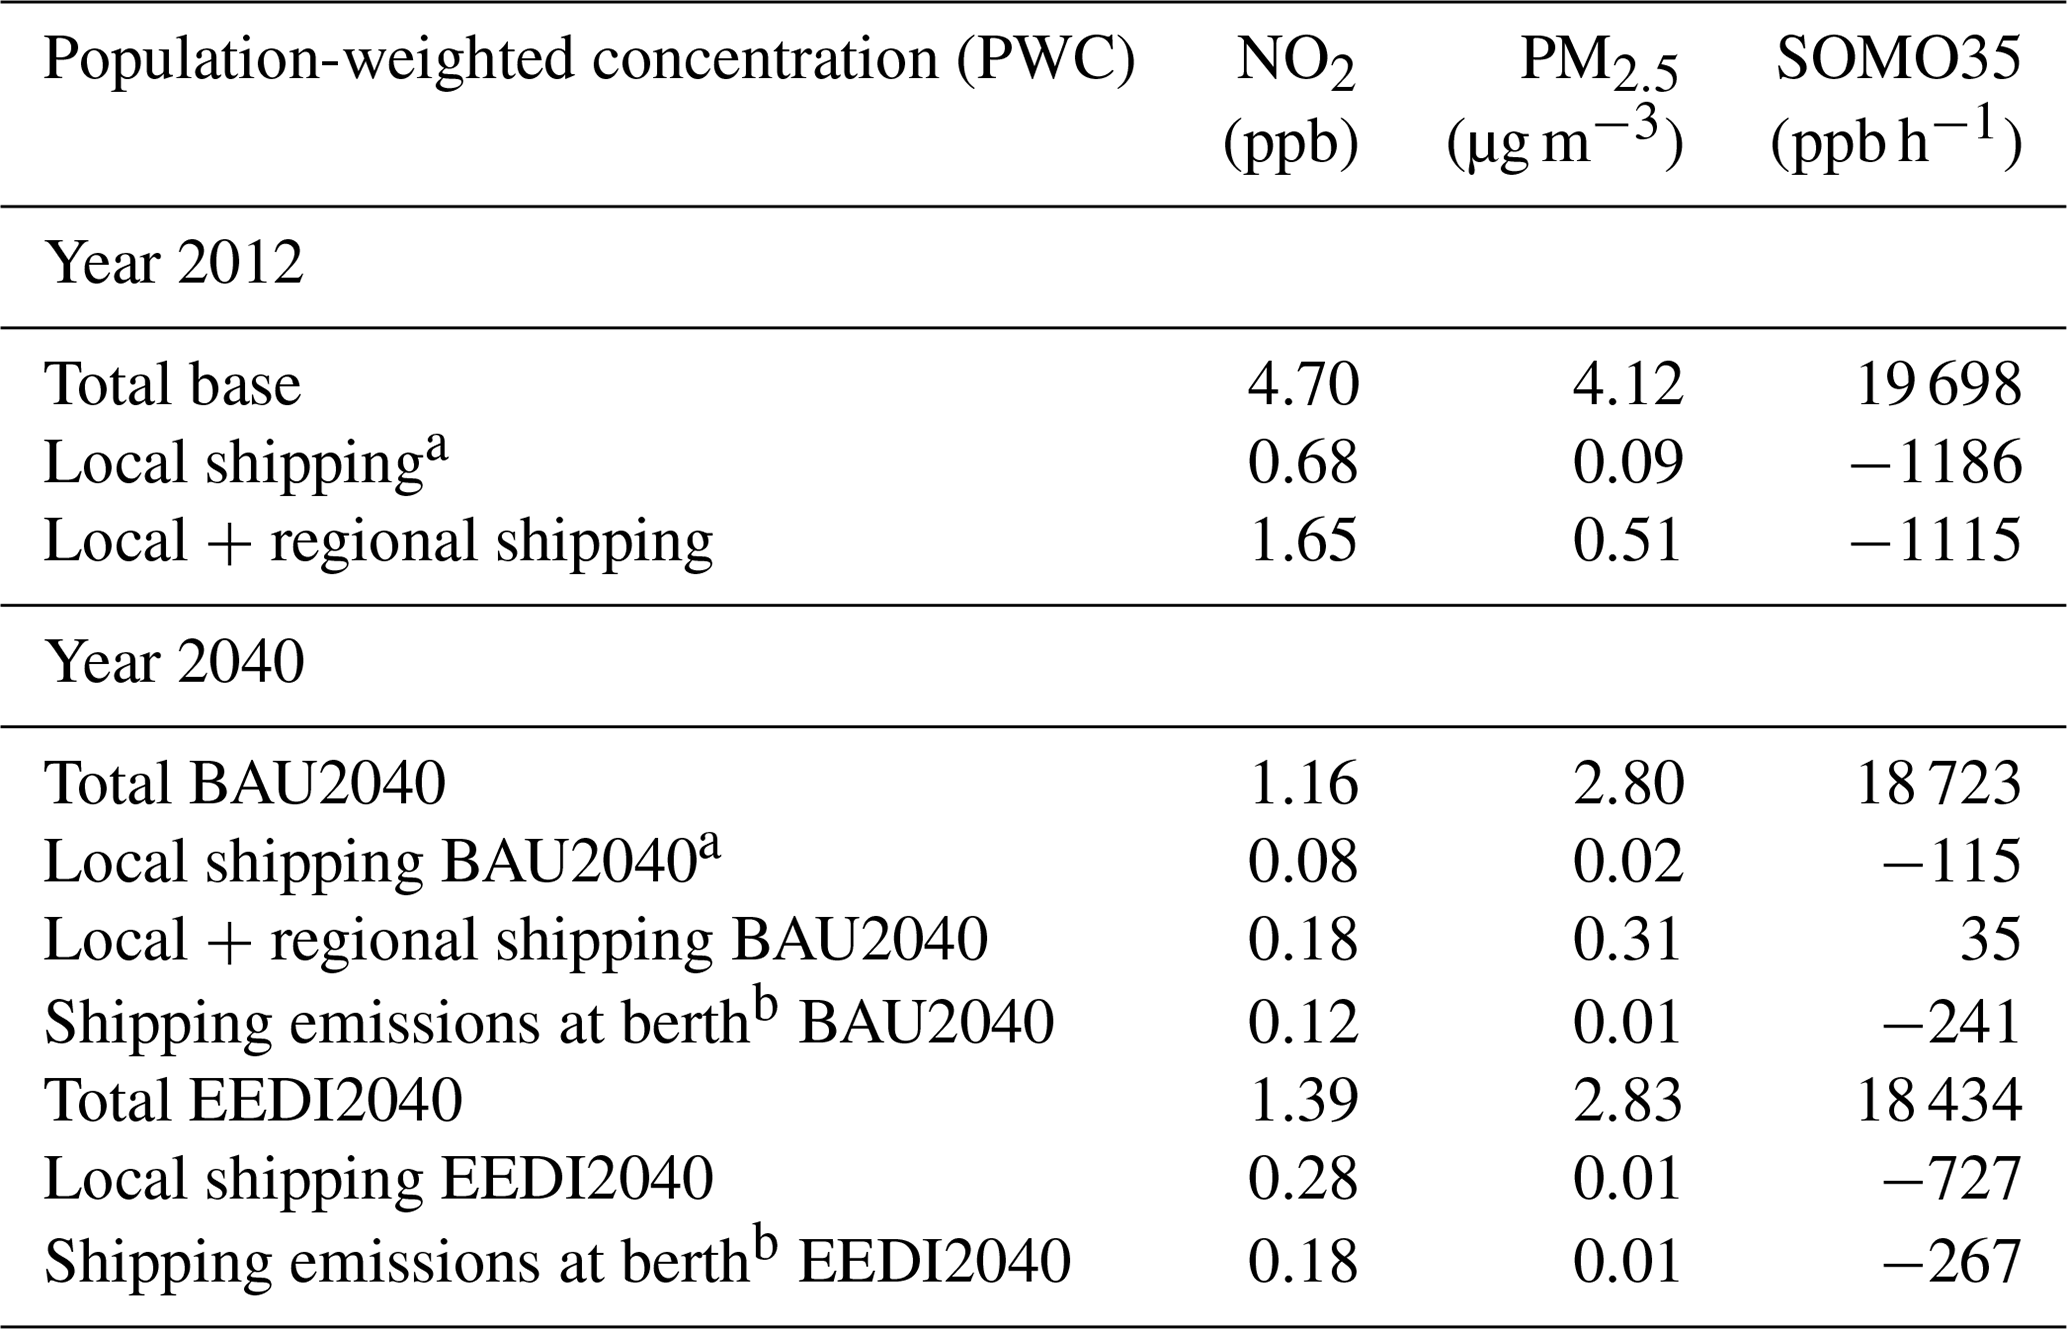
a Includes emissions at berth. b Emissions avoided by being replaced by land power in the BAU2040LP and EEDI2040LP scenarios.
4.2 Influence of ship emissions in the future scenarios: BAU
The modelled contributions of local shipping to atmospheric concentrations and relative contributions to the overall air pollution in Gothenburg in the BAU2040 scenario show high reductions relative to the year 2012 for all pollutants under investigation except of O3, which is slightly increasing (Fig. 6). Higher absolute and relative contributions of local shipping are detected in and around the port area, while there are some minor impacts in the northern urban area of Gothenburg due to predominant winds from the southwest. This general pattern also holds true for the EEDI2040 scenario. The maximum value for the contribution to annual mean NO2 concentrations in BAU2040 merely reaches 1 ppb in the port area and is about 80 % lower compared to a maximum of 4.1 ppb in 2012. In the EEDI2040 scenario the maximum ship contribution to NO2 is slightly higher with 1.4 ppb. The relative contribution of shipping given as annual average in the entire model domain changed from 14 % to 6 % in BAU2040. In the EEDI2040 scenario, the relative contribution of local shipping to the annually averaged grid means reaches 18 %. The relative contributions of shipping in the port area of Gothenburg is up to 25 % in BAU2040 and up to 45 % in EEDI2040. In 2012, NO2 concentrations due to shipping are involved as a precursor in the photochemical reaction-cycle of O3 formation and form a depletion pattern around the harbour area with up to −4 ppb O3. Following the principles of O3 formation in a high-NOx environment the pattern shows ozone formation from shipping emissions further from the harbour area. The same pattern is visible in future scenarios but with only a small depletion of −0.5 ppb O3 at most in BAU2040 and −1.2 ppb O3 in EEDI2040. While in 2012, O3 concentrations increase by up to 8 % (∼2 ppb) outside the port area, in the future scenarios shipping-related O3 concentrations are on average around 0, except for the area with industrial emission sources in the west. Here, high VOC emissions from the industrial sources react with NOx emissions from nearby shipping and form about 1 ppb O3 at most, which can be accounted to shipping activities. Nevertheless, the overall contribution of shipping to increased NO2 and O3 concentrations is very low in both future scenarios.
The pollutants PM2.5 and SO2 show similar reduction patterns in the future scenarios. The huge reductions in PM2.5 (−85 %) and SO2 (−91 %) emissions are consequently leading to a reduced impact of shipping in BAU2040. The contribution of PM2.5 from local ship emissions is relatively low in 2012 (maximum of 0.9 µg m−3 in the western port area), and even lower (maximum of 0.15 µg m−3 in the western port area) in the BAU2040 scenario. The SO2 concentrations in the Gothenburg area are driven by industrial and shipping emissions, which account for more than 99 % of the total, both in 2012 and in BAU2040. Between 2012 and BAU2040 the SO2 emissions from shipping decreased by 91 % and therefore the concentration of SO2 decreased as well. While there has been a relative contribution of shipping to SO2 concentrations in summer of about 70 % in the harbour and its surrounding areas in 2012 (concentration contribution maxima of up to 0.7 µg m−3), in the 2040BAU scenario the contributions are below 20 % with a maximum concentration contribution of less than 0.2 µg m−3 to the summer mean. To summarize, the air pollution from shipping in the BAU2040 scenario reflects the large emission reductions compared to 2012, resulting in very low contributions to atmospheric pollution levels.
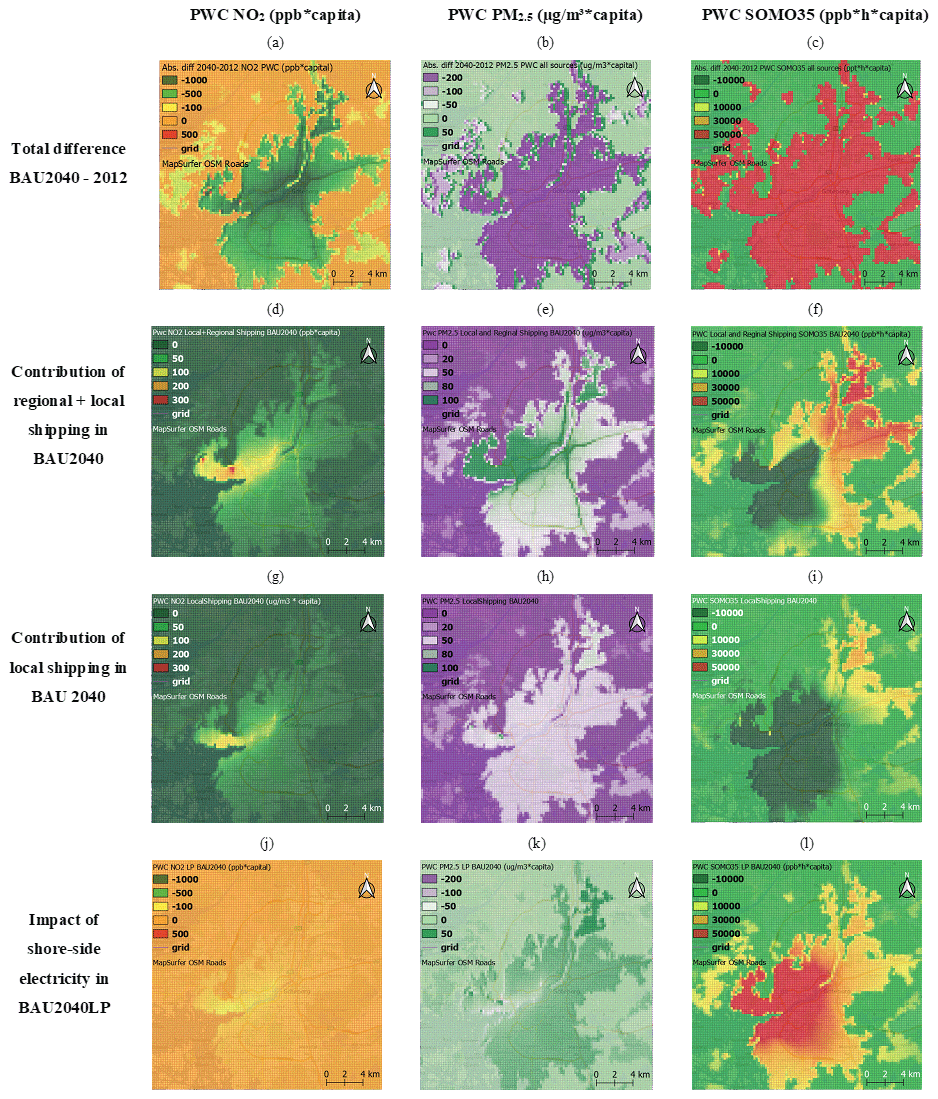
Figure 8Absolute contributions of total concentration changes between 2012 and 2040 to PWC in Gothenburg (a–c). Contribution of all shipping (regional + local) in BAU2040 to PWC (d–f). Contribution of local shipping in BAU2040 to PWC (g–i). Impact of implementation of shoreside electricity on PWC (j–l). ©OpenStreetMap contributors 2019. Distributed under a Creative Commons BY-SA License.
4.3 Influence of shoreside electricity use in future scenarios
The model simulations show that the contribution of shipping to air pollution in Gothenburg in the future scenarios is focussed on the port area (Fig. 6). The results for the shoreside electricity scenario BAU2040LP show visible reductions in NO2, PM2.5, and SO2 concentrations in the port area (Fig. 7). For NO2, local concentration reductions in the port area are up to 25 % in comparison to BAU2040, and for the EEDI2040LP scenario, the NO2 reduction due to the shoreside electricity is up to 30 % (Fig. 6). In the surrounding areas of Gothenburg, the reductions range between 1 % and 15 %. In terms of O3, replacement of emissions from auxiliary engines at berth with electricity (BAU2040LP scenario) causes an increase of up to 2.5 %. In the EEDI2040LP scenario the relative increase in annual mean O3 concentrations compared to the EEDI2040 scenario is up to 3 % (Fig. 7). In both scenarios, the decrease in NOx emissions leads to an increase in O3 concentrations due to less titration of O3. The results for PM2.5 and SO2 show similar characteristics. BAU2040LP and EEDI2040LP lead to additional local reduction potentials of up to 3 % for PM2.5 and 12 % for SO2 in the port area, but almost no difference can be seen outside the port area. EEDI2040LP shows a slightly higher reduction potential than BAU2040LP. In total, the implementation of shoreside electricity is clearly beneficial to reduce the impact of shipping emissions and therefore increase the air quality in areas close to the port.
Table 4Health impacts calculated for BAU2040 and EEDI2040 scenarios with ARP and RAINS methodologies: emissions at berth – impacts potentially avoided by the shore-site electricity implementation (BAU2040 – BAU2040-LP and EEID2040 – EEID2040LP); local shipping – impacts of all local shipping emissions in the model domain, including emissions at berth; local + regional shipping – impacts of all shipping emissions including the regional shipping emissions in the Baltic Sea and the North Sea in the model boundary conditions; total exposure – impacts of the total PWC for PM2.5, NO2, and ozone as SOMO35 in the model domain.

* Emissions at berth avoided by being replaced by land power in the LP scenarios. ** Includes emissions at berth.
5.1 Impact of future shipping on population exposure
Table 3 shows PWCs for NO2, PM2.5, and O3 (expressed as SOMO35) in the inner model domain for the year 2012 and the investigated scenarios BAU2040 and EEDI2040. PWCs attributed to local and regional shipping in the Gothenburg area and the effect of shoreside electricity in BAU2040LP and EEDI2040LP are also shown.
The calculated exposure to PM2.5 was ∼2.8 µg m−3 in the scenarios BAU2040 and EEDI2040 with a large part of the exposure originating from the regional background. The calculated decrease due to the reductions in anthropogenic emissions between 2012 and 2040 is one-third. The contribution of local shipping to PM2.5 exposure was less than 1 % (<0.02 µg m−3) in all scenarios. In the BAU2040 scenario, emissions from ships at berth which can be replaced by shoreside electricity in the BAU2040LP scenario caused approximately 50 % of the PM2.5 exposure attributed to the local shipping. In the EEDI2040LP scenario the shipping emissions at berth are responsible for more than 90 % of the exposure attributed to local shipping. Although the BAU2040LP and EEDI2040LP scenarios imply a relative emission reduction of 62 % (compared to BAU2040 and EEDI2040, respectively) due to shoreside electricity use at berth, the impact in terms of absolute concentrations is less than 0.01 µg m−3 in both scenarios. When additionally the contribution of emissions from regional shipping in the Baltic Sea and the North Sea is considered, the contribution of shipping to PM2.5 exposure in the BAU2040 scenario of 11 % (0.3 µg m−3) is substantially larger than that of the local shipping. This is due to the large impact of secondary particulate matter formed during the atmospheric transport of the more distant emissions. This secondary PM is calculated in the CMAQ model providing the boundary conditions for the TAPM simulations, and it considers mainly particulate sulfate and nitrate since VOC emissions from shipping are not included in that simulation.
The contribution of shipping to the PWC of NO2 is about 10 % in the BAU2040 scenario and 20 % in the EEDI2040 scenario (0.1 and 0.3 ppb contributions, respectively). Thus, there is a clear impact of higher improved energy efficiency. When the contribution of regional shipping is also considered in the BAU2040 scenario, the contribution of all shipping to the NO2 exposure is 16 % (0.18 ppb); the regional shipping contribution is not as important as in the case of exposure to PM2.5. One reason is that emissions of primary PM from shipping are approximately 30 times lower than emissions of NOx and ∼3 times lower than emissions of SO2, which makes the contribution of secondary PM formed from the more distant emissions relatively more important compared to the local emissions of primary PM. Another reason is the longer lifetime of secondary components in the atmosphere.
In all modelled scenarios the impact of local shipping decreased the population exposure to O3 due to less titration in the absence of NOx sources. Nevertheless, when the impact of regional shipping is included in the BAU2040 scenario, shipping emissions cause small increases in exposure to O3. The O3 exposure attributed to local shipping, however, only considers population in the local region, while one can expect O3 formation to cause an increase in exposure for the population living further away from the city.
In total, a very low impact of PM2.5 due to local shipping activities was simulated for the scenarios with and without shoreside electricity. In all cases, the regional background can be considered as the main contributor to PM2.5 exposure in the urban area. For NO2 the contribution of shipping-related concentrations to the total air pollution is significant within both scenarios (with and without shoreside electricity reduction scenarios) in 2040, with important, but lower, contributions from regional background concentrations compared to PM2.5. Nevertheless, the BAU2040LP and EEDI2040LP scenarios show a high reduction potential and benefits for the air quality in densely located areas.
The contribution of air pollution levels to the overall population exposure expressed as PWC depends on the relationship between spatial distribution of concentrations of air pollutants and the population density. Figure 8 shows products of mean concentration and population in each model grid cell with a resolution of 250 m×250 m, which represent exposure in the domain. Compared to the air quality situation in 2012 (Fig. 8a–c), the exposure to NO2 and PM2.5 will decrease in the densely populated area in 2040, especially due to reduced emissions from road traffic. On the other hand, O3 exposure is increasing correspondingly because of reduced local O3 titration caused by decreased NOx emissions in most parts of the city. The spatial patterns of NO2 and PM2.5 exposure from local shipping (Fig. 8g–i) are dominated by gradients in the concentration fields with highest reduction around the city ports north of the Göta älv. The contribution of regional and local shipping to total exposure (Fig. 8d–f) for NO2 and PM2.5 is higher in a larger city area since regional-shipping-related NO2 and PM2.5 exposure is evenly distributed over the city. The introduction of onshore electricity (Fig. 8j–l) gives visible reductions in the port area for exposure to NO2 ( ppb × capita) and PM2.5 ( µg m−3) due to the emissions avoided by shoreside electricity.
5.2 Impact of future shipping on health effects
Table 4 gives an overview of health impacts calculated for the exposure to PM2.5, NO2, and O3 in terms of mortalities and years of life lost (YOLLs). The results show that in 2040 all shipping-related PM2.5, including the regional shipping, would cause 13 premature deaths per year corresponding to a shortened lifetime of 0.009 years per person (3.4 d) in the BAU2040 scenario. The majority of the impact (over 90 %) can be associated with the regional shipping outside the city. Impacts from local shipping in Gothenburg were found to be small: less than one premature death in the city, corresponding to 0.0006 and 0.0004 YOLLs per person in the BAU2040 and EEDI2040 scenario, respectively (∼0.2 d). Shoreside electricity reduced the impact of PM2.5 from local shipping by ca. 40 % and 80 % in the BAU2040LP and EEDI2040LP scenarios, respectively, but only by a few percent if regional shipping is also considered in the BAU2040 scenario. The impacts from the short-term exposure to NO2 were calculated to be 0.36 premature deaths per year in the model domain for all shipping in the BAU2040 scenario, 0.17 premature death (46 %) being attributed to local shipping. In the EEDI2040 scenario the NO2 impact from local shipping was larger, 0.55 premature deaths per year. Impacts from short-term exposure to O3 associated with shipping were calculated as being 0.02 premature deaths in the BAU2040 scenario when all shipping is considered. As emissions from the local shipping lead to a decrease in O3 concentrations in the city, the impact of local shipping would decrease mortalities with 0.1 and 0.4 premature deaths per year in the BAU2040 and EEDI2040 scenarios, respectively.
The impact of climate policy measures in the shipping sector has been addressed in Cofala et al. (2018), too, in a study using similar methods as here. The study includes two base scenarios, one without and one with climate policy measures; the former keeps the shipping emissions 45 % higher than the latter in 2040. Comparison of the data supplement in Cofala et al. (2018) shows that the PM2.5-related mortalities caused by shipping decreased by 1.7 % (∼300 YOLLs per year) for Sweden and by 2 % (∼35 000 YOLLs per year) for the EU including UK, Norway, and Switzerland in the climate measures' scenario compared to the scenario without measures. Mortalities caused by O3 exposure related to shipping emissions decreased between these two scenarios by 4.3 % (6 premature deaths) for Sweden and by 5.4 % (848 premature deaths) for the EU in 2040. The results for PM2.5 are in line with our findings, and if we scale up our results to all of Sweden and account for the difference between the relative emission change in the scenarios by Cofala et al. (2018) and ours, we find rather similar result (∼10 % difference). For O3 the change between the scenarios in our study is of opposite sign than in Cofala et al. (2018), indicating a difference in the O3 formation regime in the two air pollution models used.
We investigated the future effect of shipping emissions on air quality and related health effects considering different scenarios of the development of shipping under current regional trends of economic growth and already decided regulations in the Gothenburg urban area in 2040. Additionally, we investigated the impact of a large-scale implementation of shoreside electricity in the Port of Gothenburg. For this purpose, we established a one-way nested CTM system from the global to the urban scale, to calculate pollutant concentrations, population-weighted concentrations, and health effects related to NO2, PM2.5, and O3. This paper is the second part of a study about the current and future air quality situation in the Gothenburg urban area. Part 1 by Tang et al. (2020) introduced, evaluated, and discussed air pollutant concentrations, population-weighted concentration, and health effects for the year 2012 and is published in the same special issue.
The simulated concentrations of NO2 and PM2.5 in future scenarios for the year 2040 are in general very low with up to 4 ppb for NO2 and up to 3.5 µg m−3 for PM2.5 in the urban areas distant to the port area. Nevertheless, two hotspots of NO2 and PM2.5 with higher concentrations are located west of the city. These hotspots are due to industrial emissions, in particular from refineries. Compared to 2012 the simulated overall exposure to PM2.5 decreased by approximately 30 % in the BAU scenario for 2040. For NO2 the decrease was more than 60 %. The simulated concentrations of ozone increased between 2012 and 2040 by about 20 %. This increase results from both higher concentrations simulated in the regional model domain and transported through the boundaries into the city domain and from lower O3 titration by reduced NOx emissions. Local shipping also contributes to the titration causing negative contributions to O3 concentrations. The impact of the background shipping, however, causes O3 formation in the city domain, and the overall impact of shipping on O3 concentrations is a net O3 formation.
In general, the contributions of local shipping emissions in 2040 focus on the harbour area. Only to some extent do they influence the rest of the city domain. For NO2 there are in maximum local shipping contributions of more than 30 % to the total concentrations, located in the port and the area surrounding it, while contributions of the local shipping activities to the NO2 concentrations in other parts of the city are up to 10 % only. The contributions of PM2.5 by shipping activities are generally much lower (up to 3 % at most) and follow the same trend with higher contributions located in the harbour area and its surroundings and lower impacts in the other areas.
The simulated impact of a wide use of shoreside electricity for shipping in 2040 shows similar spatial patterns for NO2 and PM2.5. For NO2, local concentration reductions in the port area range between 25 % and 30 % at most, depending on the individual scenario. In the surrounding areas of Gothenburg, the reductions range between 1 % and 15 %. In terms of O3, replacement of emissions from auxiliary engines at berth with electricity causes an increase of up to 2.5 %–3 %, depending on the scenario. Implementation of shoreside electricity for ships at berth leads to an additional local reduction potential of up to 3 % for PM2.5 and 12 % for SO2 in the port area, but almost no difference can be seen outside the port area. In total, the implementation of shoreside electricity is clearly beneficial to reduce the impact of shipping emissions, and it therefore improves air quality in areas close to the port. Moreover, the strict regulations as simulated in the BAU2040 scenario are of a high value for an improved air quality in the urban area of Gothenburg.
In 2040 simulations the air quality situation in the city improves considerably and the concentrations will be below the air quality limit and target values both for NO2 and PM2.5 in the city, even if the potential underestimates of the model system are accounted for (Tang et al., 2020). From the static point of view of the year 2040 the conclusion that additional measures to reduce air pollution levels beyond those in the BAU scenario would not be necessary could be drawn. However, in perspective, taking also the temporal development into consideration, the measures reducing concentrations of NO2 will be implemented only at a slow pace and the full impact of many of them, especially those targeting shipping, will first be seen in the time horizon of 2040. The local measures could, on the other hand, be implemented faster and the significant reduction in NO2 concentrations from the implementation of onshore electricity could thus reduce the time before the air quality targets are met in the city.
Calculated population-weighted concentrations and health impacts follow the same trends. The PM2.5 contribution of local shipping to PWC of PM2.5 is below 1 % for all scenarios, but the contribution of regional shipping outside the city domain is still of importance: in the BAU2040 scenario, its contribution is about 10 %. Relative to 2012 the exposure to PM2.5 from local shipping decreased by more than 80 % in all scenarios for 2040, while the impact of all shipping including the regional contribution decreased by only 40 %. The local shipping contribution to PWC of NO2 is much more pronounced, being 10 % for the BAU2040 and 20 % for the EEDI2040 scenario. In the BAU scenario, regional shipping contributed an additional 6 % to the PWC of NO2. In comparison to 2012, exposure to NO2 from local shipping decreased by approximately 50 % for the EEDI2040 scenario and by more than 80 % for the BAU2040 scenario. In the BAU2040 scenario exposure to NO2 from all shipping, including the regional contribution, decreased by 86 %. The PWC of ozone, given as SOMO35, increased in the model domain by about 20 %, following the trends in concentrations.
The most serious health effects were associated with PM2.5. It needs to be emphasized that the effects presented in Table 3 cannot be added due to a risk of double-counting, especially concerning PM2.5 and NO2. Between 2012 and 2040 we can see a large decrease in mortality caused by PM2.5 associated with shipping; in the future reference scenario (BAU2040) the total decrease is 86 %. For the whole city domain, this results in nine premature deaths per year that are avoided, corresponding to 67 YOLLs per year. This decrease is mainly associated with the decrease in emissions due to strengthened SECA legislation introduced in 2015. The introduction of the NECA legislation in 2021, with a rather slow uptake of abatement technologies for the reduction in NOx emissions, as well as climate policy measures implemented in terms of energy effectivization of the fleet, will lead to an additional reduction in CO2 emissions and those of other air pollutants. Partial impacts of these three aspects have not been studied here.
As already discussed in Tang et al. (2020), Jonson et al. (2019) studied the impact of an introduction of strengthened sulfur limits in 2015 and found an approximately 35 % reduction in the impact from the regional shipping contribution to PM2.5 around Gothenburg. The global study of Sofiev et al. (2018) shows that the impact of the global cap down to 0.5 % FSC does not have any significant impact on a further reduction in shipping-related air pollution around the Swedish west coast. The calculated decrease in PM2.5 was below 1 %. Only limited impacts of these two regulations on emission from the local shipping in Gothenburg can be expected since ships at berth have been using fuels with maximum FSC of 0.1 % since 2010 already.
In this study, the impact of the improved energy efficiency can be obtained by comparing the BAU scenario with the EEDI scenario, the latter showing approx. 30 % higher emissions. The impact on health effects from exposure to PM2.5 in the city domain is rather low: 1.2 % only. The impact of the higher emissions on exposure to NO2 is much more important with 17 %, while exposure to ozone is 1.6 % lower in the EEDI scenario compared to BAU.
Nevertheless, when it comes to the applied static exposure approach to calculate PWC and health effects, the underlying assumption is that people are at residential addresses throughout the time. Thus, static exposure does not account for spatial and temporal variability of population activities and will lead to uncertainties in calculated exposure and introduce potential bias in the quantification of human health effects. Several exposure modelling studies have overcome this traditional approach and are using population activity data, derived from surveys, individual GIS data or generic data, and models to account for the diurnal variation in population numbers in different locations (e.g. Beckx et al., 2009; Smith et al., 2016; Ramacher et al., 2019; Ramacher and Karl, 2020; Reis et al., 2018; Soares et al., 2014). Thus, to model population numbers suitable for exposure calculations, it is generally necessary to know the population distribution and characterization and therefore the number of people and diurnal activity patterns of different characteristic population groups. In future studies we plan to account for population dynamics by applying averaged generic population activity profiles, which are additionally diversified by demographic groups in different microenvironments, such as residential environments, work environments, or traffic environments. This will allow for a better representation of pollutant concentrations people are exposed to and the related health effects that are based on exposure calculations.
Impacts of the local shipping emissions on air quality and human health are further discussed and evaluated for the year 2012 in the Part I paper (Tang et al., 2020).
The TAPM model is a commercial software available at CSIRO, Australia (https://doi.org/10.1016/j.envsoft.2004.04.006, Hurley et al., 2005). STEAM is the intellectual property of the Finnish Meteorological Institute and is not publicly available. The ARP tool (Holland et al. 2013) is the intellectual property of Mike Holland and Joe Sparado (mike.holland@emrc.co.uk) and is not publicly available.
The model output data are available upon request from the corresponding authors.
The supplement related to this article is available online at: https://doi.org/10.5194/acp-20-10667-2020-supplement.
MOPR, LT, JM, and VM designed the model simulations. LJ calculated ship emissions with STEAM and contributed text about the shipping emissions. LT prepared ship emission files for the model simulations. EF prepared future scenarios. LT and JM prepared emission data from other sources. MK prepared data from the regional-scale simulation used for the boundary. MOPR and LT prepared the model setup and other input data, performed the model simulations, and evaluated the model results. LT calculated exposures, and JM calculated the health impacts. MOPR and JM wrote the major part of the text with assistance from LT and VM.
The authors declare that they have no conflict of interest.
This article is part of the special issue “Shipping and the Environment – From Regional to Global Perspectives (ACP/OS inter-journal SI)”. It is a result of the Shipping and the Environment – From Regional to Global Perspectives, Gothenburg, Sweden, 23–24 October 2017.
The air quality model CMAQ is developed and maintained by the U.S. Environmental Protection Agency (US EPA). COSMO-CLM is the community model of German climate research (https://wiki.coast.hzg.de/clmcom, last access: 8 September 2020). The simulations with COSMO-CLM and CMAQ were performed at the German Climate Computing Centre (DKRZ) within the project “Regional Atmospheric Modelling” (Project Id 0302). The Swedish Meteorological and Hydrological Institute (SMHI) is thanked for making available the precipitation data from rain gauge stations in Sweden. Zbigniew Klimont (IIASA) is thanked for emission data for the 2040 CLE scenario from ECLIPSE v5. The NILU (Norsk institutt for luftforskning) is thanked for the EBAS database maintenance and data provision. Sara Jutterström (IVL) is thanked for good collaboration and discussion of model results on deposition of nitrogen and sulfur.
This research has been supported by BONUS (grant no. Call 2014-41, BONUS SHEBA project) and the INTERREG Baltic Sea Region (grant no. C006 Project platform CSHIPP).
The article processing charges for this open-access
publication were covered by a Research
Centre of the Helmholtz Association.
This paper was edited by Huan Liu and reviewed by two anonymous referees.
Amman, M., Cofala, J., Heyes, C., Klimont, Z., Mechler, R., Posch, M., and Schöpp, W.: The RAINS model: Documentation of the model approach prepared for the RAINS peer review 2004, Interim Report IR-04-075, available at: http://pure.iiasa.ac.at/id/eprint/7307/1/IR-04-075.pdf, last access: 8 January 2020, 2004.
Azzi, M., Johnson, G. M., and Cope, M.: An introduction to the generic reaction set photochemical smog mechanism, in: Proceedings of the 8th International Clean Air Conference, Clean Air Society of Australia & New Zealand (Ed.), 8th International Clean Air Conference, Melbourne, 6–11 May, Melbourne, 1984.
Beckx, C., Int Panis, L., Arentze, T., Janssens, D., Torfs, R., Broekx, S., and Wets, G.: A dynamic activity-based population modelling approach to evaluate exposure to air pollution: Methods and application to a Dutch urban area, Euro. Env. Imp. Assess., 29, 179–185, https://doi.org/10.1016/j.eiar.2008.10.001, 2009.
Bieser, J., Aulinger, A., Matthias, V., Quante, M., and Builtjes, P.: SMOKE for Europe – adaptation, modification and evaluation of a comprehensive emission model for Europe, Geosci. Model Dev., 4, 47–68, https://doi.org/10.5194/gmd-4-47-2011, 2011.
Byun, D. and Schere, K. L.: Review of the Governing Equations, Computational Algorithms, and Other Components of the Models-3 Community Multiscale Air Quality (CMAQ) Modeling System, Appl. Mech. Rev., 59, 51–77, https://doi.org/10.1115/1.2128636, 2006.
Cofala, J., Amann, M., Borken-Kleefeld, J., Gomez-Sanabria, A., Heyes, C., Kiesewetter, G., Sander, R., Schoepp, W., Holland, M., Fagerli, H., and Nyiri, A.: The potential for cost-effective air emission reductions from international shipping through designation of further Emission Control Areas in EU waters with focus on the Mediterranean Sea: IIASA Research Report, International Institute for Applied Systems Analysis (IIASA), Laxenburg, Austria, 2018.
Corbett, J. J., Fischbeck, P. S., and Pandis, S. N.: Global nitrogen and sulfur inventories for oceangoing ships, J. Geophys. Res., 104, 3457–3470, https://doi.org/10.1029/1998JD100040, 1999.
EU: DIRECTIVE 2005/33/EC OF THE EUROPEAN PARLIAMENT AND OF THE COUNCIL of 6 July 2005 amending Directive 1999/32/EC as regards the sulphur content of marine fuels: available at: https://eur-lex.europa.eu/LexUriServ/LexUriServ.do?uri=OJ:L:2005:191:0059:0069:EN:PDF (last access: 25 March 2020), 2005.
EU: DIRECTIVE 2012/33/EC OF THE EUROPEAN PARLIAMENT AND OF THE COUNCIL of 21 November 2012 amending Directive 1999/32/EC as regards the sulphur content of marine fuels: available at: https://eur-lex.europa.eu/LexUriServ/LexUriServ.do?uri=OJ:L:2012:327:0001:0013:en:PDF (last access: 25 March 2020), 2012.
Eyring, V., Isaksen, I. S. A., Berntsen, T., Collins, W. J., Corbett, J. J., Endresen, O., Grainger, R. G., Moldanova, J., Schlager, H., and Stevenson, D. S.: Transport impacts on atmosphere and climate: Shipping, Atmos. Environ., 44, 4735–4771, https://doi.org/10.1016/j.atmosenv.2009.04.059, 2010.
Fridell, E. and Salo, K.: Measurements of abatement of particles and exhaust gases in a marine gas scrubber, Proc. IMechE, 230, 154–162, https://doi.org/10.1177/1475090214543716, 2016.
Fridell, E., Haeger-Eugensson, M., Moldanova, J., Forsberg, B., and Sjöberg, K.: A modelling study of the impact on air quality and health due to the emissions from E85 and petrol fuelled cars in Sweden, Atmos. Environ., 82, 1–8, https://doi.org/10.1016/j.atmosenv.2013.10.002, 2014.
Fridell, E., Winnes, H., Parsmo, R., Boteler, B., Troeltzsch, J., Kowalczyk, U., Piotrowicz, J., Jalkanen, J.-P., Johansson, L., Matthias, V., and Ytreberg, E.: Sustainable Shipping and Environment of the Baltic Sea Region (SHEBA) Deliverable 1.4, type RE: Future Scenarios: available at: https://www.sheba-project.eu/imperia/md/content/sheba/deliverables/sheba_d1.4_final.pdf (last access: 7 September 2020), 2015.
Gallego, E., Roca, F. J., Perales, J. F., Guardino, X., Gadea, E., and Garrote, P.: Impact of formaldehyde and VOCs from waste treatment plants upon the ambient air nearby an urban area (Spain), The Sci. Total Environ., 568, 369–380, https://doi.org/10.1016/j.scitotenv.2016.06.007, 2016.
Geyer, B.: High-resolution atmospheric reconstruction for Europe 1948–2012: coastDat2, Earth Syst. Sci. Data, 6, 147–164, https://doi.org/10.5194/essd-6-147-2014, 2014.
Heroux, M. E., Braubach, M., Korol, N., Krzyzanowski, M., Paunovic, E., and Zastenskaya, I.: The main conclusions about the medical aspects of air pollution: The projects REVIHAAP and HRAPIE WHO/EC, Gigiena i sanitariia, 9–14, 2013.
Holland, M. R., Pye, S., and Jones, G.: EC4MACS Modelling Methodology – The ALPHA Benefit Assessment Model, 2013.
Hurley, P. J., Physick, W. L., and Luhar, A. K.: TAPM: A practical approach to prognostic meteorological and air pollution modelling, Environ. Modell. Softw., 20, 737–752, https://doi.org/10.1016/j.envsoft.2004.04.006, 2005.
IMO: Amendments to the Annex of the Protocol of 1997 to Amend the International Convention for the Prevention of Pollution from Ships, 1973, as Modified by the Protocol of 1978 Relating thereto (Revised MARPOL Annex VI): Resolution MEPC 176 (58), availble at: http://www.imo.org/en/KnowledgeCentre/IndexofIMOResolutions/Marine-Environment-Protection-Committee-(MEPC)/Documents/MEPC.176(58).pdf (last access: 25 March 2020), 2008.
IMO: Amendments to the Annex of the Protocol of 1997 to Amend the International Convention for the Prevention of Pollution from Ships, 1973, as Modified by the Protocol of 1978 Relating thereto. (Inclusion of regulations on energy efficiency for ships in MARPOL Annex VI), available at: http://www.imo.org/en/OurWork/Environment/PollutionPrevention/AirPollution/Documents/Technical and Operational Measures/Resolution MEPC.203(62).pdf (last access: 25 March 2020), 2011.
IMO: Amendments to the Annex of the Protocol of 1997 to Amend the International Convention for the Prevention of Pollution from Ships, 1973, as Modified by the Protocol of 1978 Relating thereto. (Amendments to regulations 2, 13, 19, 20 and 21 and the Supplement to the IAPP Certificate under MARPOL Annex VI and certification of dual-fuel engines under the NOX Technical Code 2008): Resolution MEPC 251(66): available at: http://www.imo.org/en/KnowledgeCentre/IndexofIMOResolutions/Marine-Environment-Protection-Committee-(MEPC)/Documents/MEPC.251(66).pdf (last access: 25 March 2020), 2014.
IMO: Amendments to the Annex of the Protocol of 1997 to Amend the International Convention for the Prevention of Pollution from Ships, 1973, as Modified by the Protocol of 1978 Relating thereto. (Designation of the Baltic Sea and the North Sea Emission Control Areas for NOX Tier III control): Resolution MEPC 286(71), available at: http://www.imo.org/en/KnowledgeCentre/IndexofIMOResolutions/Marine-Environment-Protection-Committee-(MEPC)/Documents/MEPC.286(71).pdf (last access: 25 March 2020), 2017.
IMO: Initial IMO strategy on reduction of GHG emissions from ships: Resolution MEPC 304(72): available at: http://www.imo.org/en/KnowledgeCentre/IndexofIMOResolutions/Marine-Environment-Protection-Committee-(MEPC)/Documents/MEPC.304(72).pdf (last access: 25 March 2020), 2018.
Jalkanen, J.-P., Brink, A., Kalli, J., Pettersson, H., Kukkonen, J., and Stipa, T.: A modelling system for the exhaust emissions of marine traffic and its application in the Baltic Sea area, Atmos. Chem. Phys., 9, 9209–9223, https://doi.org/10.5194/acp-9-9209-2009, 2009.
Jalkanen, J.-P., Johansson, L., Kukkonen, J., Brink, A., Kalli, J., and Stipa, T.: Extension of an assessment model of ship traffic exhaust emissions for particulate matter and carbon monoxide, Atmos. Chem. Phys., 12, 2641–2659, https://doi.org/10.5194/acp-12-2641-2012, 2012.
Johansson, L., Jalkanen, J.-P., Kalli, J., and Kukkonen, J.: The evolution of shipping emissions and the costs of regulation changes in the northern EU area, Atmos. Chem. Phys., 13, 11375–11389, https://doi.org/10.5194/acp-13-11375-2013, 2013.
Jonson, J. E., Jalkanen, J. P., Johansson, L., Gauss, M., and Denier van der Gon, H. A. C.: Model calculations of the effects of present and future emissions of air pollutants from shipping in the Baltic Sea and the North Sea, Atmos. Chem. Phys., 15, 783–798, https://doi.org/10.5194/acp-15-783-2015, 2015.
Jonson, J. E., Gauss, M., Jalkanen, J.-P., and Johansson, L.: Effects of strengthening the Baltic Sea ECA regulations, Atmos. Chem. Phys., 19, 13469–13487, https://doi.org/10.5194/acp-19-13469-2019, 2019.
Kalli, J., Jalkanen, J.-P., Johansson, L., and Repka, S.: Atmospheric emissions of European SECA shipping: long-term projections, WMU J. Marit. Affairs, 12, 129–145, https://doi.org/10.1007/s13437-013-0050-9, 2013.
Karl, M., Bieser, J., Geyer, B., Matthias, V., Jalkanen, J.-P., Johansson, L., and Fridell, E.: Impact of a nitrogen emission control area (NECA) on the future air quality and nitrogen deposition to seawater in the Baltic Sea region, Atmos. Chem. Phys., 19, 1721–1752, https://doi.org/10.5194/acp-19-1721-2019, 2019a.
Karl, M., Jonson, J. E., Uppstu, A., Aulinger, A., Prank, M., Sofiev, M., Jalkanen, J.-P., Johansson, L., Quante, M., and Matthias, V.: Effects of ship emissions on air quality in the Baltic Sea region simulated with three different chemistry transport models, Atmos. Chem. Phys., 19, 7019–7053, https://doi.org/10.5194/acp-19-7019-2019, 2019b.
Keller, M., Hausberger, S., Matzer, C., Wüthrich, P., and Notter, B.: HBEFA Version 3.3: Background Documentation, available at: http://www.hbefa.net/e/documents/HBEFA33_Documentation_20170425.pdf (last access: 8 January 2020), 2017.
Kiesewetter, G., Borken-Kleefeld, J., Schöpp, W., Heyes, C., Thunis, P., Bessagnet, B., Terrenoire, E., Gsella, A., and Amann, M.: Modelling NO2 concentrations at the street level in the GAINS integrated assessment model: projections under current legislation, Atmos. Chem. Phys., 14, 813–829, https://doi.org/10.5194/acp-14-813-2014, 2014.
Matthaios, V. N., Triantafyllou, A. G., Albanis, T. A., Sakkas, V., and Garas, S.: Performance and evaluation of a coupled prognostic model TAPM over a mountainous complex terrain industrial area, Theor. Appl. Climatol., 132, 885–903, https://doi.org/10.1007/s00704-017-2122-9, 2018.
Miljöförvaltningen: Luften i Göteborg: Årsrapport 2019, available at: https://goteborg.se/wps/wcm/connect/10808596-7471-4e9e-af8a-2f7f517140af/R+2020_12+Luften+i+G 6teborg+-+ rsrapport+2019.pdf?MOD=AJPERES, last access: 29 June 2020.
Ramacher, M. O. P. and Karl, M.: Integrating Modes of Transport in a Dynamic Modelling Approach to Evaluate Population Exposure to Ambient NO2 and PM2.5 Pollution in Urban Areas, IJERPH, 17, 2099, 1–35, https://doi.org/10.3390/ijerph17062099, 2020.
Ramacher, M. O. P., Karl, M., Bieser, J., Jalkanen, J.-P., and Johansson, L.: Urban population exposure to NOx emissions from local shipping in three Baltic Sea harbour cities – a generic approach, Atmos. Chem. Phys., 19, 9153–9179, https://doi.org/10.5194/acp-19-9153-2019, 2019.
Ramacher, M. O. P., Karl, M., Aulinger, A., and Bieser, J.: Population Exposure to Emissions from Industry, Traffic, Shipping and Residential Heating in the Urban Area of Hamburg, in: Air Pollution Modeling and its Application XXVI, edited by: Mensink, C., Gong, W., and Hakami, A., Springer Proceedings in Complexity, Springer International Publishing, Cham, 177–183, 2020.
Reis, S., Liška, T., Vieno, M., Carnell, E. J., Beck, R., Clemens, T., Dragosits, U., Tomlinson, S. J., Leaver, D., and Heal, M. R.: The influence of residential and workday population mobility on exposure to air pollution in the UK, Environ. Int., 121, 803–813, https://doi.org/10.1016/j.envint.2018.10.005, 2018.
Rockel, B., Will, A., and Hense, A.: The Regional Climate Model COSMO-CLM (CCLM), Metz, 17, 347–348, https://doi.org/10.1127/0941-2948/2008/0309, 2008.
Sillman, S.: The relation between ozone, NOx and hydrocarbons in urban and polluted rural environments, Atmos. Environ., 33, 1821–1845, https://doi.org/10.1016/S1352-2310(98)00345-8, 1999.
Smith, J. D., Mitsakou, C., Kitwiroon, N., Barratt, B. M., Walton, H. A., Taylor, J. G., Anderson, H. R., Kelly, F. J., and Beevers, S. D.: London Hybrid Exposure Model: Improving Human Exposure Estimates to NO2 and PM2.5 in an Urban Setting, Environ. Sci. Technol., 50, 11760–11768, https://doi.org/10.1021/acs.est.6b01817, 2016.
Soares, J., Kousa, A., Kukkonen, J., Matilainen, L., Kangas, L., Kauhaniemi, M., Riikonen, K., Jalkanen, J.-P., Rasila, T., Hänninen, O., Koskentalo, T., Aarnio, M., Hendriks, C., and Karppinen, A.: Refinement of a model for evaluating the population exposure in an urban area, Geosci. Model Dev., 7, 1855–1872, https://doi.org/10.5194/gmd-7-1855-2014, 2014.
Sofiev, M., Winebrake, J. J., Johansson, L., Carr, E. W., Prank, M., Soares, J., Vira, J., Kouznetsov, R., Jalkanen, J.-P., and Corbett, J. J.: Cleaner fuels for ships provide public health benefits with climate tradeoffs, Nat. Commun., 9, 406, 1–12, https://doi.org/10.1038/s41467-017-02774-9, 2018.
Tang, L., Ramacher, M. O. P., Moldanová, J., Matthias, V., Karl, M., Johansson, L., Jalkanen, J.-P., Yaramenka, K., Aulinger, A., and Gustafsson, M.: The impact of ship emissions on air quality and human health in the Gothenburg area – Part 1: 2012 emissions, Atmos. Chem. Phys., 20, 7509–7530, https://doi.org/10.5194/acp-20-7509-2020, 2020.
Transport administration: Prognos för persontrafiken 2040: Trafikverkets Basprognoser 2016, Report 2016:062, Transport administration (Trafikverket), 2016.
Transport administration: Prognos för persontrafiken 2040: Trafikverkets Basprognoser 2018-04-01, Report 2018:089, Transport administration (Trafikverket), 2018.
Zandersen, M., Hyytiäinen, K., Meier, H. E. M., Tomczak, M. T., Bauer, B., Haapasaari, P. E., Olesen, J. E., Gustafsson, B. G., Refsgaard, J. C., Fridell, E., Pihlainen, S., Le Tissier, M. D. A., Kosenius, A.-K., and van Vuuren, D. P.: Shared socio-economic pathways extended for the Baltic Sea: exploring long-term environmental problems, Reg. Environ. Change, 19, 1073–1086, https://doi.org/10.1007/s10113-018-1453-0, 2019.
- Abstract
- Introduction
- Chemistry transport and health-effect modelling
- Current and future shipping emissions scenarios
- Future impact of shipping on concentrations of pollutants
- Impacts of future shipping on exposure to air pollutants and related health effects
- Conclusions
- Code availability
- Data availability
- Author contributions
- Competing interests
- Special issue statement
- Acknowledgements
- Financial support
- Review statement
- References
- Supplement