the Creative Commons Attribution 4.0 License.
the Creative Commons Attribution 4.0 License.
 | 11 Jul 2019
Measuring light absorption by freshly emitted organic aerosols: optical artifacts in traditional solvent-extraction-based methods
Nishit J. Shetty
Apoorva Pandey
Stephen Baker
Wei Min Hao
Rajan K. Chakrabarty
Recent studies have shown that organic aerosol (OA) could have a nontrivial role in atmospheric light absorption at shorter visible wavelengths. Good estimates of OA light absorption are therefore necessary to better estimate radiative forcing due to these aerosols in climate models. One of the common techniques used to measure OA light absorption is the solvent extraction technique from filter samples which involves the use of a spectrophotometer to measure bulk absorbance by the solvent-soluble organic fraction of particulate matter. Measured solvent-phase absorbance is subsequently converted to particle-phase absorption coefficient using scaling factors. The conventional view is to apply a correction factor of 2 to absorption coefficients obtained from solvent-extracted OA based on Mie calculations. The appropriate scaling factors are a function of biases due to incomplete extraction of organic carbon (OC) by solvents and size-dependent absorption properties of OA. The range for these biases along with their potential dependence on burn conditions is an unexplored area of research.
Here, we performed a comprehensive laboratory study involving three solvents (water, methanol, and acetone) to investigate the bias in absorption coefficients obtained from solvent-extraction-based photometry techniques as compared to in situ particle-phase absorption for freshly emitted OA from biomass burning. We correlated the bias with OC∕TC (total carbon) mass ratio and single scattering albedo (SSA) and observed that the conventionally used correction factor of 2 for water and methanol-extracted OA might not be extensible to all systems, and we suggest caution while using such correction factors to estimate particle-phase OA absorption coefficients. Furthermore, a linear correlation between SSA and the OC∕TC ratio was also established. Finally, from the spectroscopic data, we analyzed the differences in absorption Ångström exponents (AÅE) obtained from solution- and particulate-phase measurements. We noted that AÅE from solvent-phase measurements could deviate significantly from their OA counterparts.
- Article
(531 KB) - Full-text XML
-
Supplement
(303 KB) - BibTeX
- EndNote


Carbonaceous aerosols constitute a major short-lived climate pollutant, and even though they have been studied extensively in recent years, estimates of their contribution to shortwave radiative forcing remains highly uncertain (IPCC, 2013). Based on their thermal-refractory properties, carbonaceous aerosols are categorized as elemental carbon (EC) or organic carbon (OC) (Chow et al., 2007b; Bond et al., 2013), and the sum of OC and EC is referred to as total carbon (TC). When defined optically, the refractory EC component is approximately referred to as black carbon (BC) (Chow et al., 2007b; Bond et al., 2013). BC aerosols constitute the strongest of the light absorbing aerosol components in the atmosphere (Ramanathan and Carmichael, 2008; Andreae and Gelencsér, 2006; IPCC, 2013). While BC absorbs strongly in the visible spectrum, the contribution of OC towards absorption has largely been neglected, even though many studies have demonstrated significant OC absorption at lower visible wavelengths (Yang et al., 2009; Chen and Bond, 2010; Chakrabarty et al., 2010; Kirchstetter and Thatcher, 2012). The atmospheric mass of OC can be 3–12 times larger than that of BC (Husain et al., 2007; Zhang et al., 2008), which warrants its inclusion as an atmospheric light absorber. Only recently have global modeling studies started incorporating radiative forcing by organic aerosol (OA) absorption (Wang et al., 2014, 2018; Saleh et al., 2015; Lin et al., 2014). Thus, having accurate estimates for OA absorption is necessary to help improve climate models.
A convenient and prevalent methodology of measuring OA absorption is based on collecting aerosol particles on a filter substrate followed by extracting the organic compounds into a solvent. This analytical method is used in many studies as it ideally excludes any interference from EC and primarily provides the absorption spectra of extracted OC (Mo et al., 2017; Chen and Bond, 2010; Liu et al., 2013). The absorbance of organic chromophores in the solvent extract is measured using an ultraviolet–visible (UV–Vis) spectrophotometer, and measured absorbance values can be converted to corresponding solvent-phase absorption coefficients (babs,sol). However, this methodology has limitations as it is unable to represent size-dependent absorption properties of the extracted OA (Liu et al., 2013; Washenfelder at al., 2015; Moosmüller et al., 2011). To correct for this limitation, the complex refractive index (RI) of OC is estimated by assuming the real part and calculating the imaginary part for extracted OC using babs,sol and dissolved OC concentration, and the complex RI is then used along with a number size distribution as inputs to Mie theory for calculating the particle-phase absorption coefficient for dissolved OC. In addition to discrepancies between particle- and solvent-phase optical properties, the method suffers from biases due to incomplete extraction of organics by different solvents (Chen and Bond, 2010; Liu et al., 2013) which lead to differences in values of babs,sol obtained from different solvents. The significance and extent of this bias varies based on the OC extraction efficiency of a given solvent and would be negligible for solvents extracting 100 % of organic chromophores. A combination of inefficient organic carbon extraction and the methods' inability to measure size-dependent OA absorption properties can result in significant errors to optical properties obtained using this method. Despite the low OC extraction efficiency of water (Chen and Bond, 2010) and large potential for errors, past studies have used light absorption by water-soluble organic carbon (WSOC) as a surrogate for OA optical properties (Bosch et al., 2014; Kirillova et al., 2014a, b). However, the use of water as an OA surrogate is decreasing, with more recent studies using methanol to extract OC (Cheng et al., 2016; Shen at al., 2017; Xie et al., 2017). While methanol has a higher OC extraction efficiency than water (Chen and Bond, 2010), its efficiency is limited, ranging from 85 % to 98 % (Cheng et al., 2016; Xie et al., 2017), which can lead to misrepresentation of OA optical properties if the unextracted fraction corresponds to extremely low volatility organic carbon (ELVOC) or similar organic chromophores which have large light absorption efficiencies (Saleh et al., 2014), underscoring the need for a more complete extraction protocol. In addition to problems with incomplete OC extraction, previous studies have attempted to correct for size-dependent biases using absorption coefficients determined with Mie theory and provided a narrow range of solvent-dependent scaling factors from 2 for water extracts to 1.8 for methanol extracts, all corresponding to a mean particle diameter of 0.5 µm (Liu et al., 2013, 2016; Washenfelder et al., 2015). Sun et al. (2007) performed theoretical calculations and postulated a correction range of 0.69–0.75 for OC particles with diameters much smaller than the wavelength of light. These correction factors, while applicable to these individual systems, might not be extensible to aerosol emissions from other combustion events. However, many studies have used scaling factors from such studies on absorption coefficients obtained from solvent-phase optical measurements despite potential differences in system-dependent biases for each experiment (Kim et al., 2016; Zhang et al., 2017; Wang et al., 2018). To the authors' knowledge, no attempts have been made to explicitly study or quantify these biases with varying aerosol intrinsic properties, such as the EC∕OC ratios and single scattering albedo (SSA), even though these properties have shown to be well correlated with OA optical properties (Zhang et al., 2013; Saleh et al., 2014; Bergstrom et al., 2007).
In situ measurement of particulate-phase absorption coefficient is commonly and accurately accomplished using a photoacoustic spectrometer (PAS) (Lack et al., 2006; Arnott et al., 2005, 2003). However, on its own, a single-wavelength PAS cannot distinguish between absorption by OC and BC aerosol, and it typically measures the total particle-phase absorption coefficient (babs,tot) of the aerosol population in the cell (Moosmüller et al., 2009). One can make use of a multiwavelength PAS, using which the OA absorption coefficient (babs,OA) could be separated out from that of BC absorption, based on the difference in BC and OA absorption Ångström exponent (AÅE) (Washenfelder et al., 2015; Arola et al., 2011; Kirchstetter and Thatcher, 2012). The AÅE for pure BC is well constrained at 1 in the visible and near-infrared wavelengths (Moosmüller et al., 2009). The value of babs,OA is calculated as the difference between babs,tot and the BC absorption coefficient. A possible technique to measure the bias between particle- and solvent-phase organic absorption ( can thus be established by carrying out simultaneous measurements of solution- and particle-phase absorption properties during a study. Determining babs,OA using this method gives large errors when BC absorption coefficient is large or comparable to babs,tot, as babs,OA would be a small number obtained by the subtraction of two large numbers, limiting the use of this technique for relatively low EC∕OC ratios.
Here, we burned a range of different biomass fuels under different combustion conditions, and the resulting aerosol emissions were passed through various in situ instruments while simultaneously being collected on quartz-fiber filters. The particle-phase absorption coefficient was obtained using integrated photoacoustic-nephelometer spectrometers (IPNs) at wavelengths 375, 405, and 1047 nm. Organics collected on quartz-fiber filters were extracted in water, acetone, and methanol, and corresponding babs,sol values were calculated. These values were compared with corresponding babs,OA, and the change in with varying single scattering albedo (SSA) values and OC∕TC ratios was examined. SSA was parametrized with the OC∕TC ratios with trends similar to those observed by Pokhrel et al. (2016). AÅE values from spectroscopic data for solution- and particle-phase measurements were compared, and the Mie-theory-based correction factor was also investigated for a few samples.
2.1 Sample generation and collection
Figure 1 is a schematic diagram of our experimental setup, which consisted of a sealed 21 m3 stainless-steel combustion chamber housing a fan for mixing and recirculation (Sumlin et al., 2018b). Aerosol samples were generated by burning several types of biomass including pine, fir, grass, sage, and cattle dung (details are provided in the Supplement). During a chamber burn, 10–50 g of a given biomass was placed in a stainless-steel pan and ignited by a butane lighter. The chamber exhaust was kept closed for the duration of a given experiment. The biomass bed was either allowed to burn to completion or it was prematurely extinguished and brought to a smoldering phase by extinguishing the flame beneath a lid. Different combustion conditions were used to generate samples with varying properties: OC∕TC ratios ranged from 0.55 to 1, and SSA values ranged from 0.56 to 0.98 for wavelengths of 375, 405, and 1047 nm.
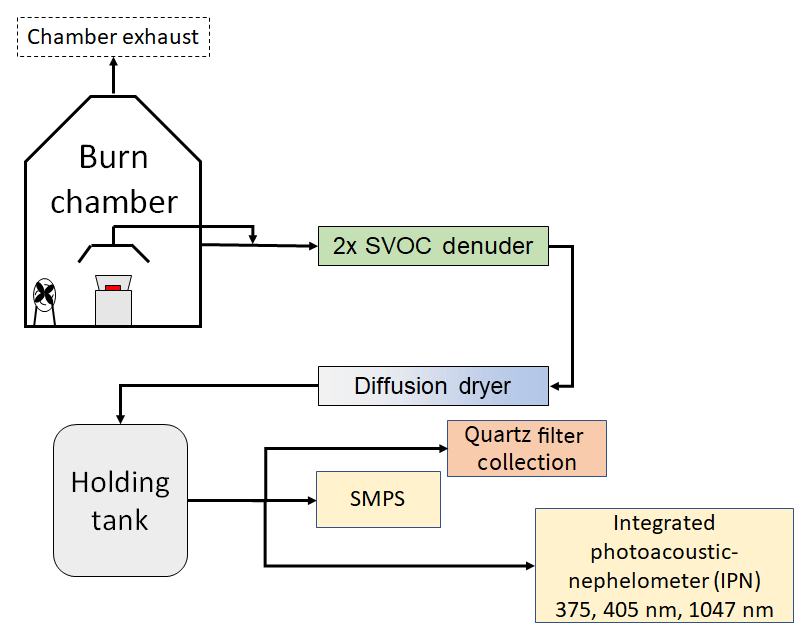
Figure 1A schematic representing the experimental setup. The aerosol emissions were sampled either directly from the chamber wall or through a hood placed above the combusting biomass.
For one set of experiments, the particles were directly sampled from the chamber; in another set, the sampling was done from a hood placed over the burning biomass. A diffusion dryer removed excess water from the sample stream, and the gas-phase organics were removed by a pair of activated parallel-plate semivolatile organic carbon (SVOC) denuders. The gas-phase organics were stripped to reduce artifacts produced by the adsorption of organic vapors on the quartz filters. The aerosols were finally sent to a 208 L stainless-steel barrel, from which they were continuously sampled by the three IPNs. Some phase repartitioning of condensed SVOCs into the vapor phase might have taken place postdenuding in our holding tank and could have introduced a positive bias to our filter-based measurements. The experiments were conducted in two sets, the first set included a scanning mobility particle sizer (SMPS, TSI, Inc.), and size measurements from this instrument were used in Mie theory calculations detailed in Sect. 2.3. The SMPS was not used in the second set of experiments due to problems with aerosol flows in the system. However, the SMPS data from the first set of experiments gave us an estimate of the range over which the size distributions varied and were used to obtain the geometric mean of the size distribution. The real-time absorption and scattering coefficients were measured by the IPNs, and samples were simultaneously collected on quartz-fiber filters once a steady-state signal was achieved. The absorption and scattering coefficients were used to calculate the SSA, which is simply the scattering coefficient divided by the extinction coefficient. Radiative forcing calculations for absorbing OC require good estimates of OC absorption at different SSA values (Lin et al., 2014; Feng et al., 2013; Chakrabarty et al., 2010), underscoring the need to study OA absorption biases as a function of SSA. The particles were passed through the filter samplers at a flow rate of 5 L min−1, with sampling times ranging from 2 to 15 min. Two or more filters were collected for a given steady-state condition. One of these filters was used to determine the OC and EC fractions of the deposited particles, and the other filters were used for the extraction experiments. The only exception was one sample from dung combustion that we assumed to be purely organic aerosol based on the smoldering-only nature of the burn and previously analyzed optical dataset of aerosol from similar burn conditions.
2.2 Analytical techniques
2.2.1 Absorption by solvent-extracted OC
Quartz filters (Pallflex Tissuquartz, 47 mm diameter) collected during sampling were split into four quarters, and each quarter was extracted using either deionized water, acetone, hexane, or methanol. The absorption by hexane extracts were low and prone to errors, so data for its extracts were not analyzed. The filters were placed in 3–5 mL of the solvent for 24 h. The filter was not sonicated to reduce artifacts from mechanical dislodging of BC particles (Phillips and Smith, 2017) and to avoid changes in chemical composition caused by acoustic cavitation (Mutzel et al., 2013). The solvent volumes were measured both before and after the extraction, and the differences between the two measurements were within 8 %. The extracts were then passed through syringe filters with 0.22 µm pores to remove any suspended particles introduced during the extraction process.
The light absorbance of the extracts was measured using a UV–Vis spectrophotometer (Varian Inc., Cary 50) at wavelengths from 300 to 800 nm. To compare the absorbance (A(λ)) of chromophores in the solution with the absorption coefficient of the particles in the atmosphere, all absorbance values were converted to solution-phase absorption coefficients at given wavelengths (babs,sol(λ)) (Liu et al., 2013):
where Vl is the volume of solvent the filter was extracted into, Va is the volume of air passed over the given filter area, and l is the optical path length that the beam traveled through the cuvette (1 cm). Absorbance at a given wavelength is normalized to absorbance at 700 nm to account for any signal drift within the instrument. Absorbance at 700 nm was negligible and close to zero for the analyzed samples, indicating no absorption at long wavelengths and little to no signal drift for the instrument. The resulting absorption coefficient (m−1) was multiplied by ln(10) to convert from log base 10 (provided by the UV–Vis spectrophotometer) to natural log.
2.2.2 Absorption by BC and OC in particle phase
To estimate the BC absorption at 375 and 405 nm, the absorption data from the IPN operated in the infrared regime at a wavelength of 1047 nm were converted to equivalent BC particulate absorption at the near-UV wavelengths using a BC absorption Ångström exponent (AÅEBC) value of 1 (Kirchstetter et al., 2004; Andreae and Gelencsér, 2006). It was assumed that all the absorption at 1047 nm could be attributed to BC aerosol (Bahadur et al., 2012). The BC light absorption coefficient at shorter wavelengths (babs,BC(λ)) was calculated by
where λ1 is the wavelength at which the absorption will be calculated and AÅE is defined for a pair of wavelengths λ1, λ2 as the exponent in a power law expressing the ratio of the absorption coefficients as follows (Moosmüller et al., 2009):
AÅE is an optical descriptor of the inherent material property. For BC particles, typical values of AÅE≈1, while for OC particles AÅE>4 (Moosmüller et al., 2009). The value of babs,BC at 375 and 405 nm was then subtracted from babs,tot at those wavelengths to calculate babs,OA. The ratio was calculated to represent the scaling bias between the bulk solvent-phase absorption coefficient and OA absorption coefficient.
The organic and elemental carbon compositions of the filters were measured with a thermal–optical OC∕EC analyzer (Sunset Laboratory, Tigard, OR) using the Interagency Monitoring of Protected Visual Environments (IMPROVE)-A thermal/optical reflectance (TOR) analysis method (Chow et al., 2007a). The OC∕TC ratios were assumed to be constant for a given steady-state IPN reading, which allowed us to relate the absorption data to the OC∕TC data. The assumption was tested by performing EC∕OC analysis of two filters collected during a given steady state for a burn. The OC∕TC ratio remained unchanged or within experimental error for the burns, and results for the EC∕OC analysis of tested filters are provided in Tables S1 and S2 in the Supplement.
2.2.3 Uncertainty using Monte Carlo simulations
The uncertainties due to error propagation were evaluated using a Monte Carlo approach. The true measurement value was assumed to possess a Gaussian probability distribution with the mean and standard deviation corresponding to measured values and errors associated with the instrument (Table S4), respectively. Calculations were performed by randomly selecting values based on the probability distribution for the different variables, and corresponding values for were estimated. A total of N=10 000 iterations were performed for each data point, and each simulation was rerun 100 times until the value converged for the calculations. The propagated error due to uncertainty in important variables was then calculated as the standard deviation of values acquired over simulations. A pseudocode for the Monte Carlo calculation is detailed in the Supplement along with Table S4, which denotes typical mean and standard deviation values used for variables with uncertainties.
2.3 Mie theory calculations
A commonly used method to correct for differences between the chromophore absorption in solution and aerosol particle absorption is by using Mie theory (Liu et al., 2013; Washenfelder et al., 2015). The imaginary part (k) of the complex refractive index can be determined from bulk solution-phase absorption data and converted to equivalent OA absorption using Mie theory along with assumptions regarding the shape of the particles and the real part of the complex refractive index of the particle.
To find k, the mass absorption efficiency (α∕ρ) was determined using the absorbance data and the OC mass concentration in the solution (Liu et al., 2013):
where babs,sol(λ) is the solvent-phase absorption coefficient determined in Eq. (1), and M is the mass concentration of OC in the solution. In the given study, the OC mass concentration was measured for some of the water extracts using a total organic carbon (TOC) analyzer (Shimadzu, TOC-L). The water-soluble organic carbon was then used to estimate α∕ρ of the solution. The calculated α∕ρ was further used to determine k for the WSOC by (Chen and Bond, 2010)
where λ is the light wavelength at which k needs to be calculated, and ρ is the density of the dissolved organic compounds. A ρ value of 1.6 (Alexander et al., 2008) was used to calculate the k values and was also used in all subsequent calculations using density. It is important to note that k values obtained using this method will represent optical characteristics of OC mass and not total organic mass. A Mie-based inversion algorithm was used to extract the real part of the refractive index (n) using data from the SMPS and IPN (Sumlin et al., 2018a). If size distributions extended over the SMPS measurement range, the data were extrapolated using a lognormal equation. A sensitivity analysis was performed by varying the n value from 1.4 to 2, and the change in Mie calculated absorption was within 18 %. The size distribution for the WSOC was estimated assuming the same geometric mean and standard deviation as that of the original aerosol, but with number concentrations calculated based on the extracted mass. Calculations for the number concentration are provided in the Supplement. After the size distribution and complex refractive index were determined, they were used to calculate the absorption coefficient based on Mie theory, which was then compared to babs,sol to verify the traditional Mie-based scaling factors for converting from solution- to particle-phase absorption.
3.1 Absorption bias correlated with single scattering albedo
Figure 2 shows the trends in for fresh organic aerosol emissions with varying SSA. The different fuel types are marked with distinct markers and the error bars – accounting for uncertainties in IPN, UV–Vis spectrophotometer, extract-volume measurements, filter sampling flow rates, and BC AÅE – are estimated from results of the Monte Carlo simulation. Measured SSA for pure fractal-like BC aggregates has values between 0.1 and 0.3 (Schnaiter et al., 2003; Bond et al., 2013) depending on the size of the BC monomers (Sorensen, 2001), and, due to this particularly low SSA of BC compared to OC, an increase in BC content of aerosol composition would lead to decreasing SSA. This relationship is explored further in Sect. 3.2 and 3.3. Figure 2 indicates that the light absorbed by methanol and acetone extracts was almost identical and would imply that the amount and type of OC extracted by the two solvents were similar, as seen in other studies as well (Chen and Bond, 2010; Wang et al., 2014). For some dung samples, the bias for methanol and acetone extracts was close to 0.6 at SSA values of 0.95. These bias values were near to the theoretical prediction of 0.69–0.75 by Sun et al. (2007) for particle sizes much smaller than the wavelength of light, even though our size distributions were not significantly smaller than the wavelength of 405 nm. This could indicate that predictions by Sun et al. (2007) are valid for sizes comparable to the wavelength of light as well, but more such observations are necessary to obtain conclusive results. The reasons for observed differences in the bias between water and methanol extracts are discussed further in Sect. 3.3. The differences between the mean values of at 375 and 405 nm were less than or close to the errors associated with them; hence any trends with wavelength were not explored. In addition to this, there were no obvious trends that could be explained using fuel type, leading us to not explore trends with fuel type either.

Figure 2Variation in with changing SSA at (a) 375 nm and (b) 405 nm (sample size N=21). The error bars represent 1 standard deviation from the mean and were calculated using Monte Carlo simulations. The black markers represent water extracts, red markers represent acetone extracts, and blue markers represent methanol extracts. The perforated lines separate points at lower SSA, which have errors greater than 30 % due to uncertainties in BC AÅE, from the data at high SSA.
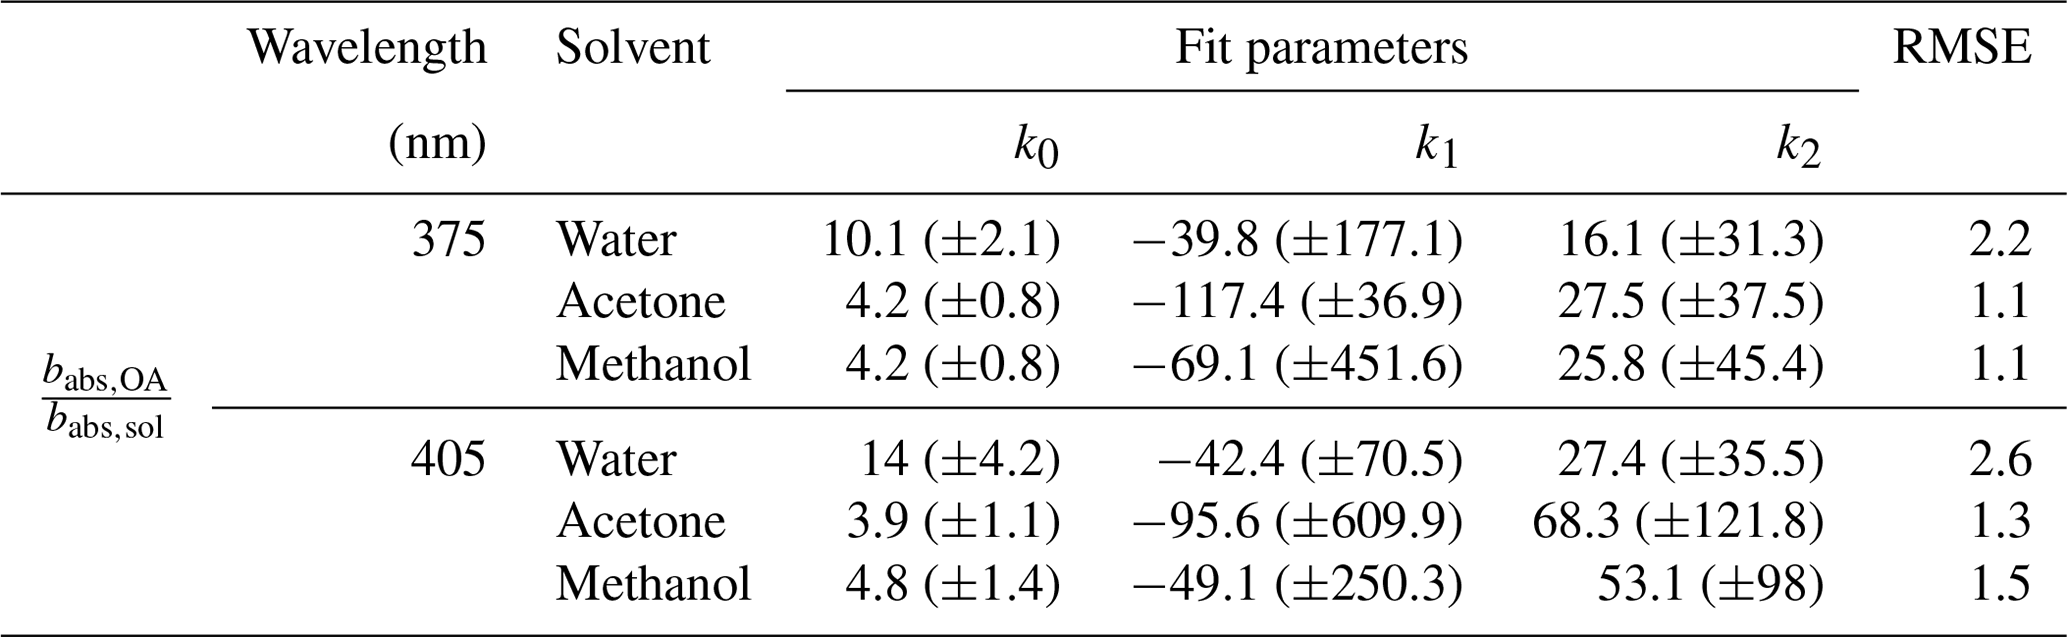
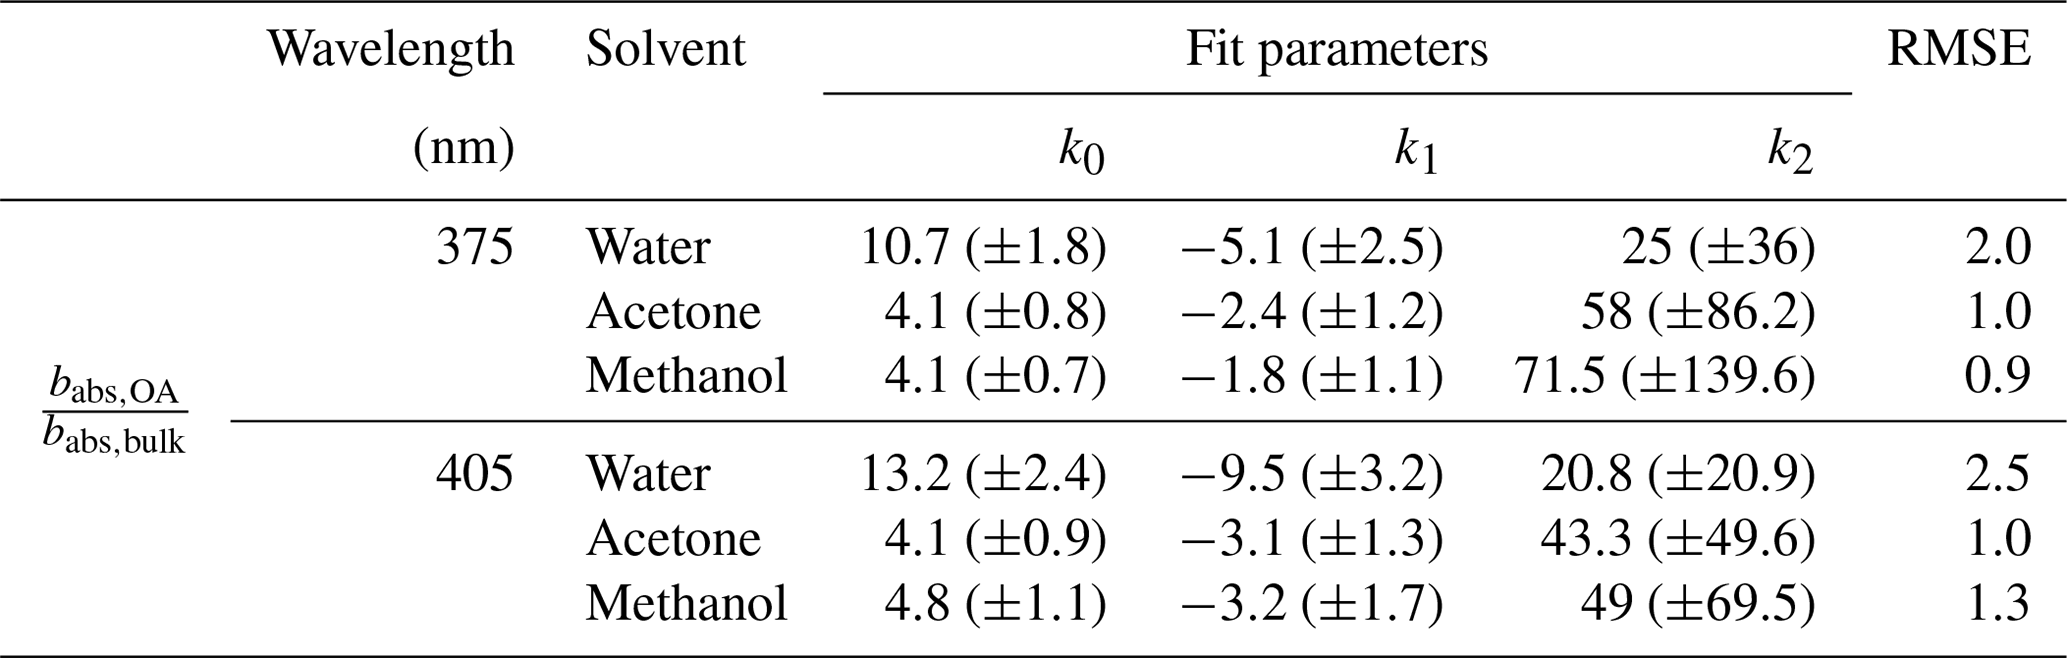
The value of approached a constant in the measured range of data. A power law ( was used to fit the points in Fig. 2, and the corresponding fit parameters, along with root mean square error (RMSE) values, are listed in Table 1. The fit was performed using the curve fitting tool in MATLAB and the RMSE values were calculated in Microsoft Excel. The power law fits were deficient in capturing the true behavior of the bias with SSA but performed better than corresponding mean values and step function curves. The parametrizations presented in this section are representative of laboratory-based biomass burning (BB) aerosol emissions in this study and are provided to mathematically visualize trends in the data. These parametrizations might not be extensible to other emissions and should not be used for determining OA absorption bias in other systems. The contribution of BC absorption coefficient to total absorption increases with larger EC fraction of the aerosol which results in significant errors while extrapolating BC absorption from longer wavelengths. Based on other studies, BC AÅE values range from 0.85 to 1.1 (Lack et al., 2008; Bergstrom et al., 2007; Lan et al., 2013). In Fig. 2, for data points below the perforated lines at SSA values smaller than 0.7 at 375 nm and smaller than 0.825 at 405 nm, the errors due to uncertainties in BC AÅE were greater than 30 % and are a result of increasing BC mass fractions at these SSA values. The large uncertainties at lower SSA values indicate that the method described here is best suited to determine for particles with relatively higher SSA values.
Table 1Fit coefficients for as a function of SSA ( for tested solvents and the fuels analyzed in this study along with the RMSE value for each fit.
3.2 SSA parametrized with OC∕TC
A linear relationship between aerosol SSA and the EC∕TC ratio was observed by Pokhrel et al. (2016). To replicate the linear trends observed by Pokhrel et al. (2016) we studied the correlation between SSA and the OC∕TC ratio (which is simply the EC∕TC ratio subtracted from 1). Figure 3 shows the variation in SSA with change in the OC∕TC ratio of the aerosol. The OC∕TC ratio was determined using the IMPROVE-A TOR protocol (Chow et al., 2007a) with a thermal optical EC/OC analyzer at Sunset laboratories. The data were parametrized using an orthogonal distance regression (ODR) to account for errors in the OC∕TC ratio, and resulting fits along with data points are plotted in Fig. 3. ODR is different from a standard linear regression as it accounts for errors in both the independent and dependent variables by minimizing least square errors perpendicular to the regression lines rather than vertical errors as in standard linear regression. The ODR fits are linear with RMSE values of 0.04 and 0.02 for wavelengths 375 and 405 nm respectively. In Fig. 3, the points corresponding to high OC∕TC ratios are associated with SSA values that are close to 1, because pure OC aerosols are predominantly light scattering. The fit yielded SSA values of 0.89 and 0.96 at 375 and 405 nm, respectively, for pure OA, indicating that the fits represent a spectral dependence of absorption which is characteristic of brown carbon optical properties because the SSA values for pure OC are below 1 at both wavelengths and SSA at 375 nm is lower than that at 405 nm (Chakrabarty et al., 2010).
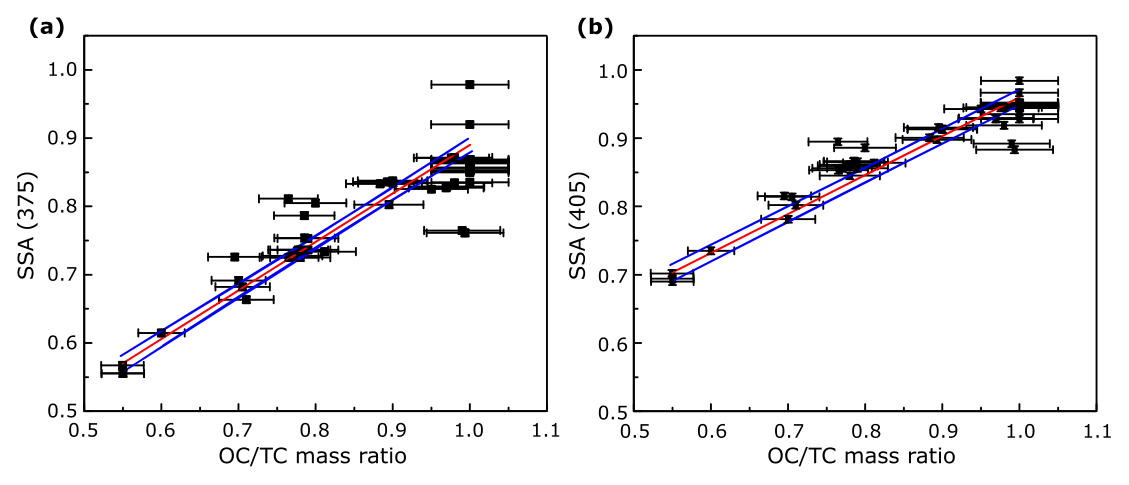
Figure 3SSA at (a) 375 nm and (b) 405 nm as a function of the OC∕TC ratio (sample size N=49). The solid red lines are ODR fits to the data and the solid blue lines represent the 95 % confidence intervals. The errors in OC∕TC ratios were determined by the quadrature sum of uncertainties from EC∕OC analysis and the errors in SSA were negligible.
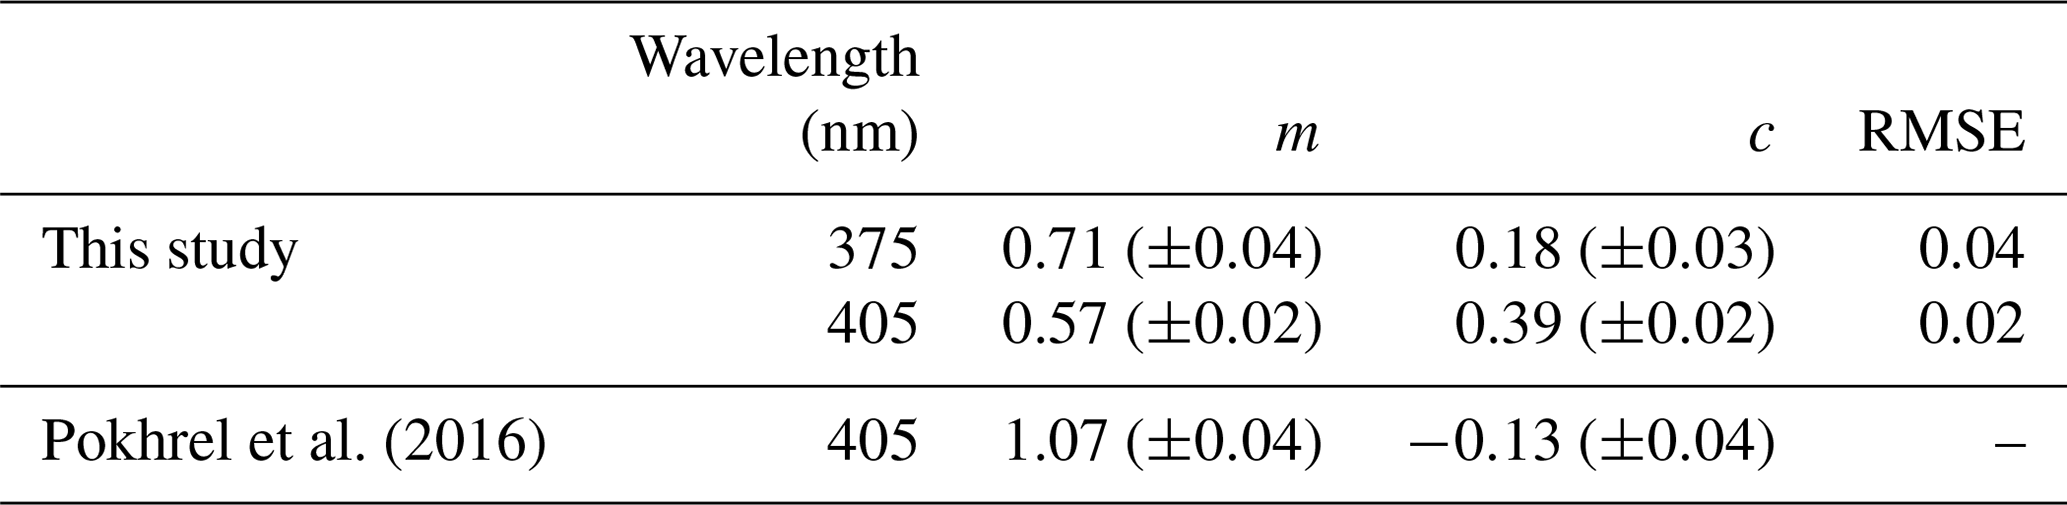
A linear relation between the SSA and the EC∕TC ratio was also observed by Pokhrel et al. (2016). However, when the data from that study were converted to OC∕TC values for comparison, it was noted that the slopes and intercepts of the resulting fits were different from those observed in this study. Table 2 has a list of the slope and intercept of fits for comparable wavelengths in both studies, along with the RMSE for our fit. A likely reason for dissimilar slopes and intercepts between the two studies could be due to discrepancies in EC∕OC ratios obtained using the same temperature protocol. Intercomparison studies have shown that different labs using the same sample with identical thermal protocols may produce different results (Panteliadis et al., 2015). The instrument bias could be such that obtained OC∕TC ratios would have a proportional offset between different instruments, leading to similar linear trends but with different slopes which might be the case here. Another plausible reason for the discrepancy could be positive artifacts in EC∕OC analysis due to gas-phase SVOCs being adsorbed on the quartz surface because of phase partitioning of these compounds in the holding tank. This reason seems less likely due relatively small sampling times for the aerosols. To assess the performance of our parametrizations, we compared our fit to data obtained by Liu et al. (2014) at 405 nm for BB aerosol. Data from the plots were extracted using Web Plot Digitizer (Rohatgi, 2017) and were plotted with our fit in Fig. 4. We observed that our fits predicted SSA well at OC∕TC ratios >0.7 with a RMSE value of 0.06 compared to 0.08 by Pokhrel et al. (2016), but predictions were worse for 405 nm at lower OC∕TC ratios as is also evident from the relatively high SSA value of 0.39 for pure EC obtained using our parametrization. Most observations for soot SSA are lower than those predicted by our 405 nm parametrizations (Bond et al., 2013; Schnaiter at al., 2003), with our projections being closer to SSA observed by Radney et al. (2014). Generally, OC∕TC ratios are greater than 0.7 for laboratory and field BB (Xie et al., 2017, 2019; Akagi et al., 2011; Zhou et al., 2017), which reduces concerns about underperformance of our fits for 405 nm at low OC∕TC ratios. It would be appropriate to use these parametrizations to determine a reasonable range for SSA values rather than use them as a surrogate to determine actual SSA for a given BB aerosol plume. A modification of Fig. 4 which compares the linear fits by Liu et al. (2014) and Pokhrel et al. (2016) with our parametrizations is provided in the Supplement.
Table 2ODR regression coefficients along with errors (in brackets) for plots of SSA vs. OC∕TC ratios (y=m (OC∕TC) + c) for the different biomass fuels used in this study, and parameters for ODR fit from Pokhrel et al. (2016) for 405 nm, along with RMSE values for our fits.
Despite the differences in ours and Pokhrel et al.'s (2016) fits, a useful conclusion from Fig. 3 is that the OC∕TC ratio determined using the IMPROVE-A protocol and SSA of BB aerosol has a linear dependence. This dependence, however, has high variations at OC∕TC ratios very close to 1, where fuel type and burn conditions dictate the composition and absorption properties (Chen and Bond, 2010; Budisulistiorini et al., 2017) of organics released, and hence a larger range of SSA values exist at those OC∕TC ratios. Further studies need to be conducted using more fuels with a variety of distinct size distributions and burn conditions to determine the validity and exact parameters for the fit.
3.3 Absorption bias correlated with the OC∕TC ratio
Figure 5 depicts the variation in for primary OA with different OC∕TC ratios. Given the good correlation between the OC∕TC ratio and SSA, we expect to see a similar trend for Fig. 5 as in Fig. 2. As in Fig. 2, the bias in Fig. 5 increases with decreasing OC∕TC ratio and approaches a constant for the three solvents. A power law similar to the one in Fig. 2 was fit to the data in Fig. 5. The fit parameters for the different solvents at the two wavelengths, along with the RMSE values corresponding to each fit, are presented in Table 3. We reiterate that the parametrizations for as a function of the OC∕TC ratio depicted here are applicable to our system and should not be used to calculate the bias in other systems. The exclusivity of depicted fit parameters to our system excuses their relatively poor RMSE while representing the bias with the OC∕TC ratio. The parametrizations are provided to represent some quantitative measure to the data rather than just analyze the trends qualitatively. The large error bars from the Monte Carlo simulations at high EC fractions are mainly due to uncertainties associated with the BC AÅE. At lower OC∕TC ratios, the contribution of BC absorption to the total particle-phase absorption coefficient is more pronounced, leading to high uncertainties while extrapolating the coefficient to shorter wavelengths. It is apparent from Fig. 5 that these errors in the bias are more prominent at OC∕TC ratios below 0.75. The burns with relatively high EC fractions are not representative of typical laboratory or field BB. As mentioned earlier, typical laboratory BB has OC∕TC ratios >0.7 (Xie et al., 2017, 2019; Akagi et al., 2011; Pokhrel et al., 2016) and >0.9 for field BB (Aurell et al., 2015; Zhou et al., 2017; Xie et al., 2017). Thus, data presented in Fig. 5 with relatively large errors and EC∕TC ratios >0.25 are not representative of typical BB aerosol in either laboratory or field settings, which may warrant their exclusion from most analyses. We have still included these data points in our plots and tables but have excluded their use in data analysis due to the high errors associated with them.

Figure 4Measured SSA values by Liu et al. (2014) for controlled laboratory combustion experiments (black squares), and overlaid with the points is the ODR parametrization determined in this study (solid red line).
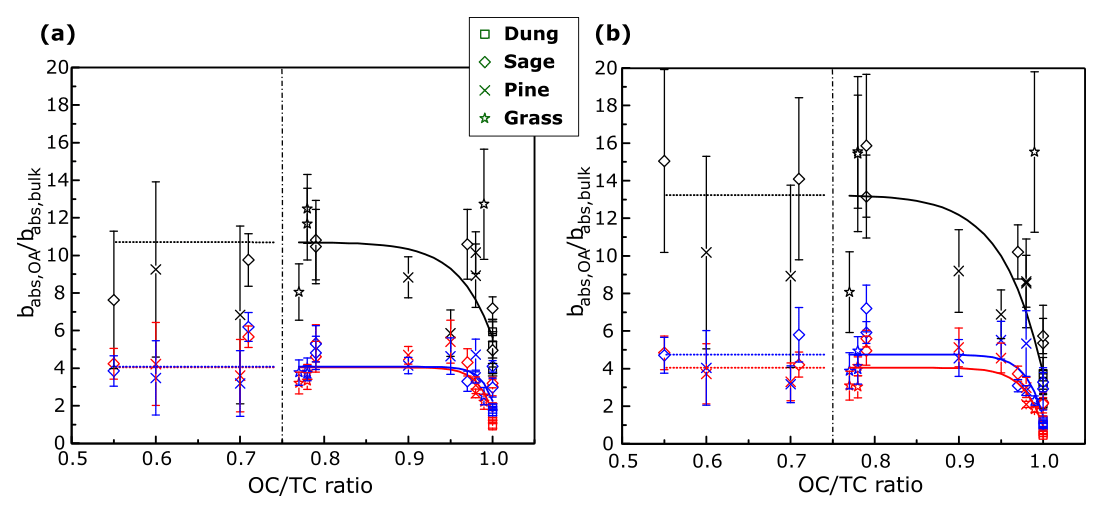
Figure 5The values of plotted against OC∕TC ratios, instead of SSA as in Fig. 2. Black markers represent data for water extracts, red markers represent data for acetone extracts, and blue markers represent data for methanol extracts.
Table 3Fit parameters for ratios of absorption coefficients of organics in particle and solvent phases, respectively, as a function of varying OC∕TC ratio ( for the fuels analyzed in this study, along with the RMSE value for each fit.
In Fig. 5, the difference in magnitude of the bias between methanol/acetone and water extracts increases as EC fraction of the aerosol increases. An increase in the emissions of ELVOCs with increasing EC∕OC ratios was observed by Saleh et al. (2014), and we hypothesize that these ELVOCs, which have high mass absorption efficiencies (Saleh et al., 2014; Di Lorenzo and Young, 2016), could have a lower solubility in water than methanol or acetone, which would explain the increasing difference in values between water and methanol/acetone extracts. Some of the generated ELVOCs might be insoluble in methanol and acetone as well, which would lead to the observed increase in the OA absorption bias with decreasing OC fraction of the aerosol. Based on the observed trends, these ELVOCs would not be released indefinitely but tend towards a constant above a given EC∕OC fraction, mimicking an exponential behavior comparable to observed trends in wavelength dependence for biomass burning OA with EC∕OC ratios (Saleh et al., 2014). This would lead to the bias approaching a constant value (due only to particle size effects) with decreasing OC∕TC ratios and in turn the aerosol SSA. Future studies can look at the type and amount of ELVOCs released as a function of the EC∕OC ratio of the aerosol and ascertain if their solubility in these solvents is a function of their EC content.
3.4 Variations in AÅE with solvents and OC∕TC ratios
The AÅE values for organics extracted in different solvents and those obtained from babs,OA are compared in Table 4. The AÅE values along with the errors for OA measurements were calculated between λ=375 and 405 nm using the Monte Carlo simulation. The AÅE values for OC extracts were calculated using Eq. (3) based on babs,sol, and corresponding errors were propagated based on uncertainties in UV–Vis measurements. Consistent with previous studies (Chen and Bond, 2010; Zhang et al., 2013; Liu et al., 2013), the AÅE values of water extracts were larger than the AÅE of acetone and methanol extracts. Experiments by Zhang et al. (2013) observed that polycyclic aromatic hydrocarbons (PAHs) absorbed light at longer wavelengths close to the visible region. Organic solvents such as methanol have a higher extraction efficiency for these compounds than water, leading to higher absorption by methanol extracts at longer wavelengths, which results in lower AÅE (Zhang et al., 2013).
Table 4The AÅE of OA (from various fuels) extracted in water, acetone, and methanol, alongside the AÅE measured from particle-phase babs,OA.

The AÅE calculated for OA ranged from 6.9±1.7 to 15.6±0.6 (excluding data with OC∕TC >0.75), which are slightly larger than the AÅE values reported by most studies (Pokhrel et al., 2016; Lewis et al., 2008). However, these studies report AÅE values in the visible range, which might be lower than aerosol AÅE values in the UV range as observed by Chen and Bond (2010) for OA extracts. The ranges of AÅE observed for water, acetone, and methanol extracts were similar to those observed by Chen and Bond (2010). A t test for data presented in Table 4 shows that AÅE values for OA were greater than their solution-phase counterparts for both methanol (N=17, p=0.0007) and acetone (N=17, p=0.0002). The differences in AÅE of OA and water extracts were statistically insignificant (N=17, p=0.25), but these differences were statistically significant at OC∕TC ratios ≥ 0.9 (N=12, p<0.05) where uncertainties due to BC absorption are lower. The reason for these differences could be a combination of artifacts due to inefficient extraction of organics absorbing light at lower wavelengths and the absence of size-dependent absorption in the solvent phase which might not capture effects of enhanced particle-phase absorption at lower wavelengths. These bulk solvent measurements of AÅE suggest that they might not be representative of spectral dependence of OC in the particle phase, and future studies and models should be cautious while using AÅE data from solvent-phase measurements to be representative of the particle phase.
3.5 Scaling factors based on Mie calculations
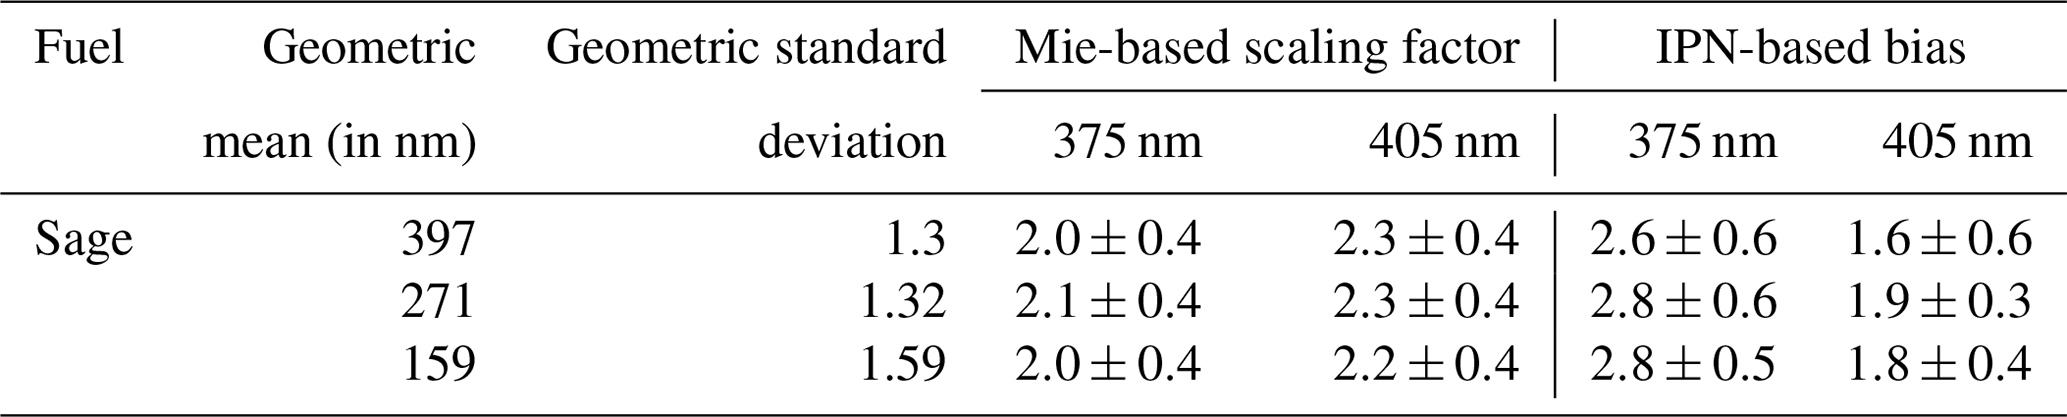
To check the reproducibility of the conventionally used correction factor of 2, the absorption coefficient determined from the bulk solvent absorbance using Eq. (1) was compared to absorption coefficients calculated using Mie theory for three samples of smoldering sage. The EC∕OC analysis (IMPROVE-A protocol) determined that these samples consisted purely of OC, and because the SMPS measurements and TOC analysis were only performed on the first set of samples, the three samples of sage were considered optimum for Mie calculations.
The Mie-based scaling factors for converting solution-phase absorption coefficients to particulate absorption for the three samples are presented in Table 5. TOC and EC∕OC analysis indicated that a similar fraction of organics at 61 % ± 2 % was extracted from all three samples. The Mie calculated scaling factors at 375 and 405 nm are close to 2 as observed in previous studies (Liu et al., 2013; Washenfelder et al., 2015), indicating that the conventional technique provides reproducible results. The values for these scaling factor vary from 2 to 2.1 at 375 nm and from 2.2 to 2.3 at 405 nm. However, it is important to note that these scaling factors were not representative of actual biases for determining OA absorption from solution phase as observed in Table 5. Thus, while a Mie-based correction factor of 2 can be duplicated, it is not representative of actual biases as also corroborated by observations from Figs. 2 and 5. We recommend future studies to use caution and judgment when using a priori scaling factors for determining OA absorption using solvent extraction techniques.
Table 5Correction factors for bulk solution absorption to particle-phase absorption, based on Mie theory calculations.
Under controlled laboratory conditions, we determined artifacts associated with optical properties of the solvent phase as compared to particle-phase counterparts for fresh OA emissions from biomass combustion. We combusted a range of different wildland fuels under different combustion conditions, generating a span of different SSA and OC∕TC values. The SSA values ranged from 0.55 to 0.87 at 375 nm and from 0.69 to 0.95 at 405 nm; the OC∕TC values ranged from 0.55 to 1. We observed an increasing difference in for water and methanol extracts with increasing EC fraction of the aerosol. The decrease in absorption by water extracts with decreasing OC∕TC ratios was hypothesized to occur due to a decrease in extraction of ELVOC or similar compounds with high mass absorption efficiencies by water. We also demonstrated that the SSA and OC∕TC ratios can be well parametrized with a linear fit that captures the effects of brown carbon aerosol. We also determined that bulk solvent measurements of AÅE are not representative of spectral dependence of OC in the particle phase. Finally, we analyzed the validity and reproducibility of the conventionally used scaling factor of 2 for determining OA absorption coefficients from water extracts of organics and noted that, while the factor is reproducible, its use can misrepresent OA absorption coefficients. We recommend that future studies use caution while applying a priori scaling factors to their systems as these factors might not be extensible to OA emissions from all combustion processes. A comprehensive technique which improves extraction efficiency with accurate knowledge of particle size distributions is necessary to determine correct scaling relations.
For future experiments, a better technique to quantify BC absorption at lower wavelengths, such as a thermodenuder to strip off all OC, or a single particle soot photometer along with core–shell Mie calculations can be used to determine BC absorption and decrease uncertainties related to BC absorption observed during experiments using this technique. Zhang et al. (2013) observed lower AÅE for WSOC from a particle into liquid sampler (PILS) than for methanol extracts. The hypothesis was that the highly dilute environment in PILS increased dissolution of organics in water. This suggests that extraction of organics can be increased by heavily diluting the samples. This can be combined with highly accurate spectrometers similar to the technique used by Hecobian et al. (2010) to reduce some of the biases due to incomplete OA extraction.
All experimental data used to plot the figures in this paper (SSA, OC∕TC ratios, and are available for download at https://doi.org/10.17632/sdy3ptyrht.1 (Shetty, 2019).
The Supplement includes data on types of fuel combusted and their optical and physical properties (Sect. 1, Tables S1–S3), a pseudocode for the Monte Carlo simulations along with associated errors in each variable (Sect. 2, Table S4), calculations for proxy size distributions used in Mie calculations (Sect. 3), a modified version of Fig. 4 depicting fits from referenced studies (Fig. S1), and a graphical comparison of particle- and solvent-phase AÅE for the samples analyzed in this study (Fig. S2). The supplement related to this article is available online at: https://doi.org/10.5194/acp-19-8817-2019-supplement.
RKC conceived of this study and designed the experiments. SB and WMH collected the fuels for the experiments and performed the EC∕OC analysis on the sampled filters. NJS and AP carried out the experiments. NJS analyzed the data and prepared the manuscript with input from all coauthors.
The authors declare that they have no conflict of interest.
This research has been supported by the National Science Foundation, Division of Atmospheric and Geospace Sciences (grant no. AGS1455215).
This paper was edited by Sergey A. Nizkorodov and reviewed by five anonymous referees.
Akagi, S., Yokelson, R. J., Wiedinmyer, C., Alvarado, M., Reid, J., Karl, T., Crounse, J., and Wennberg, P.: Emission factors for open and domestic biomass burning for use in atmospheric models, Atmos. Chem. Phys., 11, 4039–4072, https://doi.org/10.5194/acp-11-4039-2011, 2011.
Alexander, D. T., Crozier, P. A., and Anderson, J. R.: Brown carbon spheres in East Asian outflow and their optical properties, Science, 321, 833–836, https://doi.org/10.1126/science.1155296, 2008.
Andreae, M. and Gelencsér, A.: Black carbon or brown carbon? The nature of light-absorbing carbonaceous aerosols, Atmos. Chem. Phys., 6, 3131–3148, https://doi.org/10.5194/acp-6-3131-2006, 2006.
Arnott, W., Moosmüller, H., Sheridan, P., Ogren, J., Raspet, R., Slaton, W., Hand, J., Kreidenweis, S., and Collett Jr., J.: Photoacoustic and filter-based ambient aerosol light absorption measurements: Instrument comparisons and the role of relative humidity, J. Geophys. Res.-Atmos., 108, AAC15-1–AAC15-11, https://doi.org/10.1029/2002JD002165, 2003.
Arnott, W. P., Hamasha, K., Moosmüller, H., Sheridan, P. J., and Ogren, J. A.: Towards aerosol light-absorption measurements with a 7-wavelength aethalometer: Evaluation with a photoacoustic instrument and 3-wavelength nephelometer, Aerosol Sci. Technol., 39, 17–29, https://doi.org/10.1080/027868290901972, 2005.
Arola, A., Schuster, G., Myhre, G., Kazadzis, S., Dey, S., and Tripathi, S.: Inferring absorbing organic carbon content from AERONET data, Atmos. Chem. Phys., 11, 215–225, https://doi.org/10.5194/acp-11-215-2011, 2011.
Aurell, J., Gullett, B. K., and Tabor, D.: Emissions from southeastern US Grasslands and pine savannas: Comparison of aerial and ground field measurements with laboratory burns, Atmos. Environ., 111, 170–178, https://doi.org/10.1016/j.atmosenv.2015.03.001, 2015.
Bahadur, R., Praveen, P. S., Xu, Y., and Ramanathan, V.: Solar absorption by elemental and brown carbon determined from spectral observations, P. Natl. Acad. Sci. USA, 109, 17366–17371, https://doi.org/10.1073/pnas.1205910109, 2012.
Bergstrom, R. W., Pilewskie, P., Russell, P. B., Redemann, J., Bond, T. C., Quinn, P. K., and Sierau, B.: Spectral absorption properties of atmospheric aerosols, Atmos. Chem. Phys., 7, 5937–5943, https://doi.org/10.5194/acp-7-5937-2007, 2007.
Bond, T. C., Doherty, S. J., Fahey, D., Forster, P., Berntsen, T., DeAngelo, B., Flanner, M., Ghan, S., Kärcher, B., and Koch, D.: Bounding the role of black carbon in the climate system: A scientific assessment, J. Geophys. Res.-Atmos., 118, 5380–5552, https://https://doi.org/10.1002/jgrd.50171, 2013.
Bosch, C., Andersson, A., Kirillova, E. N., Budhavant, K., Tiwari, S., Praveen, P., Russell, L. M., Beres, N. D., Ramanathan, V., and Gustafsson, Ö.: Source-diagnostic dual-isotope composition and optical properties of water-soluble organic carbon and elemental carbon in the South Asian outflow intercepted over the Indian Ocean, J. Geophys. Res.-Atmos., 119, 11743–711759, https://https://doi.org/10.1002/2014JD022127, 2014.
Budisulistiorini, S. H., Riva, M., Williams, M., Chen, J., Itoh, M., Surratt, J. D., and Kuwata, M.: Light-absorbing brown carbon aerosol constituents from combustion of Indonesian peat and biomass, Environ. Sci. Technol., 51, 4415–4423, https://doi.org/10.1021/acs.est.7b00397, 2017.
Chakrabarty, R., Moosmüller, H., Chen, L.-W., Lewis, K., Arnott, W., Mazzoleni, C., Dubey, M., Wold, C., Hao, W., and Kreidenweis, S.: Brown carbon in tar balls from smoldering biomass combustion, Atmos. Chem. Phys., 10, 6363–6370, https://doi.org/10.5194/acp-10-6363-2010, 2010.
Chen, Y. and Bond, T.: Light absorption by organic carbon from wood combustion, Atmos. Chem. Phys., 10, 1773–1787, https://doi.org/10.5194/acp-10-1773-2010, 2010.
Cheng, Y., He, K.-B., Du, Z.-Y., Engling, G., Liu, J.-M., Ma, Y.-L., Zheng, M., and Weber, R. J.: The characteristics of brown carbon aerosol during winter in Beijing, Atmos. Environ., 127, 355–364, https://doi.org/10.1016/j.atmosenv.2015.12.035, 2016.
Chow, J. C., Watson, J. G., Chen, L.-W. A., Chang, M. O., Robinson, N. F., Trimble, D., and Kohl, S.: The IMPROVE – A temperature protocol for thermal/optical carbon analysis: maintaining consistency with a long-term database, J. Air Waste Manage., 57, 1014–1023, https://doi.org/10.3155/1047-3289.57.9.1014, 2007a.
Chow, J. C., Yu, J. Z., Watson, J. G., Hang Ho, S. S., Bohannan, T. L., Hays, M. D., and Fung, K. K.: The application of thermal methods for determining chemical composition of carbonaceous aerosols: A review, J. Environ. Sci. Health A, 42, 1521–1541, https://doi.org/10.1080/10934520701513365, 2007b.
Di Lorenzo, R. A. and Young, C. J.: Size separation method for absorption characterization in brown carbon: Application to an aged biomass burning sample, Geophys. Res. Lett., 43, 458–465, https://doi.org/10.1002/2015GL066954 2016.
Feng, Y., Ramanathan, V., and Kotamarthi, V.: Brown carbon: a significant atmospheric absorber of solar radiation?, Atmos. Chem. Phys., 13, 8607–8621, https://doi.org/10.5194/acp-13-8607-2013, 2013.
Hecobian, A., Zhang, X., Zheng, M., Frank, N., Edgerton, E. S., and Weber, R. J.: Water-Soluble Organic Aerosol material and the light-absorption characteristics of aqueous extracts measured over the Southeastern United States, Atmos. Chem. Phys., 10, 5965–5977, https://doi.org/10.5194/acp-10-5965-2010, 2010.
Husain, L., Dutkiewicz, V. A., Khan, A., and Ghauri, B. M.: Characterization of carbonaceous aerosols in urban air, Atmos. Environ., 41, 6872–6883, https://doi.org/10.1016/j.atmosenv.2007.04.037, 2007.
IPCC: Climate Change: The Physical Science Basis, Contribution of Working Group I to the UN IPCC's 5th Assessment Report, Cambridge University Press, New York, USA, 2013.
Kim, H., Kim, J. Y., Jin, H. C., Lee, J. Y., and Lee, S. P.: Seasonal variations in the light-absorbing properties of water-soluble and insoluble organic aerosols in Seoul, Korea, Atmos. Environ., 129, 234–242, https://doi.org/10.1016/j.atmosenv.2016.01.042, 2016.
Kirchstetter, T. W. and Thatcher, T. L.: Contribution of organic carbon to wood smoke particulate matter absorption of solar radiation, Atmos. Chem. Phys., 12, 6067–6072, https://doi.org/10.5194/acp-12-6067-2012, 2012.
Kirchstetter, T. W., Novakov, T., and Hobbs, P. V.: Evidence that the spectral dependence of light absorption by aerosols is affected by organic carbon, J. Geophys. Res.-Atmos., 109, D21208, https://doi.org/10.1029/2004JD004999, 2004.
Kirillova, E. N., Andersson, A., Han, J., Lee, M., and Gustafsson, Ö.: Sources and light absorption of water-soluble organic carbon aerosols in the outflow from northern China, Atmos. Chem. Phys., 14, 1413–1422, https://doi.org/10.5194/acp-14-1413-2014, 2014a.
Kirillova, E. N., Andersson, A., Tiwari, S., Srivastava, A. K., Bisht, D. S., and Gustafsson, Ö.: Water-soluble organic carbon aerosols during a full New Delhi winter: Isotope-based source apportionment and optical properties, J. Geophys. Res.-Atmos., 119, 3476–3485, https://https://doi.org/10.1002/2013JD020041, 2014b.
Lack, D. A., Lovejoy, E. R., Baynard, T., Pettersson, A., and Ravishankara, A.: Aerosol absorption measurement using photoacoustic spectroscopy: Sensitivity, calibration, and uncertainty developments, Aerosol Sci. Technol., 40, 697–708, https://doi.org/10.1080/02786820600803917, 2006.
Lack, D. A., Cappa, C. D., Covert, D. S., Baynard, T., Massoli, P., Sierau, B., Bates, T. S., Quinn, P. K., Lovejoy, E. R., and Ravishankara, A.: Bias in filter-based aerosol light absorption measurements due to organic aerosol loading: Evidence from ambient measurements, Aerosol Sci. Technol., 42, 1033–1041, https://doi.org/10.1080/02786820802389277, 2008.
Lan, Z.-J., Huang, X.-F., Yu, K.-Y., Sun, T.-L., Zeng, L.-W., and Hu, M.: Light absorption of black carbon aerosol and its enhancement by mixing state in an urban atmosphere in South China, Atmos. Environ., 69, 118–123, https://doi.org/10.1016/j.atmosenv.2012.12.009, 2013.
Lewis, K., Arnott, W. P., Moosmüller, H., and Wold, C. E.: Strong spectral variation of biomass smoke light absorption and single scattering albedo observed with a novel dual-wavelength photoacoustic instrument, J. Geophys. Res.-Atmos., 113, D16203, https://doi.org/10.1029/2007JD009699, 2008.
Lin, G., Penner, J. E., Flanner, M. G., Sillman, S., Xu, L., and Zhou, C.: Radiative forcing of organic aerosol in the atmosphere and on snow: Effects of SOA and brown carbon, J. Geophys. Res.-Atmos., 119, 7453–7476, https://doi.org/10.1002/2013JD021186, 2014.
Liu, J., Bergin, M., Guo, H., King, L., Kotra, N., Edgerton, E., and Weber, R.: Size-resolved measurements of brown carbon in water and methanol extracts and estimates of their contribution to ambient fine-particle light absorption, Atmos. Chem. Phys., 13, 12389–12404, https://doi.org/10.5194/acp-13-12389-2013, 2013.
Liu, J., Lin, P., Laskin, A., Laskin, J., Kathmann, S. M., Wise, M., Caylor, R., Imholt, F., Selimovic, V., and Shilling, J. E.: Optical properties and aging of light-absorbing secondary organic aerosol, Atmos. Chem. Phys., 16, 12815–12827, https://doi.org/10.5194/acp-16-12815-2016, 2016.
Liu, S., Aiken, A. C., Arata, C., Dubey, M. K., Stockwell, C. E., Yokelson, R. J., Stone, E. A., Jayarathne, T., Robinson, A. L., and DeMott, P. J.: Aerosol single scattering albedo dependence on biomass combustion efficiency: Laboratory and field studies, Geophys. Res. Lett., 41, 742–748, https://doi.org/10.1002/2013GL058392, 2014.
Mo, Y., Li, J., Liu, J., Zhong, G., Cheng, Z., Tian, C., Chen, Y., and Zhang, G.: The influence of solvent and pH on determination of the light absorption properties of water-soluble brown carbon, Atmos. Environ., 161, 90–98, https://doi.org/10.1016/j.atmosenv.2017.04.037, 2017.
Moosmüller, H., Chakrabarty, R., and Arnott, W.: Aerosol light absorption and its measurement: A review, J. Quant. Spectrosc. Ra., 110, 844–878, https://doi.org/10.1016/j.jqsrt.2009.02.035, 2009.
Moosmüller, H., Chakrabarty, R., Ehlers, K., and Arnott, W.: Absorption Ångström coefficient, brown carbon, and aerosols: basic concepts, bulk matter, and spherical particles, Atmos. Chem. Phys., 11, 1217–1225, https://doi.org/10.5194/acp-11-1217-2011, 2011.
Mutzel, A., Rodigast, M., Iinuma, Y., Böge, O., and Herrmann, H.: An improved method for the quantification of SOA bound peroxides, Atmos. Environ., 67, 365–369, https://doi.org/10.1016/j.atmosenv.2012.11.012, 2013.
Panteliadis, P., Hafkenscheid, T., Cary, B., Diapouli, E., Fischer, A., Favez, O., Quincey, P., Viana, M., Hitzenberger, R., Vecchi, R., Saraga, D., Sciare, J., Jaffrezo, J. L., John, A., Schwarz, J., Giannoni, M., Novak, J., Karanasiou, A., Fermo, P., and Maenhaut, W.: ECOC comparison exercise with identical thermal protocols after temperature offset correction - instrument diagnostics by in-depth evaluation of operational parameters, Atmos. Meas. Tech., 8, 779–792, https://doi.org/10.5194/amt-8-779-2015, 2015.
Phillips, S. M. and Smith, G. D.: Spectroscopic comparison of water-and methanol-soluble brown carbon particulate matter, Aerosol Sci. Technol., 51, 1113–1121, https://doi.org/10.1080/02786826.2017.1334109, 2017.
Pokhrel, R. P., Wagner, N. L., Langridge, J. M., Lack, D. A., Jayarathne, T., Stone, E. A., Stockwell, C. E., Yokelson, R. J., and Murphy, S. M.: Parameterization of single-scattering albedo (SSA) and absorption Ångström exponent (AAE) with EC∕OC for aerosol emissions from biomass burning, Atmos. Chem. Phys., 16, 9549–9561, https://doi.org/10.5194/acp-16-9549-2016, 2016.
Radney, J. G., You, R., Ma, X., Conny, J. M., Zachariah, M. R., Hodges, J. T., and Zangmeister, C. D.: Dependence of soot optical properties on particle morphology: measurements and model comparisons, Environ. Sci. Technol., 48, 3169–3176, https://doi.org/10.1021/es4041804, 2014.
Ramanathan, V. and Carmichael, G.: Global and regional climate changes due to black carbon, Nat. Geosci., 1, 221–227, https://doi.org/10.1038/ngeo156, 2008.
Rohatgi, A.: WebPlotDigitizer, available at: https://automeris.io/WebPlotDigitizer (last access: February 2019), 2017.
Saleh, R., Robinson, E. S., Tkacik, D. S., Ahern, A. T., Liu, S., Aiken, A. C., Sullivan, R. C., Presto, A. A., Dubey, M. K., and Yokelson, R. J.: Brownness of organics in aerosols from biomass burning linked to their black carbon content, Nat. Geosci., 7, 647–650, https://doi.org/10.1038/ngeo2220, 2014.
Saleh, R., Marks, M., Heo, J., Adams, P. J., Donahue, N. M., and Robinson, A. L.: Contribution of brown carbon and lensing to the direct radiative effect of carbonaceous aerosols from biomass and biofuel burning emissions, J. Geophys. Res.-Atmos., 120, 10285–10296, https://doi.org/10.1002/2015JD023697, 2015.
Schnaiter, M., Horvath, H., Möhler, O., Naumann, K.-H., Saathoff, H., and Schöck, O.: UV-VIS-NIR spectral optical properties of soot and soot-containing aerosols, J. Aerosol Sci., 34, 1421–1444, https://doi.org/10.1016/S0021-8502(03)00361-6, 2003.
Shen, Z., Lei, Y., Zhang, L., Zhang, Q., Zeng, Y., Tao, J., Zhu, C., Cao, J., Xu, H., and Liu, S.: Methanol extracted brown carbon in PM2.5 over Xi'an, China: seasonal variation of optical properties and sources identification, Aerosol Sci. Eng., 1, 57–65, https://doi.org/10.1007/s41810-017-0007-z, 2017.
Shetty, N.: Data for “Measuring Light Absorption by Freshly Emitted Organic Aerosols: Optical Artifacts in Traditional Solvent Extraction-Based Methods”, Mendeley Data, Version 1, https://doi.org/10.17632/sdy3ptyrht.1, 2019.
Sorensen, C.: Light scattering by fractal aggregates: a review, Aerosol Sci. Technol., 35, 648–687, https://doi.org/10.1080/02786820117868, 2001.
Sumlin, B. J., Heinson, W. R., and Chakrabarty, R. K.: Retrieving the aerosol complex refractive index using PyMieScatt: A Mie computational package with visualization capabilities, J. Quant. Spectrosc. Ra., 205, 127–134, https://doi.org/10.1016/j.jqsrt.2017.10.012, 2018a.
Sumlin, B. J., Heinson, Y. W., Shetty, N., Pandey, A., Pattison, R. S., Baker, S., Hao, W. M., and Chakrabarty, R. K.: UV–Vis–IR spectral complex refractive indices and optical properties of brown carbon aerosol from biomass burning, J. Quant. Spectrosc. Ra., 206, 392–398, https://doi.org/10.1016/j.jqsrt.2017.12.009, 2018b.
Sun, H., Biedermann, L., and Bond, T. C.: Color of brown carbon: A model for ultraviolet and visible light absorption by organic carbon aerosol, Geophys. Res. Lett., 34, L17813, https://doi.org/10.1029/2007GL029797, 2007.
Wang, X., Heald, C., Ridley, D., Schwarz, J., Spackman, J., Perring, A., Coe, H., Liu, D., and Clarke, A.: Exploiting simultaneous observational constraints on mass and absorption to estimate the global direct radiative forcing of black carbon and brown carbon, Atmos. Chem. Phys., 14, 10989–11010, https://doi.org/10.5194/acp-14-10989-2014, 2014.
Wang, X., Heald, C. L., Liu, J., Weber, R. J., Campuzano-Jost, P., Jimenez, J. L., Schwarz, J. P., and Perring, A. E.: Exploring the observational constraints on the simulation of brown carbon, Atmos. Chem. Phys., 18, 635–653, https://doi.org/10.5194/acp-18-635-2018, 2018.
Washenfelder, R., Attwood, A., Brock, C., Guo, H., Xu, L., Weber, R., Ng, N., Allen, H., Ayres, B., and Baumann, K.: Biomass burning dominates brown carbon absorption in the rural southeastern United States, Geophys. Res. Lett., 42, 653–664, https://doi.org/10.1002/2014GL062444, 2015.
Xie, M., Hays, M. D., and Holder, A. L.: Light-absorbing organic carbon from prescribed and laboratory biomass burning and gasoline vehicle emissions, Sci. Rep., 7, 7318, https://doi.org/10.1038/s41598-017-06981-8, 2017.
Xie, M., Chen, X., Hays, M. D., and Holder, A. L.: Composition and light absorption of N-containing aromatic compounds in organic aerosols from laboratory biomass burning, Atmos. Chem. Phys., 19, 2899–2915, https://doi.org/10.5194/acp-19-2899-2019, 2019.
Yang, M., Howell, S., Zhuang, J., and Huebert, B.: Attribution of aerosol light absorption to black carbon, brown carbon, and dust in China – interpretations of atmospheric measurements during EAST-AIRE, Atmos. Chem. Phys., 9, 2035–2050, https://doi.org/10.5194/acp-9-2035-2009, 2009.
Zhang, X., Wang, Y., Zhang, X., Guo, W., and Gong, S.: Carbonaceous aerosol composition over various regions of China during 2006, J. Geophys. Res.-Atmos., 113, D14111, https://doi.org/10.1029/2007JD009525, 2008.
Zhang, X., Lin, Y.-H., Surratt, J. D., and Weber, R. J.: Sources, composition and absorption Ångstrom exponent of light-absorbing organic components in aerosol extracts from the Los Angeles Basin, Environ. Sci. Technol., 47, 3685–3693, https://doi.org/10.1021/es305047b, 2013.
Zhang, Y., Forrister, H., Liu, J., Dibb, J., Anderson, B., Schwarz, J. P., Perring, A. E., Jimenez, J. L., Campuzano-Jost, P., and Wang, Y.: Top-of-atmosphere radiative forcing affected by brown carbon in the upper troposphere, Nat. Geosci., 10, 486–489, https://doi.org/10.1038/ngeo2960, 2017.
Zhou, Y., Xing, X., Lang, J., Chen, D., Cheng, S., Lin, W., Xiao, W., and Liu, C.: A comprehensive biomass burning emission inventory with high spatial and temporal resolution in China, Atmos. Chem. Phys., 17, 2839–2864, https://doi.org/10.5194/acp-17-2839-2017, 2017.