the Creative Commons Attribution 4.0 License.
the Creative Commons Attribution 4.0 License.
 | 21 Mar 2019
Potential impacts of cold frontal passage on air quality over the Yangtze River Delta, China
Hanqing Kang
Bin Zhu
Jinhui Gao
Yao He
Honglei Wang
Jifeng Su
Chen Pan
Tong Zhu
Bu Yu
Cold frontal passages usually promote quick removal of atmospheric pollutants over North China (e.g. the Beijing–Tianjin–Hebei region). However, in the Yangtze River Delta (YRD), cold fronts may bring air pollutants from the polluted North China Plain (NCP), thereby deteriorating the air quality in the YRD. In this study, a cold frontal passage and a subsequent stable weather event over YRD during 21–26 January 2015 was investigated with in situ observations and Weather Research and Forecasting – Community Multiscale Air Quality Modeling System simulations. Observations showed a burst of PM2.5 pollution and an obvious southward motion of PM2.5 peaks on the afternoon of 21 January, suggesting a strong inflow of highly polluted air masses to YRD by a cold frontal passage. Model simulations revealed an existing warm and polluted air mass over YRD ahead of the frontal zone, which climbed to the free troposphere along the frontal surface as the cold front passed, increasing the PM2.5 concentration at high altitudes. Strong north-westerly frontal airflow transported particles from the highly polluted NCP to the YRD. As the frontal zone moved downstream of YRD, high pressure took control over the YRD, which resulted in a synoptic subsidence that trapped PM2.5 in the boundary layer. After the cold frontal episode, a uniform pressure field took control over the YRD. Locally emitted PM2.5 started to accumulate under the weak winds and stable atmosphere. Tagging of PM2.5 by geophysical regions showed that the PM2.5 contribution from the YRD itself was 35 % and the contribution from the NCP was 29 % during the cold frontal passage. However, under the subsequent stable weather conditions, the PM2.5 contribution from the YRD increased to 61.5 % and the contribution from the NCP decreased to 14.5 %. The results of this study indicate that cold fronts are potential carriers of atmospheric pollutants when there are strong air pollutant sources in upstream areas, which may deteriorate air quality in downstream regions.
- Article
(9380 KB) - Full-text XML
-
Supplement
(635 KB) - BibTeX
- EndNote


Fast economic development and urbanization processes in China have led to an increase in air pollution during the past few decades (Han et al., 2016; Chen and Wang, 2015; Cao et al., 2015). Haze, which is formed by fine particulate extinction, has been the most prevalent atmospheric pollution phenomenon over China in recent years (Huang et al., 2014; Wang et al., 2017). The fundamental cause of haze is an increase in particulate matter – especially fine particles – with aerodynamic diameters equal to or less than 2.5 µm (PM2.5). Recently, fine particulate matter has caused wide concern owing to its impacts on regional air quality (Z. Wang et al., 2013), human health (Gao et al., 2017), and climate change (Rosenfeld et al., 2014).
Densely populated city clusters in China (e.g. the Beijing–Tianjin–Hebei, BTH, region; Yangtze River Delta, YRD; and Pearl River Delta, PRD) are associated with heavy particle pollution (Z. Wang et al., 2013; Liao et al., 2015; Wu et al., 2007). The two largest city clusters, BTH and YRD, are geographically close to each other. Significant cross-border transport of PM2.5 has occurred between BTH and YRD (Li et al., 2013). Cold fronts promote the long-range transport of dust and anthropogenic air pollutants (Liu, 2003; Mari, 2004) that are usually favourable for the quick removal of atmospheric pollutants in BTH (Zhao et al., 2013; Gao et al., 2016). Meanwhile, the YRD is located south of BTH, where cold fronts may transport pollutants from BTH to YRD and exacerbate atmospheric pollution. This indicates that the control of emissions in one city cluster is not sufficient to reduce particulate pollution; joint efforts among city clusters are crucial.
The formation mechanisms of PM2.5 pollution in China remain highly uncertain owing to complex interactions among pollution sources, meteorology, and atmospheric chemical processes (Guo et al., 2014). Generally, high emission intensity, adverse meteorological conditions, secondary aerosol formation, and the regional transport of particles are main factors contributing to the formation of particulate pollution (Sun et al., 2013; Wang et al., 2014; Y. Wang et al., 2013; Li et al., 2013). As anthropogenic emissions do not vary much from day to day, particulate pollution episodes are more often associated with adverse meteorological conditions, such as weak surface winds, stable stratified conditions, low mixing layers, and winds from particle source regions that transport large volumes of particles (Tao et al., 2014; Y. Wang et al., 2013; J. Li et al., 2017). Under such weather conditions, substantial amounts of secondary aerosols can be generated and aggravate particulate pollution (Gao et al., 2015; Huang et al., 2014).
Particulate concentrations have been decreasing since 2013 owing to implementation of the Atmospheric Pollution Prevention and Control Action Plan (Wei et al., 2017). However, particle pollution episodes remain frequent, especially in the wintertime. Under the influence of the East Asia winter monsoon, the YRD is dominated by cold air activity in the wintertime. If cold air activity intensified, cold fronts would intrude into the YRD. In contrast, after a cold frontal passage, weakened winds and a stable atmosphere remain over the YRD. A regional-scale stationary atmosphere is unfavourable for the diffusion of pollutants and leads to haze events, a phenomenon that has been extensively studied over East China (Yang et al., 2015; Z. Wang et al., 2013; Y. Wang et al., 2013; Leng et al., 2016). Lin et al. (2007) suggested that long-range transport of Asian dust and upstream air pollutants by cold fronts are important environmental issues of Taiwan during the winter monsoon season. Liu (2003) pointed out that the major process driving Asian pollution outflow in spring is frontal lifting ahead of south-eastward-moving cold fronts and transport in the boundary layer behind the cold fronts. Therefore, cold fronts may have a significant impact on air quality along its transport pathway.
In this study, we employed the Weather Research and Forecasting (WRF) mesoscale meteorological model and the Community Multiscale Air Quality Modelling System (CMAQ) to investigate the sources and formation processes of PM2.5 pollution during a cold frontal passage and subsequent stable weather conditions in January 2015. We investigated the formation processes, horizontal distributions, vertical structures, and contributions from source regions to PM2.5 over the YRD in both synoptic patterns. Our results highlight the reasons behind high PM2.5 episodes and source contributions to PM2.5 over the YRD and will be helpful to policy-makers in this region.
2.1 Configuration of weather prediction model
The numerical model used in this study was the non-hydrostatic, compressible, two-way interactive Advanced Research WRF (version 3.4; Skamarock et al., 2008) coupled with a single-layer urban canopy model (Kusaka et al., 2001; Chen et al., 2004). The simulation domain includes geographical areas (e.g. East China and the Korean Peninsula) with 10 km×10 km horizontal resolution and 220×220 grids, centred at 33.5∘ N and 118∘ E (Fig. 1). The vertical grid contains 30 full sigma levels from the surface to 50 hPa, the lowest 20 levels of which are below 2 km to better resolve processes within the boundary layer. The WRF interior grid-nudging technique was used to improve meteorological fields simulation. An 18-day simulation (from 00:00 UTC 10 January 2015 to 00:00 UTC 28 January 2015) was conducted with initial conditions (ICONs) and boundary conditions (BCONs) from the National Centers for Environmental Prediction's 1∘ grid spacing operational Global Forecast System final analyses. To represent a more realistic urban land type in the study area, fine-resolution (30 s) 20-category MODIS land-use data were used.
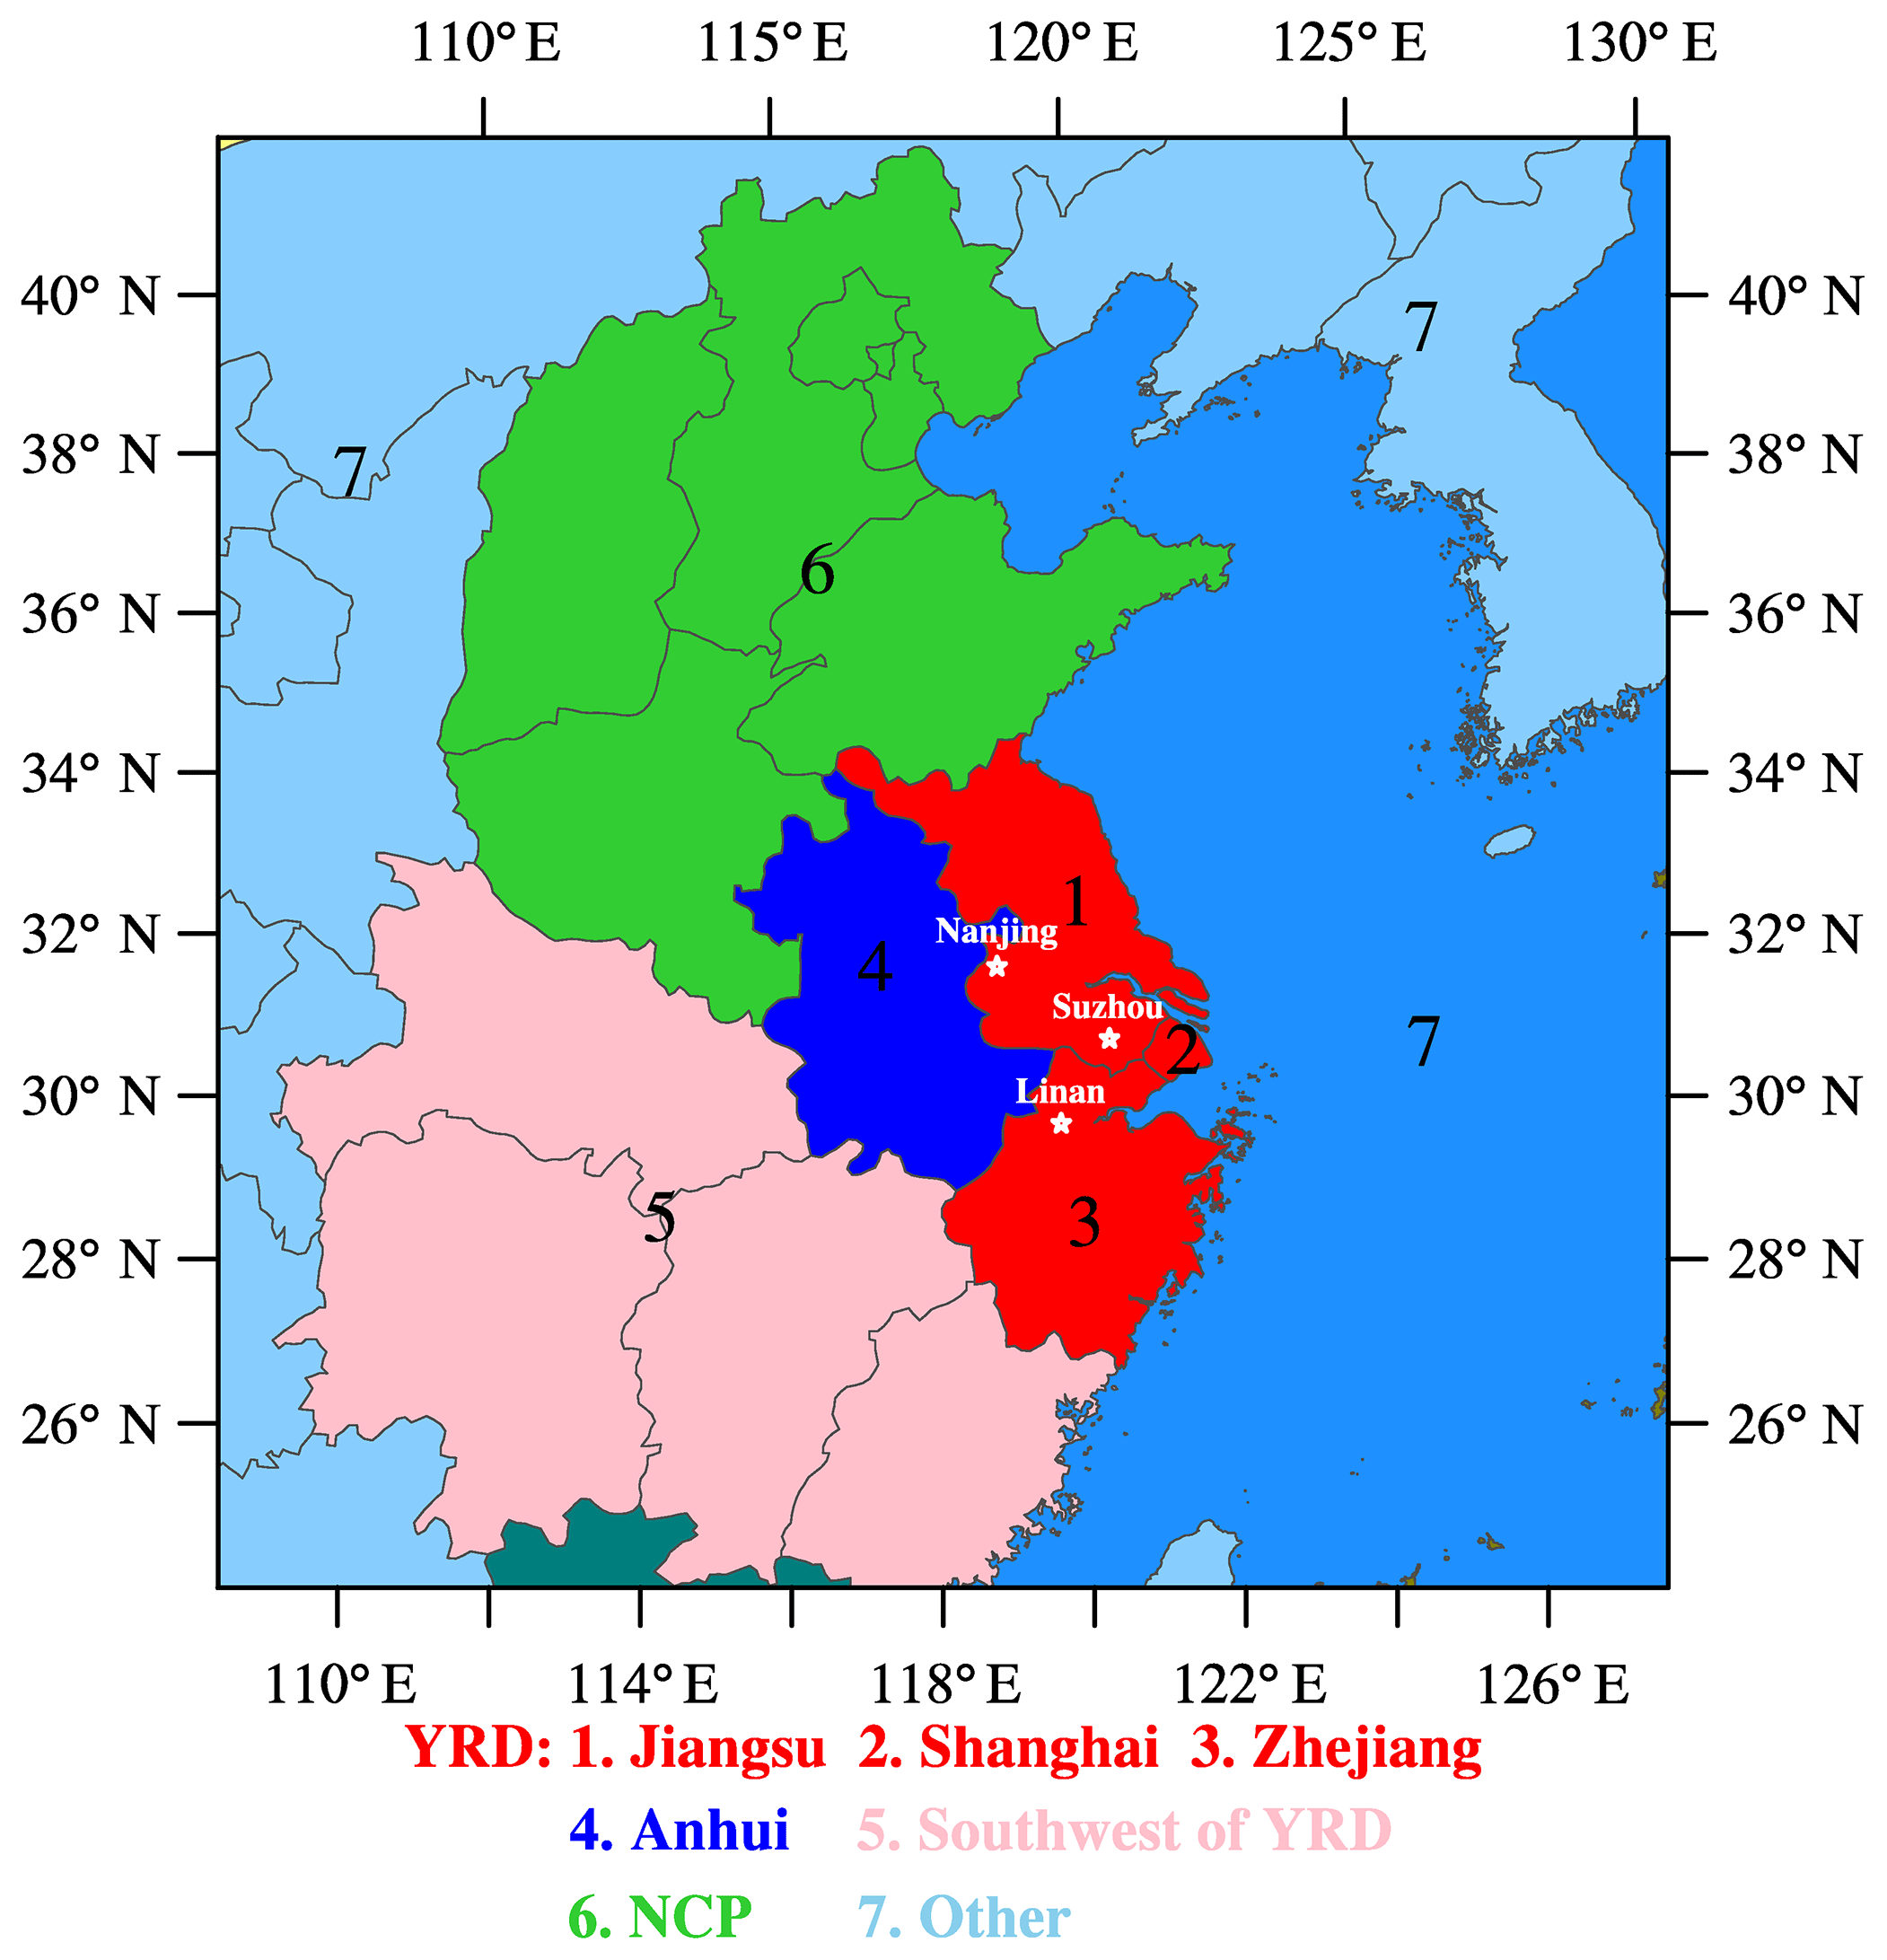
Figure 1Modelling domain and source regions. White stars denote the locations of observation sites in Nanjing, Suzhou, and Linan.
2.2 Configuration of air quality model
The CMAQ (version 5.0.2) was applied to simulate gaseous and particulate air pollutants using a 10 km horizontal grid spacing domain that covered East China and the Korean Peninsula (Fig. 1), while the hourly meteorological field was provided by the mesoscale meteorological model WRFv3.4. A period from 10 to 28 January 2015 was selected for the simulation, with the first 9 days being the spin-up period to exclude the impacts of uncertainties in ICONs. The ICONs and BCONs for the CMAQ simulation were obtained from the modelling result of the Model for Ozone and Related Chemical Tracers (version 4), an offline global chemical transport model for the troposphere (Emmons et al., 2010). The anthropogenic emissions used in this study were provided by a mosaic Asian monthly anthropogenic emission inventory, MIX (M. Li et al., 2017), with a horizontal resolution of . Biogenic emissions were generated by the Model for Emissions of Gases and Aerosols from Nature (version 2.1). The CB05 and AERO6 mechanisms were chosen for gas-phase chemistry and aerosols, respectively.
The process analysis technique introduced by Gipson (1999) was implemented in the CMAQ modelling system to determine the contributions of both physical and chemical processes to simulated species. The physical and chemical processes discussed in this study include vertical advection (ZADV), horizontal advection (HADV), vertical diffusion (VDIF), dry deposition (DDEP), cloud processes and aqueous chemistry (CLDS), and aerosol (AERO) processes.
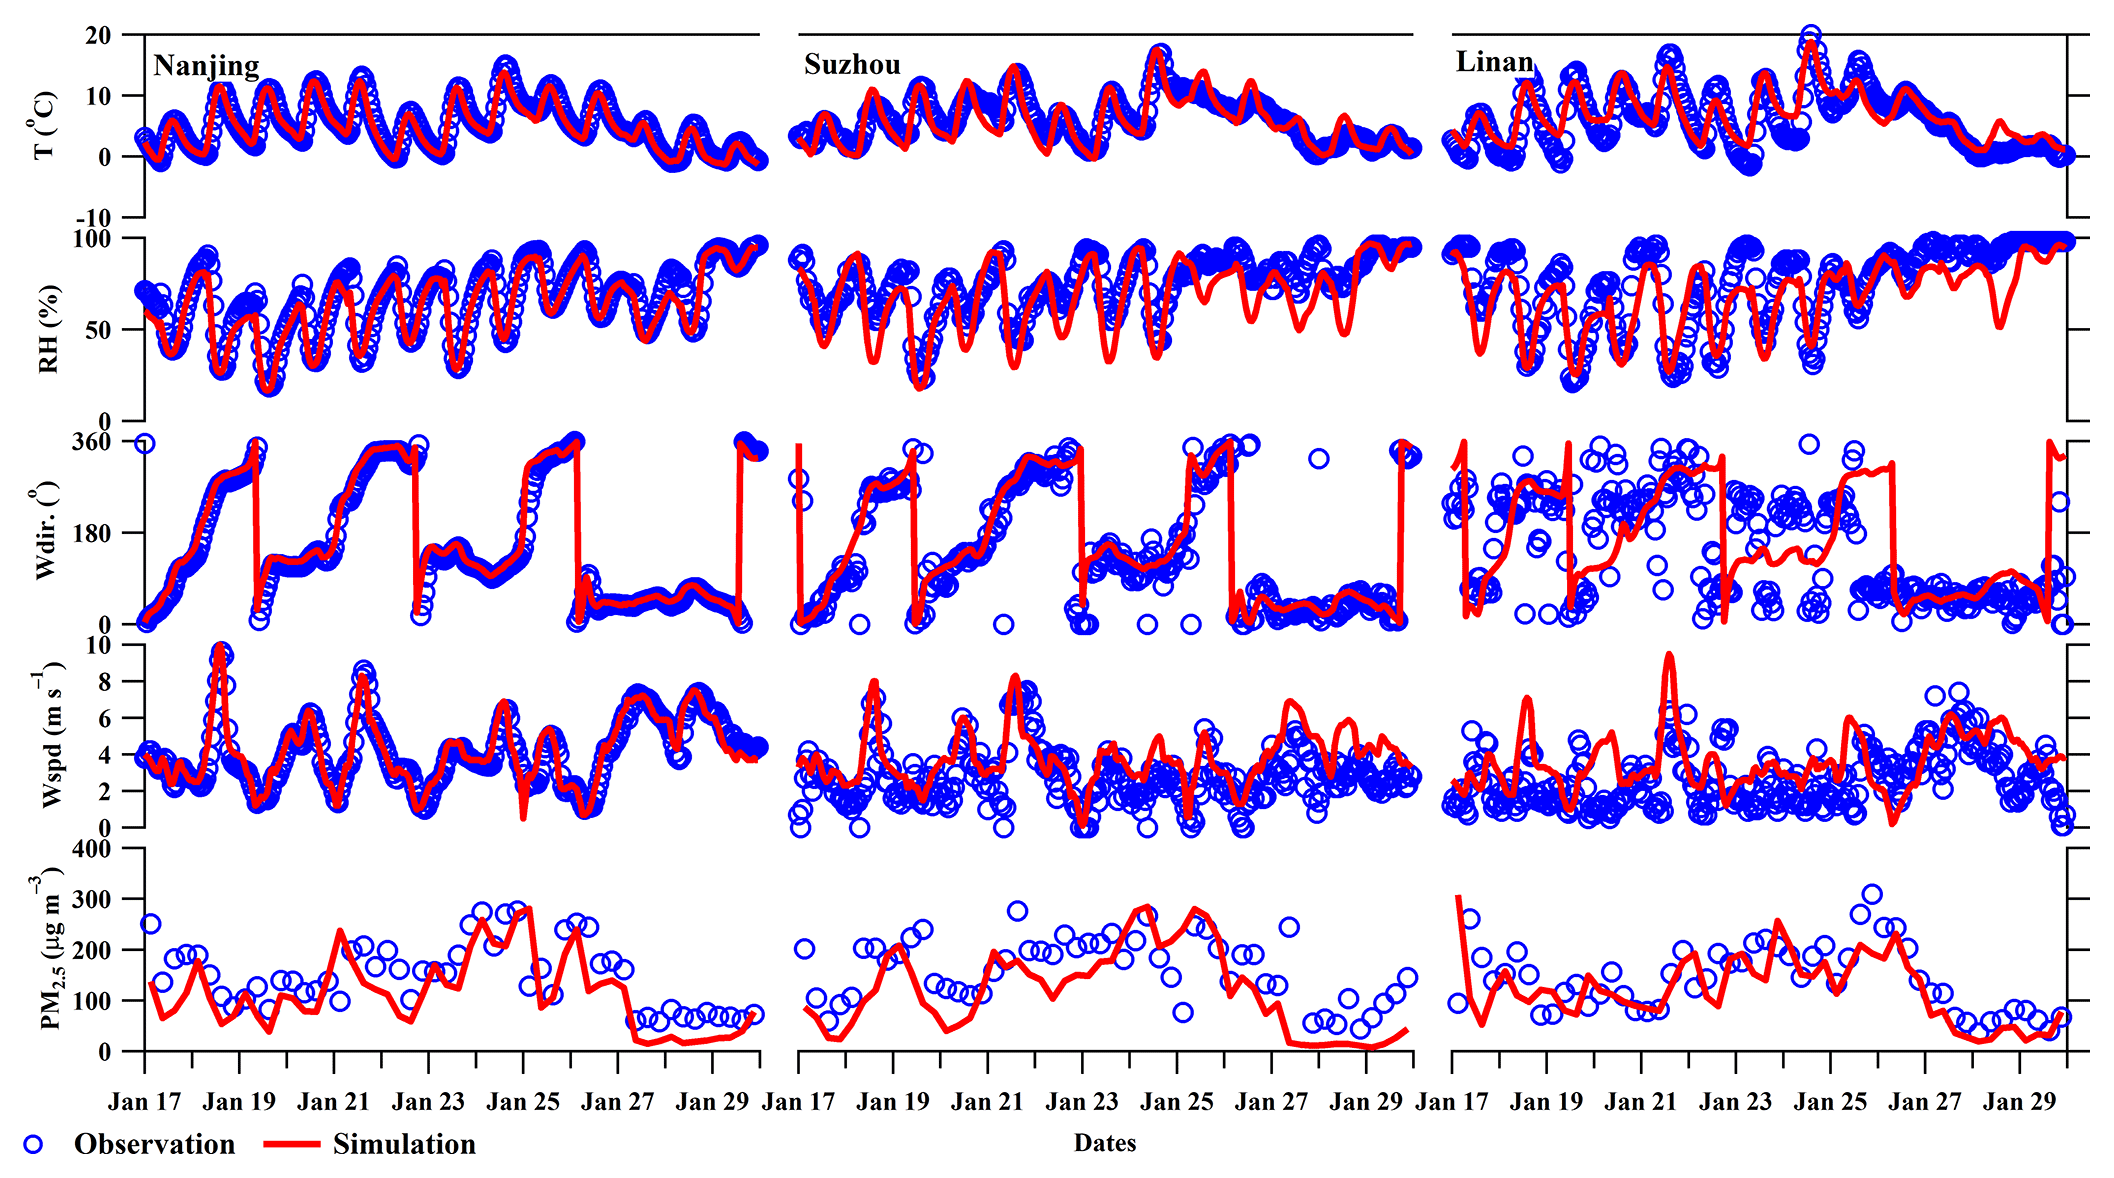
Figure 2Observed and simulated 2 m air temperature (T), relative humidity (RH), 10 m wind direction (Wdir), wind speed (Wspd), and surface PM2.5 concentrations from 00:00 LT 19 January 2015 to 00:00 LT 28 January 2015 at Nanjing, Suzhou, and Linan.
The integrated source apportionment method (ISAM) has been implemented in CMAQ (Kwok et al., 2013). ISAM tracks contributions from ICONs, BCONs, and user-defined source regions to ambient and deposited gases and aerosol particles. Currently, ISAM supports two kinds of PM2.5 tags: a primary species tag, which tracks the primary emissions of elemental carbon, organic carbon, sulfate, nitrate, ammonium, and other trace elements (e.g. Cl, Na, K, Fe, Ca, Al, Si, Ti, and Mn); and a secondary species tag, which tracks secondarily formed sulfate, nitrate, and ammonium, as well as all gaseous species associated with secondary aerosol species formations (e.g. SO2, NO2, NO, NO3, HNO3, HONO, N2O5, PAN, and NH3).
2.3 Model verification
The model-simulated surface meteorological parameters and PM2.5 concentrations were compared with observations obtained from Nanjing, Suzhou, and Linan (Fig. 1). Figure 2 compares the surface temperature, relative humidity, wind direction, wind speed, and PM2.5 concentrations between the simulations and observations from 00:00 LT 19 January 2015 to 00:00 LT 28 January 2015. Simulations from the coupled WRF–CMAQ model appeared to effectively reproduce the variations of meteorological parameters and PM2.5 concentrations at the three observation sites.
Table 1Statistical comparisons between the observed and simulated meteorological parameters and PM2.5 concentrations at Nanjing, Suzhou, and Linan∗.
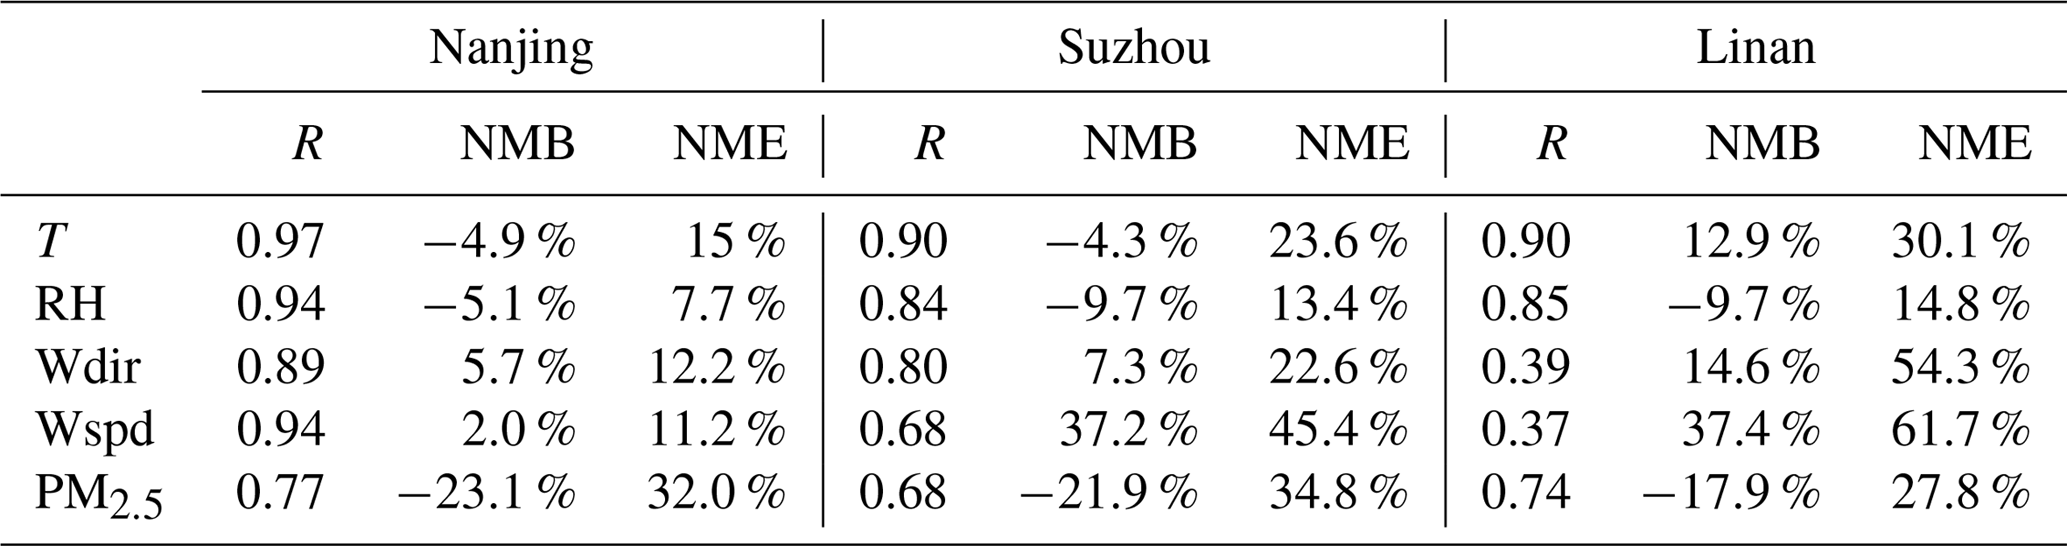
∗ R is correlation coefficient, NMB is normalized mean bias, NME is normalized mean error, T is air temperature, RH is relative humidity, Wdir is wind direction, Wspd is wind speed, PM2.5 is PM2.5 concentration.
Some statistical metrics including the correlation coefficient (R), normalized mean bias (NMB), and normalized mean error (NME) were calculated to compare simulated results with observations. The NMB and NME were calculated, respectively, by Eqs. (1) and (2):
where Mi represents the simulated value, Oi represents the observational data, and N denotes the number of data pairs. Statistical comparisons between the observed and simulated variables are shown in Table 1.
The correlation coefficients for meteorological parameters, except for wind direction and wind speed at Suzhou and Linan, were found to be around 0.90. This discrepancy is likely because the Suzhou station is located in an urban centre, and the Linan station is located on a hill. The 10 km×10 km model grid was unable to properly represent the complicated urban canopy at Suzhou and the rolling terrain at Linan. The correlation coefficients for PM2.5 concentrations at Nanjing, Suzhou, and Linan were found to be 0.77, 0.68, and 0.74, respectively. This indicates that the time series patterns of PM2.5 simulations agree well with observations. The NMB and NME for meteorological parameters were found to be relatively small, except for wind speed and wind direction at Suzhou and Linan. The model systematically underestimated PM2.5 concentrations by about 20 % for all three stations. This can probably be attributed to the coarse model grid size and lower emission resolution. The NME for PM2.5 at all three stations was found to be below 35 %, indicating that model performance was acceptable.
The YRD region was suffering from particle pollution in January 2015. The field experiment was carried out from 00:00 LT 19 January 2015 to 00:00 LT 28 January 2015 at Nanjing, Suzhou, and Linan (Fig. 1). The Nanjing observation site is located in a suburban area, the Suzhou station is located in an urban area, and the Linan station represents the regional background site. Observations revealed that 9-day mean PM2.5 concentrations reached 100 µg m−3 at the Nanjing and Suzhou sites. In some high-pollution episodes, PM2.5 concentrations reached as high as 300 µg m−3 (Fig. 3).
A short-term burst of PM2.5 pollution accompanied by strong north-west winds successively appeared in Nanjing, Suzhou, and Linan between 12:00 LT 21 January 2015 and 04:00 LT 22 January 2015 (Fig. 3). The peaks of PM2.5 concentrations reached Nanjing, Suzhou, and Linan at 16:00, 19:00, and 21:00 LT, respectively, with a 5 h delay from Nanjing to Linan. This process reveals that a strong north-westerly flow brought a polluted air mass across the YRD. Synoptic maps show dense isobars at the head of the cold front, which appeared over the north (upstream) of the YRD at 08:00 LT 21 January 2015 (Fig. 4a). At that moment, a south-westerly wind prevailed in the YRD. Twelve hours later, the cold front moved to the East China Sea (downstream of YRD; Fig. 4b). Meanwhile, the wind direction over the YRD shifted to the north-west, which was favourable for the horizontal transport of air pollutants from the upstream area to the YRD.
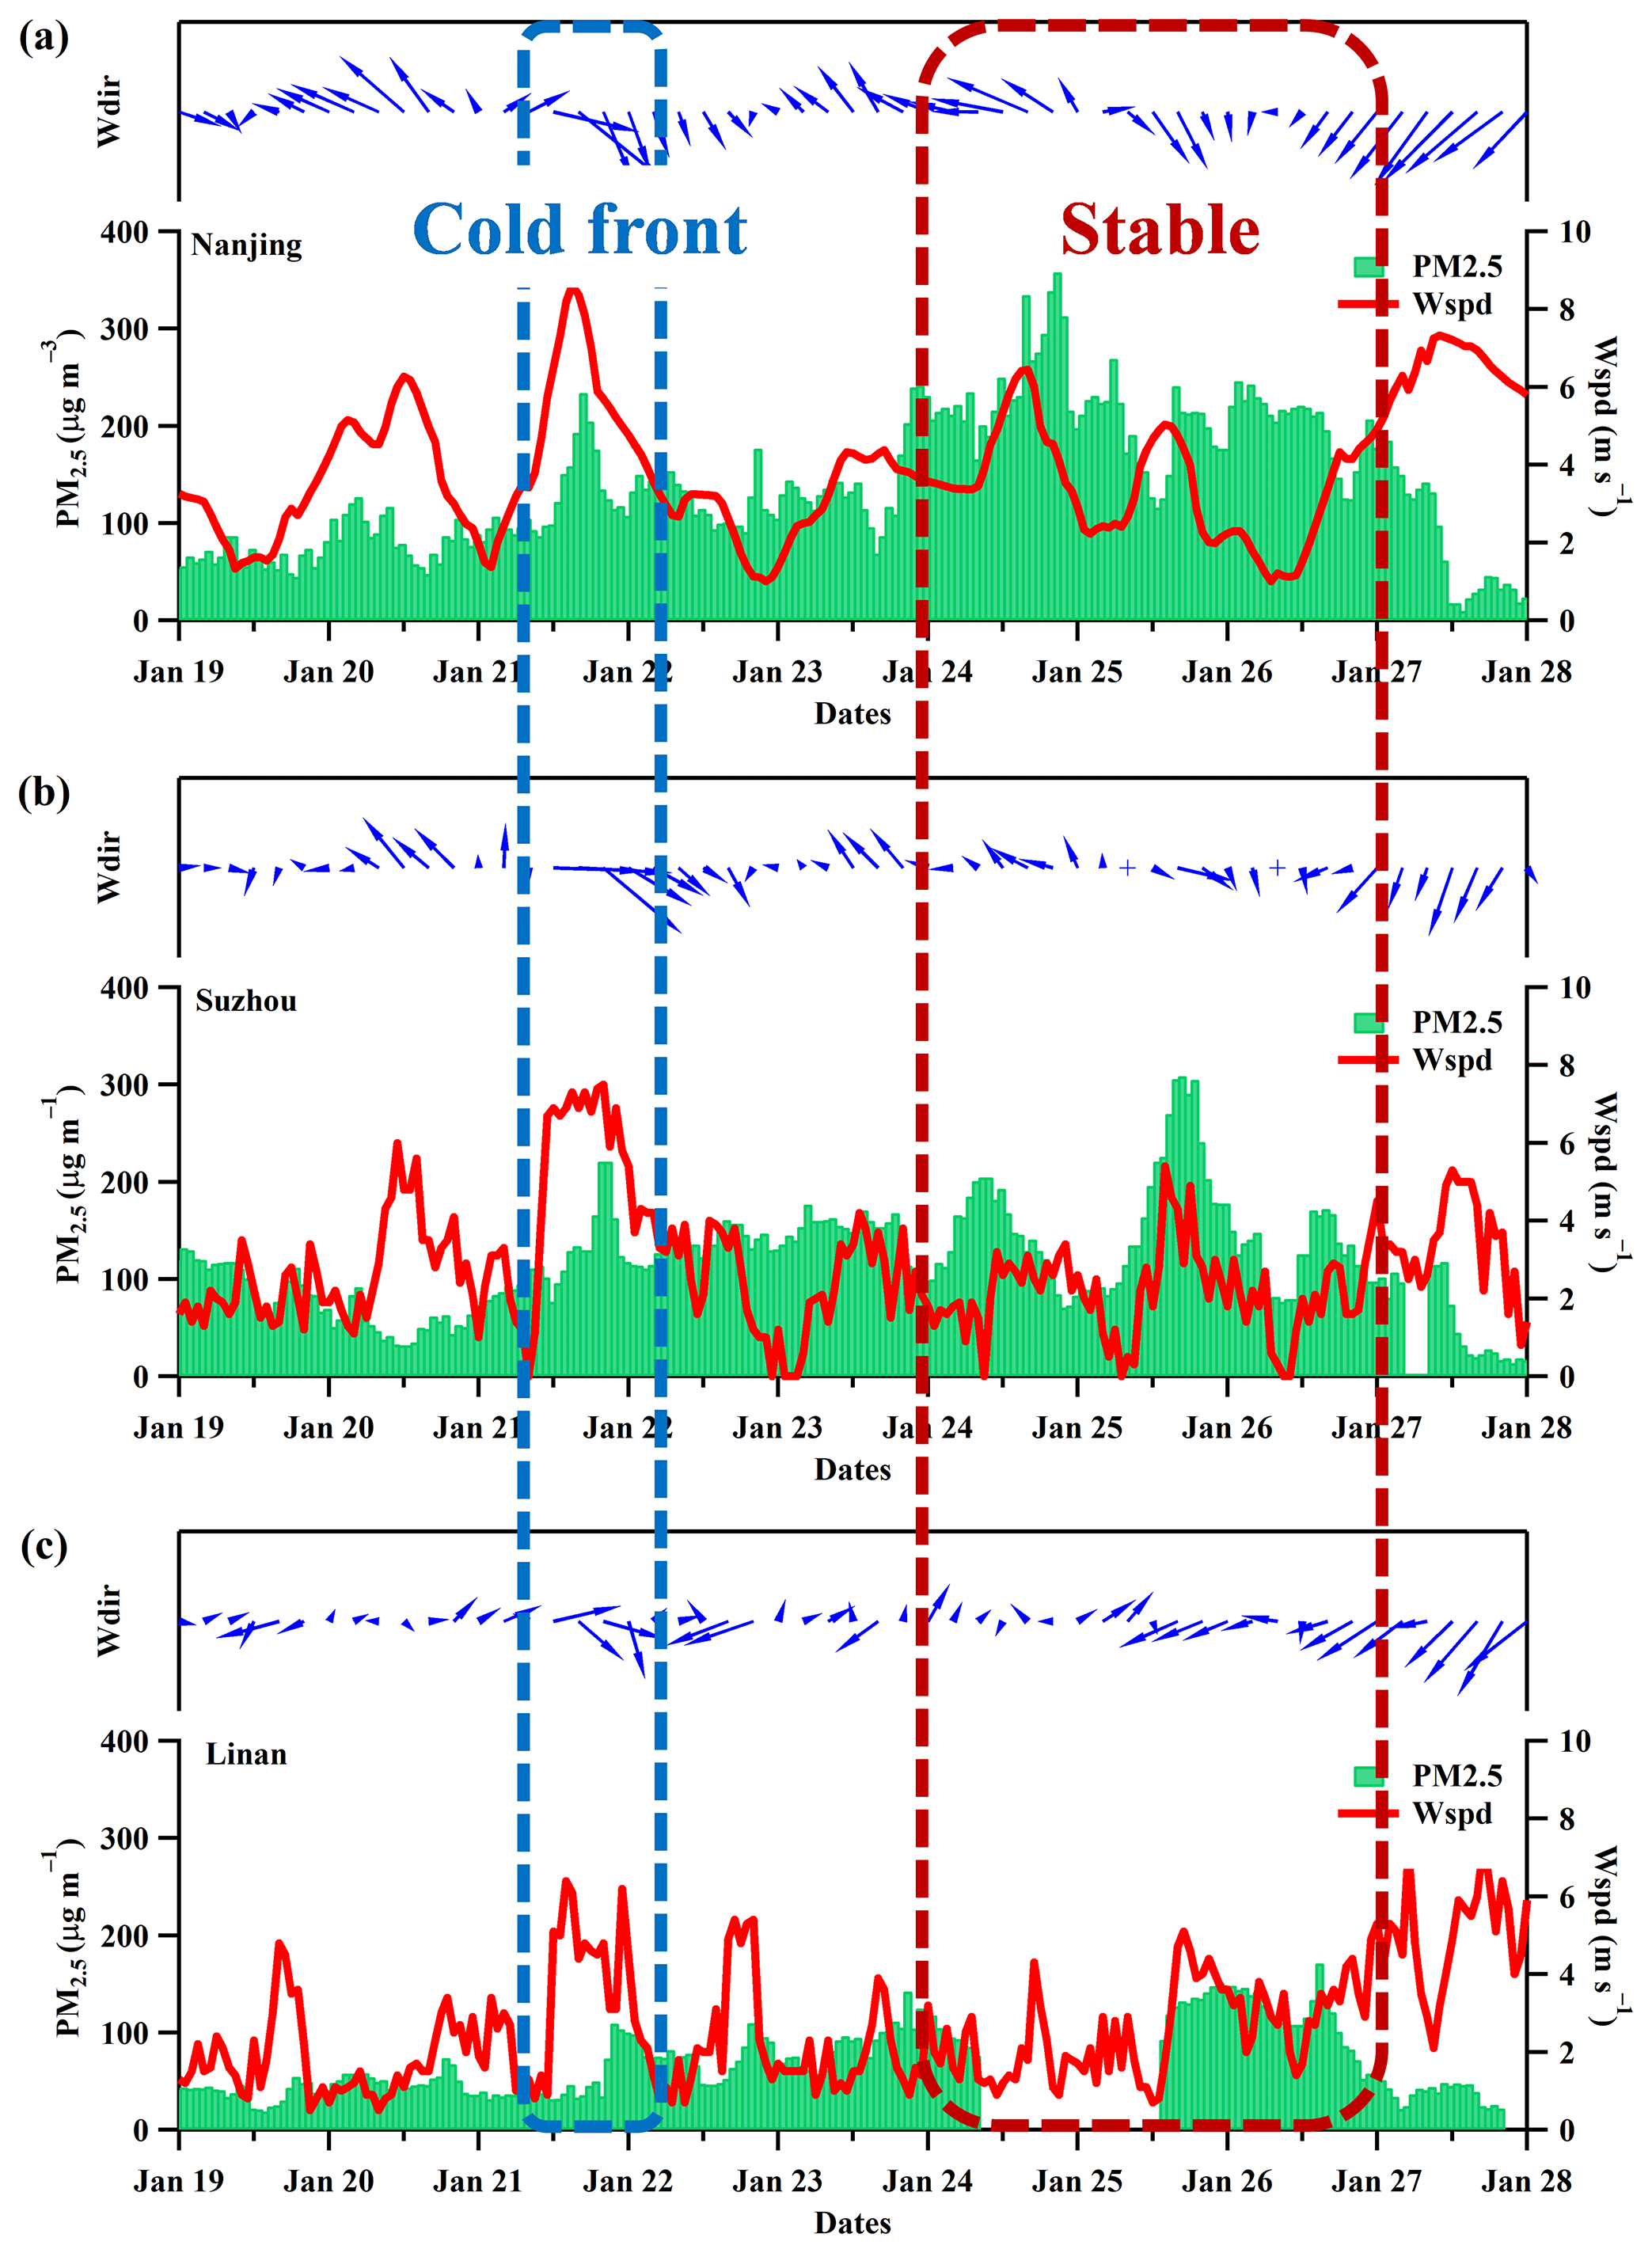
Figure 3PM2.5 concentrations (green bars), wind speeds (Wspd, red lines), and wind directions (Wdir, vectors) at (a) Nanjing, (b) Suzhou, and (c) Linan.

Figure 4Surface weather patterns over eastern Asia at (a) 08:00 LT 21 January, (b) 20:00 LT 21 January, (c) 08:00 LT 23 January, and (d) 08:00 LT 26 January.
In order to validate whether this finding was just a special case or not, further investigations were conducted using three months (from December 2014 to February 2015) of PM2.5 and meteorological observation data. The result showed that at least 13 cold frontal processes transported atmospheric pollutants from the NCP to YRD in the three months (see Fig. S1 in the Supplement). That means long-range transport of air pollutants by cold frontal passage may be an important cause of air pollution over YRD in wintertime; however, we did not notice it before. Note that the cold front generally deteriorates air quality over the YRD in a short time period, but it will finally clean the atmosphere.
After the cold frontal episode, YRD experienced a uniform pressure field for about 3 days (Fig. 4c, d), creating conditions that were unfavourable for the horizontal transport and vertical mixing of atmospheric pollutants (Zhu et al., 2010). Aerosol particles gradually accumulated over the YRD under this stable atmosphere. In order to exclude the impact of the cold front, this study designated the stable period from 24 to 27 January 2015, when the wind speed was relatively low but PM2.5 concentrations were extremely high (Fig. 3), indicating that the pollution likely originated locally. On 27 January 2015, a strong cold front intruded into the YRD accompanied by precipitation, resulting in the significant removal of PM2.5.
Observations revealed that the cold front pushed polluted air masses over the NCP to YRD, which increased PM2.5 concentration over YRD on 21 January. This finding is reproduced by the well-evaluated WRF model. Based on this finding, we considered the formation processes and source contributions of PM2.5 pollution over the YRD during the cold frontal passage and the subsequent stable weather conditions.
4.1 Formation processes of high PM2.5 during cold frontal passage
A strong wind accompanied by high PM2.5 concentrations is favourable for the long-range transport of aerosols. Time-averaged PM2.5 concentrations and fluxes at the surface and 1.0 km altitude during the cold frontal passage are shown in Fig. 5. High PM2.5 concentrations (>100 µg m−3) and high wind speeds can be observed both at the surface (Fig. 5a) and at 1.0 km (Fig. 5b), resulting in strong PM2.5 fluxes from polluted upstream regions to downstream regions. Mean PM2.5 fluxes at the surface and at 1.0 km were 619 and 1072 µg m−2 s−1, respectively. PM2.5 fluxes were stronger at 1.0 km than at the surface because the wind speed was higher, while the PM2.5 concentrations were comparable to those at surface levels. We can conclude that high altitudes are important aerosol transport pathways during cold frontal passage; they are probably more important than surface transport pathways.
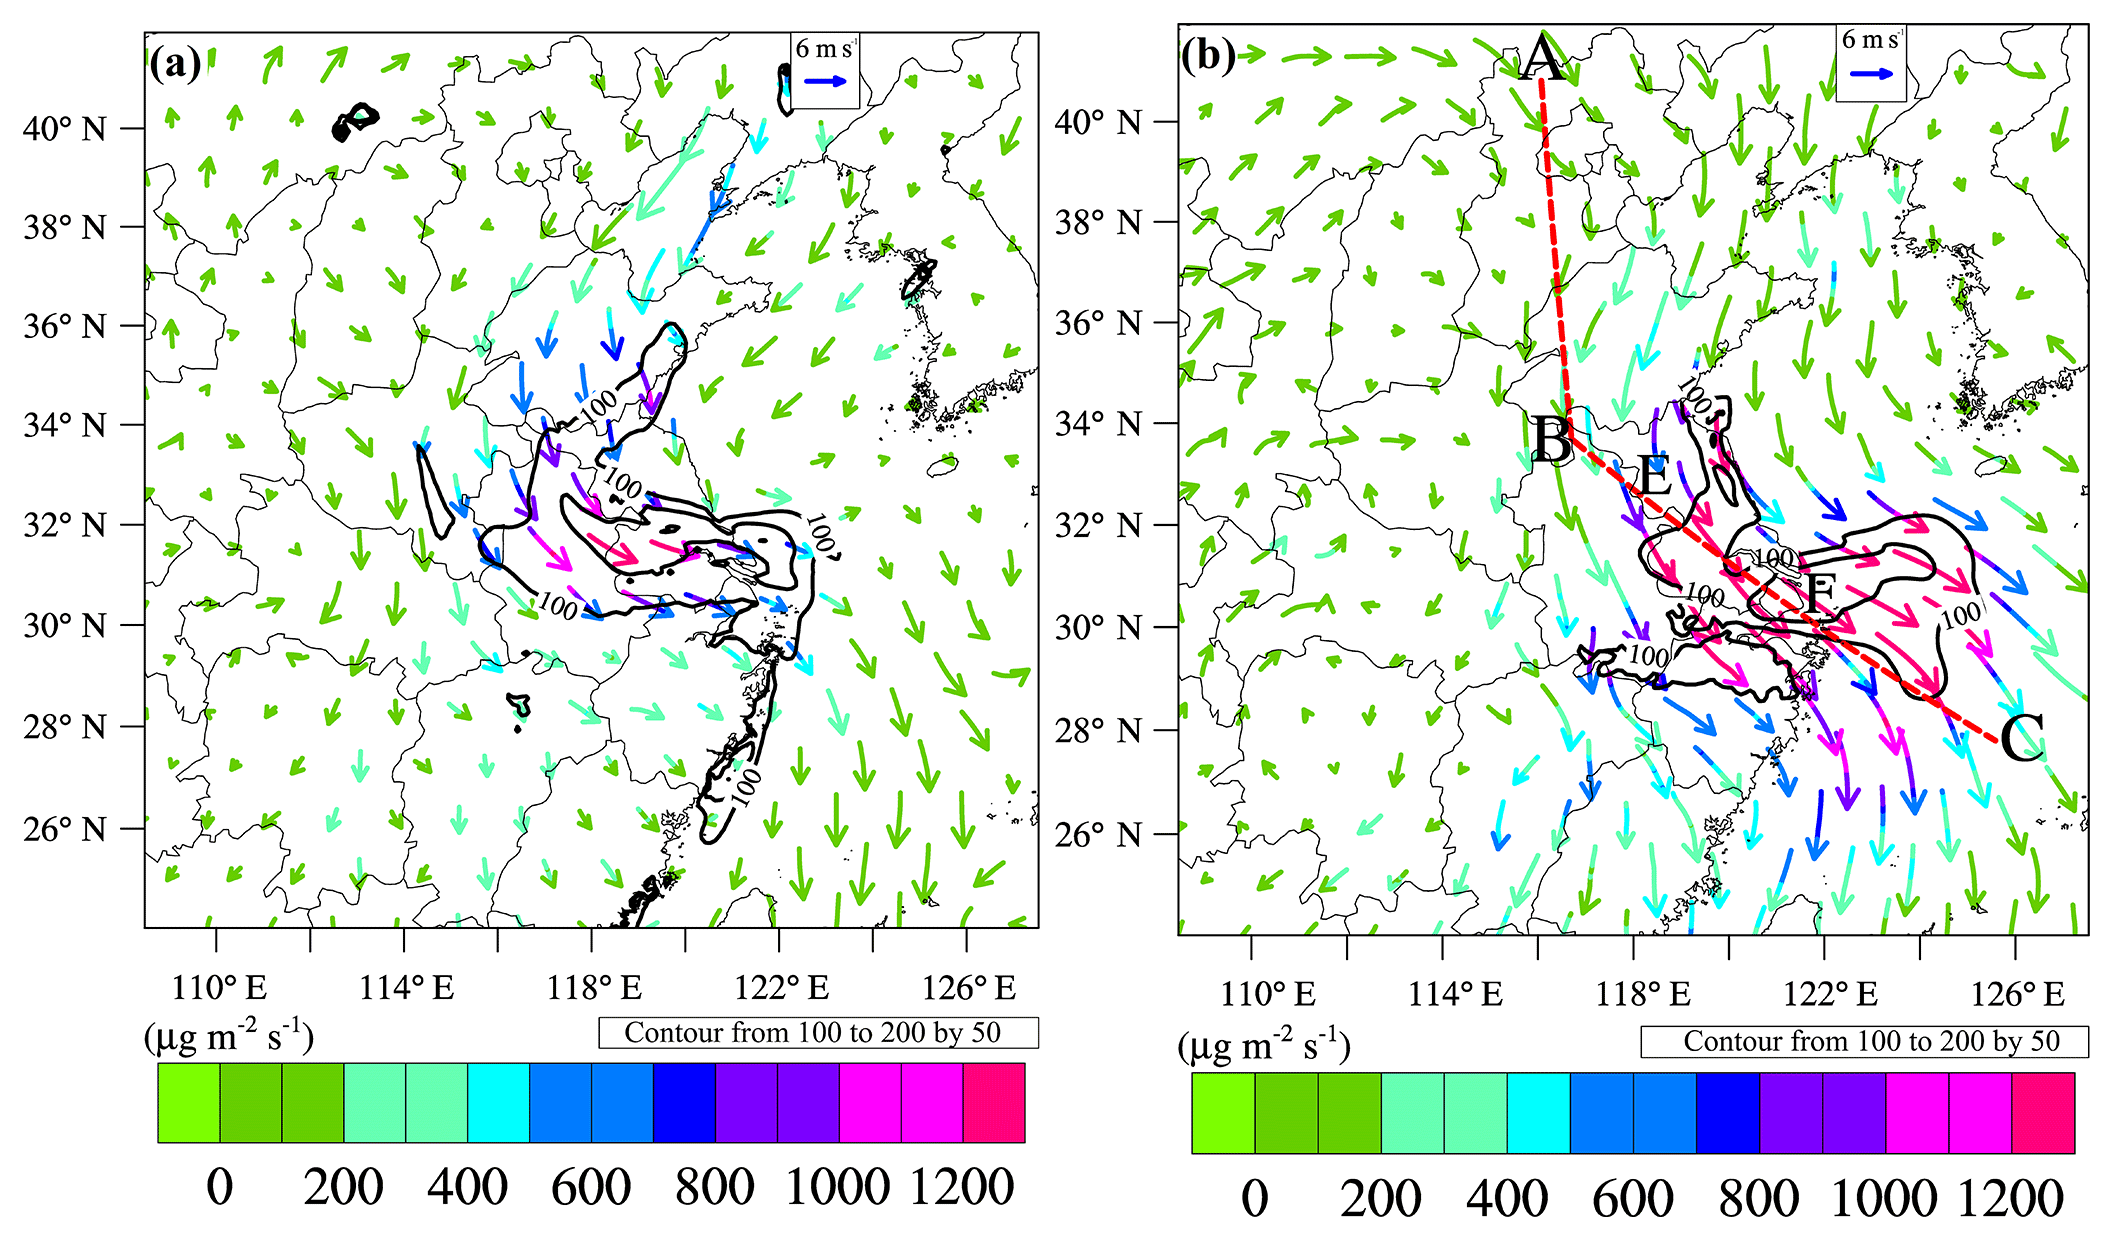
Figure 5Mean wind vectors (arrow), PM2.5 flux (coloured arrow), and mass concentration (black contours) at (a) the surface and (b) 1.0 km altitude from 12:00 LT 21 January 2015 to 04:00 LT 22 January 2015. The dashed red line (A–B–C) in Fig. 5b denotes the location of the vertical cross section shown in Fig. 6. Points E and F indicate the YRD locations shown in Fig. 6.

Figure 6Vertical cross sections of PM2.5 concentration (colour-filled contours), and equivalent potential temperature (EPT, dashed black lines), in-plane wind vectors (arrow) where the vertical speed is multiplied by 100, and PM2.5 flux (arrow colour), at (a) 12:00 LT 21 January, (b) 16:00 LT 21 January, (c) 22:00 LT 21 January, and (d) 04:00 LT 22 January. The thicker red lines in panels (a) and (b) denote the locations of the cold front.
Figure 6 shows a vertical cross section of PM2.5 concentration, PM2.5 flux, and equivalent potential temperature (EPT) along the aerosol transport pathway (indicated by the dashed red line in Fig. 5b) during the cold frontal passage through the YRD from 12:00 LT 21 January to 04:00 LT 22 January. An obvious cold front can be identified over the northern YRD from the densely spaced EPT contours near-surface and vertical wind shear (Fig. 6a). The EPT contours reveal a stable layer over the YRD with isentropic tilt toward the cold air and parallel to the cold front. Wind vectors show clear downward (upward) movements in the north (south) of the cold front (red lines in Fig. 6a and b).
At noon (12:00 LT) on 21 January, the cold front reached the northern boundary of the YRD accompanied by high PM2.5 concentrations (>100 µg m−3) and strong PM2.5 fluxes (800–1600 µg m−2 s−1; Fig. 6a). At the southern end of the cold front, the vertical extent of the high PM2.5 concentrations (100 µg m−3) reached 2.0 km, significantly higher than the boundary layer height (around 0.6–0.8 km, not shown in Fig. 6a). Therefore, the vertical transport of PM2.5 is inferred to be caused by systematic prefrontal upward movements rather than boundary layer turbulent mixing. Surface PM2.5 concentrations exceeded 100 µg m−3 over the YRD before the cold front's arrival. When the cold front moved into the YRD, it forced the warm and polluted YRD air mass ahead of the frontal zone up along the frontal boundary, lifting PM2.5 into the upper air (Ding et al., 2009). Liu (2003) suggested that this kind of frontal lifting promotes the transport of pollution to the free troposphere.

Figure 7Vertical profiles of PM2.5 concentrations and the contributions of physical/chemical processes over the centre of the YRD (from 30 to 33∘ N) to PM2.5 concentrations (a) at the beginning and (b) at the end of the cold frontal period.
In the afternoon (16:00 LT) of 21 January, the cold front intruded into the YRD (Fig. 6b). A deep neutral condition (see Fig. S2) appeared over the YRD because of the strong wind. The high PM2.5 concentration zone moved south alongside the cold front. Aerosols from the NCP were transported to the YRD by strong north-westerly frontal airflow, and hence increased aerosol concentrations and fluxes over the YRD.
At the end of the cold frontal period (Fig. 6c, d), when the frontal zone moved downstream of the YRD, the YRD was under a high-pressure system that resulted in divergence (e.g. the vertical PM2.5 flux at 1.0 km was about −0.9 µg m−2 s−1, and at 0.5 km was about −0.5 µg m−2 s−1). Synoptic subsidence behind the frontal zone would suppress the upward transport of PM2.5, increasing the surface particle concentration (Mari, 2004). Up until the next morning (04:00 LT 22 January), high PM2.5 concentrations were primarily restricted to below 1.0 km over the YRD (Fig. 6d), because the downward motion behind the frontal zone trapped air pollutants in the boundary layer. Additionally, an extremely strong southward PM2.5 flux (>1800 µg m−2 s−1) can be identified over the YRD, indicating the transport pathway of PM2.5 (Fig. 6c). The high concentration of PM2.5 that appeared over both the YRD and its downstream regions was probably due to the mixing of locally emitted particles with those brought by the cold front from the NCP.
A process analysis technique was introduced to evaluate the effects of physical and chemical processes on aerosol vertical distributions over the YRD. Figure 7 shows the profiles of the averaged PM2.5 concentrations and the contributions of VDIF, AERO, ZADV, and HADV processes over the centre of the YRD (from 30 to 33∘ N, including Shanghai, south of Jiangsu, and north of Zhejiang, since the whole YRD is larger than the frontal zone) to PM2.5 concentrations during the cold frontal passage. At the beginning of the cold front period (12:00 to 16:00 LT 21 January), the centre of the YRD was located ahead of the frontal zone, and the contributions of vertical advection processes to PM2.5 concentrations were negative (decreased aerosol concentrations) below 1.0 km, but positive (increased aerosol concentrations) between 1.0 and 2.5 km (Fig. 7a). This supports the previous conclusion that vertical motions ahead of the frontal zone lifted particles from the boundary layer to the free troposphere.
The horizontal advection process increased PM2.5 concentrations below 1.0 km but decreased PM2.5 concentrations above 1.0 km. Through the horizontal advection process, the cold air mass brought aerosols from the NCP to the YRD, increasing the surface aerosol concentration over the YRD. The negative contribution of horizontal advection above 1.0 km was probably due to aerosol concentrations being increased by strong prefrontal lifting that transported aerosols from the surface to the free troposphere, thus strengthening the outflow of free-tropospheric aerosols from the YRD. The vertical diffusion process has a relatively small effect on aerosol vertical distributions except for in the first layer, where most of the emissions exist. Vertical aerosol concentrations were slightly increased through secondary aerosol formation.
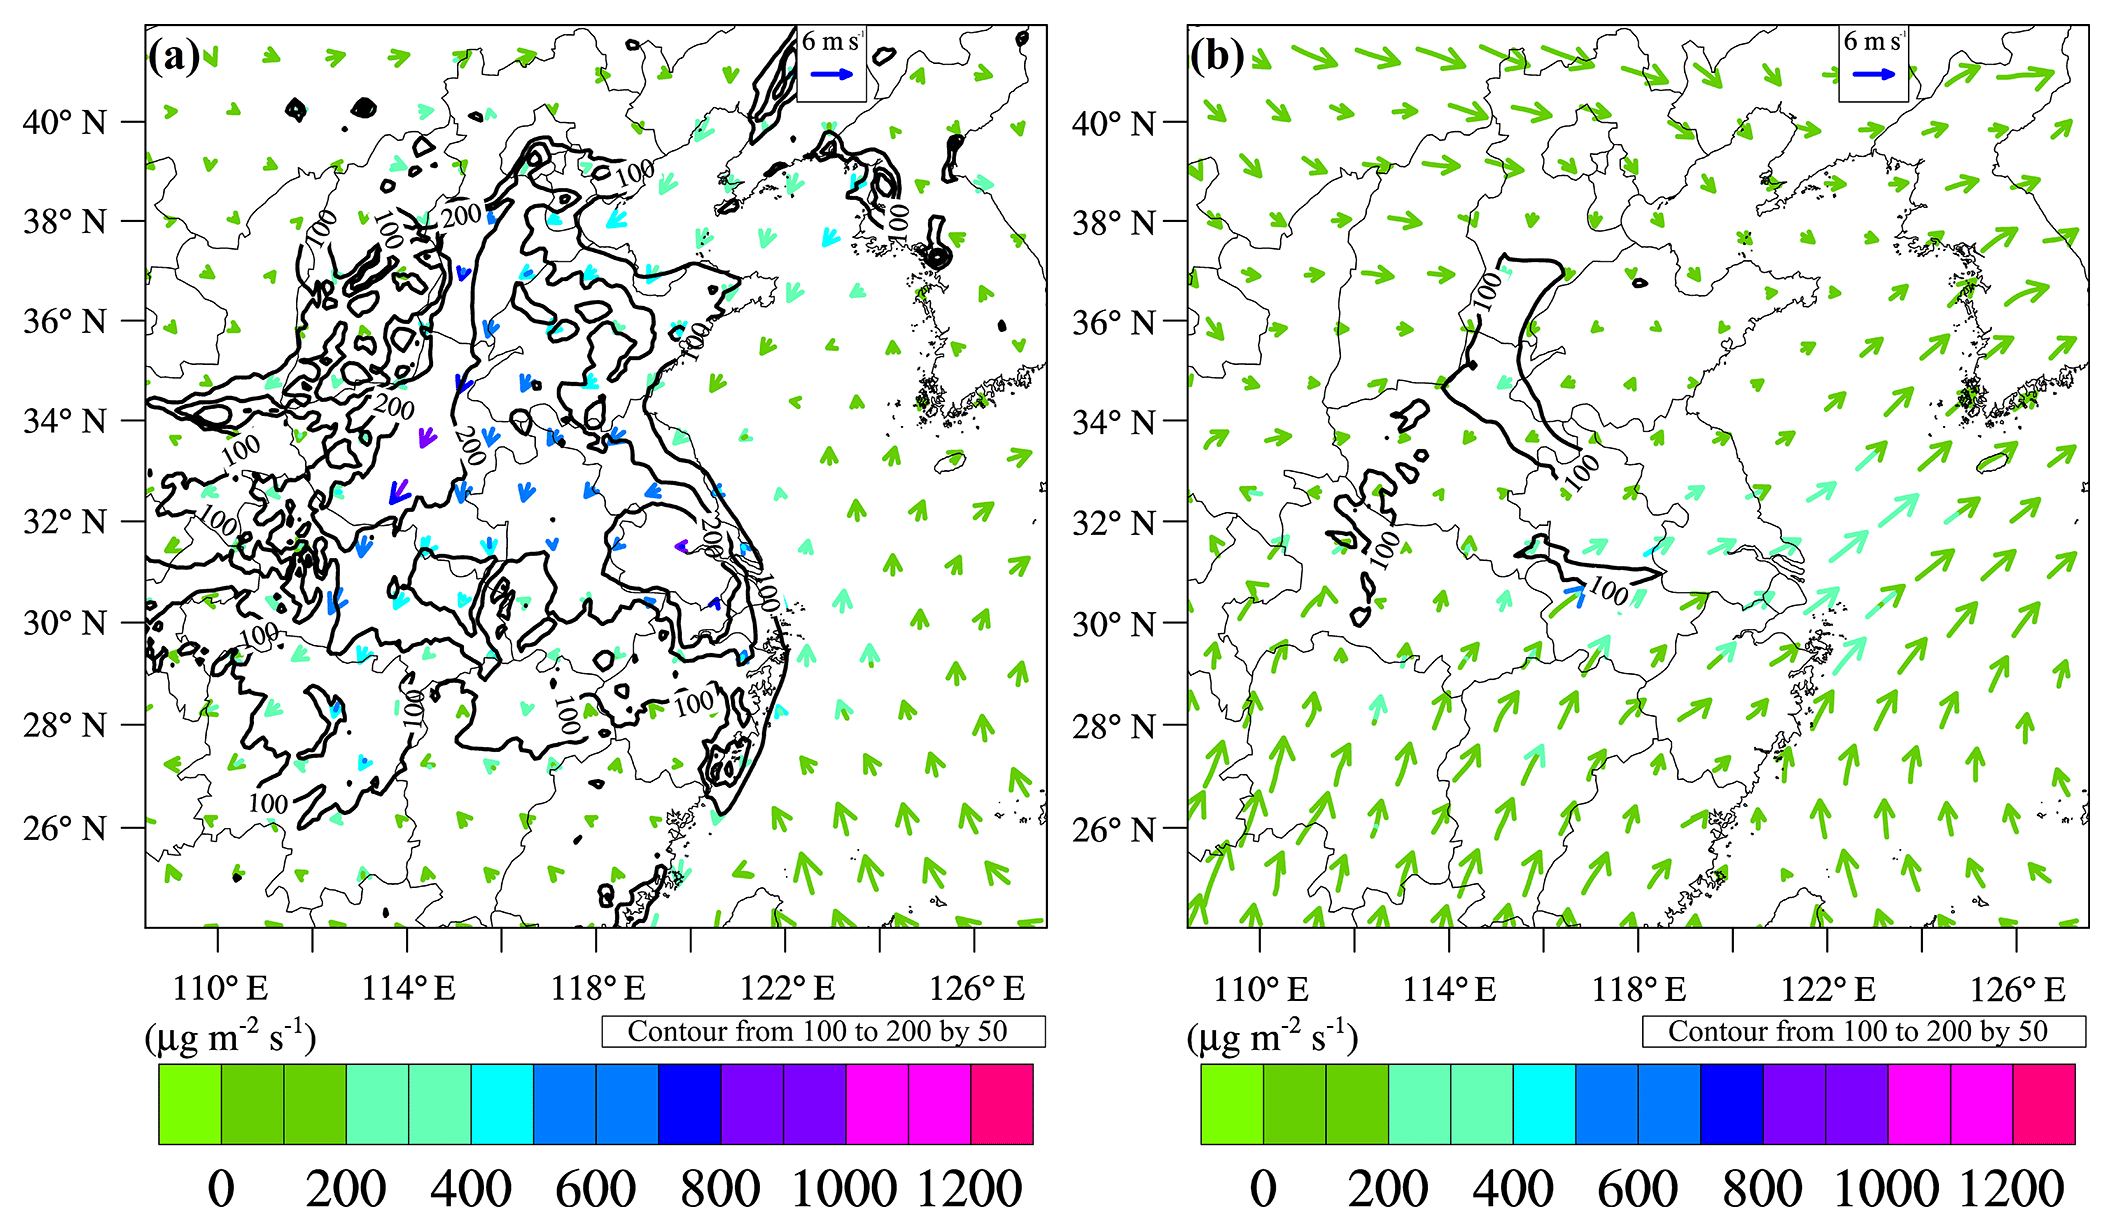
Figure 8Averaged PM2.5 flux (coloured arrows) and mass concentrations (black contour) at (a) the surface and (b) 1.0 km altitude from 00:00 LT 24 January 2015 to 00:00 LT 27 January 2015.
The profiles of averaged PM2.5 concentrations and the contributions of physical and chemical processes to PM2.5 concentrations over the centre of the YRD at the end of the cold frontal period (22:00 LT 21 January to 04:00 LT 22 January) are shown in Fig. 7b. The vertical advection process made positive contributions to PM2.5 concentrations in the lower atmosphere but negative contributions in the upper atmosphere – the opposite of the result obtained at the beginning of cold frontal passage. This result indicates that divergence behind the frontal zone (Fig. 6c, d) transports particles from the lower free troposphere to the boundary layer. The contributions of the horizontal advection process were negative between the surface and the free troposphere, implying a net horizontal outflow of aerosols from the YRD. At this time, the region upstream of the YRD was cleaner than the YRD itself.
4.2 Formation processes of high PM2.5 concentrations under stable weather
After the cold frontal episode, aerosol particles started to accumulate under a stable atmosphere that resulted in high PM2.5 concentrations in the near-surface layer over east China (Fig. 8a). In the centre of the YRD, the mean PM2.5 concentration was more than 200 µg m−3 higher than that of the cold frontal period, but the PM2.5 concentrations at 1.0 km (Fig. 8b) were significantly lower. The PM2.5 fluxes in the stable atmosphere were lower than those in the cold frontal passage at both the surface and 1.0 km, reflecting the lower mean wind velocity under stable weather. This indicates that atmospheric conditions were not favourable for the horizontal transport of PM2.5.
The averaged PM2.5 profile over the YRD shows significant vertical gradients under stable weather (Fig. 9). The process analysis showed that the vertical advection process transported PM2.5 from the surface to the upper air. However, this vertical transport only reached 1.0 km altitude – much lower than it did during the cold frontal passage (∼2.0 km). Horizontal advection shows a small negative contribution to PM2.5 concentrations over the YRD from the surface to 1.0 km. This indicates that there was a weak outflow of PM2.5 from the YRD to its surroundings, because the YRD is an important aerosol source region. Vertical diffusion mixed PM2.5 between the surface and the upper air, but its contribution to PM2.5 was relatively small. Secondary aerosol formation slightly increased the aerosol concentration from the surface to 1.0 km.
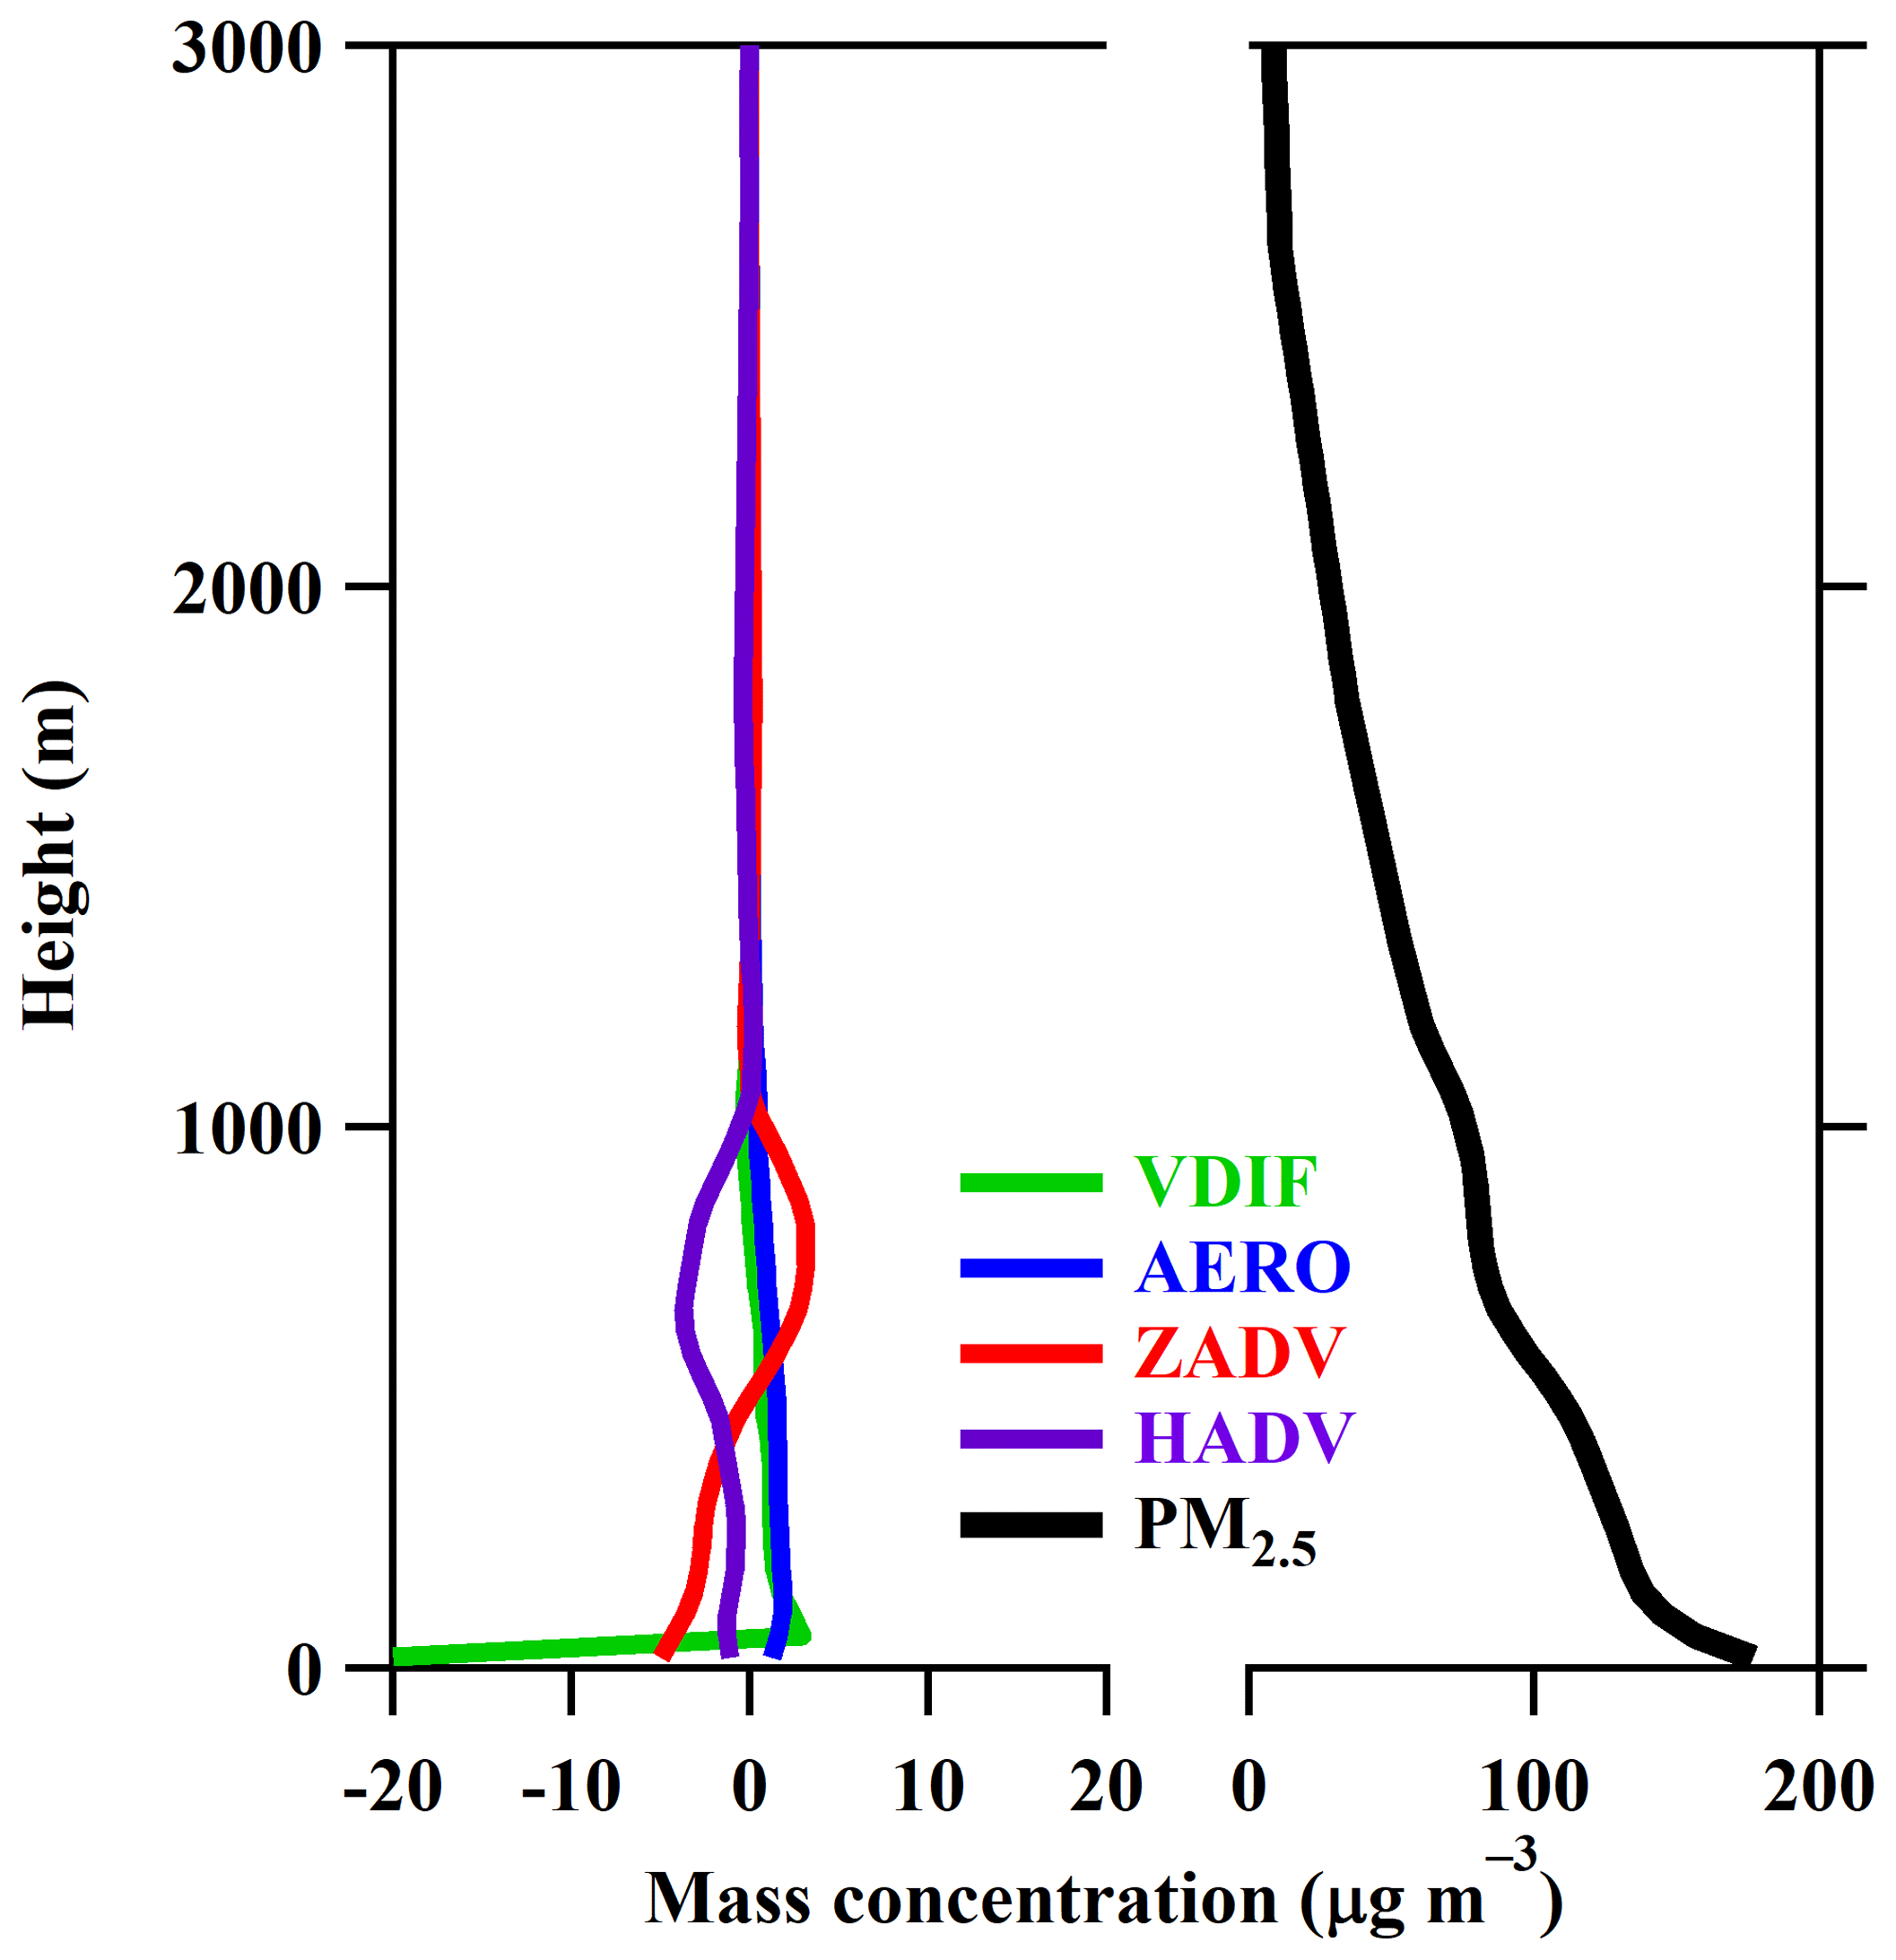
Figure 9Vertical profiles of PM2.5 concentrations and the contributions of physical/chemical processes to PM2.5 concentrations during the period of stable weather.
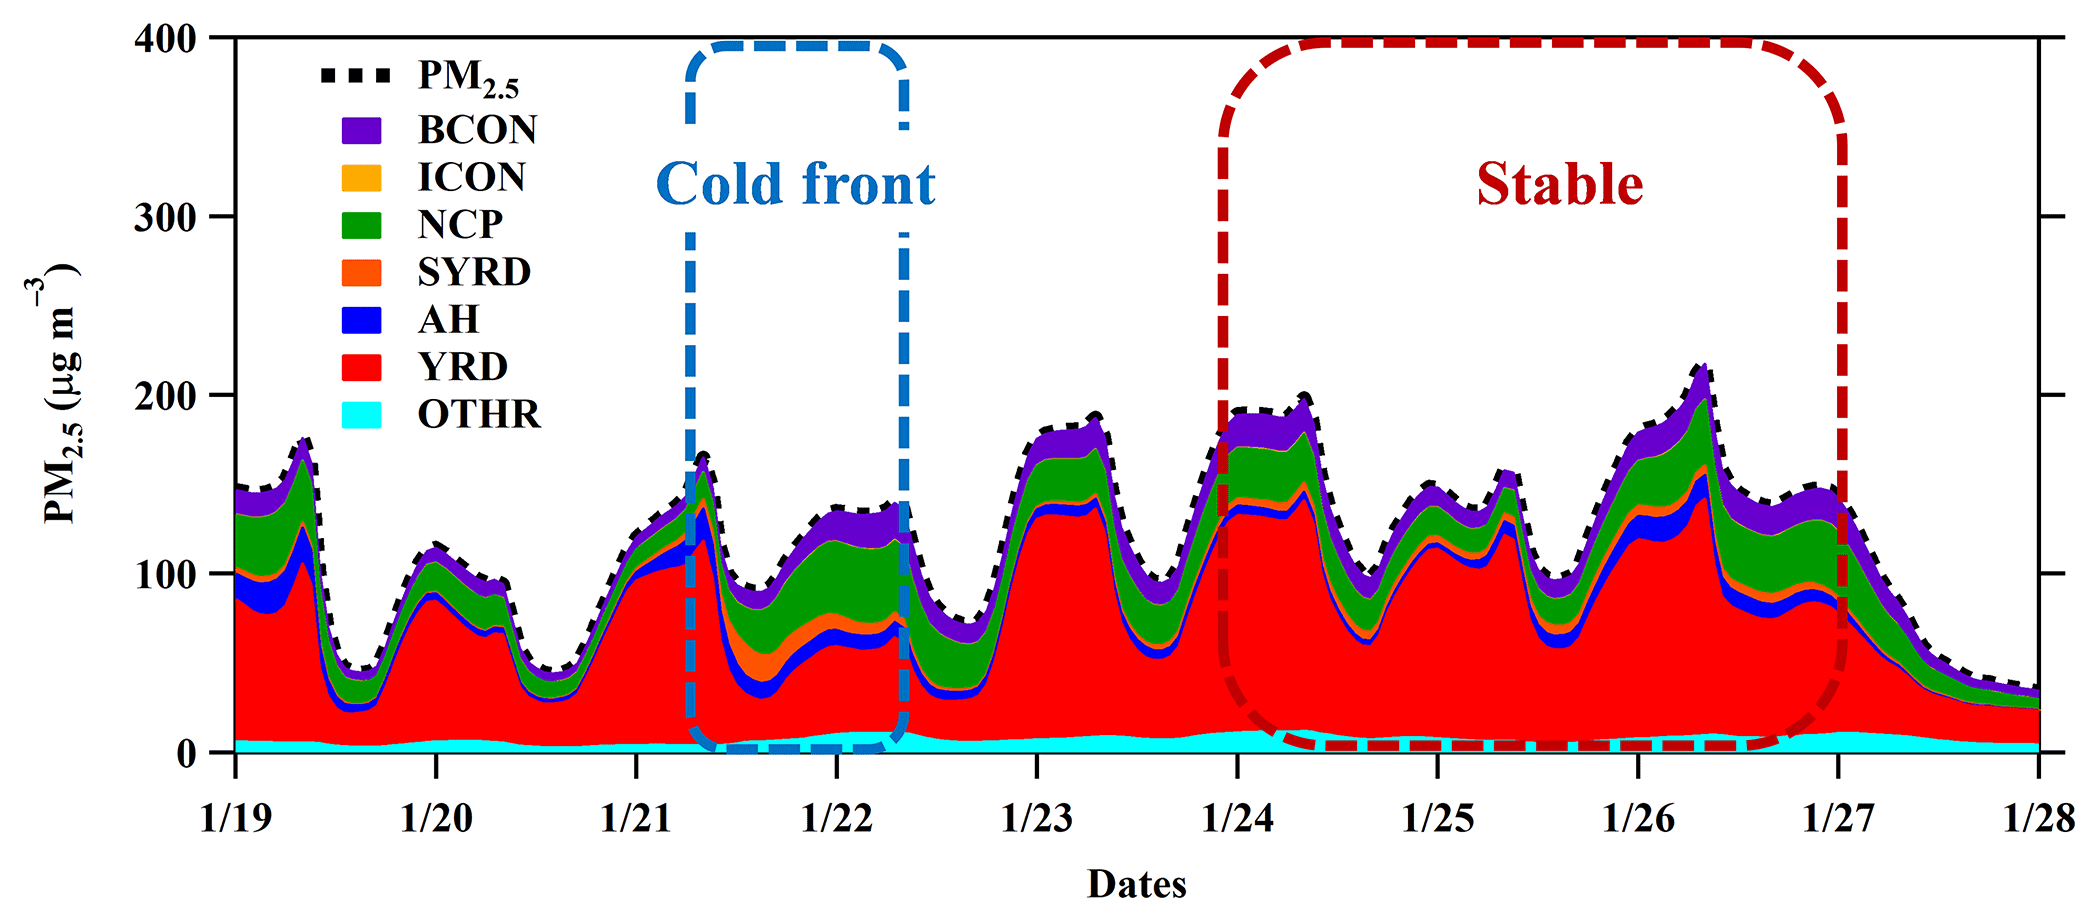
Figure 10Time series of PM2.5 concentrations and contributions of source regions to the PM2.5 concentrations over the Yangtze River Delta (YRD) from 19 to 28 January 2015. SYRD is south-west of YRD, AH is Anhui, and OTHR is other.
4.3 Contributions of PM2.5 from source regions to the YRD
Anthropogenic emissions are the fundamental source of PM2.5. Knowing the source regions of aerosols and their contributions to the YRD is critical in controlling PM2.5 pollution. Our results revealed a significant transport of aerosol particles from the NCP to the YRD during the cold frontal passage and a remarkable local PM2.5 contribution during stable weather conditions. Based on these results, we derived the contributions of PM2.5 from source regions to the YRD using ISAM, which was incorporated in the CMAQ model.
Mass contributions from each of the geographical source regions, BCONs, and ICONs to PM2.5 concentrations over the YRD from 19 to 28 January 2015 are shown in Fig. 10. The YRD is a quickly developing and densely populated region where anthropogenic activities such as industrial production, vehicle usage, power plant operation, and residential activities release huge volumes of atmospheric pollutants. Therefore, in the YRD, the most significant source of PM2.5 is local emissions (Fig. 10). The NCP is another heavily polluted region in east China (Cao et al., 2015; Chen and Wang, 2015; J. Li et al., 2017), located adjacent to YRD to the south. On 21 January, a cold front brought polluted air mass from the NCP to the YRD resulting in a high contribution of PM2.5. PM2.5 from regions outside of the modelling domain (BCONs) also impacted on the PM2.5 concentration over the YRD through long-range transport. However, contributions from other source regions were relatively small.
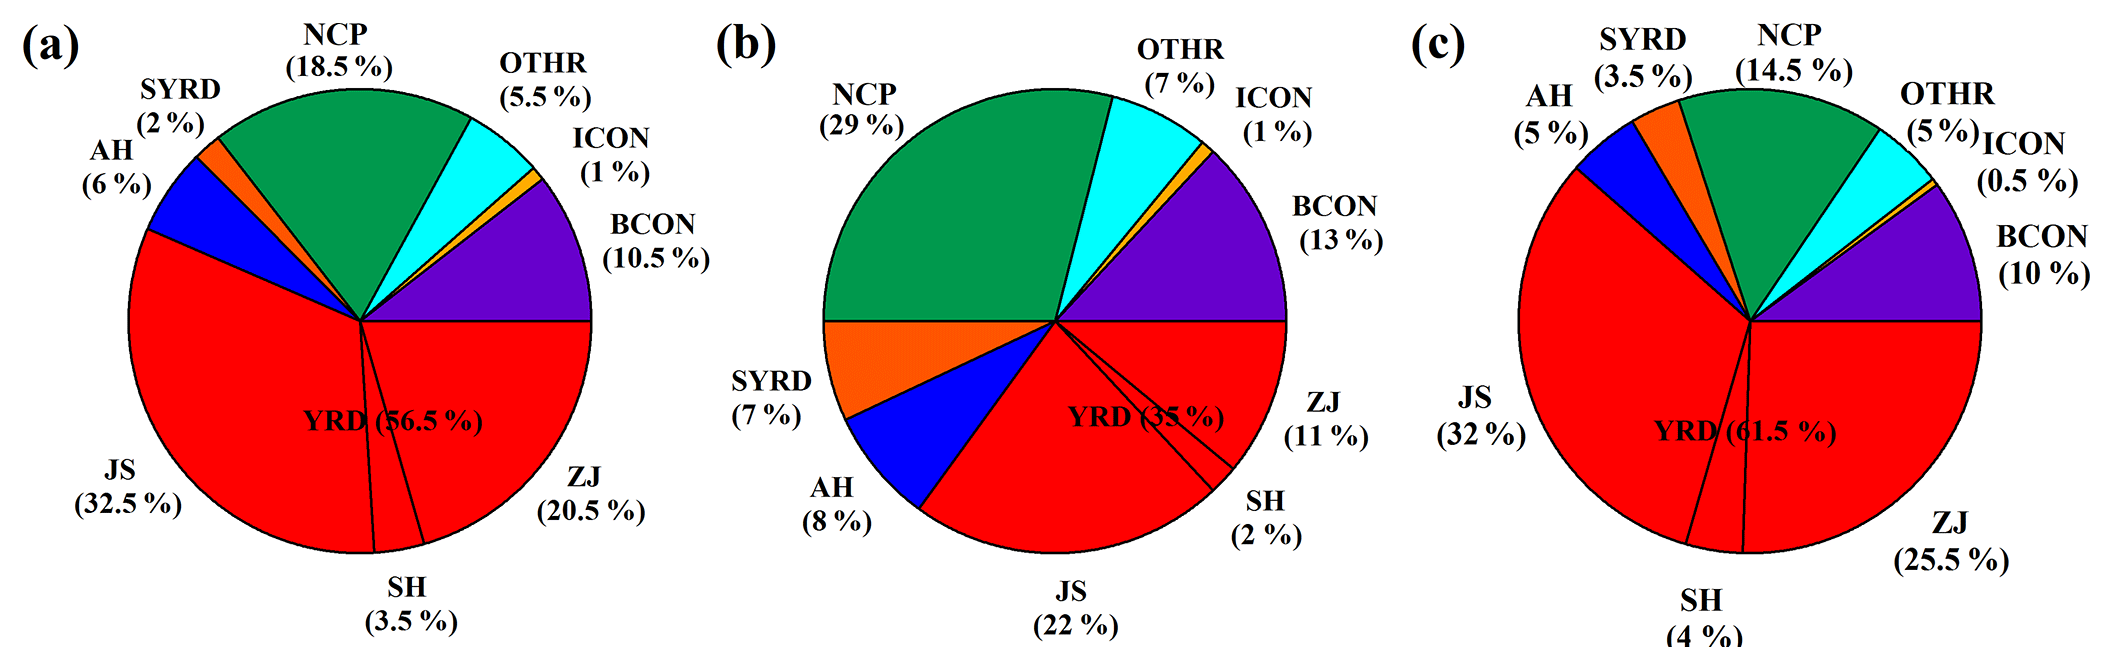
Figure 11Contribution rate of each source region to PM2.5 over the Yangtze River Delta (YRD) during (a) the whole simulation period, (b) the cold frontal passage, and (c) under the stable weather conditions. JS is Jiangsu, SH is Shanghai, and ZJ is Zhejiang.
Mean contributions from each source region from 19 to 28 January 2015 are shown in Fig. 11a. Local contributions (from the YRD itself) accounted for 56.5 % of the PM2.5 concentration, in which Jiangsu, Shanghai, and Zhejiang accounted for 32.5 %, 3.5 %, and 20.5 %, respectively. PM2.5 from the NCP and BCONs contributed 18.5 % and 10.5 %, respectively. The YRD, NCP, and BCONs contributed 85.5 % in total. During the cold frontal passage, a strong north-west wind prevailed over the YRD; locally originated aerosols only accounted for 35 % of the PM2.5 contribution, with Jiangsu, Shanghai, and Zhejiang accounting for 22 %, 2 %, and 11 %, respectively (Fig. 11b). These contributions are much lower than those in the total average because the strong wind in the cold frontal period was unfavourable for the accumulation of locally emitted pollutants. PM2.5 from the NCP contributed 29 % to the PM2.5 concentrations over YRD, a significantly higher amount than in the average contribution. Contributions from other geographical source regions were also increased during the cold frontal passage because of the long-range transport of aerosol. In general, the cold front decreased local contributions in the YRD, but increased long-range transport contributions from the NCP region.
Under stable weather conditions, local contributions (61.5 %) were increased, especially for Zhejiang province (Fig. 11c). Lower wind speeds during the stable period were unfavourable for the transport of pollutants, resulting in high PM2.5 concentrations and significant local contributions. NCP contributed 14.5 % to PM2.5 concentrations over the YRD, accounting for only half that in the cold frontal period. In general, PM2.5 contributions in the stable period were similar to those in the total average, but with higher local contributions and lower NCP contributions.
Cold fronts are favourable to the outflow of PM2.5 in the BTH region, decreasing aerosol concentrations as soon as they reach the area. However, in the YRD, cold fronts remove local aerosol particles and can also introduce upstream air pollutants. Understanding the processes of PM2.5 transport during the cold frontal passage is of great significance for the understanding of haze formation mechanisms over the YRD in wintertime. In this study, the coupled WRF–CMAQ model was employed to investigate the processes and mechanisms of PM2.5 pollution over the YRD under a cold frontal intrusion period and subsequent stable weather conditions in January 2015.
Observations at three sites show that high PM2.5 concentrations and strong north-westerly winds appeared simultaneously as the locations of the peak PM2.5 concentration moved from north to south, indicating that the cold front transported aerosol particles across the YRD. At the beginning of the cold frontal passage, when the cold front first reached the YRD, it forced the warm and polluted YRD air mass ahead of the frontal zone to move up along the frontal boundary, lifting PM2.5 into the free troposphere. As the cold front intruded deep into the YRD, aerosols from upstream areas (NCP) were transported to the YRD by strong north-westerly frontal airflow. At the end of the cold frontal period, when the frontal zone had moved downstream of YRD (East China Sea), high pressure took control over the YRD, resulting in divergence over the region. The synoptic subsidence motions trapped PM2.5 in the boundary layer. The atmospheric stratification became stable after the cold front from 24 to 27 January 2015. Aerosol particles over the YRD then began to reaccumulate until the next cold front.
The contributions of PM2.5 from each of the defined source regions were calculated by ISAM. For the entire 9-day simulation (19–28 January), PM2.5 contributions from the local area (YRD), NCP, and BCONs accounted for 56.5 %, 18.5 %, and 10.5 %, respectively. During the cold frontal passage (12:00 LT 21 January to 04:00 LT 22 January), local PM2.5 contributions decreased to 35 %, while contributions from the NCP increased to 29 %. During the stable weather conditions (00:00 LT 24 January to 00:00 LT 27 January), local PM2.5 contributions increased to 61.5 % while NCP contributions decreased to 14.5 %. This result indicates that cold fronts intensify the long-range transport of air pollutants in the NCP to the YRD.
All observations and model outputs used in this study are available. Readers can access the data directly or by contacting Bin Zhu via binzhu@nuist.edu.cn.
The supplement related to this article is available online at: https://doi.org/10.5194/acp-19-3673-2019-supplement.
HK was responsible for paper writing, model simulation, and data analysis. BZ proposed the idea and did the paper revision. JG performed model result processing and plotting. YH performed observation data processing and plotting. HW performed observation data collection. JS was responsible for weather map analysis. CP provided scripts for data processing. TZ contributed to the paper revision and language editing. BY provided meteorological observations at Linan.
The authors declare that they have no conflict of interest.
This article is part of the special issue “Regional transport and transformation of air pollution in eastern China”. It is not associated with a conference.
This work was supported by the National Natural Science Foundation of China (grant
nos. 91544229, 41605091, and 41605096), the National Key Research and Development Program
(grant no. 2016YFA0602003), The Startup Foundation for Introducing Talent of NUIST (grant
no. 2243141501035), the Hangzhou Scientific Research Project in Agriculture and Social
Development (grant no. 20170533B16), SUSTC Presidential Postdoctoral Fellowship, and the
open fund by the Key Laboratory for Aerosol-Cloud-Precipitation of CMA-NUIST (grant
no. KDW1701). We acknowledge the free use of MIX emission from Tsinghua
University.
Edited by: Tong Zhu
Reviewed
by: two anonymous referees
Cao, Z., Sheng, L., Liu, Q., Yao, X., and Wang, W.: Interannual increase of regional haze-fog in North China Plain in summer by intensified easterly winds and orographic forcing, Atmos. Environ., 122, 154–162, https://doi.org/10.1016/j.atmosenv.2015.09.042, 2015.
Chen, F., Kusaka, H., Tewari, M., Bao, J.-W., and Hirakuchi, H.: Utilizing the coupled WRF/LSM/urban modeling system with detailed urban classification to simulate the urban heat island phenomena over the greater Houston area, in: 5th Conference On Urban Environment, Vancouver, BC Canada, 23–27 August 2004, available at: http://ams.confex.com/ams/pdfpapers/79765.pdf (last access: 18 March 2019), 2004.
Chen, H. and Wang, H.: Haze Days in North China and the associated atmospheric circulations based on daily visibility data from 1960 to 2012, J. Geophys. Res.-Atmos., 120, 5895–5909, https://doi.org/10.1002/2015jd023225, 2015.
Ding, A., Wang, T., Xue, L., Gao, J., Stohl, A., Lei, H., Jin, D., Ren, Y., Wang, X., Wei, X., Qi, Y., Liu, J., and Zhang, X.: Transport of north China air pollution by midlatitude cyclones: Case study of aircraft measurements in summer 2007, J. Geophys. Res., 114, D08304, https://doi.org/10.1029/2008jd011023, 2009.
Emmons, L. K., Walters, S., Hess, P. G., Lamarque, J.-F., Pfister, G. G., Fillmore, D., Granier, C., Guenther, A., Kinnison, D., Laepple, T., Orlando, J., Tie, X., Tyndall, G., Wiedinmyer, C., Baughcum, S. L., and Kloster, S.: Description and evaluation of the Model for Ozone and Related chemical Tracers, version 4 (MOZART-4), Geosci. Model Dev., 3, 43–67, https://doi.org/10.5194/gmd-3-43-2010, 2010.
Gao, J., Tian, H., Cheng, K., Lu, L., Zheng, M., Wang, S., Hao, J., Wang, K., Hua, S., Zhu, C., and Wang, Y.: The variation of chemical characteristics of PM2.5 and PM10 and formation causes during two haze pollution events in urban Beijing, China, Atmos. Environ., 107, 1–8, https://doi.org/10.1016/j.atmosenv.2015.02.022, 2015.
Gao, M., Carmichael, G. R., Wang, Y., Saide, P. E., Yu, M., Xin, J., Liu, Z., and Wang, Z.: Modeling study of the 2010 regional haze event in the North China Plain, Atmos. Chem. Phys., 16, 1673–1691, https://doi.org/10.5194/acp-16-1673-2016, 2016.
Gao, M., Saide, P., Xin, J., Wang, Y., Liu, Z., Wang, Y., Wang, Z., Pagowski, M., Guttikunda, S., and Carmichael, G.: Estimates of Health Impacts and Radiative Forcing in Winter Haze in Eastern China through Constraints of Surface PM2.5 Predictions, Environ. Sci. Technol., 51, 2178–2185, 2017.
Gipson, G. L.: Science Algorithms of the EPA Models-3 Community Multiscale Air Quality (CMAQ) Modeling System: Process analysis, EPA/600/R-99/030, U.S. EPA, available at: https://www.cmascenter.org/cmaq/science_documentation/pdf/ch16.pdf (last access: 18 March 2019), 1999.
Guo, S., Hu, M., Zamora, M. L., Peng, J., Shang, D., Zheng, J., Du, Z., Wu, Z., Shao, M., Zeng, L., Molina, M. J., and Zhang, R.: Elucidating severe urban haze formation in China, P. Nati. Acad. Sci. USA, 111, 17373–17378, https://doi.org/10.1073/pnas.1419604111, 2014.
Han, R., Wang, S., Shen, W., Wang, J., Wu, K., Ren, Z., and Feng, M.: Spatial and temporal variation of haze in China from 1961 to 2012, J. Environ. Sci., 46, 134–146, https://doi.org/10.1016/j.jes.2015.12.033, 2016.
Huang, R.-J., Zhang, Y., Bozzetti, C., Ho, K.-F., Cao, J.-J., Han, Y., Daellenbach, K. R., Slowik, J. G., Platt, S. M., Canonaco, F., Zotter, P., Wolf, R., Pieber, S. M., Bruns, E. A., Crippa, M., Ciarelli, G., Piazzalunga, A., Schwikowski, M., Abbaszade, G., Schnelle-Kreis, J., Zimmermann, R., An, Z., Szidat, S., Baltensperger, U., Haddad, I. E., and Prévôt, A. S. H.: High secondary aerosol contribution to particulate pollution during haze events in China, Nature, 514, 218–222, https://doi.org/10.1038/nature13774, 2014.
Kusaka, H., Kondo, H., Kikegawa, Y., and Kimura, F.: A simple single-layer urban canopy model for atmospheric models: comparison with multi-layer and slab models, Bound.-Lay. Meteorol., 101, 329–358, https://doi.org/10.1023/A:1019207923078, 2001.
Kwok, R. H. F., Napelenok, S. L., and Baker, K. R.: Implementation and evaluation of PM2.5 source contribution analysis in a photochemical model, Atmos. Environ., 80, 398–407, https://doi.org/10.1016/j.atmosenv.2013.08.017, 2013.
Leng, C., Duan, J., Xu, C., Zhang, H., Wang, Y., Wang, Y., Li, X., Kong, L., Tao, J., Zhang, R., Cheng, T., Zha, S., and Yu, X.: Insights into a historic severe haze event in Shanghai: synoptic situation, boundary layer and pollutants, Atmos. Chem. Phys., 16, 9221–9234, https://doi.org/10.5194/acp-16-9221-2016, 2016.
Li, J., Wang, Z., Huang, H., Hu, M., Meng, F., Sun, Y., Wang, X., Wang, Y., and Wang, Q.: Assessing the effects of trans-boundary aerosol transport between various city clusters on regional haze episodes in spring over East China, Tellus B, 65, 20052, https://doi.org/10.3402/tellusb.v65i0.20052, 2013.
Li, J., Du, H., Wang, Z., Sun, Y., Yang, W., Li, J., Tang, X., and Fu, P.: Rapid formation of a severe regional winter haze episode over a mega-city cluster on the North China Plain, Environ. Pollut., 223, 605–615, https://doi.org/10.1016/j.envpol.2017.01.063, 2017.
Li, M., Zhang, Q., Kurokawa, J.-I., Woo, J.-H., He, K., Lu, Z., Ohara, T., Song, Y., Streets, D. G., Carmichael, G. R., Cheng, Y., Hong, C., Huo, H., Jiang, X., Kang, S., Liu, F., Su, H., and Zheng, B.: MIX: a mosaic Asian anthropogenic emission inventory under the international collaboration framework of the MICS-Asia and HTAP, Atmos. Chem. Phys., 17, 935–963, https://doi.org/10.5194/acp-17-935-2017, 2017.
Liao, J., Wang, T., Jiang, Z., Zhuang, B., Xie, M., Yin, C., Wang, X., Zhu, J., Fu, Y., and Zhang, Y.: WRF/Chem modeling of the impacts of urban expansion on regional climate and air pollutants in Yangtze River Delta, China, Atmos. Environ., 106, 204–214, https://doi.org/10.1016/j.atmosenv.2015.01.059, 2015.
Lin, C.-Y., Wang, Z., Chen, W.-N., Chang, S.-Y., Chou, C. C. K., Sugimoto, N., and Zhao, X.: Long-range transport of Asian dust and air pollutants to Taiwan: observed evidence and model simulation, Atmos. Chem. Phys., 7, 423–434, https://doi.org/10.5194/acp-7-423-2007, 2007.
Liu, H.: Transport pathways for Asian pollution outflow over the Pacific: Interannual and seasonal variations, J. Geophys. Res., 108, 8786, https://doi.org/10.1029/2002jd003102, 2003.
Mari, C.: Export of Asian pollution during two cold front episodes of the TRACE-P experiment, J. Geophys. Res., 109, D15S17, https://doi.org/10.1029/2003jd004307, 2004.
Rosenfeld, D., Sherwood, S., Wood, R., and Donner, L.: Atmospheric science. Climate effects of aerosol-cloud interactions, Science, 343, 379–380, https://doi.org/10.1126/science.1247490, 2014.
Skamarock, W. C., Klemp, J. B., Dudhia, J., Gill, D. O., Barker, D. M., Duda, M. G., Huang, X. Y., Wang, W., and Powers, J. G.: A description of the Advanced Research WRF version 3, NCAR Tech. Note NCAR/TN-475+STR, National Center for Atmospheric Research, Boulder, Colorado, USA, 125 pp., 2008.
Sun, Y. L., Wang, Z. F., Fu, P. Q., Yang, T., Jiang, Q., Dong, H. B., Li, J., and Jia, J. J.: Aerosol composition, sources and processes during wintertime in Beijing, China, Atmos. Chem. Phys., 13, 4577–4592, https://doi.org/10.5194/acp-13-4577-2013, 2013.
Tao, M., Chen, L., Xiong, X., Zhang, M., Ma, P., Tao, J., and Wang, Z.: Formation process of the widespread extreme haze pollution over northern China in January 2013: Implications for regional air quality and climate, Atmos. Environ., 98, 417–425, https://doi.org/10.1016/j.atmosenv.2014.09.026, 2014.
Wang, H., Xu, J., Zhang, M., Yang, Y., Shen, X., Wang, Y., Chen, D., and Guo, J.: A study of the meteorological causes of a prolonged and severe haze episode in January 2013 over central-eastern China, Atmos. Environ., 98, 146–157, https://doi.org/10.1016/j.atmosenv.2014.08.053, 2014.
Wang, J., Zhao, B., Wang, S., Yang, F., Xing, J., Morawska, L., Ding, A., Kulmala, M., Kerminen, V.-M., Kujansuu, J., Wang, Z., Ding, D., Zhang, X., Wang, H., Tian, M., Petäjä, T., Jiang, J., and Hao, J.: Particulate matter pollution over China and the effects of control policies, Sci. Total Environ., 584–585, 426–447, https://doi.org/10.1016/j.scitotenv.2017.01.027, 2017.
Wang, Y., Yao, L., Wang, L., Liu, Z., Ji, D., Tang, G., Zhang, J., Sun, Y., Hu, B., and Xin, J.: Mechanism for the formation of the January 2013 heavy haze pollution episode over central and eastern China, Sci. China Earth. Sci., 57, 14–25, https://doi.org/10.1007/s11430-013-4773-4, 2013.
Wang, Z., Li, J., Wang, Z., Yang, W., Tang, X., Ge, B., Yan, P., Zhu, L., Chen, X., Chen, H., Wand, W., Li, J., Liu, B., Wang, X., Wand, W., Zhao, Y., Lu, N., and Su, D.: Modeling study of regional severe hazes over mid-eastern China in January 2013 and its implications on pollution prevention and control, Sci. China Earth. Sci., 57, 3–13, https://doi.org/10.1007/s11430-013-4793-0, 2013.
Wei, Y., Li, J., Wang, Z.-F., Chen, H.-S., Wu, Q.-Z., Li, J.-J., Wang, Y.-L., and Wang, W.: Trends of surface PM2.5 over Beijing–Tianjin–Hebei in 2013–2015 and their causes: emission controls vs. meteorological conditions, Atmos. Ocean. Sci. Lett., 10, 276–283, https://doi.org/10.1080/16742834.2017.1315631, 2017.
Wu, D., Bi, X., Deng, X., Li, F., Tan, H., Liao, G., and Huang, J.: Effect of atmospheric haze on the deterioration of visibility over the Pearl River Delta, Acta Meteorol. Sin., 21, 215–223, 2007.
Yang, Y., Liu, X., Qu, Y., Wang, J., An, J., Zhang, Y., and Zhang, F.: Formation mechanism of continuous extreme haze episodes in the megacity Beijing, China, in January 2013, Atmos. Res., 155, 192–203, https://doi.org/10.1016/j.atmosres.2014.11.023, 2015.
Zhao, X. J., Zhao, P. S., Xu, J., Meng,, W., Pu, W. W., Dong, F., He, D., and Shi, Q. F.: Analysis of a winter regional haze event and its formation mechanism in the North China Plain, Atmos. Chem. Phys., 13, 5685-5696, https://doi.org/10.5194/acp-13-5685-2013, 2013.
Zhu, B., Su, J., Han, Z., Yin, C., and Wang, T.: Analysis of a serious air pollution event resulting from crop residue burning over Nanjing and surrounding regions, China Environ. Sci., 30, 585–592, 2010 (in Chinese).