the Creative Commons Attribution 4.0 License.
the Creative Commons Attribution 4.0 License.
 | 21 Aug 2019
NH3-promoted hydrolysis of NO2 induces explosive growth in HONO
Wanyun Xu
Chunsheng Zhao
Jiangchuan Tao
Gang Zhao
Yuxuan Bian
Wen Yang
Yingli Yu
Chuanyang Shen
Linlin Liang
Gen Zhang
Weili Lin
Xiaobin Xu
The study of atmospheric nitrous acid (HONO), which is the primary source of OH radicals, is crucial with respect to understanding atmospheric photochemistry and heterogeneous chemical processes. Heterogeneous NO2 chemistry under haze conditions has been identified as one of the missing sources of HONO on the North China Plain, and also produces sulfate and nitrate. However, controversy exists regarding the various proposed HONO production mechanisms, mainly regarding whether SO2 directly takes part in the HONO production process and what roles NH3 and the pH value play. In this paper, never before seen explosive HONO production was reported and evidence was found – for the first time in field measurements during fog (usually with 4< pH <6) and haze episodes under high relative humidity (pH ≈4) – that NH3 was the key factor that promoted the hydrolysis of NO2, leading to the explosive growth of HONO and nitrate under both high and relatively lower pH conditions. The results also suggest that SO2 plays a minor or insignificant role in HONO formation during fog and haze events, but was indirectly oxidized upon the photolysis of HONO via subsequent radical mechanisms. Aerosol hygroscopicity significantly increased with rapid inorganic secondary aerosol formation, further promoting HONO production as a positive feedback. For future photochemical and aerosol pollution abatement, it is crucial to introduce effective NH3 emission control measures, as NH3-promoted NO2 hydrolysis is a large daytime HONO source, releasing large amounts of OH radicals upon photolysis, which will contribute largely to both atmospheric photochemistry and secondary aerosol formation.
- Article
(7423 KB) - Full-text XML
-
Supplement
(1226 KB) - BibTeX
- EndNote


Nitrous acid (HONO) plays a vital role in atmospheric chemistry due to the fact that its photolysis is a major source (Michoud et al., 2014; Kleffmann et al., 2005) of hydroxyl radical (OH) which determines the atmospheric oxidative capacity and plays crucial role in tropospheric chemistry in processes such as ozone formation, the degradation of volatile organic compounds and secondary aerosol formation (Cheng et al., 2016; Wang et al., 2016). Hence, the source study of nitrous acid (HONO) is of crucial importance for the understanding of the tropospheric chemistry, for chemistry and climate modeling, and for developing effective pollution control strategies (Lu et al., 2018).
The North China Plain (NCP) is troubled by persistent complex air pollution with high loadings of both photochemical pollutants and particulate pollution (Zheng et al., 2015; Ran et al., 2011); the simultaneous mitigation of these two types of pollution has encountered trouble due to the nonlinear dependence of ozone on NOx (Xing et al., 2018). Unknown daytime sources of HONO have gained attention over the past few years (Michoud et al., 2014; Liu et al., 2014; Su et al., 2011), and results from a recent study indicate that an additional missing source is required to explain more than 50 % of the observed HONO concentration during daytime in western China (Huang et al., 2017). Results from several recent studies have demonstrated that intense heterogeneous conversion of NO2 to HONO on particle surfaces might be a significant source of HONO (Cui et al., 2018; Liu et al., 2014).
Two main HONO heterogeneous production pathways involving aerosol water and NO2 have been proposed. In light of the drastic decrease in solar radiation during severe haze events and rich ammonia conditions on the NCP, the first pathway hypothesized that NO2 (g) dissolved in aerosol water at aerosol pH >5.5 rapidly formed HONO while oxidizing (aq) to sulfate. The stoichiometry of this mechanism is as follows (Cheng et al., 2016; Wang et al., 2016):
Based on this mechanism, good agreement between modeled and observed sulfate formation rates were achieved. However, the assumption that the pH of ambient aerosols can reach beyond 5.5 is debatable. Results from several recent studies indicate that the pH values of ambient aerosols fall in the range of 3–5 in most cases (Ding et al., 2019; Liu et al., 2017a; Song et al., 2018). Therefore, it was proposed that HONO and were produced during the hydrolysis process of NO2, releasing OH radicals upon photolysis, which indirectly oxidize SO2 to sulfate (Li et al., 2018b):
The results of Yabushita et al. (2009) suggest that anions (such as Cl−, Br− and I−) greatly enhance the hydrolysis of NO2 on water, and that the NO2 uptake coefficients of Reaction (R2) can be enhanced several orders of magnitude by increasing the electrolyte concentration. The ambient aerosol particles in the boundary layer are in the aqueous phase under high RH (Liu et al., 2017b), and the aerosol or fog water is not pure with different dissolved anions (Wu et al., 2018; Lu et al., 2010). Therefore, HONO and nitrate formed through this mechanism should be independent of aerosol acidity, and should be primarily affected by the aerosol surface area density (SA), aerosol liquid water content and NO2 concentration (Li et al., 2018b). Moreover, recent theoretical simulations have proposed a HONO formation mechanism involving NO2 and water and have identified that NH3 can promote the hydrolysis of NO2 (Li et al., 2018a; Reaction R2 in this paper). Despite this, no direct evidence from field observations was available to support their findings.
Although the proposed HONO formation mechanisms are all heterogeneous reactions of NO2, the details regarding how SO2, pH and NH3 are involved in heterogeneous formation are still under debate (Li et al., 2018b). A clear mechanism is also still missing in current models to explain both the daytime concentration of observed HONO and the secondary inorganic aerosol formation. Measurements of HONO are rare and simultaneous observations of HONO and aerosol physical and chemical characteristics are lacking to thoroughly analyze or directly support the aerosol heterogeneous HONO formation mechanisms involving NO2. In this paper, we present simultaneous measurements of HONO, sulfate and nitrate as well as other precursor gases, oxidants and meteorological parameters during both fog and haze episodes under high ambient RH. Fog water pH is usually greater than 5.5 in eastern China (Safai et al., 2008; Lu et al., 2010), although calculations in this work and previous studies collectively indicate a moderately acidic condition (4< pH <5) for fine particles in northern China winter haze. The observational results reveal that NH3 is the key factor that promotes the hydrolysis of NO2, resulting in explosive formation of HONO, nitrate and sulfate.
From 15 October to 25 November 2016, a field campaign intended to study sulfate formation was conducted at the Ecological and Agricultural Meteorology Station (39∘09′ N, 115∘44′ E) of the Chinese Academy of Meteorological Sciences. The site is partly composed of experimental farmland and is also surrounded by farmland and small residential towns (nearest town ∼1.5 km). It is located between Beijing (∼100 km) and Baoding (∼40 km), two megacities on the North China Plain (Fig. 1). During this field campaign, an in situ gas and aerosol composition monitor (IGAC, Fortelice International Co.,Taiwan) was used for monitoring water-soluble ions (Na+, K+, Ca2+, Mg2+, , , , and Cl−) of PM2.5 (particulate matter with an aerodynamic diameter less than 2.5 µm) and trace gases including HONO, SO2, NH3, HCl and HNO3 with a time resolution of 1 h. The IGAC system draws in ambient air through a PM10 inlet and passes the sample through a sharp-cut PM2.5 cyclone at a flow rate of 16.7 L min−1. The total length of the stainless steel sampling line is approximately 2 m, with an inner diameter of 3.18 cm (1.25 inch), resulting in a residence time of under 6 s, suggesting that underestimates of NH3 possibly caused by adsorption on the stainless steel sampling tube, as proposed by Young et al. (2016), might be unimportant. A vertical annular denuder wetted with dilute H2O2 solution ( M) collects the trace gases and rapidly converts SO2 to , preventing SO2 from reacting with NO2 in the absorption solution to produce HONO artefacts. A scrub and impact aerosol collector under the denuder is mounted at an inclined angle to capture particles based on impaction after condensation growth. Two separate ion chromatographs are used to analyze anions and cations, respectively, for the gas and aerosol liquid extracts that were injected from the denuder and the aerosol collector once an hour. The detection limits are below 0.12 µg m−3, and the background concentration of most water-soluble inorganic ions within the instrument are below 0.11 µg m−3, with only showing a background concentration of 1.10 µg m−3 (Young et al., 2016). Considering the severe pollution state currently experienced by the NCP, these measurement uncertainties are fully acceptable. The instrument has shown good performance in the past, agreeing well with filter-based samples (Liu et al., 2017a). Standard LiBr solution was continuously added to the aerosol liquid extracts during the measurements, to ensure that the sampling and analysis process was stable. The swing amplitude was within the range of 3 standard deviations, confirming the stability of the ion analysis system throughout the campaign. A mixed standard solution was diluted to perform multipoint calibrations (at concentrations of 5, 10, 20, 50, 100, 200, 500 and 1000 ppb) at the beginning and at the end of the campaign for the Na+, K+, Ca2+, Mg2+, , Li+, , , , Cl− and Br− ions, with the R2 values of the calibrations reaching above 0.9999. A comparison between NH3 observed by IGAC and NH3 observed by an economical NH3 analyzer (LGR, DLT-100, for full details see Meng et al., 2018) yielded an overall slope of 0.91 with R=0.63 (Fig. S1a in the Supplement). A better comparison result (slope of 1.03, R=0.74) would be obtained if data associated with RH ≥80 were excluded (Fig. S1b). The overestimation of the LGR instruments compared with denuder-based instruments has also been reported in Teng et al. (2017), suggesting possible interference from water vapor on NH3 measurements. As can be seen in Fig. S2, both instruments captured the same diurnal variation of NH3 during the four case episodes in this study, which proves that the IGAC instrument was able to capture the overall variation trends of NH3. As both instruments have their uncertainties, we decided to use the NH3 measured by the IGAC instrument for better consistency with other data.

Figure 1MODIS Terra (a, c) and Aqua (b, d) satellite images on 4 November (a, b) and 5 November 2016 (c, d); the star markers represent the locations of Gucheng (GC: the observation site), Baoding (BD) and Beijing (BJ). The original MODIS images were downloaded from https://worldview.earthdata.nasa.gov/ (last access: 18 September 2018).
NOx and CO were observed using commercial instruments from Thermo Electronics (Model 42CTL and Model 48CTL), whereas the Aero-Laser AL2021 H2O2 monitor was used to measure H2O2 concentrations. The NOx instrument uses a Mo-based converter, which would result in interference from NOz species (e.g., HONO, HNO3, peroxyacetyl nitrate (PAN), and so on.) on NO2. Here, we define = , and use it to approximate the true NO2 concentration. The ambient RH, temperature, wind speed and wind direction were observed using an automatic weather station. The dry-state particle number size distributions (PNSDs) in the diameter range from 3 nm to 10 µm, were jointly measured using a scanning mobility particle size spectrometer (SMPS) and an aerodynamic particle sizer (APS, TSI Inc., Model 3321). The ambient aerosol liquid water concentrations were calculated based on measurements of a three-wavelength humidified nephelometer system (Kuang et al., 2018). The aerosol hygroscopicity parameter κ (Petters and Kreidenweis, 2007) was calculated using the method proposed by Kuang et al. (2017). The aerosol surface area concentration (SA) was calculated based on measured PNSD and the retrieved hygroscopicity parameter κ based on measurements from the humidified nephelometer system.
The time series of HONO, sulfate, nitrate, ammonium and their precursor gases, meteorological parameters and other parameters are shown in Fig. 2. During this observation period, the HONO concentration ranged from 0.31 to 17.6 ppb (it ranged from 0.3 to 6.0 ppb during most periods) with an average of 3.0 ppb. The concentration ranged from 7.1 to 56.3 ppb with an average of 28.9 ppb. The NH3 concentration ranged from 0.05 to 30 ppb with an average of 12.3 ppb. The ratio ranged from 0.02 to 0.6 with an average of 0.11, which is moderately higher than the previously reported results in eastern China (Cui et al., 2018; Liu et al., 2014). This is because the PM2.5 mass concentrations and SA in this study are much higher than previous measurements (as shown in Fig. 3). Additionally, increases with PM2.5 and SA, which is consistent with previous results, suggesting that aerosol might have promoted the conversion from NO2 to HONO. In Cui et al. (2018), under the observed PM2.5 range of 0 to 100 µg m−3, HONO∕NO2 ranged from 0.0013 to 0.17, with an average of 0.062, while in this study the average also increased from 0.06 to 0.07 for the same PM2.5 range. Liu et al. (2014) reported that the average HONO∕NO2 increased from 0.04 to 0.1 when SA increased from 200 to 1100 µm2 cm−3, while the average in this study increased from 0.05 to 0.15 for the same SA range. This comparison suggests that our HONO measurements were comparable to those made using other instruments previously reported in eastern China. Furthermore, it can be noticed that for the relatively lower PM2.5 concentration and SA range, increased rapidly with increasing aerosol loading, while after a critical concentration (PM2.5 >225 µg m−3, SA>1100 µm2 cm−3) the increase came to a halt. This indicates that under relatively cleaner conditions, the heterogeneous conversion of NO2 to HONO might have been limited by aerosol surface area density. However, under severe haze pollution or foggy conditions with sufficient SA available for heterogeneous reactions, the HONO formation was no longer sensitive to the change in SA.
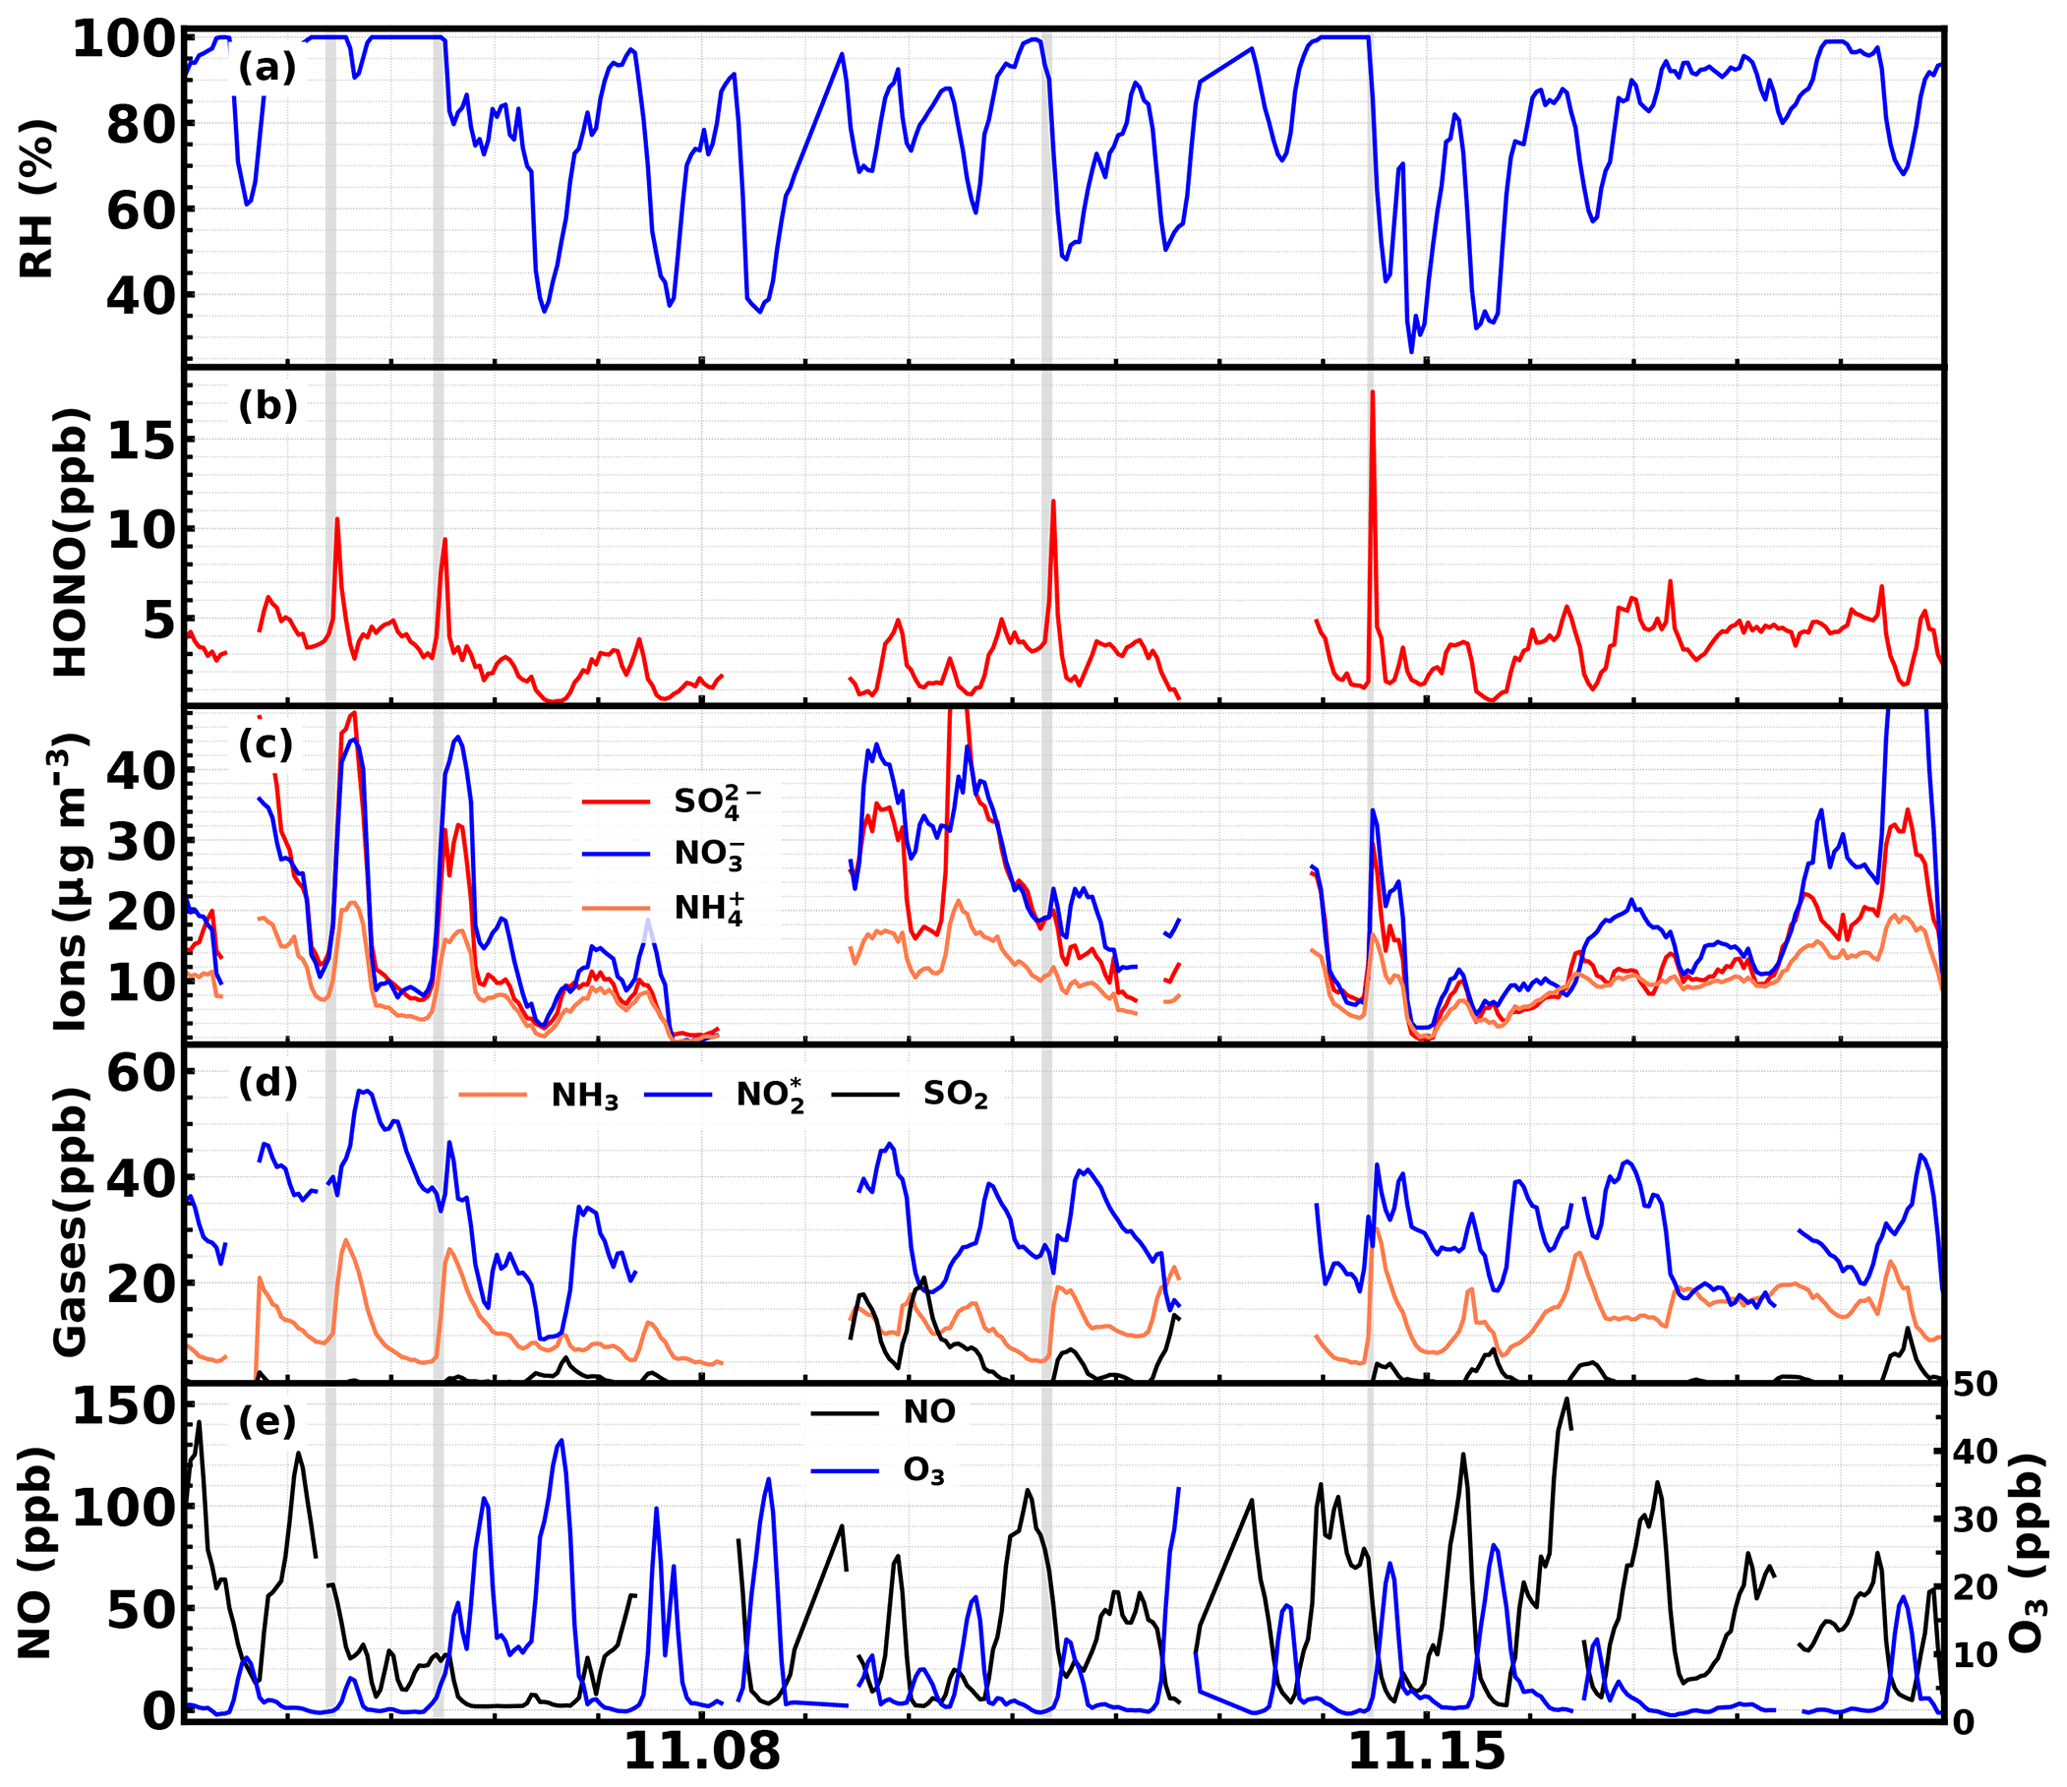
Figure 2Time series of ambient (a) RH; (b) HONO; (c) sulfate, nitrate and ammonium; (d) NH3, and SO2; and (e) NO and O3 during the observation period.
Four rapid HONO formation events were identified in Fig. 2, two under foggy conditions and the other two under severe haze conditions with high RH. In Sect. 3.1 and 3.2, the variations of the pollutants connected to HONO formation during the four cases will be described in detail, so that the mechanism behind such rapid HONO production under conditions when HONO formation was not sensitive to SA can be better discussed in Sect. 4.
3.1 Explosive growth of HONO during fog episodes
Two dense fog episodes with rapid HONO increases were observed for the first time in China, occurring on the 4 and 5 November 2016. From satellite images (Fig. 1) it can be seen that a wide area of the NCP was shrouded by fog before noon (approximately 11:30 LT – LT refers to Beijing local time) on the 5 November – including the observation site; however, the fog area reduced in the afternoon (about 13:30 LT) and dissipated near the observation site. The evolution of the fog-shrouded area during these 2 days was also observed by a geostationary satellite (http://www.eorc.jaxa.jp/ptree/index.html, last access: 18 September 2018). These two fog episodes offer us a great opportunity to study the hydrolysis process of NO2 (Reaction R2) and the role of SO2 in heterogeneous HONO production in fog water (Reaction R1), which usually show a pH above 5.5 (Safai et al., 2008; Lu et al., 2010).
The time series of simultaneously observed meteorological parameters, concentrations of nitrate, ammonium, sulfate and their precursor gases SO2, and NO and NH3, as well as atmospheric oxidants such as O3, H2O2 and other parameters including CO, which is indicative of transport processes during the 2 days with fog episodes, are shown in Fig. 4. From 00:00 LT on the 4 November, the ambient RH continuously increased, reached 100 % at approximately 05:00 LT, and lasted about 8.5 h before it dropped below 100 % at around 13:30 LT. However, at 15:30 LT, the ambient RH began to rise again, reached 100 % at roughly 19:30 and then sustained until 12:00 LT on 5 November. The latter fog episode lasted about 18.5 h.
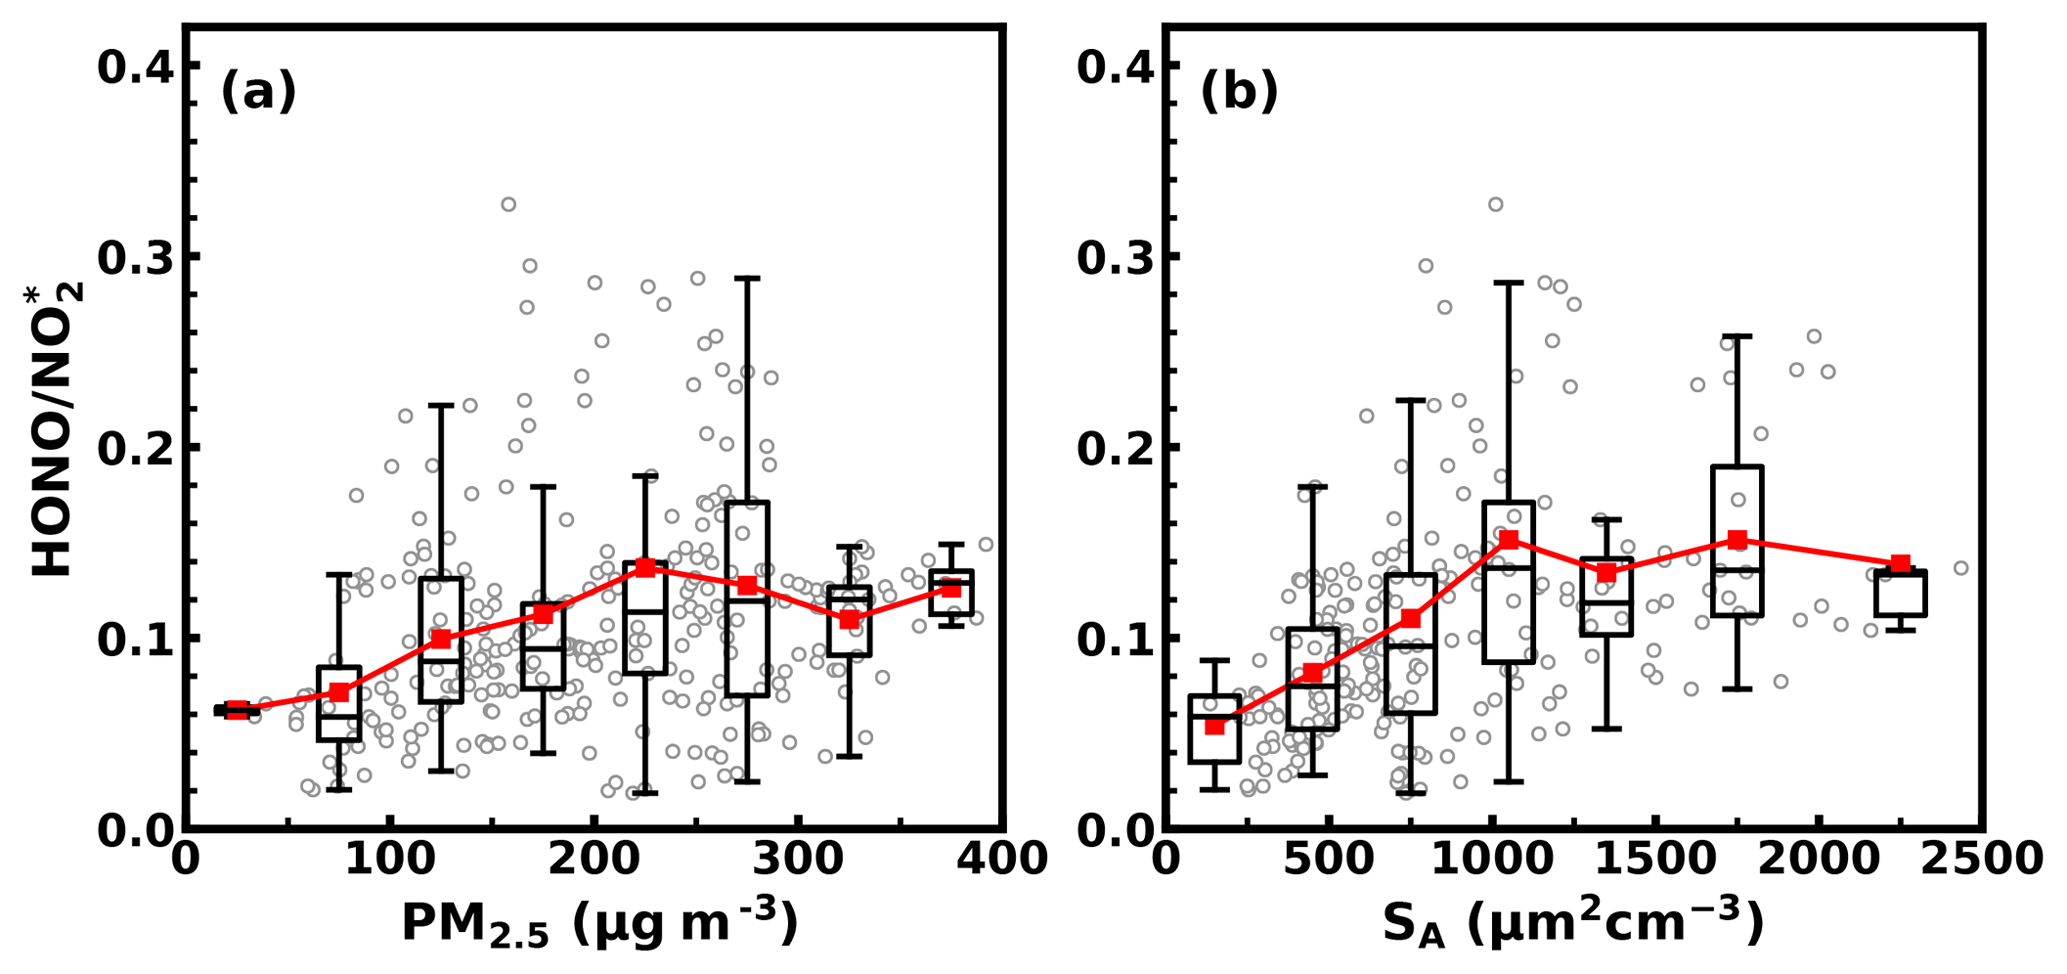
Figure 3Box plots displaying the variation of with (a) PM2.5 concentration and (b) ambient aerosol surface area density. Red markers are the mean values of . Box plots give the range from the 25th to the 75th percentile, and bars give the range from the 5th to the 95th percentile; the black lines in the boxes are the medians.
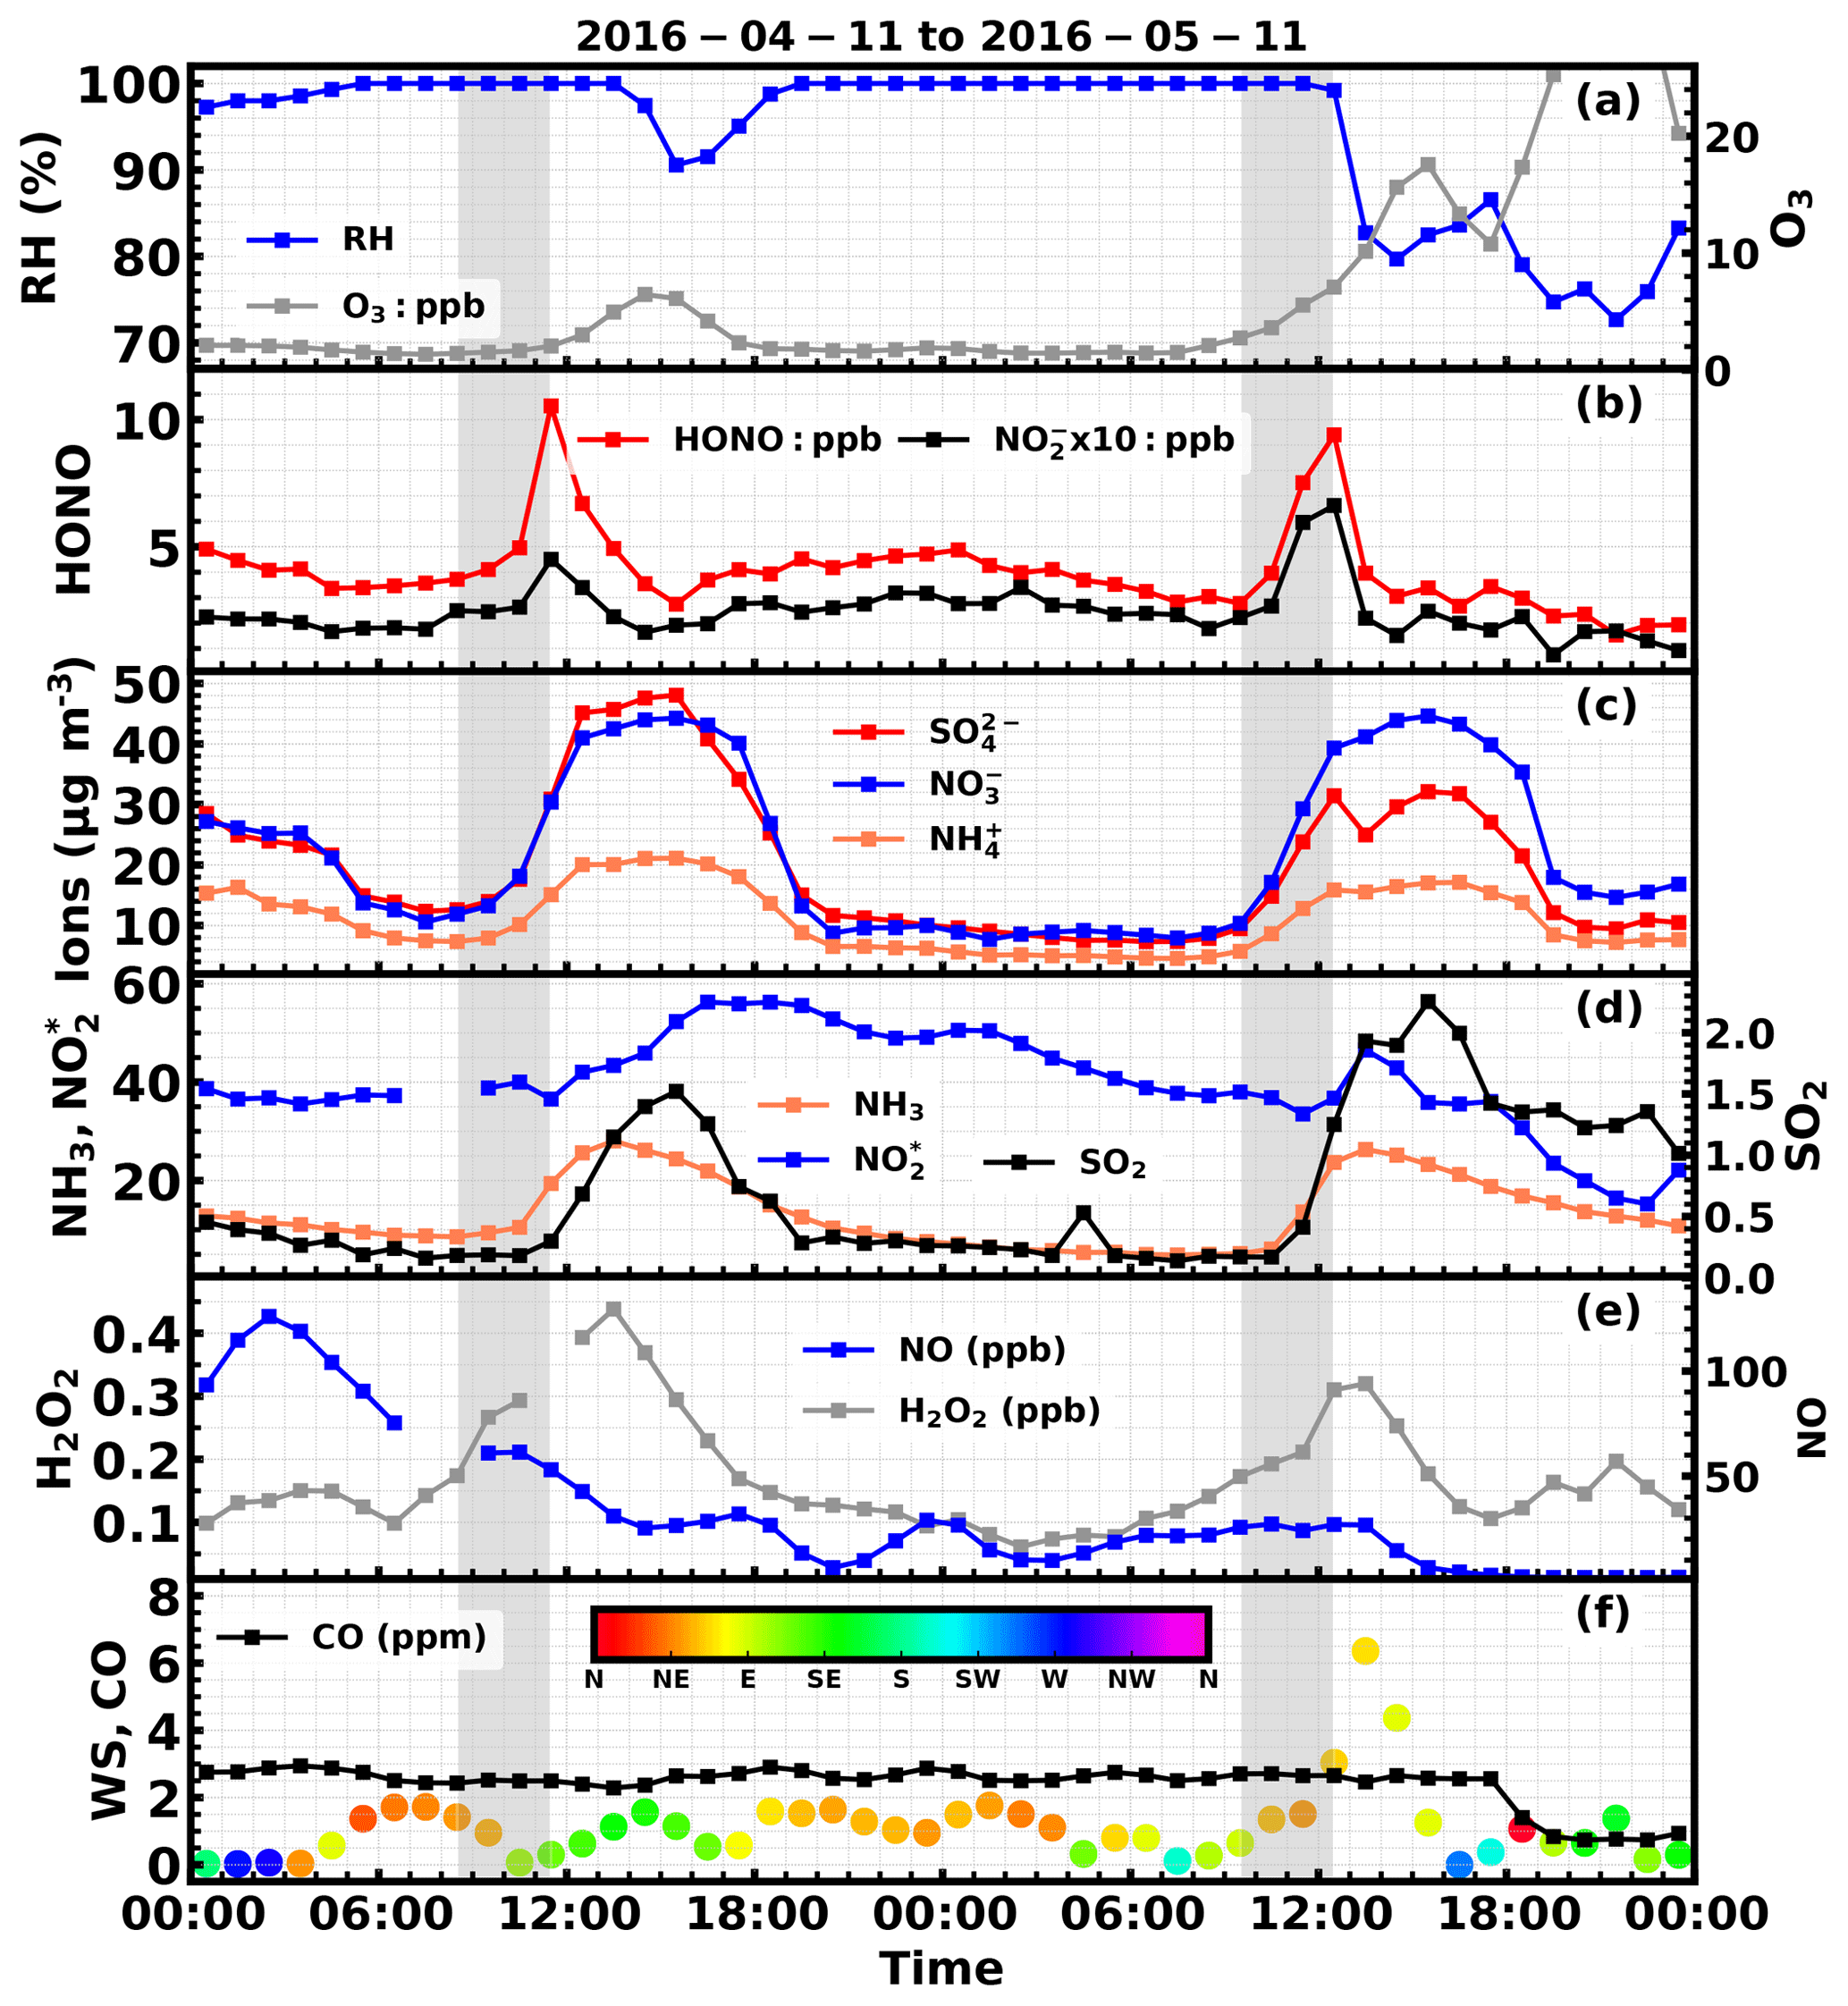
Figure 4Time series of ambient (a) RH, O3, (b) HONO, , (c) , , , (d) NH3, , SO2, (e) NO, H2O2, (f) CO, wind speed and wind direction (colors of scatter points) from 4 to 5 November. 2016. Gray shaded areas represent periods displaying a rapid increase in HONO.
During the first fog episode, rapid increases of HONO, nitrate, sulfate and ammonium were observed from 08:50 to 11:30 LT (Case 1). HONO increased from 3.6 to 10.6 ppb, with the most rapid increase occurring at around 11:00 LT at a rate of 5.5 ppb h−1. During the period of increasing HONO, the variation characteristics of related trace gases and other parameters were as follows. The NH3 concentration increased slowly at first and then increased drastically at about 11:00 LT (10 ppb h−1). The SO2 concentration remained almost constant at first and then increased from approximately 0.25 to 0.4 ppb. The concentration varied little but decreased when HONO increased, whereas the NO concentration increased first and then decreased. The H2O2 concentration continuously increased, but the O3 concentration remained near zero. The CO concentration remained almost constant (∼2.5 ppm), suggesting that there was no evident plume transport during this process. The wind speed was less than 2 m s−1 and dropped to almost 0 m s−1 when the HONO concentration dramatically increased, further supporting the fact that the drastic increase was not caused by transport processes. Ammonium, nitrate and sulfate concentrations steadily increased from 7.5, 13.2, 13.7 µg m−3 to 14.3, 30.4, 31.0 µg m−3, respectively. A noticeable increase in nitrite was also observed when HONO increased most rapidly. It should be noted that the cutting diameter of the IGAC instrument is 2.5 µm, which means that the observed concentrations only represent the variation of inorganics ions in aerosol water, and variation of fog droplets was not included.
During the second fog episode, HONO, nitrate, sulfate and ammonium started to increase rapidly from 09:30 LT and reached a plateau at roughly 12:30 LT, when the fog started to dissipate (Case 2). HONO increased from 3 to 9.5 ppb, with the fastest increase occurring near 11:00 LT at a rate of 3.5 ppb h−1. The NH3 concentration increased steadily from 5 to 24 ppb, and the SO2 concentration increased steadily from 0.25 to 1.25 ppb. The concentration decreased continuously at the very beginning (near 40 ppb) and then increased slightly, while NO concentration remained almost constant (near 30 ppb) throughout the entire fog period. The H2O2 concentration increased slightly at first and then rose rapidly towards the end of the fog period, while the O3 concentration increased very slightly. The CO concentration also remained near constant (∼3 ppm). The wind speed was steady and below 2 m s−1 at the beginning, but it began to increase quickly at noon. Ammonium, nitrate and sulfate concentrations grew steadily from 8.1, 17, 3.8 µg m−3 to 15.3, 39.3, 8.0 µg m−3, respectively. The variation of nitrite was very similar to that of HONO. The variation of wind speed demonstrated that the air mass was relatively stagnant at the very beginning of the HONO increase, but became more turbulent upon fog dissipation.
3.2 Explosive growth of HONO during haze episodes with high RH conditions
Two episodes with rapid HONO increase under severe haze conditions with high RH occurred on the 11 and 14 November, respectively. The time series of simultaneously observed meteorological parameters, concentrations of nitrate, ammonium, sulfate, and their precursor gases SO2, , NO and NH3, as well as oxidants including O3, H2O2, and other parameters such as the CO concentration, aerosol volume concentration in dry state and aerosol liquid water content during the 2 days are shown in Fig. 5.
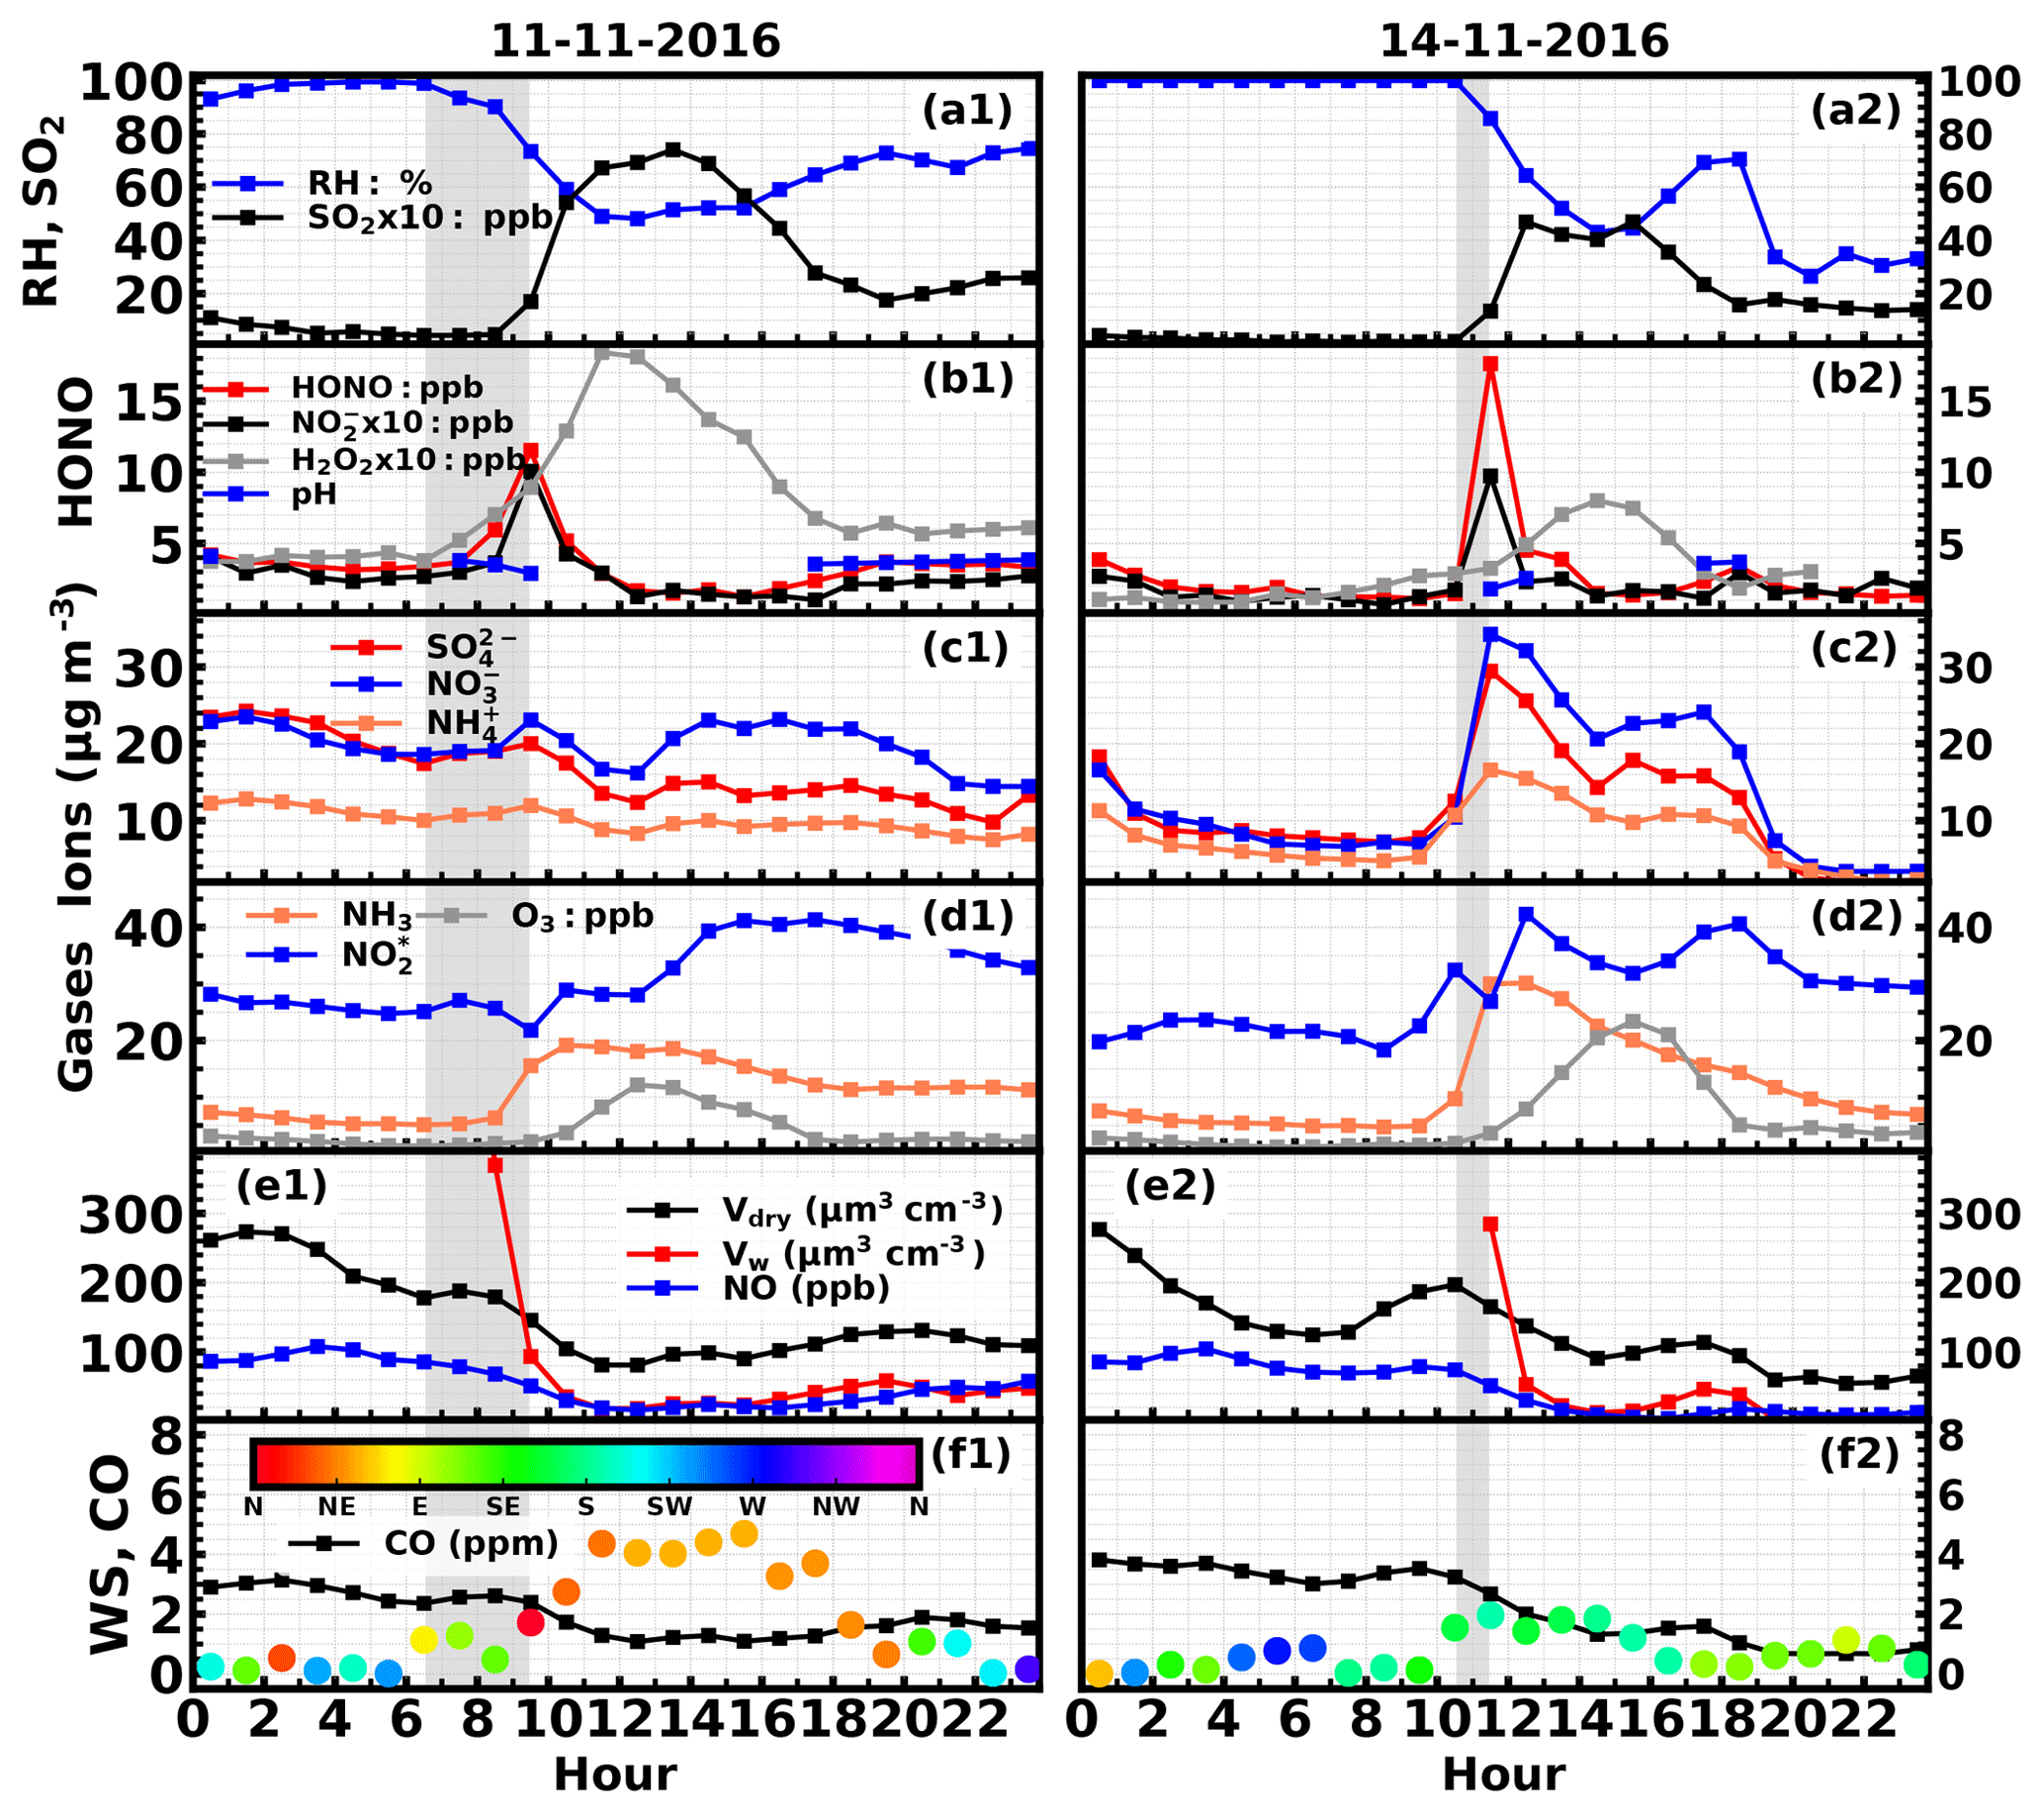
Figure 5Time series of ambient (a) RH, SO2, (b) HONO, , H2O2, aerosol pH, (c) , , , (d) NH3, , O3, (e) NO, volume concentrations of PM2.5 in dry state (Vdry), volume concentrations of liquid water (Vw), (f) CO, wind speed and wind direction on (a1–f1) 11 November 2016 and (a2–f2) 14 November 2016. Gray shaded areas represent periods of rapid HONO increase.
On the 11 November, HONO started rising at 06:30 LT (3.4 ppb) and came to a halt at 09:00 LT (11.5 ppb) (Case 3). The quickest increase of HONO occurred at approximately 09:00 LT at a rate of 5.6 ppb h−1. The ambient RH decreased rapidly (from foggy conditions to near 75 %). NH3 increased slowly at first and then grew rapidly, while decreased slowly and SO2 remained low. The total volume concentration of PM2.5 decreased. Ammonium, nitrate and sulfate concentrations increased very slowly at first and then an evident increase was observed in ammonium and nitrate. The decrease in the dry-state volume concentration of PM2.5 demonstrated that the air mass was not quite steady due to transport or boundary layer processes. The slight increase of nitrate and sulfate despite the drop in the total PM2.5 concentration suggests that the nitrate and sulfate produced during the HONO formation process overshadowed the loss of these species to boundary layer mixing and transport.
On 14 November, HONO increased drastically at about 11:00 LT, reaching 17.6 ppb at 11:30 LT (16.1 ppb h−1) and then dropped promptly to 4 ppb at 12:30 LT (Case 4). This phenomenon took place when the fog dissipated and the ambient RH abruptly dropped to near 85 %. Key variation features of other parameters are as follows. NH3 increased rapidly from 9.7 to 30 ppb. The concentration decreased as HONO quickly increased, while the SO2 concentration remained low. The concentrations of sulfate and nitrate also quickly increased. The volume concentration of PM2.5 decreased, indicating that even more sulfate and nitrate were formed than the observed growth in their concentrations. The photolysis of HONO was most probably the cause for this drastic decrease. Note that the HONO did not increase during the period when only rapidly increased and NH3 varied little.
4.1 HONO budget analysis
In these four rapid HONO formation episodes, the maximum HONO growth rates (d[HONO]∕dt) all exceeded 5 ppb h−1, and even reached beyond 16 ppb h−1. Such high HONO growth rates have not yet been reported in literature. In this section, we perform a budget analysis by estimating the net HONO production accounting for currently known sources and sinks and comparing HONO production to observed d[HONO]∕dt. By doing so, we can discuss whether the observed HONO formation events can be explained by currently known mechanisms and try to identify which mechanisms determine the variation of HONO.
The net HONO production rate can be estimated by accounting for all of the currently known sources and sinks using the following equation (Huang et al., 2017; Zhang et al., 2019):
where Pemi is the total emission rate of HONO, is the net HONO production in homogenous gas-phase reactions, Phet is the HONO produced via heterogeneous reactions, Lpho is the loss of HONO due to photolysis and Ldep is the loss of HONO due to deposition.
Previous studies have shown that HONO can be emitted from biomass burning and vehicles (Nie et al., 2015; Huang et al., 2017). Biomass burning contributes to HONO primarily by increasing SA and NO2 conversion efficiency (Nie et al., 2015). Under foggy conditions, surface area was not a limiting factor for NO2 conversion. During the haze events, SA decreased due to decreasing humidity and aerosol water content. Hence, the variation of surface area cannot explain the observed HONO increases. According to the mapped fire spots on the days of the HONO events (Fig. S3), there was no fire within 20 km of the site. K+ is often used as an indicator of biomass burning. The average K+ concentration during the whole campaign ranged from 0.022 to 5.95 µg m−3, with an average of 1.28 µg m−3. The K+ levels during the four events were 1.39, 1.08, 1.51 and 1.54 µg m−3, respectively, showing no evident sign of biomass burning. Hence, only vehicle emissions were considered in this study.
Vehicle emissions can be estimated using the following equation:
where Remission is the vehicle emission ratio, and [NOx]vehicle is the NOx concentration from vehicle emissions. The NO∕NOx ratio during the HONO formation episodes ranged from 0.37 to 0.76, suggesting that the air masses were relatively aged compared with freshly emitted air masses from exhaust (NO∕NOx >0.9). Here, Pvehicle is estimated assuming that all of the measured NOx came from vehicle emissions and an emission ratio of 1 %, which is higher than the upper limit of 0.8 % used in Huang et al. (2017), to obtain an upper limit for vehicle emissions.
HONO can be formed during gas-phase reactions of NO with OH radicals and is lost via direct reactions with OH radicals. The net production of HONO via homogeneous reactions can be estimated using the following equation:
where kNO+OH ( cm−3 s−1) and kHONO+OH ( cm−3 s−1) are the rate constants of the reactions of NO and HONO with OH, at 298 k, respectively (Li et al., 2012). The diurnal variation of OH concentrations was inferred from Whalley et al. (2015), replacing OH under fog conditions with 1×105 cm−3 (Fig. S4).
The heterogeneous conversion of NO2 on aerosol and ground surface is considered a major source for HONO. However, the detailed mechanism (either Reaction R1 or Reaction R2) is still under debate, and different studies have shown a large variability in the range of the estimated NO2 uptake coefficient. Typically, the conversion of NO2 on aerosol and ground surface is parameterized as a linear function of the NO2 uptake coefficients and the surface to volume ratios (or SA) (Xue et al., 2014; Li et al., 2018b):
where represents the mean molecular speed; γg and γa represent the uptake coefficient on ground and aerosol surface, respectively; S∕V represents the surface to volume ratio; and SA represents the ambient aerosol surface area density. For NO2 conversion on ground surface, γg is assumed to be and S∕V is assumed to be 0.1 m−1 (Li et al., 2010; Xue et al., 2014; Vogel et al., 2003). As no measurements of fog droplet surface areas were made in this experiment, estimates for NO2 conversion under foggy conditions could not be incorporated. For non-fog conditions, the ambient SA calculated using the simultaneously measured PNSD and the aerosol hygroscopicity parameter derived from measurements from a humidified nephelometer system were applied to further calculate the variation of the HONO production on aerosol surface. Here, with an overall consideration of the γa used in past literature (Li et al., 2010, 2018b; Xue et al., 2014), γa was assumed to be , and for nighttime, and for daytime with solar radiation below and above 400 Wm−2, respectively, to account for both anion-enhanced and photo-enhanced NO2 conversion.
HONO loss through photolysis reactions were calculated as follows:
where JHONO was modeled using the Tropospheric Ultraviolet and Visible (TUV) radiative transfer model (version 5.3, http://www2.acom.ucar.edu/modeling/tuv, last access: 18 September 2018). The required single-scattering albedo and aerosol Angström exponent were estimated using simultaneously measured PNSD and BC values (Kuang et al., 2015), while the 550 nm aerosol optical depth (AOD) was assumed to vary with RH (Table S1).
Loss via dry deposition was estimated using Eq. (6):
where the dry deposition rate (vdep) was assumed to be 0.3 cm s−1 according to Stutz et al. (2002) and the boundary layer height (H) was interpolated from the European Centre for Medium-Range Weather Forecasts (ECWMF) ERA-interim data (http://apps.ecmwf.int/datasets/data/interim-full-daily/, last access: 18 September 2019).
The comparison between the calculated HONO net production rate and measured HONO variation rate (d[HONO]∕dt) is displayed in Fig. 6. The estimated upper limit for vehicle emissions displays little variability during the day, with slight decreasing trends during the four events, proving that the observed HONO production could not have been caused by direct vehicle emissions. The net gaseous-phase production of HONO () contributed 0.15–0.18, 0.04–0.07, 0.27–1.04 and 0.25-1.53 ppb h−1 during case events 1–4, respectively, displaying little influence during fog events and more influence during haze events. However, the estimated was far from sufficient to explain the observed d[HONO]∕dt. Dry deposition was typically high during the night within the shallow nocturnal boundary layer and decreased during the day with the increase of the boundary layer height. The calculated Ldep contributed 0.5–0.9, 0.4–0.6, 2.7–4.3 and 0.05–0.3 ppb h−1 to the loss of HONO during case events 1–4, respectively. No significant decreases in Ldep were observed during the two fog events, whereas increases were detected during the cases on 11 and 14 November. Not only was the variation in Ldep unable to explain observed HONO production values, it further added to the discrepancy between observed and calculated d[HONO]∕dt. During case events 1–4 the JHONO increased from to s−1, to s−1, to s−1 and to s−1, respectively, with Lpho contributing 0.9–8.9, 2.2–7.8, 0.03–5.5 and 0.8–26.4 ppb h−1, respectively, to the loss of HONO. JHONO increased significantly by the end of the HONO formation case events 1–4 to , , and s−1, respectively, suggesting that the rapid drop in HONO concentrations was most probably caused by rapid photolysis. Overall, Lpho contributed most to the discrepancy between the observed and calculated d[HONO]∕dt.
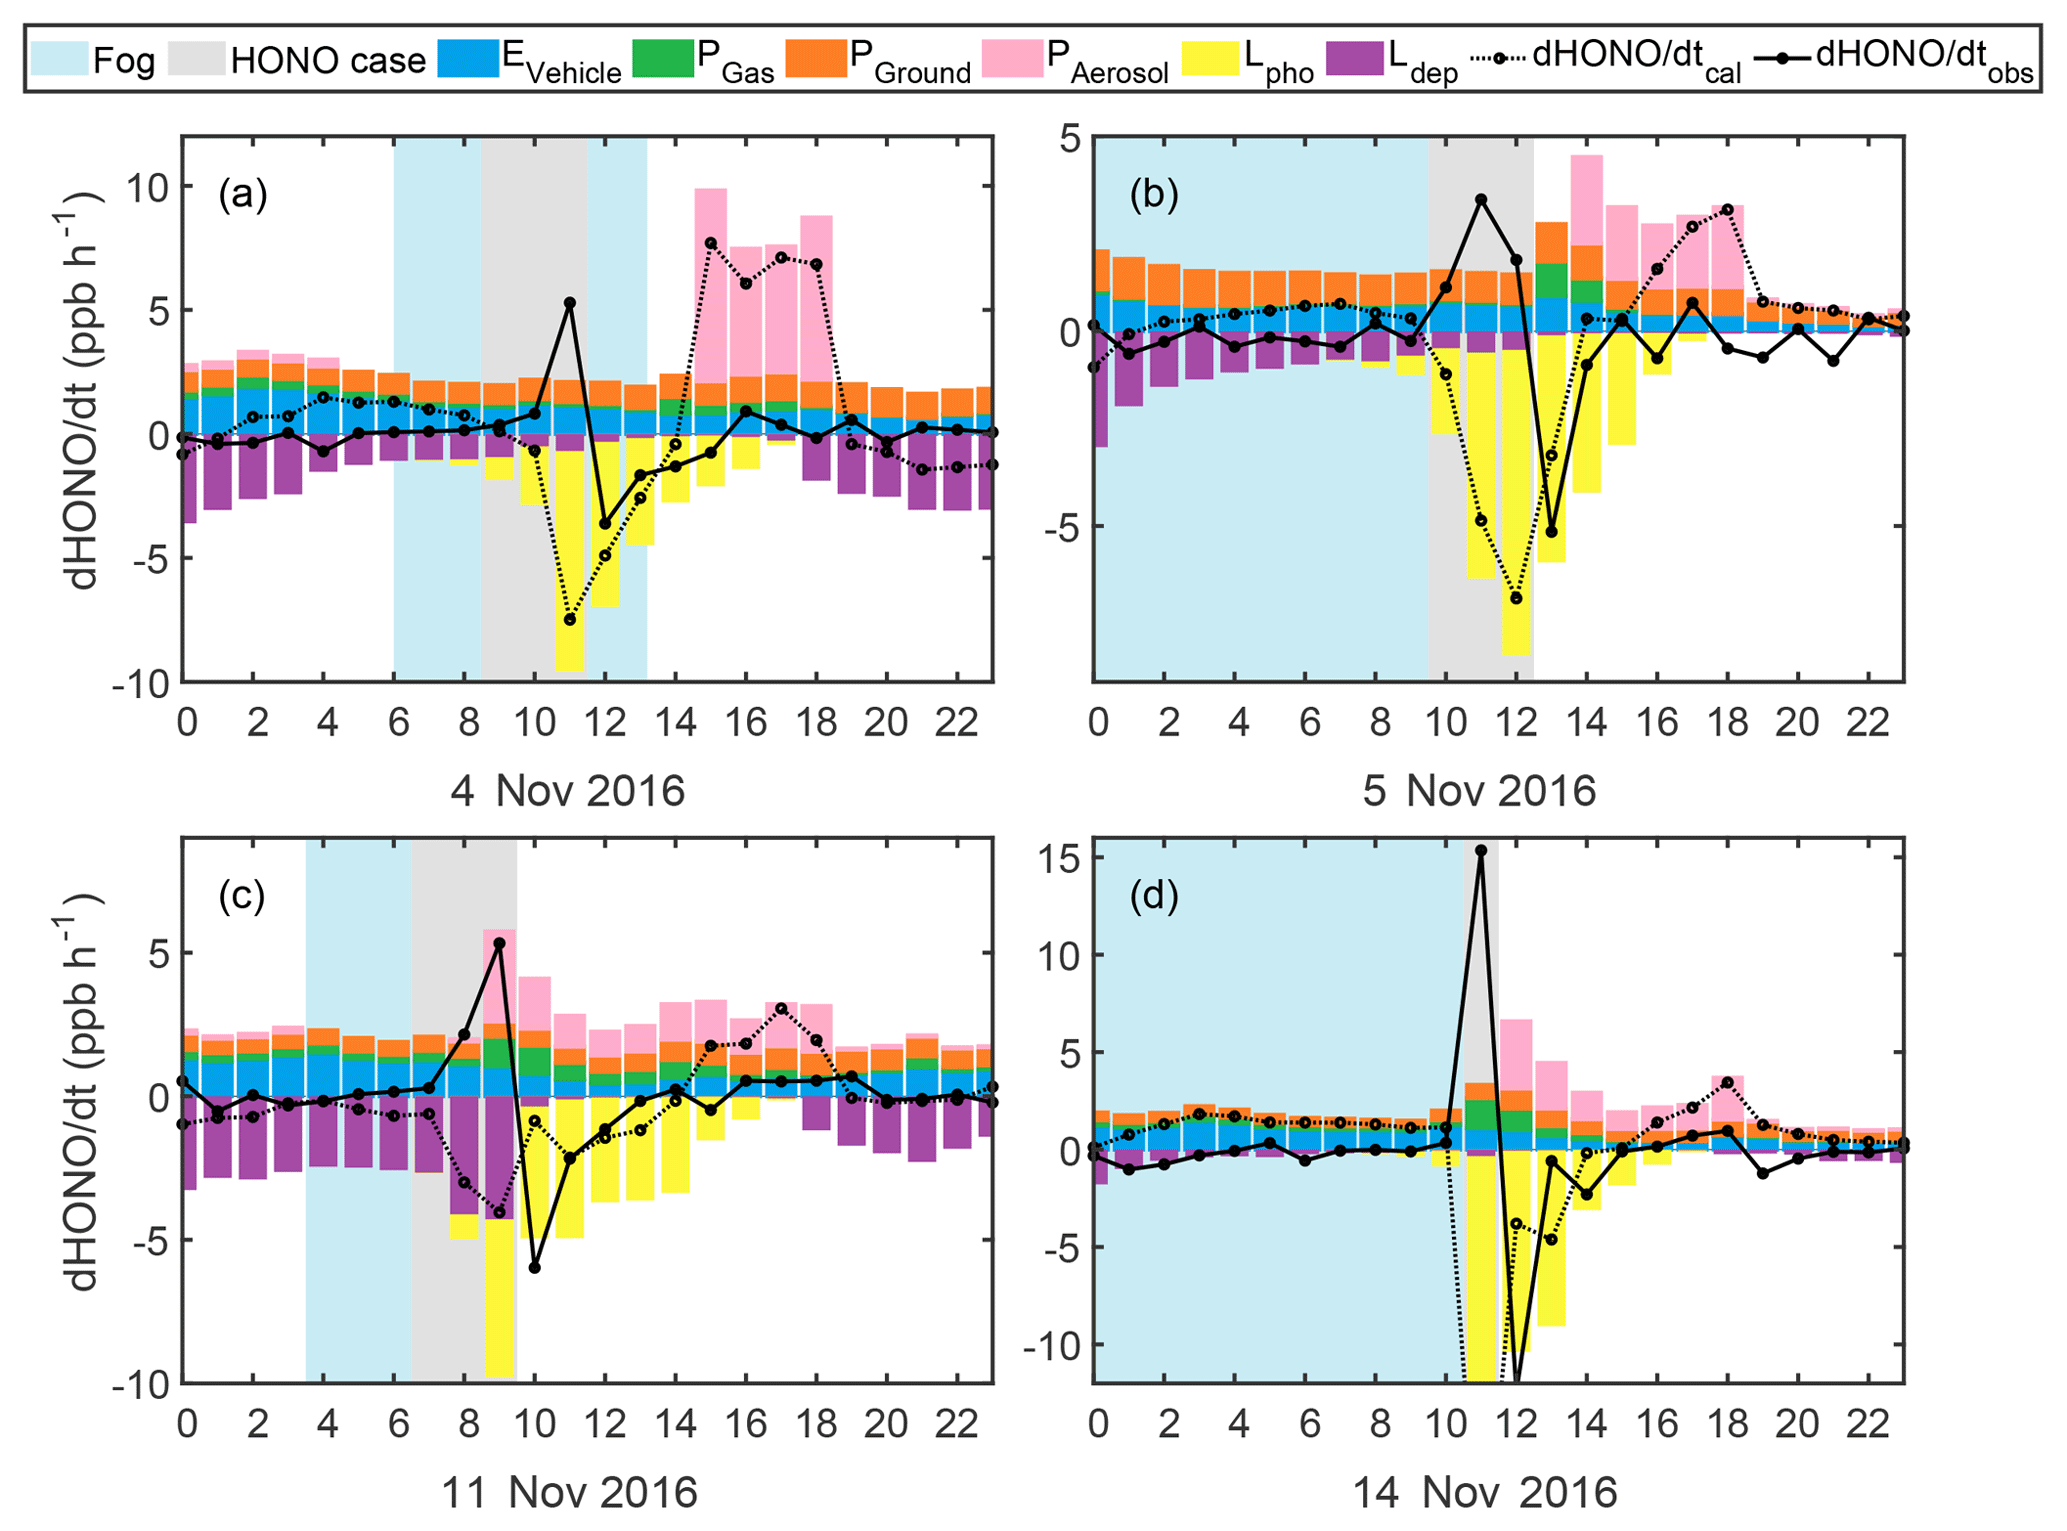
Figure 6Estimated HONO emission from vehicles (blue), gas-phase production (green), production on ground (orange) and aerosol surface (pink), loss via photolysis (yellow) and dry deposition (purple), as well as the calculated (dotted black) and observed (solid black) d[HONO]∕dt on (a) 4, (b) 5, (c) 11 and (d) 14 November 2016.
Generally, the observed and calculated d[HONO]∕dt showed better agreement outside of the HONO explosive growth periods, showing overestimations when SA was high. For the fog cases, no SA was available to account for Phet; however, for the haze case on 11 November (Fig. 6c), it can be noted that by accounting for the photo-enhanced NO2 conversion, an overestimation in Phet occurred between 14:00 and 18:00 LT, although the rapid HONO formation in the morning could not be explained. This further suggests that the observed discrepancies in HONO production were mainly caused by uncertainties in the heterogeneous formation (NO2 uptake coefficient) estimates. The fact that HONO drastically increased while NO2 varied little (09:30 to 11:30 LT, 5 November and 06:30 to 08:30 LT, 11 November) or barely increased, even during drastic increases of NO2 (08:30 to 11:30, 14 November), but displayed explosive growth with increasing NH3, could not be explained by currently known HONO sources (direct emission or gas-phase reactions). Additionally, these rapid increasing HONO phenomena were all observed under foggy or severe haze conditions with high RH, which further affirms the suspicion that the HONO increase was caused by the heterogeneous conversion of NO2. Under such conditions, SA was not the controlling factor determining the conversion of NO2; this begs the question of which mechanism might have been behind such rapid HONO production.
4.2 Heterogeneous HONO formation mechanism
As stated in Sect. 4.1, the unknown HONO source and the overestimates in HONO production were both linked to our limited understanding of the heterogeneous HONO formation mechanism. In this section, we try to evaluate the relative contribution of the currently known heterogeneous HONO formation pathways (Reactions R1 and R2) and reveal the reason for their limitations with respect to explaining the observed HONO growth.
To evaluate which process was dominating the heterogeneous production of HONO (Reaction R1 or Reaction R2), we assumed that HONO was produced in aerosol and fog water simultaneously via Reactions (R1) and (R2). As measurements of fog liquid water content or fog droplet surface area density were not made, we cannot directly quantify the absolute HONO production in fog. However, we can make a few assumptions to compare the relative HONO contribution via Reactions (R1) and (R2). First, it was assumed that the observed sulfate production (d[SVI]∕dt) was caused by the reaction of SO2 with H2O2, O3, NO2 and transition metal ions (TMI: Fe3+ and Mn2+). Calculations were performed according to Cheng et al. (2016), using the same pH-dependent TMI concentrations and the measured SO2, H2O2, O3 and concentrations (Table S2). For the two fog episodes on 4 and 5 November 2016, the mean diameter of fog droplets was assumed to be 7.0 µm, and the liquid water content was assumed to be 0.3 g m−3 according to Shen et al. (2018). For the haze episodes on the 11 and 14 November 2016, the mean aerosol diameter under ambient conditions was estimated to be 0.65–1.22 and 0.9 µm (size-resolved volume contribution of aerosol particles in dry-state peaks near 500 nm), respectively, while the liquid water content was calculated to decrease from to g m−3 on the 11 November and was assumed to be 0.01 g m−3 on the 14 November during the transition from fog to haze. The sulfate production rate and the relative contribution of each oxidation pathway to the total sulfate production rate were obtained and are depicted in Fig. 7. For the two fog episodes, assuming a pH value of 6, the estimated average sulfate production rates are 16.6 and 49.1 µg m−3 h−1, respectively, approximately 3 and 7 times the observed values within PM2.5, which might be an underestimation considering that the liquid water content of fog droplets is at least a magnitude higher than that of aerosols. For the two haze episodes, using the pH values (3.8–5.19 and 4.15 for the two haze events, respectively) estimated using ISORROPIA (forward mode and metastable assumption; Song et al., 2018), the respective estimated average sulfate production rates are 0.33 and 0.94 µg m−3 h−1, which is about 38 % and 20 % of that observed within PM2.5, respectively. Following the calculations of Cheng et al. (2016), we considered the influence of ionic strength on the reaction rates and set constraints on the maximum ionic strength (Imax), which might have caused underestimations for all reaction routes, as the calculated ionic strength commonly exceeded Imax. Underestimated TMI concentrations may also be partly responsible for the underprediction of sulfate production, as the TMI catalysis route has recently been shown to be the dominant SO2 heterogeneous oxidation pathway (Shao et al., 2019) under low-pH conditions. Additionally, there might also be other neglected SO2 oxidation pathways, which will lead to overestimates in the sulfate fraction produced by the NO2 oxidation pathway. Therefore, we can only yield an upper limit for the HONO production rate of Reaction (R1):
where is the contribution fraction of the NO2 oxidation pathway to the total sulfate production. Note that the calculated HONO production rate can only represent the production within PM2.5.
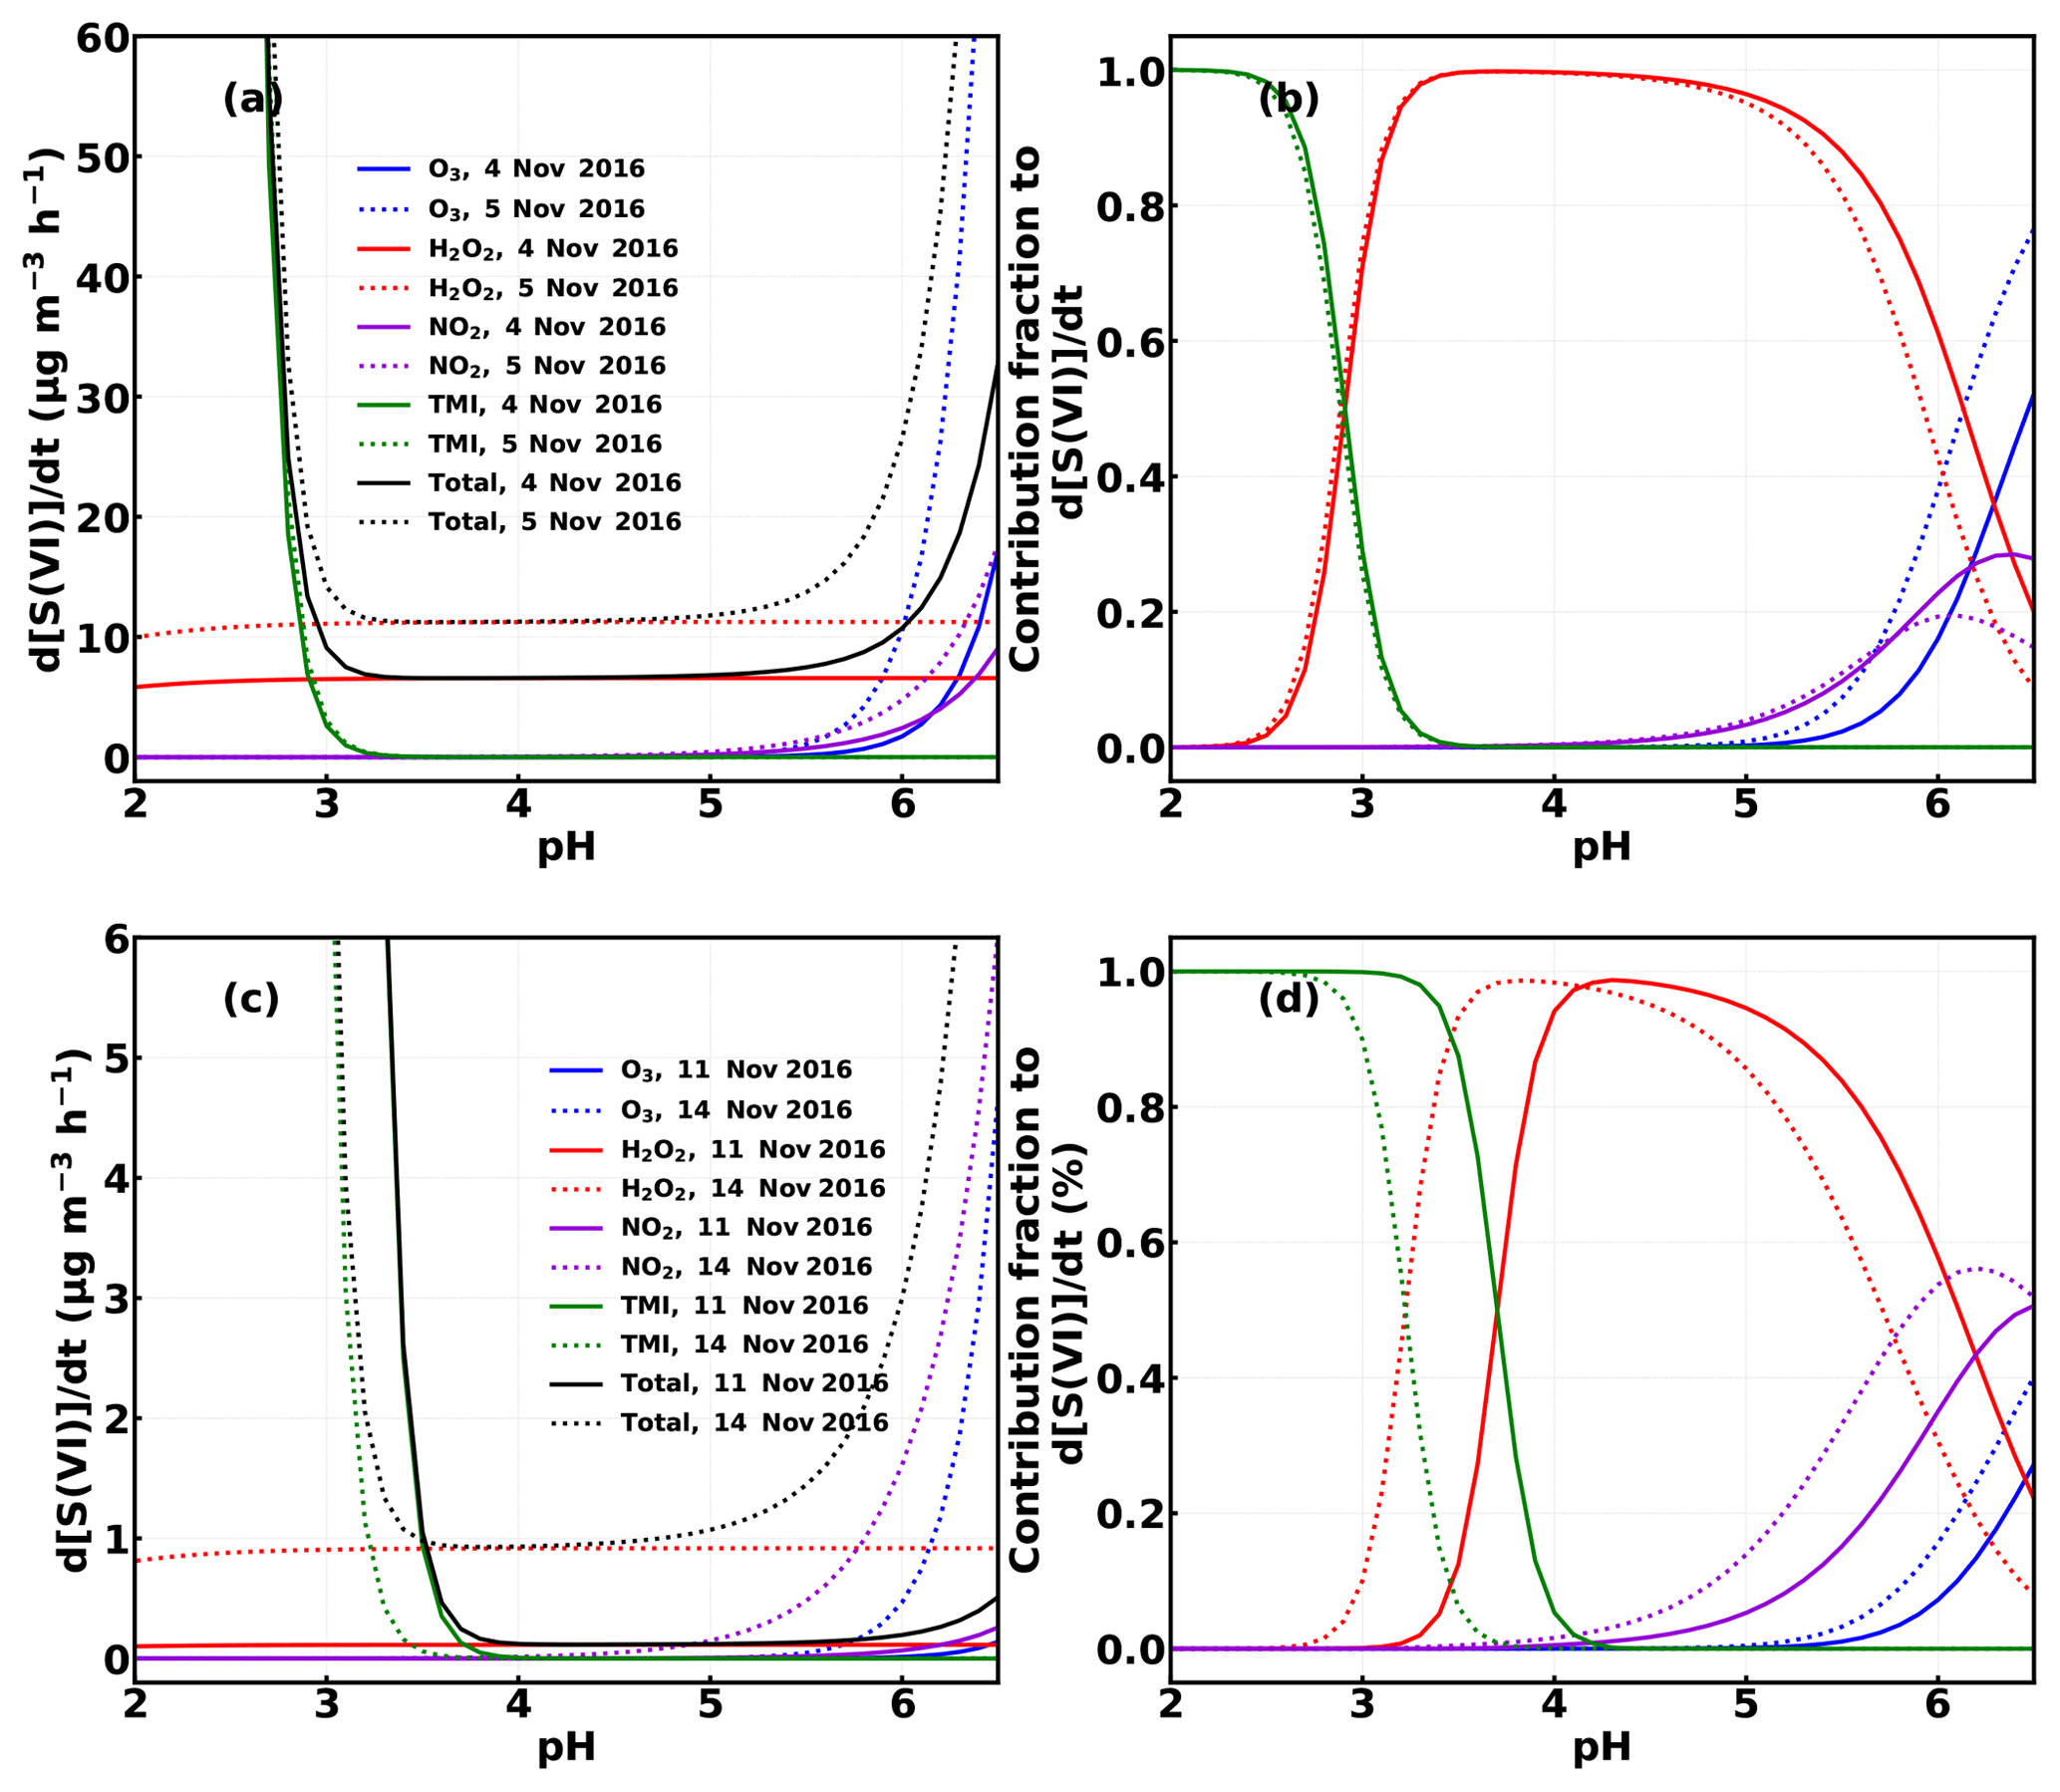
Figure 7Calculated average sulfate production (a, c) and the contribution fraction (b, d) from SO2 oxidation by H2O2, , O3 and TMI under different pH conditions using the methods described in Cheng et al. (2016) for the case episodes on 4, 5, 11 and 14 November 2016.
By further assuming that all of the observed HNO3 and nitrate production () was caused by Reaction (R2) and by the reaction of NO2 with OH radicals ( cm3 s−1), the HONO production rate of Reaction (R2) would be
The contribution fraction of the two reactions to the heterogeneous HONO production in aerosol and fog liquid water content can be calculated by
Assuming that the pH of fog droplets falls within the range of 4 to 6, fReaction R2 was estimated to range from 82.2 % to 99.7 % and from 86.8 % to 99.8 % on 4 and 5 November 2016, respectively. For the two haze events on 11 and 14 November, the respective fReaction R2 corresponding to the pH values modeled by ISORROPIA would be 99.7 % and 98.0 %.
These results suggest that, Reaction (R2) is the dominant contributor to heterogeneous HONO production, while Reaction (R1) is more important under high-pH conditions. Under the assumed upper limit of pH, Reaction (R1) could have contributed up to 17.8 % and 13.2 % to the observed HONO growth during the two fog events, respectively. This is in accordance with results from Wang et al. (2016) and Cheng et al. (2016), which suggested that Reaction (R1) was more likely to occur during fog episodes or under NH3-neutralized conditions (Cheng et al., 2016; Wang et al. 2016). For the two haze events, Reaction (R1) contributed very little (0.3 % and 2 %, respectively) to the observed HONO growth.
As Reaction (R2) seems to be the dominant contributor to the observed HONO production, it is important to evaluate whether the parameterizations in the current literature can accurately describe the HONO production process of Reaction (R2). The HONO production rate of Reaction (R2) is typically parameterized as in Eq. (4), where the NO2 reactive uptake coefficient, the NO2 concentration and the surface area density of fog droplets/aerosol particles are the controlling factors of the NO2 uptake, as opposed to the pH of the water droplets (Li et al., 2018b; Yabushita et al., 2009). Based on the NO2 reactive uptake coefficient () range of to in Yabushita et al. (2009) and Li et al. (2018b), which represents the upper limit for currently reported , we calculated the HONO production rate of Reaction (R2) under different conditions (Fig. S5). During foggy conditions, the HONO production rate would be higher than 1 ppb (ppb . during the two fog episodes ranged between 37 and 40 ppb; therefore, the HONO production rate would have been higher than 40 ppb h−1. However, no rapid increase of HONO was observed unless NH3 simultaneously increased. The same conclusion can be reached for hazy conditions. If we had used a constant of for hazy conditions in the budget analysis, the calculated Phet would have significantly overestimated the HONO production when the relative humidity was high and large ambient SA were observed, whereas it would have failed to reproduce the growth in HONO on the morning of the 11 November 2016 (Fig. S6). The parameterization in Sect. 4.1, which accounted for photo-enhancement, also failed to explain the morning growth of HONO and resulted in an overestimation of the HONO production during the afternoon. These results indicate that is not a constant, and that the currently proposed parameterization schemes for Reaction (R2) are missing the important impact of NH3. The range used in Yabushita et al. (2009) and Li et al. (2018b) highly overestimated HONO production when NH3 was not abundant enough, whereas it was insufficient to explain the observed HONO production with the growth of NH3.
Recent theoretical simulation results ascertain that NH3 can promote the hydrolysis of NO2 and contribute to HONO formation via Reaction (R2) by reducing the free energy barrier of the reaction and stabilizing the product state (Li et al., 2018a). This conclusion is consistent with the observed phenomena that HONO only increased rapidly when NH3 simultaneously increased. Considering the influence of NH3 and sulfate on the aerosol pH, under our observed NH3 concentration range, NH3 has a negligible impact on pH values (Guo et al., 2017), especially under high RH conditions. This further proves that the NH3-promoted hydrolysis of NO2 is independent of the pH value. Another phenomenon worth noting is that, in Case 3, HONO increased rapidly even under the drastic decrease in ambient RH, which demonstrates that the impact of NH3 on HONO formation should be even more important than that of the aerosol liquid water content. However, the hydrolysis of NO2 needs water to be involved; thus, the importance of water content under different conditions remains to be elucidated.
To further investigate the acceleration effect of NH3 on the hydrolysis of NO2, we examined the correlations between the NO2*-to-HONO ( ratio), the -to- ( ratio) conversion efficiencies and the NH3 concentration during the entire field campaign (Fig. 8). Note that only data points during nighttime (18:00 to 06:00 LT) and with an ambient RH higher than 80 % are displayed in Fig. 8. Daytime data were excluded, because HONO would quickly photolyze as soon as sunlight was available. Even if there was rapid HONO production, the corresponding increase of HONO might not be observable due to its quick photolysis. The reason for only including data with ambient RH values higher than 80 % is that the quick hydrolysis of NO2 requires water to be involved. However, the overall hygroscopicity of ambient aerosols during this field campaign was relatively low, with an average hygroscopicity parameter κ of 0.14, and the volume contribution of liquid water to the total volume concentrations of ambient aerosols was quite low when ambient RH was below 80 % (Kuang et al., 2018). The correlation coefficient between the ratio and the NH3 concentration reaches 0.68, whereas that between the ratio and the NH3 concentration only reaches 0.53, as the source of is much more complicated than that of HONO. These results further verified that NH3 promotes NO2 hydrolysis and HONO production. The correlation of to NH3 is highly nonlinear, and increases rapidly with NH3 when NH3 reaches above 10 ppb. Considering Sect. 3 and Fig. 3, it can be concluded that, under relatively cleaner conditions, heterogeneous HONO formation was mainly limited by particle surface area, whereas under polluted conditions, NH3 concentration was the dominant limiting factor.
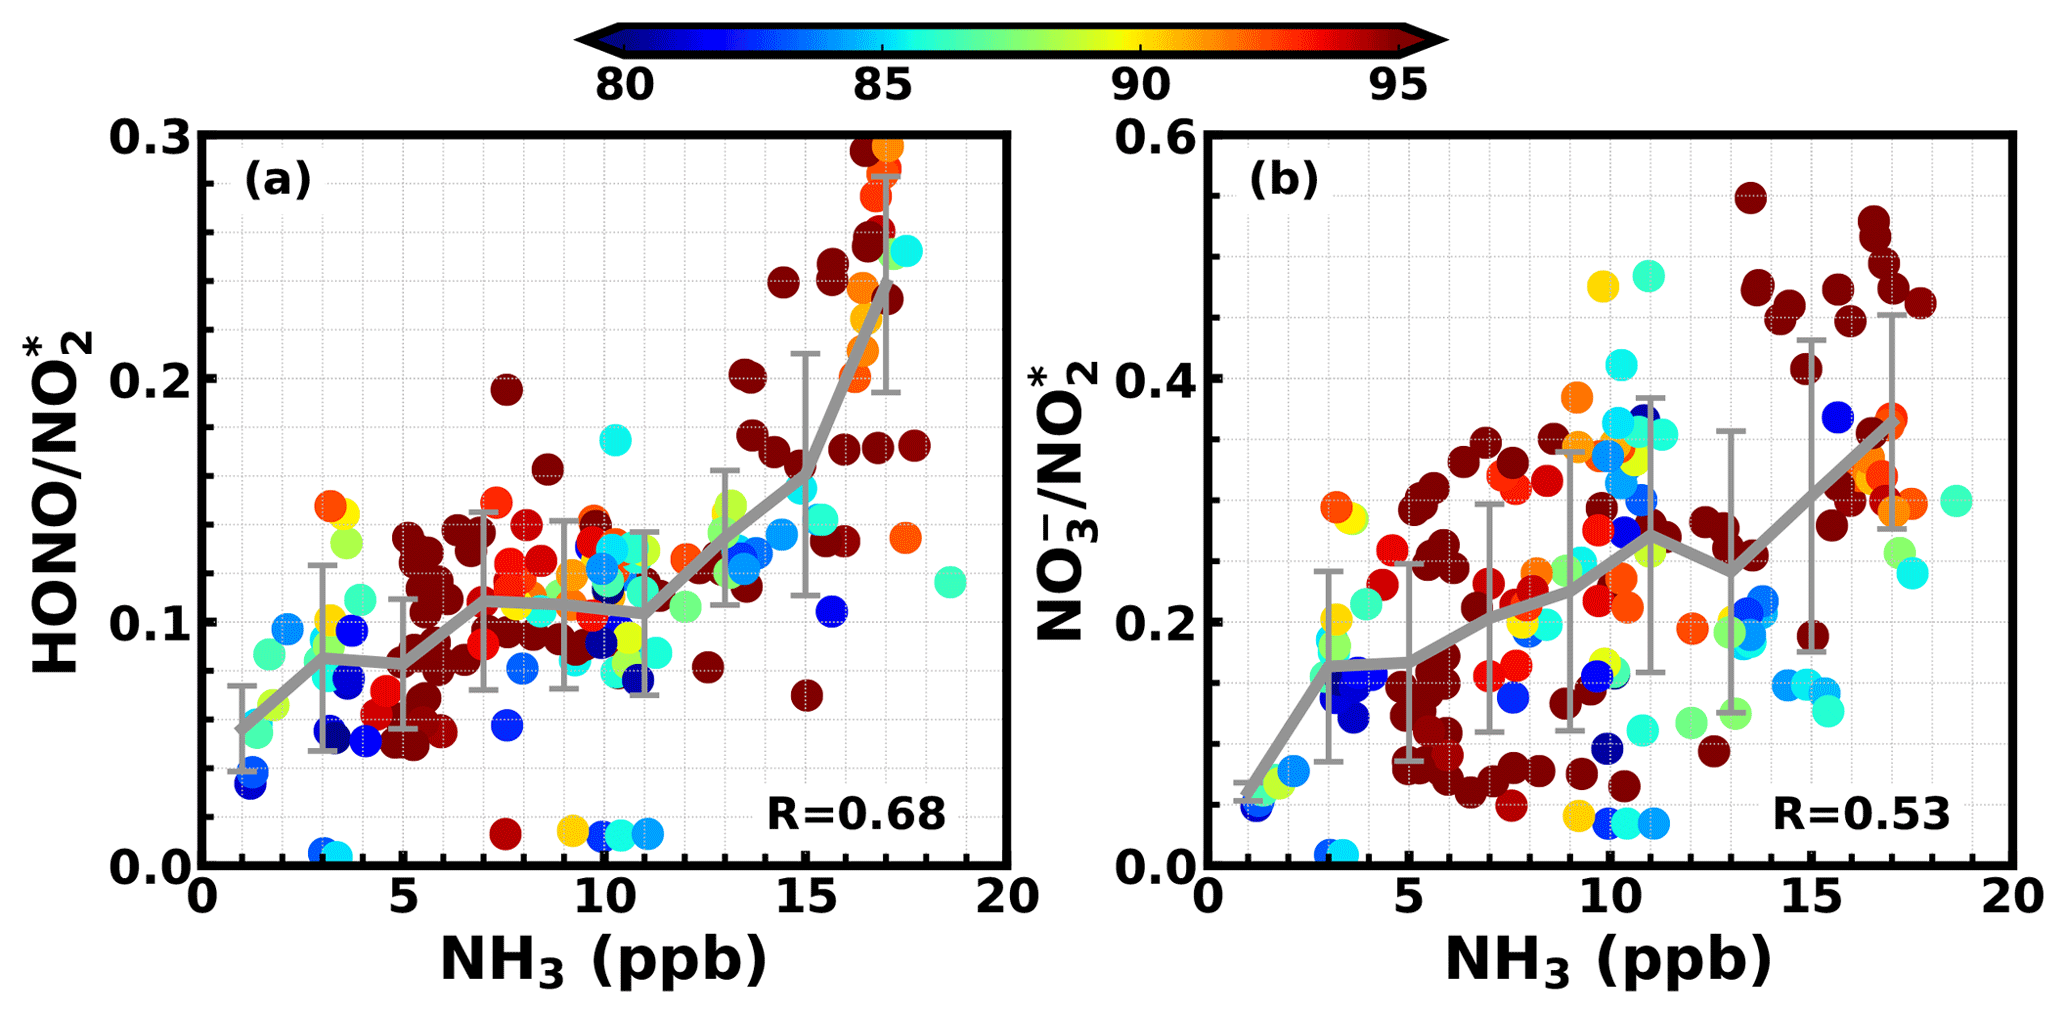
Figure 8The relationship between the NH3 concentration and the (a) ratio and (b) the NH3 concentration and the nitrate/nitrogen dioxide ratio (). Colors of scatter points represent ambient RH values, and the color bar is shown on top of the panels.
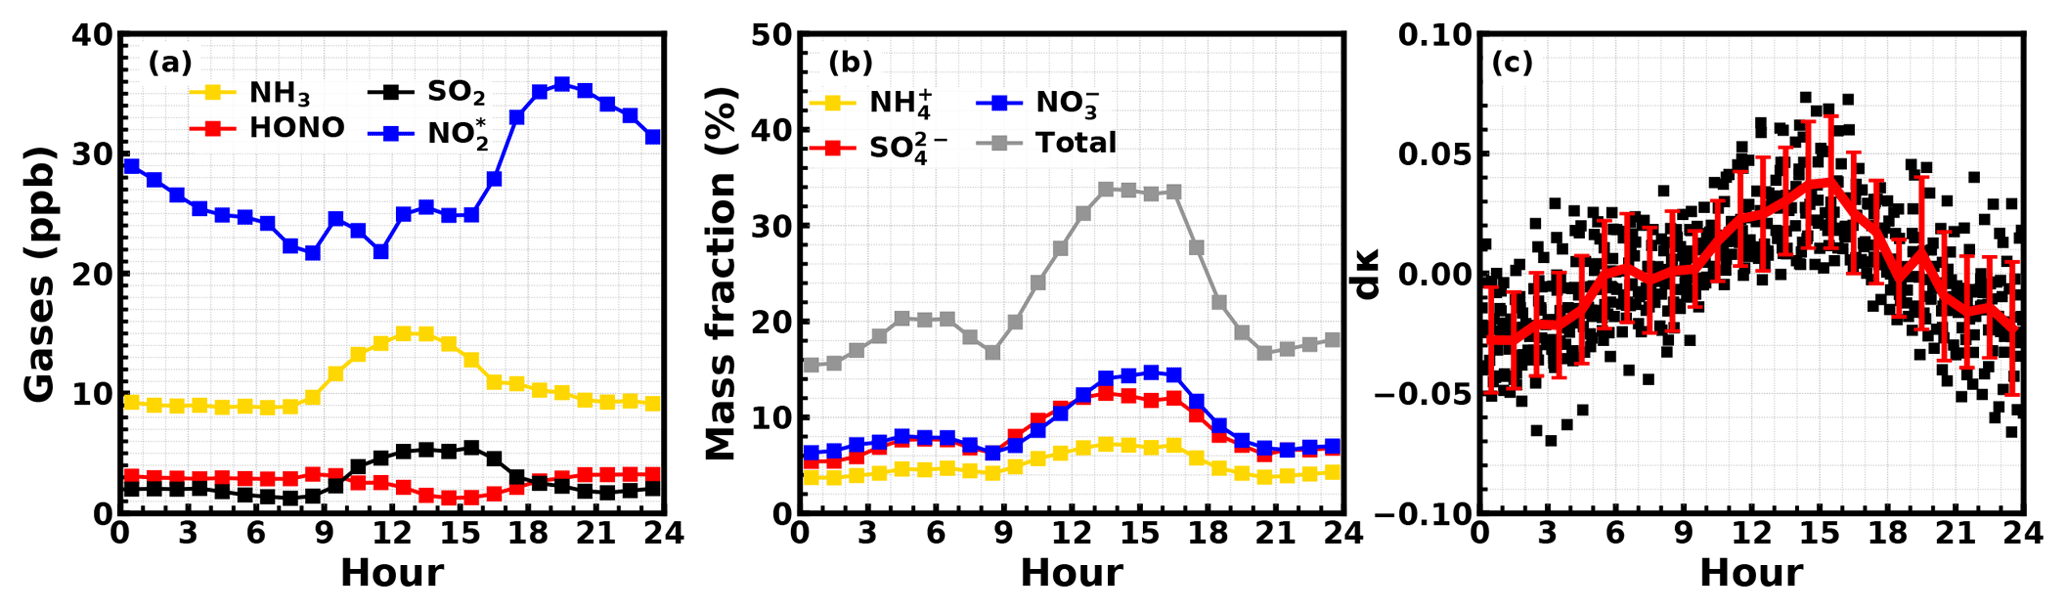
Figure 9(a) Average diurnal variations of gases. (b) The average diurnal variations of the mass fractions of nitrate, sulfate and ammonium. (c) The diurnal variations of aerosol hygroscopicity: dκ is the anomaly to the daily mean κ.
4.3 Feedback between HONO formation and inorganic secondary aerosol formation
According to the discussions in Sect. 4.2, NH3 promotes the hydrolysis of NO2, producing nitrate and most of the observed HONO. However, the connection between the NH3-promoted hydrolysis and the simultaneous rapid sulfate production remains unexplained. As previously discussed in Sect. 4.2, the sulfate production rate calculated based on currently known SO2 oxidation pathways largely underestimates the observed sulfate growth, indicating that there might be neglected oxidation pathways. Li et al. (2018b) pointed out that NO2 can oxidize S(IV) indirectly via a free radical mechanism (Reactions RS1–RS5 proposed in Li et al., 2018b, and listed in the Supplement). The key step of the proposed S(IV) oxidation pathway is the photolysis of HONO to produce OH radicals (Reaction RS1). OH can oxidize S(IV) to form bisulfate or sulfate via Reaction (RS2) and can also produce HO2. HO2 can react with NO to produce NO2, or react with itself to produce H2O2. As depicted in Fig. 6, the radiation during the fog/haze events was already strong enough to photolyze the HONO produced and release OH radicals at the same rates as Lpho in Sect. 4.1, indicating that there was strong OH production, especially near the end of the events. For the two fog events, no AOD measurements were available. Assuming AOD =2.5 for foggy conditions, the lifetime of HONO (only considering the photolysis process) was estimated to decrease from 4.2 to 1.1 h, 1.7 to 1.1 h during the growth of HONO, and to drop to 1.0 and 0.7 h by the time drastic decreases in HONO were noted. During the haze event on the 11 November, AOD measurements were also not available due to cloud coverage; however, a sensitivity study shows that the calculated HONO lifetime is much more sensitive to the AOD than to the COD values (increasing 3.1 and 0.4 h per 0.1 increase in AOD and COD, respectively; Fig. S7). The HONO lifetime dropped from 2.0 h (at the HONO peak) to 1.1 h (at the time of the HONO decrease). During the case on the 14 November 2016, the relative humidity decreased from 100 % (10:00–11:00 LT) to 86 % (11:30 LT), suggesting that this was a fog dissipation process. The HONO lifetime was estimated to be 1.7 h between 10:00 and 11:00 LT, proving that the photolysis process was relatively weaker during the rapid increase of HONO. The estimated HONO lifetime rapidly decreased to 0.6 h by 12:00 LT, resulting in accelerated HONO dissociation and OH production. The increase in H2O2 observed during and after the increase of HONO, might be indirect evidence of HO2 production and the occurrence of Reaction (RS2). The observed H2O2 concentrations were much higher than the assumed value of 0.01 ppb from Cheng et al. (2016), which was also reported by Ye et al. (2018). Under the assumed pH range for fog and the calculated pH range for aerosol, the estimated sulfate production was dominated by SO2 oxidation via H2O2 (Fig. 7). This indicates that both the calculated and the currently unexplained sulfate production were linked to the photolysis of HONO.
NH3 promoted the hydrolysis of NO2, producing HONO and nitrate. HONO easily photolyzes releasing OH radicals, which further convert to HO2 and H2O2. The highly oxidative free radicals and H2O2 collaboratively boosted the formation of sulfate. Hence, diurnal variations of NH3 should have exerted significant influences on the diurnal variations of HONO and inorganic aerosol chemical components (sulfate, nitrate and ammonium – SNA). The average diurnal variations of , NH3, HONO and SO2 concentrations during this field campaign are shown in Fig. 9a. The average HONO concentration at nighttime is higher than that during the day due to the quick photolysis of HONO upon solar irradiation. The NH3 concentration begins to increase in the morning (at approximately 08:00 LT) then reaches a plateau in the afternoon (8.5 to 15.5 ppb on average); the SO2 concentrations show a similar diurnal variation to that of NH3. This type of diurnal variation for SO2 was also found by Xu et al. (2014); however, the cause of the common diurnal pattern between NH3 and SO2 during this field campaign requires further investigation. The concentration increases quickly in the afternoon and decreases in the evening.
As shown in Fig. 9b, the increase of NH3 from morning to the afternoon was accompanied by an increase in the mass fractions of nitrate and sulfate in PM2.5. The mass fractions of different aerosol chemical compositions were obtained using the measured dry-state PNSD to calculate the volume concentration of PM2.5, assuming that the density of aerosols in the dry state is 1.5 g cm−3 (Yin et al., 2015). The results shown in Fig. 9b indicate that the molecular concentration increase in nitrate from the morning to the afternoon is much faster than that of sulfate, again supporting the fact that the NH3-promoted NO2 hydrolysis, which only produces HONO and nitrate directly, was the main contributor to the observed explosive HONO formation. The evident morning increase of inorganic aerosol component fractions resulted in prominent increases of aerosol hygroscopicity, displaying an average κ anomaly of +0.04 during noontime (Fig. 9c). From the morning to the afternoon, the ambient RH decreases quickly; however, the increase of aerosol hygroscopicity can retard the decrease of the aerosol liquid water content and surface area density of ambient aerosols. This might act as a positive feedback, further enhancing the hydrolysis of NO2 as well as nitrate and sulfate formation.
Explosive HONO growth (observed maximum ppb h−1) was observed for the first time on the NCP during fog and haze episodes with high-RH conditions, only occurring with evident increases in NH3, indicating that NH3 is the key factor promoting the hydrolysis of NO2, resulting in rapid HONO and nitrate formation. NH3 concentrations during the observation period exhibited a distinct diurnal variation with an increase in the morning and a peak in the afternoon (8.5 to 15.5 ppb on average). The increase of NH3 promotes the hydrolysis of NO2, giving significant rise to HONO and nitrate concentrations. The HONO produced released OH radicals upon photolysis, which further oxidized SO2 to sulfate via gas-phase and heterogeneous reactions. Therefore, the significant growth of NH3 in the morning determined the increase in nitrate, sulfate and ammonium as well as that of aerosol hygroscopicity, which retards the decrease in the atmospheric liquid water content and further enhances the hydrolysis of NO2 as well as the nitrate and sulfate formation as a positive feedback.
The results in this paper reveal that the NH3-promoted NO2 hydrolysis is a significant source of HONO, especially under polluted conditions, which provides direct insight into the missing daytime source of HONO on the NCP. The results also shed light on the recent controversy regarding how SO2, pH and NH3 are involved in heterogeneous HONO production. It was clarified that SO2 played a minor role in HONO production during fog events and an insignificant role during haze events, and that the observed growth in sulfate was dominantly the byproduct of the HONO photolysis. This once again confirmed the importance of HONO as an OH source and its crucial role in atmospheric chemistry.
These results have demonstrated the critical role and contribution of NH3 in the formation of photochemical and aerosol pollution on the North China Plain. Effective control measures are urgently called for to reduce NH3 emissions, which would simultaneously benefit photochemical and aerosol pollution abatement via the reduction of HONO production.
The data used in this study are available from the corresponding author upon request (kuangye@jnu.edu.cn).
The supplement related to this article is available online at: https://doi.org/10.5194/acp-19-10557-2019-supplement.
WX designed the experiment and YK led the research. YK, JT, GZ, YB, YY, CS and LL were responsible for the aerosol measurements during the experiment, and WY helped with the IGAC measurements. WX made the trace gas measurements with the help of ZG, WL and XX. YK and WX analyzed the data and wrote the paper.
The authors declare that they have no conflict of interest.
This article is part of the special issue “Multiphase chemistry of secondary aerosol formation under severe haze”. It is not associated with a conference.
This work is supported by the National Key R&D Program of China (2016YFC0202300), the National research program for key issues in air pollution control (DQGG0103) and the National Natural Science Foundation of China (41505107 and 41590872). We thank Wei Peng from Beijing Met High-Tech Co., Ltd. for his help with the maintenance of the IGAC instrument.
This research has been supported by the National Key R&D Program of China (grant no. 2016YFC0202300), the National research program for key issues in air pollution control (grant no. DQGG0103), the National Natural Science Foundation of China (grant no. 41505107) and the National Natural Science Foundation of China (grant no. 41590872).
This paper was edited by Aijun Ding and reviewed by three anonymous referees.
Cheng, Y., Zheng, G., Wei, C., Mu, Q., Zheng, B., Wang, Z., Gao, M., Zhang, Q., He, K., Carmichael, G., Pöschl, U., and Su, H.: Reactive nitrogen chemistry in aerosol water as a source of sulfate during haze events in China, Science Advances, 2, e1601530, https://doi.org/10.1126/sciadv.1601530, 2016.
Cui, L., Li, R., Zhang, Y., Meng, Y., Fu, H., and Chen, J.: An observational study of nitrous acid (HONO) in Shanghai, China: The aerosol impact on HONO formation during the haze episodes, Sci. Total Environ., 630, 1057–1070, https://doi.org/10.1016/j.scitotenv.2018.02.063, 2018.
Ding, J., Zhao, P., Su, J., Dong, Q., Du, X., and Zhang, Y.: Aerosol pH and its driving factors in Beijing, Atmos. Chem. Phys., 19, 7939–7954, https://doi.org/10.5194/acp-19-7939-2019, 2019.
Guo, H., Weber, R. J., and Nenes, A.: High levels of ammonia do not raise fine particle pH sufficiently to yield nitrogen oxide-dominated sulfate production, Sci. Rep., 7, 12109, https://doi.org/10.1038/s41598-017-11704-0, 2017.
Huang, R.-J., Yang, L., Cao, J., Wang, Q., Tie, X., Ho, K.-F., Shen, Z., Zhang, R., Li, G., Zhu, C., Zhang, N., Dai, W., Zhou, J., Liu, S., Chen, Y., Chen, J., and O'Dowd, C. D.: Concentration and sources of atmospheric nitrous acid (HONO) at an urban site in Western China, Sci. Total Environ., 593–594, 165–172, https://doi.org/10.1016/j.scitotenv.2017.02.166, 2017.
Kleffmann, J., Gavriloaiei, T., Hofzumahaus, A., Holland, F., Koppmann, R., Rupp, L., Schlosser, E., Siese, M., and Wahner, A.: Daytime formation of nitrous acid: A major source of OH radicals in a forest, Geophys. Res. Lett., 32, L05818, https://doi.org/10.1029/2005GL022524, 2005.
Kuang, Y., Zhao, C. S., Tao, J. C., and Ma, N.: Diurnal variations of aerosol optical properties in the North China Plain and their influences on the estimates of direct aerosol radiative effect, Atmos. Chem. Phys., 15, 5761–5772, https://doi.org/10.5194/acp-15-5761-2015, 2015.
Kuang, Y., Zhao, C., Tao, J., Bian, Y., Ma, N., and Zhao, G.: A novel method for deriving the aerosol hygroscopicity parameter based only on measurements from a humidified nephelometer system, Atmos. Chem. Phys., 17, 6651–6662, https://doi.org/10.5194/acp-17-6651-2017, 2017.
Kuang, Y., Zhao, C. S., Zhao, G., Tao, J. C., Xu, W., Ma, N., and Bian, Y. X.: A novel method for calculating ambient aerosol liquid water content based on measurements of a humidified nephelometer system, Atmos. Meas. Tech., 11, 2967–2982, https://doi.org/10.5194/amt-11-2967-2018, 2018.
Li, G., Lei, W., Zavala, M., Volkamer, R., Dusanter, S., Stevens, P., and Molina, L. T.: Impacts of HONO sources on the photochemistry in Mexico City during the MCMA-2006/MILAGO Campaign, Atmos. Chem. Phys., 10, 6551–6567, https://doi.org/10.5194/acp-10-6551-2010, 2010.
Li, L., Duan, Z., Li, H., Zhu, C., Henkelman, G., Francisco, J. S., and Zeng, X. C.: Formation of HONO from the NH3-promoted hydrolysis of NO2-dimers in the atmosphere, P. Natl. Acad. Sci. USA, 115, 7236–7241, https://doi.org/10.1073/pnas.1807719115, 2018a.
Li, L., Hoffmann, M. R., and Colussi, A. J.: Role of Nitrogen Dioxide in the Production of Sulfate during Chinese Haze-Aerosol Episodes, Environ. Sci. Technol., 52, 2686–2693, https://doi.org/10.1021/acs.est.7b05222, 2018b.
Li, X., Brauers, T., Häseler, R., Bohn, B., Fuchs, H., Hofzumahaus, A., Holland, F., Lou, S., Lu, K. D., Rohrer, F., Hu, M., Zeng, L. M., Zhang, Y. H., Garland, R. M., Su, H., Nowak, A., Wiedensohler, A., Takegawa, N., Shao, M., and Wahner, A.: Exploring the atmospheric chemistry of nitrous acid (HONO) at a rural site in Southern China, Atmos. Chem. Phys., 12, 1497–1513, https://doi.org/10.5194/acp-12-1497-2012, 2012.
Liu, M., Song, Y., Zhou, T., Xu, Z., Yan, C., Zheng, M., Wu, Z., Hu, M., Wu, Y., and Zhu, T.: Fine particle pH during severe haze episodes in northern China, Geophys. Res. Lett., 44, 5213–5221, https://doi.org/10.1002/2017GL073210, 2017a.
Liu, Y., Wu, Z., Wang, Y., Xiao, Y., Gu, F., Zheng, J., Tan, T., Shang, D., Wu, Y., Zeng, L., Hu, M., Bateman, A. P., and Martin, S. T.: Submicrometer Particles Are in the Liquid State during Heavy Haze Episodes in the Urban Atmosphere of Beijing, China, Environ. Sci. Tech. Let., 4, 427–432, https://doi.org/10.1021/acs.estlett.7b00352, 2017b.
Liu, Z., Wang, Y., Costabile, F., Amoroso, A., Zhao, C., Huey, L. G., Stickel, R., Liao, J., and Zhu, T.: Evidence of Aerosols as a Media for Rapid Daytime HONO Production over China, Environ. Sci. Technol., 48, 14386–14391, https://doi.org/10.1021/es504163z, 2014.
Lu, C., Niu, S., Tang, L., Lv, J., Zhao, L., and Zhu, B.: Chemical composition of fog water in Nanjing area of China and its related fog microphysics, Atmos. Res., 97, 47–69, https://doi.org/10.1016/j.atmosres.2010.03.007, 2010.
Lu, K., Guo, S., Tan, Z., Wang, H., Shang, D., Liu, Y., Li, X., Wu, Z., Hu, M., and Zhang, Y.: Exploring atmospheric free-radical chemistry in China: the self-cleansing capacity and the formation of secondary air pollution, Natl. Sci. Rev., 1–16, https://doi.org/10.1093/nsr/nwy073, 2018.
Meng, Z., Xu, X., Lin, W., Ge, B., Xie, Y., Song, B., Jia, S., Zhang, R., Peng, W., Wang, Y., Cheng, H., Yang, W., and Zhao, H.: Role of ambient ammonia in particulate ammonium formation at a rural site in the North China Plain, Atmos. Chem. Phys., 18, 167–184, https://doi.org/10.5194/acp-18-167-2018, 2018.
Michoud, V., Colomb, A., Borbon, A., Miet, K., Beekmann, M., Camredon, M., Aumont, B., Perrier, S., Zapf, P., Siour, G., Ait-Helal, W., Afif, C., Kukui, A., Furger, M., Dupont, J. C., Haeffelin, M., and Doussin, J. F.: Study of the unknown HONO daytime source at a European suburban site during the MEGAPOLI summer and winter field campaigns, Atmos. Chem. Phys., 14, 2805–2822, https://doi.org/10.5194/acp-14-2805-2014, 2014.
Nie, W., Ding, A. J., Xie, Y. N., Xu, Z., Mao, H., Kerminen, V.-M., Zheng, L. F., Qi, X. M., Huang, X., Yang, X.-Q., Sun, J. N., Herrmann, E., Petäjä, T., Kulmala, M., and Fu, C. B.: Influence of biomass burning plumes on HONO chemistry in eastern China, Atmos. Chem. Phys., 15, 1147–1159, https://doi.org/10.5194/acp-15-1147-2015, 2015.
Petters, M. D. and Kreidenweis, S. M.: A single parameter representation of hygroscopic growth and cloud condensation nucleus activity, Atmos. Chem. Phys., 7, 1961–1971, https://doi.org/10.5194/acp-7-1961-2007, 2007.
Ran, L., Zhao, C. S., Xu, W. Y., Lu, X. Q., Han, M., Lin, W. L., Yan, P., Xu, X. B., Deng, Z. Z., Ma, N., Liu, P. F., Yu, J., Liang, W. D., and Chen, L. L.: VOC reactivity and its effect on ozone production during the HaChi summer campaign, Atmos. Chem. Phys., 11, 4657–4667, https://doi.org/10.5194/acp-11-4657-2011, 2011.
Safai, P. D., Kewat, S., Pandithurai, G., Praveen, P. S., Ali, K., Tiwari, S., Rao, P. S. P., Budhawant, K. B., Saha, S. K., and Devara, P. C. S.: Aerosol characteristics during winter fog at Agra, North India, J. Atmos. Chem., 61, 101–118, https://doi.org/10.1007/s10874-009-9127-4, 2008.
Shao, J., Chen, Q., Wang, Y., Lu, X., He, P., Sun, Y., Shah, V., Martin, R. V., Philip, S., Song, S., Zhao, Y., Xie, Z., Zhang, L., and Alexander, B.: Heterogeneous sulfate aerosol formation mechanisms during wintertime Chinese haze events: air quality model assessment using observations of sulfate oxygen isotopes in Beijing, Atmos. Chem. Phys., 19, 6107–6123, https://doi.org/10.5194/acp-19-6107-2019, 2019.
Shen, C., Zhao, C., Ma, N., Tao, J., Zhao, G., Yu, Y., and Kuang, Y.: Method to Estimate Water Vapor Supersaturation in the Ambient Activation Process Using Aerosol and Droplet Measurement Data, J. Geophys. Res.-Atmos., 123, 10606–10619, https://doi.org/10.1029/2018JD028315, 2018.
Song, S., Gao, M., Xu, W., Shao, J., Shi, G., Wang, S., Wang, Y., Sun, Y., and McElroy, M. B.: Fine-particle pH for Beijing winter haze as inferred from different thermodynamic equilibrium models, Atmos. Chem. Phys., 18, 7423–7438, https://doi.org/10.5194/acp-18-7423-2018, 2018.
Stutz, J., Alicke, B., and Neftel, A.: Nitrous acid formation in the urban atmosphere: Gradient measurements of NO2 and HONO over grass in Milan, Italy, J. Geophys. Res.-Atmos., 107, LOP 5-1–LOP 5-15, https://doi.org/10.1029/2001JD000390, 2002.
Su, H., Cheng, Y., Oswald, R., Behrendt, T., Trebs, I., Meixner, F. X., Andreae, M. O., Cheng, P., Zhang, Y., and Pöschl, U.: Soil Nitrite as a Source of Atmospheric HONO and OH Radicals, Science, 333, 1616–1618, https://doi.org/10.1126/science.1207687, 2011.
Teng, X., Hu, Q., Zhang, L., Qi, J., Shi, J., Xie, H., Gao, H., and Yao, X.: Identification of Major Sources of Atmospheric NH3 in an Urban Environment in Northern China During Wintertime, Environ. Sci. Technol., 51, 6839–6848, https://doi.org/10.1021/acs.est.7b00328, 2017.
Vogel, B., Vogel, H., Kleffmann, J., and Kurtenbach, R.: Measured and simulated vertical profiles of nitrous acid – Part II. Model simulations and indications for a photolytic source, Atmos. Environ., 37, 2957–2966, https://doi.org/10.1016/S1352-2310(03)00243-7, 2003.
Wang, G., Zhang, R., Gomez, M. E., Yang, L., Levy Zamora, M., Hu, M., Lin, Y., Peng, J., Guo, S., Meng, J., Li, J., Cheng, C., Hu, T., Ren, Y., Wang, Y., Gao, J., Cao, J., An, Z., Zhou, W., Li, G., Wang, J., Tian, P., Marrero-Ortiz, W., Secrest, J., Du, Z., Zheng, J., Shang, D., Zeng, L., Shao, M., Wang, W., Huang, Y., Wang, Y., Zhu, Y., Li, Y., Hu, J., Pan, B., Cai, L., Cheng, Y., Ji, Y., Zhang, F., Rosenfeld, D., Liss, P. S., Duce, R. A., Kolb, C. E., and Molina, M. J.: Persistent sulfate formation from London Fog to Chinese haze, P. Natl. Acad Sci. USA, 113, 13630–13635, https://doi.org/10.1073/pnas.1616540113, 2016.
Whalley, L. K., Stone, D., George, I. J., Mertes, S., van Pinxteren, D., Tilgner, A., Herrmann, H., Evans, M. J., and Heard, D. E.: The influence of clouds on radical concentrations: observations and modelling studies of HOx during the Hill Cap Cloud Thuringia (HCCT) campaign in 2010, Atmos. Chem. Phys., 15, 3289–3301, https://doi.org/10.5194/acp-15-3289-2015, 2015.
Wu, Z., Wang, Y., Tan, T., Zhu, Y., Li, M., Shang, D., Wang, H., Lu, K., Guo, S., Zeng, L., and Zhang, Y.: Aerosol Liquid Water Driven by Anthropogenic Inorganic Salts: Implying Its Key Role in Haze Formation over the North China Plain, Environ. Sci. Tech. Lett., 5, 160–166, https://doi.org/10.1021/acs.estlett.8b00021, 2018.
Xing, J., Ding, D., Wang, S., Zhao, B., Jang, C., Wu, W., Zhang, F., Zhu, Y., and Hao, J.: Quantification of the enhanced effectiveness of NOx control from simultaneous reductions of VOC and NH3 for reducing air pollution in the Beijing–Tianjin–Hebei region, China, Atmos. Chem. Phys., 18, 7799–7814, https://doi.org/10.5194/acp-18-7799-2018, 2018.
Xu, W. Y., Zhao, C. S., Ran, L., Lin, W. L., Yan, P., and Xu, X. B.: SO2 noontime-peak phenomenon in the North China Plain, Atmos. Chem. Phys., 14, 7757–7768, https://doi.org/10.5194/acp-14-7757-2014, 2014.
Xue, L. K., Wang, T., Gao, J., Ding, A. J., Zhou, X. H., Blake, D. R., Wang, X. F., Saunders, S. M., Fan, S. J., Zuo, H. C., Zhang, Q. Z., and Wang, W. X.: Ground-level ozone in four Chinese cities: precursors, regional transport and heterogeneous processes, Atmos. Chem. Phys., 14, 13175–13188, https://doi.org/10.5194/acp-14-13175-2014, 2014.
Yabushita, A., Enami, S., Sakamoto, Y., Kawasaki, M., Hoffmann, M. R., and Colussi, A. J.: Anion-Catalyzed Dissolution of NO2 on Aqueous Microdroplets, J. Phys. Chem. A, 113, 4844–4848, https://doi.org/10.1021/jp900685f, 2009.
Ye, C., Liu, P., Ma, Z., Xue, C., Zhang, C., Zhang, Y., Liu, J., Liu, C., Sun, X., and Mu, Y.: High H2O2 Concentrations Observed during Haze Periods during the Winter in Beijing: Importance of H2O2 Oxidation in Sulfate Formation, Environ. Sci. Tech. Lett., 5, 757–763, https://doi.org/10.1021/acs.estlett.8b00579, 2018.
Yin, Z., Ye, X., Jiang, S., Tao, Y., Shi, Y., Yang, X., and Chen, J.: Size-resolved effective density of urban aerosols in Shanghai, Atmos. Environ., 100, 133–140, https://doi.org/10.1016/j.atmosenv.2014.10.055, 2015.
Young, L.-H., Li, C.-H., Lin, M.-Y., Hwang, B.-F., Hsu, H.-T., Chen, Y.-C., Jung, C.-R., Chen, K.-C., Cheng, D.-H., Wang, V.-S., Chiang, H.-C., and Tsai, P.-J.: Field performance of a semi-continuous monitor for ambient PM2.5 water-soluble inorganic ions and gases at a suburban site, Atmos. Environ., 144, 376–388, https://doi.org/10.1016/j.atmosenv.2016.08.062, 2016.
Zhang, W., Tong, S., Ge, M., An, J., Shi, Z., Hou, S., Xia, K., Qu, Y., Zhang, H., Chu, B., Sun, Y., and He, H.: Variations and sources of nitrous acid (HONO) during a severe pollution episode in Beijing in winter 2016, Sci. Total Environ., 648, 253–262, https://doi.org/10.1016/j.scitotenv.2018.08.133, 2019.
Zheng, G. J., Duan, F. K., Su, H., Ma, Y. L., Cheng, Y., Zheng, B., Zhang, Q., Huang, T., Kimoto, T., Chang, D., Pöschl, U., Cheng, Y. F., and He, K. B.: Exploring the severe winter haze in Beijing: the impact of synoptic weather, regional transport and heterogeneous reactions, Atmos. Chem. Phys., 15, 2969–2983, https://doi.org/10.5194/acp-15-2969-2015, 2015.
- Abstract
- Introduction
- Site description and instrumentation
- Observed simultaneous rapid increase of HONO, nitrate and sulfate
- Discussions
- Summary and atmospheric implications
- Data availability
- Author contributions
- Competing interests
- Special issue statement
- Acknowledgements
- Financial support
- Review statement
- References
- Supplement