the Creative Commons Attribution 4.0 License.
the Creative Commons Attribution 4.0 License.
 | 01 Jun 2018
Particle and VOC emission factor measurements for anthropogenic sources in West Africa
Cathy Liousse
Véronique Yoboué
Pamela Dominutti
Benjamin Guinot
Eric-Michel Assamoi
Agnès Borbon
Sophie L. Haslett
Laetitia Bouvier
Aurélie Colomb
Aristide Akpo
Jacques Adon
Julien Bahino
Madina Doumbia
Julien Djossou
Corinne Galy-Lacaux
Eric Gardrat
Sylvain Gnamien
Jean F. Léon
Money Ossohou
E. Touré N'Datchoh
Laurent Roblou
A number of campaigns have been carried out to establish the emission factors of pollutants from fuel combustion in West Africa, as part of work package 2 (“Air Pollution and Health”) of the DACCIWA (Dynamics-Aerosol-Chemistry-Cloud Interactions in West Africa) FP7 program. Emission sources considered here include wood (hevea and iroko) and charcoal burning, charcoal making, open trash burning, and vehicle emissions, including trucks, cars, buses and two-wheeled vehicles. Emission factors of total particulate matter (TPM), elemental carbon (EC), primary organic carbon (OC) and volatile organic compounds (VOCs) have been established. In addition, emission factor measurements were performed in combustion chambers in order to reproduce field burning conditions for a tropical hardwood (hevea), and obtain particulate emission factors by size (PM0.25, PM1, PM2.5 and PM10). Particle samples were collected on quartz fiber filters and analyzed using gravimetric method for TPM and thermal methods for EC and OC. The emission factors of 58 VOC species were determined using offline sampling on a sorbent tube. Emission factor results for two species of tropical hardwood burning of EC, OC and TPM are 0.98 ± 0.46 g kg−1 of fuel burned (g kg−1), 11.05 ± 4.55 and 41.12 ± 24.62 g kg−1, respectively. For traffic sources, the highest emission factors among particulate species are found for the two-wheeled vehicles with two-stroke engines (2.74 g kg−1 fuel for EC, 65.11 g kg−1 fuel for OC and 496 g kg−1 fuel for TPM). The largest VOC emissions are observed for two-stroke two-wheeled vehicles, which are up to 3 times higher than emissions from light-duty and heavy-duty vehicles. Isoprene and monoterpenes, which are usually associated with biogenic emissions, are present in almost all anthropogenic sources investigated during this work and could be as significant as aromatic emissions in wood burning (1 g kg−1 fuel). EC is primarily emitted in the ultrafine fraction, with 77 % of the total mass being emitted as particles smaller than 0.25 µm. The particles and VOC emission factors obtained in this study are generally higher than those in the literature whose values are discussed in this paper. This study underlines the important role of in situ measurements in deriving realistic and representative emission factors.
- Article
(2253 KB) - Full-text XML
-
Supplement
(671 KB) - BibTeX
- EndNote


Air pollution and its consequences on air quality, human health and climate are particularly worrying in Africa. First, there is a rich mixture of sources of pollutants: natural sources with Sahelian and Saharan dust emissions combine with anthropogenic sources including biomass burning, traffic, industry, residential cooking, power plant emissions and others. To date, dust and biomass burning have been considered to be predominant and many studies have been conducted on these sources. A few studies only deal with anthropogenic sources. Andreae and Merlet (2001) have shown that domestic fires used for cooking are an important source of primary particle carbon worldwide and particularly in Africa. The main sources of energy in households in Africa are solid fuels such as charcoal, agricultural residues and wood (Wang et al., 2013): in Sub-Saharan Africa, these biofuels represent approximatively 80 % of the total energy consumption (Ozturk and Bilgili, 2015). Traffic emissions are also expected to be important due to the type of engine, its maintenance, its age and the fuel it uses (Robert et al., 2007; Peltier et al., 2011). Indeed, the traffic fleet in Africa is characterized by an aging fleet (more than 80 % are second-hand vehicles, with 73 % older than 10 years) (Kablan, 2010; Essoh, 2013). In Côte d'Ivoire, most of these vehicles are more than 20 years old (Ministry of Transport, 2012) and are as such highly polluting due to inefficient combustion (Boughedaoui et al., 2009). Also, there is a difference in fuel quality used in traffic between Africa and developed countries. The UNEP (2017) reports shows that in developing countries the average sulfur levels of fuel used in traffic (particularly diesel fuels) are high and may even reach 10 000 ppm, while developed countries have reduced fuel sulfur levels to 10 parts per million (ppm). In some African countries, it is also necessary to note the importance of two-wheeled vehicles (two-stroke or four-stroke engines) which use a mixture of oil and gasoline derived from smuggling that is very polluting (Assamoi and Liousse, 2010). Finally, very high levels of pollutants are associated with trash-burning emissions and this source has not been well studied in Africa. In most African countries, solid waste collection systems are insufficient, leading some people to dispose of waste using open burning (Wiedinmyer et al., 2014). In many African countries, open burning occurs at public landfills due to the lack of a modern incinerator.
All these anthropogenic sources are expected to increase in the next decades due to urbanization and population density increases. In Marticorena et al. (2010) it has been seen that they can be as important as the “well-known” dust and biomass burning sources. In Liousse et al. (2014), it may be underlined that they could be higher than Asian emissions in 2030 if no regulation occurs as quickly as possible.
One approach for quantifying air pollution and impacts, and formulating emission reduction strategies, is to use atmospheric modeling tools which require emission inventories as source data (Bond et al., 2004; Junker and Liousse, 2008; Granier et al., 2011; Smith et al., 2011; Klimont et al., 2013). Emission inventories are built based on activity and pollutant emission factor (EF) data. However, the above-mentioned sources are not well documented, especially in terms of particle carbon and volatile organic compound (VOC) EFs, leading to a scarcity of emission factors for these sources. Indeed, biomass burning EFs for a number of gaseous and particulate species have been compiled by Andreae and Merlet (2001) and Akagi et al. (2011), showing that many studies have been carried out in Africa since 1994. However, the literature shows only a few EF measurement studies on anthropogenic sources. Most existing works in that area have mainly focused on biofuel combustion. For example, particle and gas EF measurements for wood cooking fires have been performed by Brocard (1996) and Brocard et al. (1998) in Côte d'Ivoire and by Bertschi et al. (2003) in Zambia. Particle and gas EF measurements have also been performed by Bertschi et al. (2003), Brocard et al. (1998) and Kituyi et al. (2001) for charcoal cooking fire and by Pennise et al. (2001), Lacaux et al. (1994), Cachier et al. (1996) and Brocard et al. (1998) for charcoal-making fire. Unfortunately, such studies are only done for a few pollutants. To our knowledge, EF measurements for traffic vehicles in Africa are very scarce.
As a consequence, existing emission inventories for Africa extracted from global emission products use inadequate emission factors, which are not measured in Africa and consequently which are not relevant to specific fuels and combustions, and inadequate activity consumption data given by international agencies (e.g., UN, IEA). Even in the existing African Regional Inventory of Liousse et al. (2014), literature EFs issued from US or European emissions and not relevant for Africa have been sometimes used, leading to many uncertainties (Assamoi and Liousse, 2010). Moreover, if the emission inventory uncertainties result from uncertainties in the activity and emission factor data (Liousse et al., 2014; Bond et al., 2013; Zhang and Tao, 2009; Zhao et al., 2011), uncertainties are also linked to spatial keys used to geographically distribute pollutant emissions. Therefore, the use of local activity data, emission factors and adapted spatial keys derived from local measurements on Africa-specific sources may help to reduce uncertainties in emission inventories.
In Africa, the most recent regional African inventory has shown that black or elemental carbon (BC or EC) emissions are dominated by the use of diesel fuels, animal waste, fuelwood, charcoal making and coal (Liousse et al., 2014). However, animal waste, charcoal making, fuelwood and two-wheeled-vehicle fuels mostly affect organic carbon (OC) emissions. Liousse et al. (2014) also showed that West Africa has maximum emissions in the domestic and traffic sectors for EC, OC, carbon monoxide, nitrogen oxides and volatile organic compound species due to combustion of the fuels mentioned above.
In terms of pollutants from combustion process, it is necessary to focus on carbonaceous particles (OC and EC) since carbonaceous particles are the main constituents of the particle phase from combustion activity emissions. It is also interesting to study VOCs since the emission factors of these components are not well known despite their expected impact on air quality and climate through their effects on ozone and secondary organic aerosol (SOA) formation (Matsui et al., 2009; Yokelson et al., 2009; Sharma et al., 2015).
In this context, our study was to conduct several campaigns to measure EFs for the above-mentioned important sources and pollutants. Such a study is fully included in the frame of the Dynamics-Aerosol-Chemistry-Cloud Interactions in West Africa (DACCIWA) program (Knippertz et al., 2015). DACCIWA aims to quantify the influence of anthropogenic and natural emissions on air quality, clouds and rainfall over southern West Africa and assess their impacts on human and ecosystem health as well as agricultural productivity. One of its aims is to develop an emission inventory of anthropogenic sources specific to this region.
The work here presented aims to provide a database of EFs for total particulate matter (TPM) mass, elemental carbon (EC), organic carbon (OC) and combustion gases (VOC) for pollution sources specific to Africa. The focus is on domestic fires using wood and charcoal mostly for cooking, charcoal making and solid trash disposal by open fires. Emissions related specifically to road traffic come from studies on vehicle categories (light duty and heavy duty), energy (gasoline or diesel engine), use (private and public transport) and age (old and recent).
In Sect. 2, this paper describes the material and the methodology used to calculate EFs of the main studied African emissions sources. Section 3 deals with the analysis of samples, whereas Sect. 4 presents the EF results of field measurements, including a comparison with literature values. In this section, combustion chamber measurements of EF are also added.
Two types of measurements were carried out in this study for emission factor measurement experiments: field measurements for all studied sources and combustion chamber measurements for fuelwood sources.
2.1 Emission factors
Emission factors are defined as the amount of pollutant emitted per kilogram of burned fuel. EFs are determined using the carbon balance method (Ferek et al., 1998; Radke et al., 1988; Ward and Radke, 1993). The amount of carbon emitted to the atmosphere during combustion and that contained in each fuel allow an estimation of the amount of fuel burned. Previous studies (Hall et al., 2012; Chen et al., 2007; Gupta et al., 2001) have shown that, during fuel combustion, approximately 95 % of carbon is emitted into the atmosphere as carbon dioxide (CO2) and carbon monoxide (CO). It is therefore reasonable to estimate the emitted amount of carbon from CO and CO2 concentrations by neglecting hydrocarbons and particles, implying a minor overestimation of EF values (Pant and Harrison, 2013; Hall et al., 2012; Chen et al., 2007; Gupta et al., 2001; Yokelson et al., 2007; Shen et al., 2010; Roden et al., 2006). The EFs are determined from concentration measurements in the plume and in ambient air outside the emission sources. Emissions factors are then calculated as follows:
where EF (x) is the emission factor of the pollutant x in grams per kilogram fuel burned (g kg−1), is the mixing ratio of x in fresh smoke plume and background air, respectively (it is noted that ambient concentrations of TPM, EC, OC and VOC before combustion are assumed to be zero), MMx is the molar mass of x (g mol−1), 12 is the molar mass of carbon (g mol−1) and fc is the mass fraction of carbon in the fuel.
The modified combustion efficiency (MCE) is defined as
The ratio ΔCO ∕ ΔCO2 and MCE both depend on the relative importance of the two main phases of combustion: the flaming and smoldering phases. The flaming phase is characterized by very high-temperature combustion and oxygenation, and the smoldering phase by low temperature and oxygenation (Ward and Radke, 1993). Higher ΔCO ∕ ΔCO2 or lower MCE indicates more smoldering (Ward and Radke, 1993). From laboratory tests on biomass burning, several authors have demonstrated that MCE is around 0.99 for pure flaming (Chen et al., 2007; Yokelson et al., 1996) and varies between 0.65 and 0.85 for smoldering (Akagi et al., 2011). In this study, an average MCE was determined for each studied source from measurements.
Combustion chamber EFs were calculated using the carbon balance method with Eq. (1). However, using AMS and SP2 data collected in the Edinburgh combustion chamber the following equation was used:
In Eq. (3), EF (x) is the emission factor of the pollutant x in g kg−1 fuel burned, [Cx]smoke and [Cx]background are the concentration of x in the fresh smoke plume and the background air, respectively, Qchamber is the air flow entering the chamber, t is the sampling time and mburned is the mass of burned fuel.
2.2 Description of field measurements
Three field campaigns of emission factor measurements were performed as part of DACCIWA work package 2: the first in March 2015 in Abidjan (Côte d'Ivoire), the second in July 2015 in both Abidjan and Cotonou (Benin), and the third in July 2016, also in Abidjan. Locations for these field measurements are shown on a map in Supplement Fig. S1. During these campaigns, several sources were studied.
-
Open trash burning: in each eight different locations chosen to represent the combustion of waste diversity (dry, wet, old or fresh waste), trash-burning plumes were sampled at “Akouédo” landfill, the largest (153 ha) and the official landfill site in the east of Abidjan District.
-
Charcoal- and wood-burning fire: eight samplings were carried out for charcoal-burning EFs, including six in Abidjan and two in Cotonou. For wood-burning EFs, four measurements were carried out in Abidjan using two different species of tropical African hardwood, hevea (Hevea brasiliensis) and iroko (Milicia excelsa). Note that hevea and iroko are both hardwood but with different properties; for example, their density differs (600 and 650 kg m−3, respectively). Both are mainly used in urban areas for residential cooking, heating and in other services (bakeries, power plants, etc.). During these measurements, wood and charcoal were burned in two types of stoves traditionally used in the West African region for cooking, made of metal and of baked earth (see Fig. S2). These measurements include different phases of combustion (pyrolysis, flaming and smoldering).
-
Charcoal-making fire (CHM): eight tests were carried out on traditional charcoal-making furnaces; three of these eight tests were carried out in the outskirts of Abidjan and five tests in a rural area at 2 km from the Lamto geophysical station (Lamto is 260 km from Abidjan). The CHM kiln was prepared by charcoal producers who use all types of available dense wood. The kiln was covered with a layer of leaves and a layer of earth of about 10 cm thick. The draft, needed for the propagation of the pyrolysis, comes from air circulation between the base of the kiln and a row of holes made in a horizontal plane, which are closed when the charcoal producers open a new row below the previous one. The smoke was sampled at the holes made in the CHM kiln.
-
Combustion of fossil fuels in the traffic sector: EF measurements were carried out on several vehicle exhausts in Abidjan and Cotonou: cars, buses, trucks, mopeds, and gasoline and diesel vehicles. Both recent (under 10 years) and old vehicles (over 10 years) have been studied. For each type of vehicle, at least two tests were performed, simulating several engine speeds.
During these various measurements, samples were taken in the plume at around 1–1.5 m from the source, except for vehicles where samples were taken at the tailpipe outlet. The different EF values of the different tests are averaged for each source. For road traffic EFs, we also calculated a mean equivalent vehicle EF for both four-wheeled gasoline and diesel fleets using fleet characteristics given by Direction Generale des Transports Terrestres (DGTT) of Côte d'Ivoire: 60 % of total vehicles are considered as old models (whereas 40 % are recent ones) and 77 % of total vehicles are light-duty vehicles (whereas 23 % are heavy-duty vehicles) (SIE CI, 2010).
As with four-wheeled vehicles, we calculated an average equivalent vehicle for two-wheeled fleets assuming that 40 % are two-stroke engines (whereas 60 % are four-stroke engines) and 40 % are recent vehicles (whereas 60 % are older vehicles).
2.3 Field measurement and sampling equipment
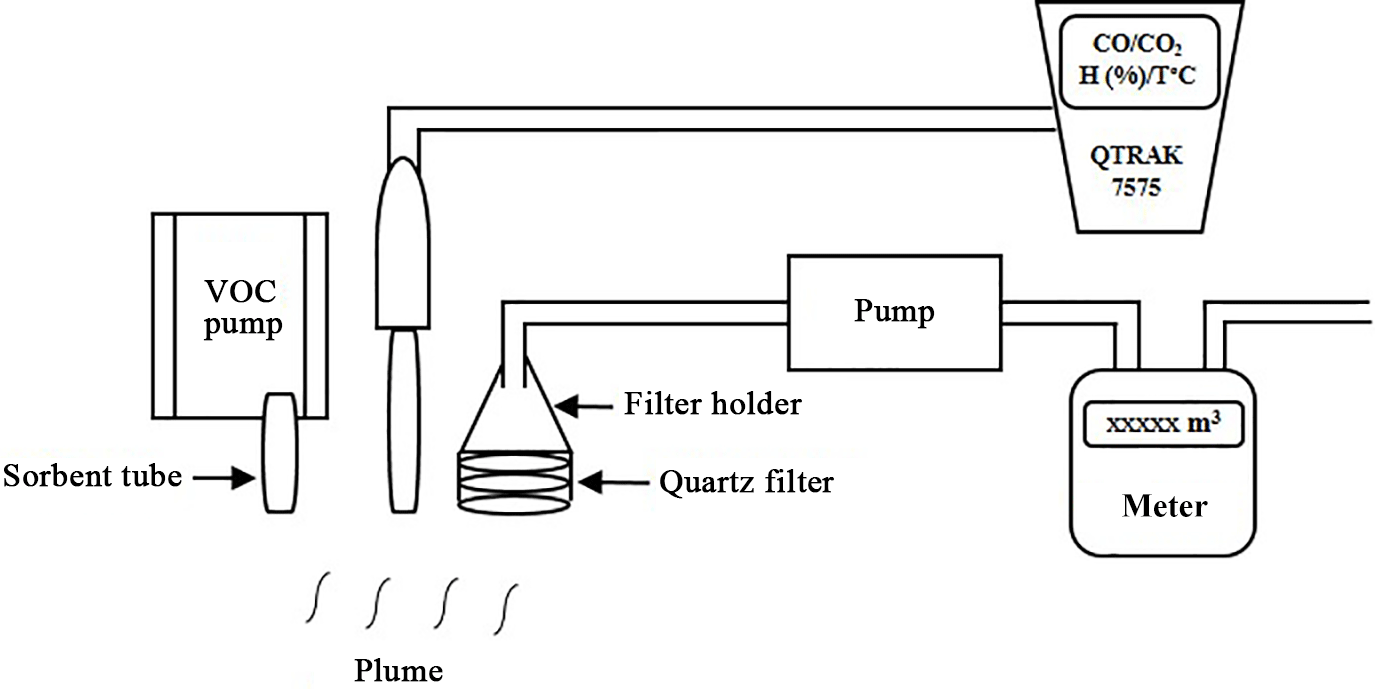
Two types of sampling were performed during our EF measurement experiments: collection of particles on Whatman quartz fiber filters and speciated VOCs (alkanes, alkene, carbonyl and aromatic compounds) on sorbent tubes. Figure 1 shows the particles and VOC schematic sampling system in the field. According to Eq. (1), it is necessary to quantify the amounts of CO2 and CO emitted to the atmosphere to determine the amount of carbon emitted during the combustion and calculate the MCE. The QTRAK-7575 (Kam et al., 2011; Li et al., 2017), developed by TSI, was used to measure CO2 and CO gas concentrations. This allows the measurement of real-time atmospheric CO2 and CO concentrations. The CO concentration is determined using an electrochemical sensor with a sensitivity of 0 to 500 ppm with ±3 % accuracy. The CO2 concentration is measured using a non-dispersive infrared detector with a sensitivity of 0 to 5000 ppm with an accuracy of ±3 %. The QTRAK-7575 was calibrated in the laboratory prior to each field measurement. The difference between CO2 and CO in the fresh smoke plume and the background air allowed the amount of carbon emitted into the atmosphere during each sampling to be obtained.
VOCs were actively sampled using sorbent tubes (Perkin-Elmer® and TERA-Environnement) containing multisorbent materials. Duplicates were performed for 15 min using a manual pump (Accuro 2000, from Dräger) with a controlled flow of 100 mL min−1. For each emission source studied, samples were taken at the same levels as those from the filter holder and QTRAK-7575 probe (see Fig. 1). While offline field measurements are essential to characterize the composition from real emissions from an unrestricted number of sources, they are limited as only a small fraction of compounds and only some combustion processes can be measured. Therefore, in order to capture a large spectrum of VOC species from the largest number of emission sources in the region, two types of sorbent tubes were used: Tenax TA 60–80 meshes (250 mg, 2,6-diphenyl-p-phenylene oxide) and multi-sorbent tubes composed of Carbopack C (200 mg) and Carbopack B (200 mg) 60–80 mesh (graphitized black carbon). The identification and quantification of each tube type was performed at different places and using different analytical techniques.
The particle collection line consisted of a pump with a flow rate of 9.5 liters per minute (L min−1) for sampling total particulate matter, a volumetric counter for quantifying sampled air volume and a filter holder on which a 47 mm diameter quartz-fiber filter (QM/A®, Whatman Inc.) was mounted. Before sampling, the filters were cleaned by heating for 48 h at 340 ∘C. After sampling they were kept at a temperature of 5 ∘C to avoid any contamination of the samples.
2.4 Measurements in the combustion chamber in the diluted wood combustion plume
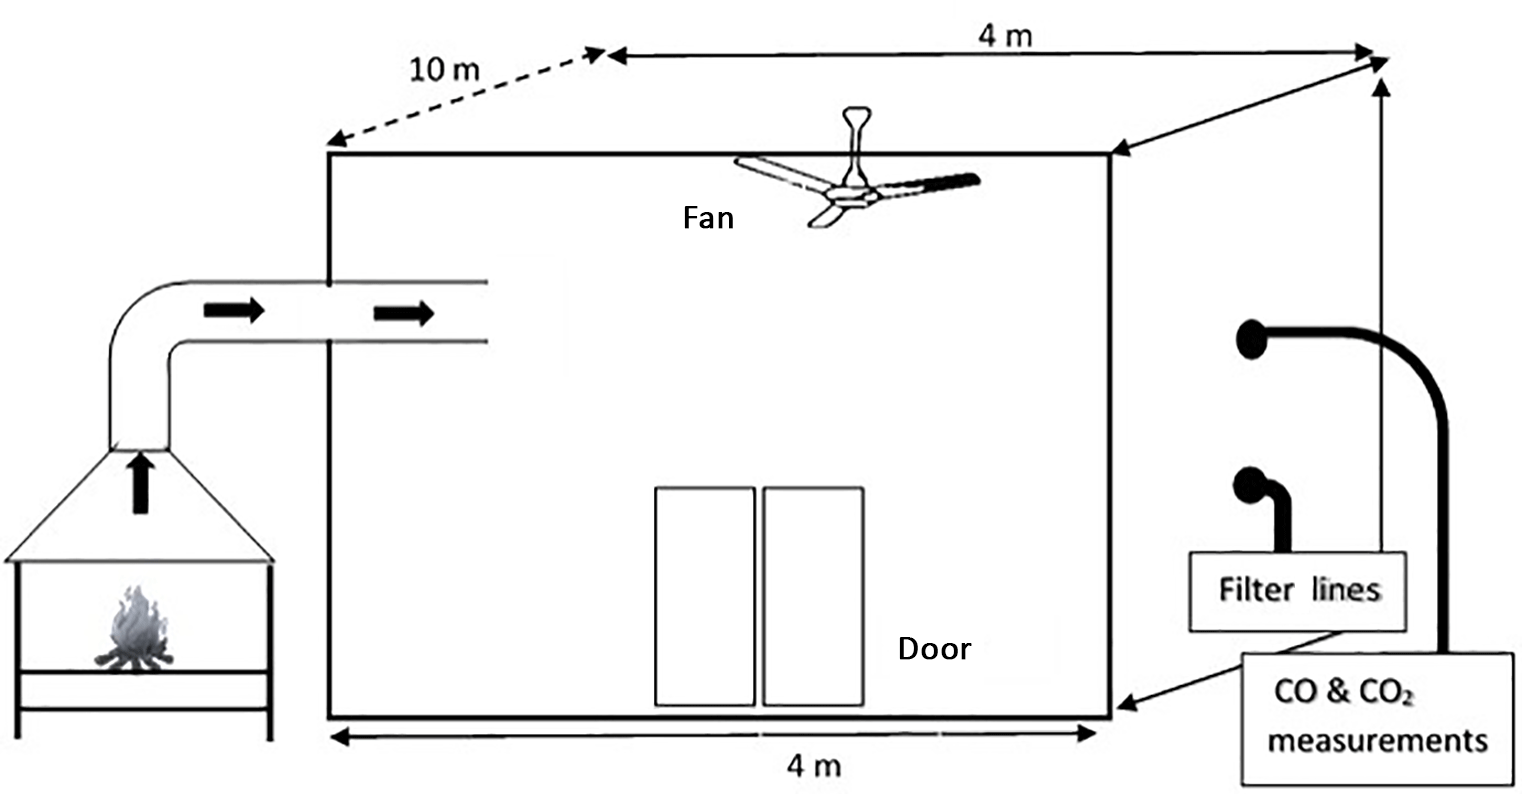
This sampling took place in a chamber where the plumes of hevea wood fire were convoyed. Therefore, concentrations were diluted compared to the measurements carried out in the field at the sources. The tests were conducted in two combustion chambers with different configurations. Only hevea wood from Côte d'Ivoire was studied in both combustion chambers. The combustion chamber of Lannemezan (Guillon et al., 2013) (Laboratoire d'Aérologie, UMR 5560, Toulouse, France) and the combustion chamber at the University of Edinburgh's School of Engineering were used. In Lannemezan, the dark dilution chamber (10 m × 4 m × 4 m) allowed measurement of concentrations at the absence of any solar radiation with no photochemistry. A fan stirs the air in the chamber to mix it well. For this combustion, the fuels were burned in a metal stove similar to the one used in the field and the plume is conveyed into the chamber through a chimney 1.5 m high and 15 cm wide (Fig. 2). Two QTRAKs were used to measure CO2 and CO concentrations, temperature and associated relative humidity in the room. The chamber remained closed during all phases of combustion, monitored from an adjacent room to the combustion chamber. After homogenization of the plume within the chamber, five filter sampling lines corresponding respectively to the cut-off heads for PM0.25, PM1, PM2.5, PM10 and TPM were used to collect aerosols for 15–25 min on average. For each of the five lines, the pumps were coupled to flow regulators to allow aerosol selection by particle size classes. Between two experiments, the chamber was opened (ventilated) to allow all sensors to return to their background values. Four tests were carried out with hevea wood from Côte d'Ivoire.
Hevea wood combustion experiments were also conducted using the FM-Global Fire Propagation Apparatus (FPA) at the Edinburgh University School of Engineering facility. The FPA allows the burning of small samples of fuel under controlled conditions (Brohez et al., 2006). The sample holder was placed on a mass balance that provides sample mass evolution during the experiment. The samples were surrounded by four infrared lamps, irradiating uniformly at 30 kWm−2 (low heat) or 50 kWm−2 (high heat), and subjected to an air flow entering from below at rates of 50 L min−1 (low flow) or 200 L min−1 (high flow). A large part of these chamber measurements has already been discussed in detail in Haslett et al. (2018), mainly focusing on active analyzer results but not on filter sampling. The configuration used in this chamber is shown in Fig. 3.
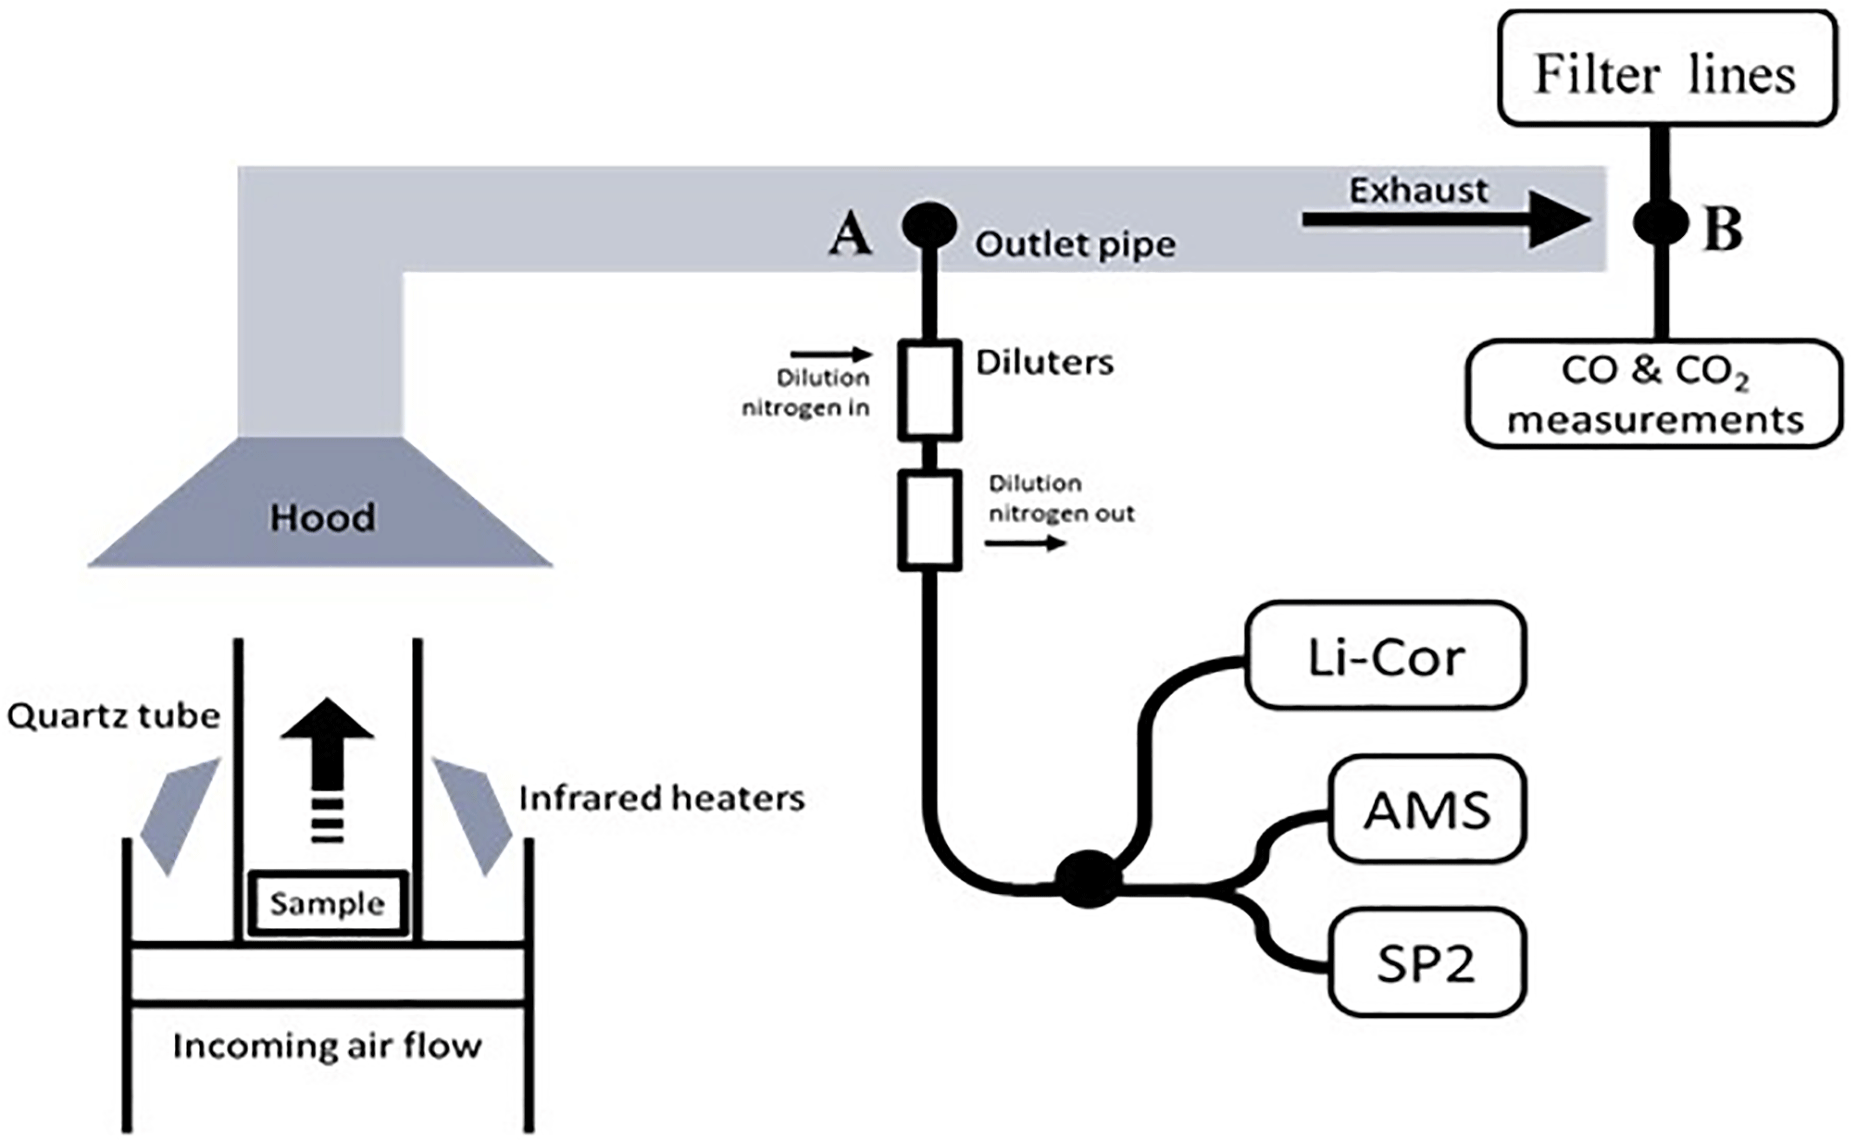
Figure 3Schematic view of the FM-Global Fire Propagation Apparatus with a diagram of the gas and particle sampling system (adapted from Haslett et al., 2018).
The fuel used in Edinburgh was hevea wood from Côte d'Ivoire. The plume was collected in a hood before entering the exhaust tube. Air samples were collected simultaneously at two points. The first was in the exhaust tube, where CO and CO2 were measured directly and a further sample was diluted in pure nitrogen by a factor of 100 for the online measurement of EC and OC concentrations. An aerosol mass spectrometer (AMS) was used to measure the concentration of organic aerosols and other non-refractory species and a single-particle soot photometer (SP2) to measure refractory black carbon (EC) mass concentration. The CO2, CO and O2 concentrations in the plume were measured at a frequency of 1 Hz at the exhaust tube by the FPA analyzers using non-dispersive infrared techniques (Servopro 4200). The second was at the exit of the exhaust pipe for filter sampling (offline measurement). A QTRAK analyzer was used to continuously measure CO and CO2 concentrations. Two aerodynamic sampling lines (PM2.5 and TPM) were used with pumps, counter, cut-off heads and filter holders with 47 mm quartz fiber filters.
Eight combustion tests were carried out during this experiment. Two of them were made with infrared lamps set at 30 kWm−2 and incoming airflow of 200 L min−1 (low heat and high flow: hFl), three tests at 50 kWm−2 and 200 L min−1 (high heat and high flow: HFl) and three other tests at 50 kWm−2 and 50 L min−1 (high heat and low flow: Hfl).
3.1 VOCs analysis
The analysis of Tenax tubes was performed at the Laboratoire de Météorologie Physique (LaMP, Clermont-Ferrand, France), using a gas chromatograph–mass spectrometer system (GC/MS, Turbomass Clarus 600, Perkin Elmer) connected to an automatic thermal desorption unit (Turbomatrix ATD). Each cartridge was desorbed at 270 ∘C for 15 min at a flow rate of 40 mL min−1, reconcentrated on a second trap, at −10 ∘C containing Tenax TA. After the cryofocusing, the trap was rapidly heated to 300 ∘C (40∘ s−1) and the target compounds were flushed into the GC. The separating column used was a capillary PE-5MS (60 m × 0.25 mm × 0.25 µm, 5 % phenyl–95 % PDMS, Perkin Elmer) and the GC temperature profile was ramped from 35 ∘C for 5 min, heating at 8 ∘C min−1 to 250 ∘C and hold for 2 min. The mass spectrometer was operated in a total ion current (TIC) chromatogram from 35 to 350 m∕z amu, and all chromatography parameters were optimized to enable the separation of 16 compounds from C5–C10 VOCs. Calibration was performed by analyzing conditioned cartridges doped with known masses of each compound, present in standard low-ppb-level gas solutions (purchased from the National Physical Laboratory, UK). The cartridges were then analyzed with the aforementioned method and calibration curves were obtained for each compound. Carbopack cartridges were analyzed at the SAGE Department (IMT Lille Douai) with an ATD-GC-FID analytical system, already described in Detournay et al. (2011) and Ait-Helal et al. (2014). This method allowed the separation and identification of 58 compounds, from C5–C16 VOCs, including 7 carbonyls, 2 ketones, 12 terpenes and 6 intermediate VOCs (C11–C16). The application of both methods allowed the comparison of common compounds (benzene, toluene, ethylbenzene, m+p-xylene, o-xylene, trimethylbenzenes, n-heptane, iso-octane, n-octane, α-pinene, β-pinene, limonene, isoprene) and the analysis of analytical techniques' performance.
The tubes were previously conditioned by flowing purified nitrogen through them at a rate of 100 mL min−1, for 5 h at 320 ∘C using an adsorbent thermal regenerator. The quality assurance parameters of both methods (uncertainties and detection limits) are described in the Supplement (Tables S1 and S2).
3.2 Particulate matter filters
Gravimetric analysis of quartz fiber filters (providing TPM, PM10, PM2.5, etc.) was performed by comparing the difference in weight of the filters before and after exposure. Weighing was performed using a SARTORIUS microbalance with 1.95 µg sensitivity. After the gravimetric analysis, the laboratory two-step thermal method from Cachier et al. (1989) was applied for the separation and the analysis of elemental and organic carbon particulate contents (EC and OC, respectively). Note that the detection stage was modified since in our instrument (G4 ICARUS), particulate carbon content is quantified from CO2 by a non-dispersive infrared (NDIR) detector, instead of coulometry as in Cachier et al. (1989). The relevance of the use of thermal method was validated by comparing results of 10 samples also analyzed using a thermo-optical method (IMPROVE method; Chow et al., 1993, 2001). We performed a linear regression analysis of all values obtained for both methods for TC, EC and OC. The analysis of the regression coefficients (given here in terms of R2) shows that suitable correlations were found among the thermal and thermo-optical methods for TC, EC and OC values. The thermal method gives 94 % of OC and 90 % of the EC measured with the thermo-optical method. Examples of regression plots are given in the Supplement with the Fig. S3. After this comparative study of analyses by these two methods, the thermal method was used for the subsequent analyses because of the high filter load. Two similar aliquots of the same filter were then separately analyzed. One portion was directly analyzed for its total carbon content (TC). The other portion was firstly submitted to a pre-combustion step (2 h at 340 ∘C under pure oxygen) in order to eliminate OC and then analyzed for its EC content. Organic carbon (OC) concentrations were calculated as the difference between TC and EC. The analyzer calibration is checked before each series of analyses by analysis of the filter punches each containing a sucrose solution of known concentration.
4.1 Field measurements
Field measurements allowed determination of mean values of EF for residential fuel fires (charcoal burning, CH; fuelwood burning, FW), charcoal-making fires (CHM), open trash-burning fires (WB) and vehicle exhaust (car, bus, truck, light-duty vehicles, two-wheeled two-stroke and four-stroke vehicles) by energy source (diesel and gasoline) and by model age (recent, less than 10 years old; old, 10 years and over). As mentioned above, the studied species are CO, CO2, carbonaceous particles (EC, OC and TC), speciated VOCs compounds (C5–C16 alkanes, C5–C11 carbonyls, C4-ketones, C6–C9 aromatics and 13 species of terpenes) and total particulate matter (TPM).
4.1.1 Particulate EFs for biofuel combustion sources
Table 1EFs of residential sources for this study and those from the literature (mean values from this study in bold).
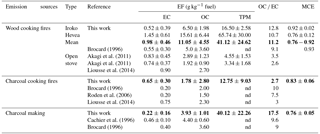
The EFs for fuelwood burning sources were calculated following Eq. (1), and using fc=46 % (Brocard et al., 1996). EFs are expressed in grams of pollutant per kilogram of fuel burned (g kg−1). Results of OC emission factor (EF(OC)) values given in Table 1 are 15.61 ± 6.44 and 6.50 ± 1.98 g kg−1 for hevea and iroko wood respectively, while for EC, EFs were found to be 1.45 ± 0.61 and 0.52 ± 0.39 g kg−1, respectively. Hevea wood emitted more carbonaceous particles than iroko wood. To have a mean EFs for wood cooking fire, we averaged the EFs of the two types of wood studied here (iroko and hevea). Following this, a value of 0.98 ± 0.46 g kg−1 for EC and 11.05 ± 4.55 g kg−1 for OC is assumed to be representative of the EFs typical for this area. On the one hand, EC and OC EFs for iroko wood cooking fire are of almost the same order of magnitude as those of Brocard et al. (1996), but EFs of hevea wood cooking fire from this study are higher than other literature values in Table 1. On the other hand, comparison of mean EFs of EC and OC with those used by Liousse et al. (2014) and Akagi et al. (2011) showed that EF(EC) is of the same order of magnitude while EF(OC) of this study is 4 times higher than those values reported by Liousse et al. (2014) and Akagi et al. (2011) (see Table 1). Thus, the use of new EF(OC) from this study should show that previous values of EF(OC) underestimated OC emissions in West Africa. These differences may be explained by the wide variety of wood used in the different studies as well as the different burning conditions as shown by the different MCE values in Table 1. However, our MCE value for iroko wood cooking is reasonably similar to those of Brocard et al. (1996). This reveals that these two combustions take place mainly in the flaming phase because MCE ≈ 0.92.
Particles EFs for charcoal cooking fire were obtained by averaging EFs of several tests and using fc of 71.5 % (Brocard et al., 1996) to express EFs in g kg−1 of charcoal burned. Table 1 also presents the mean EF for charcoal cooking fire with literature data. EC and OC EFs were found to be 0.65 ± 0.30 and 1.78 ± 2.80 g kg−1, respectively. It can be seen here that our EF(EC) for charcoal cooking fires are 3 times higher than those reported by Brocard et al. (1996) and Roden and Bond (2006) but of the same order of magnitude as those used by Liousse et al. (2014). However, the EFs are almost the same for OC. For charcoal burning, we can say that Liousse et al. (2014) give values of the same order of magnitude for EC and OC emissions in West Africa compared to those we would obtain using these study values and the same activity data. The mean value of MCE (0.83 ± 0.06) found for charcoal cooking fire shows that this also burned mainly in the flaming phase.
The carbon balance method cannot be used directly to calculate charcoal-making (CHM) EF (Bertschi et al., 2003) in the same way we calculate wood- and charcoal-burning EFs. Indeed, during the CHM process, part of the burned carbon is found in charcoal, ash and pyroligneous liquid. Thus, less than 50 % is emitted into the atmosphere. As shown previously, Lacaux et al. (1994), Cachier et al. (1996), Smith et al. (1999) and Bertschi et al. (2003) estimate the fraction of carbon emitted as atmospheric gases to be 35, 35, 37, and 45 % respectively. Moreover, Cachier et al. (1996) estimate that if 35 % of the carbon content of wood is emitted into the atmosphere during CHM, 89 % is emitted as CO and CO2 during the smoldering phase. Since the CHM conditions described in Cachier et al. (1996) are similar to those of this study (pure smoldering phase because of an average MCE of 76 %; Fig. 4; Akagi et al., 2011), we considered that 35 % of the carbon content of wood is emitted into the atmosphere and 89 % of this carbon is emitted as CO and CO2 for CHM. Thus, 0.35 was the factor used in order to obtain an EF in g kg−1 of wood burned from EF in grams per kilogram of carbon (Cachier et al., 1996). As shown in Table 1, CHM EFs of this study are comparable to those of Brocard (1996) and Cachier et al. (1996) for OC and are a factor of 2 lower for EC. This difference could be explained by a wide variety of wood used for CHM (e.g., wood type or wood moisture). For charcoal-making fires, mean MCE is found to be 0.76 ± 0.05, a value lower than those found for other biofuels tested in this study.
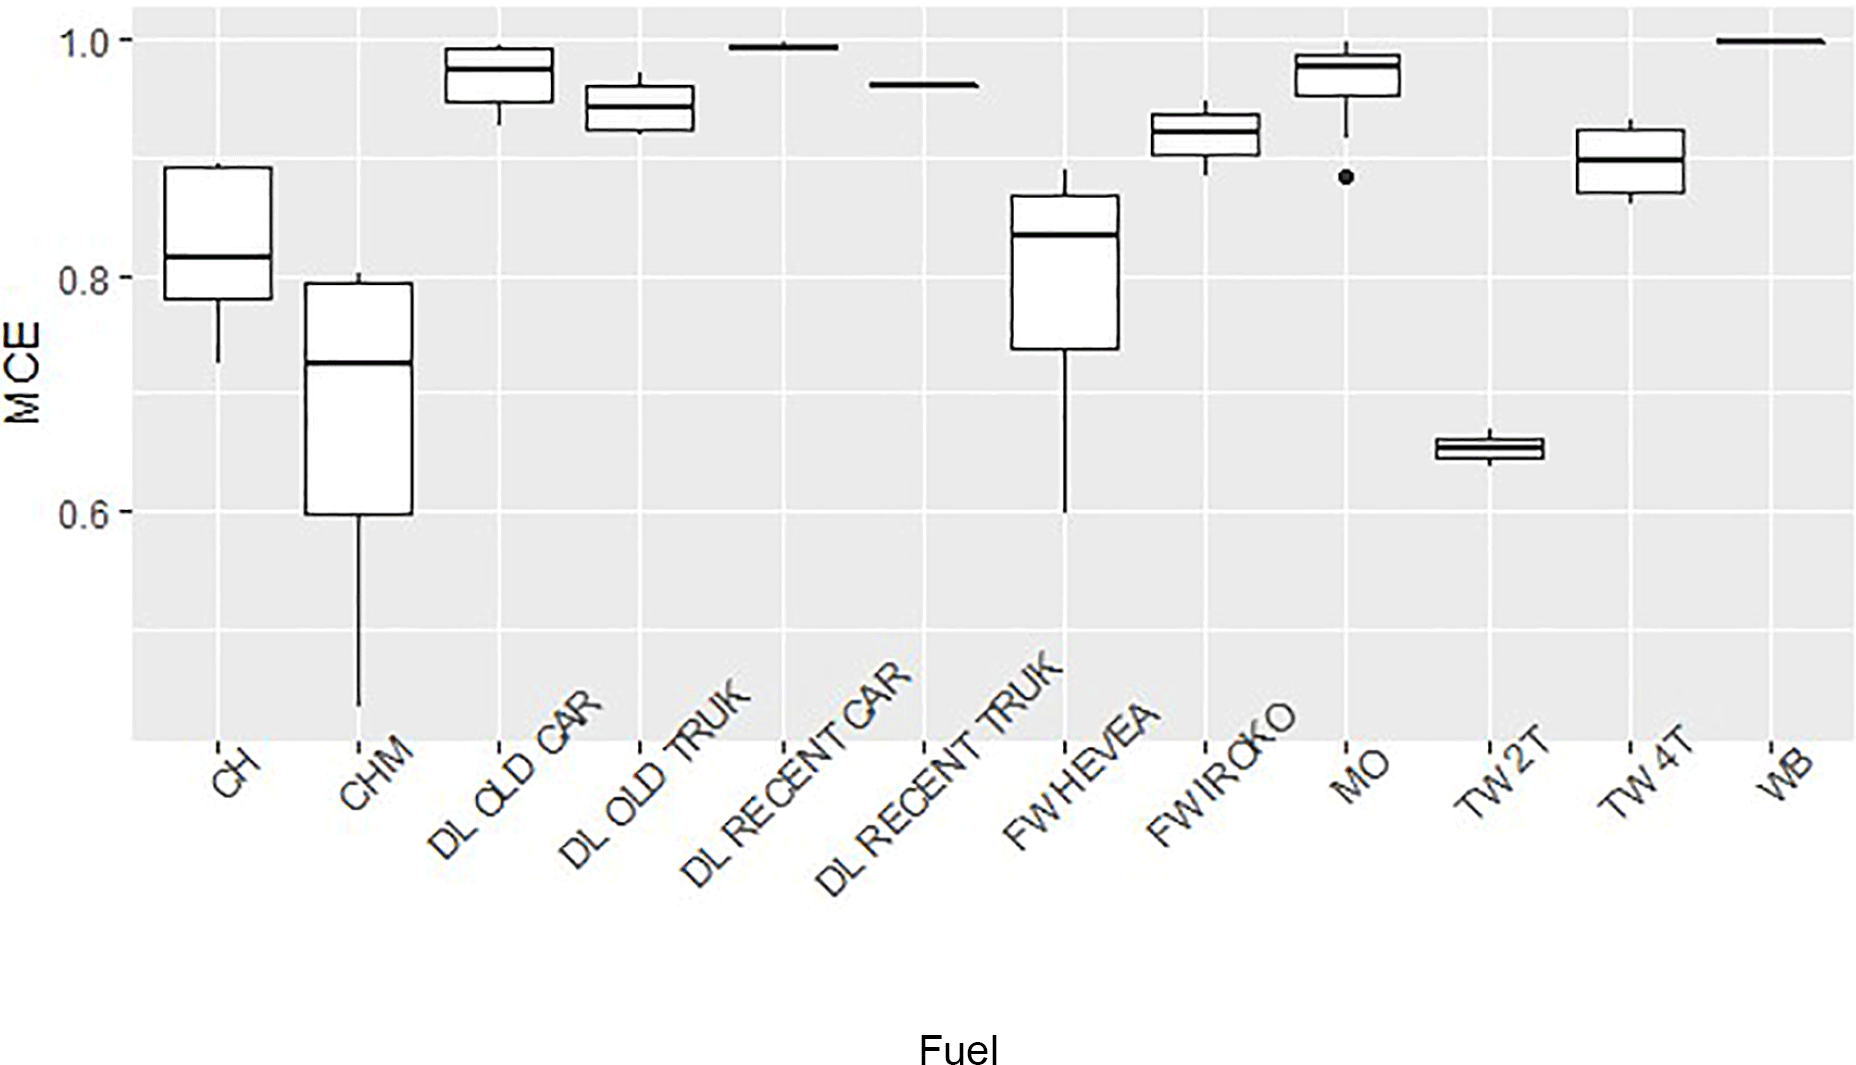
Figure 4Modified combustion efficiency of different sources studied (charcoal burning: CH; charcoal making: CHM; diesel: DL; wood burning: FW; gasoline: MO; two-wheeled vehicles: TW; and trash burning: WB).
4.1.2 Particulate EFs for road traffic sources
EFs for road traffic sources were calculated following (Eq. 1). The fraction of carbon contained in diesel (Eggleston et al., 2006; Kirchstetter et al., 1999) and in gasoline (IPCC, 2006; Ban-Weiss et al., 2010) was assumed to be 85 % in order to obtain an EF expressed in g of pollutant per kg of fuel burned (g kg−1). Table 2 summarizes EC, OC and TPM EFs from our measurements by two vehicle age categories (old, 10 years and over; recent, less than 10 years old), by energy or fuel type (gasoline and diesel) and by those used in emissions inventories.
Table 2Emission factors for gasoline and diesel vehicles by age group and those in the literature, from different measurement methods (mean values in bold).
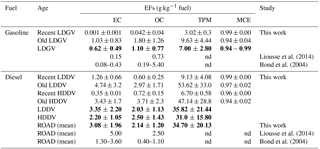
nd: not determined
The results show that the EF(EC) (1.03 ± 0.83 g kg−1) and EF(OC) (1.80 ± 1.26 g kg−1) of this study for old light-duty gasoline vehicles (LDGVs) are larger than those of recent vehicles by a factor of 1000 and 40 respectively for EC and OC, showing that older the LDGV becomes, the more EC it emits. Like LDGVs, EF(EC) and EF(OC) for old vehicles are higher than those of recent vehicles for light-duty diesel vehicles (LDDVs) (Table 2). The high emission factors for older vehicles in Africa can be explained by the lack of regulations on vehicle emissions (catalytic converter and diesel particulate filters, e.g., EURO standards). In addition, EC EFs are higher than OC EFs for both old and recent LDDVs as previously shown by some studies such as Pant and Harrison (2013), Chiang et al. (2012), and Grieshop et al. (2006). EFs of all tested vehicles are reported in Table S3 of the Supplement. It was reported in the literature (measurements not performed in Africa) that the EC EFs of diesel vehicles were in the range of 0.11 to 2.20 g kg−1 fuel (Kirchstetter et al., 1999; Gillies and Gertler, 2000; Streets et al., 2001; Westerdahl et al., 2009; Wang et al., 2012, 2016). Our results of EF(EC) of diesel vehicle are in this range with the exception of old vehicles.
Mean EFs of EC, OC and TPM for LDDVs, including private cars and taxis, are estimated to be respectively 3.35 ± 2.20, 2.03 ± 1.13 and 35.82 ± 21.40 g kg−1. They are higher than mean EFs for heavy-duty diesel vehicles (HDDVs), including trucks and buses, respectively of the order of 2.20 ± 1.05, 2.50 ± 1.43 and 31.00 ± 15.80 g kg−1. Regarding gasoline vehicles, EF measurements were carried out only for LDGVs, which constitute the majority of the fleet using gasoline. Mean EC, OC and TPM EFs are lower than LDDVs with 0.62 ± 0.49, 1.10 ± 0.77 and 7.0 ± 2.80 g kg−1 respectively.
Finally, mean road equivalent vehicle EFs (Table 2) by fuel types were compared with EF values used in Bond et al. (2004) inventory and in the most recent African emissions inventory by Liousse et al. (2014). For gasoline vehicles, the EF(EC) value of our mean road equivalent vehicle is higher than the upper limit value used by Bond et al. (2004), which is the value used by these authors for countries where there are the most super emitters such as in West Africa. Unlike EF(EC), our EF(OC) is within the range of values given by Bond et al. (2004), but it is lower than the upper limit given by Bond et al. (2004). For diesel vehicles, while our EF(EC) value for mean road equivalent vehicle is close to the upper limit given by Bond et al. (2004), our EF(OC) is higher than their upper limit value. In addition, the EF values obtained in this study for gasoline are higher than those observed in Liousse et al. (2014) (4 times higher for EC and 2 times higher for OC), while they are slightly lower for diesel (Table 2). This shows that the use of Liousse et al. (2014) EFs underestimates EC and OC emissions for on-road gasoline motors compared to what would happen if using our EF values, whereas they are of the same order of magnitude for on-road diesel motor.
EFs for two-wheeled (TW) vehicles were also classified according to their age (old and recent), and their engine type (two- or four-stroke). Indeed, it is important to note that due to the use of a very polluting mixture of gasoline and oil, the two-stroke engines were distinguished from the four-stroke engines. For recent TW two-stroke engines, EC and OC EFs are 2.26 ± 1.40 and 25.71 ± 1.10 g kg−1 respectively, while 0.11 ± 0.01 and 0.45 ± 0.13 g kg−1 are found for recent TW four-stroke engines. In addition, for old TW two-stroke engines, EC and OC EFs are 3.45 and 124.21 g kg−1 respectively, while 3.66 and 25.46 g kg−1 are found for old TW four-stroke engines (Table 3). This shows that TW two-stroke engines globally emitted considerably more carbonaceous particles (especially OC particles) than TW four-stroke engines. These high EC and OC EFs for two-stroke engines can be explained by incomplete combustion due to the gasoline–oil mixtures used in these engines. This has already been highlighted by Volckens et al. (2008) for particulate emissions when studying two-stroke engines. In addition, the old / recent ratio of EF(EC) for TW two-stroke engines is around 1.5, while the same ratio for EF(OC) is around 5, which is 3 times greater than that of EF(EC). Similarly, for TW four-stroke engines, the old / recent ratio of EF(OC) is a factor of 2 greater than the ratio of EF(EC). That shows that OC emissions are more enhanced (doubled or tripled) in older TW vehicles compared with those of EC.
Table 3EC and OC EFs for two-wheeled (TW) vehicles of our study and those of the literature (mean values in bold).
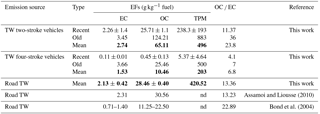
Mean road equivalent two-wheeled-vehicle EFs obtained for EC and OC (Table 3) are both very close to the values used by Assamoi and Liousse (2010), which is the only regional two-wheeled-vehicle inventory specific to Africa. These values were used in Liousse et al. (2014). Also, EF(EC) and EF(OC) mean values from this study are both above the upper limit of the TW EFs given by Bond et al. (2004), which correspond to the TW EFs that these authors consider for Africa. Comparison of these new values with those used in the Bond et al. (2004) inventory shows that this global inventory underestimates EC and OC emissions from two-wheeled vehicles in Africa, particularly in West Africa.
These higher EFs may be explained by the fact that African TW two-stroke vehicles are often older and second-hand (used) vehicles imported from Europe. Moreover, Assamoi and Liousse (2010) have shown that a large proportion of the fuel used by two-wheeled vehicles in West Africa is adulterated and smuggled and thus of poor quality compared to European standards as shown by UNEP (2017). It can be seen in Fig. 4 that fossil fuel (FF) sources (diesel, gasoline) have MCEs in the range between 0.9 and 1, aside from two-wheeled two-stroke engines (TW 2T), which have a MCE of 0.65. As expected, TW 2T with a mixture of gasoline and oil has less efficient combustion with more abundant smoldering products.
4.1.3 Particulate EFs for open trash burning
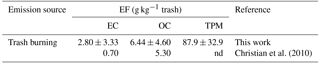
EFs of pollutants for open trash burning were calculated using Eq. (1) adapted for this source. In that case, Eq. (1) was multiplied by a carbon oxidation factor (COF), defined as the ratio between the amount of burned carbon and the amount of carbon initially present in the sample. Carbon content of household waste (trash) of 46 % was used (Lundin et al., 2013; Wiedinmyer et al., 2014) with a COF of 58 % (Fiedler et al., 2010). The averaged EFs for open trash burning are presented in Table 4 with associated standard deviation. During our measurements, different phases were observed during each test/sample with different predominance from one test to another (Fig. S4): the flaming phase was predominant during the combustion of dry trash, while the smoldering phase was predominant for wet trash burning. These various fire types and the trash composition explain the relatively high value of the associated standard deviation. EF expressed in grams per kilogram of trash (g kg−1) of EC, OC and TPM are 2.80 ± 3.30, 6.44 ± 4.60 and 87.90 ± 32.90, respectively. As expected, trash burning emits more OC than EC. In addition, the relatively high value of TPM suggests that other kinds of particulate matter (such as ions or metals) are also emitted during trash burning. When comparing values found during this study to those of Christian et al. (2010) which deals with carbonaceous particles EFs, it is noted that EF(OC) is of the same order of magnitude, while the EF(EC) of our work is higher than that of Christian et al. (2010) by a factor of 4. This high EF(EC) found in the present work may be explained by differences in the solid trash composition from Côte d'Ivoire and Mexico, where the measurements of Christian et al. (2010) were carried out. Moreover, it can be also explained by the fact that more flaming was sampled during our measurements. Finally, the use of EC EFs from Christian et al. (2010) in several global inventories would underestimate EC emissions from trash burning in West Africa.
Table 4EF for open solid trash burning of this study and other studies.
4.1.4 Emission factors of volatile organic compounds
VOCs were measured and emission factors estimated for the first time to our knowledge in West Africa. Fifteen common VOC species (C5 to C10) were identified and quantified from sorbent tube measurements and are reported in Table 5. The selection of these VOC was related to their identification by both analytical methods implemented during this study.
Table 5EF values of VOC species for the studied sources: heavy-duty diesel vehicles (HDDV), light-duty diesel vehicles (LDDV), light-duty gasoline vehicles (LDGV), two-wheeled two-stroke vehicles (TW 2T), two-wheeled four-stroke vehicles (TW 4T), fuelwood (FW), charcoal (CH), charcoal making (CHM) and trash burning (WB) (in bold the EFs of the first four major species).
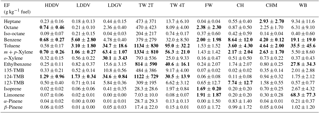
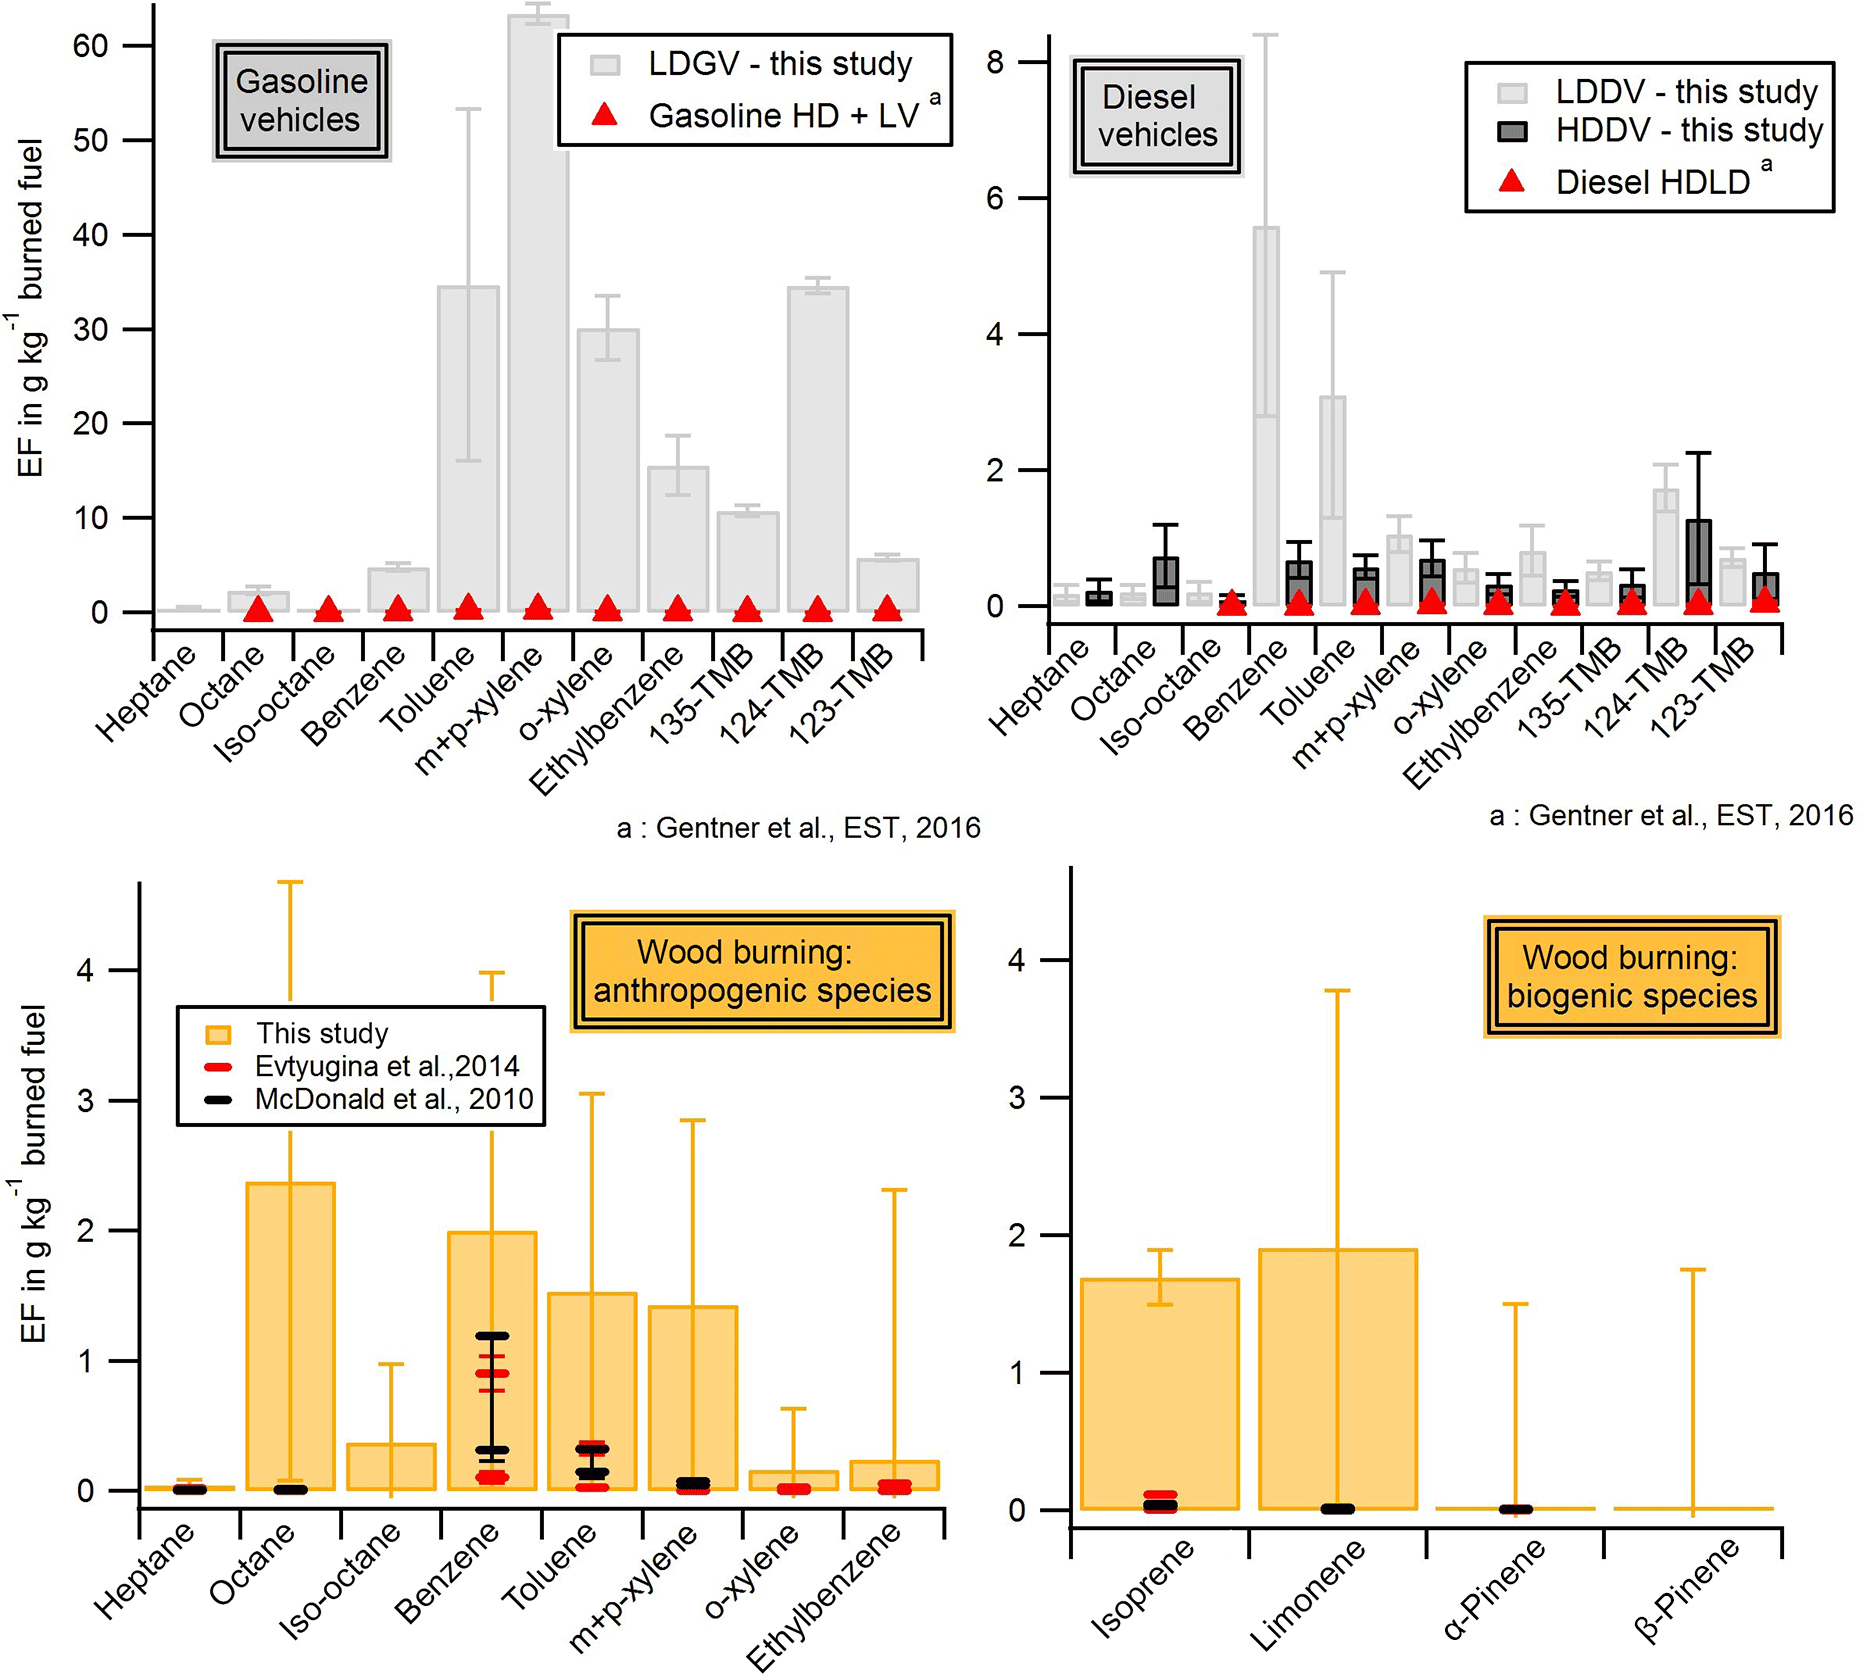
Figure 5Comparison of VOC EF with the literature for traffic (light-duty gasoline vehicles, LDGV; light-duty diesel vehicles, LDDV; and heavy-duty diesel vehicles, HDDV) and wood burning. The bars correspond to the standard deviations of measurements
Globally, the dominant VOC species emitted during EF measurements include toluene, m+p-xylene, 1,2,4-trimethylbenzene (124-TMB), ethylbenzene, o-xylene, 1,3,5-trimethylbenzene (135-TMB) and heptane. These compounds are important species in terms of atmospheric reactivity, generally involved in photochemistry processing and in the formation of secondary pollutants like ozone (Pandis and Seinfeld, 2006). Aromatic compounds also have high secondary organic aerosol potentials (Derwent et al., 2010). While they are usually associated with biogenic emissions (Kesselmeier and Staudt, 1999), isoprene and terpenes (limonene, α-pinene and β-pinene) were also observed in the EFs of almost all anthropogenic sources. Table 5 presents EF values of such species for all the studied sources. It is important to note that standard deviation values are high, reflecting the range of uncertainties linked to the two sets of analysis (see “Methodology and materials” section) and also to the different sources associated with the emission sector analyzed.
As can be seen, road traffic VOC EFs presented the highest values, especially for two-wheeled two-stroke engines (TW 2T). The EFs for TW are up to 3 orders of magnitude greater than those observed for diesel vehicles (HDDVs and LDDVs) and LDGVs. They are dominated by alkanes and aromatic compounds (Tsai et al., 2003). Likewise, we highlight the presence of isoprene and terpene emissions in TW sources, whose contribution cannot be neglected. In terms of engine differences, four-stroke engine emissions had lower EFs than those observed for two-stroke engines. This result is in agreement with other works (Tsai et al., 2000; Montero et al., 2010) which analyzed the concentration of individual VOC in the tailpipe exhaust, showing the differences between two-stroke and four-stroke engine emissions.
Gasoline vehicle EFs are higher than diesel vehicles and they are dominated by aromatic compounds, including xylenes, trimethylbenzenes and toluene (45, 25 and 15 % respectively, in relative contribution, % wt). The main differences associated with both fuel emission profiles were related to the higher relative contribution of benzene (37 % for LDDV) and alkanes (18 % for HDDV) for diesel vehicles. Charcoal making (CHM), wood (FW) and charcoal burning (CH) emissions were characterized by the abundant presence of alkanes, benzene, and xylenes. Particularly in the case of FW, terpenes and isoprene show important contribution to the total sum of emissions (15 and 13 % respectively). The most abundant VOC species observed for open trash burning (WB) were terpenes (38 %) followed by toluene, trimethylbenzenes, benzene and alkanes. The sum of C5–C10 VOC for this study shows a similar EF range in comparison with the sum of volatile organic compounds found in the literature (Christian et al., 2010). Despite the uncertainties associated with each method, high variabilities were found from different measurements related to the same emission source. For instance, the WB emission factors presented a high standard deviation (up to 100 %). This deviation could be related to the effect of many factors the can impact the burning process, including the combustion processes, the fuel chemistry, moisture, and geometry (Andreae and Merlet, 2001).
Individual VOC species were aggregated into species groups as proposed by the GEIA initiative that were introduced in the last EDGAR VOC inventory (Huang et al., 2017) (Tables S4, S5 and S6). In this way, a larger VOC database was considered, including 12 species of terpenes, intermediate VOCs (iVOCs from C11–C16 n-alkanes), ketones and carbonyl compounds for a reduced number of sources (Table S4). The main differences obtained from this exhaustive speciation were related to the contribution of heavy alkanes (VOC6, with iVOCs the most important fraction, 50 %) and aldehydes (VOC22, 13 %) for HDDV sources. The contribution of heavy alkanes from diesel was also observed in other studies (Ait-Helal et al., 2014; Dunmore et al., 2015). In the same way aldehydes presented a considerable contribution in CH and CHM emissions and terpenes were also significant (14 %) in wood-burning emissions (FW).
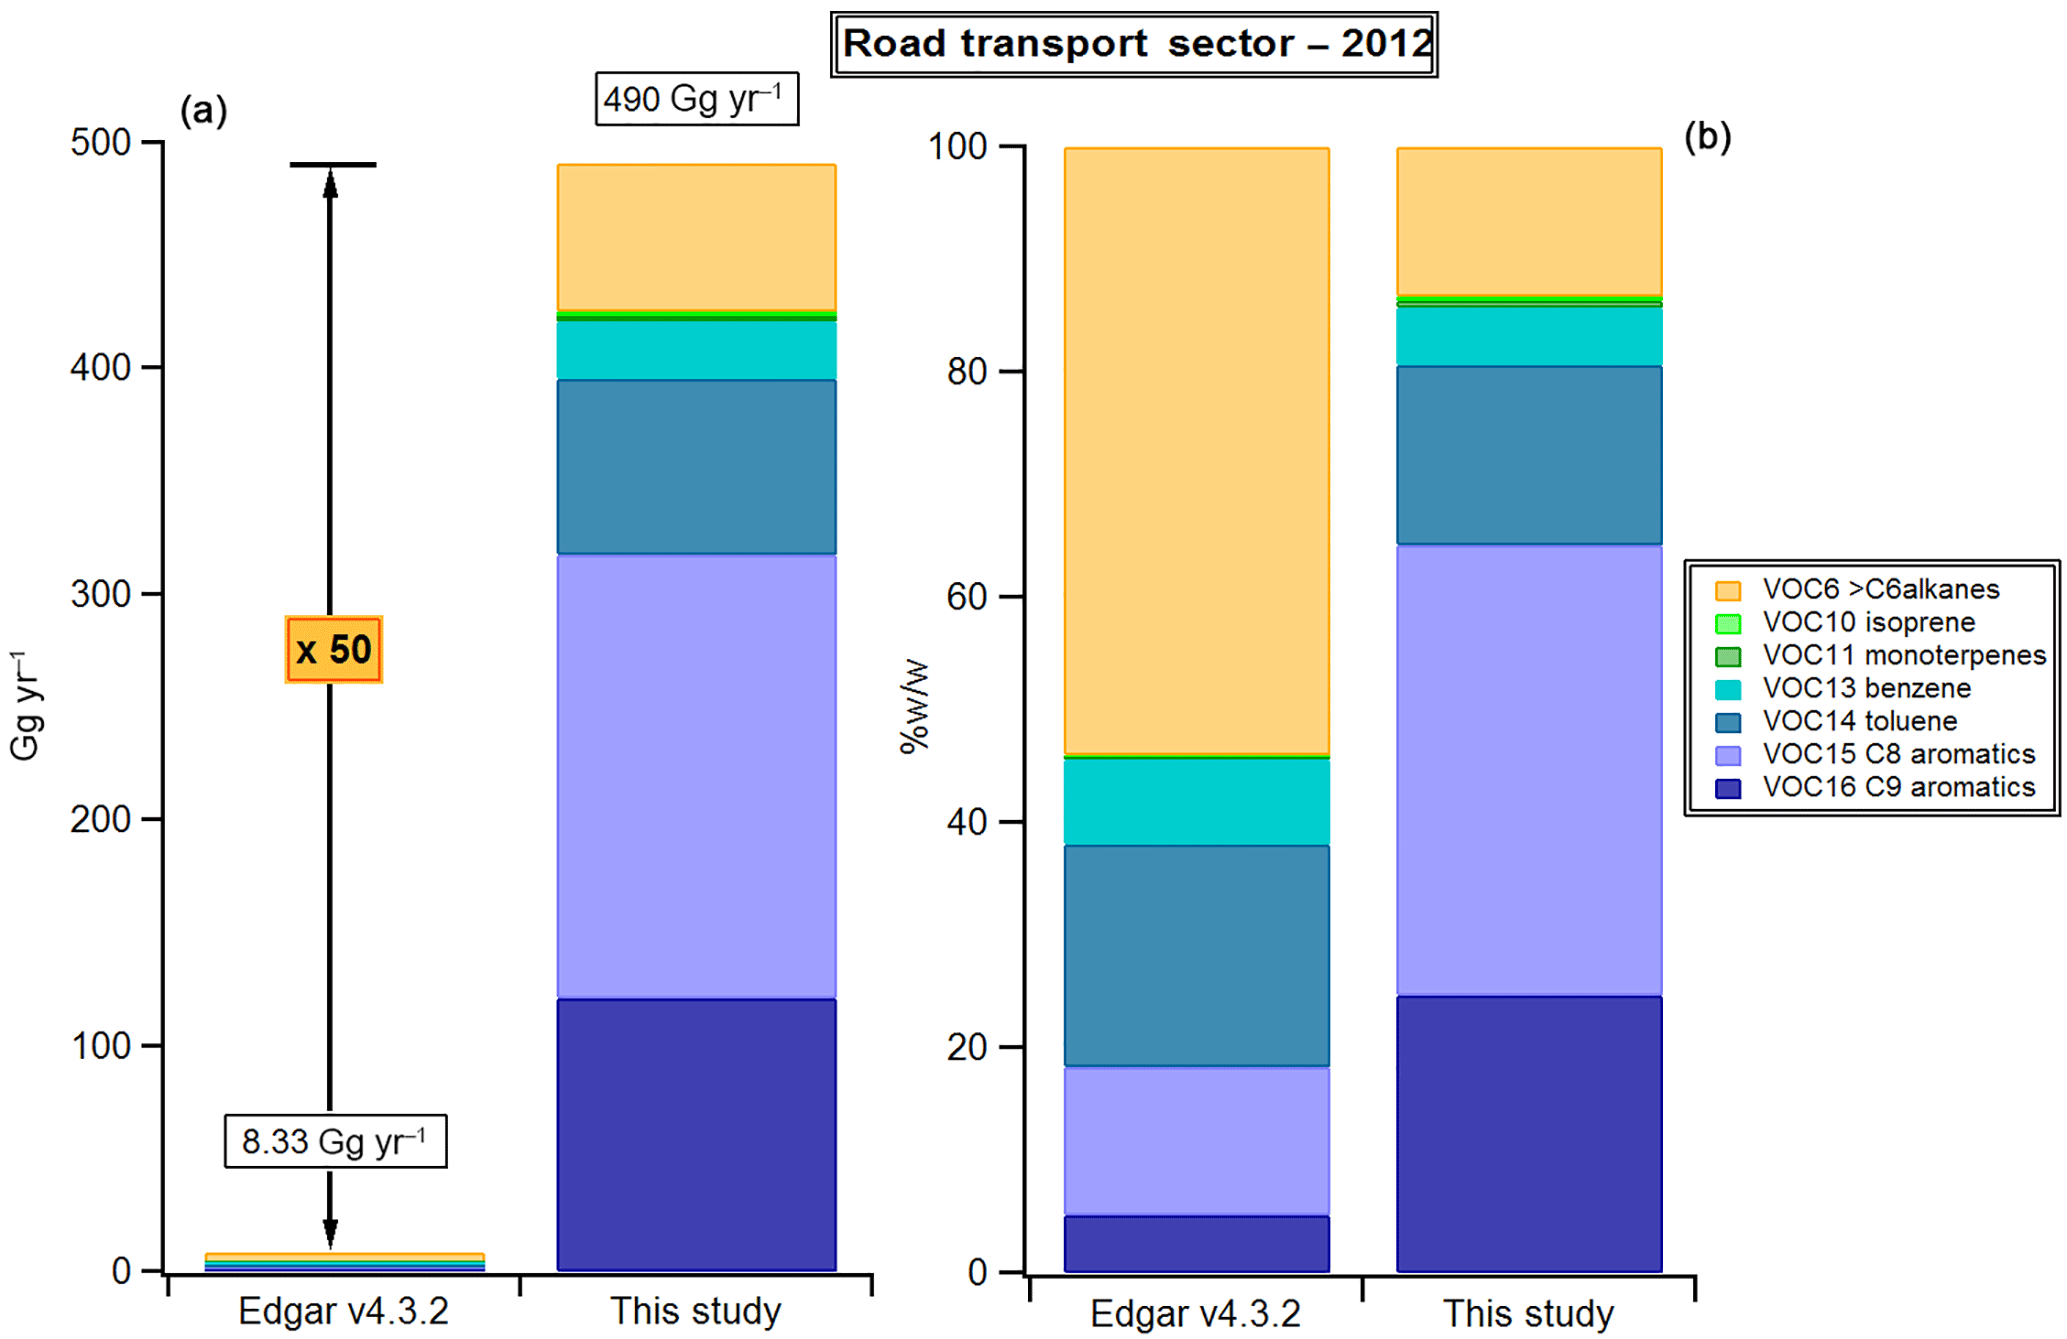
Figure 6Comparison of Côte d'Ivoire VOC emissions with the Edgar v4.3.2 inventory (Huang et al., 2017) for the road transport sector in 2012: (a) absolute emissions in Gg yr−1 and (b) relative mass emissions for selected VOC groups.
The determined EFs for gasoline (LDGV) and diesel (LDDV and HDDV) vehicles and wood burning have been compared (Fig. 5) to the ones from the literature (McDonald et al., 2000; Gentner et al., 2013; Evtyugina et al., 2014) in order to evaluate the magnitude of the West African anthropogenic emissions of VOCs. Numbers are reported in Table S7 of the Supplement. Regardless of the motorization, the EFs in West Africa are higher than the most recent ones reported in California in the Caldecott Tunnel by Gentner et al. (2013). The differences span 2 orders of magnitude. The EFs for wood burning are also higher by between a factor of 2 and a factor of 100 than those reported in the literature for different types of hardwood used in woodstoves and fireplaces (Fig. 5). The presence of isoprene and monoterpenes in WB emissions is also observed in the literature. However, in this study, their levels are as significant as the ones of aromatic compounds.
These new VOC data were also used to evaluate the emission inventories in Côte d'Ivoire as a first case study. VOC emissions were calculated by combining the new speciated VOC EFs and statistical activity data provided by International Energy Agency (IEA) and then compared with those provided by the EDGAR inventory (EDGAR v4.3.2) for the road transport sector. For that purpose, the 15 VOCs were aggregated according to GEIA VOC groups (Table S4, Huang et al., 2017). In Fig. 6 the road transport emissions for the year 2012 in Côte d'Ivoire are compared. Notwithstanding the selected number of VOC species, a large discrepancy can be noted between both profiles (Fig. 6a): the EDGAR inventory underestimates VOC emissions by a factor of 50. In terms of composition, the main differences are observed for the VOC6 group (> C6 alkanes), which presents a greater contribution in the EDGAR inventory. This disparity could also be related to the few VOC species that were analyzed for the VOC6 group in our study. In contrast, aromatic compounds dominate the updated emission inventory, especially for C8 and C9 compounds (40 and 25 %, respectively, Fig. 6b). Since the reactivity is different for each species, the inaccuracies in the VOC speciation also have consequences in the estimation of their impacts. The scarcity of measurement and source profile data in Africa was previously pointed out in the development of the EDGAR inventory, which leads to considering the priority of this region for future inventory improvements (Huang et al., 2017). Our results show that emissions of anthropogenic VOCs by actual emission inventory are largely underestimated and show the usefulness of in situ measurements in real conditions to derive realistic emission factors and subsequent emissions of better quality.
4.2 Combustion chamber measurements for fuelwood burning
4.2.1 EF comparison between field and combustion chamber measurements for wood burning
Table 6EF for fuelwood burning of this study for field and combustion chamber measurements.
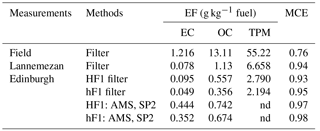
Table 6 summarizes EFs of EC, OC and TPM experiments carried out in the combustion chambers. As can be seen, field EF values obtained with the same methodology of “filter sampling” are a factor of 16 and 11 higher than those of the Lannemezan combustion chamber for EC and OC respectively, and a factor of 16 and 28 higher than those of the Edinburgh combustion chamber. Quantitatively, it can be seen that a dilution factor of around 8 exists between field and combustion chamber measurements. Indeed, CO ∕ CO2 field measurements (≈ 0.32) are 8 times higher than that of Lannemezan (≈ 0.04), and CO2 is roughly the same. The same factor is obtained for the EFfield ∕ EFLannemezan ratio for EC and total mass. This is not so clear with the Edinburgh results. Edinburgh and Lannemezan MCE results show that there is more flaming during these tests than during the field tests due to higher MCE (≈ 0.94) rather than in the field (≈ 0.76). This important difference between field and combustion chamber results may be linked to many factors such as the different combustion conditions (different MCE) and the high dilution of plumes occurring in combustion chambers. Indeed, field EF measurements are performed within the plume before its dispersion. In terms of quantities, field values are representative of primary emissions, which have to be computed in emission inventory algorithms. Finally, we have compared EFs (EC and OC) obtained at the Edinburgh combustion chamber with two sampling methods: the method using the filter sampling and QTRAK-7575 on the one hand and the AMS-SP2 and FPA CO-CO2 analyzer method on the other hand. MCEs obtained with FPA are slightly higher than those of QTRAK, which shows a stronger flaming condition. But the differences are more pronounced with EFs, where EFs(EC) obtained from AMS-SP2 measurements are 100 times higher than those obtained from filter methodology. These differences in addition to those listed above may be due to the carbon measurement method (thermal method for filters (EC) and incandescence method using single-particle methods for SP2 (BC); Petzold et al., 2013).
However, it should be underlined that combustion chamber measurements are very complementary for field measurement. First, it allows more measurements to be performed than on the ground. Second, it allows a better understanding of the impact of combustion processes on aerosol composition and size class (e.g., PM2.5, PM1).
4.2.2 Wood burning EFs per size class
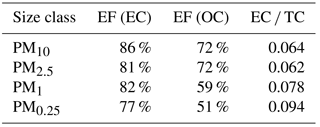
Relative contributions of different size classes (PM10, PM2.5, PM1, and PM0.25) to total size of EC and OC EFs are shown in Table 7. As can be seen, such a contribution is less variable for EC EFs from fine particles (PM2.5: 81 %) to ultrafine particles (PM0.25: 77 %) than for OC EFs, which varies from 72 to 51 % for PM2.5 and PM0.25, respectively. This means that EC EFs particularly predominate in the ultrafine size fraction. These results are in line with those reported by previous works on fuelwood burning (Guofeng et al., 2012; Danielsen et al., 2011; Purvis et al., 2000). Table 7 also shows that EC ∕ TC is consequently different in the different aerosol size fraction with larger values in the ultrafine sizes (0.094) than in the coarse ones (0.064). The domination of fine particles from fuelwood burning is a health concern for those who use wood for cooking, since fine particles can penetrate deeper into the lungs and are often associated with many toxic compounds (Englert, 2004; Pope et al., 2009; Val et al., 2013).
Table 7Relative contribution of EFs (EC and OC) for wood burning per size class to total size.
This study characterizes the emissions of many sources specific to Africa. EFs of EC, OC, TPM and specified VOCs were determined for biofuel (tropical fuelwood, charcoal and charcoal making), fossil fuels used in traffic (gasoline and diesel) and trash burning. Field EF measurements were performed for all studied sources as well as in combustion chambers for hevea fuelwood in order to obtain EFs per size fraction.
During field measurements, several tests were performed per source studied here in order to get the more representative EFs for each source. The mean EFs of EC, OC and TPM are 0.98 ± 0.46, 11.05 ± 4.55 and 41.12 ± 24.62 g kg−1 fuel for wood burning and 0.65 ± 0.30, 1.78 ± 2.80 and 12.75 ± 9.03 g kg−1 fuel for charcoal burning, respectively. Note that wood burning emits more particles than charcoal burning. Particle EFs for biofuel burning are comparable to the range of those found in the literature (measurements and values used in inventories in Africa) excepted EF(OC) for wood burning. In the combustion chamber measurements, the EFs of the particles for hevea wood burning per size class show that EC is mainly in the fine fraction. The significant difference between the combustion chamber and field measurements suggests that EFs and chemical composition are strongly affected by variables that differ according to field and laboratory procedures. Even if field values are more representative of primary emissions, combustion chamber allows for more measurements to be performed than in the field, allowing for better understanding the impact of wood combustion processes on aerosol composition and size class: these two types of measures remain complementary. EFs for fossil fuel burning in traffic are strongly dependent on vehicle age. The older the vehicles, the higher EF values for carbonaceous particles are; these values are sometimes up to 100 times higher than the EF values found in the literature generally for recent vehicles. These older vehicles are the most used in African countries and can be characterized as typical “African EFs”. In contrast, particles EFs for recent (under 10 years old) vehicle models are similar to published EF values for gasoline and of the same order of magnitude for diesel. The mean EFs of EC, OC and TPM are 0.62 ± 0.49, 1.10 ± 0.77 and 7.0 ± 2.80 g kg−1 fuel for road gasoline and 3.08 ± 1.96, 2.14 ± 1.20 and 34.70 ± 20.13 g kg−1 fuel for road diesel, respectively.
Finally, the EFs of more than 50 VOCs have been determined for the first time in West Africa and integrated into the GEIA VOC groups available for the development of emission inventories. These EFs showed that emission profiles are dominated by aromatics (up to 80 % for some traffic-related sources). The greatest emissions are observed for two-stroke two-wheelers, which can be higher than 3 orders of magnitude compared to the EFs observed from LD and HD vehicles. The presence of terpenes in biofuel burning emissions was considerable, as were heavy alkanes (iVOCs), reaching up to 50 % in diesel-related sources. Comparison to recent literature worldwide points out the greatest levels of anthropogenic African EF for VOC and the relevance of in situ measurements to derive realistic and representative emission factors. Such measurements should be complemented with experiences under controlled conditions.
This original database will be useful for improving and updating African emission inventories, which will reduce emission uncertainties and help to better assess impacts on climate, air quality and health. The emissions obtained with these new EFs in this study can also help to identify key source categories. This could help policy makers implement new policies to mitigate emissions from major emission sources.
The emission factor data from this study are original and are publicly available in the Supplement.
The supplement related to this article is available online at: https://doi.org/10.5194/acp-18-7691-2018-supplement.
The authors declare that they have no conflict of interest.
This article is part of the special issue “Results of the project `Dynamics-aerosol-chemistry-cloud interactions in West Africa' (DACCIWA) (ACP/AMT inter-journal SI)”. It is not associated with a conference.
This work has received funding from the European Union 7th Framework
Programme (FP7/2007-2013) under grant agreement no. 603502 (EU project
DACCIWA: Dynamics-aerosol-chemistry-cloud interactions in West Africa).
Sekou Keita would like to thank the AUF (Agence
Universitaire de la Francophonie) for funding his stays in Laboratoire
d'Aérologie of Toulouse (3 months per year during 3 years). Part of the
analysis of VOC tubes was graciously performed at the SAGE Department at IMT
Lille Douai (France) by Thierry Leonardis and Stéphane
Sauvage.
Edited by: Mathew Evans
Reviewed by: two anonymous referees
Ait-Helal, W., Borbon, A., Sauvage, S., de Gouw, J. A., Colomb, A., Gros, V., Freutel, F., Crippa, M., Afif, C., Baltensperger, U., Beekmann, M., Doussin, J.-F., Durand-Jolibois, R., Fronval, I., Grand, N., Leonardis, T., Lopez, M., Michoud, V., Miet, K., Perrier, S., Prévôt, A. S. H., Schneider, J., Siour, G., Zapf, P., and Locoge, N.: Volatile and intermediate volatility organic compounds in suburban Paris: variability, origin and importance for SOA formation, Atmos. Chem. Phys., 14, 10439–10464, https://doi.org/10.5194/acp-14-10439-2014, 2014.
Akagi, S. K., Yokelson, R. J., Wiedinmyer, C., Alvarado, M. J., Reid, J. S., Karl, T., Crounse, J. D., and Wennberg, P. O.: Emission factors for open and domestic biomass burning for use in atmospheric models, Atmos. Chem. Phys., 11, 4039–4072, https://doi.org/10.5194/acp-11-4039-2011, 2011.
Andreae, M. O. and Merlet, P.: Emission of trace gases and aerosols from biomass burning, Global Biogeochem. Cy., 15, 955–966, 2001.
Assamoi, E.-M. and Liousse, C.: A new inventory for two-wheel vehicle emissions in West Africa for 2002, Atmos. Environ., 44, 3985–3996, 2010.
Ban-Weiss, G. A., Lunden, M. M., Kirchstetter, T. W., and Harley, R. A.: Size-resolved particle number and volume emission factors for on-road gasoline and diesel motor vehicles, J. Aerosol Sci., 41, 5–12, 2010.
Bertschi, I. T., Yokelson, R. J., Ward, D. E., Christian, T. J., and Hao, W. M.: Trace gas emissions from the production and use of domestic biofuels in Zambia measured by open-path Fourier transform infrared spectroscopy, J. Geophys. Res.-Atmos., 108, 8469, https://doi.org/10.1029/2002JD002158, 2003.
Bond, T. C., Streets, D. G., Yarber, K. F., Nelson, S. M., Woo, J.-H., and Klimont, Z.: A technology-based global inventory of black and organic carbon emissions from combustion, J. Geophys. Res.-Atmos., 109, D14203, https://doi.org/10.1029/2003JD003697, 2004.
Bond, T. C., Doherty, S. J., Fahey, D. W., Forster, P. M., Berntsen, T., DeAngelo, B. J., Flanner, M. G., Ghan, S., Kärcher, B., Koch, D., Kinne, S., Kondo, Y., Quinn, P. K., Sarofim, M. C., Schultz, M. G., Schulz, M., Venkataraman, C., Zhang, H., Zhang, S., Bellouin, N., Guttikunda, S. K., Hopke, P. K., Jacobson, M. Z., Kaiser, J. W., Klimont, Z., Lohmann, U., Schwarz, J. P., Shindell, D., Storelvmo, T., Warren, S. G., and Zender, C. S.: Bounding the role of black carbon in the climate system: A scientific assessment: BLACK CARBON IN THE CLIMATE SYSTEM, J. Geophys. Res.-Atmos., 118, 5380–5552, https://doi.org/10.1002/jgrd.50171, 2013.
Boughedaoui, M., Chikhi, S., Driassa, N., Kerbachi, R., Vidon, R., and Joumard, R.: Mesure des émissions de VUL avec un système embarqué à Blida, in: Environnement et Transports dans des contextes différents, ENP Alger, 69–76, available at: https://hal.archives-ouvertes.fr/hal-01253510/ (last access: 5 February 2017), 2009.
Brocard, D.: Emissions atmosphériques des combustions domestiques?: étude des processus et détermination des sources à l'échelle régionale et globale en Afrique, Toulouse 3, available at: http://www.theses.fr/1996TOU30296 (last access: 2 March 2017), 1996.
Brocard, D., Lacaux, C., Lacaux, J.-P., Kouadio, G., and Yoboue, V.: Emissions from the combustion of biofuels in western Africa, Biomass Burn. Glob. Change, 1, 350–360, 1996.
Brocard, D., Lacaux, J.-P., and Eva, H.: Domestic biomass combustion and associated atmospheric emissions in West Africa, Global Biogeochem. Cy., 12, 127–139, https://doi.org/10.1029/97GB02269, 1998.
Brohez, S., Marlair, G., and Delvosalle, C.: Fire calorimetry relying on the use of the fire propagation apparatus. Part I: early learning from use in Europe, Fire Mater., 30, 131–149, https://doi.org/10.1002/fam.896, 2006.
Cachier, H., Bremond, M.-P., and Buat-MÉNARD, P.: Determination of atmospheric soot carbon with a simple thermal method, Tellus B, 41, 379–390, 1989.
Cachier, H., Liousse, C., Pertuisot, M.-H., Gaudichet, A., Echalar, F., and Lacaux, J.-P.: African fire particulate emissions and atmospheric influence, Biomass Burn, Global Change, 1, 428–440, 1996.
Chen, L.-W. A., Moosmüller, H., Arnott, W. P., Chow, J. C., Watson, J. G., Susott, R. A., Babbitt, R. E., Wold, C. E., Lincoln, E. N., and Hao, W. M.: Emissions from Laboratory Combustion of Wildland Fuels: Emission Factors and Source Profiles, Environ. Sci. Technol., 41, 4317–4325, https://doi.org/10.1021/es062364i, 2007.
Chiang, H.-L., Lai, Y.-M., and Chang, S.-Y.: Pollutant constituents of exhaust emitted from light-duty diesel vehicles, Atmos. Environ., 47, 399–406, https://doi.org/10.1016/j.atmosenv.2011.10.045, 2012.
Chow, J. C., Watson, J. G., Pritchett, L. C., Pierson, W. R., Frazier, C. A., and Purcell, R. G.: The DRI thermal/optical reflectance carbon analysis system: description, evaluation and applications in US air quality studies, Atmos. Environ., 27, 1185–1201, 1993.
Chow, J. C., Watson, J. G., Crow, D., Lowenthal, D. H., and Merrifield, T.: Comparison of IMPROVE and NIOSH carbon measurements, Aerosol Sci. Tech., 34, 23–34, 2001.
Christian, T. J., Yokelson, R. J., Cárdenas, B., Molina, L. T., Engling, G., and Hsu, S.-C.: Trace gas and particle emissions from domestic and industrial biofuel use and garbage burning in central Mexico, Atmos. Chem. Phys., 10, 565–584, https://doi.org/10.5194/acp-10-565-2010, 2010.
Danielsen, P. H., Møller, P., Jensen, K. A., Sharma, A. K., Wallin, H., Bossi, R., Autrup, H., Mølhave, L., Ravanat, J.-L., Briedé, J. J., de Kok, T. M., and Loft, S.: Oxidative Stress, DNA Damage, and Inflammation Induced by Ambient Air and Wood Smoke Particulate Matter in Human A549 and THP-1 Cell Lines, Chem. Res. Toxicol., 24, 168–184, https://doi.org/10.1021/tx100407m, 2011.
Derwent, R. G., Jenkin, M. E., Utembe, S. R., Shallcross, D. E., Murrells, T. P., and Passant, N. R.: Secondary organic aerosol formation from a large number of reactive man-made organic compounds, Sci. Total Environ., 408, 3374–3381, https://doi.org/10.1016/j.scitotenv.2010.04.013, 2010.
Detournay, A., Sauvage, S., Locoge, N., Gaudion, V., Leonardis, T., Fronval, I., Kaluzny, P., and Galloo, J.-C.: Development of a sampling method for the simultaneous monitoring of straight-chain alkanes, straight-chain saturated carbonyl compounds and monoterpenes in remote areas, J. Environ. Monitor., 13, 983–990, https://doi.org/10.1039/c0em00354a, 2011.
Dunmore, R. E., Hopkins, J. R., Lidster, R. T., Lee, J. D., Evans, M. J., Rickard, A. R., Lewis, A. C., and Hamilton, J. F.: Diesel-related hydrocarbons can dominate gas phase reactive carbon in megacities, Atmos. Chem. Phys., 15, 9983–9996, https://doi.org/10.5194/acp-15-9983-2015, 2015.
Eggleston, H. S., Buendia, L., Miwa, K., Ngara, T., and Tanabe, K.: IPCC guidelines for national greenhouse gas inventories, Inst. Glob. Environ. Strateg. Hayama Jpn., 2, 48–56, 2006.
Englert, N.: Fine particles and human health – a review of epidemiological studies, Toxicol. Lett., 149, 235–242, https://doi.org/10.1016/j.toxlet.2003.12.035, 2004.
Essoh, N. P. S.: Shipping and Invasion of Second-Hand Vehicles in West African Ports: Analysing the Factors and Market Effects at the Port of Abidjan, Am. J. Ind. Bus. Manag., 3, 209–221, https://doi.org/10.4236/ajibm.2013.32026, 2013.
Evtyugina, M., Alves, C., Calvo, A., Nunes, T., Tarelho, L., Duarte, M., Prozil, S. O., Evtuguin, D. V., and Pio, C.: VOC emissions from residential combustion of Southern and mid-European woods, Atmos. Environ., 83, 90–98, https://doi.org/10.1016/j.atmosenv.2013.10.050, 2014.
Ferek, R. J., Reid, J. S., Hobbs, P. V., Blake, D. R., and Liousse, C.: Emission factors of hydrocarbons, halocarbons, trace gases and particles from biomass burning in Brazil, J. Geophys. Res., 103, 107–32, 1998.
Fiedler, H., Solorzano Ochoa, G., Yu, G., Zhang, T., Marklund, S., and Lundin, L.: Hazardous Chemicals from Open Burning of Waste in Developing Countries–Final Report, U. N. Environ. Programme Div. Technol. Ind. Econ. Chem. Branch, 2010.
Gentner, D. R., Worton, D. R., Isaacman, G., Davis, L. C., Dallmann, T. R., Wood, E. C., Herndon, S. C., Goldstein, A. H., and Harley, R. A.: Chemical Composition of Gas-Phase Organic Carbon Emissions from Motor Vehicles and Implications for Ozone Production, Environ. Sci. Technol., 47, 11837–11848, https://doi.org/10.1021/es401470e, 2013.
Gillies, J. A. and Gertler, A. W.: Comparison and Evaluation of Chemically Speciated Mobile Source PM2.5 Particulate Matter Profiles, Japca J. Air Waste Ma., 50, 1459–1480, https://doi.org/10.1080/10473289.2000.10464186, 2000.
Granier, C., Bessagnet, B., Bond, T., D'Angiola, A., Denier van der Gon, H., Frost, G. J., Heil, A., Kaiser, J. W., Kinne, S., Klimont, Z., Kloster, S., Lamarque, J.-F., Liousse, C., Masui, T., Meleux, F., Mieville, A., Ohara, T., Raut, J.-C., Riahi, K., Schultz, M. G., Smith, S. J., Thompson, A., van Aardenne, J., van der Werf, G. R., and van Vuuren, D. P.: Evolution of anthropogenic and biomass burning emissions of air pollutants at global and regional scales during the 1980–2010 period, Clim. Change, 109, 163–190, https://doi.org/10.1007/s10584-011-0154-1, 2011.
Grieshop, A. P., Lipsky, E. M., Pekney, N. J., Takahama, S., and Robinson, A. L.: Fine particle emission factors from vehicles in a highway tunnel: Effects of fleet composition and season, Atmos. Environ., 40, 287–298, https://doi.org/10.1016/j.atmosenv.2006.03.064, 2006.
Guillon, A., Le Ménach, K., Flaud, P.-M., Marchand, N., Budzinski, H., and Villenave, E.: Chemical characterization and stable carbon isotopic composition of particulate Polycyclic Aromatic Hydrocarbons issued from combustion of 10 Mediterranean woods, Atmos. Chem. Phys., 13, 2703–2719, https://doi.org/10.5194/acp-13-2703-2013, 2013.
Guofeng, S., Siye, W., Wen, W., Yanyan, Z., Yujia, M., Bin, W., Rong, W., Wei, L., Huizhong, S., Ye, H., Yifeng, Y., Wei, W., Xilong, W., Xuejun, W., and Shu, T.: Emission Factors, Size Distributions, and Emission Inventories of Carbonaceous Particulate Matter from Residential Wood Combustion in Rural China, Environ. Sci. Technol., 46, 4207–4214, https://doi.org/10.1021/es203957u, 2012.
Gupta, P. K., Krishna Prasad, V., Sharma, C., Sarkar, A. K., Kant, Y., Badarinath, K. V. S., and Mitra, A. P.: CH4 emissions from biomass burning of shifting cultivation areas of tropical deciduous forests – experimental results from ground-based measurements, Chemosphere, 3, 133–143, https://doi.org/10.1016/S1465-9972(01)00003-4, 2001.
Hall, D., Wu, C.-Y., Hsu, Y.-M., Stormer, J., Engling, G., Capeto, K., Wang, J., Brown, S., Li, H.-W., and Yu, K.-M.: PAHs, carbonyls, VOCs and PM2.5 emission factors for pre-harvest burning of Florida sugarcane, Atmos. Environ., 55, 164–172, https://doi.org/10.1016/j.atmosenv.2012.03.034, 2012.
Haslett, S. L., Thomas, J. C., Morgan, W. T., Hadden, R., Liu, D., Allan, J. D., Williams, P. I., Keita, S., Liousse, C., and Coe, H.: Highly controlled, reproducible measurements of aerosol emissions from combustion of a common African biofuel source, Atmos. Chem. Phys., 18, 385–403, https://doi.org/10.5194/acp-18-385-2018, 2018.
Huang, G., Brook, R., Crippa, M., Janssens-Maenhout, G., Schieberle, C., Dore, C., Guizzardi, D., Muntean, M., Schaaf, E., and Friedrich, R.: Speciation of anthropogenic emissions of non-methane volatile organic compounds: a global gridded data set for 1970–2012, Atmos. Chem. Phys., 17, 7683–7701, https://doi.org/10.5194/acp-17-7683-2017, 2017.
Junker, C. and Liousse, C.: A global emission inventory of carbonaceous aerosol from historic records of fossil fuel and biofuel consumption for the period 1860–1997, Atmos. Chem. Phys., 8, 1195–1207, https://doi.org/10.5194/acp-8-1195-2008, 2008.
Kablan, N. H. J.: L'invasion des véhicules d'occasion en transit par le port d'Abidjan: le dynamisme ambivalent d'une activité en plein essor, Cah. O.-m., 63, 365–390, https://doi.org/10.4000/com.6044, 2010.
Kam, W., Cheung, K., Daher, N., and Sioutas, C.: Particulate matter (PM) concentrations in underground and ground-level rail systems of the Los Angeles Metro, Atmos. Environ., 45, 1506–1516, https://doi.org/10.1016/j.atmosenv.2010.12.049, 2011.
Kesselmeier, J. and Staudt, M.: Biogenic volatile organic compounds (VOC): an overview on emission, physiology and ecology, J. Atmos. Chem., 33, 23–88, 1999.
Kirchstetter, T. W., Harley, R. A., Kreisberg, N. M., Stolzenburg, M. R., and Hering, S. V.: On-road measurement of fine particle and nitrogen oxide emissions from light-and heavy-duty motor vehicles, Atmos. Environ., 33, 2955–2968, 1999.
Kituyi, E., Marufu, L., Huber, B., O. Wandiga, S., O. Jumba, I., O. Andreae, M., Helas, G.: Biofuel consumption rates and patterns in Kenya, Biomass Bioenergy, 20, 83–99, https://doi.org/10.1016/S0961-9534(00)00072-6, 2001.
Klimont, Z., Smith, S. J., and Cofala, J.: The last decade of global anthropogenic sulfur dioxide: 2000–2011 emissions, Environ. Res. Lett., 8, 014003, https://doi.org/10.1088/1748-9326/8/1/014003, 2013.
Knippertz, P., Evans, M. J., Field, P. R., Fink, A. H., Liousse, C., and Marsham, J. H.: The possible role of local air pollution in climate change in West Africa, Nat. Clim. Change, 5, 815–822, https://doi.org/10.1038/nclimate2727, 2015.
Lacaux, J.-P., Brocard, D., Lacaux, C., Delmas, R., Brou, A., Yoboué, V., and Koffi, M.: Traditional charcoal making: an important source of atmospheric pollution in the African tropics, Atmos. Res., 35, 71–76, 1994.
Li, Z., Che, W., Frey, H. C., Lau, A. K. H., and Lin, C.: Characterization of PM2.5 exposure concentration in transport microenvironments using portable monitors, Environ. Pollut., 228, 433–442, https://doi.org/10.1016/j.envpol.2017.05.039, 2017.
Liousse, C., Assamoi, E., Criqui, P., Granier, C., and Rosset, R.: Explosive growth in African combustion emissions from 2005 to 2030, Environ. Res. Lett., 9, 035003, https://doi.org/10.1088/1748-9326/9/3/035003, 2014.
Lundin, L., Gullett, B., Carroll, W. F., Touati, A., Marklund, S., and Fiedler, H.: The effect of developing nations' municipal waste composition on PCDD/PCDF emissions from open burning, Atmos. Environ., 79, 433–441, https://doi.org/10.1016/j.atmosenv.2013.06.040, 2013.
Marticorena, B., Chatenet, B., Rajot, J. L., Traoré, S., Coulibaly, M., Diallo, A., Koné, I., Maman, A., NDiaye, T., and Zakou, A.: Temporal variability of mineral dust concentrations over West Africa: analyses of a pluriannual monitoring from the AMMA Sahelian Dust Transect, Atmos. Chem. Phys., 10, 8899–8915, https://doi.org/10.5194/acp-10-8899-2010, 2010.
Matsui, H., Koike, M., Takegawa, N., Kondo, Y., Griffin, R. J., Miyazaki, Y., Yokouchi, Y., and Ohara, T.: Secondary organic aerosol formation in urban air: Temporal variations and possible contributions from unidentified hydrocarbons, J. Geophys. Res., 114, D04201, https://doi.org/10.1029/2008JD010164, 2009.
McDonald, J. D., Zielinska, B., Fujita, E. M., Sagebiel, J. C., Chow, J. C., and Watson, J. G.: Fine particle and gaseous emission rates from residential wood combustion, Environ. Sci. Technol., 34, 2080–2091, 2000.
Ministry of Transport: Ministère des Transports – Republique de Côte d'Ivoire, available at: http://www.transports.gouv.ci/projetsuite.php?rd=2 (last access: 19 September 2017), 2012.
Montero, L., Duane, M., Manfredi, U., Astorga, C., Martini, G., Carriero, M., Krasenbrink, A., and Larsen, B. R.: Hydrocarbon emission fingerprints from contemporary vehicle/engine technologies with conventional and new fuels, Atmos. Environ., 44, 2167–2175, https://doi.org/10.1016/j.atmosenv.2010.03.027, 2010.
Ozturk, I. and Bilgili, F.: Economic growth and biomass consumption nexus: Dynamic panel analysis for Sub-Sahara African countries, Appl. Energ., 137, 110–116, https://doi.org/10.1016/j.apenergy.2014.10.017, 2015.
Pandis, S. N. and Seinfeld, J. H.: Atmospheric chemistry and physics: From air pollution to climate change, Wiley, 2006.
Pant, P. and Harrison, R. M.: Estimation of the contribution of road traffic emissions to particulate matter concentrations from field measurements: A review, Atmos. Environ., 77, 78–97, https://doi.org/10.1016/j.atmosenv.2013.04.028, 2013.
Peltier, R. E., Cromar, K. R., Ma, Y., Fan, Z.-H., and Lippmann, M.: Spatial and seasonal distribution of aerosol chemical components in New York City: (2) Road dust and other tracers of traffic-generated air pollution, J. Expo. Sci. Env. Epid., 21, 484–494, https://doi.org/10.1038/jes.2011.15, 2011.
Pennise, D. M., Smith, K. R., Kithinji, J. P., Rezende, M. E., Raad, T. J., Zhang, J., and Fan, C.: Emissions of greenhouse gases and other airborne pollutants from charcoal making in Kenya and Brazil, J. Geophys. Res.-Atmos., 106, 24143–24155, https://doi.org/10.1029/2000JD000041, 2001.
Petzold, A., Ogren, J. A., Fiebig, M., Laj, P., Li, S.-M., Baltensperger, U., Holzer-Popp, T., Kinne, S., Pappalardo, G., Sugimoto, N., Wehrli, C., Wiedensohler, A., and Zhang, X.-Y.: Recommendations for reporting “black carbon” measurements, Atmos. Chem. Phys., 13, 8365–8379, https://doi.org/10.5194/acp-13-8365-2013, 2013.
Pope, C. A., Ezzati, M., and Dockery, D. W.: Fine-Particulate Air Pollution and Life Expectancy in the United States, New Engl. J. Med., 360, 376–386, https://doi.org/10.1056/NEJMsa0805646, 2009.
Purvis, C. R., McCrillis, R. C., and Kariher, P. H.: Fine Particulate Matter (PM) and Organic Speciation of Fireplace Emissions, Environ. Sci. Technol., 34, 1653–1658, https://doi.org/10.1021/es981006f, 2000.
Radke, L. F., Hegg, D. A., Lyons, J. H., Brock, C. A., Hobbs, P. V., Weiss, R., and Rasmussen, R.: Airborne measurements on smokes from biomass burning, in: Aerosols and climate, edited by: Hobbs, P. V. and McCormick, M. P., A. Deepak Publishing Co, Hampton, VA, 411–422, 1988.
Robert, M. A., VanBergen, S., Kleeman, M. J., and Jakober, C. A.: Size and composition distributions of particulate matter emissions: Part 1 – Light-duty gasoline vehicles, Japca J. Air Waste Ma., 57, 1414–1428, 2007.
Roden, C. A., Bond, T. C., Conway, S., and Pinel, A. B. O.: Emission Factors and Real-Time Optical Properties of Particles Emitted from Traditional Wood Burning Cookstoves, Environ. Sci. Technol., 40, 6750–6757, https://doi.org/10.1021/es052080i, 2006.
Sharma, S., Goel, A., Gupta, D., Kumar, A., Mishra, A., Kundu, S., Chatani, S., and Klimont, Z.: Emission inventory of non-methane volatile organic compounds from anthropogenic sources in India, Atmos. Environ., 102, 209–219, https://doi.org/10.1016/j.atmosenv.2014.11.070, 2015.
Shen, G., Yang, Y., Wang, W., Tao, S., Zhu, C., Min, Y., Xue, M., Ding, J., Wang, B., Wang, R., Shen, H., Li, W., Wang, X., and Russell, A. G.: Emission Factors of Particulate Matter and Elemental Carbon for Crop Residues and Coals Burned in Typical Household Stoves in China, Environ. Sci. Technol., 44, 7157–7162, https://doi.org/10.1021/es101313y, 2010.
SIE CI: Rapport Côte d'Ivoire Energie 2010, available at: http://www.ecowrex.org/system/files/repository/2010_rapport_annuel_sie_-_min_ener.pdf (last access: 27 May 2018), 2010.
Smith, K. R., Pennise, D. M., Khummongkol, P., Chaiwong, V., Ritgeen, K., and Zhang, J.: Greenhouse gases from small-scale combustion devices in developing countries: Charcoal-making kilns in Thailand, available at: http://ehsdiv.sph.berkeley.edu/krsmith/publications/99_smith_2.pdf (last access: 11 February 2017), 1999.
Smith, S. J., van Aardenne, J., Klimont, Z., Andres, R. J., Volke, A., and Delgado Arias, S.: Anthropogenic sulfur dioxide emissions: 1850–2005, Atmos. Chem. Phys., 11, 1101–1116, https://doi.org/10.5194/acp-11-1101-2011, 2011.
Streets, D. G., Gupta, S., Waldhoff, S. T., Wang, M. Q., Bond, T. C., and Yiyun, B.: Black carbon emissions in China, Atmos. Environ., 35, 4281–4296, https://doi.org/10.1016/S1352-2310(01)00179-0, 2001.
Tsai, J.-H., Hsu, Y.-C., Weng, H.-C., Lin, W.-Y., and Jeng, F.-T.: Air pollutant emission factors from new and in-use motorcycles, Atmos. Environ., 34, 4747–4754, https://doi.org/10.1016/S1352-2310(00)00270-3, 2000.
Tsai, J.-H., Chiang, H.-L., Hsu, Y.-C., Weng, H.-C., and Yang, C.-Y.: The speciation of volatile organic compounds (VOCs) from motorcycle engine exhaust at different driving modes, Atmos. Environ., 37, 2485–2496, https://doi.org/10.1016/S1352-2310(03)00177-8, 2003.
UNEP: United Nations Environment Programme. Diesel Fuel Sulphur Levels: Global Status, available at: http://www.unep.org/ transport/pcfv (last access: 27 May 2018), 2017.
Val, S., Liousse, C., Doumbia, E. H. T., Galy-Lacaux, C., Cachier, H., Marchand, N., Badel, A., Gardrat, E., Sylvestre, A., and Baeza-Squiban, A.: Physico-chemical characterization of African urban aerosols (Bamako in Mali and Dakar in Senegal) and their toxic effects in human bronchial epithelial cells: description of a worrying situation, Part. Fibre Toxicol., 10, 1–16, https://doi.org/10.1186/1743-8977-10-10, 2013.
Volckens, J., Olson, D. A., and Hays, M. D.: Carbonaceous species emitted from handheld two-stroke engines, Atmos. Environ., 42, 1239–1248, 2008.
Wang, X., Westerdahl, D., Hu, J., Wu, Y., Yin, H., Pan, X., and Max Zhang, K.: On-road diesel vehicle emission factors for nitrogen oxides and black carbon in two Chinese cities, Atmos. Environ., 46, 45–55, https://doi.org/10.1016/j.atmosenv.2011.10.033, 2012.
Wang, Y., Xing, Z., Zhao, S., Zheng, M., Mu, C., and Du, K.: Are emissions of black carbon from gasoline vehicles overestimated? Real-time, in situ measurement of black carbon emission factors, Sci. Total Environ., 547, 422–428, https://doi.org/10.1016/j.scitotenv.2015.12.115, 2016.
Wang, Z., Gu, C., Li, F., Bale, P., and Sun, H.: Active demand response using shared energy storage for household energy management, IEEE T. Smart Grid, 4, 1888–1897, 2013.
Ward, D. E. and Radke, L. F.: Emissions measurements from vegetation fires: A comparative evaluation of methods and results, available at: http://www.treesearch.fs.fed.us/pubs/40604 (last access: 13 March 2017), 1993.
Westerdahl, D., Wang, X., Pan, X., and Zhang, K. M.: Characterization of on-road vehicle emission factors and microenvironmental air quality in Beijing, China, Atmos. Environ., 43, 697–705, https://doi.org/10.1016/j.atmosenv.2008.09.042, 2009.
Wiedinmyer, C., Yokelson, R. J., and Gullett, B. K.: Global Emissions of Trace Gases, Particulate Matter, and Hazardous Air Pollutants from Open Burning of Domestic Waste, Environ. Sci. Technol., 48, 9523–9530, https://doi.org/10.1021/es502250z, 2014.
Yokelson, R. J., Griffith, D. W. T., and Ward, D. E.: Open-path Fourier transform infrared studies of large-scale laboratory biomass fires, J. Geophys. Res.-Atmos., 101, 21067–21080, https://doi.org/10.1029/96JD01800, 1996.
Yokelson, R. J., Karl, T., Artaxo, P., Blake, D. R., Christian, T. J., Griffith, D. W. T., Guenther, A., and Hao, W. M.: The Tropical Forest and Fire Emissions Experiment: overview and airborne fire emission factor measurements, Atmos. Chem. Phys., 7, 5175–5196, https://doi.org/10.5194/acp-7-5175-2007, 2007.
Yokelson, R. J., Crounse, J. D., DeCarlo, P. F., Karl, T., Urbanski, S., Atlas, E., Campos, T., Shinozuka, Y., Kapustin, V., Clarke, A. D., Weinheimer, A., Knapp, D. J., Montzka, D. D., Holloway, J., Weibring, P., Flocke, F., Zheng, W., Toohey, D., Wennberg, P. O., Wiedinmyer, C., Mauldin, L., Fried, A., Richter, D., Walega, J., Jimenez, J. L., Adachi, K., Buseck, P. R., Hall, S. R., and Shetter, R.: Emissions from biomass burning in the Yucatan, Atmos. Chem. Phys., 9, 5785–5812, https://doi.org/10.5194/acp-9-5785-2009, 2009.
Zhang, Y. and Tao, S.: Global atmospheric emission inventory of polycyclic aromatic hydrocarbons (PAHs) for 2004, Atmos. Environ., 43, 812–819, 2009.
Zhao, Y., Nielsen, C. P., Lei, Y., McElroy, M. B., and Hao, J.: Quantifying the uncertainties of a bottom-up emission inventory of anthropogenic atmospheric pollutants in China, Atmos. Chem. Phys., 11, 2295–2308, https://doi.org/10.5194/acp-11-2295-2011, 2011.