the Creative Commons Attribution 4.0 License.
the Creative Commons Attribution 4.0 License.
 | 09 Oct 2018
Ice crystal number concentration estimates from lidar–radar satellite remote sensing – Part 1: Method and evaluation
Odran Sourdeval
Edward Gryspeerdt
Martina Krämer
Tom Goren
Julien Delanoë
Armin Afchine
Friederike Hemmer
Johannes Quaas
The number concentration of cloud particles is a key quantity for understanding aerosol–cloud interactions and describing clouds in climate and numerical weather prediction models. In contrast with recent advances for liquid clouds, few observational constraints exist regarding the ice crystal number concentration (Ni). This study investigates how combined lidar–radar measurements can be used to provide satellite estimates of Ni, using a methodology that constrains moments of a parameterized particle size distribution (PSD). The operational liDAR–raDAR (DARDAR) product serves as an existing base for this method, which focuses on ice clouds with temperatures ∘C.
Theoretical considerations demonstrate the capability for accurate retrievals of Ni, apart from a possible bias in the concentration in small crystals when Tc≳−50 ∘C, due to the assumption of a monomodal PSD shape in the current method. This is verified via a comparison of satellite estimates to coincident in situ measurements, which additionally demonstrates the sufficient sensitivity of lidar–radar observations to Ni. Following these results, satellite estimates of Ni are evaluated in the context of a case study and a preliminary climatological analysis based on 10 years of global data. Despite a lack of other large-scale references, this evaluation shows a reasonable physical consistency in Ni spatial distribution patterns. Notably, increases in Ni are found towards cold temperatures and, more significantly, in the presence of strong updrafts, such as those related to convective or orographic uplifts. Further evaluation and improvement of this method are necessary, although these results already constitute a first encouraging step towards large-scale observational constraints for Ni. Part 2 of this series uses this new dataset to examine the controls on Ni.
- Article
(12124 KB) - Full-text XML
- Companion paper
-
Supplement
(2072 KB) - BibTeX
- EndNote


Clouds play a major role in the climate system and are essential components of the Earth–atmosphere radiation balance (Stephens, 2005). Therefore, a precise understanding of their properties and processes is necessary to properly address current uncertainties regarding climate change estimates (Boucher et al., 2013). In particular, the impact of ice clouds on the Earth's radiation budget is recognized as being substantial Liou (e.g., 1986); Stephens et al. (e.g., 1990) but still remains difficult to quantify due to the large variability and complexity of their radiative, macro- and micro-physical properties (Zhang et al., 1999; Baran, 2009).
Because of their high spatial and temporal coverage, satellite observations are excellent tools to answer these questions (Lohmann et al., 2007). The A-Train satellite constellation offers a unique synergy between a wide range of active and passive instruments (Stephens et al., 2002), meaning that numerous methods now exist to provide spaceborne retrievals of ice cloud properties. For instance, bispectral approaches based on passive visible (Nakajima and King, 1990) or thermal infrared (Inoue, 1985) measurements are often used to directly infer the cloud optical depth (τc) and ice crystal effective radius (effective radius is hereafter referred to as reff) (e.g., King et al., 1998; Sourdeval et al., 2013). Direct retrievals of the vertically integrated ice water content (IWC) – the ice water path (IWP) – can also be obtained from these channels (Guignard et al., 2012; Sourdeval et al., 2015), passive microwave sensors (Gong and Wu, 2014) or a synergy of both (Holl et al., 2014). Vertical profiles of the cloud visible extinction (αext), IWC and ice crystal reff are commonly provided using lidar and/or radar measurements (e.g., Vaughan et al., 2009; Austin et al., 2009; Delanoë and Hogan, 2010). However, only a few developments to date have focused on the ice crystal number concentration (Ni).
The lack of Ni retrievals from satellites contrasts with the importance of this quantity for understanding and describing ice cloud processes (Comstock et al., 2008). Along with the mass concentration, the number concentration is often used as a prognostic variable in two-moment bulk microphysics schemes that predict the evolution of clouds in recent climate and numerical weather prediction models (Khain et al., 2000; Seifert and Beheng, 2006). Therefore, an absence of global observational constraints limits the evaluation of model predictions to sparser in situ measurements (e.g., Jensen et al., 1994; Zhang et al., 2013; Farrington et al., 2016). Moreover, Ni appears as a particularly useful metric to quantify aerosol–cloud interactions due its potentially close link with the aerosol concentration (Kärcher and Ström, 2003; Kay and Wood, 2008; Hendricks et al., 2011). Consequently, while numerous studies have (for the abovementioned reasons) used satellite estimates of the cloud droplet number concentration (Nd) to evaluate the indirect aerosol radiative forcing (Boers et al., 2006; Quaas et al., 2006, 2008; Gryspeerdt et al., 2016), the contribution of ice clouds to this effect remains largely unknown (Heyn et al., 2017).
One reason for this absence of a global Ni dataset lies in the difficulty of directly linking this quantity to other commonly retrieved cloud properties. For liquid clouds, Nd can, for instance, be inferred through relationships between satellite retrievals of τc and the droplet reff (Han et al., 1998; Brenguier et al., 2000). These relationships rely on strong assumptions that have shortcomings (Grosvenor et al., 2018); nonetheless, they provide Nd values that compare well against in situ observations (Painemal and Zuidema, 2011) and can be used to establish climatologies (Bennartz and Rausch, 2017) and study aerosol–cloud interactions (Han et al., 2002; Quaas et al., 2008). Such relationships are less trivial for ice clouds due to the high complexity and variability of ice nucleation processes (Kärcher and Lohmann, 2002, 2003; Ickes et al., 2015). Recent attempts have been made, e.g., by Mitchell et al. (2016, 2018) who linked (by providing additional lidar information) the absorption τc and ice crystal reff to Ni for thin single-layer ice clouds, although rigorous validation remains necessary.
An alternative approach to estimate Ni has arisen with the emergence of retrieval methods aiming at directly constraining parameters of particle size distributions (PSDs) from remote sensing observations. Indeed, provided that a PSD is properly estimated, the corresponding number concentration (the zeroth moment of the PSD, or ℳ0) can be extracted. Important developments regarding applying these methods to satellite observations can be attributed to Austin and Stephens (2001) who, through an elaborate variational scheme, used the sensitivity of radar reflectivity (Ze) and τc to other moments, namely ℳ6 and ℳ2, respectively, to constrain PSD shape parameters. This method, initially dedicated to liquid clouds, allowed for the retrieval of profiles of droplet geometric mean radius and a vertically homogeneous Nd. This work was later extended to ice clouds by Benedetti et al. (2003) and further improved by Austin et al. (2009) to perform retrievals of Ni profiles using better a priori assumptions. These developments are now implemented in the operational CloudSat 2B-CWC-RO product, which has been extensively used to study the IWC (e.g., Wu et al., 2009; Waliser et al., 2009; Eliasson et al., 2011), although its Ni product remains to be thoroughly evaluated. Notably, Protat et al. (2010) highlighted the need to improve these Ni retrievals prior to quantitative use through comparisons with ground-based lidar–radar cloud products. Protat et al. (2010) argued that radar-only methods lack sensitivity to Ni profiles due to the dominant contribution of small ice particles to the total number concentration, whereas the combined use of a lidar extinction backscatter coefficient (βext) would help to further constrain the amount of small particles. However, no operational estimation of Ni from satellite lidar–radar observations has been attempted to date.
Based on these early developments, this study aims to investigate the capabilities of lidar–radar methods to estimate Ni by producing and evaluating a new dataset based on the operational liDAR–raDAR (DARDAR, Delanoë and Hogan, 2010) product. DARDAR retrieves profiles of ice cloud properties by combining measurements from the CloudSat Cloud Profiling Radar (CPR) and the Cloud-Aerosol Lidar with Orthogonal Polarization (CALIOP). Although DARDAR does not operationally provide Ni, and has not been tested for this purpose, its retrieval framework that aims at constraining parameters of a PSD parameterization (Delanoë et al., 2005, hereinafter D05) makes it a suitable candidate to estimate this quantity. Nevertheless, a careful evaluation remains necessary to determine if the D05 parameterization is theoretically capable of predicting Ni and if lidar and/or radar measurements can provide sufficient information to properly constrain it. Therefore, a threefold evaluation is performed here to investigate the quality of these lidar–radar Ni estimates based on comparisons to in situ observations, a case study and a brief climatological analysis.
The paper is structured as follows: Sect. 2 presents the methodology used to estimate Ni from current DARDAR products. Section 3 describes the data utilized in this study. The ability of DARDAR to retrieve in situ measurements of Ni is investigated in Sect. 4. Then, Sect. 5 discusses the vertical structure of Ni estimates along a short orbit, and Sect. 6 proposes a brief analysis of Ni climatologies. Finally, Sect. 7 concludes this study. Algorithmic limitations and uncertainties are discussed in the Appendix. The second part of this series (Gryspeerdt et al., 2018b) will use this new dataset to investigate the processes controlling Ni.
2.1 Representation of the size distribution
Ni can be expressed as the integral of a given ice particle size distribution N(D):
where D is the particle dimension (hereinafter the maximum diameter). Hence, Ni corresponds to the moment zero of the PSD, noted ℳ0. Other moments also relate to various cloud properties (e.g., to the IWC, through mass–dimension relations, or to ) and to remote sensing measurements (e.g., βext relates to ℳ2 and Ze to ℳ6), demonstrating that PSDs act as crucial links between physical parameters and observations. However, the lidar extinction βext and the radar reflectivity Ze each provide information on a single moment of the PSD and so, assuming a pair of single-wavelength measurements, their combination is not sufficient to fully constrain every aspect of a complex PSD; simplifications are necessary.
Parameterizing PSDs is a challenging task due to the large variability of their shapes on a global scale or even within a cloud layer (e.g., Mitchell et al., 2011; Krämer et al., 2016). Nevertheless, D05 and Field et al. (2005) showed that two-moment normalization methods can be used to reasonably approximate a wide range of measured size distributions to a single shape function, noted F, referred to as a “universal” or “normalized” PSD. By normalization it is meant that the dimension and concentration axes are carefully scaled in order to make F independent of parameters that strongly influence the shape of the original PSD.
This study will focus on the D05 parameterization, which is used in DARDAR (see Sect. 3.1) to relate lidar–radar measurements to ice cloud properties. In D05, a normalization factor noted and the ice crystal mean volume-weighted diameter Dm (defined as ℳ4∕ℳ3) serve as scaling parameters to the concentration and dimension axes, respectively. The normalization process can then be summarized as
where Dm and are specifically set to make F independent of the IWC and Dm of the original PSD (i.e., they become constant after normalization). The ice crystal size is represented by the equivalent melted diameter, Deq, which relates to D through
where ρw = 1000 kg m−3 is the density of liquid water and m(D) is a given mass–dimension (m−D) relationship. DARDAR uses the empirical m−D formulas by Brown and Francis (1995) when D>300 µm and by Mitchell (1996) otherwise. D05 demonstrated using in situ measurements that this approach allows the accurate prediction of ℳ2 and ℳ6. Inversely, βext and Ze can be used to constrain these moments, infer the associated scaling parameters and reproduce the original PSD using Eq. (2).
D05 further concluded that a four-parameter gamma-modified distribution,
allows the parameterization to properly fit in situ measurements from midlatitude and tropical regions. In DARDAR, α and β are two fixed parameters that were chosen to best fit these measurements ( and β=3), whereas N0 and k are iteratively adjusted during the retrieval process to fit observational constraints through their relations to the scaling parameters, as shown in Sect. 2.2.
2.2 Extracting Ni from DARDAR
Considering the gamma-modified function in Eq. (4) to describe the shape of N(D) in Eq. (1), and because the total number of particles is independent of the choice of a dimensional variable, Ni in DARDAR corresponds to
Because α and β are fixed, Ni can be computed given a knowledge of N0 and k. These two parameters are not part of the operational products but can be deduced from their link to other retrieved properties. Here, it is demonstrated how retrievals of IWC and can be used to determine Dm, deduce N0 and k, and subsequently estimate Ni. A strict consistency with the current version of DARDAR is respected to ensure that Ni estimates are meaningful; possible improvements, such as those proposed by Delanoë et al. (2014, hereinafter D14) for future DARDAR versions, are not included at this stage.
As mentioned in Sect. 2.1, the scaling parameters and Dm are defined so that N(Deq) becomes independent of IWC and Dm after normalization. Using the definition of N(Deq) from Eq. (2) to rewrite Dm, the latter condition leads to , with the nth moment of the normalized PSD F(Deq∕Dm). Subsequently, and must be equal to an arbitrary constant, which was set by D05 to Γ(4)∕44. By inserting Eq. (4) into Eq. (2), and after simplification of the definite integral, becomes
Based on this equation, the conditions and lead to two unique relationships between the PSD parameters k and N0 and the scaling variables and Dm:
and
Hence, providing and Dm, Eqs. (7) and (8) can be inserted into Eq. (5) to compute Ni.
The scaling parameter is provided in DARDAR, whereas Dm can be deduced from other cloud properties. For instance, considering that IWC for equivalent-melted spheres, and by using Eq. (2) to demonstrate that , Dm relates to IWC and following
3.1 Satellite retrievals
Global DARDAR retrievals of IWC and are used to compute Ni, following the methodology described in Sect. 2. This section only provides a brief introduction to this algorithm; the reader is invited to refer to Delanoë and Hogan (2008, 2010) for further details.
DARDAR (currently v2.1.1) uses a variational method that merges measurements from CALIOP (βext) and CPR (Ze) to constrain the scaling parameters of D05 and infer profiles of various ice cloud properties such as αext, IWC and reff. DARDAR retrievals are provided with a vertical resolution of 60 m along the CloudSat footprint (about 1.7 km of horizontal resolution), i.e., globally with Equator crossings around 01:30 and 13:30 local time.
The position and thermodynamic phase of cloud layers are determined prior to the retrieval process (Ceccaldi et al., 2013) by merging satellite observations with reanalyses from the European Centre for Medium-Range Weather Forecasts (ECMWF). To avoid possibly strong uncertainties in retrievals of the cloud phase and/or properties, only purely ice clouds that are not situated below supercooled or liquid layers are considered in this study (i.e., layers identified as supercooled or mixed-phase are ignored).
DARDAR has been extensively used for improving our understanding of clouds and precipitations (e.g., Battaglia and Delanoë, 2013; Protat et al., 2014; Feofilov et al., 2015; Massie et al., 2016). It has also been evaluated against products from a similar lidar–radar method (Deng et al., 2010) and in situ observations. Notably, Deng et al. (2012) found good agreements between the retrievals of IWC, reff and αext from both methods, which also compared well against coincident in situ observations, despite a small overestimation noted for IWCs retrieved by DARDAR in lidar-only conditions.
DARDAR retrievals from 2006 to 2016 are used here to produce a 10-year Ni dataset. It can be noted that DARDAR products are not continuously available throughout this period due to gaps in the CloudSat measurements. However, such discontinuities should not affect the following conclusions, as precise analyses of Ni patterns (e.g., trends or diurnal cycles) are not intended in this study. To avoid possible confusion with the operational product, the research-level Ni dataset obtained here will be referred to as DARDAR-Nice (liDAR–raDAR-Number concentration of ICE particles).
It can be noted that, as with any retrieval algorithm, DARDAR depends on assumptions made on non-retrieved parameters used in its forward model to simulate lidar and radar measurements. Furthermore, additional hypotheses are needed in the absence of information from one instrument, as discussed in Sect. A1. Thanks to its use of a statistical approach, DARDAR is able to rigorously propagate assumed errors on non-retrieved forward model parameters or any other a priori assumptions on its retrievals. A propagation of the errors attached to IWC and on Ni shows relative uncertainties from about 20 % to 50 % on this parameter (see Sect. A2). Expectedly, these uncertainties are lowest when lidar and radar measurements are available together. However, these numbers do not provide a complete estimation of the accuracy of Ni as DARDAR does not rigorously account for uncertainties related to assumptions on the PSD shape. A preliminary sensitivity study has shown that strong deviations from the assumed α and β parameters could reasonably lead to errors of up to 50 % on Ni (see Sect. A3). Therefore, the overall uncertainties on Ni due to instrumental sensitivity and physical assumptions are difficult to quantify based on DARDAR products alone. This study instead aims at evaluating the quality of these satellite Ni estimates through comparisons to in situ measurements.
3.2 In situ measurements
In situ PSD measurements from midlatitude and tropical ice clouds are required to evaluate the satellite estimates of Ni. This evaluation must determine if (i) the PSD parameterization used in DARDAR (i.e., D05) is capable of predicting ℳ0, and (ii) there is enough sensitivity in lidar–radar measurements to properly constrain Ni. Thus, a few conditions are set for this evaluation. To answer (i), it is preferable that the measurements used in this evaluation are independent of those utilized by D05 to build the PSD parameterization. Answering (ii) additionally requires measurements from flights that are coincident with the CloudSat overpass. Finally, (i) and (ii) require usable measurements of the concentration of small ice crystals (i.e., D<100 µm), which highly contribute to Ni. This implies that the possible phenomena of ice crystal shattering on the probe tips and inlets (Korolev et al., 2011, 2013) must be accounted for to a reasonable extent, through combined specific instrumental design and post-processing (Field et al., 2006; Korolev and Field, 2015).
3.2.1 Airborne instruments and campaigns
Table 1Description of the in situ campaigns. The numbers correspond to PSDs averaged over 10 s periods and for ice clouds with ∘C. refers to the average true air speed.
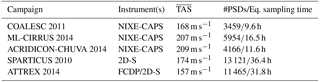
Measurements from five recent airborne campaigns are used during this evaluation process. Three campaigns are described in the “Cirrus Guide Part I” by Krämer et al. (2016): COALESC 2011 (Combined Observation of the Atmospheric boundary Layer to study the Evolution of Strato-Cumulus; Osborne et al., 2014), ML-CIRRUS 2014 (Mid-Latitude CIRRUS; Voigt et al., 2016) and ACRIDICON-CHUVA 2014 (Aerosol, Cloud, Precipitation, and Radiation Interactions and Dynamics of Convective Cloud Systems; Wendisch et al., 2016). Another two campaigns took place over the USA and the tropical Pacific: SPARTICUS 2010 (Small PARTicles In CirrUS; Mace et al., 2009) and ATTREX 2014 (Airborne Tropical TRopopause EXperiment-2014; Jensen et al., 2015). A detailed description of these field campaigns and their instrumentation can be found in the abovementioned references; therefore, no descriptions are given here. However, a brief summary of the information relevant to this evaluation is provided below and in Table 1.
The COALESC campaign involved 16 flights performed by the BAe-146 aircraft of the Facility for Airborne Atmospheric Measurements over the southeast coast of England and Wales, during February and March 2011. Despite the fact that the main objectives of COALESC focused on stratocumulus clouds, numerous flights also involved direct measurements of PSDs within mixed-phase and cirrus clouds. The instrumentation for cloud particle measurements notably involved the NIXE-CAPS (Novel Ice Experiment – Cloud-Aerosol Spectrometer) (Meyer, 2012; Luebke et al., 2016), which provides distributions of the number concentration of particles with sizes from 0.6 to 937 µm. This instrument consists of a combination of the CAS-DPOL (Cloud and Aerosol Spectrometer with Depolarization) probe for particles smaller than 50 µm and the cloud imaging probe (CIPg) for particles larger than 15 µm. The in-cloud PSDs are combined from CAS-Dpol (3.0 to 20 µm) and CIPg (>20 µm). It should be noted that the NIXE-CAPS inlets have been designed to limit the occurrence of shattering effects, which are further reduced through the use of post-processing by inter-arrival time algorithms. Flight details and additional information regarding the NIXE-CAPS instrument and its uncertainties are provided in Costa et al. (2017) and Meyer (2012), respectively.
ML-CIRRUS took place in March and April 2014 over Europe and the North Atlantic. This campaign aimed at investigating nucleation and life cycle processes in cirrus clouds, as well as their impact on climate. The High Altitude and LOng range (HALO) aircraft flew a total of 16 flights, including 40 h dedicated to the remote sensing or in situ measurement of cirrus clouds. In a similar fashion to COALESC, cloud particle measurements were performed by the NIXE-CAPS probe. The reader can refer to Luebke et al. (2016) for further details on these measurements during ML-CIRRUS.
ACRIDICON-CHUVA took place in September 2014 over the Amazonian forest with the primary goal of studying the role of anthropogenic aerosols on the life cycle of deep convective clouds and precipitation. This campaign involved the HALO aircraft, which performed 13 research flights for a total of 96 h. The cloud particle measurements were performed by the NIXE-CAPS probe. The algorithms to remove shattered ice fragments were not automatically applied to avoid the possible erroneous removal of small droplets in warm and mixed-phase clouds. However, applying the inter-arrival time algorithms generally only negligibly changes the cirrus ice particle concentrations, as the crystals in cold cirrus do not grow to sizes that are subject to shattering in most cases. Further details on the use of NIXE-CAPS during ACRIDICON-CHUVA can be found in Costa et al. (2017).
The ATTREX-2014 mission took place between February and March 2014 over the tropical western Pacific. Six flights were performed by the NASA Global Hawk aircraft, for a total of 34 h of measurements inside cirrus clouds within the tropical tropopause layer (TTL, i.e., from an altitude of about 14 to 19 km). Concentrations of small- to moderate-size particles were measured by two instruments: a two-dimension stereo (2D-S) probe (Lawson et al., 2006) for particle sizes between 5 and 1280 µm (extended to 3205 µm using the time dimension) with a maximal bin resolution of 10 µm, and a Fast Cloud Droplet Probe (FCDP) for sizes from 1 to 50 µm. Different processing methods, noted Mi, are available to determine particle concentrations and sizes from the 2D-S probe (Lawson, 2011). PSDs used here have been processed with M1 or M7 when available. Erfani and Mitchell (2016) found no significant differences in the concentration of small particles from these two methods. The 2D-S was specifically developed to limit ice shattering through probe inlet design and is combined with a post-processing treatment based on an inter-arrival time algorithm (Lawson, 2011). However, it should be noted that concentrations measured in its first two bins (i.e., for particles smaller than 25 µm) may suffer from large uncertainties (Jensen et al., 2013b; Gurganus and Lawson, 2018), which must be considered when selecting a minimal size threshold for computing Ni (see Sect. 3.3). The FCDP is also considered to be efficient at removing shattered particles (McFarquhar et al., 2007). Therefore, these two instruments are combined here to improve the description of small particles in PSD measurements. The FCDP is used to provide the concentration of particles from 3 to 24 µm (i.e., 10 bins) and the 2D-S is used from 25 (i.e., its third bin) to 3205 µm. The 1 µm gap is accounted for by scaling the concentration of the last FCDP bin. More information on 2DS and FCDP measurements during ATTREX-2014 can be found in Thornberry et al. (2017).
SPARTICUS was operated as part of the Atmospheric Measurement and Radiation (ARM) aerial program (Schmid et al., 2013) to reach a better understanding of small ice particles in clouds. This mission took place between January and June 2010 over central USA and involved a Learjet 25 aircraft that performed 200 h of scientific flights in synoptic and convective ice clouds. Its instrumentation involved the 2D-S probe for particle size measurement. A forward scattering spectrometer probe (FSSP) was also available during the campaign but its measurements are not included here due to likely contamination by shattering (Field et al., 2003; McFarquhar et al., 2007; Jackson et al., 2015). The SPARTICUS data used here were treated with a combination of the M1 method for D>365 µm and M4 otherwise (Lawson, 2011), which allowed for the more accurate treatment of out of focus particles (Korolev, 2007). An advantage of SPARTICUS for this study is that it contains numerous coincident flights with the A-Train, as detailed in Deng et al. (2012).
3.2.2 Data processing
In order to ensure optimal consistency between the PSD measurements from each airborne campaign, an identical post-processing procedure was followed to treat 1 Hz measurements from the 2DS, FCDP-2DS and NIXE-CAPS. This section discusses the most important details regarding the treatment of these measurements.
First, the 1 Hz measurements was averaged over 10 s periods to improve the statistical reliability of cloud sampling by in situ probes. This averaging also allows for a better comparability with cloud volumes sampled by CloudSat (and therefore DARDAR products), which has an along- and across-track horizontal resolution of 1.7 and 1.4 km, respectively. Considering the average true air speeds (TAS) for each campaign (see Table 1), 10 s PSDs are representative of flight legs from about 1.6 to 2.1 km.
Furthermore, to avoid possible ambiguities and uncertainties related to satellite retrievals and in situ measurements in mixed-phase clouds, this study focuses purely on ice clouds, i.e., with a temperature ∘C. However, to allow for additional flexibility in the evaluation, all in situ measurements obtained when ∘C are considered. Possible contamination by liquid drops are expected to be negligible at these temperatures (Costa et al., 2017).
Finally, the IWC corresponding to each in situ PSD is required to obtain predictions by D05. Bulk measurements are available for SPARTICUS and ATTREX but the bulk IWC was not measured for ACRIDICON-CHUVA, COALESC and ML-CIRRUS. Alternatively, and consistently with Krämer et al. (2016), the m−D relation by Luebke et al. (2016), noted mL16(D), can instead be utilized to estimate IWCs from the NIXE-CAPS PSD measurements. mL16(D) is based on a m−D relation by Mitchell et al. (2010), which has been slightly modified to improve the representativeness of the mass concentration for small ice crystals. The validity of this type of approach, and of mL16(D) in particular, was recently consolidated by Erfani and Mitchell (2016) and Afchine et al. (2018), who demonstrated their accuracy and generalizability for all types of ice clouds from ∘C. Afchine et al. (2018) in particular has shown that this relation should be applicable to tropical clouds and that the influence of different m−D relations on IWC is small in the temperature range of cirrus clouds. Considering this, and because Mitchell et al. (2010) and Erfani and Mitchell (2016) developed and tested their m−D relation using 2D-S measurements from tropical and midlatitude campaigns (including SPARTICUS), mL16(D) should also be applicable to SPARTICUS and ATTREX2014. For the sake of consistency, mL16(D) is utilized here to estimate the IWC for all campaigns. The uncertainties arising from using a m−D relation are discussed in Erfani and Mitchell (2016) and appear reasonable in the context of this evaluation due to the relatively small sensitivity of D05 predictions to IWC, as discussed in Sect. 4.1.
Overall, about 40 000 10 s PSDs, or 106 h of equivalent cloud sampling, are used for the evaluation presented in this study. These numbers are summarized in Table 1 and the distribution of temperatures sampled during each campaign is indicated in Fig. S1 of the Supplement.
3.3 Choice of a minimum integration size
To ensure consistency with DARDAR when inferring Ni from Eq. (5), the PSD parameters α and β are set to −1 and 3, respectively. However, implies a discontinuity in N(Deq) when the diameter equals zero. Therefore, an analytic solution for Ni can only be obtained by considering a minimum diameter, Dmin, for the integral. In this study, this threshold must be chosen within the validity range of the in situ measurements used for the evaluation.
As mentioned in Sect. 3.2.1, the 2DS, FCDP and NIXE-CAPS have a different sensitivity to small particles. The first instrument measures ice crystals with sizes down to about 5 µm, whereas the latter two can detect particles down to 1 µm. For consistency reasons, and to avoid possible contamination by aerosols, only ice crystals larger than 5 µm are considered when computing Ni from each probe. Thus, the same threshold is applied when computing Ni from DARDAR and the following results focus on concentrations in crystals larger than Dmin = 5 µm, noted .
In situ measurements of can still be associated with large uncertainties that are difficult to quantify. In particular, measurements from the first two size bins of the 2D-S (5 to 25 µm) are known to suffer from uncertainties due to the instrumental response time and depth of field (Jensen et al., 2013b; Gurganus and Lawson, 2018). Also, despite being minimized, contamination from ice shattering events can not be excluded. These effects are typically associated with an overestimation of . Therefore, the concentration of particles larger than 25 and 100 µm ( and , respectively) will also be used during this evaluation. The Dmin= 25 µm threshold allows for the representation of ice crystals of moderate sizes for which in situ measurements can be considered of higher confidence. The Dmin= 100 µm threshold typically involves concentrations for which in situ measurements are the most accurate, and the D05 parameterization is expected to perform well.
It is worth mentioning that different physical processes are likely to influence Ni depending on the threshold choice. For instance, small particles that are nucleated through homogeneous freezing should dominate , whereas large particles resulting from aggregation processes are likely to influence .
4.1 Optimal predictability of Ni by D05
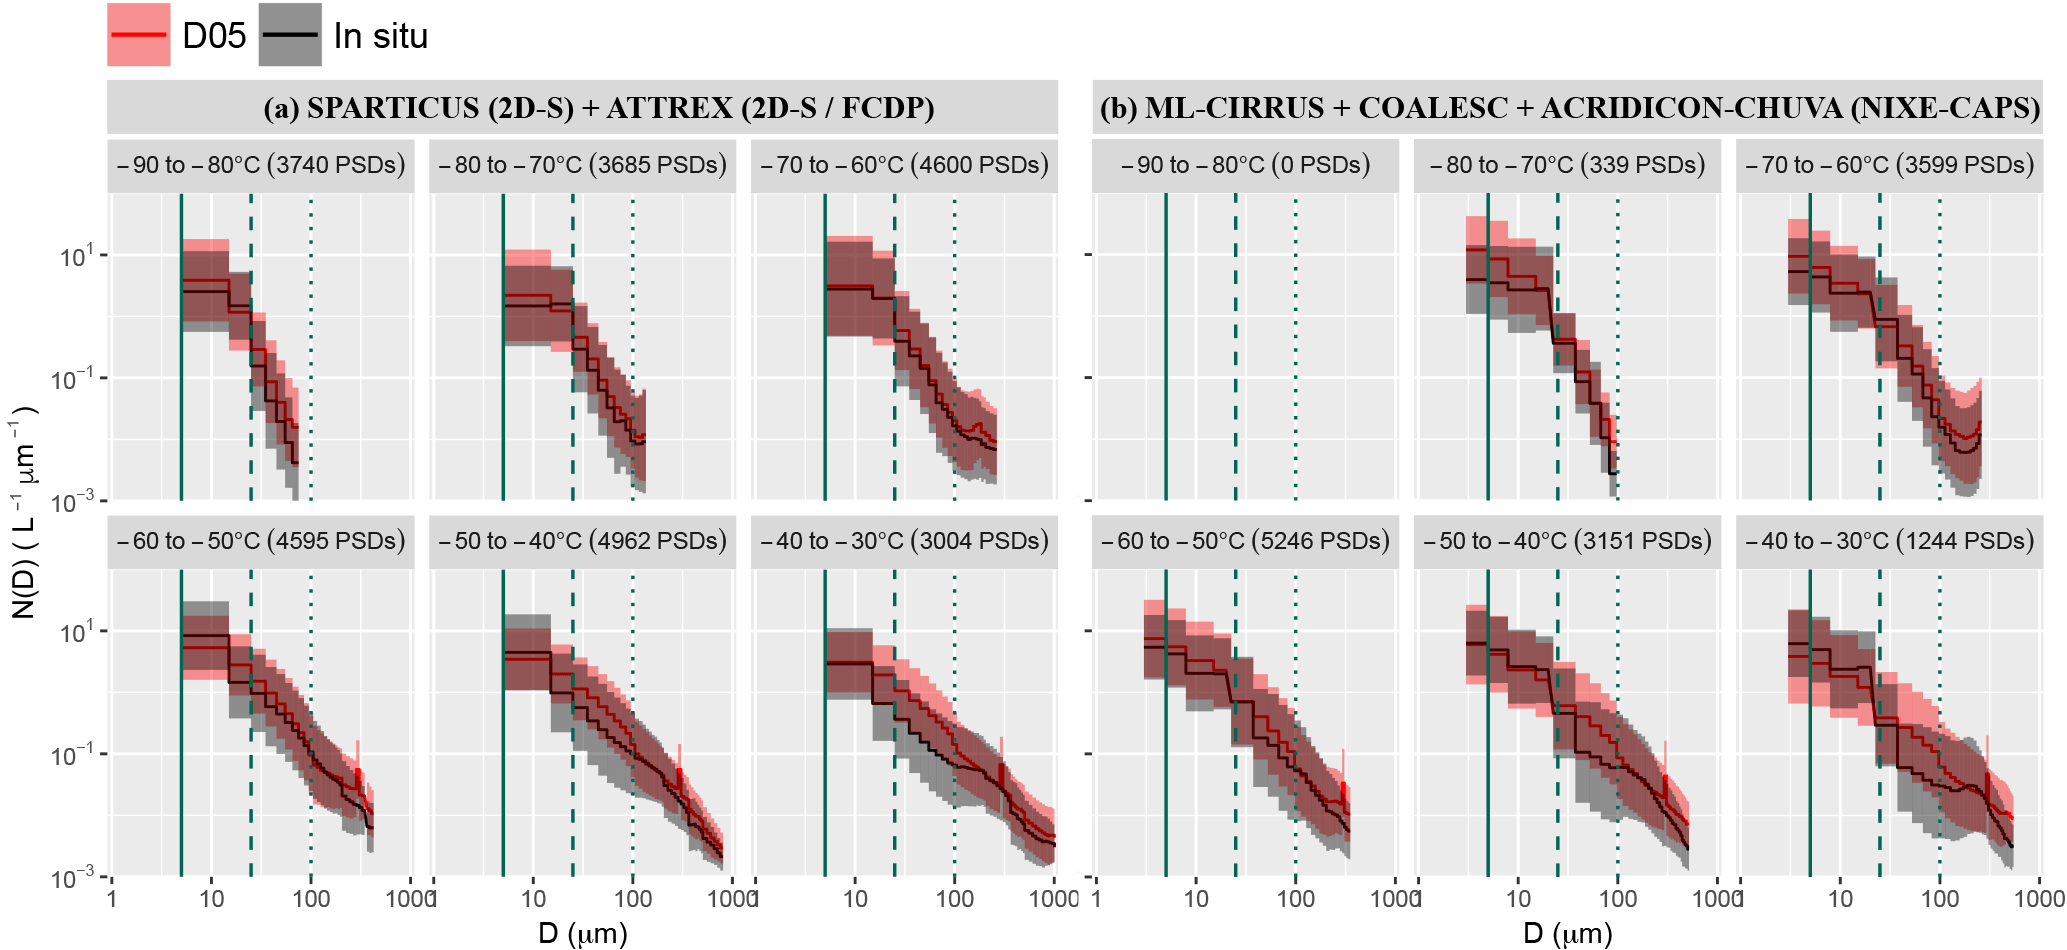
Figure 1(a) Mean PSDs measured (black lines) during SPARTICUS and ATTREX, averaged per 10 ∘C temperature bin (from −90 to −30 ∘C). Black contours indicate one standard deviation around the mean. The mean and spread of one-to-one predictions by the D05 parameterization are similarly indicated in red. The total number of PSDs in each Tc bin is indicated in the panel heading and the relative contributions from each campaign can be deduced from Fig. S1. Vertical plain, dashed and dotted green lines indicate D = 5, 25 and 100 µm, respectively. The SPARTICUS data with ∘C are ignored here to avoid contaminating FCDP measurements with uncertainties arising from the first size bins of 2D-S. (b) Similar to (a) but for the ML-CIRRUS, COALESC and ACRIDICON-CHUVA campaigns.
The ability of D05 to predict Ni is now investigated. It is reiterated that this parameterization is designed to predict ℳ2 and ℳ6 and so its representation of the distribution in small particles remains to be tested. PSDs and Ni predictions by D05 are computed here on the basis of IWC and values from each of the 40 000 PSDs composing the dataset described in Sect. 3.2. Comparing these predictions back to the original in situ PSDs and Ni measurements should provide insights regarding the abilities and limitations of D05 to predict Ni assuming that IWC and are perfectly constrained (i.e., if DARDAR retrievals of these parameters were optimal).
4.1.1 Reproducibility of the PSDs
As indicated in Sect. 2.1, the D05 parameterization predicts PSDs based on the assumption of a “universal” size distribution shape and the knowledge of two scaling parameters. Following this formalism, a PSD prediction by D05 can be obtained given the Dm and values corresponding to each measured PSD. Dm can be directly extracted from in situ PSDs, as it corresponds to the ratio of ℳ4 to ℳ3. can be indirectly estimated from Dm and the IWC, using Eq. (9). It can be noted that is proportional to IWC , which means that predictions by D05 are much more sensitive to Dm than to the IWC. This prediction makes use of mL16(D) to estimate IWC, which is a reasonable approximation for the purposes of this evaluation. The size dimension of PSDs predicted by D05 has been converted from Deq to D to improve the clarity of the following comparisons.
Comparisons of the PSD measurements obtained during ATTREX2014 and SPARTICUS and corresponding predictions by D05 are shown in Fig. 1a. The black and red lines indicate the respective mean measured and predicted PSDs within the 10 ∘C temperature bins. The use of measurements from midlatitude (SPARTICUS) and TTL ice clouds (ATTREX2014) allows a high statistical significance to be reached (over 3000 PSDs) in each Tc bin from −90 to −30 ∘C. The colored contours indicate one standard deviation around that mean. It can be noted that the measured and predicted concentrations in the FCDP bins have been averaged within each of the two first 2D-S bins in order to conveniently display the means in Fig. 1a. This figure clearly shows a very good overall agreement between D05 predictions and the in situ measurements. The mean as well as the spread of the 2D-S and FCDP measurements are well represented by D05. The agreement is especially good for −90 ∘C ∘C, where the in situ distribution tends to be monomodal with very few large particles. A small overestimation of the concentration of crystals smaller than 25 µm by D05 is still noted when ∘C. An overestimation of the number of particles with D<100 µm is also noted for D05 from ∘C, where a second mode appears for large aggregated particles. Features such as these and temperature dependency of PSD shapes have already been widely reported in the literature (e.g., Mitchell et al., 2011; Mishra et al., 2014; Luebke et al., 2016). When a bimodal shape is found in the in situ measurements, the D05 parameterization naturally tends to reproduce the concentration of large particles due to their strong weight on Dm and IWC. Because a monomodal shape is assumed to describe the PSD in D05, an erroneous extrapolation of the concentration of small particles leads to the observed overestimation when ∘C. However, this overestimation appears to mainly concern particles from 25 to 100 µm, as the concentration of ice particles smaller than about 15 µm seems accurately predicted when ∘C (keeping in mind that measurements for such small particles can be highly uncertain).
These results are supported by the evaluation of the D05 predictions of NIXE-CAPS measurements during ACRIDICON-CHUVA, COALESC and ML-CIRRUS, which are shown in Fig. 1b. Despite there being far fewer measurements of ice clouds with ∘C, very good agreements are found regarding the mean and the spread predicted by D05 for ∘C. A small overestimation of the concentration of small ice crystals (D<25 µm) is found for ∘, where concentrations measured by the NIXE-CAPS only slightly increase. This feature should be carefully accounted for due to the lack of measurements in the coldest temperature bin, but could again indicate an increase of Ni towards small particles in D05 that is too steep (i.e., a too negative α) at very low temperatures. Consistent with the previous results, the D05 predictions are less accurate towards higher temperatures as bimodal structures tend to appear in the in situ measurements above −50 ∘C. Moreover, comparing all campaigns shows a very good overall agreement between the NIXE-CAPS and 2D-S/FCDP measurements, which points towards the generalization of these conclusions. It should be mentioned that these analyses are not repeated by explicitly discriminating between cloud types (e.g., synoptic cirrus/anvil or liquid/ice origin) for reasons of brevity. The overall agreements observed in Fig. 1 are considered satisfactory in this evaluation, especially since DARDAR does not discriminate between cloud types and the normalized size distribution used in D05 is expected to perform equally for all cloud types.
4.1.2 Consequences on Ni predictions
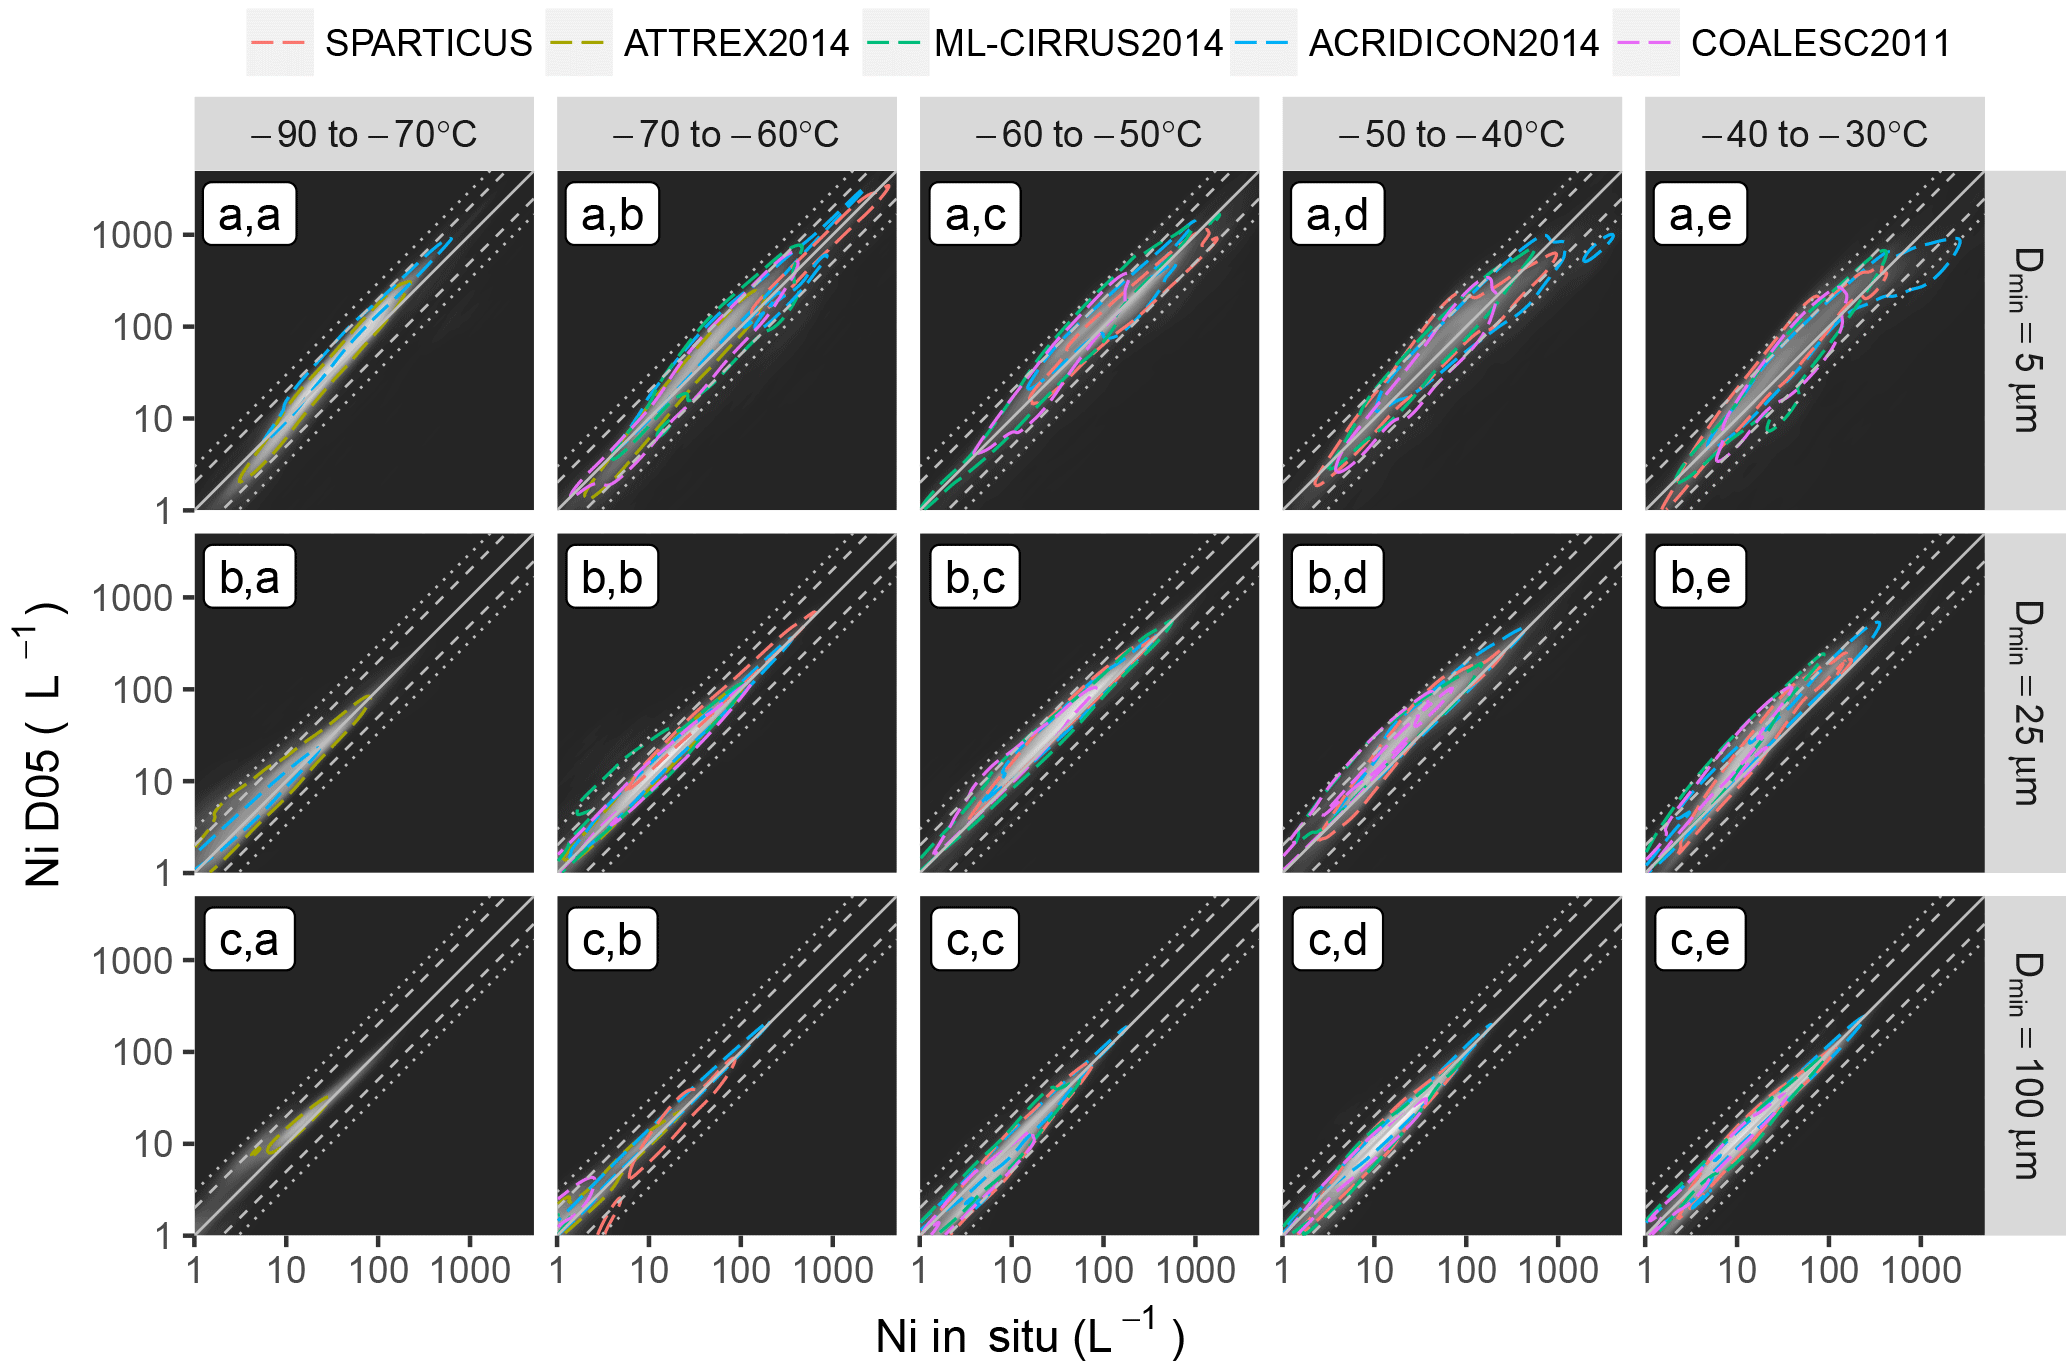
Figure 2Density scatterplot showing Ni theoretically estimated by D05 as function of corresponding in situ measurements (from white to black indicates high to low frequency of occurrence). Colored isolines indicate the 68 % (one standard deviation) confidence interval for each campaign. Density and confidence intervals are provided per 10 ∘C temperature bin from −80 to −30 ∘C (first to fifth column) as is the lower integration threshold for Ni (5, 25 and 100 µm in the first, second and third row, respectively). The identity line and a factor of 2 and 3 around the identity line are indicated by grey plain, dashed and dotted lines, respectively.
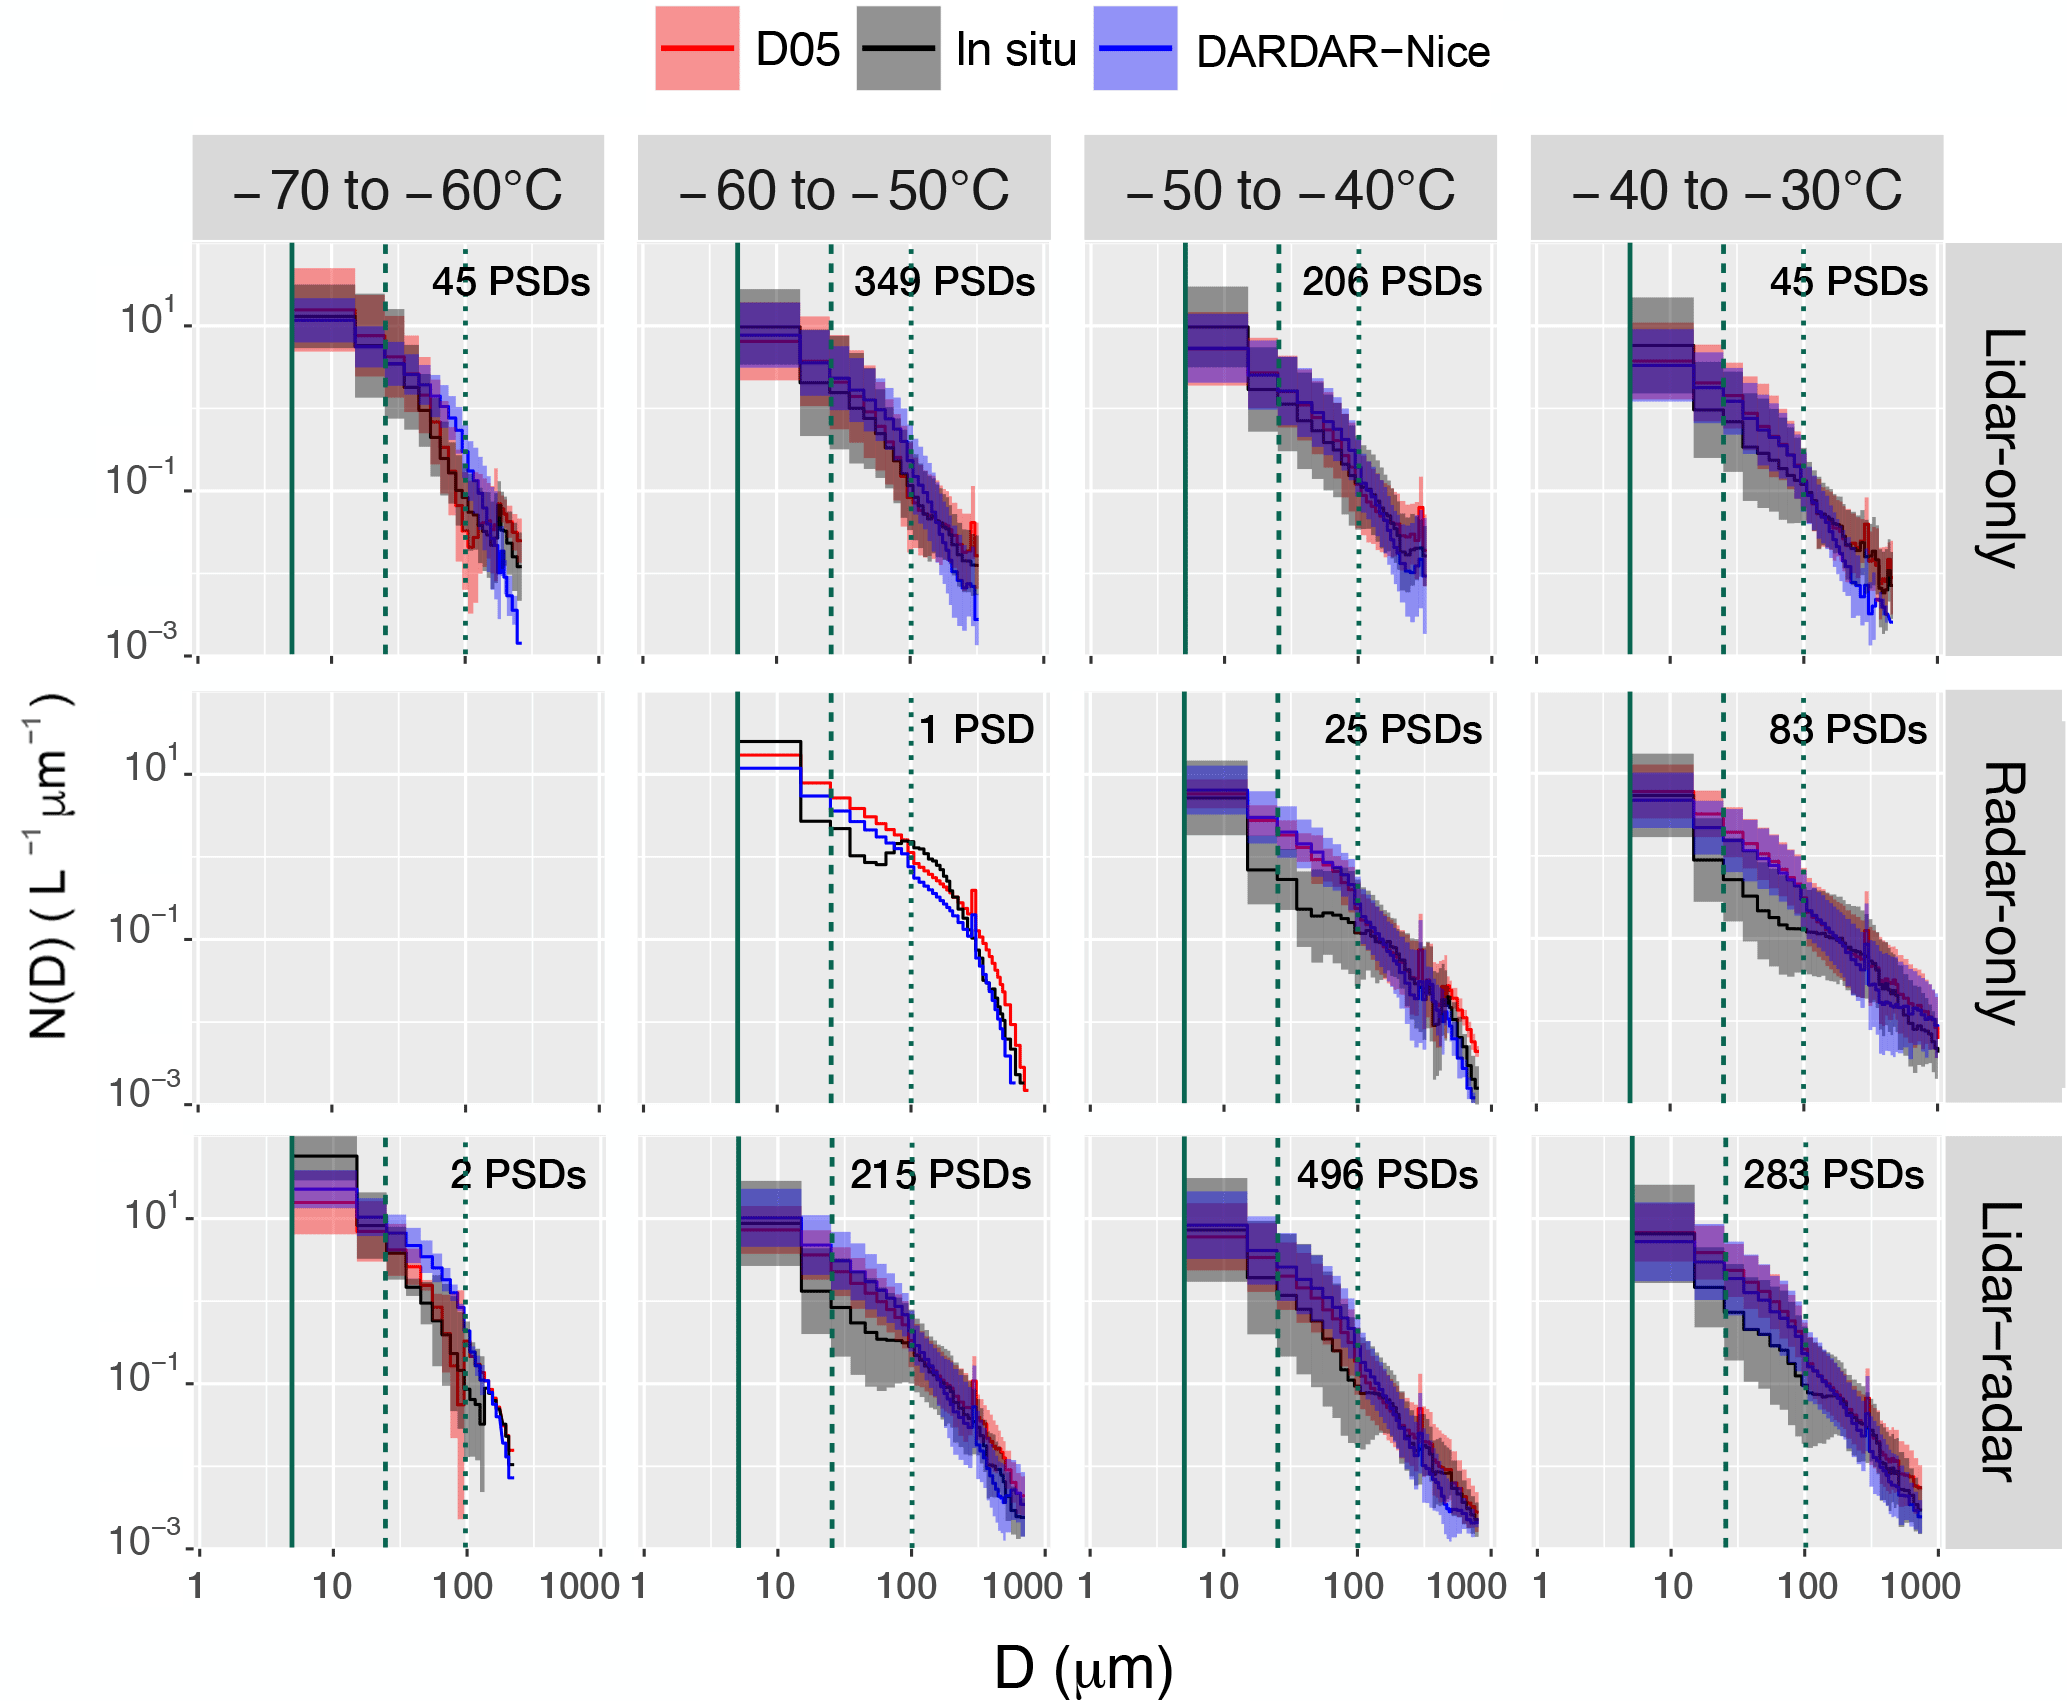
Figure 3Similar to Fig. 1 but for SPARTICUS flights coincident with the A-Train overpass. PSDs estimated on the basis of DARDAR IWC and retrievals (i.e., corresponding to the DARDAR-Nice Ni) are shown in blue. All PSDs are averaged per temperature bin (columns) and by instrumental conditions met during DARDAR retrievals (rows).
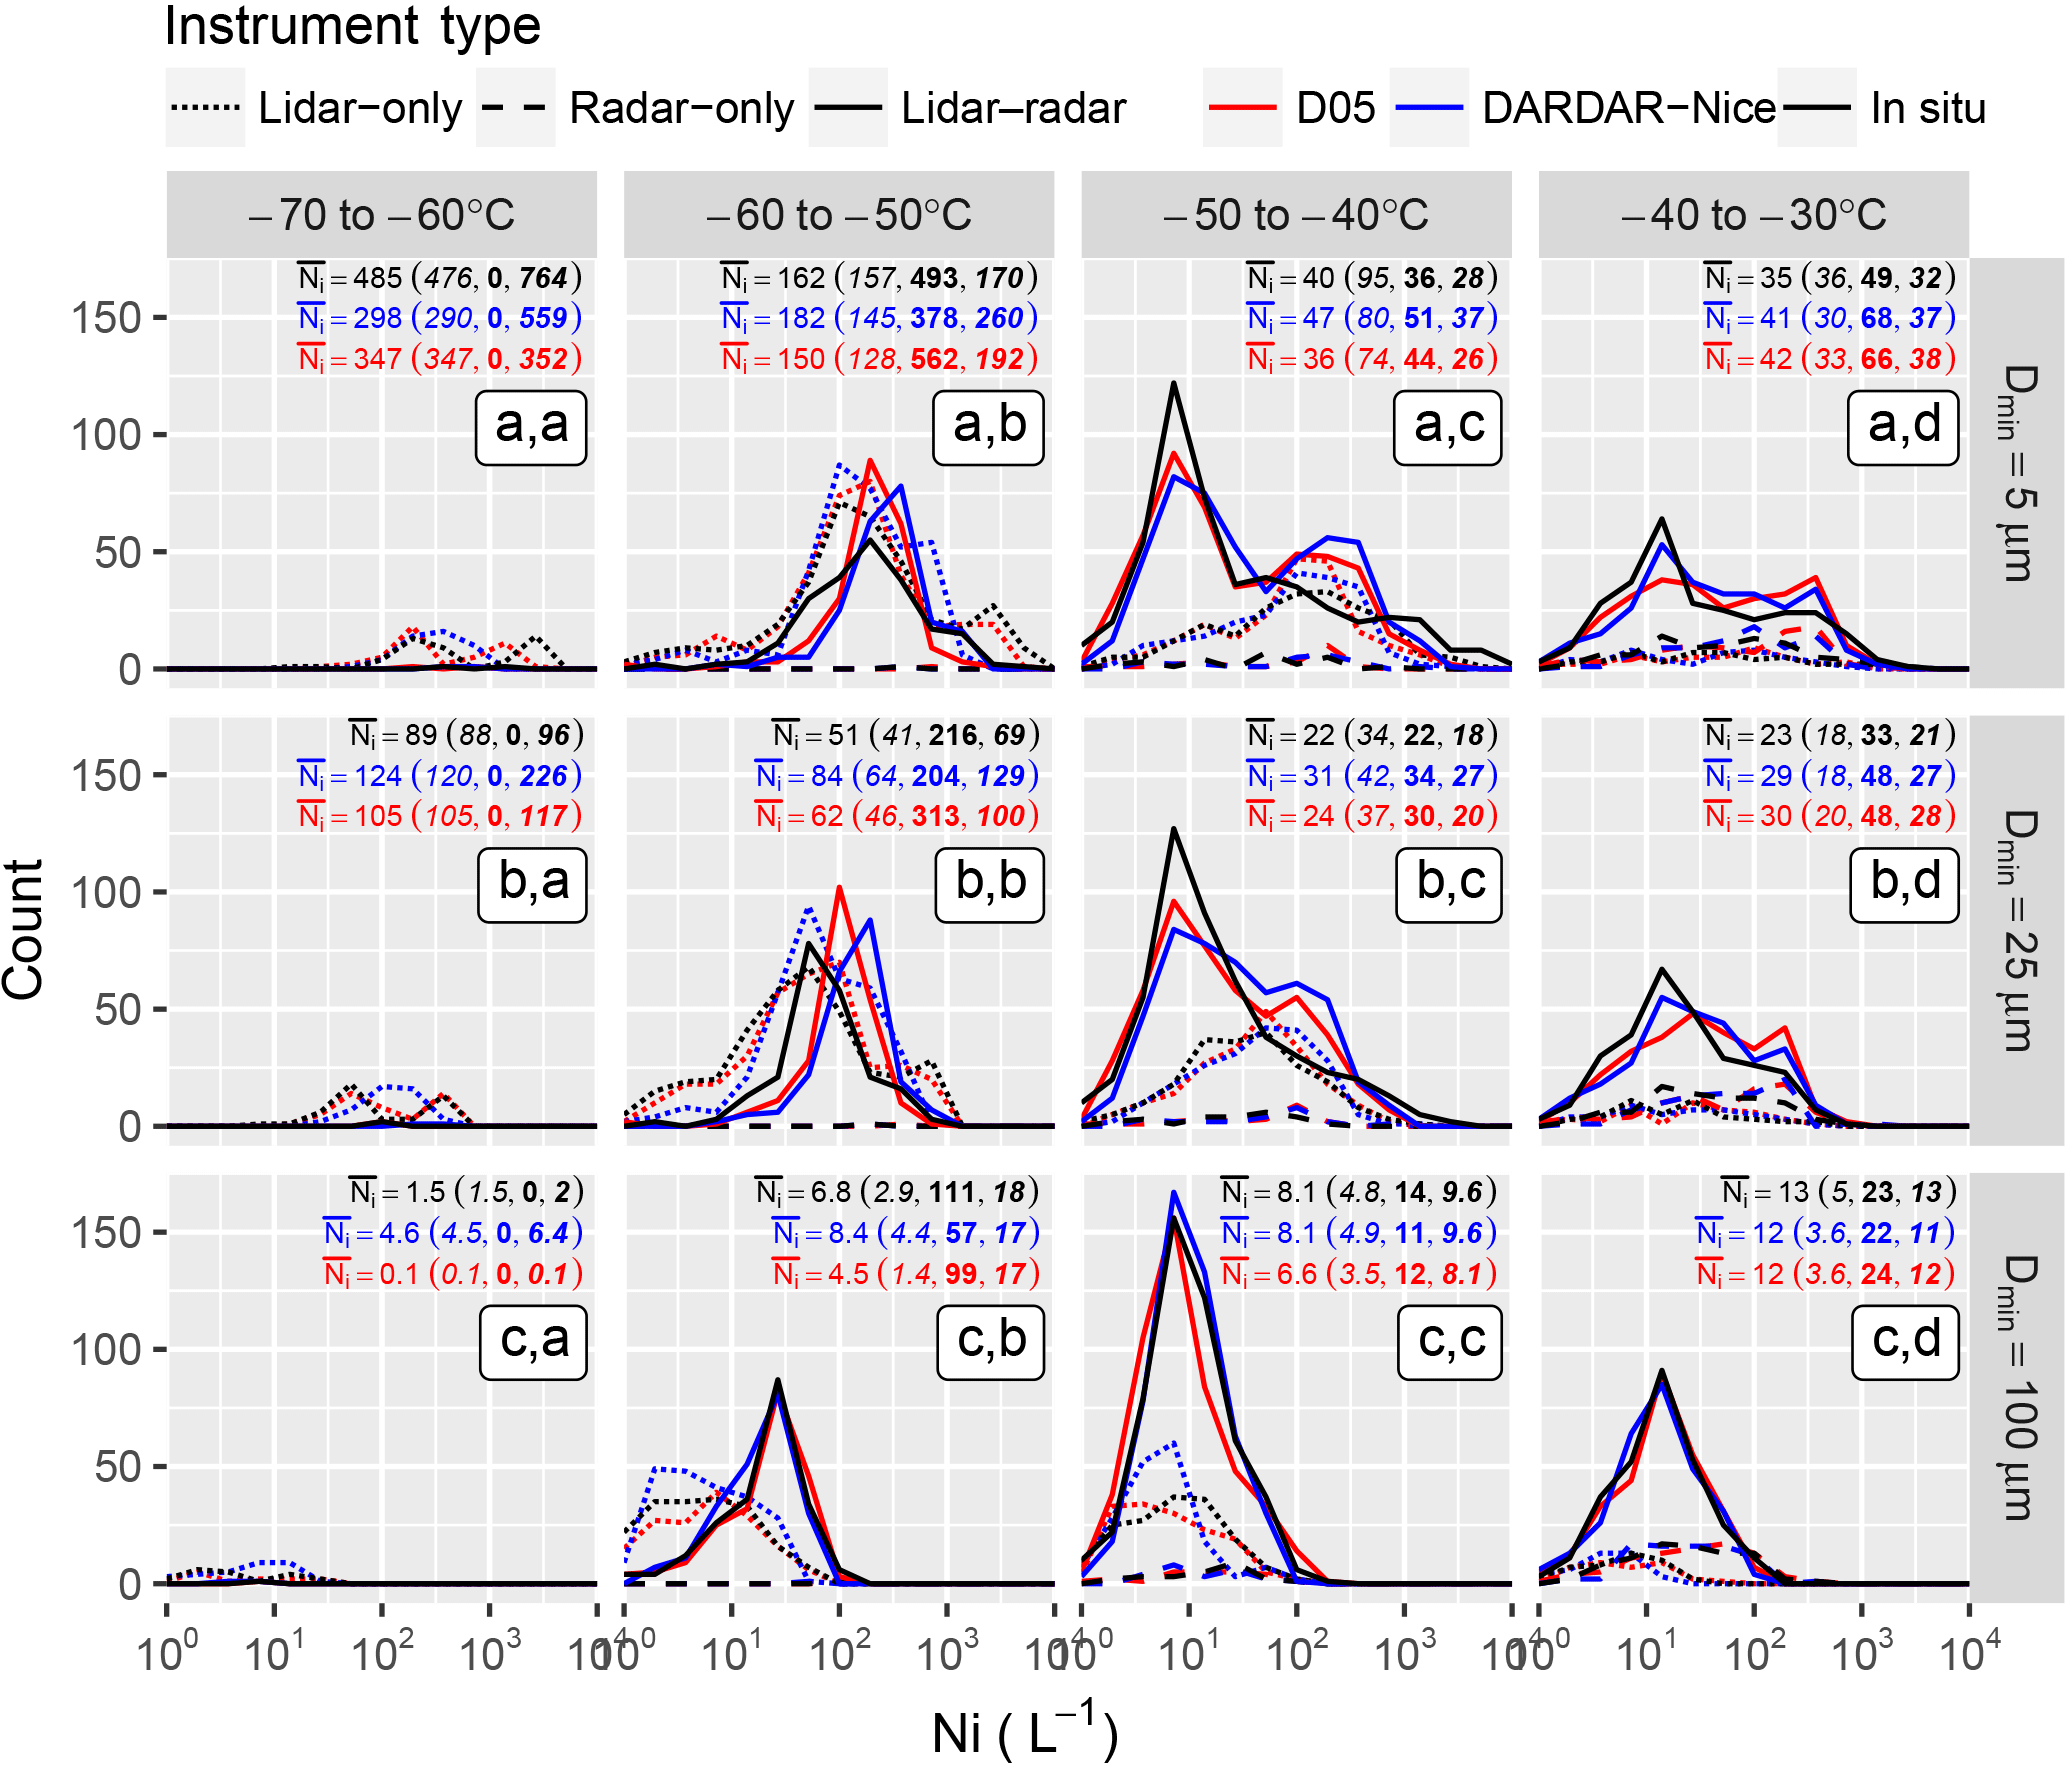
Figure 4Histograms of Ni measured during SPARTICUS (black), theoretically estimated by D05 (red) and retrieved by DARDAR-Nice (blue). Plain, dotted and dashed lines indicate that DARDAR retrievals were obtained using lidar-only, radar-only and lidar–radar, respectively. Panels indicate the temperature and integration threshold, in a similar fashion to Fig. 2. Geometric means of Ni (represented in per liter) are shown in each panel for 2D-S, DARDAR-Nice and D05. The overall mean is indicated first, followed in brackets by values for the lidar-only (italic), radar-only (bold) and lidar–radar (bold-italic) subsets.
Ni obtained from direct integrations of the measured and predicted PSDs are now compared. Figure 2 shows a density scatterplot of one-to-one comparisons between the in situ measurements (x axis) and the corresponding D05 predictions (y axis), obtained by integrating the corresponding PSDs from Dmin=5, 25 and 100 µm (first to third row, respectively). The background color indicates the overall density and isolines are provided to show the 68 % confidence levels (i.e., all values inside the isolines fall within one standard deviation σ of the mean) for each campaign. These results are shown per 10 ∘C temperature bin from −80 to −30 ∘C (first to fifth column, respectively).
Figure 2c.a–c.e show that the prediction of Ni for ice particles larger than 100 µm is very consistent with the in situ reference, with an agreement close to the one-to-one line for all campaigns and temperatures. values ranging between about 1 and 100 L−1 are observed. This good agreement was expected from Sect. 4.1.1, and due to the fact that D05 should, in principle, perform best at reproducing the concentration in large particles. Figure 2b.a–b.e also indicates an accurate prediction of , well within a factor of 2 (dashed lines), from −80 to −50 ∘C. At higher temperatures, predictions by D05 can be overestimated by a factor of 2 to 3 (dotted lines) for most field campaigns. These results also hold for , as indicated in Fig. 2a.a–a.e, despite a larger spread within and between the campaigns in this case. It can be noted that the overestimation is particularly strong for SPARTICUS (red isolines) but is less clear for other campaigns. The overestimation is also not as clear as for , as the concentration in particles smaller than 25 µm appears more properly predicted by D05 (see Fig. 1). At ∘C, the D05 predictions are more consistent with the in situ measurements, with maximal values of about 300 L−1; however, these values can also reach up to 1000 L−1 for several field campaigns. Nevertheless, a small overestimation, by a factor less than 2, can be observed in predictions by D05 when ∘C. This is consistent with its steeper increase in the concentration in small ice crystals, noted in Fig. 1.
4.2 Satellite estimates vs. coincident measurements
Section 4.1 demonstrated the ability of the D05 parameterization to predict Ni measurements from numerous airborne campaigns. However, these conclusions only reflect ideal cases where the input parameters of D05 are perfectly constrained, since IWC and were extracted from the in situ data. It is now necessary to investigate if enough information is contained in lidar and radar measurements to sufficiently constrain these two parameters and estimate Ni.
This question is investigated by comparing the DARDAR-Nice Ni to measurements from coincident flights. These flights are selected under the condition that they are within a maximum distance of 5 km and a 30 min time period from the CloudSat/CALIPSO overpass. Among the campaigns described in Sect. 3.2.1, coincident flights with the A-Train track were intended during ACRIDICON-CHUVA, ML-CIRRUS and SPARTICUS. Unfortunately, none of the three coincident flights during ACRIDICON-CHUVA could be selected here, due to the absence of CALIOP measurements (12 September 2014) or the fact that the flights did not fulfill the above conditions (about 3 h late or 350 km west of the overpass track on 21 and 23 September 2014, respectively). Also, technical issues occurred during the ML-CIRRUS coincident flights (4 April 2014), making PSD measurements uncertain and unusable for this evaluation. However, numerous flights successfully achieved a close spatial and temporal coincidence with the A-Train during SPARTICUS. A list and description of these flights can be found in Deng et al. (2012). Overall, about 1750 PSDs were found to match the above conditions in this study and are considered in this evaluation. The coincident DARDAR-Nice Ni are obtained by selecting the closest pixel (based on a great circle distance) at the altitude of the airplane.
In a similar fashion to Figs. 1, 3 compares PSDs measured by the 2D-S along A-Train overpasses (black) to corresponding predictions by D05 (red). PSDs predicted by D05 on the basis of coincident DARDAR IWC and retrievals are additionally shown in blue. These correspond to the PSDs that are integrated to compute Ni in DARDAR-Nice. All PSDs are averaged per 10 ∘C bin (columns) and by instrumental conditions met for DARDAR retrievals (rows). In agreement with results from Sect. 4.1.1, the theoretical predictions by D05 are in better agreement with 2D-S observations when the latter display monomodal shapes. This is mainly observed towards low temperatures but also when retrievals are obtained in lidar-only condition, i.e., for thin cirrus or in regions near cloud-top. The 2D-S PSDs feature a stronger bimodality in lidar–radar and radar-only regions, where larger crystals resulting from aggregation or complex heterogeneous nucleation processes are likely to appear. D05 is, by construction, unable to reproduce this behavior but, despite disagreements with the 2D-S, PSDs retrieved by DARDAR-Nice agree well with D05 predictions based on in situ measurements. This indicates that and IWC are sufficiently retrieved and that errors in Ni are likely to be dominated by assumptions on the PSD shape. That is especially true in lidar–radar conditions where βext and Ze both provide information on the concentration of small and large particles, respectively. As expected, the concentrations in particles with D>100 µm are not well constrained in lidar-only conditions. Inversely, radar-only retrievals poorly constrain concentrations in particles smaller than 100 µm. However, Fig. 3 shows that, despite fewer available constraints under lidar-only conditions, reasonable and estimates are obtained due to simpler PSD shapes.
In order to avoid problems related with one-to-one comparisons of satellite and airplane measurements, a statistical comparison is presented in Fig. 4. This figure shows histograms of Ni for the 2D-S (black) and DARDAR-Nice (blue) per temperature bin and Dmin threshold. Theoretical predictions by D05 are indicated in red to provide an idea of the optimal expectations for DARDAR-Nice. Plain, dotted and dashed lines indicate satellite estimates that correspond to lidar–radar, lidar-only, radar-only conditions, respectively. These histograms are shown individually in Fig. S6 for better clarity. Mean Ni values for 2D-S, DARDAR-Nice and D05 are indicated in each panel. Very good agreements are seen between the satellite estimates and in situ observations of at all temperature ranges above −60 ∘C. The distributions and mean values of estimated by DARDAR-Nice are perfectly consistent with the 2D-S for all instrumental conditions. Deviation of radar-only values in the −60 to −50 ∘C bin (Fig. 4c, b) can be discarded as only representative of one PSD. The satellite estimates of also agree with the 2D-S; however, this is with the expected overestimation of in D05 and DARDAR-Nice due to limited PSD shape assumptions. Overestimations by about 10 % to 30 % and 20 % to 60 % are found in the mean values of by D05 and DARDAR-Nice, respectively. This overestimation is less in lidar-only conditions, and is consistent with the weaker bimodality of PSDs (see Fig. 3). Similar observations can be made for , with a slightly smaller overestimation of the mean values by DARDAR-Nice due to good agreements between DARDAR-Nice and 2D-S for D<15 µm noted in Fig. 3. However, it is reiterated that uncertainties in the two first bins of the 2D-S can contaminate its estimations of ; therefore, represents a more trustworthy estimate of Ni from this instrument. Finally, it can be clearly noted from Fig. 4 that, even when the distributions from DARDAR-Nice and the 2D-S do not perfectly agree, the satellite estimates remain close to the D05 predictions. This again indicates that errors in the Ni estimates by DARDAR-Nice are dominated by assumptions made on the PSD shape rather than by a lack of instrumental sensitivity.
Therefore, Figs. 3 and 4 demonstrate that DARDAR-Nice is capable of statistically reproducing 2D-S measurements of , and ; however, an overestimation of up to about a factor of 2 can be expected in the mean and values due to a misrepresentation of the PSD shape by D05 at warm temperatures. An analysis of one-to-one comparisons between DARDAR-Nice/D05 and 2D-S (see Figs. S4 and S5) also supports these conclusions.
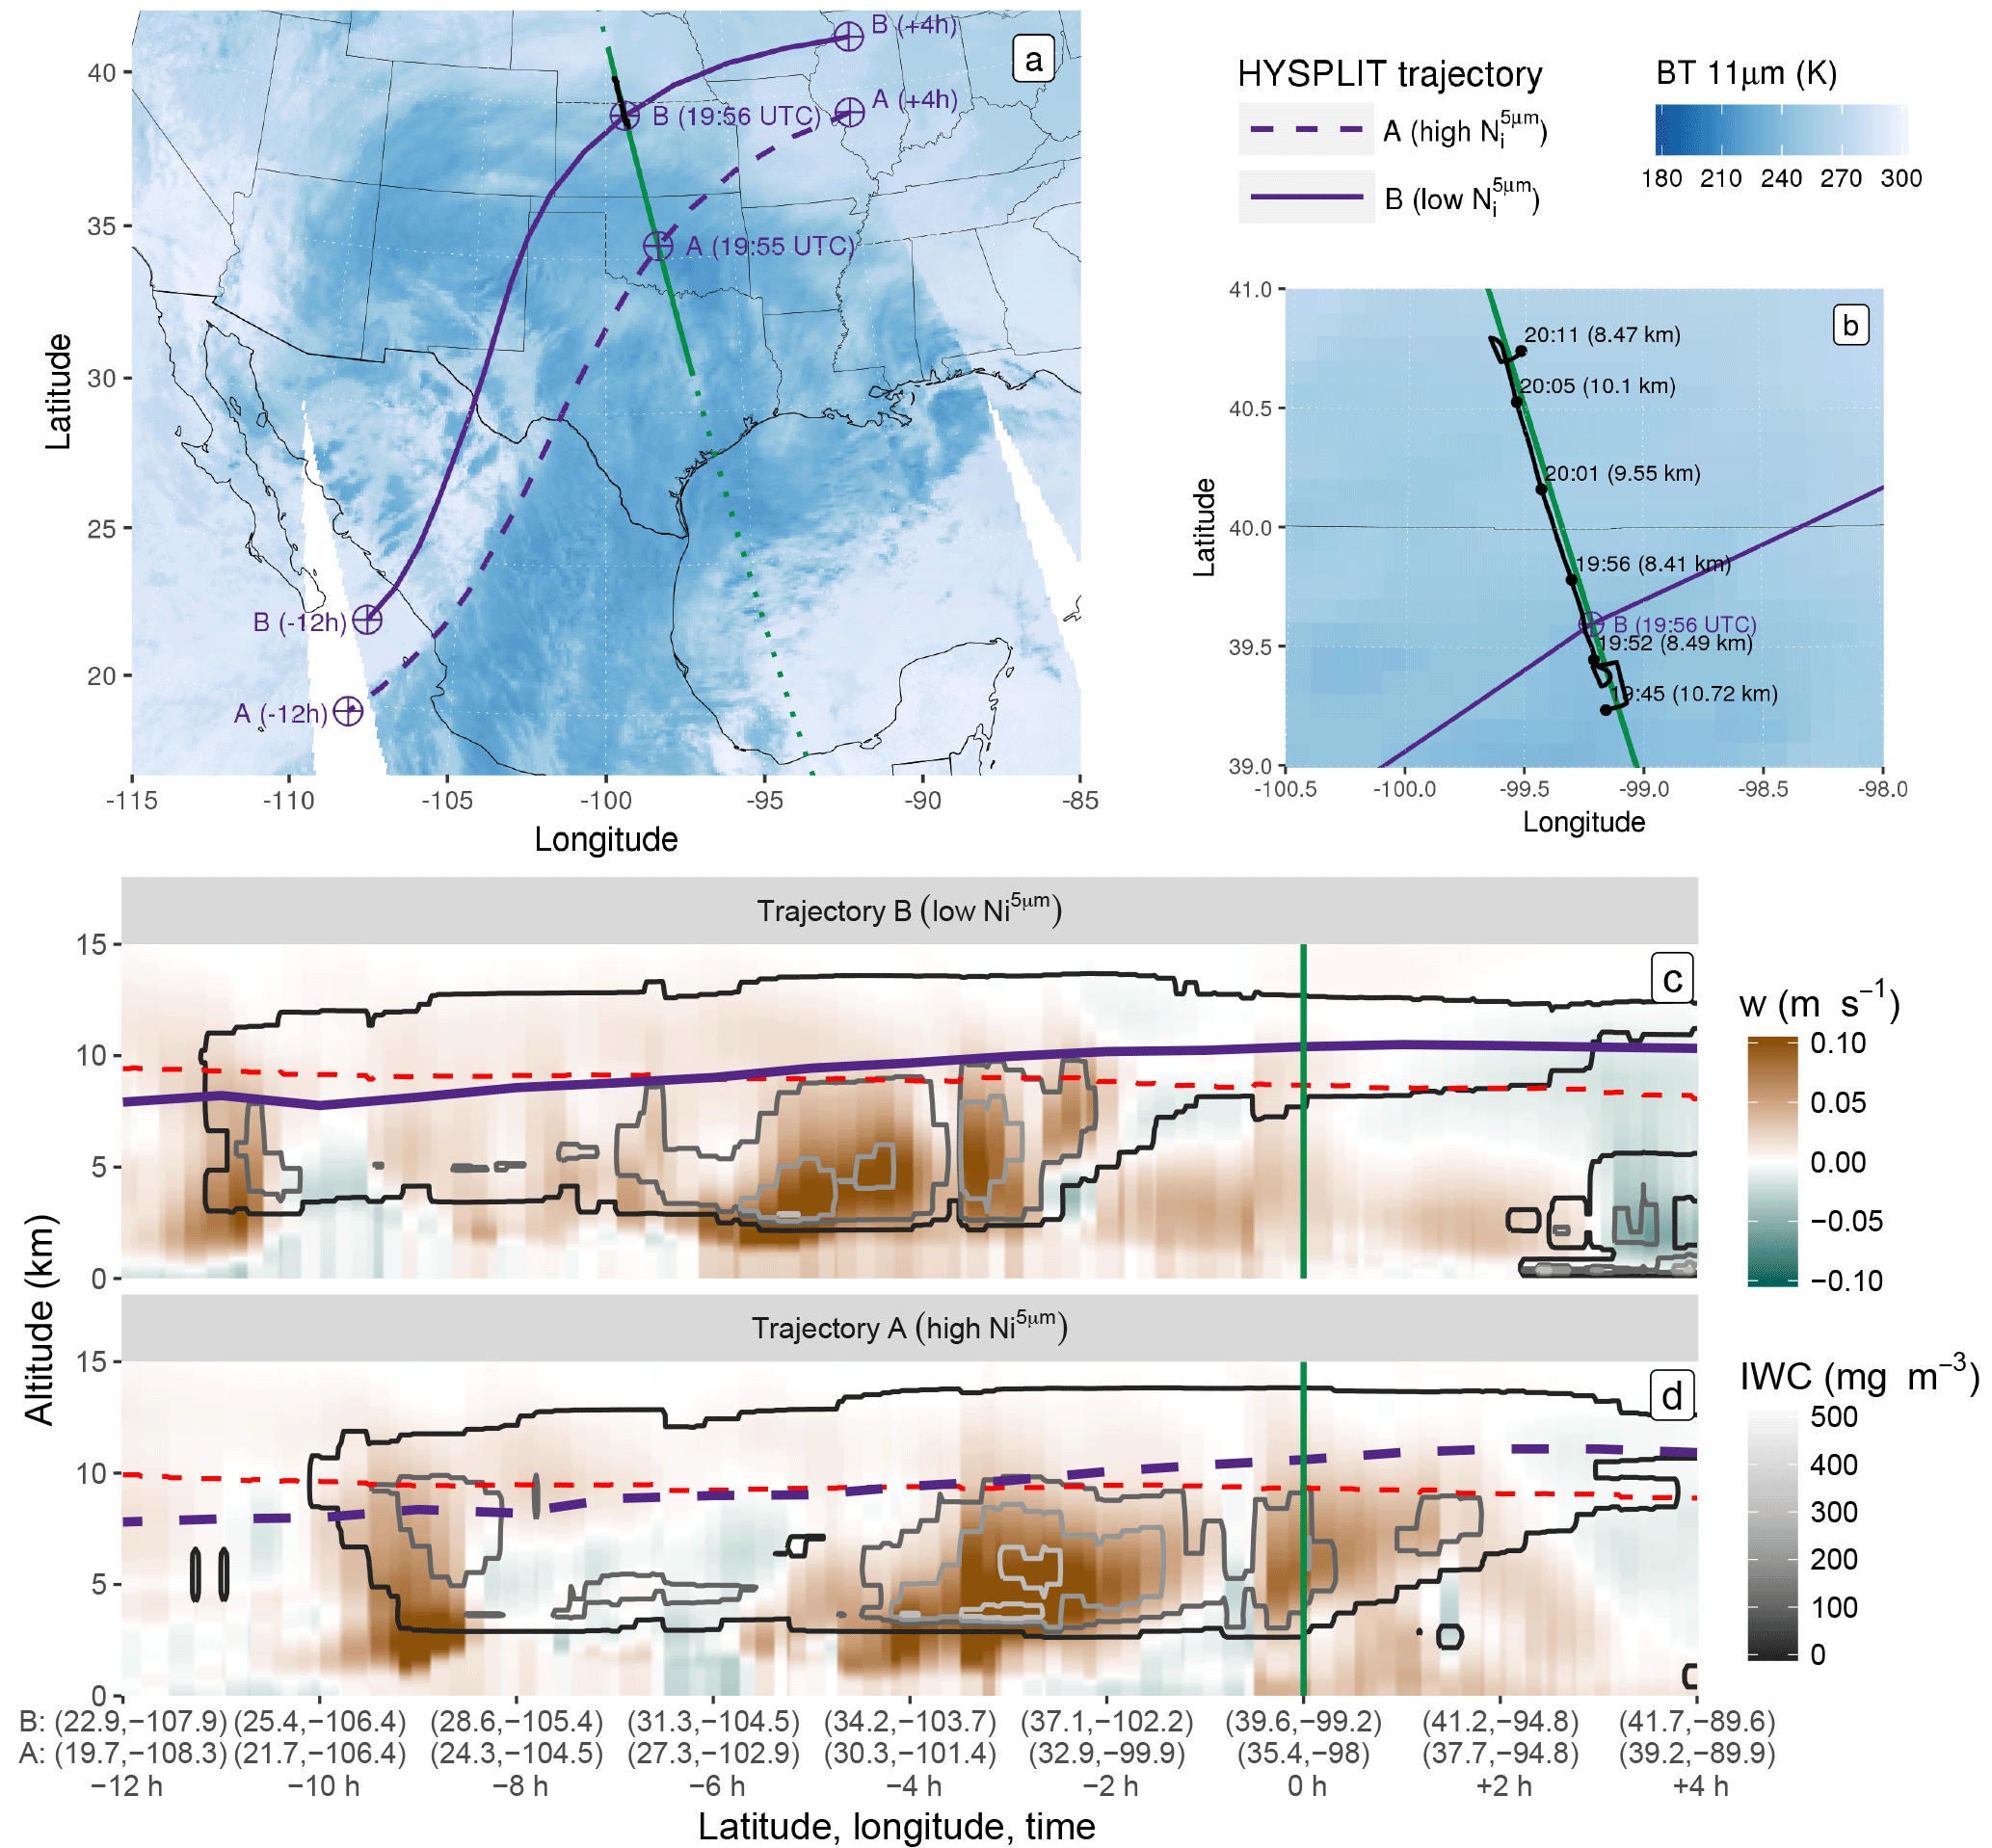
Figure 5(a) Map summarizing the observations during the case study. The shaded blue background corresponds to MODIS/Aqua 11 µm brightness temperature measurements around the A-Train overpass. The CloudSat track is shown by a dotted green line, and a plain green line highlights the region of interest. The Learjet 25 flight track is shown in black. Dashed and plain purple lines represent HYSPLIT trajectories computed for two air parcels of high (A) and low (B) , respectively, at 11 km along the overpass. (b) Similar to (a) but zoomed in around the flight area. The aircraft times (in UTC) and altitudes are indicated in black. (c–d) Vertical cross sections of vertical wind velocities (w; background color) and IWC (grey contours) predicted by NARR along the B and A trajectories, respectively. The positions of the corresponding air parcels are indicated in purple. A dashed red line shows the −40 ∘C isotherm. The overpass time is highlighted by a vertical green line.
A first examination of Ni profiles by DARDAR-Nice is performed here in the context of a case study corresponding to a frontal ice cloud structure observed on 3 February 2010 around 20:00 UTC over the South Central USA. This case is of particular interest as it contains a leg of high spatial and temporal coincidence between the A-Train and the Learjet 25 aircraft involved during SPARTICUS.
5.1 Overall context
The cloud structure analyzed here is part of a mature cyclonic system that had reached an occluded stage, as featured by the brightness temperature snapshot shown in Fig. 5a. Further analyses of the weather conditions (not shown here for brevity reasons) indicated that this system originated from a mid-tropospheric wave pattern that crossed the USA and supported a surface low pressure area over northern central Mexico. The storm then moved in a northwesterly direction, eventually reaching northeastern USA on 5 February in the form of a major blizzard.
The CloudSat track crossed the cyclone from south to north around 19:55 UTC (dashed green line). The section of interest in this case study (plain green line) captures a frontal cloud associated with the ascending southern moist warm air flow atop a cold continental air mass. The corresponding CloudSat Ze and CALIOP βext profiles, shown in Fig. 6a–b, typically hint at high water contents and precipitation toward the center of the cyclone and to thin ice clouds as the A-Train moves northwards towards the storm's periphery.
The Learjet 25 performed in situ measurements in a cirrus cloud at the edge of the cyclone. The flight track is shown by black lines in Figs. 5a–b and 6. These figures indicate that the aircraft approached from the west at an altitude of about 10.7 km (near cloud top) and descended to about 8 km (near cloud base) before reaching the overpass. The aircraft then closely followed the A-Train while ascending to cloud top and finally descended back to cloud base in a spiral. Optimal comparisons between the A-Train and Learjet 25 measurements are expected within the ascending leg from about 39.5 to 40.7∘ N, where the time and space coincidences are well within 15 min and 10 km, respectively.

Figure 6Vertical profiles of the (a) the CloudSat reflectivity factor, (b) the CALIOP backscatter coefficient, (c) the DARDAR instrument flag, (d) reff, (e) IWC and (f–h) DARDAR-Nice , , and , respectively, along the selected A-Train overpass (plain green line in Fig. 5). Dark-grey shaded areas in (f)–(h) indicate a rejection of the retrievals (insufficient niter or below a supercooled layer; see Sect. 3.1). The −40 ∘C isotherm is in dashed red, the location of the A and B air parcels are indicated in purple, and the Learjet 25 track is shown in black.
5.2 Vertical structure along the overpass
The respective reff, IWC, , and profiles along the selected A-Train overpass are shown in Fig. 6d–h. As expected, high IWC values are retrieved between altitudes of 2.5 and 7.5 km along the southern half of the track (31.2–35.4∘ N), i.e., towards the center of the cyclone. Retrievals of reff indicate small crystals (about 30 µm or less) above the 40 ∘C isoline (dashed red line) and particles larger than 100 µm below 8 km. The clear cut below 2.5 km, associated with high Ze, corresponds to pixels classified as rain by the DARDAR mask. Figure 6f shows that high values are found towards cloud top, ranging from 250 to more than 1000 L−1. increases above the −40 ∘C isoline, which is consistent with the probable occurrence of homogeneous nucleation below that temperature threshold. However, the increase in when ∘C is not spatially homogeneous. Indeed, very high values (reaching 1000 L−1) are observed between 33.3 and 36.5∘ N, where the cloud-base heights start increasing in relation to the frontal system. However, lower , with values typically between 250 and 500 L−1, are observed above −40 ∘C toward the cyclone periphery (36.5 to 41.5∘ N). This distribution of could be consistent with expectations of stronger updrafts and vertical transport of moisture near the center of the cyclone. This could result from the high homogeneous freezing rates of aqueous aerosols that occur on top of existing ice crystals that are heterogeneously formed from liquid droplets (the area of high backscatter around 33.3∘ N in Fig. 6b indicates the presence of supercooled liquid water). This hypothesis will be discussed further in Sect. 5.3.
The vertical distribution of in Fig. 6g shows patterns that are similar to , with absolute values that are about 50 % lower. Profiles of shown in Fig. 6h indicate that areas of high are located deeper in the cloud than the region where high and are found. tends to increase below regions of high , which is coherent with possible aggregation processes, and remains constant or decreases slightly towards the cloud base before precipitating from the lowermost layers. Very high values appear around 33.0∘ N, and are coincident with high IWC values. However, this area is subject to supercooled layers, where retrievals are highly uncertain. It is worth noting that the distribution does not necessarily follow that of the IWC.
Finally, it can be noted when comparing the Ni profiles in Fig. 6f–h with the corresponding instrumental flags shown in Fig. 6c that no clear bias is observed within transition areas between the cloud properties obtained in lidar-only, radar-only and lidar–radar conditions, consistent with conclusions from Sect. 4.2.
A detailed analysis of 2D-S measurements along the coincident flight leg (see Fig. S7) showed good overall agreement with DARDAR-Nice estimates of , and . Despite a few discrepancies, the overall variations of Ni appear well captured by DARDAR-Nice. This is particularly apparent along the ascending leg, which has the highest time and space coincidence with the satellite overpass.
5.3 Trajectory analysis of patterns
Thorough investigations of nucleation processes based on DARDAR-Nice are not in the scope of this paper and will be discussed further in Part 2 of this series. Nevertheless, a qualitative analysis is presented here to provide further explanation of the patterns observed in this case study.
To achieve this, back- and forward-trajectories were computed from points A and B indicated in Fig. 6, using the Hybrid Single-Particle Lagrangian Integrated Trajectory model (HYSPLIT; Stein et al., 2015) coupled with the North American Regional Reanalysis (NARR; Mesinger et al., 2006) model. A and B correspond to air parcels associated with high and low , respectively, when ∘C. Their trajectories (from −12 to +4 h starting at the overpass time) are shown as dashed and plain purple lines, respectively, in Fig. 5a. The corresponding altitudes are similarly indicated as function of time in Fig. 5c–d. Complementarily, the vertical cross sections of vertical wind velocities (w) predicted by NARR along the trajectories are indicated by the colored background in Fig. 5c–d. Contours of the NARR IWC are shown in grey to serve as rough indicators of the presence of ice cloud layers in the model. It can be noted that NARR provides reanalyses with a horizontal resolution of 32 km, 29 vertical levels and 3-hourly outputs; therefore, the closest output times and grid-points were selected.
It is observed that both air parcels originated from warm moist air over the Pacific and slowly ascended atop the cold continental air following northwesterly trajectories associated with slow vertical motions (light brown colors), which is in agreement with expectations. Parcel B ascended from about 8 km at 08:00 UTC to 11 km at the overpass time (20:00 UTC) and then remained at a constant altitude. The −40 ∘C isoline (dashed red line) is crossed around 14:00 UTC and this parcel then appears to belong to an anvil-like maturing cloud layer from 19:00 UTC, supported by small w (less than 1 cm s−1) observed around the overpass time. On the contrary, parcel A, which also started ascending from an altitude of around 7.5 km, met stronger uplifts later during the day (around 16:00 UTC). The −40 ∘C isoline is also consistently crossed about 2 h later than for parcel B. This parcel keeps ascending upon meeting with the overpass, where updrafts stronger than 5 cm s−1 are found.
These observations are in agreement with the high values observed at A; thus, they are likely to have been caused by strong and recent updrafts. The high sensitivity to w could indeed relate to a high in situ homogeneous freezing event of aqueous aerosols, occurring on top of ice crystals formed, probably heterogeneously, from liquid droplets (Kärcher and Ström, 2003; Kärcher et al., 2006; Krämer et al., 2016). On the contrary, B corresponds to an air parcel within a mature cloud, where w is too small to cause further ice nucleation and small ice crystals have already started to sublimate or aggregate. It is worth mentioning that these variations of Ni with w are in good agreement with findings by Kärcher et al. (2006) based on a physically based ice nucleation scheme. However, an exact comparison of absolute numbers is difficult as Kärcher et al. (2006) also shows a dependence on background ice nuclei concentrations, which are unknown for this case study.
Keeping possible uncertainties associated with the NARR reanalyses and HYSPLIT trajectories in mind, this analysis still provides comforting arguments as to the physical meaningfulness of and patterns in DARDAR-Nice.
Spatial distributions of , and corresponding to 10 years of DARDAR-Nice products are now analyzed. A thorough evaluation of these distributions remains difficult due to the lack of other references for such climatological data; thus, preliminary results are discussed here to assess the overall coherence of the observed Ni patterns to general expectations. The interpretation of these distributions in terms of evidence of controls on Ni are only briefly addressed here as they will be the focus of Part 2 of this paper.
6.1 Geographical distributions
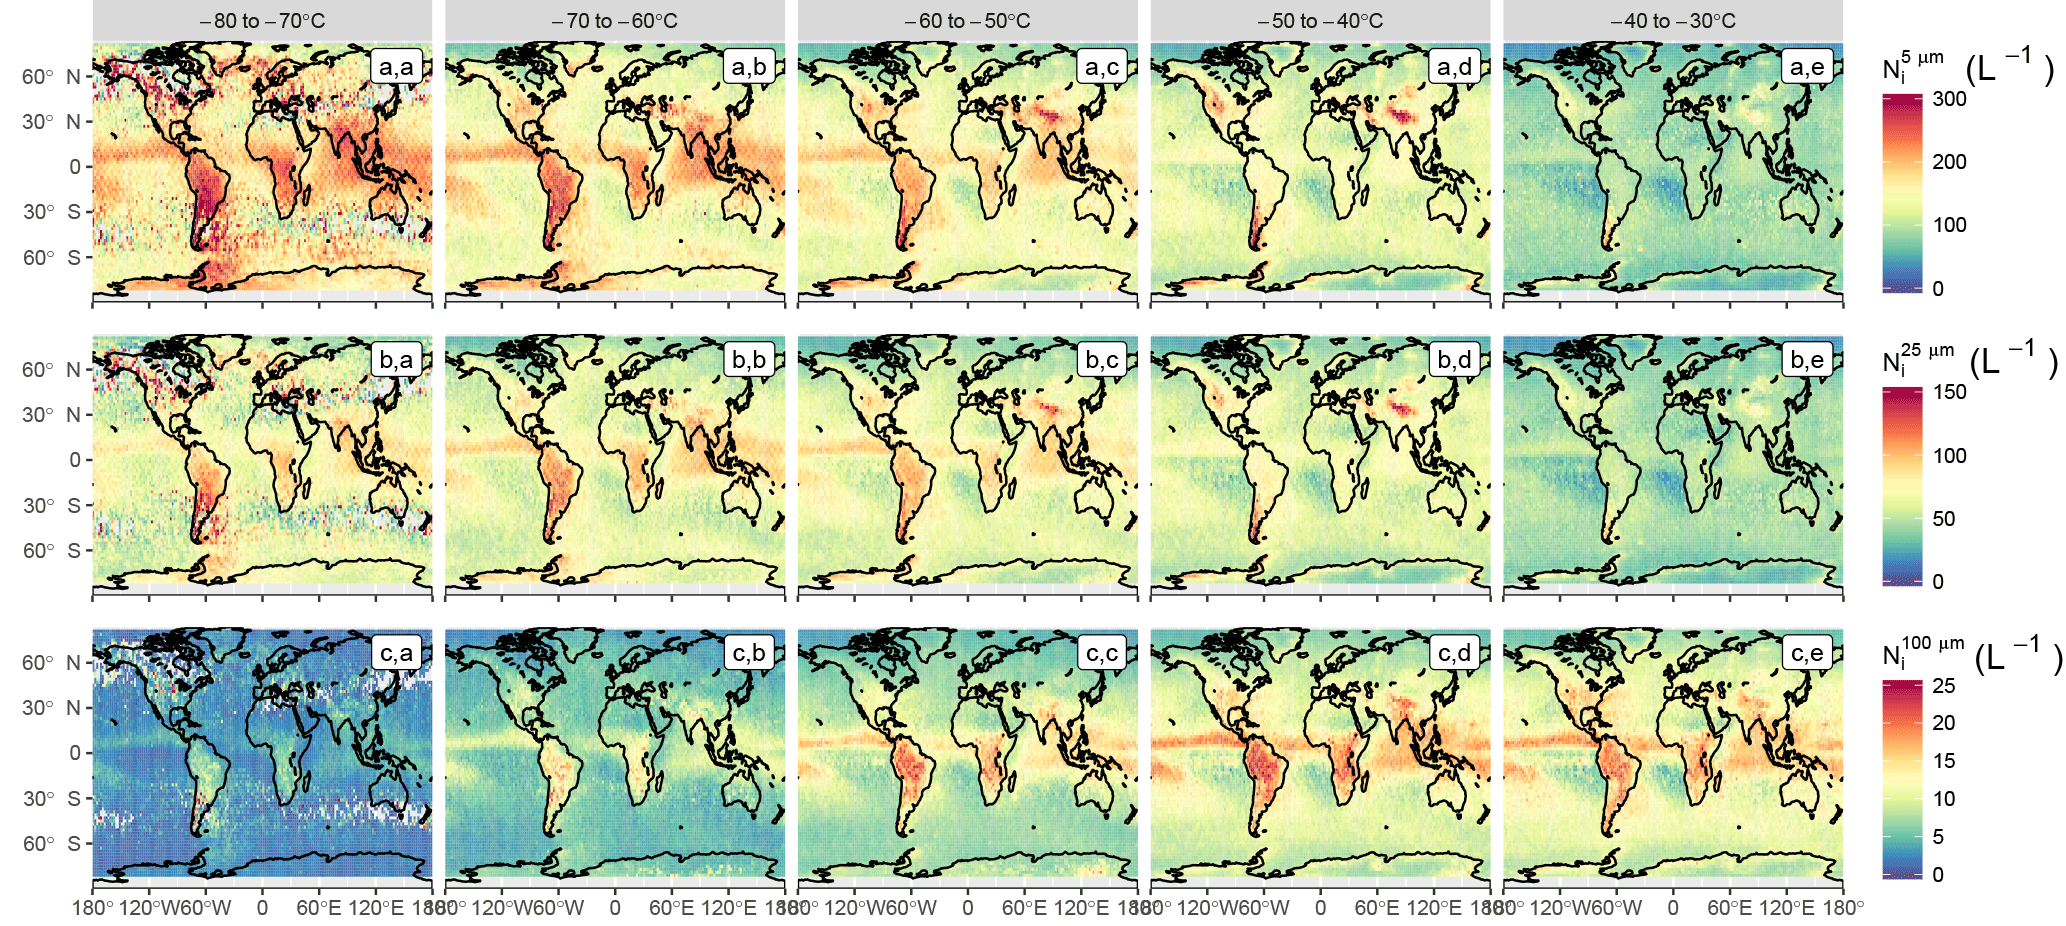
Figure 7Spatial distribution of (a.a–a.e), (b.a–b.e) and (c.a–c.e) from 2006 to 2016, averaged in a 2×2∘ lat–lon grid and per 10 ∘C temperature bin from −80 to −30 ∘C.
Figure 7a.a–a.e show the spatial distribution of averaged in a 2×2∘ lat–lon grid and subset into 10 ∘C bins from −80 to −30 ∘C. Corresponding pixel counts are shown in Fig. S8. The shows a strong temperature dependence, with higher values being observed at colder Tc globally (Fig. 7a.a–a.e). This Tc dependence is particularly important over tropical land regions and in regions experiencing strong convection (the tropical warm pool or intertropical convergence zone – ITCZ). This is consistent with the strong updrafts in convective regions producing high supersaturations and, in turn, higher nucleation rates, which cause these increased values (Kärcher and Lohmann, 2002; Krämer et al., 2016).
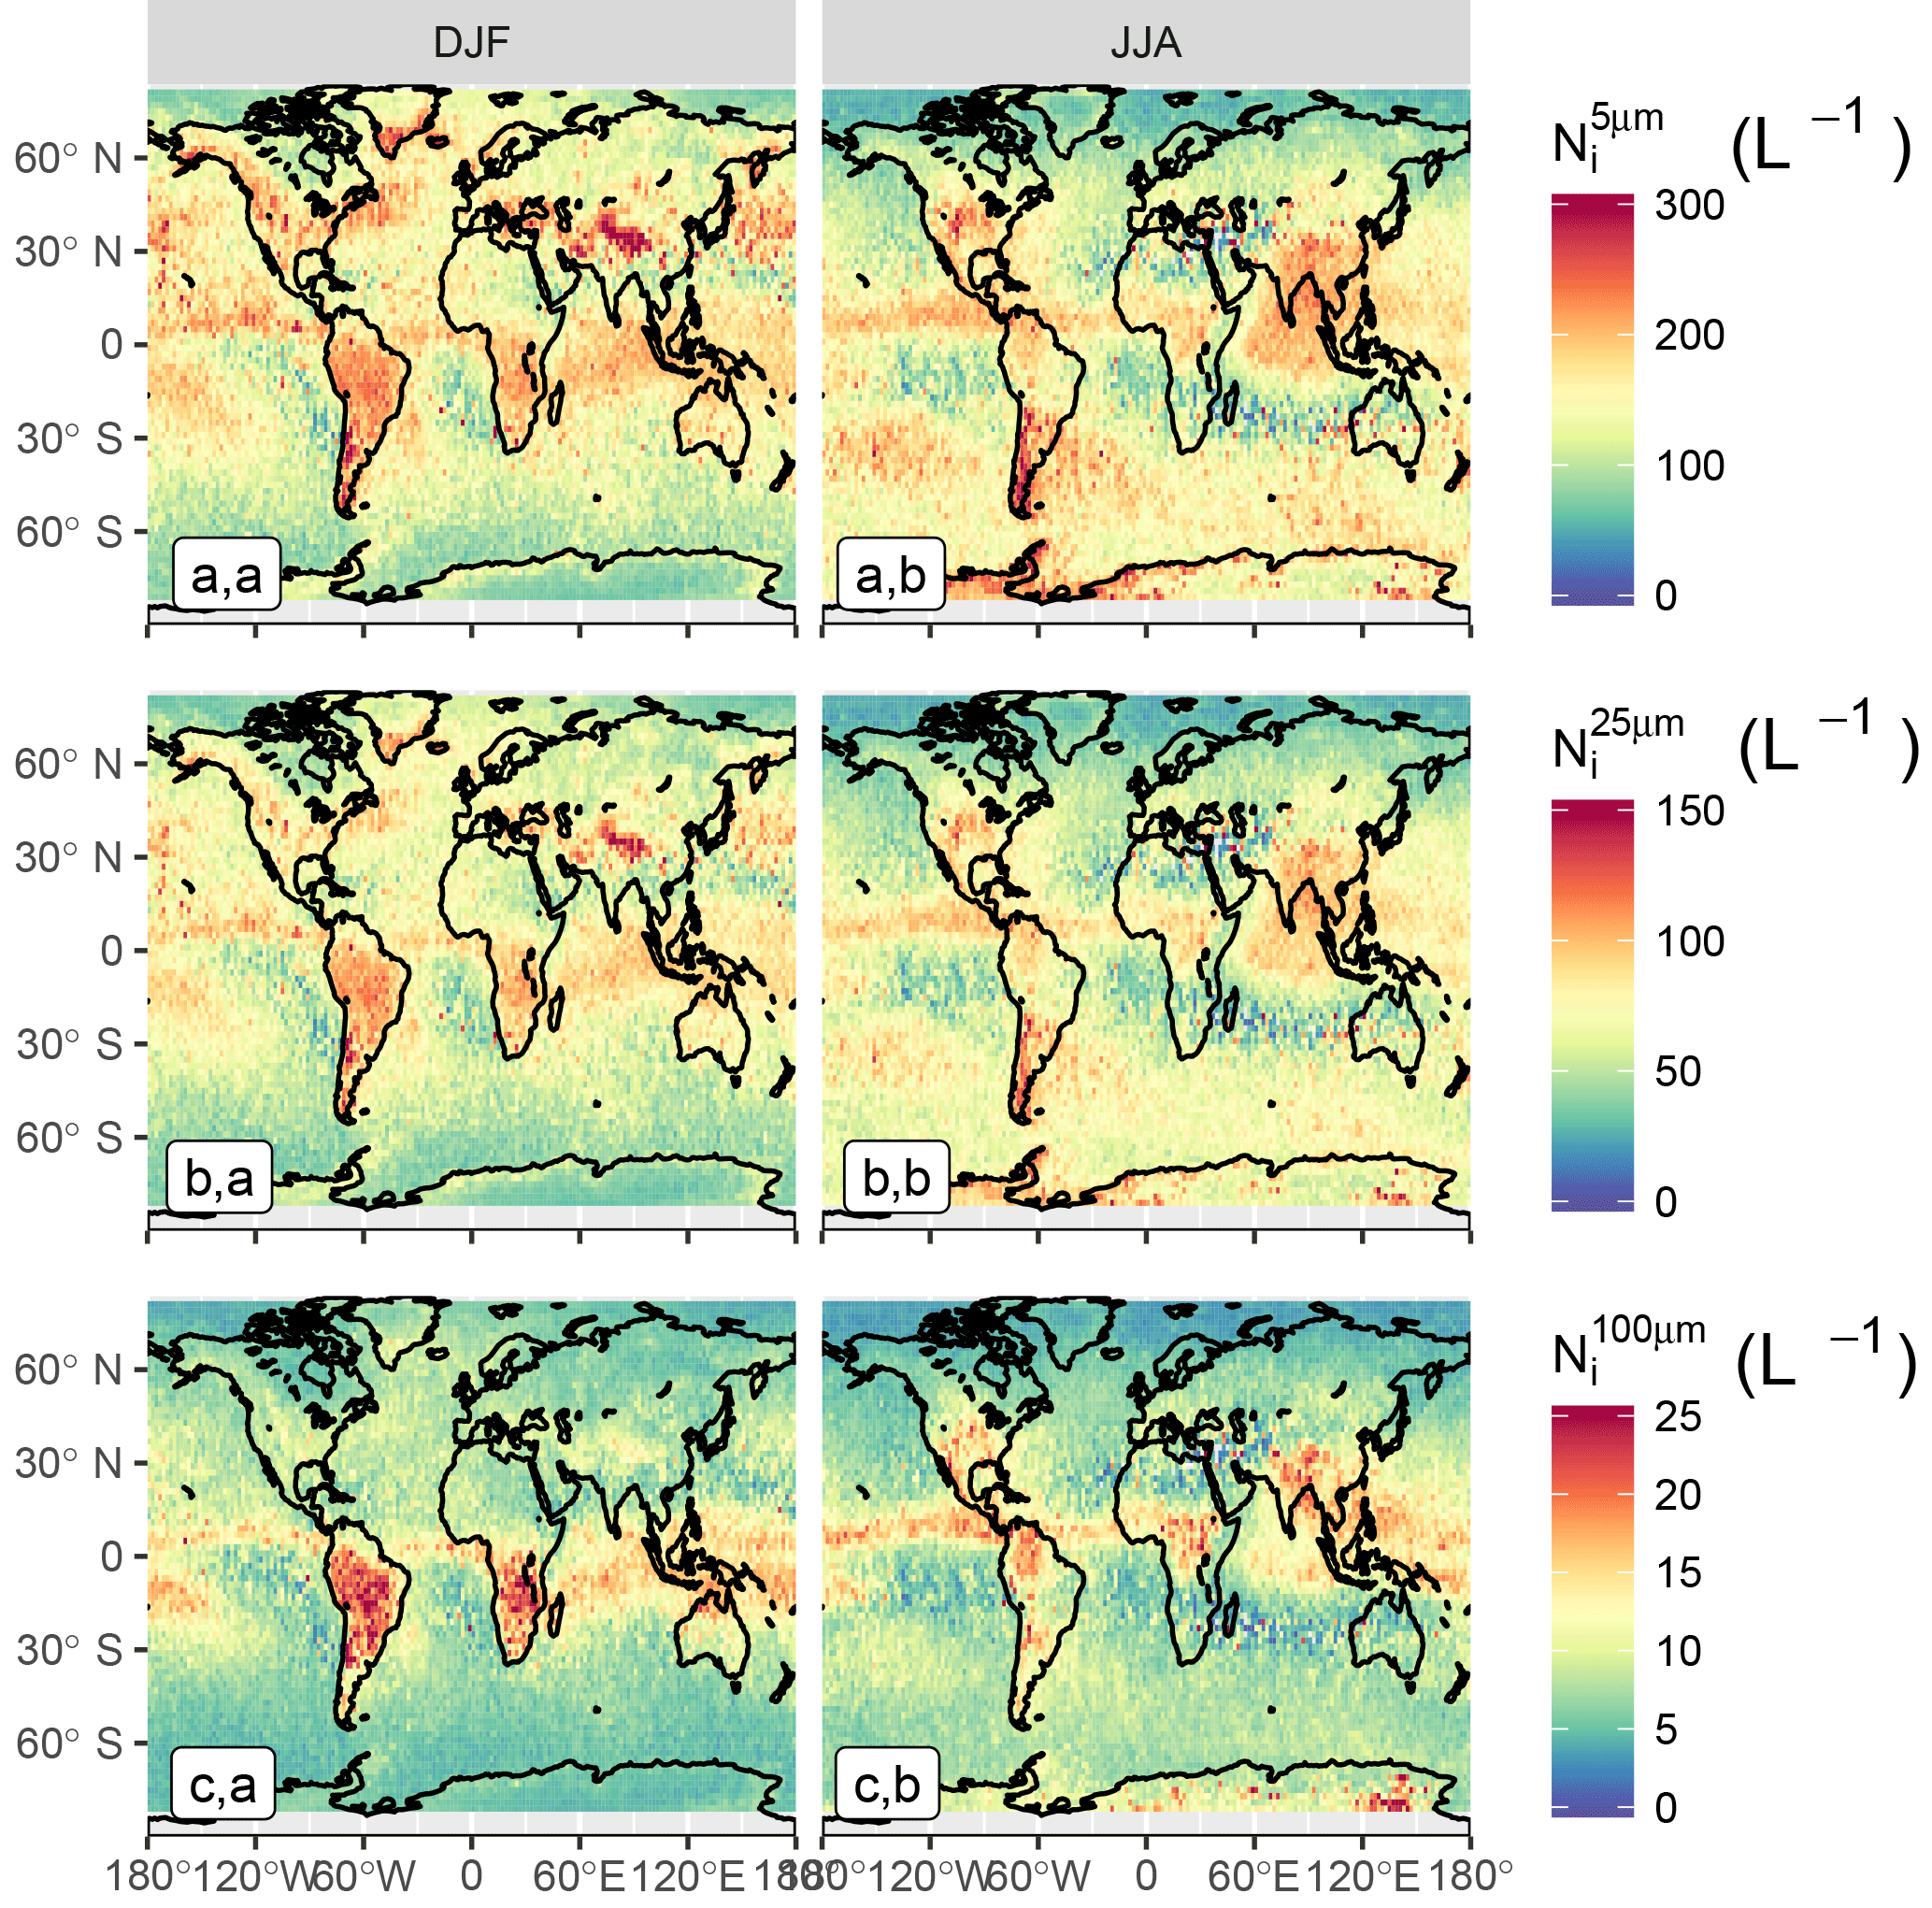
Figure 8Spatial distribution in (a.a; a.b), (b.a; b.b) and (c.a; c.b) between −60 and −50 ∘C , during Northern Hemisphere winter (DJF; a.a; b.a; c.a) and summer (JJA; a.b; b.b; c.b) seasons.
Low values, below 100 L−1, are observed in subsidence regions, where thin cirrus are typically met. Nevertheless, it should be kept in mind that these regions contain few ice clouds, which are most likely the remnants of jets stream or tropical anvils (see Fig. S8). On the contrary, maximum mean values, between 200 and 300 L−1, appear at very low temperatures and in deep convective regions. It can be noted that these numbers are about 2–3 times higher than the concentrations reported by Jensen et al. (2013a, 2016) for TTL cirrus, which are more consistent with the 100 L−1 that are found here in subsidence regions. This could hint at an overestimation of by DARDAR-Nice at these temperatures, possibly related to the fact that the increase of the concentration towards small ice crystals noted for D05 in Figs. 1 and 2 is too steep. However, it is difficult (based on Fig. 7) to disentangle the contributions from different cloud types or meteorological conditions to Ni, which would be required to properly compare these Ni climatologies to specific in situ measurements. This point will be further discussed in Part 2.
There is also a strong Tc relationship in orographic regions, but it is prominent at warmer temperatures, with a large increase in being observed in the Himalayas, the Rockies, the southern Andes and the Antarctic Peninsula, as well as on the edge of the East Antarctic ice sheet (Fig. 7a, d). These higher values are typically found in the midlatitudes, where higher wind speeds provide stronger orographic uplifts (Gryspeerdt et al., 2018a). Consequently, such features are less likely in the tropics, where the atmosphere is barotropic. This is clearly noted in the Andes for instance, where no high values appear at the northern end of the mountain range.
Similar features are seen in the distributions of , with absolute values that are about 50 % smaller than . Therefore, maximum values, found at low Tc in the tropics or in orographic regions, are about 100 L−1. It is reiterated that is relatively robust to PSD shape assumptions (see Sect. A3) and was found to agree well with in situ measurements for ∘C. Another notable difference with is the weaker temperature dependence of below −50 ∘C, particularly in convective regions. This could be due to ice crystals larger than 25 µm being less directly related to homogeneous freezing events.
The spatial distribution of the shown in Fig. 7c.a–c.e is noticeably different, with a significantly reduced at lower temperatures. This might be expected due to the reduced efficiency of the aggregation and deposition processes needed to generate larger crystals at colder Tc, along with the size sorting of ice crystals in cirrus clouds. At all of the temperatures examined, higher values are observed in convective regions, where updrafts are sufficient to transport large particles to the upper troposphere, but also where high and at colder temperatures subsequently lead to high as the clouds mature.
The seasonal variability of Ni spatial distributions in the −60 to −50 ∘C bin is shown in Fig. 8. Strong variations are found in the tropics and along the ITCZ, where large cloud structures are convectively driven. High Ni values are noted in these regions during summer seasons, which strengthens their link to freezing events associated with deep convective structures. These values typically decrease by a factor of 2–3 during winter seasons. Inversely, and in the midlatitude storm tracks and orographic regions are found to be higher during winter months, consistent with stronger jets (Gryspeerdt et al., 2018a).
Comparisons of these results with recent findings by Mitchell et al. (2016, 2018) based on thermal infrared and lidar measurements show good consistency in midlatitude regions (increases of Ni orographic and storm track regions). Lower absolute Ni values are found here, possibly due to the use of a Dmin threshold. These two studies also identify a strong decrease of Ni in the tropics between −55 and −45 ∘C that do not clearly appear in Fig. 7a.c–a.d. A possible explanation for this could be the different cloud sampling techniques between the two methods. Lidar and thermal infrared measurements only provide the concentrations of thin to moderately thick cirrus or near cloud-top concentrations found at this temperature range, whereas Fig. 7 also indicates Ni within deep convective clouds, where high values can be expected (Paukert et al., 2017). Therefore, more consistent comparisons with these studies would require the study of the spatial distributions of DARDAR-Nice Ni at cloud top. This will be carried out in Part 2.
6.2 Zonal profile distributions
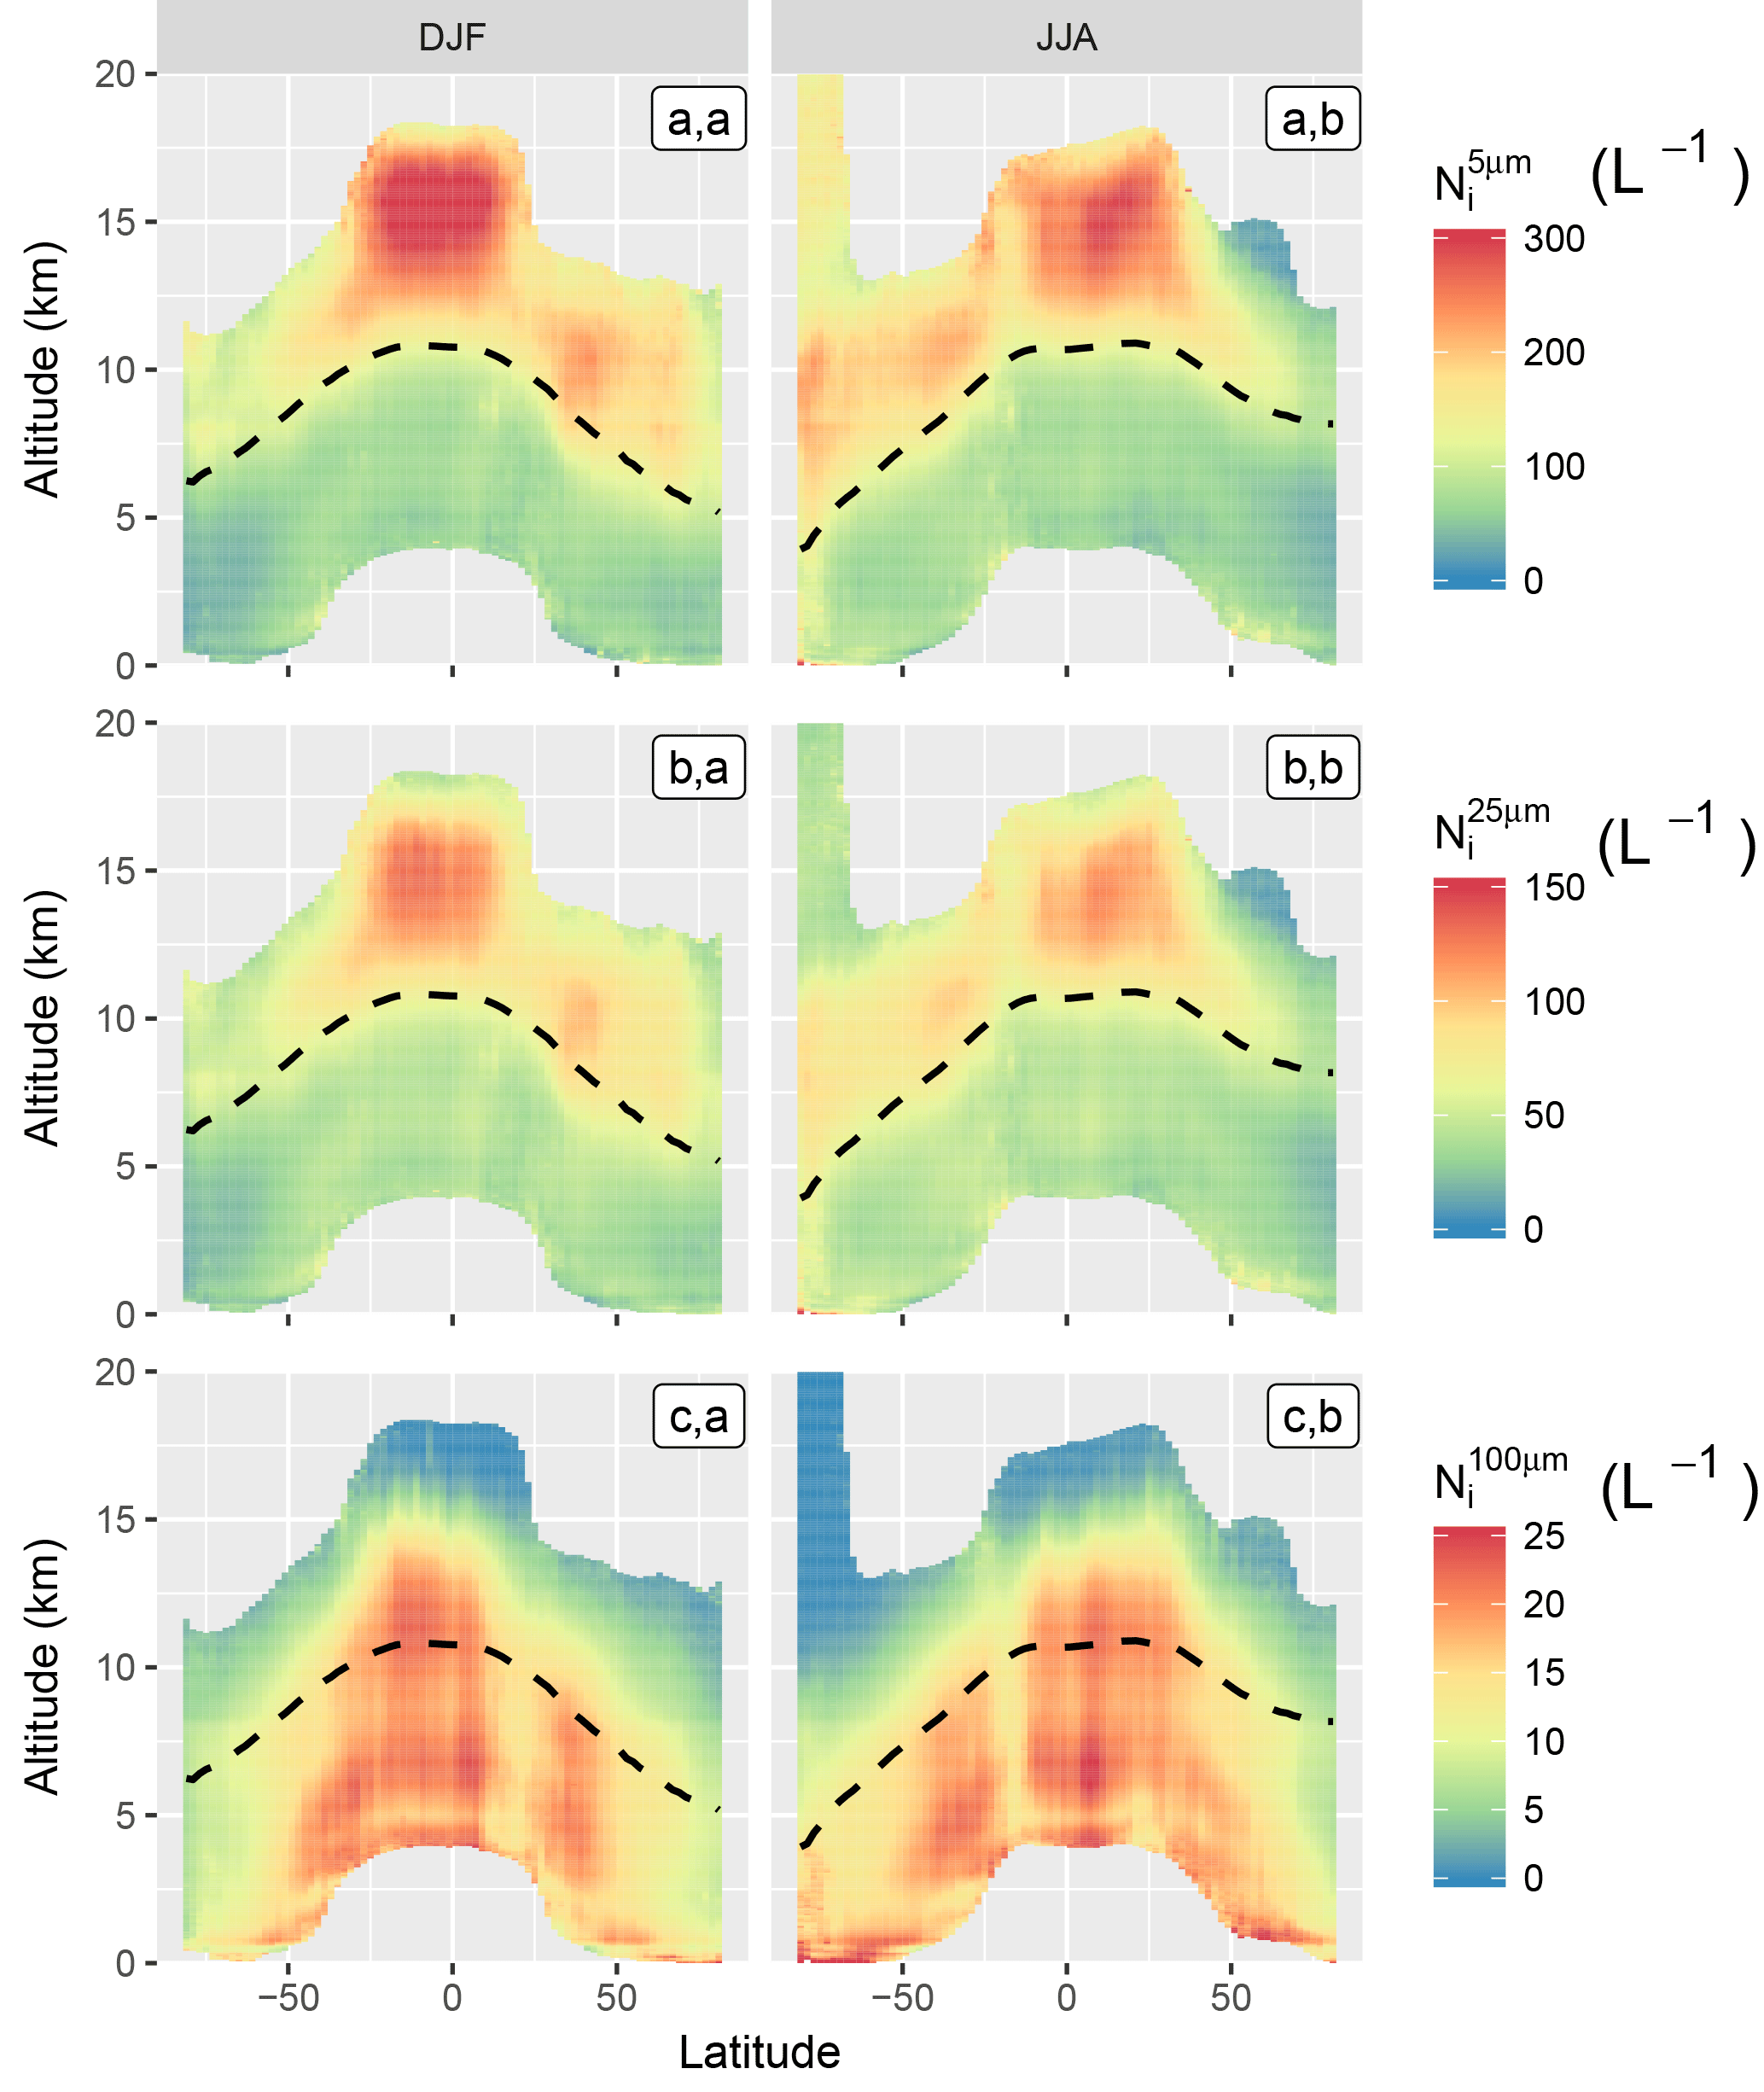
Figure 9Zonal profiles of (a.a; a.b), (b.a; b.b) and (c.a; c.b), during Northern Hemisphere winter (DJF; a.a; b.a; c.a) and summer (JJA; a.b; b.b; c.b) seasons. The −40 ∘C isoline is shown as a dashed black line.
Subsets of zonal profiles distributions of , and corresponding to the Northern Hemisphere winter (DJF) and summer (JJA) seasons are presented in Fig. 9. Corresponding pixels counts are provided in Fig. S9.
As with the global maps in Fig. 7, a dependency between Ni and the temperature is observed. It is clear from these zonal plots that this relationship is not linear, as and nearly double their values upon crossing the −40 ∘C isoline (dashed line). Because homogeneous nucleation rates become significant at colder temperatures (Koop et al., 2000), this suggests that the at temperatures colder than −40 ∘C is strongly influenced by homogeneous freezing. The increase in is particularly strong in the tropics, where convective updrafts may be able to generate the high supersaturations required for homogeneous nucleation.
It is also observed that values, and values to a lesser extent, decrease at very low temperatures towards the tropopause. This could indicate lower and at cloud top, but should be carefully considered due to the low statistical significance of retrievals in the high troposphere (see Fig. S9). This feature also appears in convective regions and could hint at lower Ni in very cold TTL cirrus by comparison to the high values found within convective structures below the freezing level. It can be noted that the vertical structure of and observed here in the tropics is consistent with recent simulations of deep convective clouds by Paukert et al. (2017). Finally, it should be mentioned that the values of about 150 L−1 observed above 12 km over Antarctica during the winter season are highly uncertain due to likely issues in the cloud mask and retrievals in this region.
Consistent with the global maps in Fig. 7c.a–c.e, there is a strong decrease in with decreasing temperature. This temperature dependence is much stronger for ∘C, and becomes much weaker at warmer temperatures. Despite being lower than , at warmer temperatures, the reaches values higher than 20 L−1, such that large crystals comprise a significant fraction of the total (50–100 L−1). This temperature dependence will be further investigated in Part 2.
A novel approach to estimate Ni from combined CALIPSO–CloudSat measurements, called DARDAR-Nice, is presented here and evaluated against in situ measurements and in the context of a case study and a preliminary climatological analysis.
Based on about 40 000 PSD measurements from five recent in situ campaigns, it is demonstrated that Ni can be predicted by constraining the moments of normalized PSDs using βext and Ze measurements. The D05 parameterization appears capable of predicting the measured concentration of particles from different minimum size thresholds and for ice clouds with Tc spanning from −90 to −30 ∘C reasonably well, demonstrating good predictions of , and (Fig. 2). Nevertheless, a possible bias in and predictions is noted when Tc≳−50 ∘C and is explained by a misrepresentation in D05 of the bimodality observed in the measured PSDs (Fig. 1). A slight overestimation of by D05, by a factor less than 2, is also noted when ∘C due to the fact that the representation of the concentration in particles smaller than 25 µm is too steep. does not seem significantly impacted, as it is less sensitive to PSD shape assumptions (Sect. A3).
Following these results, it is verified that Ni estimates inferred from IWC and retrievals of DARDAR, which use D05, are also in good agreement with the in situ measurements from coincident flights (Figs. 3–4). Good agreements are observed between DARDAR-Nice and coincident D05 predictions based on the coincident in situ measurements, which demonstrates the sufficient sensitivity in βext and Ze to constrain Ni. Observed differences between DARDAR-Nice and the in situ data are consistent with the aforementioned expectations and are explained by limited PSD shape assumptions in D05. It was noted that lidar-only estimates of Ni are possible because, despite being associated with fewer observational constraints, they correspond to PSDs observed at cloud top or in thin cirrus that tend to follow a monomodal shape. Due to the strong bimodality of PSDs associated with radar-only retrievals, corresponding estimates of and are more difficult. Finally, it should be noted that these analyses of coincident flights are only based on 2D-S measurements, which can be uncertain for sizes between 5 and 25 µm. Therefore, more in situ comparisons will be necessary to further evaluate from DARDAR-Nice.
Reasonable physical consistency is also found in the vertical distribution of Ni estimates analyzed along a short orbital track in the context of a case study representative of an occluded frontal system. and are found to increase below −40 ∘C (Fig. 6f–g), in conformity with higher homogeneous nucleation rates. Large values are found deeper in thick cloud layers. As expected, very good consistency is observed between estimates obtained in lidar-only, radar-only and lidar–radar conditions. Based on a quantitative analysis of the trajectory of two air masses, it is observed that regions that are subject to stronger updrafts and, in turn, supplied moisture show peaks in , whereas regions representative of mature cloud parcels do not. Direct comparisons to aircraft measurements that are coincident with the satellite track again confirm that DARDAR-Nice very satisfactorily reproduces the overall values and spatial variability measured in situ.
Finally, global distributions of and are analyzed on the basis of a 10-year climatology (Figs. 7–9). An overall increase of is observed with decreasing temperature but its rate is regionally dependent. A global increase is observed as Tc reaches −40 ∘C, consistent with a strong temperature dependency of the homogeneous nucleation rate. However, steep increases when ∘C are only observed in regions where uplifts are sustained by convection or orography, in agreement with expectations of high sensitivity of the Ni to updrafts. Thus, the lidar–radar Ni estimates introduced in this study constitute a first and very encouraging basis to provide global observational constraints of this quantity. This, in turn, will open the door to a better understanding of cloud processes and their evaluation in climate and numerical weather prediction models. Improvements of the method remain necessary to reduce the uncertainties related to these Ni estimates. In particular, the use of a PSD parameterization that is better fitted to retrieving Ni. This includes a better representation of bimodality and possibly a less steep increase of the concentration in small particles at low temperatures. Further comparisons to in situ measurements as well as modeling are also intended to continue the evaluation of this new Ni product. A detailed investigation of the controls on Ni based on the DARDAR-Nice dataset is presented in Part 2 of this series.
The DARDAR-Nice product created in this study can be retrieved via the AERIS/ICARE data center (Sourdeval et al., 2018). Additional gridded data can be obtained from the corresponding author upon request. The DARDAR product was retrieved via ICARE and the MODIS MYD09CMG product was retrieved via the NASA Land Processes Distributed Active Archive Center (https://e4ftl01.cr.usgs.gov, last access: 2 October 2018). All in situ data are available through mission-based databases and can be accessed after signing a data agreement. ACRIDICON-CHUVA and ML-CIRRUS are available via the DLR HALO database (https://halo-db.pa.op.dlr.de, last access: 2 October 2018), COALESC via the MetOffice FAAM database (http://data.ceda.ac.uk/badc/faam, last access: 2 October 2018), SPARTICUS via the ARM data discovery center (https://www.archive.arm.gov/discovery/, last access: 2 October 2018) and ATTREX via the NASA Earth Science Project Office (https://espoarchive.nasa.gov, last access: 2 October 2018).
Ni under lidar- and radar-only conditions
The simultaneous use of lidar and radar observations makes DARDAR sensitive to a wide variety of ice clouds, with IWPs spanning from about 0.01 g m−2 to 5 kg m−2 (Sourdeval et al., 2016). Nevertheless, it should be kept in mind that the information provided by these two instruments does not always overlap, leading to lidar-only and radar-only regions in the vertical profiles where cloud layers are optically very thin or thick, respectively. Fewer constraints are applied on D05 in this partial or complete absence of information from one instrument and so retrievals may be more uncertain.
Under such conditions, DARDAR relies on a priori information provided by an empirical relationship between , αext and the layer temperature Tc (Hogan et al., 2006). This relationship is further constrained in the occurrence of lidar–radar conditions within the same column to improve the physical consistency of the a priori constraints (Hogan, 2007). Nevertheless, the exact weight of these constraints on lidar-only and radar-only retrievals is difficult to quantify from the operational products only. The number of iteration is used here as a proxy to avoid any strong influence of a priori assumptions on the retrievals; cloud products associated with niter<2 are excluded from this study.
Following these considerations, it can be expected that DARDAR retrievals are optimal when both lidar and radar measurements are available. However, predicting the consequence of lidar-only or radar-only conditions on Ni is not trivial. Reasonable Ni estimates should be possible in lidar-only regions due to βext being sensitive to small particles (to ℳ2), which largely contribute to Ni (ℳ0). PSDs observed in lidar-only conditions, i.e., towards cloud-top, are also likely to be monomodal and, in turn, easier for D05 to represent. Radar-only estimates may be more difficult due to Ze being mainly sensitive to large particles (to ℳ6); therefore, these estimates depend on the capability of D05 to extrapolate the concentration in small particles. These questions are investigated and discussed throughout the manuscript (see in particular Sect. 4.2).
A2 Propagation of DARDAR operational errors
A qualitative estimation of the errors expected in Ni can be obtained based on the uncertainties associated with DARDAR IWC and retrievals. These account for instrumental errors and uncertainties attached to non-retrieved parameters used to simulate the lidar and radar measurements. A direct propagation of these errors on Ni can be reached from . The variances and are provided in DARDAR and the partial derivatives can be solved from the equations provided in Sect. 2.2. The relative uncertainties typically increase from about 25 % in lidar–radar conditions to 50 % in lidar-only or radar-only conditions (see Fig. S2), which confirms expectations of lidar–radar estimates being more precise due to a higher information content. However, these numbers only provide rough estimates of the actual uncertainties expected on Ni as no rigorous errors are associated with non-retrieved parameters that are critical for its accuracy. For instance, the errors associated with PSD shape assumptions are only represented by fixed errors on βext and Ze simulations instead of being computed from the exact sensitivity of these measurements to α and β and to the atmospheric state at each iteration.
Influence of PSD shape assumptions on Ni
Important uncertainties in Ni can be expected from the choice of α and β in Eq. (4). The former parameter is especially critical as it controls the steepness of the PSD towards small particles and strongly varies depending on the dominating nucleation processes (Mitchell, 1991). The normalization approach by D05 should, in principle, account for such variations in the PSD shape by adjusting the scaling parameters and Dm, but large deviations from the assumed α value due to unusual conditions could still have consequences on subsequent Ni estimates. For instance, an overestimation of α (i.e., a less negative α) in D05 will lead to an underestimation of Ni. This could occur in the presence of very high homogeneous nucleation rates (e.g., related strong orographic updraft) where α is very negative. Reciprocally, an underestimation of α is possible in cases of highly dominant aggregation processes and will lead to an overestimation of Ni. The variability of α and β between numerous airborne campaigns has been investigated by D14 in order to propose an updated version of the PSD parameterization for future DARDAR versions. Based on the shape parameters extracted in this study, it could be estimated that uncertainties within about 50 % (usually an overestimation) can reasonably be expected in Ni as a result of variations from the PSD shape assumed in DARDAR (see Fig. S3 for details). Nevertheless, lower uncertainties should be expected if the PSD is not too broad (i.e., in cases where homogeneous nucleation dominates) and if very small particles are discarded by a high integration threshold. Consequently, is less sensitive to errors in α and β than . These numbers remain preliminary as the average and IWC values used here may not be fully representative of each couple of α and β. Finally, it can be noted that the coefficients chosen by D14 for future DARDAR versions, noted “all (DARDAR)” in Fig. S3, should lead to smaller and values due to a less negative α.
The supplement related to this article is available online at: https://doi.org/10.5194/acp-18-14327-2018-supplement.
OS, EG and JQ conceived the study; OS, EG, TG and FH performed the analyses; MK and AA provided expertise on the in situ data; JD provided expertise on the satellite data; OS and EG wrote the paper. All of the authors assisted with the interpretation of the results and commented on the paper.
The authors declare that they have no conflict of interest.
The authors gratefully acknowledge the science teams involved with collecting
and providing the airborne measurements used in this study. The authors are
grateful to Paul Lawson and Sarah Woods for helpful discussions regarding the
processing of 2DS and FCDP data from these two campaigns. The NOAA Air
Resources Laboratory and National Center for Atmospheric Prediction is
acknowledged for the provision of HYSPLIT trajectories and NARR reanalyses.
We are grateful to the Deutsches Klimarechenzentrum (DKRZ) for providing the
computational resources necessary for this study. This work was funded by the
European Research Council (grant no. 306284 “QUAERERE”), by the Federal
Ministry for Education and Research in Germany (Bundesministerium für
Bildung und Forschung, BMBF) in the “HD(CP)2” project (grant no. FKZ 01LK1210D,
01LK1503A and 01LK1505E) and by the
German Research Foundation (Deutsche Forschungsgemeinschaft, DFG) Priority
Programme SPP 1294 “HALO”, project QU 311/14-1 (“FLASH”). Tom Goren
received funding from the European Union Horizon 2020 research and innovation
programme under the Marie Sklodowska-Curie grant agreement no. 703880. Edward
Gryspeerdt was supported by an Imperial College London Junior Research
Fellowship. We acknowledge support from the German Research Foundation (DFG)
and Leipzig University within the program of Open Access
Publishing.
Edited by: Matthias Tesche
Reviewed by: three anonymous referees
Afchine, A., Rolf, C., Costa, A., Spelten, N., Riese, M., Buchholz, B., Ebert, V., Heller, R., Kaufmann, S., Minikin, A., Voigt, C., Zöger, M., Smith, J., Lawson, P., Lykov, A., Khaykin, S., and Krämer, M.: Ice particle sampling from aircraft – influence of the probing position on the ice water content, Atmos. Meas. Tech., 11, 4015–4031, https://doi.org/10.5194/amt-11-4015-2018, 2018. a, b
Austin, R. T. and Stephens, G. L.: Retrieval of stratus cloud microphysical parameters using millimeter-wave radar and visible optical depth in preparation for CloudSat: 1. Algorithm formulation, J. Geophys. Res.-Atmos., 106, 28233–28242, 2001. a
Austin, R. T., Heymsfield, A. J., and Stephens, G. L.: Retrieval of ice cloud microphysical parameters using the CloudSat millimeter-wave radar and temperature, J. Geophys. Res.-Atmos., 114, D00A23, https://doi.org/10.1029/2008JD010049, 2009. a, b
Baran, A. J.: A review of the light scattering properties of cirrus, J. Quant. Spectrosc. Ra., 110, 1239–1260, https://doi.org/10.1016/j.jqsrt.2009.02.026, 2009. a
Battaglia, A. and Delanoë, J.: Synergies and complementarities of CloudSat-CALIPSO snow observations, J. Geophys. Res.-Atmos., 118, 721–731, https://doi.org/10.1029/2012JD018092, 2013. a
Benedetti, A., Stephens, G. L., and Haynes, J. M.: Ice cloud microphysics retrievals from millimeter radar and visible optical depth using an estimation theory approach, J. Geophys. Res.-Atmos., 108, 2156–2202, https://doi.org/10.1029/2002JD002693, 2003. a
Bennartz, R. and Rausch, J.: Global and regional estimates of warm cloud droplet number concentration based on 13 years of AQUA-MODIS observations, Atmos. Chem. Phys., 17, 9815–9836, https://doi.org/10.5194/acp-17-9815-2017, 2017. a
Boers, R., Acarreta, J. R., and Gras, J. L.: Satellite monitoring of the first indirect aerosol effect: Retrieval of the droplet concentration of water clouds, J. Geophys. Res.-Atmos., 111, 2156–2202, 2006. a
Boucher, O., Randall, D., Artaxo, P., Bretherton, C., Feingold, G., Forster, P., Kerminen, V.-M., Kondo, Y., Liao, H., Lohmann, U., Rasch, P., Satheesh, S., Sherwood, S., Stevens, B., and Zhang, X.: Clouds and Aerosols, in: Climate Change 2013: The Physical Science Basis. Contribution of Working Group I to the Fifth Assessment Report of the Intergovernmental Panel on Climate Change, edited by: Stocker, T., Qin, D., Plattner, G.-K., Tignor, M., Allen, S., Boschung, J., Nauels, A., Xia, Y., Bex, V., and Midgley, P., https://doi.org/10.1017/CBO9781107415324.016, Cambridge University Press, Cambridge, United Kingdom and New York, NY, USA, 2013. a
Brenguier, J.-L., Pawlowska, H., Schüller, L., Preusker, R., Fischer, J., and Fouquart, Y.: Radiative Properties of Boundary Layer Clouds: Droplet Effective Radius versus Number Concentration, J. Atmos. Sci., 57, 803–821, 2000. a
Brown, P. R. A. and Francis, P. N.: Improved Measurements of the Ice Water Content in Cirrus Using a Total-Water Probe, J. Atmos. Ocean. Tech., 12, 410–414, 1995. a
Ceccaldi, M., Delanoë, J., Hogan, R. J., Pounder, N. L., Protat, A., and Pelon, J.: From CloudSat-CALIPSO to EarthCare: Evolution of the DARDAR cloud classification and its comparison to airborne radar-lidar observations, J. Geophys. Res.-Atmos., 118, 7962–7981, https://doi.org/10.1002/jgrd.50579, 2013. a
Comstock, J. M., Lin, R.-F., Starr, D. O., and Yang, P.: Understanding ice supersaturation, particle growth, and number concentration in cirrus clouds, J. Geophys. Res.-Atmos., 113, D23211, https://doi.org/10.1029/2008JD010332, 2008. a
Costa, A., Meyer, J., Afchine, A., Luebke, A., Günther, G., Dorsey, J. R., Gallagher, M. W., Ehrlich, A., Wendisch, M., Baumgardner, D., Wex, H., and Krämer, M.: Classification of Arctic, midlatitude and tropical clouds in the mixed-phase temperature regime, Atmos. Chem. Phys., 17, 12219–12238, https://doi.org/10.5194/acp-17-12219-2017, 2017. a, b, c
Delanoë, J. and Hogan, R. J.: A variational scheme for retrieving ice cloud properties from combined radar, lidar, and infrared radiometer, J. Geophys. Res.-Atmos., 113, D07204, https://doi.org/10.1029/2007JD009000, 2008. a
Delanoë, J. and Hogan, R. J.: Combined CloudSat-CALIPSO-MODIS retrievals of the properties of ice clouds, J. Geophys. Res.-Atmos., 115, D00H29, https://doi.org/10.1029/2009JD012346, 2010. a, b, c
Delanoë, J., Protat, A., Testud, J., Bouniol, D., Heymsfield, A. J., Bansemer, A., Brown, P. R. A., and Forbes, R. M.: Statistical properties of the normalized ice particle size distribution, J. Geophys. Res.-Atmos., 110, D10201, https://doi.org/10.1029/2004JD005405, 2005. a
Delanoë, J., Heymsfield, A. J., Protat, A., Bansemer, A., and Hogan, R. J.: Normalized particle size distribution for remote sensing application, J. Geophys. Res, 119, 4204–4227, https://doi.org/10.1002/2013JD020700, 2014. a
Deng, M., Mace, G. G., Wang, Z., and Okamoto, H.: Tropical Composition, Cloud and Climate Coupling Experiment validation for cirrus cloud profiling retrieval using CloudSat radar and CALIPSO lidar, J. Geophys. Res.-Atmos., 115, D00J15, https://doi.org/10.1029/2009JD013104, 2010. a
Deng, M., Mace, G. G., Wang, Z., and Lawson, R. P.: Evaluation of Several A-Train Ice Cloud Retrieval Products with In Situ Measurements Collected during the SPARTICUS Campaign, J. Appl. Meteorol. Clim., 52, 1014–1030, https://doi.org/10.1175/JAMC-D-12-054.1, 2012. a, b, c
Eliasson, S., Buehler, S. A., Milz, M., Eriksson, P., and John, V. O.: Assessing observed and modelled spatial distributions of ice water path using satellite data, Atmos. Chem. Phys., 11, 375–391, https://doi.org/10.5194/acp-11-375-2011, 2011. a
Erfani, E. and Mitchell, D. L.: Developing and bounding ice particle mass- and area-dimension expressions for use in atmospheric models and remote sensing, Atmos. Chem. Phys., 16, 4379–4400, https://doi.org/10.5194/acp-16-4379-2016, 2016. a, b, c, d
Farrington, R. J., Connolly, P. J., Lloyd, G., Bower, K. N., Flynn, M. J., Gallagher, M. W., Field, P. R., Dearden, C., and Choularton, T. W.: Comparing model and measured ice crystal concentrations in orographic clouds during the INUPIAQ campaign, Atmos. Chem. Phys., 16, 4945–4966, https://doi.org/10.5194/acp-16-4945-2016, 2016. a
Feofilov, A. G., Stubenrauch, C. J., and Delanoë, J.: Ice water content vertical profiles of high-level clouds: classification and impact on radiative fluxes, Atmos. Chem. Phys., 15, 12327–12344, https://doi.org/10.5194/acp-15-12327-2015, 2015. a
Field, P. R., Wood, R., Brown, P. R. A., Kaye, P. H., Hirst, E., Greenaway, R., and Smith, J. A.: Ice Particle Interarrival Times Measured with a Fast FSSP, J. Atmos. Ocean. Tech., 20, 249–261, https://doi.org/10.1175/1520-0426(2003)020<0249:IPITMW>2.0.CO;2, 2003. a
Field, P. R., Hogan, R. J., Brown, P. R. A., Illingworth, A. J., Choularton, T. W., and Cotton, R. J.: Parametrization of ice-particle size distributions for mid-latitude stratiform cloud, Q. J. Roy. Meteor. Soc., 131, 1997–2017, https://doi.org/10.1256/qj.04.134, 2005. a
Field, P. R., Heymsfield, A. J., and Bansemer, A.: Shattering and Particle Interarrival Times Measured by Optical Array Probes in Ice Clouds, J. Atmos. Ocean. Tech., 23, 1357–1371, https://doi.org/10.1175/JTECH1922.1, 2006. a
Gong, J. and Wu, D. L.: CloudSat-constrained cloud ice water path and cloud top height retrievals from MHS 157 and 183.3 GHz radiances, Atmos. Meas. Tech., 7, 1873–1890, https://doi.org/10.5194/amt-7-1873-2014, 2014. a
Grosvenor, D. P., Sourdeval, O., Zuidema, P., Ackerman, A. S., Alexandrov, M. D., Bennartz, R., Boers, R., Cairns, B., Chiu, C., Christensen, M., Deneke, H., Diamond, M., Feingold, G., Fridlind, A., Hünerbein, A., Knist, C., Kollias, P., Marshak, A., McCoy, D., Merk, D., Painemal, D., Rausch, J., Rosenfeld, D., Russchenberg, H., Seifert, P., Sinclair, K., Stier, P., van Diedenhoven, B., Wendisch, M., Werner, F., Wood, R., Zhang, Z., and Quaas, J.: Remote sensing of droplet number concentration in warm clouds: A review of the current state of knowledge and perspectives, Rev. Geophys., 56, 409–453, https://doi.org/10.1029/2017RG000593, 2018. a
Gryspeerdt, E., Quaas, J., and Bellouin, N.: Constraining the aerosol influence on cloud fraction, J. Geophys. Res.-Atmos., 121, 3566–3583, https://doi.org/10.1002/2015JD023744, 2016. a
Gryspeerdt, E., Quaas, J., Goren, T., Klocke, D., and Brueck, M.: An automated cirrus classification, Atmos. Chem. Phys., 18, 6157–6169, https://doi.org/10.5194/acp-18-6157-2018, 2018a. a, b
Gryspeerdt, E., Sourdeval, O., Quaas, J., Delanoë, J., Krämer, M., and Kühne, P.: Ice crystal number concentration estimates from lidar–radar satellite remote sensing – Part 2: Controls on the ice crystal number concentration, Atmos. Chem. Phys., 18, 14351–14370, https://doi.org/10.5194/acp-18-14351-2018, 2018b. a
Guignard, A., Stubenrauch, C. J., Baran, A. J., and Armante, R.: Bulk microphysical properties of semi-transparent cirrus from AIRS: a six year global climatology and statistical analysis in synergy with geometrical profiling data from CloudSat-CALIPSO, Atmos. Chem. Phys., 12, 503–525, https://doi.org/10.5194/acp-12-503-2012, 2012. a
Gurganus, C. and Lawson, P.: Laboratory and Flight Tests of 2D Imaging Probes: Toward a Better Understanding of Instrument Performance and the Impact on Archived Data, J. Atmos. Ocean. Tech., 35, 1533–1553, https://doi.org/10.1175/JTECH-D-17-0202.1, 2018. a, b
Han, Q., Rossow, W. B., Chou, J., and Welch, R. M.: Global variation of column droplet concentration in low-level clouds, Geophys. Res. Lett., 25, 1419–1422, https://doi.org/10.1029/98GL01095, 1998. a
Han, Q., Rossow, W. B., Zeng, J., and Welch, R.: Three Different Behaviors of Liquid Water Path of Water Clouds in Aerosol–Cloud Interactions, J. Atmos. Sci., 59, 726–735, https://doi.org/10.1175/1520-0469(2002)059<0726:TDBOLW>2.0.CO;2, 2002. a
Hendricks, J., Kärcher, B., and Lohmann, U.: Effects of ice nuclei on cirrus clouds in a global climate model, J. Geophys. Res.-Atmos., 116, D18206, https://doi.org/10.1029/2010JD015302, 2011. a
Heyn, I., Block, K., Mülmenstädt, J., Gryspeerdt, E., Kühne, P., Salzmann, M., and Quaas, J.: Assessment of simulated aerosol effective radiative forcings in the terrestrial spectrum, Geophys. Res. Lett., 44, 1001–1007, https://doi.org/10.1002/2016GL071975, 2017. a
Hogan, R. J.: A Variational Scheme for Retrieving Rainfall Rate and Hail Reflectivity Fraction from Polarization Radar, J. Appl. Meteorol. Clim., 46, 1544–1564, https://doi.org/10.1175/JAM2550.1, 2007. a
Hogan, R. J., Mittermaier, M. P., and Illingworth, A. J.: The Retrieval of Ice Water Content from Radar Reflectivity Factor and Temperature and Its Use in Evaluating a Mesoscale Model, J. Appl. Meteorol. Clim., 45, 301–317, https://doi.org/10.1175/JAM2340.1, 2006. a
Holl, G., Eliasson, S., Mendrok, J., and Buehler, S. A.: SPARE-ICE: Synergistic ice water path from passive operational sensors, J. Geophys. Res.-Atmos., 119, 1504–1523, https://doi.org/10.1002/2013JD020759, 2014. a
Ickes, L., Welti, A., and Lohmann, U.: Classical nucleation theory of immersion freezing: sensitivity of contact angle schemes to thermodynamic and kinetic parameters, Atmos. Chem. Phys., 17, 1713–1739, https://doi.org/10.5194/acp-17-1713-2017, 2017. a
Inoue, T.: On the temperature and effective emissivity determination of semi-transparent cirrus clouds by bi-spectral measurements in the 10 µm window region, J. Meteorol. Soc. Jpn., 63, 88–98, https://doi.org/10.2151/jmsj1965.63.1_88, 1985. a
Jackson, R. C., McFarquhar, G. M., Fridlind, A. M., and Atlas, R.: The dependence of cirrus gamma size distributions expressed as volumes in N0-λ-μ phase space and bulk cloud properties on environmental conditions: Results from the Small Ice Particles in Cirrus Experiment (SPARTICUS), J. Geophys. Res.-Atmos., 120, 10351–10377, https://doi.org/10.1002/2015JD023492, 2015. a
Jensen, E. J., Toon, O. B., Westphal, D. L., Kinne, S., and Heymsfield, A. J.: Microphysical modeling of cirrus: 1. Comparison with 1986 FIRE IFO measurements, J. Geophys. Res.-Atmos., 99, 10421–10442, https://doi.org/10.1029/93JD02334, 1994. a
Jensen, E. J., Diskin, G., Lawson, R. P., Lance, S., Bui, T. P., Hlavka, D., McGill, M., Pfister, L., Toon, O. B., and Gao, R.: Ice nucleation and dehydration in the Tropical Tropopause Layer, P. Natl. Acad. Sci. USA, 110, 2041–2046, https://doi.org/10.1073/pnas.1217104110, 2013a. a
Jensen, E. J., Lawson, R. P., Bergman, J. W., Pfister, L., Bui, T. P., and Schmitt, C. G.: Physical processes controlling ice concentrations in synoptically forced, midlatitude cirrus, J. Geophys. Res.-Atmos., 118, 5348–5360, https://doi.org/10.1002/jgrd.50421, 2013b. a, b
Jensen, E. J., Pfister, L., Jordan, D. E., Bui, T. V., Ueyama, R., Singh, H. B., Thornberry, T., Rollins, A. W., Gao, R.-S., Fahey, D. W., Rosenlof, K. H., Elkins, J. W., Diskin, G. S., DiGangi, J. P., Lawson, R. P., Woods, S., Atlas, E. L., Navarro Rodriguez, M. A., Wofsy, S. C., Pittman, J., Bardeen, C. G., Toon, O. B., Kindel, B. C., Newman, P. A., McGill, M. J., Hlavka, D. L., Lait, L. R., Schoeberl, M. R., Bergman, J. W., Selkirk, H. B., Alexander, M. J., Kim, J.-E., Lim, B. H., Stutz, J., and Pfeilsticker, K.: The NASA Airborne Tropical TRopopause EXperiment (ATTREX): High-Altitude Aircraft Measurements in the Tropical Western Pacific, B. Am. Meteorol. Soc., 98, 129–143, https://doi.org/10.1175/BAMS-D-14-00263.1, 2015. a
Jensen, E. J., Ueyama, R., Pfister, L., Bui, T. V., Lawson, R. P., Woods, S., Thornberry, T., Rollins, A. W., Diskin, G. S., DiGangi, J. P., and Avery, M. A.: On the Susceptibility of Cold Tropical Cirrus to Ice Nuclei Abundance, J. Atmos. Sci., 73, 2445–2464, https://doi.org/10.1175/JAS-D-15-0274.1, 2016. a
Kärcher, B. and Lohmann, U.: A parameterization of cirrus cloud formation: Homogeneous freezing of supercooled aerosols, J. Geophys. Res.-Atmos., 107, D2, https://doi.org/10.1029/2001JD000470, 2002. a, b
Kärcher, B. and Lohmann, U.: A parameterization of cirrus cloud formation: Heterogeneous freezing, J. Geophys. Res.-Atmos., 108, 4402, https://doi.org/10.1029/2002JD003220, 2003. a
Kärcher, B. and Ström, J.: The roles of dynamical variability and aerosols in cirrus cloud formation, Atmos. Chem. Phys., 3, 823–838, https://doi.org/10.5194/acp-3-823-2003, 2003. a, b
Kärcher, B., Hendricks, J., and Lohmann, U.: Physically based parameterization of cirrus cloud formation for use in global atmospheric models, J. Geophys. Res.-Atmos., 111, D01205, https://doi.org/10.1029/2005JD006219, 2006. a, b, c
Kay, J. E. and Wood, R.: Timescale analysis of aerosol sensitivity during homogeneous freezing and implications for upper tropospheric water vapor budgets, Geophys. Res. Lett., 35, L10809, https://doi.org/10.1029/2007GL032628, 2008. a
Khain, A., Ovtchinnikov, M., Pinsky, M., Pokrovsky, A., and Krugliak, H.: Notes on the state-of-the-art numerical modeling of cloud microphysics, Atmos. Res., 55, 159–224, https://doi.org/10.1016/S0169-8095(00)00064-8, 2000. a
King, M. D., Tsay, S. C., Platnick, S., Wang, M., and Liou, K. N.: Cloud Retrieval Algorithms for MODIS: Optical Thickness, Effective Particle Radius, and Thermodynamic Phase, Algorithm Theor. Basis Doc. ATBD-MOD-05, NASA Goddard Space Flight Cent., Greenbelt, Md., 1998. a
Koop, T., Luo, B., Tsias, A., and Peter, T.: Water activity as the determinant for homogeneous ice nucleation in aqueous solutions, Nature, 406, 611–614, https://doi.org/10.1038/35020537, 2000. a
Korolev, A.: Reconstruction of the Sizes of Spherical Particles from Their Shadow Images. Part I: Theoretical Considerations, J. Atmos. Ocean. Tech., 24, 376–389, https://doi.org/10.1175/JTECH1980.1, 2007. a
Korolev, A. and Field, P. R.: Assessment of the performance of the inter-arrival time algorithm to identify ice shattering artifacts in cloud particle probe measurements, Atmos. Meas. Tech., 8, 761–777, https://doi.org/10.5194/amt-8-761-2015, 2015. a
Korolev, A., Emery, E. F., Strapp, J. W., Cober, S. G., Isaac, G. A., Wasey, M., and Marcotte, D.: Small Ice Particles in Tropospheric Clouds: Fact or Artifact? Airborne Icing Instrumentation Evaluation Experiment, B. Am. Meteorol. Soc., 92, 967–973, https://doi.org/10.1175/2010BAMS3141.1, 2011. a
Korolev, A. V., Emery, E. F., Strapp, J. W., Cober, S. G., and Isaac, G. A.: Quantification of the Effects of Shattering on Airborne Ice Particle Measurements, J. Atmos. Ocean. Tech., 30, 2527–2553, https://doi.org/10.1175/JTECH-D-13-00115.1, 2013. a
Krämer, M., Rolf, C., Luebke, A., Afchine, A., Spelten, N., Costa, A., Meyer, J., Zöger, M., Smith, J., Herman, R. L., Buchholz, B., Ebert, V., Baumgardner, D., Borrmann, S., Klingebiel, M., and Avallone, L.: A microphysics guide to cirrus clouds – Part 1: Cirrus types, Atmos. Chem. Phys., 16, 3463–3483, https://doi.org/10.5194/acp-16-3463-2016, 2016. a, b, c, d, e
Lawson, R. P.: Effects of ice particles shattering on the 2D-S probe, Atmos. Meas. Tech., 4, 1361–1381, https://doi.org/10.5194/amt-4-1361-2011, 2011. a, b, c
Lawson, R. P., O'Connor, D., Zmarzly, P., Weaver, K., Baker, B., Mo, Q., and Jonsson, H.: The 2D-S (Stereo) Probe: Design and Preliminary Tests of a New Airborne, High-Speed, High-Resolution Particle Imaging Probe, J. Atmos. Ocean. Tech., 23, 1462–1477, https://doi.org/10.1175/JTECH1927.1, 2006. a
Liou, K.: Influence of cirrus clouds on weather and climate processes: A global perspective, Mon. Weather Rev., 114, 1167–1199, https://doi.org/10.1175/1520-0493(1986)114<1167:IOCCOW>2.0.CO;2, 1986. a
Lohmann, U., Quaas, J., Kinne, S., and Feichter, J.: Different Approaches for Constraining Global Climate Models of the Anthropogenic Indirect Aerosol Effect, B. Am. Meteorol. Soc, 88, 243–249, https://doi.org/10.1175/BAMS-88-2-243, 2007. a
Luebke, A. E., Afchine, A., Costa, A., Grooß, J.-U., Meyer, J., Rolf, C., Spelten, N., Avallone, L. M., Baumgardner, D., and Krämer, M.: The origin of midlatitude ice clouds and the resulting influence on their microphysical properties, Atmos. Chem. Phys., 16, 5793–5809, https://doi.org/10.5194/acp-16-5793-2016, 2016. a, b, c, d
Mace, J., Jensen, E., McFarquhar, G., Comstock, J., Ackerman, T., Mitchell, D., Liu, X., and Garrett, T.: SPartICus: Small Particles In Cirrus science and operations plan, Tech. rep., ARM, available at: https://www.arm.gov/publications/programdocs/doe-sc-arm-10-003.pdf (last access: 2 October 2018), 2009. a
Massie, S. T., Delanoë, J., Bardeen, C. G., Jiang, J. H., and Huang, L.: Changes in the shape of cloud ice water content vertical structure due to aerosol variations, Atmos. Chem. Phys., 16, 6091–6105, https://doi.org/10.5194/acp-16-6091-2016, 2016. a
McFarquhar, G. M., Um, J., Freer, M., Baumgardner, D., Kok, G. L., and Mace, G.: Importance of small ice crystals to cirrus properties: Observations from the Tropical Warm Pool International Cloud Experiment (TWP-ICE), Geophys. Res. Lett., 34, L13803, https://doi.org/10.1029/2007GL029865, 2007. a, b
Mesinger, F., DiMego, G., Kalnay, E., Mitchell, K., Shafran, P. C., Ebisuzaki, W., Jović, D., Woollen, J., Rogers, E., Berbery, E. H., Ek, M. B., Fan, Y., Grumbine, R., Higgins, W., Li, H., Lin, Y., Manikin, G., Parrish, D., and Shi, W.: North American Regional Reanalysis, B. Am. Meteorol. Soc., 87, 343–360, https://doi.org/10.1175/BAMS-87-3-343, 2006. a
Meyer, J.: Ice Crystal Measurements with the New Particle Spectrometer NIXE-CAPS, PhD thesis, Schriften des Forschungszentrum Jülich, Reihe Energie und Umwelt, 2012. a, b
Mishra, S., Mitchell, D. L., Turner, D. D., and Lawson, R. P.: Parameterization of ice fall speeds in midlatitude cirrus: Results from SPartICus, J. Geophys. Res.-Atmos., 119, 3857–3876, https://doi.org/10.1002/2013JD020602, 2014. a
Mitchell, D., Mishra, S., and Lawson, P.: Cirrus Clouds and Climate Engineering: New Findings on Ice Nucleation and Theoretical Basis, in: Planet Earth 2011 – Global Warming Challenges and Opportunities for Policy and Practice, edited by: Carayannis, E., InTech, https://doi.org/10.5772/24664, 2011. a, b
Mitchell, D. L.: Evolution of Snow-Size Spectra in Cyclonic Storms. Part II: Deviations from the Exponential Form, J. Atmos. Sci., 48, 1885–1899, https://doi.org/10.1175/1520-0469(1991)048<1885:EOSSSI>2.0.CO;2, 1991. a
Mitchell, D. L.: Use of Mass- and Area-Dimensional Power Laws for Determining Precipitation Particle Terminal Velocities, J. Atmos. Sci., 53, 1710–1723, https://doi.org/10.1175/1520-0469(1996)053<1710:UOMAAD>2.0.CO;2, 1996. a
Mitchell, D. L., d'Entremont, R. P., and Lawson, R. P.: Inferring Cirrus Size Distributions through Satellite Remote Sensing and Microphysical Databases, J. Atmos. Sci., 67, 1106–1125, https://doi.org/10.1175/2009JAS3150.1, 2010. a, b
Mitchell, D. L., Garnier, A., Avery, M., and Erfani, E.: CALIPSO observations of the dependence of homo- and heterogeneous ice nucleation in cirrus clouds on latitude, season and surface condition, Atmos. Chem. Phys. Discuss., https://doi.org/10.5194/acp-2016-1062, 2016. a, b
Mitchell, D. L., Garnier, A., Pelon, J., and Erfani, E.: CALIPSO (IIR-CALIOP) Retrievals of Cirrus Cloud Ice Particle Concentrations, Atmos. Chem. Phys. Discuss., https://doi.org/10.5194/acp-2018-526, in review, 2018. a, b
Nakajima, T. and King, M. D.: Determination of the Optical Thickness and Effective Particle Radius of Clouds from Reflected Solar Radiation Measurements. Part I: Theory, J. Atmos. Sci., 47, 1878–1893, https://doi.org/10.1175/1520-0469(1991)048<0728:DOTOTA>2.0.CO;2, 1990. a
Osborne, S. R., Abel, S. J., Boutle, I. A., and Marenco, F.: Evolution of Stratocumulus Over Land: Comparison of Ground and Aircraft Observations with Numerical Weather Prediction Simulations, Bound.-Lay. Meteorol., 153, 165–193, https://doi.org/10.1007/s10546-014-9944-0, 2014. a
Painemal, D. and Zuidema, P.: Assessment of MODIS cloud effective radius and optical thickness retrievals over the Southeast Pacific with VOCALS-REX in situ measurements, J. Geophys. Res.-Atmos., 116, D24206, https://doi.org/10.1029/2011JD016155, 2011. a
Paukert, M., Hoose, C., and Simmel, M.: Redistribution of ice nuclei between cloud and rain droplets: Parameterization and application to deep convective clouds, J. Adv. Model. Earth Sy., 9, 514–535, https://doi.org/10.1002/2016MS000841, 2017. a, b
Protat, A., Delanoë, J., O'Connor, E. J., and L'Ecuyer, T. S.: The Evaluation of CloudSat and CALIPSO Ice Microphysical Products Using Ground-Based Cloud Radar and Lidar Observations, J. Atmos. Ocean. Tech., 27, 793–810, https://doi.org/10.1175/2009JTECHA1397.1, 2010. a, b
Protat, A., Young, S. A., McFarlane, S. A., L'Ecuyer, T., Mace, G. G., Comstock, J. M., Long, C. N., Berry, E., and Delanoë, J.: Reconciling Ground-Based and Space-Based Estimates of the Frequency of Occurrence and Radiative Effect of Clouds around Darwin, Australia, J. Appl. Meteorol. Clim., 53, 456–478, https://doi.org/10.1175/JAMC-D-13-072.1, 2014. a
Quaas, J., Boucher, O., and Lohmann, U.: Constraining the total aerosol indirect effect in the LMDZ and ECHAM4 GCMs using MODIS satellite data, Atmos. Chem. Phys., 6, 947–955, https://doi.org/10.5194/acp-6-947-2006, 2006. a
Quaas, J., Boucher, O., Bellouin, N., and Kinne, S.: Satellite-based estimate of the direct and indirect aerosol climate forcing, J. Geophys. Res.-Atmos., 113, D05204, https://doi.org/10.1029/2007JD008962, 2008. a, b
Schmid, B., Tomlinson, J. M., Hubbe, J. M., Comstock, J. M., Mei, F., Chand, D., Pekour, M. S., Kluzek, C. D., Andrews, E., Biraud, S. C., and McFarquhar, G. M.: The DOE ARM Aerial Facility, B. Am. Meteorol. Soc., 95, 723–742, https://doi.org/10.1175/BAMS-D-13-00040.1, 2013. a
Seifert, A. and Beheng, K. D.: A two-moment cloud microphysics parameterization for mixed-phase clouds. Part 1: Model description, Meteorol. Atmos. Phys., 92, 45–66, https://doi.org/10.1007/s00703-005-0112-4, 2006. a
Sourdeval, O., -Labonnote, L. C., Brogniez, G., Jourdan, O., Pelon, J., and Garnier, A.: A variational approach for retrieving ice cloud properties from infrared measurements: application in the context of two IIR validation campaigns, Atmos. Chem. Phys., 13, 8229–8244, https://doi.org/10.5194/acp-13-8229-2013, 2013. a
Sourdeval, O., C. Labonnote, L., Baran, A. J., and Brogniez, G.: A methodology for simultaneous retrieval of ice and liquid water cloud properties. Part I: Information content and case study, Q. J. Roy. Meteor. Soc., 141, 870–882, https://doi.org/10.1002/qj.2405, 2015. a
Sourdeval, O., C. Labonnote, L., Baran, A. J., Mülmenstädt, J., and Brogniez, G.: A methodology for simultaneous retrieval of ice and liquid water cloud properties. Part 2: Near-global retrievals and evaluation against A-Train products, Q. J. Roy. Meteor. Soc., 142, 3063–3081, https://doi.org/10.1002/qj.2889, 2016. a
Sourdeval, O., Gryspeerdt, E., Krämer, M., Goren, T., Delanoë, J., Afchine, A., Hemmer, F., and Quaas, J.: Ice crystal number concentration from satellite lidar-radar observations (DARDAR-Nice) [Data set], AERIS, https://doi.org/10.25326/09, 2018.
Stein, A. F., Draxler, R. R., Rolph, G. D., Stunder, B. J. B., Cohen, M. D., and Ngan, F.: NOAA's HYSPLIT Atmospheric Transport and Dispersion Modeling System, B. Am. Meteorol. Soc., 96, 2059–2077, https://doi.org/10.1175/BAMS-D-14-00110.1, 2015. a
Stephens, G. L.: Cloud Feedbacks in the Climate System: A Critical Review, J. Climate, 18, 237–273, https://doi.org/10.1175/JCLI-3243.1, 2005. a
Stephens, G. L., Tsay, S.-C., Stackhouse, P. W., and Flatau, P. J.: The Relevance of the Microphysical and Radiative Properties of Cirrus Clouds to Climate and Climatic Feedback, J. Atmos. Sci., 47, 1742–1754, 1990. a
Stephens, G. L., Vane, D. G., Boain, R. J., Mace, G. G., Sassen, K., Wang, Z., Illingworth, A. J., O'Connor, E. J., Rossow, W. B., Durden, S. L., Miller, S. D., Austin, R. T., Benedetti, A., Mitrescu, C., and CloudSat Science Team, T.: The CLOUDSAT Mission and the A-Train, B. Am. Meteorol. Soc., 83, 1771–1790, https://doi.org/10.1175/BAMS-83-12-1771, 2002. a
Thornberry, T. D., Rollins, A. W., Avery, M. A., Woods, S., Lawson, R. P., Bui, T. V., and Gao, R.-S.: Ice water content-extinction relationships and effective diameter for TTL cirrus derived from in situ measurements during ATTREX 2014, J. Geophys. Res.-Atmos., 122, 4494–4507, https://doi.org/10.1002/2016JD025948, 2017. a
Vaughan, M., Powell, K., Kuehn, R., Young, S., Winker, D., Hostetler, C., Hunt, W., Liu, Z., McGill, M., and Getzewich, B.: Fully Automated Detection of Cloud and Aerosol Layers in the CALIPSO Lidar Measurements, J. Atmos. Ocean. Tech., 26, 2034–2050, https://doi.org/10.1175/2009JTECHA1228.1, 2009. a
Voigt, C., Schumann, U., Minikin, A., Abdelmonem, A., Afchine, A., Borrmann, S., Boettcher, M., Buchholz, B., Bugliaro, L., Costa, A., Curtius, J., Dollner, M., Dörnbrack, A., Dreiling, V., Ebert, V., Ehrlich, A., Fix, A., Forster, L., Frank, F., Fütterer, D., Giez, A., Graf, K., Grooß, J.-U., Groß, S., Heimerl, K., Heinold, B., Hüneke, T., Järvinen, E., Jurkat, T., Kaufmann, S., Kenntner, M., Klingebiel, M., Klimach, T., Kohl, R., Krämer, M., Krisna, T. C., Luebke, A., Mayer, B., Mertes, S., Molleker, S., Petzold, A., Pfeilsticker, K., Port, M., Rapp, M., Reutter, P., Rolf, C., Rose, D., Sauer, D., Schäfler, A., Schlage, R., Schnaiter, M., Schneider, J., Spelten, N., Spichtinger, P., Stock, P., Walser, A., Weigel, R., Weinzierl, B., Wendisch, M., Werner, F., Wernli, H., Wirth, M., Zahn, A., Ziereis, H., and Zöger, M.: ML-CIRRUS: The Airborne Experiment on Natural Cirrus and Contrail Cirrus with the High-Altitude Long-Range Research Aircraft HALO, B. Am. Meteorol. Soc., 98, 271–288, https://doi.org/10.1175/BAMS-D-15-00213.1, 2016. a
Waliser, D. E., Li, J.-L. F., Woods, C. P., Austin, R. T., Bacmeister, J., Chern, J., Del Genio, A., Jiang, J. H., Kuang, Z., Meng, H., Minnis, P., Platnick, S., Rossow, W. B., Stephens, G. L., Sun-Mack, S., Tao, W.-K., Tompkins, A. M., Vane, D. G., Walker, C., and Wu, D.: Cloud ice: A climate model challenge with signs and expectations of progress, J. Geophys. Res., 114, D00A21, https://doi.org/10.1029/2008JD010015, 2009. a
Wendisch, M., Pöschl, U., Andreae, M. O., Machado, L. A. T., Albrecht, R., Schlager, H., Rosenfeld, D., Martin, S. T., Abdelmonem, A., Afchine, A., Araùjo, A. C., Artaxo, P., Aufmhoff, H., Barbosa, H. M. J., Borrmann, S., Braga, R., Buchholz, B., Cecchini, M. A., Costa, A., Curtius, J., Dollner, M., Dorf, M., Dreiling, V., Ebert, V., Ehrlich, A., Ewald, F., Fisch, G., Fix, A., Frank, F., Fütterer, D., Heckl, C., Heidelberg, F., Hüneke, T., Jäkel, E., Järvinen, E., Jurkat, T., Kanter, S., Kästner, U., Kenntner, M., Kesselmeier, J., Klimach, T., Knecht, M., Kohl, R., Kölling, T., Krämer, M., Krüger, M., Krisna, T. C., Lavric, J. V., Longo, K., Mahnke, C., Manzi, A. O., Mayer, B., Mertes, S., Minikin, A., Molleker, S., Münch, S., Nillius, B., Pfeilsticker, K., Pöhlker, C., Roiger, A., Rose, D., Rosenow, D., Sauer, D., Schnaiter, M., Schneider, J., Schulz, C., de Souza, R. A. F., Spanu, A., Stock, P., Vila, D., Voigt, C., Walser, A., Walter, D., Weigel, R., Weinzierl, B., Werner, F., Yamasoe, M. A., Ziereis, H., Zinner, T., and Zöger, M.: ACRIDICON–CHUVA Campaign: Studying Tropical Deep Convective Clouds and Precipitation over Amazonia Using the New German Research Aircraft HALO, B. Am. Meteorol. Soc., 97, 1885–1908, https://doi.org/10.1175/BAMS-D-14-00255.1, 2016. a
Wu, D. L., Austin, R. T., Deng, M., Durden, S. L., Heymsfield, A. J., Jiang, J. H., Lambert, A., Li, J.-L., Livesey, N. J., McFarquhar, G. M., Pittman, J. V., Stephens, G. L., Tanelli, S., Vane, D. G., and Waliser, D. E.: Comparisons of global cloud ice from MLS, CloudSat, and correlative data sets, J. Geophys. Res.-Atmos., 114, D00A24, https://doi.org/10.1029/2008JD009946, 2009. a
Zhang, K., Liu, X., Wang, M., Comstock, J. M., Mitchell, D. L., Mishra, S., and Mace, G. G.: Evaluating and constraining ice cloud parameterizations in CAM5 using aircraft measurements from the SPARTICUS campaign, Atmos. Chem. Phys., 13, 4963–4982, https://doi.org/10.5194/acp-13-4963-2013, 2013. a
Zhang, Y., Macke, A., and Albers, F.: Effect of crystal size spectrum and crystal shape on stratiform cirrus radiative forcing, Atmos. Res., 52, 59–75, 1999. a