the Creative Commons Attribution 4.0 License.
the Creative Commons Attribution 4.0 License.
 | 11 Sep 2018
Response of stratospheric water vapor and ozone to the unusual timing of El Niño and the QBO disruption in 2015–2016
Martin Riese
Thomas Birner
Paul Konopka
Rolf Müller
Michaela I. Hegglin
Michelle L. Santee
Mark Baldwin
Bernard Legras
Felix Ploeger
The stratospheric circulation determines the transport and lifetime of key trace gases in a changing climate, including water vapor and ozone, which radiatively impact surface climate. The unusually warm El Niño–Southern Oscillation (ENSO) event aligned with a disrupted Quasi-Biennial Oscillation (QBO) caused an unprecedented perturbation to this circulation in 2015–2016. Here, we quantify the impact of the alignment of these two phenomena in 2015–2016 on lower stratospheric water vapor and ozone from satellite observations. We show that the warm ENSO event substantially increased water vapor and decreased ozone in the tropical lower stratosphere. The QBO disruption significantly decreased global lower stratospheric water vapor and tropical ozone from early spring to late autumn. Thus, this QBO disruption reversed the lower stratosphere moistening triggered by the alignment of the warm ENSO event with westerly QBO in early boreal winter. Our results suggest that the interplay of ENSO events and QBO phases will be crucial for the distributions of radiatively active trace gases in a changing future climate, when increasing El Niño-like conditions and a decreasing lower stratospheric QBO amplitude are expected.
- Article
(6495 KB) - Full-text XML
- BibTeX
- EndNote


The lower stratosphere (10–25 km) is a key region in a changing climate. Transport, mixing and chemistry in this region regulate the amount of key greenhouse gases, such as water vapor and ozone, which radiatively impact temperatures both locally (e.g., Forster and Shine, 2002) and globally (e.g., Forster and Shine, 1999; Solomon et al., 2010; Riese et al., 2012; Dessler et al., 2013). Ozone is mainly produced in the stratosphere (10–50 km) and is directly regulated in the tropical lower stratosphere by the upwelling strength of the stratospheric circulation (Randel et al., 2007; Abalos et al., 2013). Conversely, water vapor mainly originates from the troposphere and its stratospheric concentration is controlled by the tropical cold point tropopause temperatures (Holton and Gettelman, 2001; Hu et al., 2016) and production from methane oxidation (le Texier et al., 1988; Dessler et al., 1994). The amount of stratospheric water vapor is thereby modulated by the coldest temperatures experienced by air parcels ascending through the tropical tropopause layer (TTL) (e.g., between 14 and 19 km; Fueglistaler et al., 2009; Fueglistaler, 2012; Schoeberl and Dessler, 2011). The dehydration in the air parcels crossing through the TTL plays an important role in the control of the lower stratospheric moisture. Stratospheric water vapor is the primary source of stratospheric hydrogen oxide radicals, which drive important gas-phase ozone loss cycles, and it also strongly influences heterogeneous chemistry on cold sulfate aerosol and the formation of polar stratospheric clouds, which promote chlorine activation and polar ozone loss (e.g., Solomon et al., 1986; Manney et al., 1994; Crutzen et al., 1995; Müller et al., 1997; Solomon, 1999; Kirk-Davidoff et al., 1999; Dvortsov and Solomon, 2001; Drdla and Müller, 2012).
Water vapor and ozone abundances in the tropical lower stratosphere show multi-timescale variations ranging from daily to decadal (e.g., Randel et al., 2004; Fueglistaler and Haynes, 2005; Fujiwara et al., 2010; Hegglin et al., 2014) dominated by temperature variations and the tropical upwelling strength, respectively (e.g., Randel et al., 2007, 2010; Rosenlof and Reid, 2008; Fueglistaler et al., 2013; Randel and Jensen, 2013). These temperature fluctuations are driven by the varying strength of the stratospheric circulation. Beyond the annual cycle (tape recorder; Mote et al., 1996; Glanville and Birner, 2017), one key driver of the interannual variability in water vapor is the interaction between the El Niño–Southern Oscillation (ENSO) and the Quasi-Biennial Oscillation (QBO) (Garfinkel and Hartmann, 2007; Taguchi, 2010), which, in turn, modulates the stratospheric circulation.
The stratospheric mean meridional circulation is the Brewer–Dobson circulation (BD-circulation; e.g., Brewer, 1949; Butchart, 2014), defined as a slow circulation in which air parcels rising in the tropics drift poleward into the stratosphere and are transported downward in the high-latitude regions via its shallow and deep branches (Birner and Bönisch, 2011; Bönisch et al., 2011). Driven by wave breaking in the stratosphere (Haynes et al., 1991; Rosenlof and Holton, 1993; Newman and Nash, 2000; Plumb, 2002), the BD-circulation varies on subseasonal to decadal timescales.
The QBO is a major mode of variability in the tropical upwelling of the BD-circulation (Lindzen and Holton, 1968; Plumb and Bell, 1982). The QBO is composed of alternating westerly and easterly zonal wind shears, descending in the tropical stratosphere with a period of ∼28 months. Mostly driven by equatorially trapped waves (Wallace et al., 1993; Baldwin et al., 2001; Ern and Preusse, 2009; Ern et al., 2014), the QBO triggers a modulation of vertical and meridional transport in the stratosphere by affecting temperature and heating rates (Niwano et al., 2003; Punge et al., 2009). The easterly shear is associated with enhanced tropical upwelling and anomalously cold tropopause temperatures. As the easterly shear reaches the tropopause, it therefore causes low anomalies of tropical lower stratospheric water vapor and ozone. Conversely, the westerly shear reduces the tropical upward motion, but also enhances the horizontal transport and mixing of stratospheric trace gases and aerosols poleward (Plumb and Bell, 1982; Trepte and Hitchman, 1992). The tropical upwelling is anticorrelated with the tropical temperature above the tropopause and its strength modulates stratospheric ozone by advecting tropospheric air generally poor in ozone into the stratosphere (Randel et al., 2006). The strength of the tropical upwelling also determines water vapor entry values by modulating TTL temperatures (Yulaeva et al., 1994; Flury et al., 2013).
Another major mode of climate variability that affects the variability of the BD-circulation is the ENSO. ENSO is a coupled atmosphere–ocean phenomenon covering the equatorial Pacific Ocean with drastic changes in regional sea surface temperatures (SSTs), impacting surface weather and climate (e.g., Bjerknes, 1969; Cagnazzo and Manzini, 2009; Wang et al., 2016). ENSO alternates between anomalously warm (El Niño) and cold (La Niña) conditions in the tropical Pacific Ocean at intervals of 2–8 years (Philander, 1990; Baldwin and O'Sullivan, 1995). In addition to warming the troposphere, El Niño events cool the tropical lower stratosphere and strengthen the tropical upwelling of the BD-circulation, decreasing ozone in the tropical lower stratosphere (Randel et al., 2009). From a zonal mean perspective, El Niño events induce tropospheric warming and stratospheric cooling with a node near the tropopause (Randel et al., 2009; Mitchell et al., 2015). Stratospheric water vapor, however, is predominantly controlled by cold point temperatures over the tropical western Pacific (Hu et al., 2016). El Niño events are associated with warmer cold point temperatures over this region, thereby causing increased lower stratospheric water vapor. In addition, based on chemistry climate simulations, these regional variations in temperatures and water vapor have been shown to exhibit a nonlinear response to ENSO in the Western Indo-Pacific (Garfinkel et al., 2018). In contrast, La Niña events induce an opposite effect (e.g., Calvo et al., 2010; Konopka et al., 2016).
Climate models predict that increasing greenhouse gas levels will speed up the mean tropical upwelling of the BD-circulation in the future (McLandress and Shepherd, 2009; Garny et al., 2011; Lin and Fu, 2013; Butchart, 2014; Hardiman et al., 2014). A previous study finds a long-term decrease in the QBO amplitude in the lowermost stratosphere associated with this strengthening tropical upwelling (Saravanan, 1990), consistent with projections of global climate models (Kawatani et al., 2011; Kawatani and Hamilton, 2013). Future projections of climate models also predict a shift of the basic state toward more frequent El Niño conditions in a warming climate (Timmermann et al., 1999; van Oldenborgh et al., 2005; Latif and Keenlyside, 2009; Cai et al., 2014). In this context, it is of particular importance to better understand the impact of the interplay between ENSO and QBO on changes in stratospheric water vapor and ozone (Solomon et al., 2010; Riese et al., 2012), which directly impact the global radiative forcing of climate (Forster and Shine, 1999; Butchart and Scaife, 2001).
Recently, a previously unobserved timing of this interplay between ENSO and QBO occurred. During the boreal winter 2015–2016, a strong El Niño event (among the three strongest El Niño events on record; Huang et al., 2016) was aligned with a westerly QBO phase. This westerly QBO phase was abruptly disrupted well before completion by an easterly phase in January 2016 (Osprey et al., 2016; Newman et al., 2016). The interplay of both circulation anomalies caused large changes in trace gas transport, the climate implications of which are currently a topic of debate. Based on modern reanalyses and satellite observations, including Aura Microwave Limb Sounder (MLS) water vapor mixing ratios, Avery et al. (2017) argued that the most recent El Niño event significantly moistened the lower stratosphere (±0.9 ppmv) during boreal winter 2015–2016 due to particularly warm tropopause temperature anomalies in the tropical western Pacific. Using a simple linear regression of MLS water vapor mixing ratios at 82 hPa with a QBO index at 70 hPa, Avery et al. (2017) concluded that the contribution of the QBO disruption was small (up to 0.1 ppmv) at 82 hPa, even though the study mainly focused on ENSO, particularly the role of tropical convective cloud ice in stratospheric hydration. In contrast, Tweedy et al. (2017) mainly focused on QBO disruption impact and attributed changes in the global stratospheric water vapor content from spring to autumn to the QBO disruption during the 2015–2016 winter. However, Tweedy et al. (2017) also acknowledged that the strong El Niño event could have strongly influenced their correlation (composite) analyses based on MLS satellite and radiosonde observations. Disentangling the effects of ENSO and QBO on this anomalous trace gas variability and identifying the dominant driver of recent lower stratospheric water vapor changes during 2015–2016 is a challenging task. A detailed explanation of the reasons for this lower stratospheric water vapor variability in 2015–2016 is still lacking.
Here, we quantify the impact of the interaction between the most recent El Niño event and the QBO disruption on lower stratospheric ozone and water vapor from spaceborne measurements during the 2015–2016 period. We describe the satellite observational data record and multiple regressions in Sect. 3. Section 4 describes the anomalous stratospheric circulation in boreal winter of 2015–2016 and Sect. 5 shows evidence for the impact of the El Niño event and QBO disruption on stratospheric ozone and water vapor. Finally, we discuss our results in the context of the puzzling water vapor response to the interaction of these two phenomena.
The data analyzed here are monthly mean ozone (O3) and water vapor (H2O) mixing ratios in the lower stratosphere from the Aura Microwave Limb Sounder satellite observations covering the period 2005–2016 (Livesey et al., 2017). The MLS instrument, flying aboard the EOS Aura satellite, is designed to measure a wide range of physical and chemical quantities, including O3 and H2O (Waters et al., 2006). The version 4.2 MLS data were produced with improved retrieval algorithms, which substantially reduced the occurrence of unrealistically small O3 values at 215 hPa in the tropics observed in the previous version 2.2 MLS product (Livesey et al., 2008). Note that the version 4.2 MLS data used here are not significantly different from the previous version MLS observations at pressures less than 100 hPa, but show less oscillatory behavior and fewer retrieval artifacts induced by cloud contamination in the tropical upper troposphere and lower stratosphere (UTLS). The vertical resolution, precision, systematic uncertainty and lowest recommended vertical range of the relevant v4.2 data are, respectively, 2.5–3 km, ±10–40 %, ±10–25 % and 316 hPa for H2O and 3–3.5 km, ±0.02–0.04 ppmv, ±0.02–0.05 ppmv + ±5–10 % and 261 hPa for O3 for individual profile measurements with a spatial representativeness of ∼200–300 km along the orbital-track line of sight (Schwartz et al., 2013; Livesey et al., 2017; Santee et al., 2017). The regression results will not be affected by these intrinsic uncertainties since they apply to the H2O and O3 mixing ratios and not the anomalies. In addition, Hegglin et al. (2013) show that MLS zonal monthly mean H2O show very good to excellent agreement with the multi-instrument mean (MIM) in comparison between 13 instruments, throughout most of the atmosphere (including the UTLS) with mean deviations from the MIM between +2.5 % and +5 %, making these random errors irrelevant for the averaged monthly zonal mean H2O anomalies used in this study. Additional detailed information on the quality of O3 and H2O in the upper troposphere–stratosphere in previous versions can be found in dedicated validation papers (Read et al., 2007; Lambert et al., 2007; Livesey et al., 2008; Froidevaux et al., 2008).
As an illustration of the robustness of the regression results, MLS water vapor is compared in Sect. 6 to simulated H2O from the Chemical Lagrangian Model of the Stratosphere (CLaMS; McKenna et al., 2002; Konopka et al., 2004). Lagrangian transport in CLaMS is based on 3-D backward trajectories and a parameterization of small-scale mixing, which relates mixing to deformations in the large-scale flow. The model uses an isentropic vertical coordinate, with vertical transport driven by the total diabatic heating rate (Ploeger et al., 2010). The model simulations considered for this paper are driven by temperatures, horizontal winds and diabatic heating rates from the European Centre for Medium-Range Weather Forecasts (ECMWF) ERA-Interim reanalysis (Dee et al., 2011). For the wind and temperature fields, CLaMS uses the native ERA-Interim vertical resolution, and therefore has higher vertical resolution than MLS. The mean vertical resolution of air parcels in CLaMS Lagrangian model is about 400 m near the tropopause. Stratospheric water vapor in CLaMS is calculated based on a simplified dehydration scheme, which is based on freezing at 100 % saturation and a parameterized ice particle fallout (e.g., Poshyvailo et al., 2018), and additional chemical production in the middle stratosphere due to methane oxidation. For further details about the model set-up used here see Pommrich et al. (2014). Based on modern reanalysis intercomparisons, Long et al. (2017) show that the ERA-Interim temperatures compare favorably to other reanalyses throughout most of the atmosphere, including the TTL region. The assimilation of the Global Positioning System radio occultation data since December 2006 have reduced the ERA-Interim cold temperature bias compared with radiosondes in the tropopause layer and the lower stratosphere (Poli et al., 2010). ERA-Interim tropical tropopause temperatures have also been shown to compare very well against in situ observations over the eastern tropical Pacific (Ueyama et al., 2014). Based on a comparison of ERA-Interim tropopause temperature with in situ balloon observations, Podglajen et al. (2014) found fairly good agreement with a weak positive bias of 0.6 K and a standard deviation of 1.8 K in the TTL. Schoeberl et al. (2012) show that even small temperature differences between reanalyses and observations can still induce differences in the associated H2O saturation mixing ratio using a trajectory model driven by ERA-Interim. However, the CLaMS dehydration scheme has been shown to provide lower stratospheric H2O anomalies in good agreement with current satellite observations, including the MLS product, giving good confidence in the CLaMS H2O reconstruction from the large-scale perspective (e.g., Ploeger et al., 2013; Tao et al., 2015; Lossow et al., 2018). In addition, biases, which do not have ENSO or QBO signals, affect the absolute H2O values but not the anomaly time series (Hegglin et al., 2013).
To disentangle the ENSO and QBO impact on these stratospheric trace gases from the other sources of natural variability, the 2005–2016 monthly zonal mean O3 and H2O mixing ratios from MLS observations are analyzed as a function of latitude (ϕ) and altitude (z) using a multiple regression model. This regression method is an established method and appropriate to disentangle the relative influences of the considered climate indices on stratospheric trace gas variability, as it includes time lag coefficients for both QBO and ENSO. For more details about the method and its further applications see Diallo et al. (2012, 2017). The regression method decomposes the temporal evolution of the monthly zonal mean trace gas mixing ratio, χ, in terms of a long-term linear trend, seasonal cycle, QBO, ENSO, aerosol optical depth (AOD; Vernier et al., 2011) and a residual. The model yields for a given trace gas, χ (herein O3 and H2O) are
where Pk represents the predictors or proxies. P1 is a normalized QBO index (QBOi) from CDAS/Reanalysis zonally averaged winds at 50 hPa, P2 is the normalized Multivariate ENSO Index (MEI; Wolter and Timlin, 2011) and P3 is the AOD from satellite data (Vernier et al., 2011). The coefficients are a linear trend a, the annual cycle , the amplitude b1 and the lag τ1(ϕ,z) associated with the QBO; the amplitude b2 and the lag τ2(ϕ,z) associated with ENSO and the amplitude b3 and the lag τ3(ϕ,z) associated with AOD. The constraint applied to determine the parameters a, b1, b2, b3, τ1(ϕ,z), τ2(ϕ,z), τ3(ϕ,z) and C is to minimize the residual in the least squares sense. Because of the presence of lags in the QBO, ENSO and AOD terms in Eq. (1), the problem is nonlinear and the residual may have multiple minima as a function of the parameters. In order to determine the optimal values of τ1(ϕ,z), τ2(ϕ,z) and τ3(ϕ,z), the residual is first minimized at fixed lag and then selected from a range of possible lags. This is done in sequence for QBO, ENSO and AOD. Here we neglect solar forcing, because our data set covers only one solar period. Uncertainty estimates for the statistical fits are calculated using a Student's t test technique (Zwiers and von Storch, 1995; Bence, 1995; von Storch and Zwiers, 1999).
Almost simultaneously with the exceptionally strong El Niño peaking in boreal winter of 2015–2016 (Huang et al., 2016), the fairly regular QBO cycle was disrupted by an unexpected shift from westerly (positive QBOi) to easterly (negative QBOi) winds. In January 2016, an easterly phase developed in the center of the westerly phase, breaking the regular cycle of easterly–westerly phase (Osprey et al., 2016; Newman et al., 2016). The QBO disruption was attributed to planetary Rossby waves propagating from the Northern Hemisphere to the Southern Hemisphere in the winter stratosphere (Osprey et al., 2016; Coy et al., 2017; Hitchcock et al., 2018), potentially triggered by the strong El Niño event (Schirber, 2015; Dunkerton, 2016; Christiansen et al., 2016; Barton and McCormack, 2017). Both the most recent El Niño event and the QBO disruption are expected to impact the tropical upwelling, via wave–mean-flow interaction (Holton, 1979; Dunkerton, 1980; Grimshaw, 1984) and control of the cold point temperatures (Kim and Son, 2012; Kim and Alexander, 2015). Therefore, these two phenomena affect the transport and distribution of stratospheric trace gases most effectively when they peak in boreal winter 2015–2016 and mid-April, respectively (Avery et al., 2017; Tweedy et al., 2017).
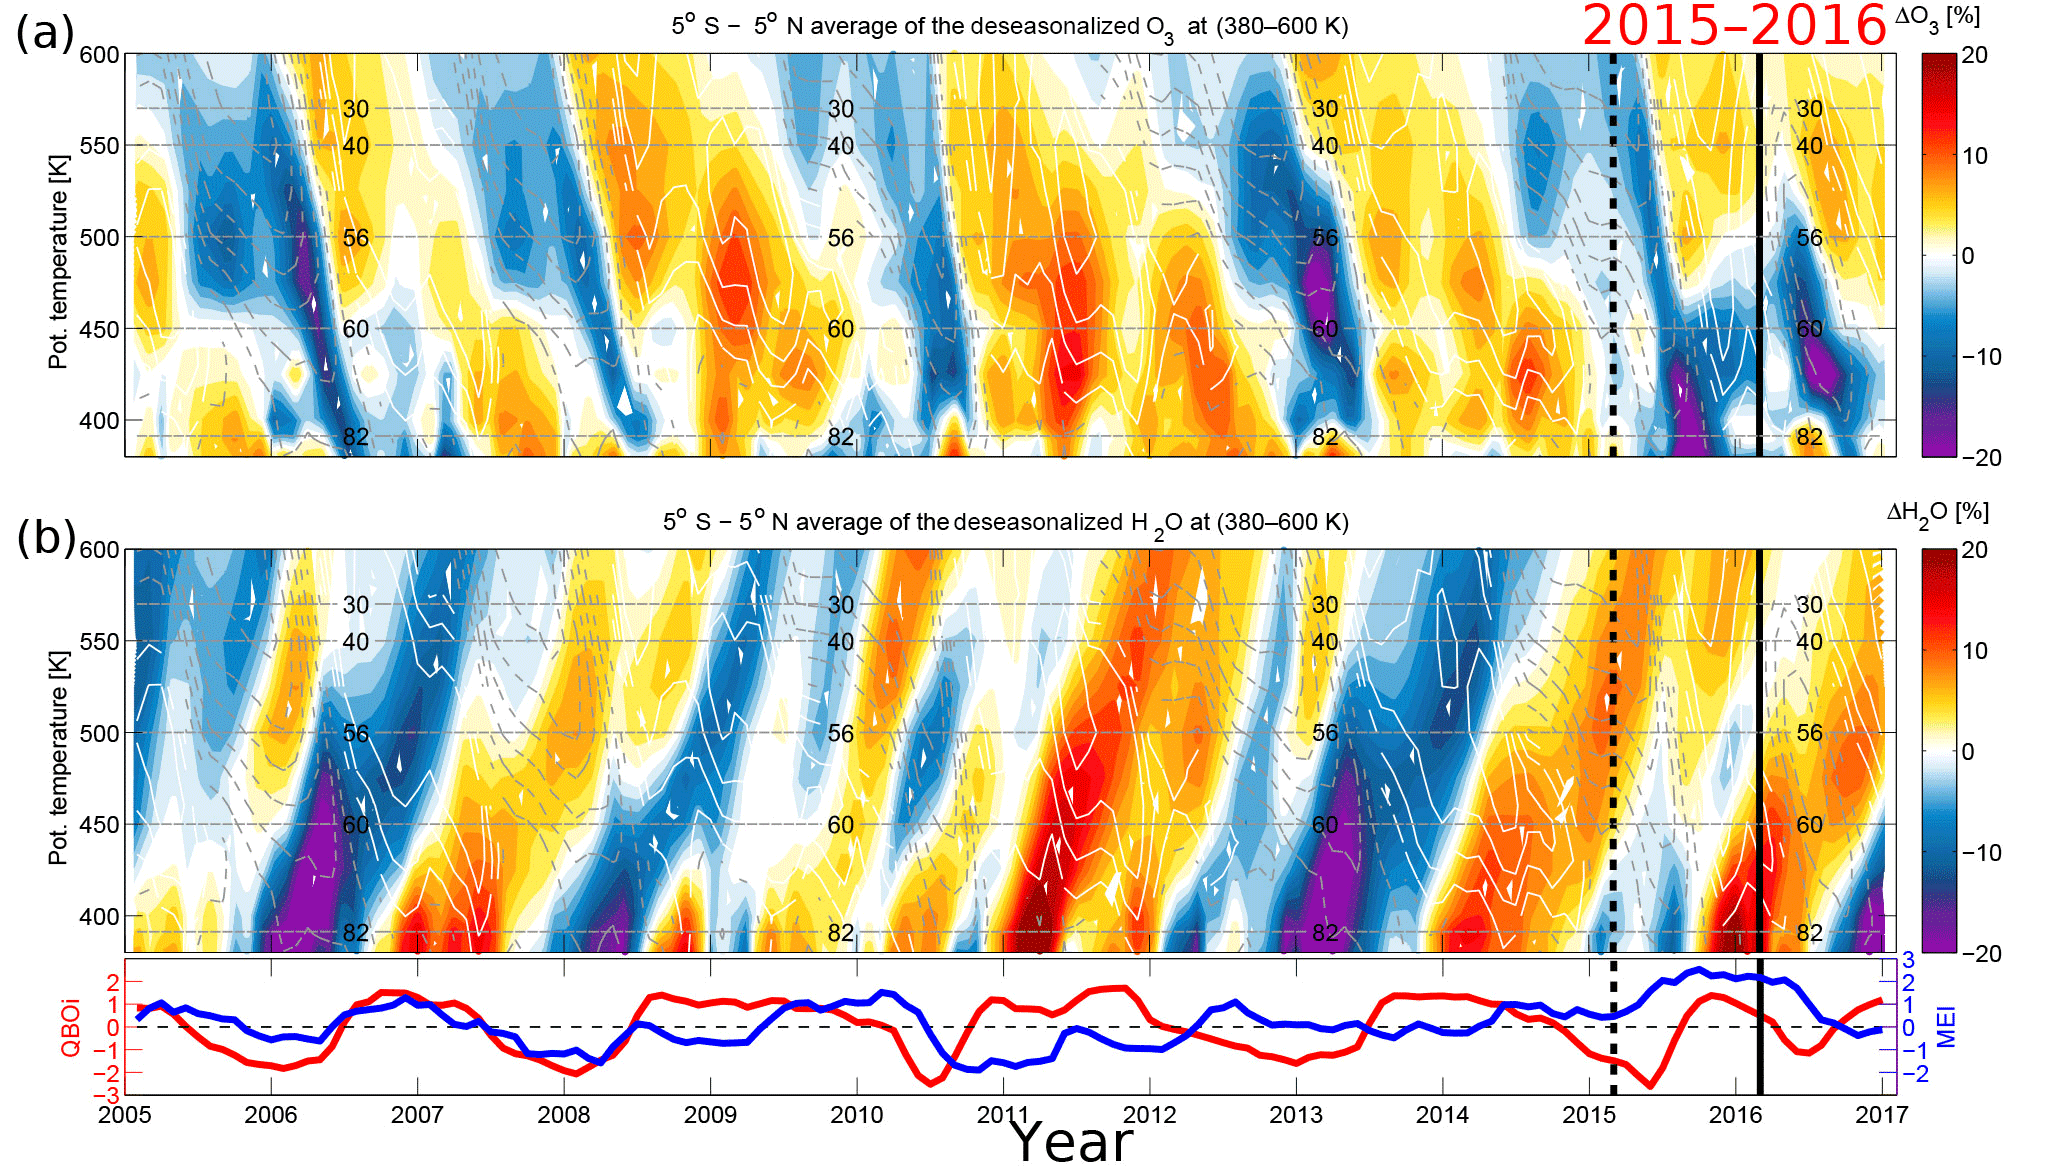
Figure 1Deseasonalized tropical stratospheric O3 and H2O time series from MLS satellite observations for the 2005–2016 period in percent change from long-term monthly means as a function of time and potential temperature. (a) Deseasonalized monthly mean O3. (b) Deseasonalized monthly mean H2O. Vertical black dashed line indicates February 2015 for the warm ENSO onset. The vertical black solid line indicates February 2016 for the QBO shift onset. Horizontal gray dashed lines indicate the pressure levels. The lowermost panel shows the QBO index at 50 hPa in red and the MEI index in blue. Monthly averaged zonal mean zonal wind component, u (m s−1), from ERA-Interim, is overlaid as solid white (westerly) and dashed gray (easterly) lines.
Figure 1a, b show the interannual variability in the deseasonalized O3 (a) and H2O (b) in the tropical lower stratosphere as a percentage change relative to the monthly mean mixing ratio during the 2005–2016 period. Particularly, during the 2015–2016 period, the deseasonalized O3 shows negative anomalies in the lower stratosphere (380–550 K) as expected due to the enhanced tropical upwelling caused by both the extreme El Niño event and the QBO disruption (e.g., easterly wind shear at 100–40 hPa). In contrast, the H2O variability (tape recorder) is more challenging to interpret because of its regulation by the tropical cold point tropopause temperatures. The complexity in H2O variability lies in its dependency on ENSO, on the QBO phases (Liess and Geller, 2012), seasons (early or late in the winter) and location (central or eastern Pacific, where the ENSO maximum occurs; Garfinkel et al., 2013). Therefore, to elucidate the ENSO and QBO impact on the stratospheric O3 and H2O anomalies, the multiple regression is performed both without and with explicitly including ENSO and QBO signals to isolate the impact of the ENSO and QBO on these trace gases, respectively. The difference between the residual (ϵ in Eq. 1) with and without explicit inclusion of the ENSO and QBO signals gives the ENSO- and QBO-induced impact on stratospheric O3 and H2O anomalies. This approach of differencing the residuals is similar to direct calculations, projecting the regression fits onto the ENSO and QBO basis functions, i.e., the ENSO and QBO predictor time series (see supplement Figs. 2 and 4 in Diallo et al., 2017). In addition, this differencing approach avoids the need to reconstruct the time series after the regression analysis.
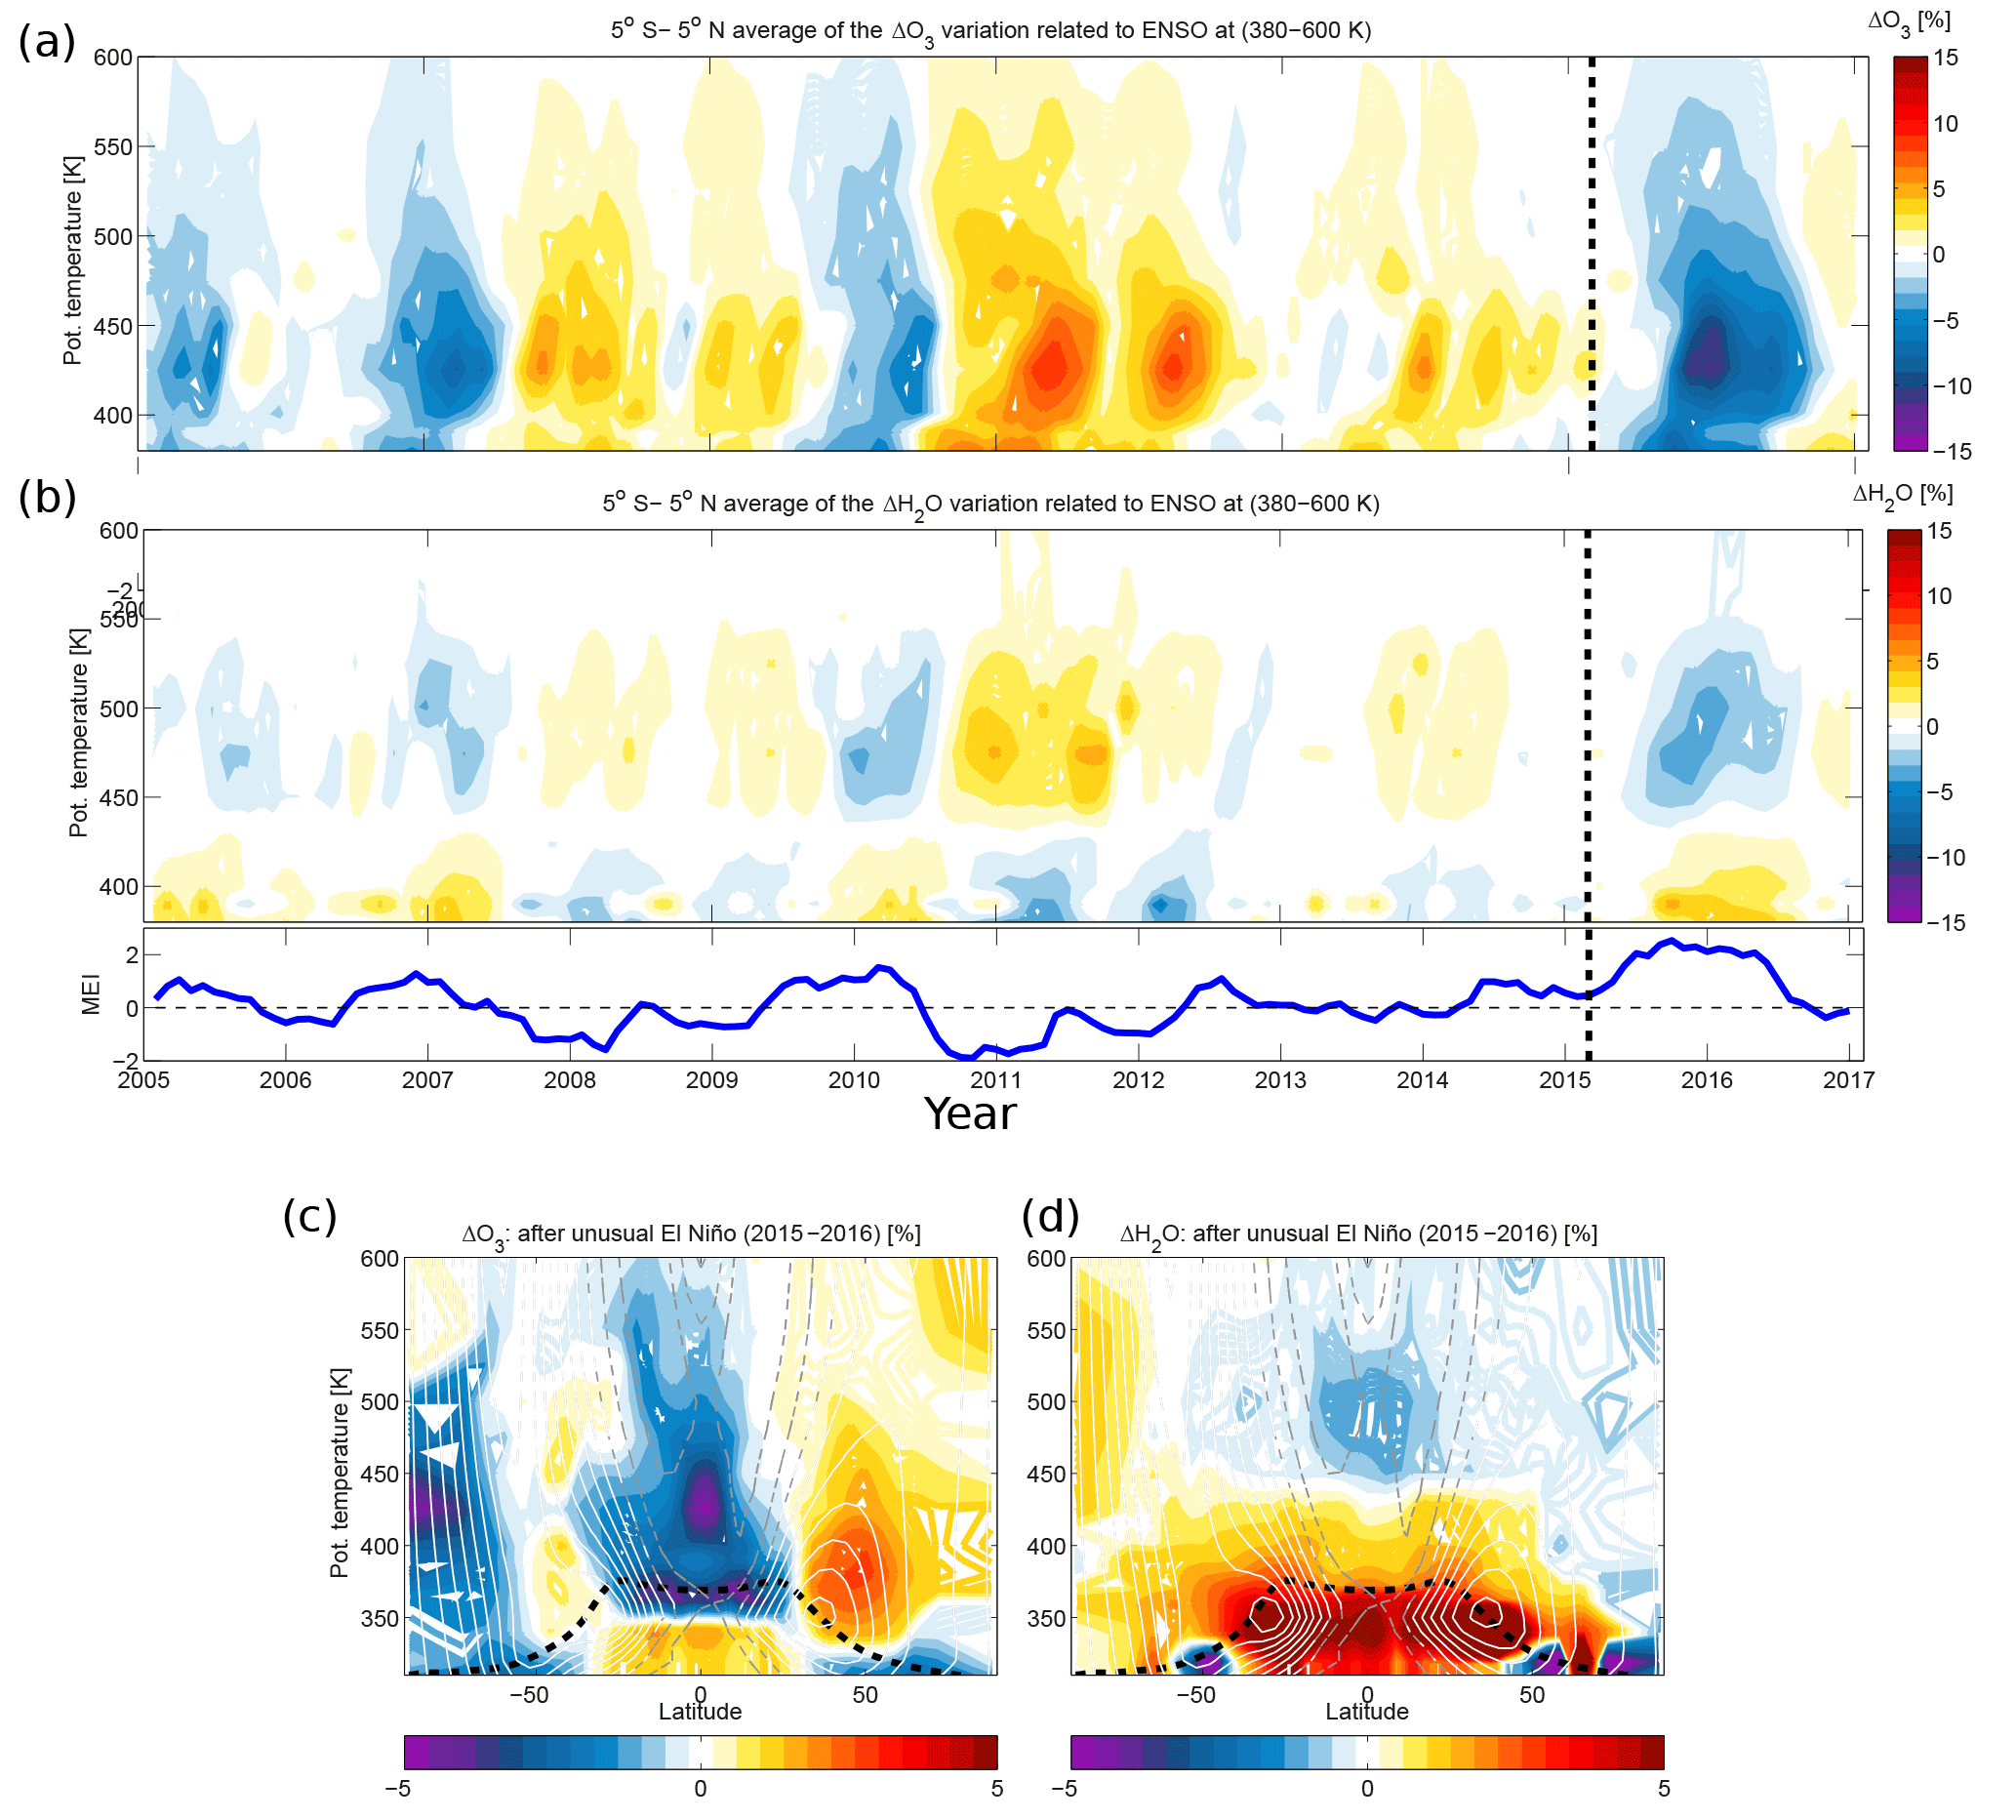
Figure 2ENSO impact on the stratospheric O3 (a) and H2O (b) from MLS satellite observations for the 2005–2016 period in percent change relative to monthly mean mixing ratio as a function of time and potential temperature. The ENSO impact on the stratospheric trace gases is derived from the multiple regression fit as the difference between the residual (ϵ in Eq. 1) without and with explicit inclusion of the ENSO signal. Vertical black dashed line indicates the warm ENSO onset (February 2015). The lower panel below indicates the MEI index in blue. Panels (c–d) show the zonal distribution of the ENSO impact on stratospheric O3 (c) and H2O (d) averaged from January 2015 to December 2016 in percent change relative to monthly mean mixing ratios. The black dashed horizontal line indicates the tropopause from ERA-Interim. Zonal mean zonal wind component, u (m s−1), averaged over the 2015–2016 period, from ERA-Interim is overlaid as solid white (westerly) and dashed gray (easterly) lines.
5.1 Impact of the 2015–2016 El Niño on lower stratospheric O3 and H2O
Figure 2a, b show time series of the ENSO-induced variability in tropical monthly mean O3 and H2O estimated from the difference between the residual (ϵ in Eq. 1) without and with explicit inclusion of the ENSO signal for the 2005–2016 period. Figure 2a indicates that the most recent El Niño event produces an extremely large negative O3 anomaly in the lower stratosphere, inducing a record minimum anomaly of minus 15 % in the tropics, consistent with previous studies (Randel et al., 2009; Calvo et al., 2010; Konopka et al., 2016). This strong decrease in O3 mixing ratio is interpreted as a strengthening of the tropical upwelling induced by El Niño (Randel et al., 2009). In addition, by effectively warming the cold point temperature (Hu et al., 2016), the recent strong El Niño event in 2015–2016 regulates the stratospheric H2O entry mixing ratio by significantly inducing positive anomalies in the tropical lower stratosphere between 380 and 450 K (Fig. 2b). These changes in H2O mixing ratio in the TTL reach 10–15 % and are consistent with a recent study (Avery et al., 2017).
Figure 2c, d depict the zonal mean impact of the recent strong El Niño on O3 (c) and H2O (d) calculated from the difference between the residuals, which is similar to Fig. 2a, b but averaged for the 2015–2016 period. Figure 2c shows that the O3 mixing ratio decreases throughout the tropics during El Niño as expected due to the enhanced tropical upwelling, bringing air poor in O3 from the troposphere. In the extratropics (poleward of 30∘ N) of the Northern Hemisphere, there is a related increase in O3 mixing ratios due to enhanced downwelling from the shallow branch of the BD-circulation (Neu et al., 2014). The negative O3 anomalies seen in the Southern Hemisphere polar region are likely a consequence of the Antarctic ozone hole during the austral spring (Solomon, 1999; WMO, 2014).
Clearly, there is a strong increase in H2O anomalies in the lower stratosphere related to the extreme El Niño event from February 2015 to December 2016 (Fig. 2d), which induced generally warmer tropical cold point tropopause temperatures (Hu et al., 2016). These positive H2O anomalies are consistent with the known effect of El Niño to moisten the tropical lower stratosphere (e.g., Bonazzola and Haynes, 2004; Randel et al., 2004; Fueglistaler et al., 2005; Konopka et al., 2016). The induced H2O anomalies by the strong El Niño event propagate toward the extratropical lower stratosphere. This propagation is likely attributable to the horizontal transport caused by the shallow branch of the residual circulation near the subtropics and by eddy mixing at higher latitudes, poleward of about 50∘ N (Hegglin and Shepherd, 2007; James and Legras, 2009; Ploeger et al., 2013). The largest H2O anomalies occur between 20 and 50∘ S/N near the subtropical jet due to the convection shift (L'Heureux et al., 2017; Avery et al., 2017) and in the upper troposphere. The positive H2O anomalies associated with El Niño below ∼400 K are related to the extended tropospheric moist anomaly (Fig. 2d), which is partly associated with an upward-shifting tropopause (Randel et al., 2004; Lorenz and DeWeaver, 2007; Lu et al., 2008) and partly due to a smearing effect arising from the limited 2.5–3 km vertical resolution of the MLS H2O measurements. Using high-resolution temperature data and climate model simulations, Randel et al. (2009) showed that there is a clear separation between a warming troposphere and cooling lower stratosphere for the zonal average ENSO signal, with a node near the tropical cold point tropopause (i.e., a demarcation between the warming and cooling regime). However, zonal mean H2O anomalies do not exactly follow the zonal mean temperature, but critically depend on the geographical distribution of lowest temperature regions (Bonazzola and Haynes, 2004; Konopka et al., 2016). Konopka et al. (2016) argued that El Niño causes colder zonal mean temperatures, but also warmer temperatures over the west Pacific region, which is most critical for stratospheric entry water vapor (e.g., Fueglistaler et al., 2004). As a net effect, zonal mean H2O mixing ratios turn out to be larger during El Niño than La Niña.
With the exception of the Antarctic polar vortex, the H2O anomalies above 450 K become negative over the entire stratosphere, with a minimum occurring in the inner tropics between 450 and 550 K. These negative H2O anomalies are related to air which entered the stratosphere before the onset of El Niño and a related upward propagating tape-recorder signal.
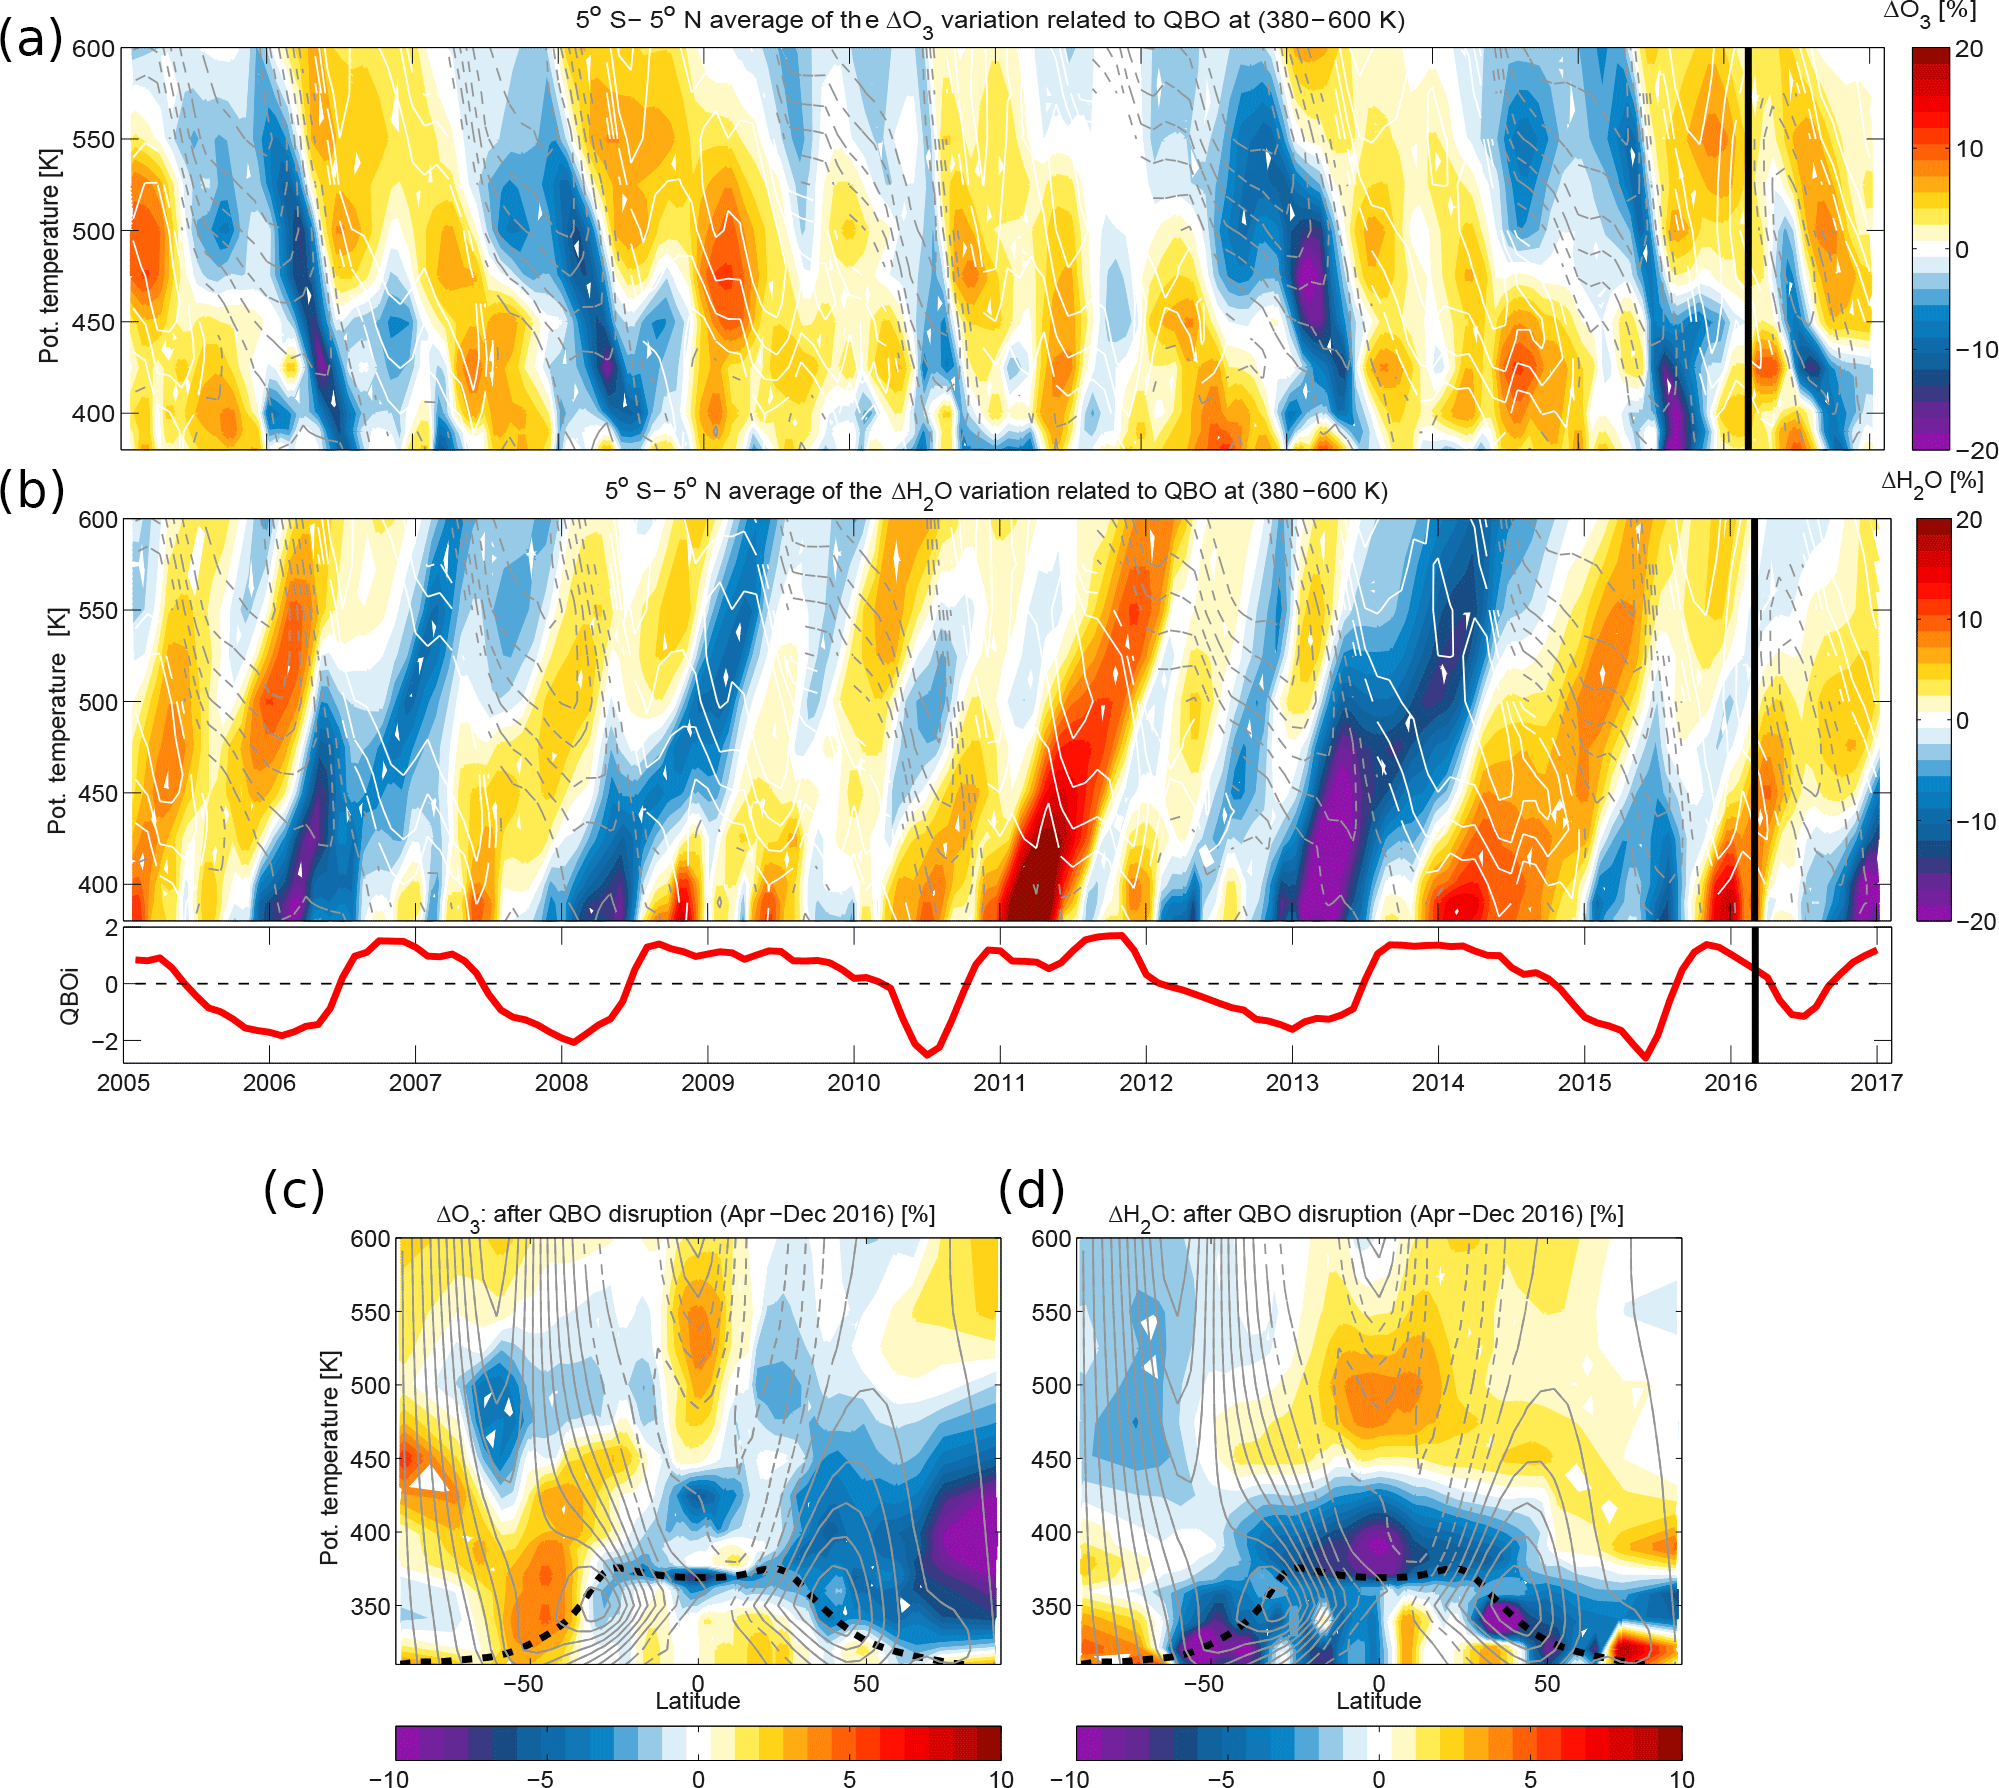
Figure 3QBO impact on the stratospheric O3 (a) and H2O (b) from MLS satellite observations for the 2005–2016 period in percent change relative to monthly mean mixing as a function of time and potential temperature. Shown QBO impact on the stratospheric trace gases is derived from the multiple regression fit as the difference between the residual (ϵ in Eq. 1) without and with explicit inclusion of the QBO signal. The vertical black line indicates the QBO shift onset (February 2016). The lower panel below indicates the QBO index at 50 hPa in red. Panels (c–d) show the zonal mean QBO disruption impact on stratospheric O3 (c) and H2O (d) averaged from April to December 2016 in percent change relative to monthly mean mixing ratios. The black dashed horizontal line indicates the tropopause from ERA-Interim. Monthly mean zonal mean wind component, u (m s−1), from ERA-Interim is overlaid as solid white (westerly) and dashed gray (easterly) lines.
5.2 Impact of the QBO disruption on lower stratospheric O3 and H2O
Figure 3a, b show time series of the QBO-induced variability in tropical monthly mean O3 and H2O estimated from the difference between the residual (ϵ in Eq. 1) without and with explicit inclusion of the QBO signal for the 2005–2016 period. For the QBO-induced impact, anomalies in both trace gases are roughly in phase below 500 K, with a delay of a few months for the H2O anomalies. Both trace gases reveal a footprint of the QBO disruption in their anomalies, e.g., a shift from increasing mixing ratios (positive anomalies) related to the westerly wind shear (positive QBOi) to decreasing mixing ratios (negative anomalies) related to the easterly wind shear (negative QBOi). The occurrence of the easterly wind shear at 40 hPa (∼550 K) induces significant negative O3 and H2O anomalies as large as 15 %–20 % between 380 and 450 K consistent with upward transport of young and dehydrated air poor in O3 and H2O into the lower stratosphere (Fig. 3). The response of the O3 anomalies to the QBO shift is sudden and follows the monthly mean zonal mean wind changes as represented in ERA-Interim reanalysis. The H2O response to the QBO disruption is delayed by about 3–6 months due to its tropospheric origin, and reaches its minimum value in autumn 2016. The results for both O3 and H2O are consistent with those shown previously by Tweedy et al. (2017). The westerly wind shear that appears between 30 and 10 hPa (∼570–600 K) reduces the upward motion of the BD-circulation and causes positive O3 and H2O anomalies of up to 5 % and 10 % in the lower stratosphere (above 570 K) during the early boreal winter of 2015–2016.
The zonal mean impact of the QBO disruption on O3 and H2O anomalies is calculated as the difference between the residuals averaged between April and December 2016 (Fig. 3c, d, respectively). In the tropics, the observed negative O3 anomalies in Fig. 3a reach up to 450 K due to the easterly QBO phase, whilst above that level, the positive O3 anomalies remain mainly confined below 600 K due to the westerly QBO phase (Fig. 3c). In the extratropics, the changes in O3 anomalies reflect large variability at high latitudes, which can be associated with the effect of the QBO influence on the extratropical circulation (Hampson and Haynes, 2006; Damadeo et al., 2014), stratospheric major warmings and chemical processes (WMO, 2014; Manney and Lawrence, 2016).
In contrast to the strong El Niño, the QBO disruption significantly dehydrates the lower stratosphere (Fig. 3d). Below the 450 K level, the lower stratospheric H2O abundances globally decrease due to the enhanced tropical upwelling and related decrease of cold point temperature (Jensen et al., 1996; Hartmann et al., 2001; Geller et al., 2002; Schoeberl and Dessler, 2011). This decrease in H2O mixing ratios reaches a maximum net change of about minus 10–20 % (Fig. 3d). The strongly dehydrated air rising through the tropical tropopause propagates more toward the Northern Hemisphere than Southern Hemisphere because of the asymmetry of the meridional circulation driven by planetary wave activity (Holton and Gettelman, 2001; Flury et al., 2013; Konopka et al., 2015) and eddy mixing (Haynes and Shuckburgh, 2000; Nakamura, 2001; Hegglin et al., 2005). The large-amplitude negative H2O anomalies at high latitudes are likely due to the large atmospheric variability in that region, which is related to stratospheric major warmings and chemical processes (WMO, 2014; Manney and Lawrence, 2016), or the high-latitude influence of the QBO (Holton and Tan, 1980; Baldwin and Dunkerton, 1998; Anstey and Shepherd, 2014). The zonal mean picture of decreasing H2O related to the QBO disruption is consistent with the findings of Tweedy et al. (2017), which suggested a global dehydration of the lower stratosphere. The positive H2O anomalies with a maximum occurrence between 500 and 550 K are related to the effect of the preceding westerly QBO phase on TTL temperatures and the upward propagating tape-recorder signal.
Two previous studies (i.e., Avery et al., 2017; Tweedy et al., 2017) focussed on ENSO and QBO, respectively, and made contradictory statements on the H2O anomalies in 2015–2016. Avery et al. (2017) argued that the most recent El Niño event significantly moistened the lower stratosphere due to ice lofting, with the QBO having only a small contribution. In contrast, Tweedy et al. (2017) attributed the lower stratospheric H2O changes from spring to autumn to the 2015–2016 QBO disruption. Our analysis shows that the QBO disruption significantly decreased global lower stratospheric H2O from early spring to late autumn and reversed the lower stratosphere moistening triggered by the alignment of the warm ENSO event with westerly QBO in early boreal winter. These presented regression results are significant with respect to the measurement uncertainties.
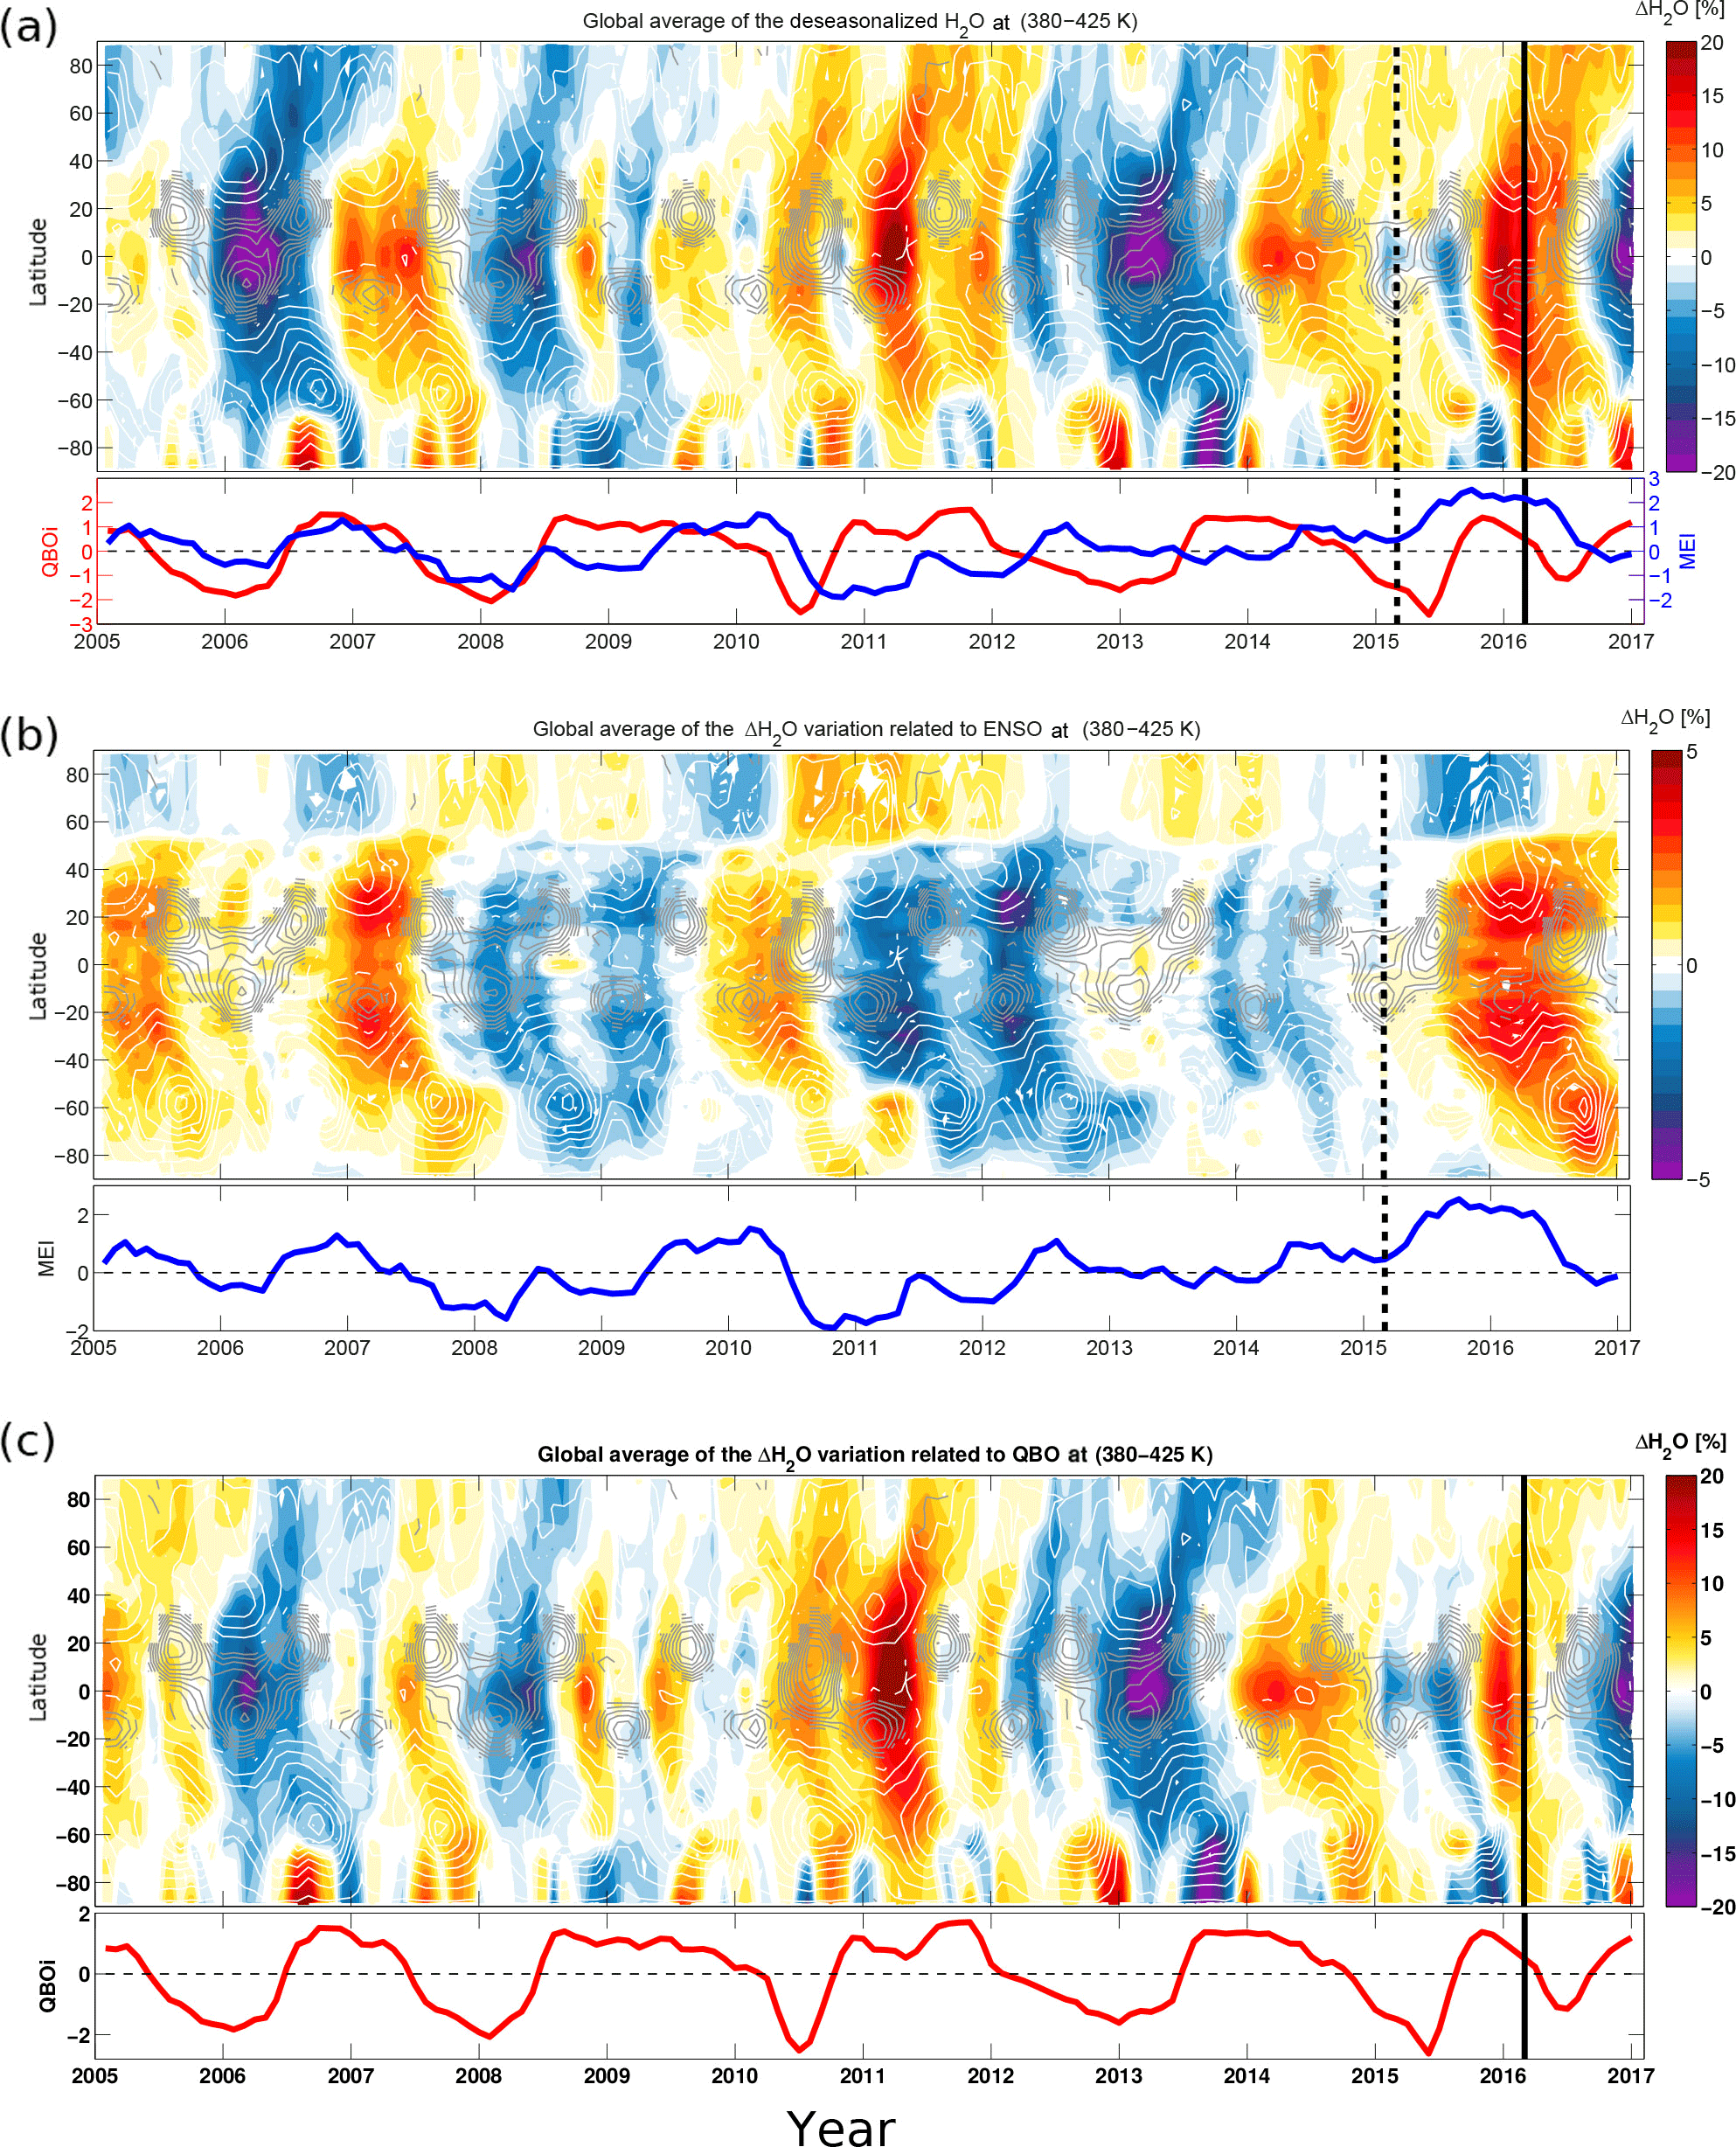
Figure 4Latitude–time evolution of the global deseasonalized MLS H2O (a) together with the ENSO (b) and QBO (c) impact on lower stratospheric H2O in percent change from long-term zonal monthly means derived from the multiple regression fit and averaged between 380 and 425 K for the 2005–2016 period. Note that there is a factor of 4 difference in the color scales in (b) and (c) reflecting the difference in the magnitude of the H2O changes related to ENSO compared to those related to the QBO. The vertical black dashed line indicates February 2015 for the warm ENSO onset. The vertical black line indicates February 2016 for the QBO shift onset. The monthly averaged zonal mean zonal wind component, u (m s−1), from ERA-Interim between 380 and 500 K is overlaid as solid white (westerly) and solid gray (easterly) lines.
An interesting open question concerns what would have happened to the lower stratospheric H2O anomalies if there had been no QBO disruption? The clearest picture emerges from the latitude–time series of H2O anomalies in Fig. 4, on which we concentrate our discussion in the following. Figure 4 shows the deseasonalized time series (a) together with the impact of the QBO (b) and ENSO (c) on H2O averaged in the lower stratosphere between 380 and 425 K. Remarkably, the variability in H2O anomalies shown in Fig. 4a is largely explained by the interplay between the ENSO- and QBO-induced variability. In early boreal winter 2015–2016, Fig. 4a shows that the lower stratosphere was strongly moistened by both the strong El Niño event (Fig. 4b) and the westerly QBO phase (Fig. 4c). Considered as one of the three strongest occurring since 1950 (Huang et al., 2016; Hu et al., 2016), the most recent El Niño event stands out in the decadal record of ENSO impact on H2O in the lower stratosphere (see black vertical dashed line in Fig. 4b), consistent with the findings of Avery et al. (2017). The positive H2O anomalies induced by this most recent El Niño slowly propagate with time into the extratropical lower stratosphere of both hemispheres due to the shallow branch of BD-circulation and eddy mixing processes. During the boreal winter 2015–2016 (DJFM, December–March), the westerly QBO phase contribution to H2O anomalies adds to the El Niño-induced H2O variability, resulting in particularly large H2O anomalies, consistent with the findings of Tweedy et al. (2017).
However, the QBO shift from westerly to easterly wind shear at 40 hPa (∼550 K) suddenly reverses the extreme lower stratospheric moistening by significantly decreasing H2O from boreal spring 2016 to boreal winter 2016–2017 (Fig. 4c). The QBO disruption contributes the most to the lower stratospheric water budget between 380 and 425 K, with strong negative H2O anomalies of about 20 % from boreal spring to boreal winter 2016–2017 compared to the El Niño, which only induces about 5–10 % increase on average in this layer during the same period. Therefore, if there had been no QBO disruption during the boreal winter of 2015–2016 with an ongoing westerly QBO phase, the H2O anomalies would have likely increased to more than 25 %, leading to changes larger than previously observed in the lower stratospheric water budget.

Figure 5Standard deviation (SD) of the global deseasonalized MLS H2O (black) together with the SD of the ENSO (blue), QBO (red) and ENSO plus QBO (green) impact on lower stratospheric H2O derived from the multiple regression fit results shown in Fig. 4.
The control of the interannual variability in lower stratospheric H2O anomalies critically depends on the alignment of the ENSO events and QBO phases. Alignment of a westerly QBO phase with El Niño leads to strongly positive H2O anomalies as illustrated for the boreal winters of 2006–2007 and 2015–2016. Alignment of an easterly QBO phase with La Niña induces strongly negative H2O anomalies, for example, as seen during the boreal winter of 2005–2006 and 2007–2008. This result is consistent with previous studies based on observations (Yuan et al., 2014) and climate models (Brinkop et al., 2016). According to the findings of Yuan et al. (2014), the greatest dehydration of air entering the stratosphere from the troposphere occurs during the winter under La Niña and easterly QBO phase. Brinkop et al. (2016) suggested that a large decline in H2O anomalies can be found after strong El Niño/La Niña events combined with a transition from the westerly QBO phase during La Niña to the easterly QBO phase. In conclusion, the alignment of the westerly QBO phases with El Niño events (e.g., 2006–2007, early 2015–2016) and easterly QBO with La Niña events (e.g., 2005–2006, 2007–2008) are the key factors in creating extreme lower stratospheric water vapor anomalies via a control of cold point tropopause temperatures. Consistent with this picture, the variance in the deseasonalized H2O time series is largely captured by this interplay of the ENSO events and QBO phases as shown in Fig. 5. The variance in the QBO- and ENSO-induced changes in H2O anomalies shows that the QBO contributes the largest part to the H2O variability (Fig. 5).
In addition, when the ENSO signal is weak or moderate (e.g., 2012–2015, early winter 2016–2017), the lower stratospheric H2O anomalies are dominated by the QBO phases. This QBO control of the lower stratospheric H2O budget is also illustrated during the boreal winter of 2010–2011. Despite the ongoing La Niña event, which dehydrated the lower stratosphere, the impact of the westerly QBO phase on H2O anomalies dominated, leading to positive anomalies approaching 25 %. According to Nedoluha et al. (2015), the westerly wind shear persisted slightly longer than usual during the 2008–2013 period (QBOi in Fig. 4c). Therefore, this persistence of the westerly QBO can explain the large H2O anomalies during this period. Note that the 2011 winter had an extreme anomalously strong vortex, i.e., strongly reduced BD-circulation, which also might have contributed to these large positive anomalies (Manney et al., 2011). An additional example of this QBO control on the lower stratospheric H2O anomalies is the drop in H2O during the 2012–2013 boreal winter (Urban et al., 2014). These extremely negative H2O anomalies are associated with the rapid cooling of the tropical cold point tropopause temperatures induced by easterly wind shear and a major sudden stratospheric warming (Evan et al., 2015; Tao et al., 2015). This cooling of the tropical cold point tropopause temperatures is induced by a downward shift of the zero wind line (∼30 hPa) during easterly wind shear, inducing more subtropical wave dissipation at low latitudes, therefore efficiently speeding up the shallow branch of the BD-circulation (Garny et al., 2011; Gómez-Escolar et al., 2014). Therefore, based on these recent findings (Gómez-Escolar et al., 2014; Evan et al., 2015; Tao et al., 2015), we can explain the sudden drop in the lower stratospheric moistening from boreal spring 2016 to boreal winter 2016–2017 despite the strong El Niño as a consequence of the rapid cooling of the tropical cold point tropopause temperatures induced by the QBO disruption (easterly; Tweedy et al., 2017) and the major stratospheric final warming in 2016 (Manney and Lawrence, 2016), which strengthened the shallow branch of the BD-circulation.
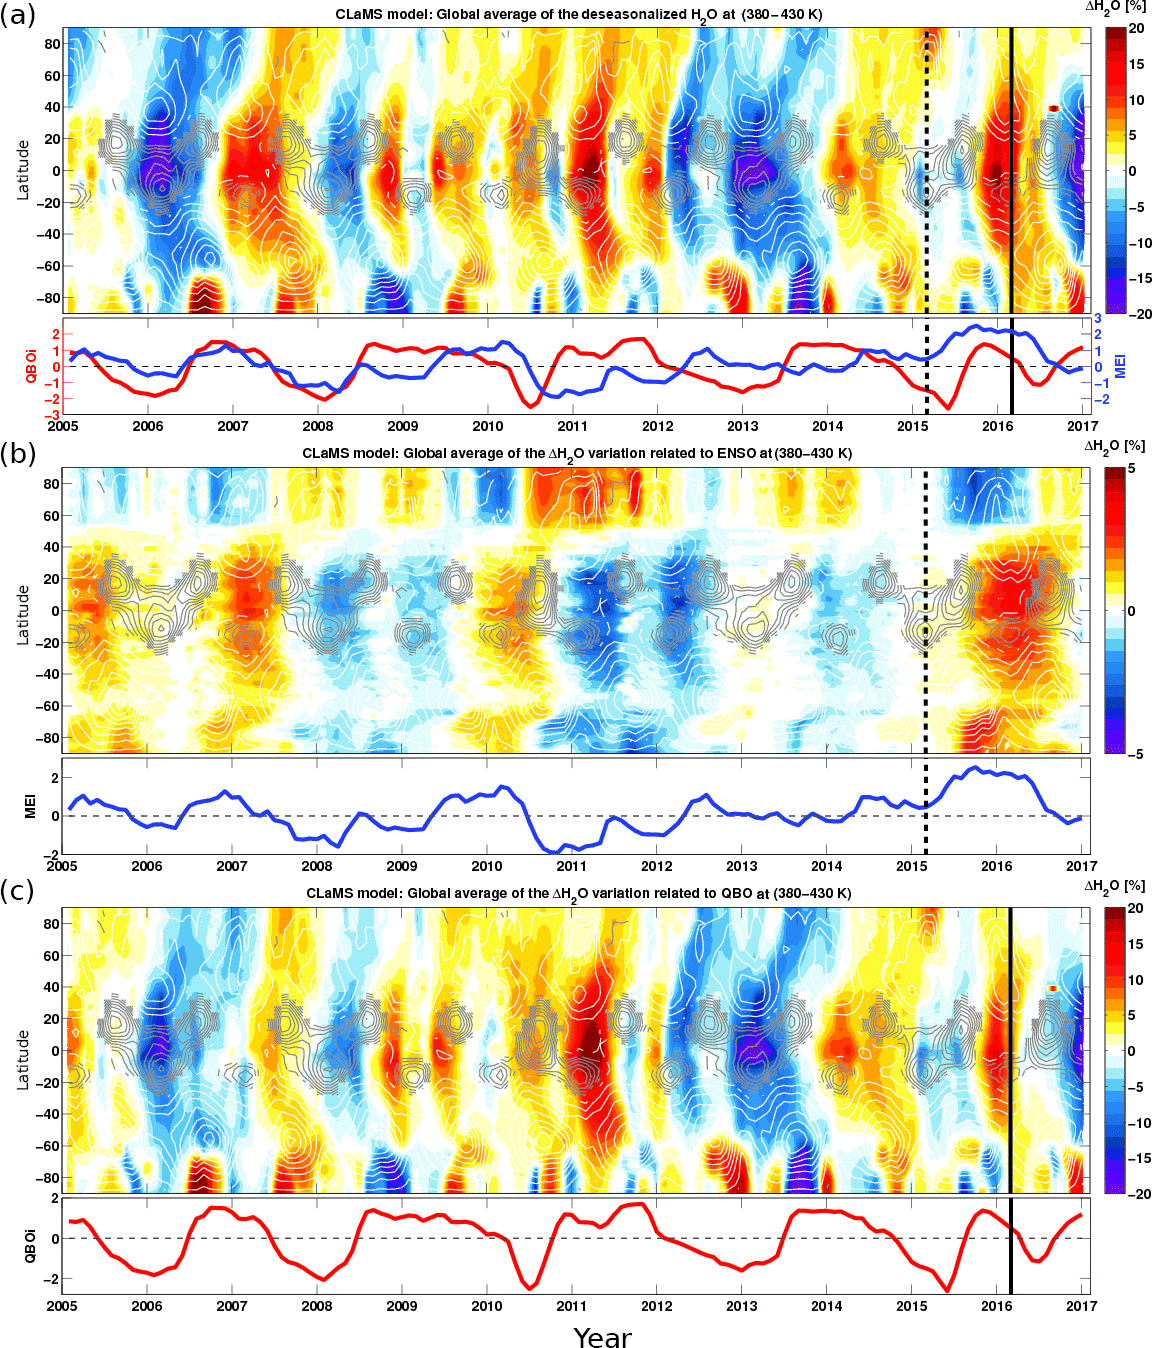
Figure 6Latitude–time evolution of the global deseasonalized CLaMS H2O (a) together with the ENSO (b) and QBO (c) impact on lower stratospheric H2O in percent change from long-term zonal monthly means derived from the multiple regression fit and averaged between 380 and 430 K for the 2005–2016 period. Note that there is a factor of 4 difference in the color scales in Fig. 4b and c reflecting the difference in the magnitude of the H2O changes related to ENSO compared to those related to the QBO. The vertical black dashed line indicates February 2015 for the warm ENSO onset. The vertical black line indicates February 2016 for the QBO shift onset. The monthly averaged zonal mean zonal wind component, u (m s−1), from ERA-Interim between 380 and 500 K is overlaid as solid white (westerly) and solid gray (easterly) lines.
In order to gain confidence in the robustness of the above discussed results and to illustrate the ability of the CLaMS model to capture the unusual timing of QBO shift and El Niño in 2015–2016, we have also estimated the impact of their interplay on lower stratospheric H2O anomalies from the CLaMS simulations using the same regression method. Consistently, the CLaMS H2O anomalies show characteristics in good agreement with the zonally averaged H2O anomalies from MLS (Fig. 6a). CLaMS simulations and MLS observations agree remarkably well throughout the entire record and especially the El Niño and QBO signals in 2015–2016 (Fig. 6b, c). In particular, also in the model the El Niño signal is much weaker than the impact of the QBO disruption on lower stratospheric H2O. The influence of the QBO disruption turns out to be 4 times stronger than the El Niño impact in 2015–2016. Consequently, the reanalysis meteorology (here ERA-Interim) in combination with a sophisticated chemistry transport model (here CLaMS) realistically represents the effects of the interplay of QBO and ENSO on lower stratospheric H2O.
Current climate models predict a shift of the basic state toward more frequent El Niño conditions as well as a weakening QBO amplitude in the lower stratosphere for the future climate due to anthropogenic climate change (van Oldenborgh et al., 2005; Timmermann et al., 1999; Cai et al., 2014; Kawatani and Hamilton, 2013). Hence, the interplay of ENSO events and QBO phases affecting the lower stratospheric water vapor and ozone is likely to change, causing changes in radiative forcing of surface climate. An improved understanding of the interplay between ENSO events and QBO phases will help to reduce related uncertainties in climate projections as well as in past and future lower stratospheric H2O trends (Kunz et al., 2013; Hegglin et al., 2014). In addition, subtle differences in the alignment of ENSO and QBO could contribute to the large spread in basic state cold point tropopause temperature between different climate models and induced ozone radiative feedback (Birner and Charlesworth, 2017; Ming et al., 2017).
Based on an established multiple regression method applied to Aura MLS observations and CLaMS model simulations, we found that both the most recent El Niño and the QBO disruption in 2015–2016 induced substantial changes in the lower stratospheric O3 and H2O. The El Niño-induced substantial positive anomalies of up to 10 % in H2O and negative anomalies of about 15 % in O3. Our results also demonstrate that if there had been no QBO disruption, the lower stratosphere would likely have been substantially moistened by the alignment of the El Niño with the westerly QBO, with deseasonalized anomalies exceeding 25 %.
In boreal winter of 2015–2016 (September 2015–March 2016), the alignment of the strong El Niño with the westerly QBO strongly moistened the lower stratosphere (positive anomalies of more than 20 %). However, the sudden shift in the QBO from westerly to easterly wind shear reversed the moistening of the lower stratosphere between 380 and 450 K, leading to large negative H2O anomalies of as much as 20 % by autumn 2016 (4 times bigger than the El Niño influence in early 2016). The QBO also led to positive H2O anomalies over 460–600 K from April to December 2016. The El Niño-induced H2O anomalies are opposite to the easterly QBO-induced H2O changes. This opposite response arises because the QBO affects the atmosphere in a zonally symmetric manner, whereas ENSO predominantly creates zonally asymmetric signatures (source region of the dehydration Konopka et al., 2016; Avery et al., 2017), and therefore the two mechanisms give rise to different patterns of variability in the tropical cold point tropopause temperatures. Interestingly, although this QBO shift reversed the moistening of the lower stratosphere, the O3 mixing ratios continued to decrease in the tropics, indicating an additional acceleration of the BD-circulation.
The control of stratospheric H2O anomalies strongly depends on the interaction of ENSO events and QBO phases. The alignment of the westerly QBO phase with El Niño and the easterly QBO phase with La Niña are the key factors regulating the stratospheric water budget. The interaction of El Niño and the westerly QBO phase leads to large positive lower stratospheric H2O anomalies, while the interplay between La Niña and easterly QBO phase leads to negative anomalies. During weak and moderate ENSO events, the H2O anomalies are controlled by the QBO phase. The effects of QBO and ENSO on lower stratospheric H2O in the MLS observations are consistent with CLaMS model results.
Our results suggest that the interplay of ENSO events and QBO phases will be crucial for the control of the lower stratospheric water vapor and ozone budget under changing future climate, when increasing El Niño-like conditions (Timmermann et al., 1999; Cai et al., 2014) and a decreasing lower stratospheric QBO amplitude (Kawatani and Hamilton, 2013) are expected. The interplay will change, with ENSO likely controlling the lower stratospheric trace gas variability more strongly in the future. It is clear that ENSO impacts both tropopause height and tropopause temperature. Future analysis is needed using sensitivity runs from global circulation models and coupled chemistry-climate models to diagnose and separate the impact of future changes in tropopause height and tropopause temperature on stratospheric water.
The Aura Microwave Limb Sounder product (http://disc.sci.gsfc.nasa.gov/Aura/data-holdings/MLS/index.shtml, last access: 4 September 2018, Livesey et al., 2017; Santee et al., 2017) and ERA-Interim reanalysis data (https://www.ecmwf.int/en/forecasts/datasets/reanalysis-datasets/era-interim, last access: 4 September 2018, Dee et al., 2011) are available. The CLaMS H2O data set can be requested from the corresponding author Mohamadou Diallo (m.diallo@fz-juelich.de).
All co-authors made substantial contributions to the analysis and interpretation of the data as well as contributing to drafting the article.
The authors declare that they have no conflict of interest.
This article is part of the special issue “Water vapour in the upper troposphere and middle atmosphere: a WCRP/SPARC satellite data quality assessment including biases, variability, and drifts (ACP/AMT/ESSD inter-journal SI)”. It is not associated with a conference.
We particularly thank the NASA Jet Propulsion Laboratory and the European Centre for Medium-Range
Weather Forecasts for providing the Aura Microwave Limb Sounder product (https://mls.jpl.nasa.gov/, last access: 4 September 2018)
and the ERA-Interim reanalysis data. Work at the Jet Propulsion Laboratory, California Institute
of Technology, was done under contract with the National Aeronautics and Space Administration.
This work was funded by the Helmholtz Association under grant number VH-NG-1128
(Helmholtz-Hochschul-Nachwuchsforschergruppe). The authors thank the organizing committee
of SPARC training school on stratosphere–troposphere interactions during which this
work was initiated. We sincerely thank Chen Schwartz at the Hebrew University of
Jerusalem, Israel, and Abebe Kebede of Bahir Dar University, Ethiopia, for helpful
discussions. Finally our thanks go to the anonymous reviewers.
The article processing charges for this open-access
publication were covered by a Research
Centre of the Helmholtz Association.
Edited by: Karen Rosenlof
Reviewed by: two anonymous referees
Abalos, M., Ploeger, F., Konopka, P., Randel, W. J., and Serrano, E.: Ozone seasonality above the tropical tropopause: reconciling the Eulerian and Lagrangian perspectives of transport processes, Atmos. Chem. Phys., 13, 10787–10794, https://doi.org/10.5194/acp-13-10787-2013, 2013. a
Anstey, J. A. and Shepherd, T. G.: High-latitude influence of the quasi-biennial oscillation, Q. J. Roy. Meteorol. Soc., 140, 1–21, https://doi.org/10.1002/qj.2132, 2014. a
Avery, M. A., Davis, S. M., Rosenlof, K. H., Ye, H., and Dessler, A. E.: Large anomalies in lower stratospheric water vapour and ice during the 2015–2016 El Niño, Nat. Geosci., 10, 405–409, https://doi.org/10.1038/ngeo2961, 2017. a, b, c, d, e, f, g, h, i
Baldwin, M. P. and Dunkerton, T. J.: Quasi-biennial modulation of the southern hemisphere stratospheric polar vortex, Geophys. Res. Lett., 25, 3343–3346, https://doi.org/10.1029/98GL02445, 1998. a
Baldwin, M. P. and O'Sullivan, D.: Stratospheric Effects of ENSO-Related Tropospheric Circulation Anomalies, J. Climate, 8, 649–667, https://doi.org/10.1175/1520-0442(1995)008<0649:SEOERT>2.0.CO;2, 1995. a
Baldwin, M. P., Gray, L. J., Dunkerton, T. J., Hamilton, K., Haynes, P. H., Randel, W. J., Holton, J. R., Alexander, M. J., Hirota, I., Horinouchi, T., Jones, D. B. A., Kinnersley, J. S., Marquardt, C., Sato, K., and Takahashi, M.: The quasi-biennial oscillation, Rev. Geophys., 39, 179–229, https://doi.org/10.1029/1999RG000073, 2001. a
Barton, C. A. and McCormack, J. P.: Origin of the 2016 QBO Disruption and Its Relationship to Extreme El Niño Events, Geophys. Res. Lett., 44, 11150–11157, https://doi.org/10.1002/2017GL075576, 2017. a
Bence, J. R.: Analysis of short time series: Correcting for autocorrelation, Ecology, 76, 628–639, 1995. a
Birner, T. and Bönisch, H. B.: Residual circulation trajectories and transit times into the extratropical lowermost stratosphere, Atmos. Chem. Phys., 11, 817–827, https://doi.org/10.5194/acp-11-817-2011, 2011. a
Birner, T. and Charlesworth, E. J.: On the relative importance of radiative and dynamical heating for tropical tropopause temperatures, J. Geophys. Res., 122, 6782–6797, https://doi.org/10.1002/2016JD026445, 2016JD026445, 2017. a
Bjerknes, J.: Atmospheric teleconnections from the equatorial Pacific, Mon. Weather Rev., 97, 163–172, https://doi.org/10.1175/1520-0493(1969)097<0163:ATFTEP>2.3.CO;2, 1969. a
Bönisch, H. B., Engel, A., Birner, T., Hoor, P., Tarasick, D. W., and Ray, E. A.: On the structural changes in the Brewer-Dobson circulation after 2000, Atmos. Chem. Phys., 11, 3937–3948, https://doi.org/10.5194/acp-11-3937-2011, 2011. a
Bonazzola, M. and Haynes, P. H.: A trajectory-based study of the tropical tropopause region, J. Geophys. Res., 109, D20112, https://doi.org/10.1029/2003JD004356, 2004. a, b
Brewer, A.: Evidence for a world circulation provided by the measurements of helium and water vapour distribution in the stratosphere, Q. J. Roy. Meteorol. Soc., 75, 351–363, 1949. a
Brinkop, S., Dameris, M., Jöckel, P., Garny, H., Lossow, S., and Stiller, G.: The millennium water vapour drop in chemistry–climate model simulations, Atmos. Chem. Phys., 16, 8125–8140, https://doi.org/10.5194/acp-16-8125-2016, 2016. a, b
Butchart, N.: The Brewer-Dobson circulation, Rev. Geophys., 52, 157–184, https://doi.org/10.1002/2013RG000448, 2014. a, b
Butchart, N. and Scaife, A. A.: Removal of chlorofluorocarbons by increased mass exchange between the stratosphere and troposphere in a changing climate., Nature, 410, 799–802, https://doi.org/10.1038/35071047, 2001. a
Cagnazzo, C. and Manzini, E.: Impact of the Stratosphere on the Winter Tropospheric Teleconnections between ENSO and the North Atlantic and European Region, J. Climate, 22, 1223–1238, https://doi.org/10.1175/2008JCLI2549.1, 2009. a
Cai, W., Borlace, S., Lengaigne, M., van Rensch, P., Collins, M., Vecchi, G., Timmermann, A., Santoso, A., McPhaden, M. J., Wu, L., England, M. H., Wang, G., Guilyardi, E., and Jin, F.-F.: Increasing frequency of extreme El Niño events due to greenhouse warming, Nat. Clim. Change, 4, 111–116, https://doi.org/10.1038/nclimate2100, 2014. a, b, c
Calvo, N., Garcia, R. R., Randel, W. J., and Marsh, D. R.: Dynamical mechanism for the increase in tropical upwelling in the lowermost tropical stratosphere during warm ENSO events, J. Atmos. Sci., 67, 2331–2340, https://doi.org/10.1175/2010JAS3433.1, 2010. a, b
Christiansen, B., Yang, S., and Madsen, M. S.: Do strong warm ENSO events control the phase of the stratospheric QBO?, Geophys. Res. Lett., 43, 10489–10495, https://doi.org/10.1002/2016GL070751, 2016. a
Coy, L., Newman, P. A., Pawson, S., and Lait, L. R.: Dynamics of the Disrupted 2015/16 Quasi-Biennial Oscillation, J. Climate, 30, 5661–5674, https://doi.org/10.1175/JCLI-D-16-0663.1, 2017. a
Crutzen, P. J., Grooß, J. U., Brühl, C., Müller, R., and Russell, J. M.: A Reevaluation of the Ozone Budget with HALOE UARS Data: No Evidence for the Ozone Deficit, Science, 268, 705–708, https://doi.org/10.1126/science.268.5211.705, 1995. a
Damadeo, R. P., Zawodny, J. M., and Thomason, L. W.: Reevaluation of stratospheric ozone trends from SAGE II data using a simultaneous temporal and spatial analysis, Atmos. Chem. Phys., 14, 13455–13470, https://doi.org/10.5194/acp-14-13455-2014, 2014. a
Dee, D. P., Uppala, S. M., Simmons, A. J., Berrisford, P., Poli, P., Kobayashi, S., Andrae, U., Balmaseda, M. A., Balsamo, G., Bauer, P., Bechtold, P., Beljaars, A. C. M., van de Berg, L., Bidlot, J., Bormann, N., Delsol, C., Dragani, R., Fuentes, M., Geer, A. J., Haimberger, L., Healy, S. B., Hersbach, H., Hólm, E. V., Isaksen, L., Kållberg, P., Köhler, M., Matricardi, M., McNally, A. P., Monge-Sanz, B. M., Morcrette, J.-J., Park, B.-K., Peubey, C., de Rosnay, P., Tavolato, C., Thépaut, J.-N., and Vitart, F.: The ERA-Interim reanalysis: configuration and performance of the data assimilation system, Q. J. Roy. Meteorol. Soc., 137, 553–597, https://doi.org/10.1002/qj.828, 2011. a
Dessler, A. E., Weinstock, E. M., Hintsa, E. J., Anderson, J. G., Webster, C. R., May, R. D., Elkins, J. W., and Dutton, G. S.: An examination of the total hydrogen budget of the lower stratosphere, Geophys. Res. Lett., 21, 2563–2566, https://doi.org/10.1029/94GL02283, 1994. a
Dessler, A. E., Schoeberl, M. R., Wang, T., Davis, S. M., and Rosenlof, K. H.: Stratospheric water vapor feedback, Proc. Natl. Acad. Sci. USA, 110, 18087–18091, 2013. a
Diallo, M., Legras, B., and Chédin, A.: Age of stratospheric air in the ERA-Interim, Atmos. Chem. Phys., 12, 12133–12154, https://doi.org/10.5194/acp-12-12133-2012, 2012. a
Diallo, M., Ploeger, F., Konopka, P., Birner, T., Müller, R., Riese, M., Garny, H., Legras, B., Ray, E., Berthet, G., and Jegou, F.: Significant contributions of volcanic aerosols to decadal changes in the stratospheric circulation, Geophys. Res. Lett., 44, 10780–10791, https://doi.org/10.1002/2017GL074662, 2017. a, b
Drdla, K. and Müller, R.: Temperature thresholds for chlorine activation and ozone loss in the polar stratosphere, Ann. Geophys., 30, 1055–1073, https://doi.org/10.5194/angeo-30-1055-2012, 2012. a
Dunkerton, T.: A Lagrangian mean theory of wave, mean-Flow interaction with applications to nonacceleration and its breakdown, Rev. Geophys., 18, 387–400, https://doi.org/10.1029/RG018i002p00387, 1980. a
Dunkerton, T. J.: The quasi-biennial oscillation of 2015–2016: Hiccup or death spiral?, Geophys. Res. Lett., 43, 10547–10552, https://doi.org/10.1002/2016GL070921, 2016. a
Dvortsov, V. L. and Solomon, S.: Response of the stratospheric temperatures and ozone to past and future increases in stratospheric humidity, J. Geophys. Res.-Atmos., 106, 7505–7514, https://doi.org/10.1029/2000JD900637, 2001. a
Ern, M. and Preusse, P.: Wave fluxes of equatorial Kelvin waves and QBO zonal wind forcing derived from SABER and ECMWF temperature space-time spectra, Atmos. Chem. Phys., 9, 3957–3986, https://doi.org/10.5194/acp-9-3957-2009, 2009. a
Ern, M., Ploeger, F., Preusse, P., Gille, J. C., Gray, L. J., Kalisch, S., Mlynczak, M. G., Russell, J. M., and Riese, M.: Interaction of gravity waves with the QBO: A satellite perspective, J. Geophys. Res.-Atmos., 119, 2329–2355, https://doi.org/10.1002/2013JD020731, 2014. a
Evan, S., Rosenlof, K. H., Thornberry, T., Rollins, A., and Khaykin, S.: TTL cooling and drying during the January 2013 stratospheric sudden warming, Q. J. Roy. Meteorol. Soc., 141, 3030–3039, https://doi.org/10.1002/qj.2587, 2015. a, b
Flury, T., Wu, D. L., and Read, W. G.: Variability in the speed of the Brewer–Dobson circulation as observed by Aura/MLS, Atmos. Chem. Phys., 13, 4563–4575, https://doi.org/10.5194/acp-13-4563-2013, 2013. a, b
Forster, P. M. and Shine, K. P.: Stratospheric water vapour changes as a possible contributor to observed stratospheric cooling, Geophys. Res. Lett., 26, 3309–3312, https://doi.org/10.1029/1999GL010487, 1999. a, b
Forster, P. M. d. F. and Shine, K. P.: Assessing the climate impact of trends in stratospheric water vapor, Geophys. Res. Lett., 29, 1086, https://doi.org/10.1029/2001GL013909, 2002. a
Froidevaux, L., Jiang, Y. B., Lambert, A., Livesey, N. J., Read, W. G., Waters, J. W., Browell, E. V., Hair, J. W., Avery, M. A., McGee, T. J., Twigg, L. W., Sumnicht, G. K., Jucks, K. W., Margitan, J. J., Sen, B., Stachnik, R. A., Toon, G. C., Bernath, P. F., Boone, C. D., Walker, K. A., Filipiak, M. J., Harwood, R. S., Fuller, R. A., Manney, G. L., Schwartz, M. J., Daffer, W. H., Drouin, B. J., Cofield, R. E., Cuddy, D. T., Jarnot, R. F., Knosp, B. W., Perun, V. S., Snyder, W. V., Stek, P. C., Thurstans, R. P., and Wagner, P. A.: Validation of Aura Microwave Limb Sounder stratospheric ozone measurements, J. Geophys. Res.-Atmos., 113, D15S20, https://doi.org/10.1029/2007JD008771, 2008. a
Fueglistaler, S.: Stepwise changes in stratospheric water vapor?, J. Geophys. Res.-Atmos., 117, D13302, https://doi.org/10.1029/2012JD017582, 2012. a
Fueglistaler, S. and Haynes, P. H.: Control of interannual and longer-term variability of stratospheric water vapor, J. Geophys. Res.-Atmos., 110, D24108, https://doi.org/10.1029/2005JD006019, 2005. a
Fueglistaler, S., Wernli, H., and Peter, T.: Tropical troposphere-to-stratosphere transport inferred from trajectory calculations, J. Geophys. Res., 109, D03108, https://doi.org/10.1029/2003JD004069, 2004. a
Fueglistaler, S., Bonazzola, M., Haynes, P. H., and Peter, T.: Stratospheric water vapor predicted from the Lagrangian temperature history of air entering the stratosphere in the tropics, J. Geophys. Res., 110, D08107, https://doi.org/10.1029/2004JD005516, 2005. a
Fueglistaler, S., Dessler, A. E., Dunkerton, T. J., Folkins, I., Fu, Q., and Mote, P. W.: Tropical Tropopause Layer, Rev. Geophys., 47, G1004+, https://doi.org/10.1029/2008RG000267, 2009. a
Fueglistaler, S., Liu, Y., Flannaghan, T., Haynes, P., Dee, D., Read, W., Remsberg, E., Thomason, L., Hurst, D., Lanzante, J., and Bernath, P.: The relation between atmospheric humidity and temperature trends for stratospheric water, J. Geophys. Res.-Atmos., 118, 1052–1074, https://doi.org/10.1002/jgrd.50157, 2013. a
Fujiwara, M., Vömel, H., Hasebe, F., Shiotani, M., Ogino, S.-Y., Iwasaki, S., Nishi, N., Shibata, T., Shimizu, K., Nishimoto, E., Valverde Canossa, J. M., Selkirk, H. B., and Oltmans, S. J.: Seasonal to decadal variations of water vapor in the tropical lower stratosphere observed with balloon-borne cryogenic frost point hygrometers, J. Geophys. Res.-Atmos., 115, D18304, https://doi.org/10.1029/2010JD014179, 2010. a
Garfinkel, C. I. and Hartmann, D. L.: Effects of the El Niño-Southern Oscillation and the Quasi-Biennial Oscillation on polar temperatures in the stratosphere, J. Geophys. Res.-Atmos., 112, D19112, https://doi.org/10.1029/2007JD008481, 2007. a
Garfinkel, C. I., Hurwitz, M. M., Oman, L. D., and Waugh, D. W.: Contrasting Effects of Central Pacific and Eastern Pacific El Niño on stratospheric water vapor, Geophys. Res. Lett., 40, 4115–4120, https://doi.org/10.1002/grl.50677, 2013. a
Garfinkel, C. I., Gordon, A., Oman, L. D., Li, F., Davis, S., and Pawson, S.: Nonlinear response of tropical lower-stratospheric temperature and water vapor to ENSO, Atmos. Chem. Phys., 18, 4597–4615, https://doi.org/10.5194/acp-18-4597-2018, 2018. a
Garny, H., Dameris, M., Randel, W., Bodeker, G. E., and Deckert, R.: Dynamically forced increase of tropical upwelling in the lower stratosphere, J. Atmos. Sci., 68, 1214–1233, https://doi.org/10.1175/2011JAS3701.1, 2011. a, b
Geller, M. A., Zhou, X., and Zhang, M.: Simulations of the Interannual Variability of Stratospheric Water Vapor, J. Atmos. Sci., 59, 1076–1085, https://doi.org/10.1175/1520-0469(2002)059<1076:SOTIVO>2.0.CO;2, 2002. a
Glanville, A. A. and Birner, T.: Role of vertical and horizontal mixing in the tape recorder signal near the tropical tropopause, Atmos. Chem. Phys., 17, 4337–4353, https://doi.org/10.5194/acp-17-4337-2017, 2017. a
Gómez-Escolar, M., Calvo, N., Barriopedro, D., and Fueglistaler, S.: Tropical response to stratospheric sudden warmings and its modulation by the QBO, J. Geophys. Res.-Atmos., 119, 7382–7395, https://doi.org/10.1002/2013JD020560, 2014. a, b
Grimshaw, R.: Wave Action and Wave–Mean Flow Interaction, with Application to Stratified Shear Flows, Ann. Rev. Fluid Mech., 16, 11–44, https://doi.org/10.1146/annurev.fl.16.010184.000303, 1984. a
Hampson, J. and Haynes, P.: Influence of the Equatorial QBO on the Extratropical Stratosphere, J. Atmos. Sci., 63, 936–951, https://doi.org/10.1175/JAS3657.1, 2006. a
Hardiman, S. C., Butchart, N., and Calvo, N.: The morphology of the Brewer–Dobson circulation and its response to climate change in CMIP5 simulations, Q. J. Roy. Meteorol. Soc., 140, 1958–1965, https://doi.org/10.1002/qj.2258, 2014. a
Hartmann, D. L., Holton, J. R., and Fu, Q.: The heat balance of the tropical tropopause, cirrus, and stratospheric dehydration, Geophys. Res. Lett., 28, 1969–1972, https://doi.org/10.1029/2000GL012833, 2001. a
Haynes, P. H. and Shuckburgh, E.: Effective diffusivity as a diagnostic of atmospheric transport 2. Troposphere and lower stratosphere, J. Geophys. Res., 105, 22795–22810, https://doi.org/10.1029/2000JD900092, 2000. a
Haynes, P. H., McIntyre, M. E., Shepherd, T. G., Marks, C. J., and Shine, K. P.: On the “Downward Control” of Extratropical Diabatic Circulations by Eddy-Induced Mean Zonal Forces, J. Atmos. Sci., 48, 651–678, https://doi.org/10.1175/1520-0469(1991)048<0651:OTCOED>2.0.CO;2, 1991. a
Hegglin, M. I. and Shepherd, T. G.: O3-N2O Correlations from the Atmospheric Chemistry Experiment: Revisiting a Diagnostic of Transport and Chemistry in the Stratosphere, J. Geophys. Res., 112, D19301, https://doi.org/10.1029/2006JD008281, 2007. a
Hegglin, M. I., Brunner, D., Peter, T., Staehelin, J., Wirth, V., Hoor, P., and Fischer, H.: Determination of eddy diffusivity in the lowermost stratosphere, Geophys. Res. Lett., 32, L13812, https://doi.org/10.1029/2005GL022495, 2005. a
Hegglin, M. I., Tegtmeier, S., Anderson, J., Froidevaux, L., Fuller, R., Funke, B., Jones, A., Lingenfelser, G., Lumpe, J., Pendlebury, D., Remsberg, E., Rozanov, A., Toohey, M., Urban, J., Clarmann, T., Walker, K. A., Wang, R., and Weigel, K.: SPARC Data Initiative: Comparison of water vapor climatologies from international satellite limb sounders, J. Geophys. Res.-Atmos, 118, 11,824–11,846, https://doi.org/10.1002/jgrd.50752, 2013. a, b
Hegglin, M. I., Plummer, D. A., Shepherd, T. G., Scinocca, J. F., Anderson, J., Froidevaux, L., Funke, B., Hurst, D., Rozanov, A., Urban, J., von Clarmann, T., Walker, K. A., Wang, H. J., Tegtmeier, S., and Weigel, K.: Vertical structure of stratospheric water vapour trends derived from merged satellite data, Nat. Geosci., 7, 768–776, https://doi.org/10.1038/ngeo2236, 2014. a, b
Hitchcock, P., Haynes, P. H., Randel, W. J., and Birner, T.: The Emergence of Shallow Easterly Jets within QBO Westerlies, J. Atmos. Sci., 75, 21–40, https://doi.org/10.1175/JAS-D-17-0108.1, 2018. a
Holton, J. R.: Equatorial Wave-Mean Flow Interaction: A Numerical Study of the Role of Latitudinal Shear, J. Atmos. Sci., 36, 1030–1040, https://doi.org/10.1175/1520-0469(1979)036<1030:EWMFIA>2.0.CO;2, 1979. a
Holton, J. R. and Gettelman, A.: Horizontal transport and the dehydration of the stratosphere, Geophys. Res. Lett., 28, 2799–2802, https://doi.org/10.1029/2001GL013148, 2001. a, b
Holton, J. R. and Tan, H.-C.: The Influence of the Equatorial Quasi-Biennial Oscillation on the Global Circulation at 50 mb, J. Atmos. Sci., 37, 2200–2208, https://doi.org/10.1175/1520-0469(1980)037<2200:TIOTEQ>2.0.CO;2, 1980. a
Hu, D., Tian, W., Guan, Z., Guo, Y., and Dhomse, S.: Longitudinal Asymmetric Trends of Tropical Cold-Point Tropopause Temperature and Their Link to Strengthened Walker Circulation, J. Climate, 29, 7755–7771, https://doi.org/10.1175/JCLI-D-15-0851.1, 2016. a, b, c, d, e
Huang, B., L'Heureux, M., Hu, Z.-Z., and Zhang, H.-M.: Ranking the strongest ENSO events while incorporating SST uncertainty, Geophys. Res. Lett., 43, 9165–9172, https://doi.org/10.1002/2016GL070888, 2016. a, b, c
James, R. and Legras, B.: Mixing processes and exchanges in the tropical and the subtropical UT/LS, Atmos. Chem. Phys., 9, 25–38, https://doi.org/10.5194/acp-9-25-2009, 2009. a
Jensen, E. J., Toon, O. B., Pfister, L., and Selkirk, H. B.: Dehydration of the upper troposphere and lower stratosphere by subvisible cirrus clouds near the tropical tropopause, Geophys. Res. Lett., 23, 825–828, https://doi.org/10.1029/96GL00722, 1996. a
Kawatani, Y. and Hamilton, K.: Weakened stratospheric quasibiennial oscillation driven by increased tropical mean upwelling, Nature, 497, 478–481, https://doi.org/10.1038/nature12140, 2013. a, b, c
Kawatani, Y., Hamilton, K., and Watanabe, S.: The Quasi-Biennial Oscillation in a Double CO2 Climate, J. Atmos. Sci., 68, 265–283, https://doi.org/10.1175/2010JAS3623.1, 2011. a
Kim, J.-E. and Alexander, M. J.: Direct impacts of waves on tropical cold point tropopause temperature, Geophys. Res. Lett., 42, 1584–1592, https://doi.org/10.1002/2014GL062737, 2015. a
Kim, J. and Son, S.-W.: Tropical Cold-Point Tropopause: Climatology, Seasonal Cycle, and Intraseasonal Variability Derived from COSMIC GPS Radio Occultation Measurements, J. Climate, 25, 5343–5360, https://doi.org/10.1175/JCLI-D-11-00554.1, 2012. a
Kirk-Davidoff, D. B., Hintsa, E. J., Anderson, J. G., and Keith, D. W.: The effect of climate change on ozone depletion through changes in stratospheric water vapour, Nature, 402, 399–401, https://doi.org/10.1038/46521, 1999. a
Konopka, P., Steinhorst, H.-M., Grooß, J.-U., Günther, G., Müller, R., Elkins, J., Jost, H.-J., Richard, E., Schmidt, U., Toon, G., and McKenna, D.: Mixing and ozone loss in the 1999–2000 Arctic vortex: simulations with the three-dimensional Chemical Lagrangian Model of the Stratosphere (CLaMS), J. Geophys. Res., 109, 2315, https://doi.org/10.1029/2003JD003792, 2004. a
Konopka, P., Ploeger, F., Tao, M., Birner, T., and Riese, M.: Hemispheric asymmetries and seasonality of mean age of air in the lower stratosphere: Deep versus shallow branch of the Brewer-Dobson circulation, J. Atmos. Sci., 120, 2053–2066, https://doi.org/10.1002/2014JD022429, 2015. a
Konopka, P., Ploeger, F., Tao, M., and Riese, M.: Zonally resolved impact of ENSO on the stratospheric circulation and water vapor entry values, J. Geophys. Res.-Atmos., 121, 11486–11501, https://doi.org/10.1002/2015JD024698, 2016. a, b, c, d, e, f
Kunz, A., Müller, R., Homonnai, V., Jánosi, M. I., Hurst, D., Rap, A., Forster, M. P., Rohrer, F., Spelten, N., and Riese, M.: Extending water vapor trend observations over Boulder into the tropopause region: Trend uncertainties and resulting radiative forcing, J. Geophys. Res., 118, 11269–11284, https://doi.org/10.1002/jgrd.50831, 2013. a
Lambert, A., Read, W. G., Livesey, N. J., Santee, M. L., Manney, G. L., Froidevaux, L., Wu, D. L., Schwartz, M. J., Pumphrey, H. C., Jimenez, C., Nedoluha, G. E., Cofield, R. E., Cuddy, D. T., Daffer, W. H., Drouin, B. J., Fuller, R. A., Jarnot, R. F., Knosp, B. W., Pickett, H. M., Perun, V. S., Snyder, W. V., Stek, P. C., Thurstans, R. P., Wagner, P. A., Waters, J. W., Jucks, K. W., Toon, G. C., Stachnik, R. A., Bernath, P. F., Boone, C. D., Walker, K. A., Urban, J., Murtagh, D., Elkins, J. W., and Atlas, E.: Validation of the Aura Microwave Limb Sounder middle atmosphere water vapor and nitrous oxide measurements, J. Geophys. Res.-Atmos., 112, D24S36, https://doi.org/10.1029/2007JD008724, 2007. a
Latif, M. and Keenlyside, N. S.: El Niño/Southern Oscillation response to global warming, P. Natl. Acad. Sci. USA, 106, 20578–20583, https://doi.org/10.1073/pnas.0710860105, 2009. a
le Texier, H., Solomon, S., and Garcia, R. R.: The role of molecular hydrogen and methane oxidation in the water vapour budget of the stratosphere, Q. J. Roy. Meteorol. Soc., 114, 281–295, https://doi.org/10.1002/qj.49711448002, 1988. a
L'Heureux, M. L., Takahashi, K., Watkins, A. B., Barnston, A. G., Becker, E. J., Liberto, T. E. D., Gamble, F., Gottschalck, J., Halpert, M. S., Huang, B., Mosquera-Vásquez, K., and Wittenberg, A. T.: Observing and Predicting the 2015/16 El Niño, B. Am. Meteorol. Soc., 98, 1363–1382, https://doi.org/10.1175/BAMS-D-16-0009.1, 2017. a
Liess, S. and Geller, M. A.: On the relationship between QBO and distribution of tropical deep convection, J. Geophys. Res.-Atmos., 117, D03108, https://doi.org/10.1029/2011JD016317, 2012. a
Lin, P. and Fu, Q.: Changes in various branches of the Brewer–Dobson circulation from an ensemble of chemistry climate models, J. Geophys. Res.-Atmos., 118, 73–84, https://doi.org/10.1029/2012JD018813, 2013. a
Lindzen, R. S. and Holton, J. R.: A Theory of the Quasi-Biennial Oscillation, J. Atmos. Sci., 25, 1095–1107, https://doi.org/10.1175/1520-0469(1968)025<1095:ATOTQB>2.0.CO;2, 1968. a
Livesey, N. J., Filipiak, M. J., Froidevaux, L., Read, W. G., Lambert, A., Santee, M. L., Jiang, J. H., Pumphrey, H. C., Waters, J. W., Cofield, R. E., Cuddy, D. T., Daffer, W. H., Drouin, B. J., Fuller, R. A., Jarnot, R. F., Jiang, Y. B., Knosp, B. W., Li, Q. B., Perun, V. S., Schwartz, M. J., Snyder, W. V., Stek, P. C., Thurstans, R. P., Wagner, P. A., Avery, M., Browell, E. V., Cammas, J.-P., Christensen, L. E., Diskin, G. S., Gao, R.-S., Jost, H.-J., Loewenstein, M., Lopez, J. D., Nedelec, P., Osterman, G. B., Sachse, G. W., and Webster, C. R.: Validation of Aura Microwave Limb Sounder O3 and CO observations in the upper troposphere and lower stratosphere, J. Geophys. Res., 113, 10195–10213, https://doi.org/10.1029/2007JD008805, 2008. a, b
Livesey, N. J., Read, W. G., Wagner, P. A., Froidevaux, L., Lambert, A., Manney, G. L., Millán Valle, L. F., Pumphrey, H. C., Santee, M. L., Schwartz, M. J., Wang, S., Fuller, R. A., Jarnot, R. F., Knosp, B. W., and Martinez, E.: Aura Microwave Limb Sounder (MLS) Version 4.2x Level 2 data quality and description document, Tech. Rep. JPL D-33509 Rev. C, 1–169, https://doi.org/10.5194/acp-15-9945-2015, 2017. a, b
Long, C. S., Fujiwara, M., Davis, S., Mitchell, D. M., and Wright, C. J.: Climatology and interannual variability of dynamic variables in multiple reanalyses evaluated by the SPARC Reanalysis Intercomparison Project (S-RIP), Atmos. Chem. Phys., 17, 14593–14629, https://doi.org/10.5194/acp-17-14593-2017, 2017. a
Lorenz, D. J. and DeWeaver, E. T.: Tropopause height and zonal wind response to global warming in the IPCC scenario integrations, J. Geophys. Res.-Atmos., 112, D10119, https://doi.org/10.1029/2006JD008087, 2007. a
Lossow, S., Hurst, D. F., Rosenlof, K. H., Stiller, G. P., von Clarmann, T., Brinkop, S., Dameris, M., Jöckel, P., Kinnison, D. E., Plieninger, J., Plummer, D. A., Ploeger, F., Read, W. G., Remsberg, E. E., Russell, J. M., and Tao, M.: Trend differences in lower stratospheric water vapour between Boulder and the zonal mean and their role in understanding fundamental observational discrepancies, Atmos. Chem. Phys., 18, 8331–8351, https://doi.org/10.5194/acp-18-8331-2018, 2018. a
Lu, J., Chen, G., and Frierson, D. M. W.: Response of the Zonal Mean Atmospheric Circulation to El Niño versus Global Warming, J. Climate, 21, 5835–5851, https://doi.org/10.1175/2008JCLI2200.1, 2008. a
Manney, G. L. and Lawrence, Z. D.: The major stratospheric final warming in 2016: dispersal of vortex air and termination of Arctic chemical ozone loss, Atmos. Chem. Phys., 16, 15371–15396, https://doi.org/10.5194/acp-16-15371-2016, 2016. a, b, c
Manney, G. L., Froidevaux, L., Waters, J. W., Zurek, R. W., Read, W. G., Elson, L. S., Kumer, J. B., Mergenthaler, J. L., Roche, A. E., O'Neill, A., Harwood, R. S., Mackenzie, I., and Swinbank, R.: Chemical depletion of ozone in the Arctic lower stratosphere during winter 1992–93, Nature, 370, 429–434, https://doi.org/10.1038/370429a0, 1994. a
Manney, G. L., Santee, M. L., Rex, M., Livesey, N. J., Pitts, M. C., Veefkind, P., Nash, E. R., Wohltmann, I., Lehmann, R., Froidevaux, L., Poole, L. R., Schoeberl, M. R., Haffner, D. P., Davies, J., Dorokhov, V., Gernandt, H., Johnson, B., Kivi, R., Kyrö, E., Larsen, N., Levelt, P. F., Makshtas, A., McElroy, C. T., Nakajima, H., Parrondo, M. C., Tarasick, D. W., von der Gathen, P., Walker, K. A., and Zinoviev, N. S.: Unprecedented Arctic ozone loss in 2011, Nature, 370, 469–475, https://doi.org/10.1038/nature10556, 2011. a
McKenna, D., Konopka, P., Grooß, J.-U., Günther, G., Müller, R., Spang, R., Offermann, D., and Orsolini, Y.: A new Chemical Lagrangian Model of the Stratosphere (CLaMS): 1. Formulation of advection and mixing, J. Geophys. Res., 107, 4309, https://doi.org/10.1029/2000JD000114, 2002. a
McLandress, C. and Shepherd, T. G.: Simulated anthropogenic changes in the Brewer-Dobson Circulation, Including Its Extension to High Latitudes, J. Climate, 22, 1516, https://doi.org/10.1175/2008JCLI2679.1, 2009. a
Ming, A., Maycock, A. C., Hitchcock, P., and Haynes, P.: The radiative role of ozone and water vapour in the annual temperature cycle in the tropical tropopause layer, Atmos. Chem. Phys., 17, 5677–5701, https://doi.org/10.5194/acp-17-5677-2017, 2017. a
Mitchell, D. M., Gray, L. J., Fujiwara, M., Hibino, T., Anstey, J. A., Ebisuzaki, W., Harada, Y., Long, C., Misios, S., Stott, P. A., and Tan, D.: Signatures of naturally induced variability in the atmosphere using multiple reanalysis datasets, Q. J. Roy. Meteorol. Soc., 141, 2011–2031, https://doi.org/10.1002/qj.2492, 2015. a
Mote, P. W., Rosenlof, K. H., M. Mclntyre, M. E., Carr, E. S., Gille, J. C., Holton, J. R., Kinnersley, J. S., Pumphrey, H. C., Russell III, J. M., and Waters, J. W.: An atmospheric tape recorder: The imprint of tropical tropopause temperatures on stratospheric water vapor, J. Geophys. Res., 101, 3989–4006, 1996. a
Müller, R., Grooß, J.-U., McKenna, D. S., Crutzen, P. J., Brühl, C., Russell, J. M., and Tuck, A. F.: HALOE observations of the vertical structure of chemical ozone depletion in the Arctic Vortex during winter and early spring 1996–1997, Geophys. Res. Lett., 24, 2717–2720, https://doi.org/10.1029/97GL52834, 1997. a
Nakamura, N.: A New Look at Eddy Diffusivity as a Mixing Diagnostic, J. Atmos. Sci., 58, 3685–3701, https://doi.org/10.1175/1520-0469(2001)058<3685:ANLAED>2.0.CO;2, 2001. a
Nedoluha, G. E., Boyd, I. S., Parrish, A., Gomez, R. M., Allen, D. R., Froidevaux, L., Connor, B. J., and Querel, R. R.: Unusual stratospheric ozone anomalies observed in 22 years of measurements from Lauder, New Zealand, Atmos. Chem. Phys., 15, 6817–6826, https://doi.org/10.5194/acp-15-6817-2015, 2015. a
Neu, J. L., Flury, T., Manney, G. L., Santee, M. L., Livesey, N. J., and Worden, J.: Tropospheric ozone variations governed by changes in stratospheric circulation, Nat. Geosci., 7, 340–344, https://doi.org/10.1038/ngeo2138, 2014. a
Newman, P. A. and Nash, E. R.: Quantifying the wave driving of the stratosphere, J. Geophys. Res.-Atmos., 105, 12485–12497, https://doi.org/10.1029/1999JD901191, 2000. a
Newman, P. A., Coy, L., Pawson, S., and Lait, L. R.: The anomalous change in the QBO in 2015–2016, Geophys. Res. Lett., 43, 8791–8797, https://doi.org/10.1002/2016GL070373, 2016. a, b
Niwano, M., Yamazaki, K., and Shiotani, M.: Seasonal and QBO variations of ascent rate in the tropical lower stratosphere as inferred from UARS HALOE trace gas data, J. Geophys. Res., 108, 4794, https://doi.org/10.1029/2003JD003871, 2003. a
Osprey, S. M., Butchart, N., Knight, J. R., Scaife, A. A., Hamilton, K., Anstey, J. A., Schenzinger, V., and Zhang, C.: An unexpected disruption of the atmospheric quasi-biennial oscillation, Science, 353, 1424–1427, https://doi.org/10.1126/science.aah4156, 2016. a, b, c
Philander, S. G.: El Niño, La Nina, and the Southern Oscillation, Vol. 46 of Academic Press, Cambridge Univ. Press, San Diego, CA, 1990. a
Ploeger, F., Konopka, P., , Günther, G., , Grooß, J.-U., and Müller, R.: Impact of the vertical velocity scheme on modeling transport in the tropical tropopause layer, J. Geophys. Res., 115, D03301, https://doi.org/10.1029/2009JD012023, 2010. a
Ploeger, F., Günther, G., Konopka, P., Fueglistaler, S., Müller, R., Hoppe, C., Kunz, A., Spang, R., Grooß, J.-U., and Riese, M.: Horizontal water vapor transport in the lower stratosphere from subtropics to high latitudes during boreal summer, J. Geophys. Res.-Atmos., 118, 8111–8127, https://doi.org/10.1002/jgrd.50636, 2013. a, b
Plumb, R. A.: Stratospheric transport, J. Meteor. Soc. Japan, 80, 793–809, 2002. a
Plumb, R. A. and Bell, R. C.: A model of the quasi-biennial oscillation on an equatorial beta-plane, Q. J. Roy. Meteorol. Soc., 108, 335–352, https://doi.org/10.1002/qj.49710845604, 1982. a, b
Podglajen, A., Hertzog, A., Plougonven, R., and Zagar, N.: Assessment of the accuracy of (re)analyses in the equatorial lower stratosphere, J. Geophys. Res.-Atmos., 119, 11166–11188, https://doi.org/10.1002/2014JD021849, 2014. a
Poli, P., Healy, S. B., and Dee, D. P.: Assimilation of Global Positioning System radio occultation data in the ECMWF ERA-Interim reanalysis, Q. J. Roy. Meteorol. Soc., 136, 1972–1990, https://doi.org/10.1002/qj.722, 2010. a
Pommrich, R., Müller, R., Grooß, J.-U., Konopka, P., Ploeger, F., B. Vogel, M. T., Hoppe, C. M., Günther, G., Spelten, N., Hoffmann, L., Pumphrey, H.-C., S. Viciani, F. D., Volk, C. M., Hoor, P., Schlager, H., and Riese, M.: Tropical troposphere to stratosphere transport of carbon monoxide and long-lived trace species in the Chemical Lagrangian Model of the Stratosphere (CLaMS), Geosci. Model Dev., 7, 2895–2916, https://doi.org/10.5194/gmd-7-2895-2014, 2014. a
Poshyvailo, L., Müller, R., Konopka, P., Günther, G., Riese, M., Podglajen, A., and Ploeger, F.: Sensitivities of modelled water vapour in the lower stratosphere: temperature uncertainty, effects of horizontal transport and small-scale mixing, Atmos. Chem. Phys., 18, 8505–8527, https://doi.org/10.5194/acp-18-8505-2018, 2018. a
Punge, H. J., Konopka, P., Giorgetta, M. A., and Müller, R.: Effect of the quasi-biennial oscillation on low-latitude transport in the stratosphere derived from trajectory calculations, J. Geophys. Res., 114, D03102, https://doi.org/10.1029/2008JD010518, 2009. a
Randel, W. J. and Jensen, E. J.: Physical processes in the tropical tropopause layer and their roles in a changing climate, Nat. Geosci., 6, 169–176, https://doi.org/10.1038/NGEO1733, 2013. a
Randel, W. J., Wu, F., Oltmans, S. J., Rosenlof, K., and Nedoluha, G. E.: Interannual Changes of Stratospheric Water Vapor and Correlations with Tropical Tropopause Temperatures, J. Atmos. Sci., 61, 2133–2148, https://doi.org/10.1175/1520-0469(2004)061<2133:ICOSWV>2.0.CO;2, 2004. a, b, c
Randel, W. J., Wu, F., Vömel, H., Nedoluha, G. E., and Forster, P.: Decreases in stratospheric water vapor after 2001: Links to changes in the tropical tropopause and the Brewer-Dobson circulation, J. Geophys. Res., 111, 12312, https://doi.org/10.1029/2005JD006744, d12312, 2006. a
Randel, W. J., Park, M., Wu, F., and Livesey, N.: A Large Annual Cycle in Ozone above the Tropical Tropopause Linked to the Brewer Dobson Circulation, J. Atmos. Sci., 64, 4479–4488, https://doi.org/10.1175/2007JAS2409.1, 2007. a, b
Randel, W. J., Garcia, R. R., Calvo, N., and Marsh, D.: ENSO influence on zonal mean temperature and ozone in the tropical lower stratosphere, Geophys. Res. Lett., 36, L15822, https://doi.org/10.1029/2009GL039343, 2009. a, b, c, d, e
Randel, W. J., Park, M., Wu, F., and Livesey, N.: Asian monsoon transport of pollution to the stratosphere, Science, 328, 611–613, https://doi.org/10.1126/science.1182274, 2010. a
Read, W. G., Lambert, A., Bacmeister, J., Cofield, R. E., Christensen, L. E., Cuddy, D. T., Daffer, W. H., Drouin, B. J., Fetzer, E., Froidevaux, L., Fuller, R., Herman, R., Jarnot, R. F., Jiang, J. H., Jiang, Y. B., Kelly, K., Knosp, B. W., Kovalenko, L. J., Livesey, N. J., Liu, H.-C., Manney, G. L., Pickett, H. M., Pumphrey, H. C., Rosenlof, K. H., Sabounchi, X., Santee, M. L., Schwartz, M. J., Snyder, W. V., Stek, P. C., Su, H., Takacs, L. L., Thurstans, R. P., Vömel, H., Wagner, P. A., Waters, J. W., Webster, C. R., Weinstock, E. M., and Wu, D. L.: Aura Microwave Limb Sounder upper tropospheric and lower stratospheric H2O and relative humidity with respect to ice validation, J. Geophys. Res.-Atmos., 112, D24S35, https://doi.org/10.1029/2007JD008752, 2007. a
Riese, M., Ploeger, F., Rap, A., Vogel, B., Konopka, P., Dameris, M., and Forster, P.: Impact of uncertainties in atmospheric mixing on simulated UTLS composition and related radiative effects, J. Geophys. Res., 117, D16305, https://doi.org/10.1029/2012JD017751, 2012. a, b
Rosenlof, K. and Holton, J.: Estimates of the stratospheric residual circulation using the downward control principle, J. Geophys. Res., 98, 10465–10479, 1993. a
Rosenlof, K. H. and Reid, G. C.: Trends in the temperature and water vapor content of the tropical lower stratosphere: Sea surface connection, J. Geophys. Res.-Atmos., 113, D06107, https://doi.org/10.1029/2007JD009109, 2008. a
Santee, M. L., Manney, G. L., Livesey, N. J., Schwartz, M. J., Neu, J. L., and Read, W. G.: A comprehensive overview of the climatological composition of the Asian summer monsoon anticyclone based on 10 years of Aura Microwave Limb Sounder measurements, J. Geophys. Res.-Atmos., 122, 5491–5514, https://doi.org/10.1002/2016JD026408, 2017. a
Saravanan, R.: A Multiwave Model of the Quasi-biennial Oscillation, J. Atmos. Sci., 47, 2465–2474, https://doi.org/10.1175/1520-0469(1990)047<2465:AMMOTQ>2.0.CO;2, 1990. a
Schirber, S.: Influence of ENSO on the QBO: Results from an ensemble of idealized simulations, J. Geophys. Res.-Atmos., 120, 1109–1122, https://doi.org/10.1002/2014JD022460, 2015. a
Schoeberl, M. R. and Dessler, A. E.: Dehydration of the stratosphere, Atmos. Chem. Phys., 11, 8433–8446, https://doi.org/10.5194/acp-11-8433-2011, 2011. a, b
Schoeberl, M. R., Dessler, A. E., and Wang, T.: Simulation of stratospheric water vapor and trends using three reanalyses, Atmos. Chem. Phys., 12, 6475–6487, https://doi.org/10.5194/acp-12-6475-2012, 2012. a
Schwartz, M. J., Read, W. G., Santee, M. L., Livesey, N. J., Froidevaux, L., Lambert, A., and Manney, G. L.: Convectively injected water vapor in the North American summer lowermost stratosphere, Geophys. Res. Lett., 40, 2316–2321, https://doi.org/10.1002/grl.50421, 2013. a
Solomon, S.: Stratospheric ozone depletion: A review of concepts and history, Rev. Geophys., 37, 275–316, https://doi.org/10.1029/1999RG900008, 1999. a, b
Solomon, S., Garcia, R. R., Sherwood, R. F., and Wuebbles, D. J.: On the depletion of Antarctic ozone, Science, 321, 755–758, https://doi.org/10.1038/321755a0, 1986. a
Solomon, S., Rosenlof, K. H., Portmann, R. W., Daniel, J. S. Davis, S. M., Sanford, T., and Plattner, G.-K.: Contributions of Stratospheric Water Vapor to Decadal Changes in the Rate of Global Warming, Science, 327, 1219–1223, https://doi.org/10.1126/science.1182488, 2010. a, b
Taguchi, M.: Observed connection of the stratospheric quasi-biennial oscillation with El Niño–Southern Oscillation in radiosonde data, J. Geophys. Res.-Atmos., 115, D18120, https://doi.org/10.1029/2010JD014325, 2010. a
Tao, M., Konopka, P., Ploeger, F., Riese, M., Müller, R., and Volk, C. M.: Impact of stratospheric major warmings and the quasi-biennial oscillation on the variability of stratospheric water vapor, Geophys. Res. Lett., 42, 4599–4607, https://doi.org/10.1002/2015GL064443, 2015. a, b, c
Timmermann, A., Oberhuber, J., Bacher, A., Esch, M., Latif, M., and Roeckner, E.: El Niño, La Nina, and the Southern Oscillation, Nature, 398, 904–905, https://doi.org/10.1038/19505, 1999. a, b, c
Trepte, C. R. and Hitchman, M. H.: Tropical stratospheric circulation deduced from satellite aerosol data, Nat. Geosci., 355, 626–628, https://doi.org/10.1038/355626a0, 1992. a
Tweedy, O. V., Kramarova, N. A., Strahan, S. E., Newman, P. A., Coy, L., Randel, W. J., Park, M., Waugh, D. W., and Frith, S. M.: Response of trace gases to the disrupted 2015–2016 quasi-biennial oscillation, Atmos. Chem. Phys., 17, 6813–6823, https://doi.org/10.5194/acp-17-6813-2017, 2017. a, b, c, d, e, f, g, h, i
Ueyama, R., Jensen, E. J., Pfister, L., Diskin, G. S., Bui, T. P., and Dean-Day, J. M.: Dehydration in the tropical tropopause layer: A case study for model evaluation using aircraft observations, J. Geophys. Res.-Atmos., 119, 5299–5316, https://doi.org/10.1002/2013JD021381, 2014. a
Urban, J., Lossow, S., Stiller, G., and Read, W.: Another Drop in Water Vapor, Eos, Trans. American Geophys. Union, 95, 245–246, https://doi.org/10.1002/2014EO270001, 2014. a
van Oldenborgh, G. J., Philip, S. Y., and Collins, M.: El Niño in a changing climate: a multi-model study, Ocean Sci., 1, 81–95, https://doi.org/10.5194/os-1-81-2005, 2005. a, b
Vernier, J. P., Thomason, L. W., Pommereau, J. P., Bourassa, A., Pelon, J., Garnier, A., Hauchecorne, A., Trepte, C., Degenstein, D., and Vargas, F.: Major influence of tropical volcanic eruptions on the stratospheric aerosol layer during the last decade, Geophys. Res. Lett., 38, L12807, https://doi.org/10.1029/2011GL047563, 2011. a, b
von Storch, H. and Zwiers, F. W.: Statistical analysis in climate research, Cambridge Unv. Press, 1999. a
Wallace, J. M., Panetta, R. L., and Estberg, J.: Representation of the Equatorial Stratospheric Quasi-Biennial Oscillation in EOF Phase Space, J. Atmos. Sci., 50, 1751–1762, https://doi.org/10.1175/1520-0469(1993)050<1751:ROTESQ>2.0.CO;2, 1993. a
Wang, C., Deser, Y. J.-Y., DiNezio, P., and Clement, A.: El Niño–Southern Oscillation (ENSO): A review, in: Reefs of the Eastern Pacific, Springer Sci. Publish., 85–106, 2016. a
Waters, J. W., Froidevaux, L., Harwood, R. S., Jarnot, R. F., Pickett, H. M., Read, W. G., Siegel, P. H., Cofield, R. E., Filipiak, M. J., Flower, D. A., Holden, J. R., Lau, G. K., Livesey, N. J., Manney, G. L., Pumphrey, H. C., Santee, M. L., Wu, D. L., Cuddy, D. T., Lay, R. R., Loo, M. S., Perun, V. S., Schwartz, M. J., Stek, P. C., Thurstans, R. P., Boyles, M. A., Chandra, K. M., Chavez, M. C., Chen, G.-S., Chudasama, B. V., Dodge, R., Fuller, R. A., Girard, M. A., Jiang, J. H., Jiang, Y., Knosp, B. W., LaBelle, R. C., Lam, J. C., Lee, K. A., Miller, D., Oswald, J. E., Patel, N. C., Pukala, D. M., Quintero, O., Scaff, D. M., Van Snyder, W., Tope, M. C., Wagner, P. A., and Walch, M. J.: The Earth Observing System Microwave Limb Sounder (EOS MLS) on the Aura satellite, IEEE Trans. Geosci. Remote Sens., 122, 1075–1092, https://doi.org/10.1109/TGRS.2006.873771, 2006. a
WMO: Scientific Assessment of Ozone Depletion: 2014, Global ozone research and monitoring project – report no. 55, WMO (World Meteorological Organization), Geneva, 2014. a, b, c
Wolter, K. and Timlin, M. S.: El Nino/Southern Oscillation behaviour since 1871 as diagnosed in an extended multivariate ENSO index (MEI.ext), Int. J. Climatol., 31, 1074–1087, https://doi.org/10.1002/joc.2336, 2011. a
Yuan, W., Geller, M. A., and Love, P. T.: ENSO influence on QBO modulations of the tropical tropopause, Q. J. Roy. Meteorol. Soc., 140, 1670–1676, https://doi.org/10.1002/qj.2247, 2014. a, b
Yulaeva, E., Holton, J. R., and Wallace, J. M.: On the Cause of the Annual Cycle in Tropical Lower-Stratospheric Temperatures, J. Atmos. Sci., 51, 169–174, https://doi.org/10.1175/1520-0469(1994)051<0169:OTCOTA>2.0.CO;2, 1994. a
Zwiers, F. W. and von Storch, H.: Taking Serial Correlation into Account in Tests of the Mean, J. Climate, 8, 336–351, https://doi.org/10.1175/1520-0442(1995)008<0336:TSCIAI>2.0.CO;2, 1995. a
- Abstract
- Introduction
- Puzzling water vapor anomalies in 2015–2016
- Data and methodology
- Anomalous stratospheric circulation in the 2015–2016 boreal winter
- Results
- Discussion
- Summary and conclusions
- Data availability
- Author contributions
- Competing interests
- Special issue statement
- Acknowledgements
- References