the Creative Commons Attribution 4.0 License.
the Creative Commons Attribution 4.0 License.
 | 16 Aug 2018
Exploration of PM2.5 sources on the regional scale in the Pearl River Delta based on ME-2 modeling
Xiao-Feng Huang
Bei-Bing Zou
Ling-Yan He
André S. H. Prévôt
Yuan-Hang Zhang
The Pearl River Delta (PRD) of China, which has a population of more than 58 million people, is one of the largest agglomerations of cities in the world and had severe PM2.5 pollution at the beginning of this century. Due to the implementation of strong pollution control in recent decades, PM2.5 in the PRD has continuously decreased to relatively lower levels in China. To comprehensively understand the current PM2.5 sources in the PRD to support future air pollution control strategies in similar regions, we performed regional-scale PM2.5 field observations coupled with a state-of-the-art source apportionment model at six sites in four seasons in 2015. The regional annual average PM2.5 concentration based on the 4-month sampling was determined to be 37 µg m−3, which is still more than 3 times the WHO standard, with organic matter (36.9 %) and (23.6 %) as the most abundant species. A novel multilinear engine (ME-2) model was first applied to a comprehensive PM2.5 chemical dataset to perform source apportionment with predetermined constraints, producing more environmentally meaningful results compared to those obtained using traditional positive matrix factorization (PMF) modeling. The regional annual average PM2.5 source structure in the PRD was retrieved to be secondary sulfate (21 %), vehicle emissions (14 %), industrial emissions (13 %), secondary nitrate (11 %), biomass burning (11 %), secondary organic aerosol (SOA, 7 %), coal burning (6 %), fugitive dust (5 %), ship emissions (3 %) and aged sea salt (2 %). Analyzing the spatial distribution of PM2.5 sources under different weather conditions clearly identified the central PRD area as the key emission area for SO2, NOx, coal burning, biomass burning, industrial emissions and vehicle emissions. It was further estimated that under the polluted northerly air flow in winter, local emissions in the central PRD area accounted for approximately 45 % of the total PM2.5, with secondary nitrate and biomass burning being most abundant; in contrast, the regional transport from outside the PRD accounted for more than half of PM2.5, with secondary sulfate representing the most abundant transported species.
- Article
(9507 KB) - Full-text XML
-
Supplement
(3992 KB) - BibTeX
- EndNote


With China's rapid economic growth and urbanization, air pollution has become a serious problem in recent decades. Due to its smaller size, fine particulate matter (PM2.5) can carry toxic chemicals into human lungs and bronchi, causing respiratory diseases and cardiovascular diseases that can harm human health (Sarnat et al., 2008; Burnett et al., 2014). In particular, long-term exposure to high concentrations of fine particulate matter can also lead to premature death (Lelieveld et al., 2015). The Chinese government has attached great importance to improving air quality and issued the “Air Pollution Prevention and Control Action Plan” in September 2013, clearly requiring the concentration levels of fine particulate matter in a few key regions, including the Pearl River Delta (PRD), to drop by 2017 from 15 % to 25 % of their values in 2012. The PRD is one of the fastest-growing regions in China and the largest urban agglomeration in the world; it includes the cities of Guangzhou, Shenzhen, Zhuhai, Dongguan, Foshan, Huizhou, Zhongshan, Zhaoqing, and Jiangmen and contains more than 58 million people. The PM2.5 concentration in this region reached a high level of 58 µg m−3 in 2007 (Nanfang Daily, 2016); however, the air quality has significantly improved due to the implementation of strict air pollution control measures, which were implemented earlier here than in other regions in China. The annual average concentration of PM2.5 in the PRD dropped to 34 µg m−3 in 2015 (Ministry of Environmental Protection, 2016).
In recent years, the receptor model method (commonly, positive matrix factorization, PMF) in the PRD was applied to perform the source apportionment of PM2.5, which was carried out in several major cities, including Guangzhou (Gao et al., 2013; Liu et al., 2014; Wang et al., 2016), Shenzhen (X. F. Huang et al., 2014), Dongguan (Wang et al., 2015; Zou et al., 2017) and Foshan (Tan et al., 2016). However, the above source apportionment studies only focused on part of PM2.5 (e.g., organic matter) or a single city in the PRD (e.g., Shenzhen and Dongguan), lacking the extensive representation of the PRD region in terms of simultaneous sampling in multiple cities. Since the lifetime of PM2.5 in the surface layer of the atmosphere is days to weeks and the cities in the PRD are closely linked, the transport of PM2.5 between cities is specifically noteworthy (Hagler et al., 2006). Conversely, although the PMF model has been successfully applied to source apportionment in the PRD, the apportionment with PMF has high rotational ambiguity and can output non-meaningful or mixed factors. Under such conditions, the multilinear engine (ME-2) model can guide the rotation toward a more objective optimal solution by utilizing a priori information (i.e., predetermined factor profiles). In recent years, ME-2, initiated and controlled via the Source Finder (SoFi) written by the Paul Scherrer Institute, was successfully developed to apportion the sources of organic aerosols (Canonaco et al., 2013). The novel ME-2 model has become a widely used and successful source analysis technique (e.g., Crippa et al., 2014; Fröhlich et al., 2015; Visser et al., 2015; Elser et al., 2016; Reyes-Villegas et al., 2016). The key challenges in running ME-2 are the construction of the appropriate constraint source profiles and the determination of factor numbers, and PMF could serve as the first step when using ME-2 for the determination of the a priori information needed.
Accurately understanding the regional characteristics of PM2.5 sources in the PRD can certainly guide the regional joint prevention and control of PM2.5 in this region and provide useful references for future air pollution control strategies in China. Thus, in this study, the PM2.5 mass and chemical compositions were measured during four seasons in 2015 at six sites in the PRD, which basically represent the pollution level of the PRD on a regional scale rather than on a city scale. For the first time, the novel ME-2 model via the SoFi was applied to a comprehensive chemical dataset (including elemental carbon (EC), organic mass (OM), inorganic ions and metal elements) to identify the sources of bulk PM2.5 on the regional scale of the PRD; then, the spatial locations of the sources were systematically explored using the analysis of weather conditions.
2.1 Sampling and chemical analysis
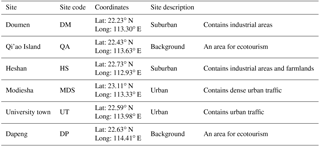
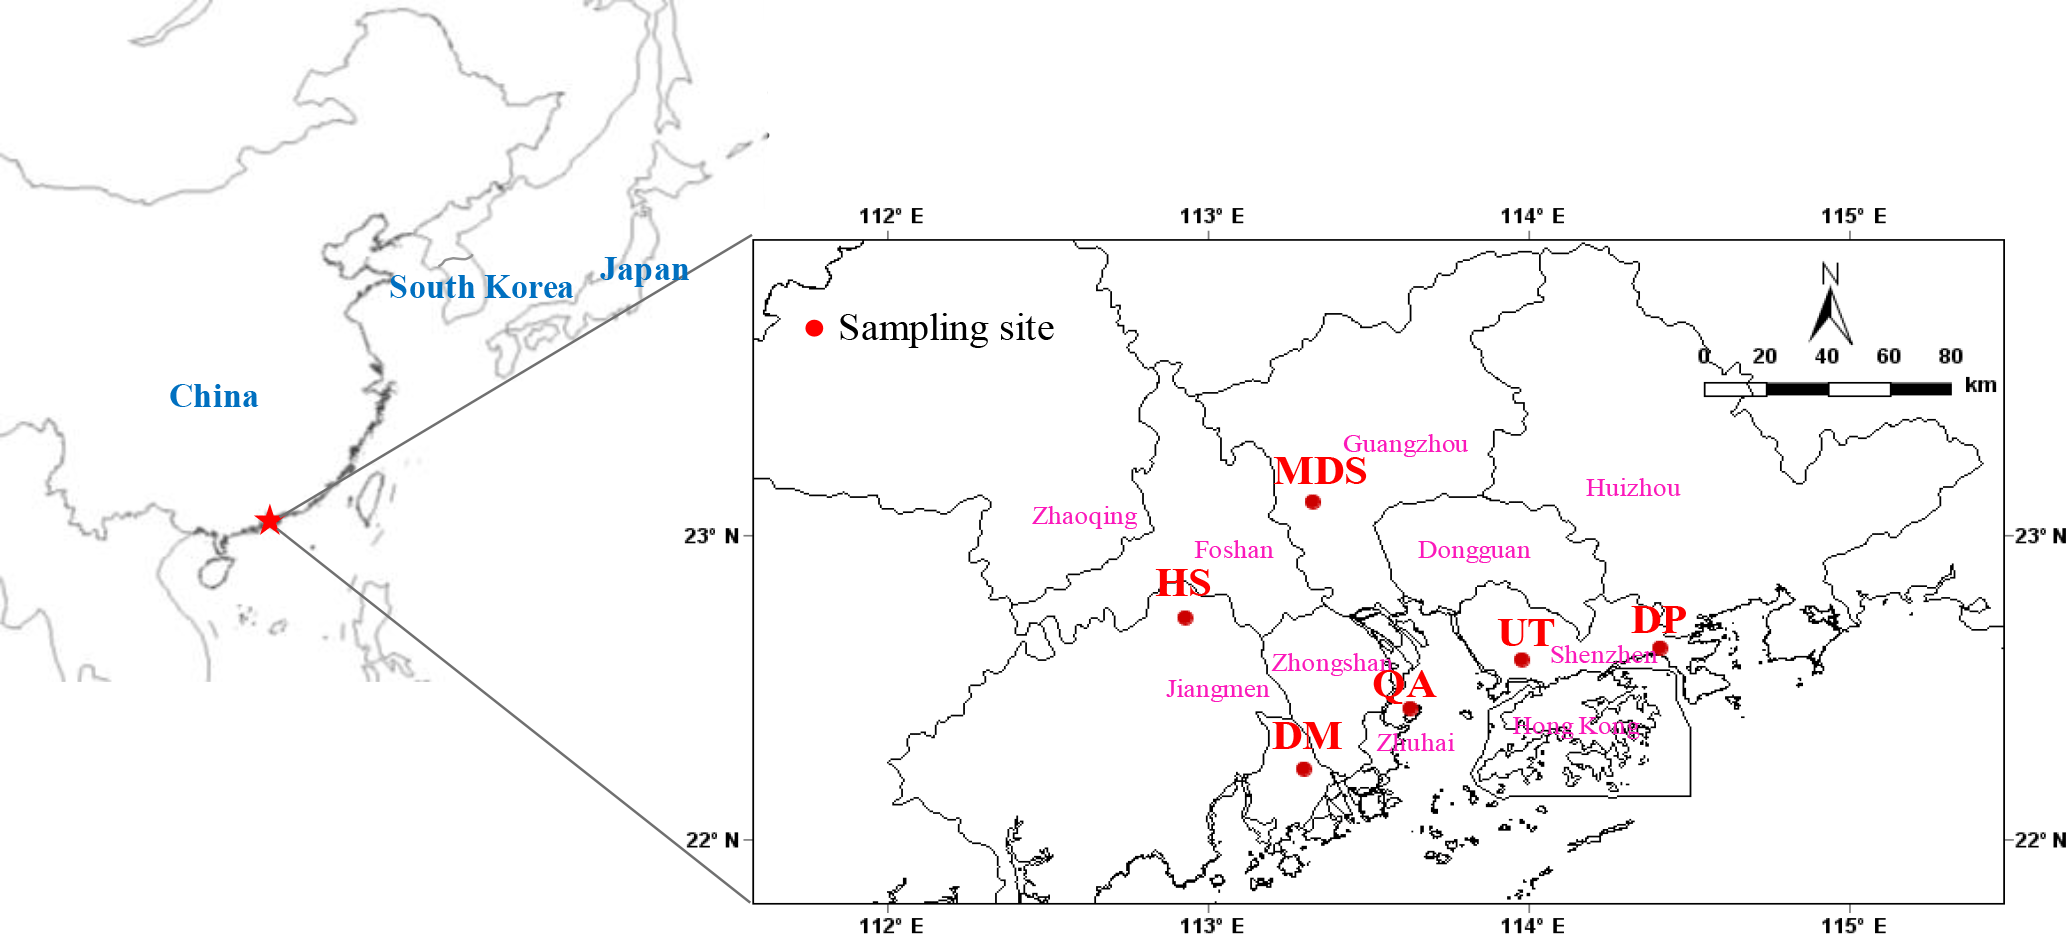
The PRD is located in south central Guangdong Province. Based on the layout of the cities in the PRD, six sampling sites were selected to represent urban, suburban, and background sites. Detailed descriptions of these sampling sites are listed in Table 1, and their locations are shown on the regional map in Fig. 1.
Samples were collected every other day during a 1-month-long period for each season in 2015, and Table 2 contains the detailed sampling information for reference. Each sampling period lasted for 24 h at each site. The sampling sites of University Town (UT) and Dapeng (DP) used Thermo 2300 PM2.5 samplers (Thermo Fisher Scientific Inc., Waltham, Massachusetts, USA, with a flow rate of 16.7 L min−1 for two channels and a flow rate of 10.0 L min−1 for the other two channels), while those in Modiesha (MDS), Heshan (HS), Qi'ao Island (QA) and Doumen (DM) used TH-16A PM2.5 samplers (Tianhong Corp., Wuhan, China, with a flow rate of 16.7 L min−1 for four channels). Prior to the sampling campaigns, the six instruments sampled in parallel three times, and each time lasted for 12 h. The standard deviation of the PM2.5 mass concentrations obtained by the six samplers in each parallel sampling was within 5 %. The all sample boxes were then sealed with Parafilm, stored in an ice-packed cooler during transportation, and stored under freezing temperatures before analysis. A total of 362 valid samples (15–16 samples at each site for each season) were collected in this study. In addition, to track the possible contamination caused by the sampling treatment, a field blank sample was collected at each site for each season. The PM2.5 mass can be obtained based on the difference in the weight of the Teflon filter before and after sampling in a clean room at conditions of 20 ∘C and 50 % relative humidity, according to the Quality Assurance and Quality Control procedures of the National Environmental Protection Standard (NEPS; MEE, 2013b). The Teflon filters were analyzed for their major ion contents (, , and Cl−) via an ion chromatography system (ICS-2500, Dionex; Sunnyvale, California, USA), following the guidelines of NEPS (MEE, 2016a, b). The metal element contents (23 species) were analyzed via an inductively coupled plasma mass spectrometer (ICP-MS, auroraM90; Bruker, Germany), also following the guidelines of NEPS (MEE, 2013a). The Quartz filters were analyzed for organic carbon (OC) and EC contents using an OC–EC analyzer (2001A, Desert Research Institute, Reno, Nevada, USA), following the IMPROVE protocol (Chow et al., 1993). The overall OM was estimated as 1.8× OC. In a previous aerosol mass spectrometer (AMS) measurement for PM1, the OM ∕ OC ratio was measured to be 1.6 for an urban atmosphere (He et al., 2011) and 1.8 for a rural atmosphere (Huang et al., 2011). We adopted a uniform OM ∕ OC ratio of 1.8 in this study because it is assumed that the mass difference between PM1 and PM2.5 may mostly contain aged regional aerosol with higher OM ∕ OC.
2.2 Meteorological conditions and weather classification
The meteorological conditions during the observation period, shown in Table 2, indicated that the PRD region experienced a hot and humid summer and a cool and dry winter, while spring and fall were two transition seasons. Furthermore, the back trajectories of the air masses obtained using the NOAA HYSPLIT model (Fig. S1 in the Supplement) revealed that the air masses originated from the northern inland in winter, from the northern inland and the South China Sea in spring, from the South China Sea in summer, and from the northeast coast and the northern inland in fall.
Table 2General meteorological conditions during the observation period in the PRD.
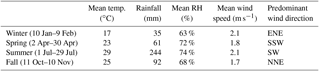
Table 3Sampling days categorized as southerly flow and northerly flow days.
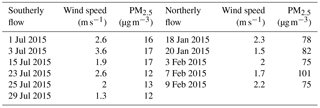
Changes in meteorological conditions with the seasons have significant influences on the air quality in the PRD (Hagler et al., 2006). The same type of weather is often repeated. Physick and Goudey (2001) classified the weather over the region surrounding Hong Kong into seven categories based on surface pressure patterns, i.e., as northerly (winter monsoon), northeasterly (winter monsoon), easterly or southeasterly, trough, southerly or southwesterly (summer monsoon), and cyclonic 1 and cyclonic 2 weather types. The PRD region, including Hong Kong, has nearly similar weather patterns and similar meteorological conditions. In this study, the daily weather types during the observation period (excluding rainy days) were also classified into seven categories based on surface pressure patterns. However, according to the surface horizontal wind vectors, the PRD was mostly impacted by two types of airflow, i.e., southerly flow and northerly flow. Southerly flow, including the southeasterly and southerly or southwesterly (summer monsoon) weather types, was relatively clean and originated from the ocean (e.g., Figs. S2 and S4). Northerly flow, including the northerly (winter monsoon) and northeasterly (winter monsoon) weather types, was relatively polluted and originated from the north mainland (e.g., Figs. S3 and S5). Southerly flow and northerly flow appeared with the highest frequency in the PRD (i.e., above 80 %), followed by cyclone (10 %), easterly (2 %) and trough (2 %). In this study, southerly flow days (PM2.5 ≤17 µg m−3; see Table 3) were selected to better reflect the local source regions in the PRD, and northerly flow days (PM2.5 ≥ 75 µg m−3; see Table 3) were selected to better understand the pollution accumulation process and regional transport characteristics of pollutants in the PRD. The sampling days for southerly flow and northerly flow are listed in Table 3.
2.3 Input data matrices for source apportionment modeling
PMF is a multivariate factor analysis tool widely used for aerosol source apportionment. The PMF algorithm groups the measured matrix X (Eq. 1) into two nonnegative constant matrices G (factor time series) and F (factor profiles), and E denotes the model residuals (Paatero and Tapper, 1994). The entries in G and F are fitted using a least-squares algorithm that iteratively minimizes the object function Q in Eq. (2), where eij are the elements of the residual matrix E, and uij are the errors/uncertainties of the measured species xij.
The multilinear engine (ME-2) was later developed by Paatero (1999) based on the PMF algorithm. In contrast to an unconstrained PMF analysis, ME-2 can utilize the constraints (i.e., predetermined factor profiles) provided by the user to enhance the control of rotation for a more objective solution. One or more factor profiles can be expediently input into ME-2, and the output profiles are allowed to vary from the input profiles to some extent. When using ME-2 modeling, the mixed factors can usually be better resolved.
In this study, both PMF and ME-2 models were run for the datasets observed in the PRD. We first need to determine the species input into the models. Species that may lead to high species residuals or lower R2 values between measured and model-predicted or non-meaningful factors, such as those that fulfilled the following criteria, were not included: (1) species that were below detection in more than 40 % of samples, (2) species that yielded R2 values of less than 0.4 in interspecies correlation analysis, and (3) species that had little implication for pollution sources and lower concentrations. Therefore, 18 species were input into the models; these species accounted for 99.6 % of the total measured species and included OM, EC, , , , Cl−, K, Ca, Na, Mg, Al, Zn, Fe, Cd, V, Ni, Ti and Pb.
The application of PMF or ME-2 also depends on the estimated realistic uncertainty (uij) of the individual data point of an input matrix, which determines the Q value in Eq. (2). Therefore, the estimation of uncertainty is an important component of the application of these models. There are many sources of uncertainty, including sampling, handling, transport, storage, preparation and testing (Leiva et al., 2012). In this study, the sources of uncertainty that contributed little to the total uncertainty could be neglected, such as replacing filters, sample transport and sample storage under strict quality assurance and quality control. Therefore, we first considered the uncertainties introduced by sampling and analysis processes, such as sampling volume, repeatability analysis and ion extraction. The species uncertainties uij are estimated using Eq. (3), where is the error fraction of the species, which is estimated using the relative combined error formula Eq. (4) (BIPM et al., 2008).
where is the relative error of the sampling volume, is the relative error of the repeatability analysis of the standard species, and is the relative error of the ion extraction of multiple samples. When the concentration of the species is below the detection limit (DL), the concentration values were replaced by 1∕2 of the DL, and the corresponding uncertainties were set at 5∕6 of the DL. Missing values were replaced by the geometric mean of the species with corresponding uncertainties of 4 times their geometric mean (Polissar et al., 1998). The uncertainties of , and all metal elements, which have scaled residuals larger than ±3 due to the small analytical uncertainties, need to be increased to reduce their weights in the solution (Norris and Duvall, 2014). In addition, the uncertainties of EC caused by pyrolyzed carbon (PC) and the uncertainties of OM, and Cl− due to semi-volatility under high ambient temperatures should also be taken into account (Cao et al., 2018). In this study, more reasonable source profiles can be obtained when further increasing the estimated uncertainties () of all species by a factor of 2.
2.4 Constraint setup in ME-2 modeling
In this study, the U.S. EPA PMF v5.0 was applied with the concentration matrix and uncertainties matrix described above to identify the PM2.5 sources. After examining a range of factor numbers from 3 to 12, the nine-factor solution output by the PMF base run (Qtrue / Qexp=2.5) was found to be the optimal solution, with the scaled residuals approximately symmetrically distributed between −3 and +3 (Fig. S6) and the most interpretable factor profiles (Fig. S7). The model-input total mass of the 18 species and the model-reconstructed total mass of all the factors showed a high correlation (R2=0.97, slope =1.01) (Fig. S8). The factor of biomass burning was not extracted in the eight-factor solution, while the factor of fugitive dust was separated into two non-meaningful factors when more factors were set to run PMF. For the nine-factor solution of secondary sulfate-rich aerosol, secondary nitrate-rich aerosol, aged sea salt, fugitive dust, biomass burning, vehicle emissions, coal burning, industrial emissions and ship emissions, the source judgment based on tracers for each factor was identical to that of the ME-2 results detailed in Sect. 3.2. However, in Fig. S7, some factors seemed to be mixed by some unexpected components and were thus overestimated. For example, the secondary sulfate-rich and secondary nitrate-rich factors of PMF had certain species from primary particulates, such as EC, Zn, Al, K and Fe, among which EC had obvious percentage explained variation (EV) values, i.e., the percent of a species apportioned to the factor, of 18.7 % and 9.7 %; the EV value of OM in the sea salt factor (which was theoretically negligible) had a high value of 6.4 %, and OM accounted for 37 % of the total mass of this factor; the EV value of in the fugitive dust factor (which was theoretically negligible) had a high value of 8.6 %, and the concentration accounted for 26 % of the total mass of this factor.
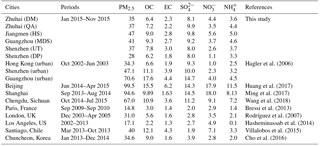
Table 5The comparison of the major chemical compositions of PM2.5 in typical cities (unit: µg m−3).
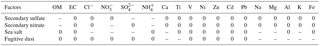
SoFi is a user-friendly interface developed by PSI for initiating and controlling ME-2 (Canonaco et al., 2013), and it can conveniently constrain multiple factor profiles. Although the U.S. EPA PMF v5.0 can also use some a priori information (such as the ratio of elements in factor) to control the rotation after the base run, it is not able to use multiple constrained factor profiles to control the rotation (Norris and Duvall, 2014). Therefore, SoFi is a more convenient and powerful tool to establish various constrained factors for source apportionment modeling. Using the same species concentration matrix and uncertainties matrix, we ran the ME-2 model via SoFi for 9–12 factors with the four factors constrained as described above, as shown in Table 4. The following considerations were used. Secondary sulfate and secondary nitrate factors should theoretically not contain species from primary particulates, but they may contain secondary organic matter related to the secondary conversion process of SO2 and NOx (He et al., 2011; Z. B. Yuan et al., 2006; X. F. Huang et al., 2014). Therefore, the contributions of the species from primary particulates were constrained to zero in the input secondary aerosol factors, while others were not constrained. In addition, the factors of sea salt and fugitive dust in primary aerosols could be understood based on the abundance of species in seawater and the upper crust (Mason, 1982; Taylor and Mclennan, 1995). As seen in Table S1 in the Supplement, the abundances of Cl−, Na+, , Mg2+, Ca2+ and K+ in sea salt were relatively high, as were the abundances of Al, Fe, Ca, Na, K, Mg and Ti in fugitive dust. Therefore, these high-abundance species were not constrained in the sea salt and fugitive dust factors, while the other species (with abundances of less than 0.1 % in the particulates) were constrained to zero (Table 4). In addition, HNO3 might react with sea salt to displace Cl− (Huang et al., 2006); thus, was also not constrained in the sea salt factor.
3.1 Spatiotemporal variations in PM2.5 in the PRD
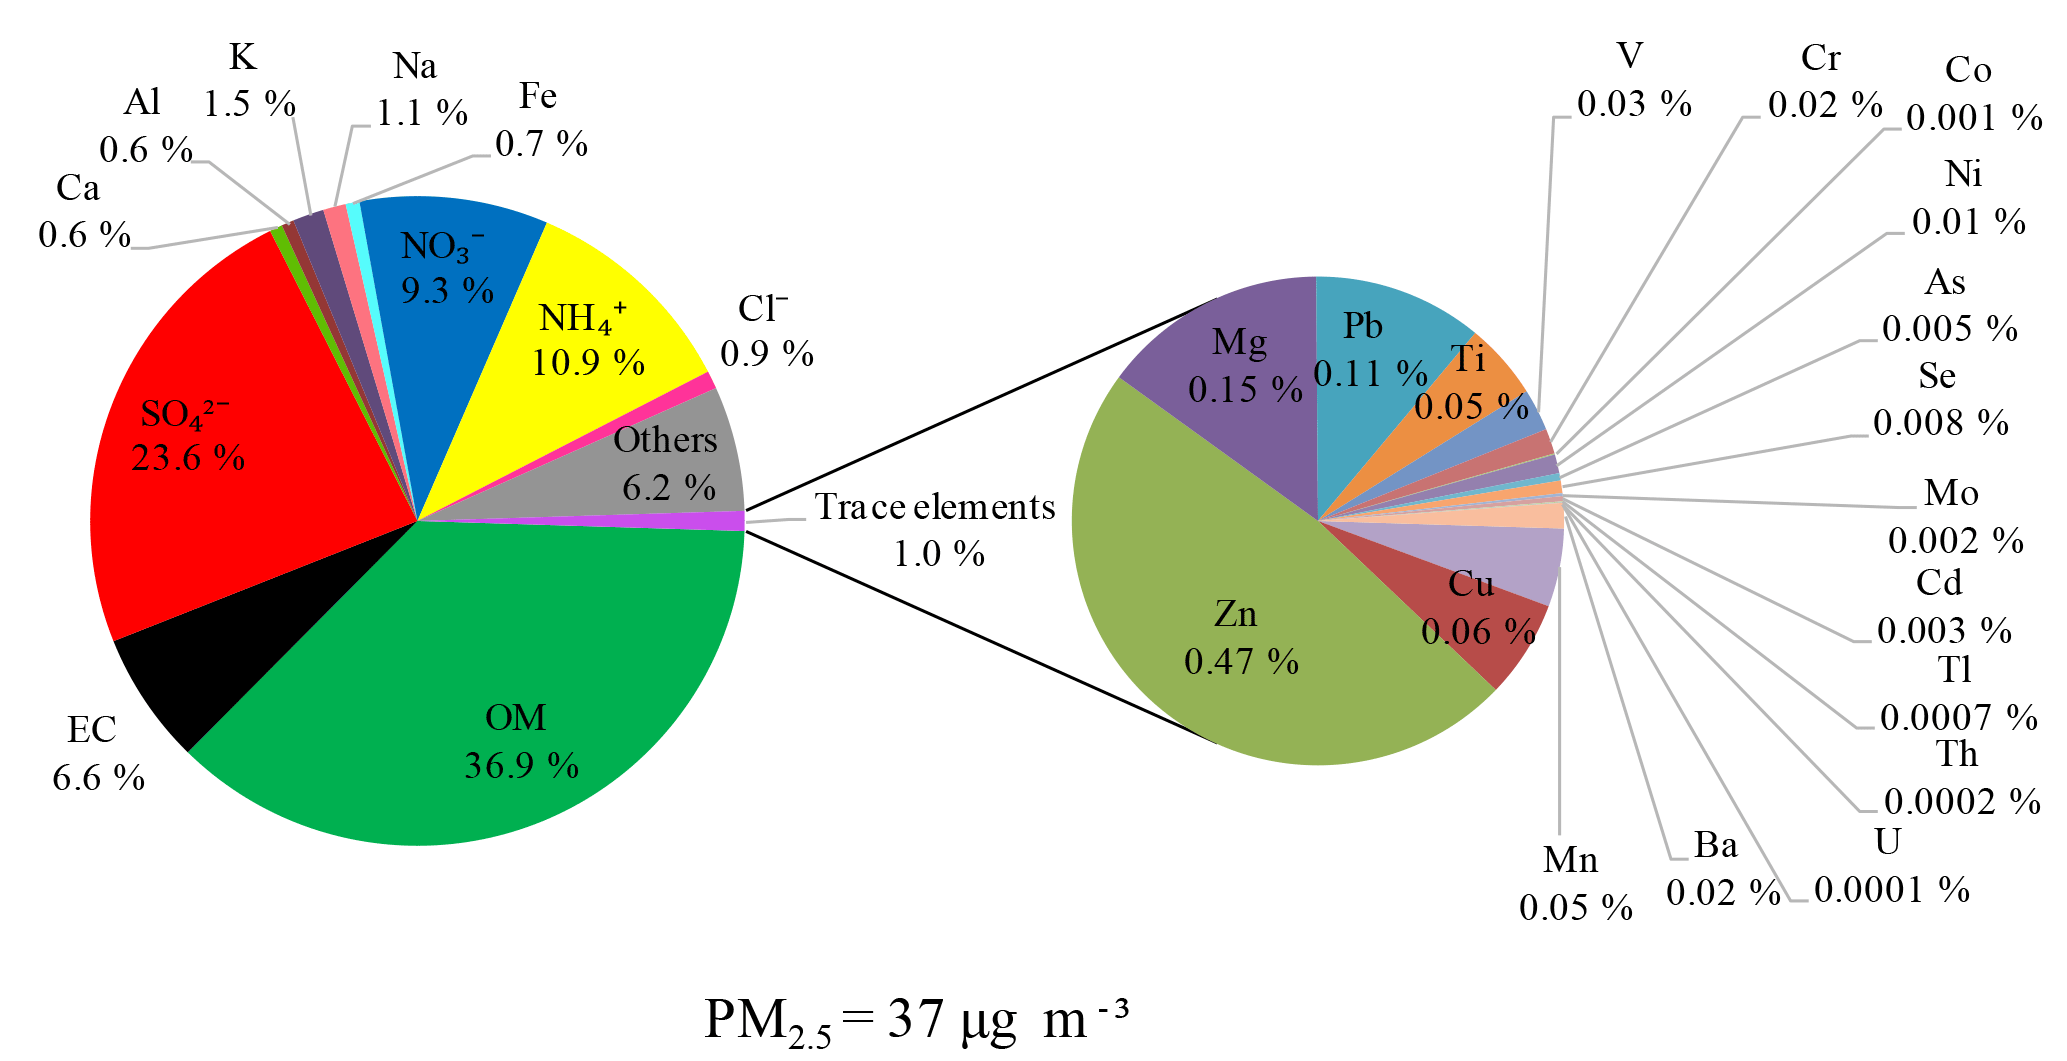
The 4-month average PM2.5 concentration for all six sites in the PRD was 37 µg m−3, which was slightly higher than the Grade II national standards for air quality (with an annual mean of 35 µg m−3). The chemical compositions of PM2.5 in the PRD are shown in Fig. 2. OM had the highest contribution of 36.9 %, suggesting severe organic pollution in the PRD. Other important components included (23.6 %), (10.9 %), (9.3 %), EC (6.6 %) and Cl− (0.9 %). The major metallic components included K (1.5 %), Na (1.1 %), Fe (0.7 %), Al (0.6 %), and Ca (0.6 %), and trace elements accounted for 1.0 %. Figure 3a shows the spatial distribution of the PM2.5 and chemical components among the six sites. The PM2.5 pollution level in the PRD was distinctly higher in the northwestern hinterland (HS and MDS) and lower in the southern coastal areas (DM and DP). The DP background site had little local emissions and was hardly influenced by the emissions from the PRD under both southerly flow and northerly flow. Thus, DP air pollution reflects the large-scale regional air pollution. The average PM2.5 concentration at DP was as high as 28 µg m−3, indicating that the PRD had a large amount of air pollution transported from outside this region. At the background DP site, the fractions of Cl− and in PM2.5 were the lowest of the six sites, i.e., 0.3 % and 3.9 %, respectively, suggesting that they had dominantly local sources in the PRD. The highest concentration level of PM2.5 was observed at HS (suburban), which was influenced by the pollution transport of Foshan (industrial city) and Guangzhou (metropolis) under the northeastern wind, which is the most frequent wind in the PRD. The back trajectories of the air masses (Fig. S1) show that the northern monsoon prevails in winter and the southern monsoon prevails in summer in the PRD. Under the winter monsoon, the air masses mostly came from inland and carried higher concentrations of air pollutants. However, under the summer monsoon, the air masses largely originated from the South China Sea and were clean. In addition, the frequent rainfall and higher planetary boundary layer (PBL) in summer in the PRD also favored the dispersion and removal of air pollutants (X. F. Huang et al., 2014). Figure 3b shows that the normalized seasonal variations in the major components in PM2.5 in the PRD were evidently higher in winter and lower in summer, which is consistent with the seasonal variations in the monsoon and other meteorological factors as mentioned above.
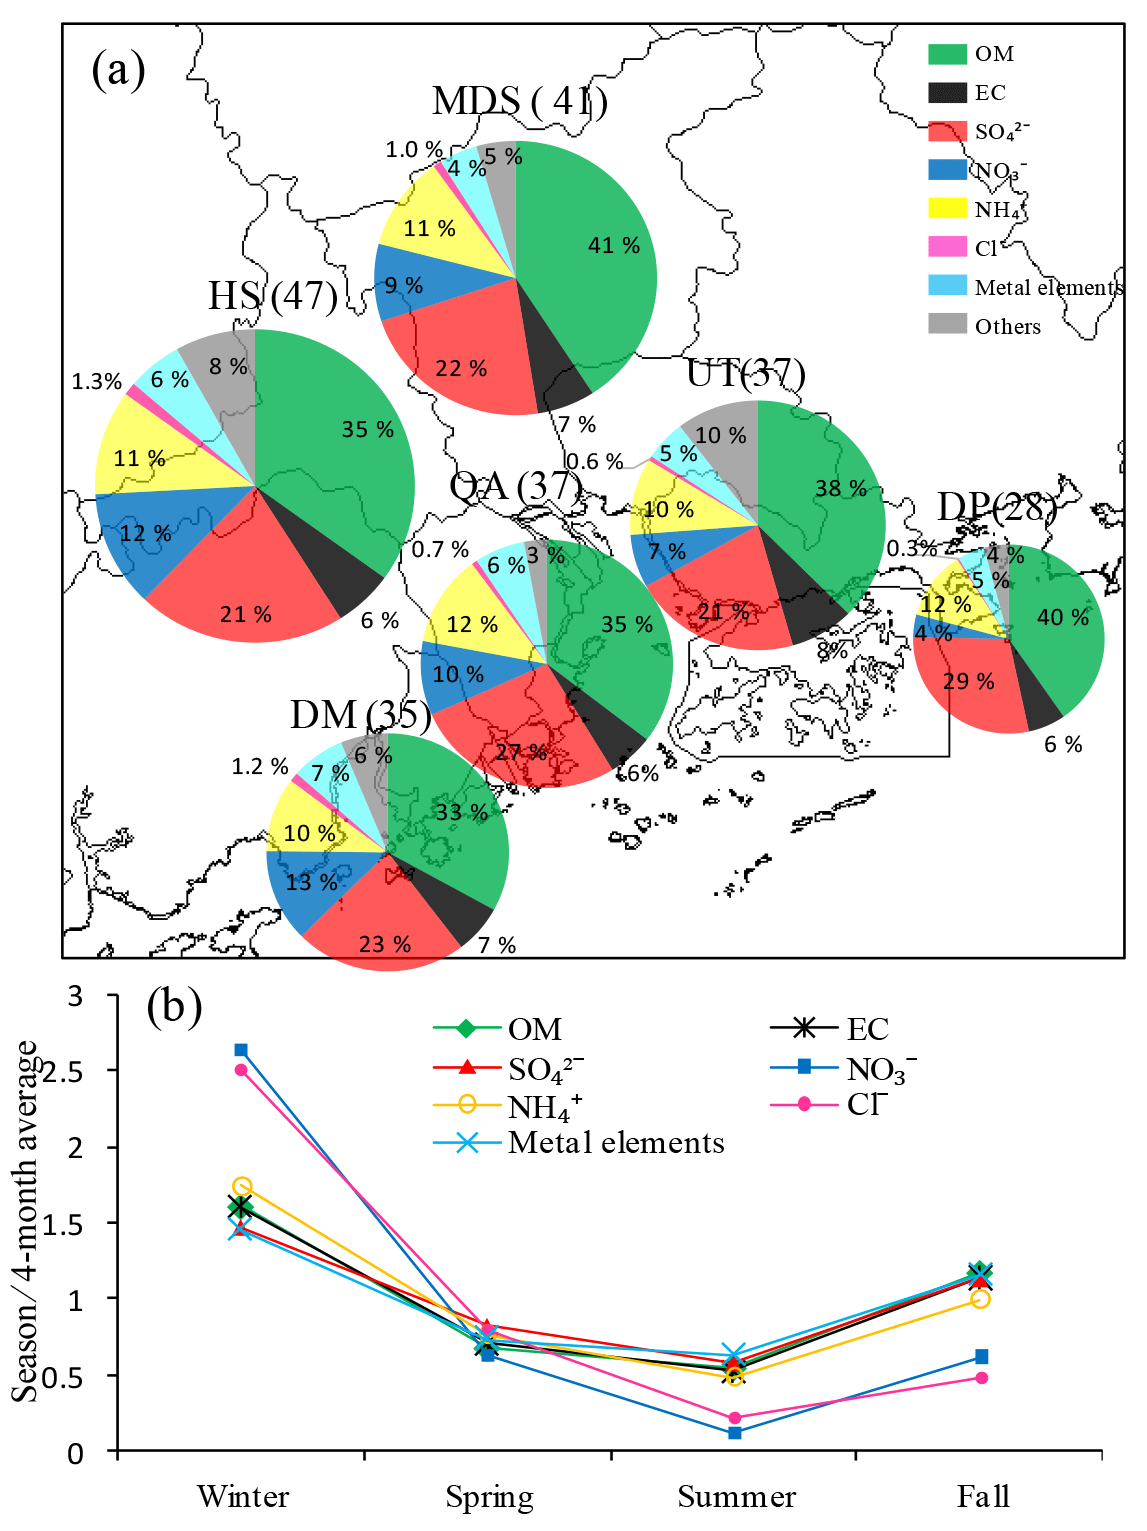
Figure 3The spatial distributions of (a) and seasonal variations in (b) the PM2.5 chemical compositions in the PRD. Sizes of the pie charts indicate the concentrations of PM2.5 at the six sites, with the detailed numbers (unit: µg m−3) in brackets.
Table 6Comparison of the results of source apportionment of PM2.5 in the PRD.
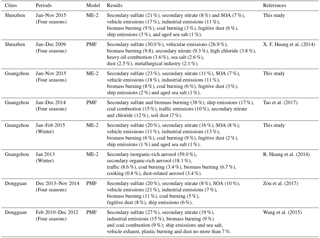
Table 5 summarizes some previous studies that used similar filter-sampling and analytical methods to allow for a better comparison with this study. In 2002–2003, Hagler et al. (2006) also conducted observations and analysis of PM2.5 in the PRD and Hong Kong region, nearly 12 years before this study, as shown in Table 5. Compared with Hagler's results, the PM2.5 concentrations in this study decreased by 42 % in Guangzhou (MDS) and 21 % in Shenzhen (UT), especially OC, EC and , which decreased significantly by 20 %–47 %, indicating that the measures taken to desulfurize coal-fired power plants, improve the fuel standards of motor vehicles, and phase-out older and more polluting vehicles have played important roles in improving the air quality in the PRD region (People's Government of Guangdong Province, 2012). Compared with the PM2.5 concentrations reported by other cities in China in recent years, the PM2.5 concentrations in urban Guangzhou and Shenzhen in this study were 39 %–63 % lower than those in Beijing (Huang et al., 2017) in northern China, Shanghai (Ming et al., 2017) in eastern China, and Chengdu (Wang et al., 2018) in western China. However, the PM2.5 concentrations in urban Guangzhou and Shenzhen observed in this study were clearly higher than those in famous megacities in developed countries, such as Paris (Bressi et al., 2013), London (Rodríguez et al., 2007) and Los Angeles (Hasheminassab et al., 2014), while they were similar to those of Santiago (Villalobos et al., 2015) and Chuncheon (Cho et al., 2016). It should be highlighted that the higher concentration of in the urban atmosphere of the PRD is one of the major reasons leading to the higher degree of PM2.5 pollution in the PRD compared to that in developed cities.
3.2 Source apportionment of PM2.5 using ME-2
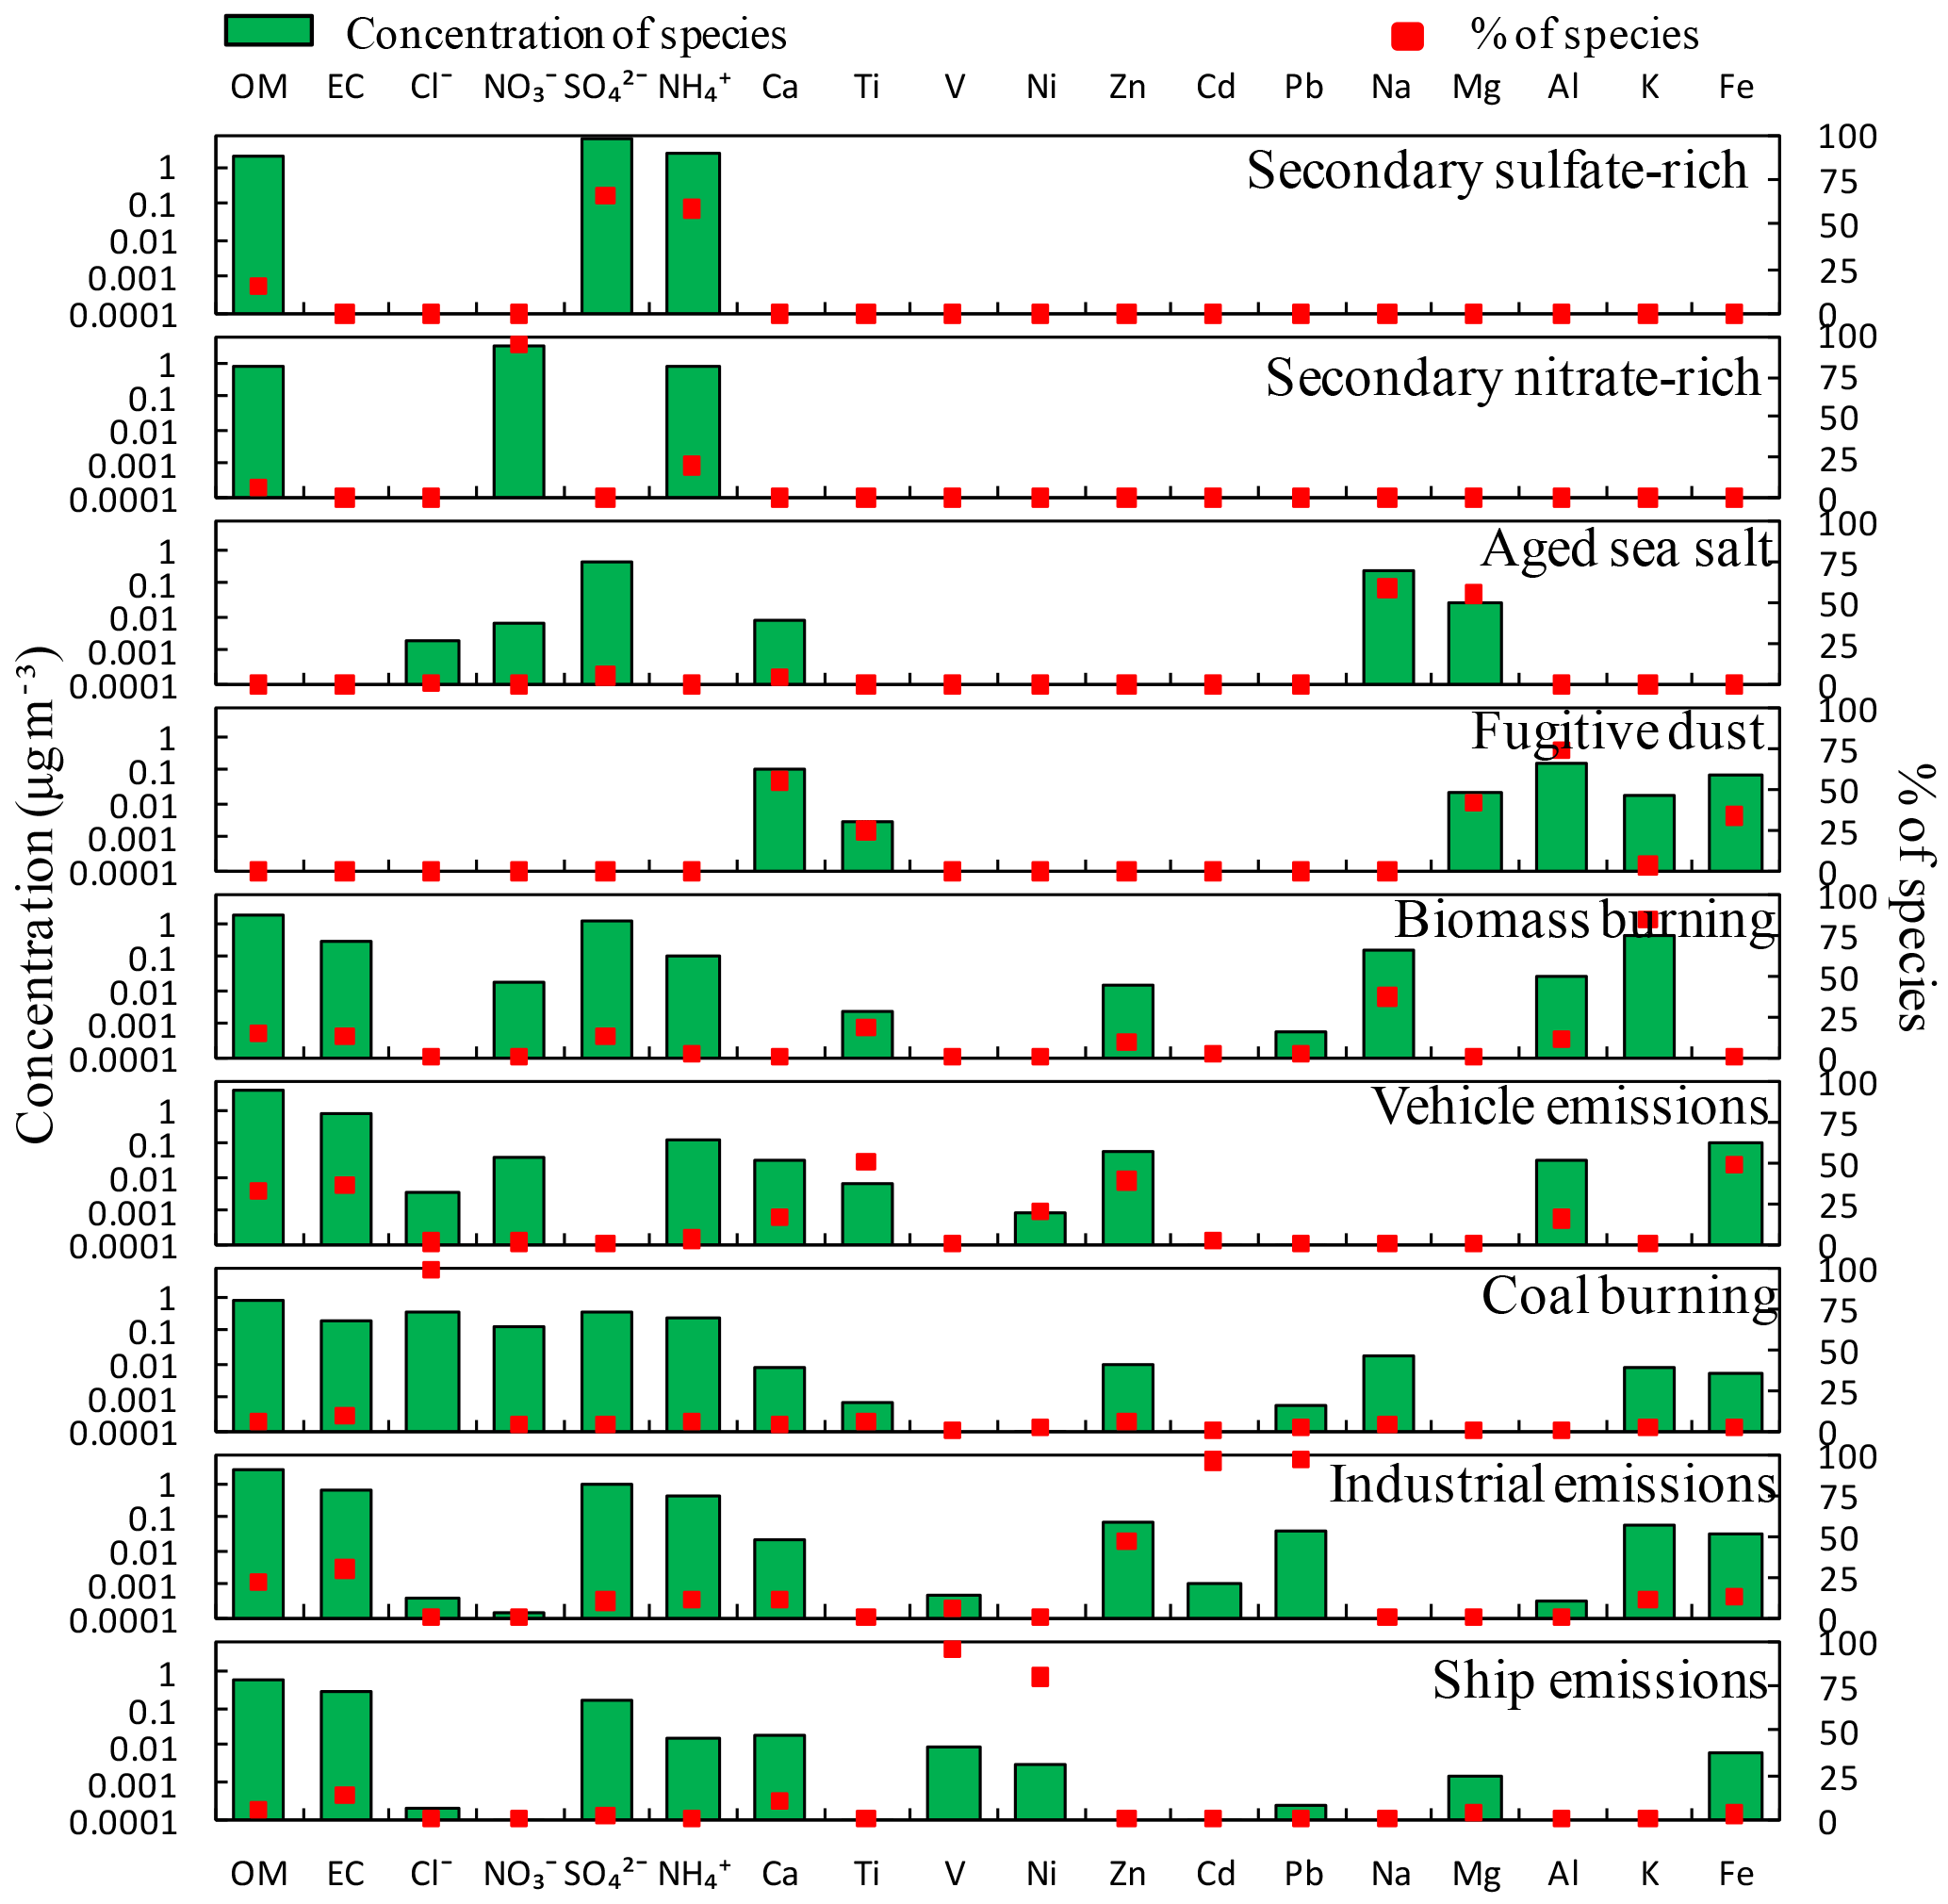
The solutions of 9–12 factors of the ME-2 were modeled with the four factors constrained in Table 4, using the SoFi tool, an implementation of ME-2 (Canonaco et al., 2013). Again, the nine-factor solution provided the most reasonable source profiles since uninterpretable factors were produced (e.g., a high Ti factor) when more factors were set to run ME-2. Based on the EV and the contributed concentrations of species in each factor shown in Fig. 4, the sources of PM2.5 can be judged as follows: (1) the first factor was explained as secondary sulfate rich, which had large EV values of and . (2) The second factor was explained as secondary nitrate rich, which had significant EV values of and . (3) The third factor was related to sea salt due to the large EV values and concentrations of Na and Mg. However, the low Cl− concentration and high concentration implied that replaced Cl− during the sea salt aging process. Therefore, this factor was identified as aged sea salt (Z. Yuan et al., 2006). (4) The fourth factor was identified as fugitive dust due to its significant EV values of Al, Ca, Mg and Fe. In this study, the undetermined mass of O and Si in this factor was compensated for using the elemental abundance in dust particles in Table S1 (Taylor and Mclennan, 1995). (5) The fifth factor was identified as biomass burning due to its significant characteristic value of K (Yamasoe et al., 2000). (6) The sixth factor had high concentrations and large EV values of OM and EC, as well as a certain range of EV values of Fe and Zn, which were related to tires and the brake wear of motor vehicles (Z. Yuan et al., 2006; He et al., 2011). Therefore, this factor was identified as vehicle emissions. (7) The seventh factor had a high EV value of Cl− and certain concentrations of OM, EC, and , implying a combustion source. This factor was identified as coal burning, which was a major source of Cl− in the PRD (Wang et al., 2015). (8) The eighth factor had large EV values of Zn, Cd, and Pb and certain concentrations of OM and EC. Zn, Cd and Pb had high enrichment factors (Table S2) of 821, 4121 and 663, respectively, and were thus considered to be related to industrial emissions (Wang et al., 2015). (9) The last factor had large EV values of V and Ni. V and Ni were predominantly derived from heavy oil combustion, and they had high enrichment factors (Table S2) of 64 and 89, respectively. Heavy oil was related to ship emissions in the PRD (Chow and Watson, 2002; X. F. Huang et al., 2014). Although these nine factors of the ME-2 modeling generally showed high correlations (R2=0.81–0.97) with the corresponding factors of the PMF modeling in terms of time series, it is easy to see that the ME-2 modeling provided a better Qtrue / Qexp ratio (1.2) than that of the PMF modeling (Qtrue / Qexp=2.5), indicating that the species residuals were decreased in the ME-2 modeling, and the EV values of tracers (e.g., , , OM, EC, Cl−, V, Ni, Pb and Cd) were assigned to factors more intensively. Therefore, it is concluded that the source apportionment results of the ME-2 modeling were more environmentally meaningful and statistically better than those of the PMF modeling.
In this study, secondary organic aerosol (SOA) did not appear as a single factor, even if we run the ME-2 with 10 or more factors. SOA can usually be described by low-volatility oxygenated organic aerosol (LV-OOA) and semi-volatile oxygenated organic aerosol (SV-OOA), based on the volatility and oxidation state of organics (Jimenez et al., 2009). In previous studies (e.g., He et al., 2011; Lanz et al., 2007; Ulbrich et al., 2009), the time series of LV-OOA and SV-OOA were highly correlated with those of sulfate and nitrate, respectively, implying that LV-OOA and sulfate (or SV-OOA and nitrate) cannot be separated easily in cluster analysis, especially when there is no effective tracer of SOA. In this study, the high OM concentration in the secondary sulfate-rich factor was considered to represent LV-OOA, while the high OM concentration in the secondary nitrate-rich factor was considered to represent SV-OOA (Z. B. Yuan et al., 2006; He et al., 2011). Therefore, it should be acknowledged that mixed secondary factors cannot be solved even using ME-2. However, the contribution time series of LV-OOA (or SV-OOA) can be extracted based on the contribution time series of the secondary sulfate-rich factor (or the secondary nitrate-rich factor) and the mass percentage of OM in this factor, leaving the remaining mass as the “pure” secondary sulfate (or secondary nitrate). Therefore, a new SOA factor can be reasonably estimated by LV-OOA + SV-OOA.
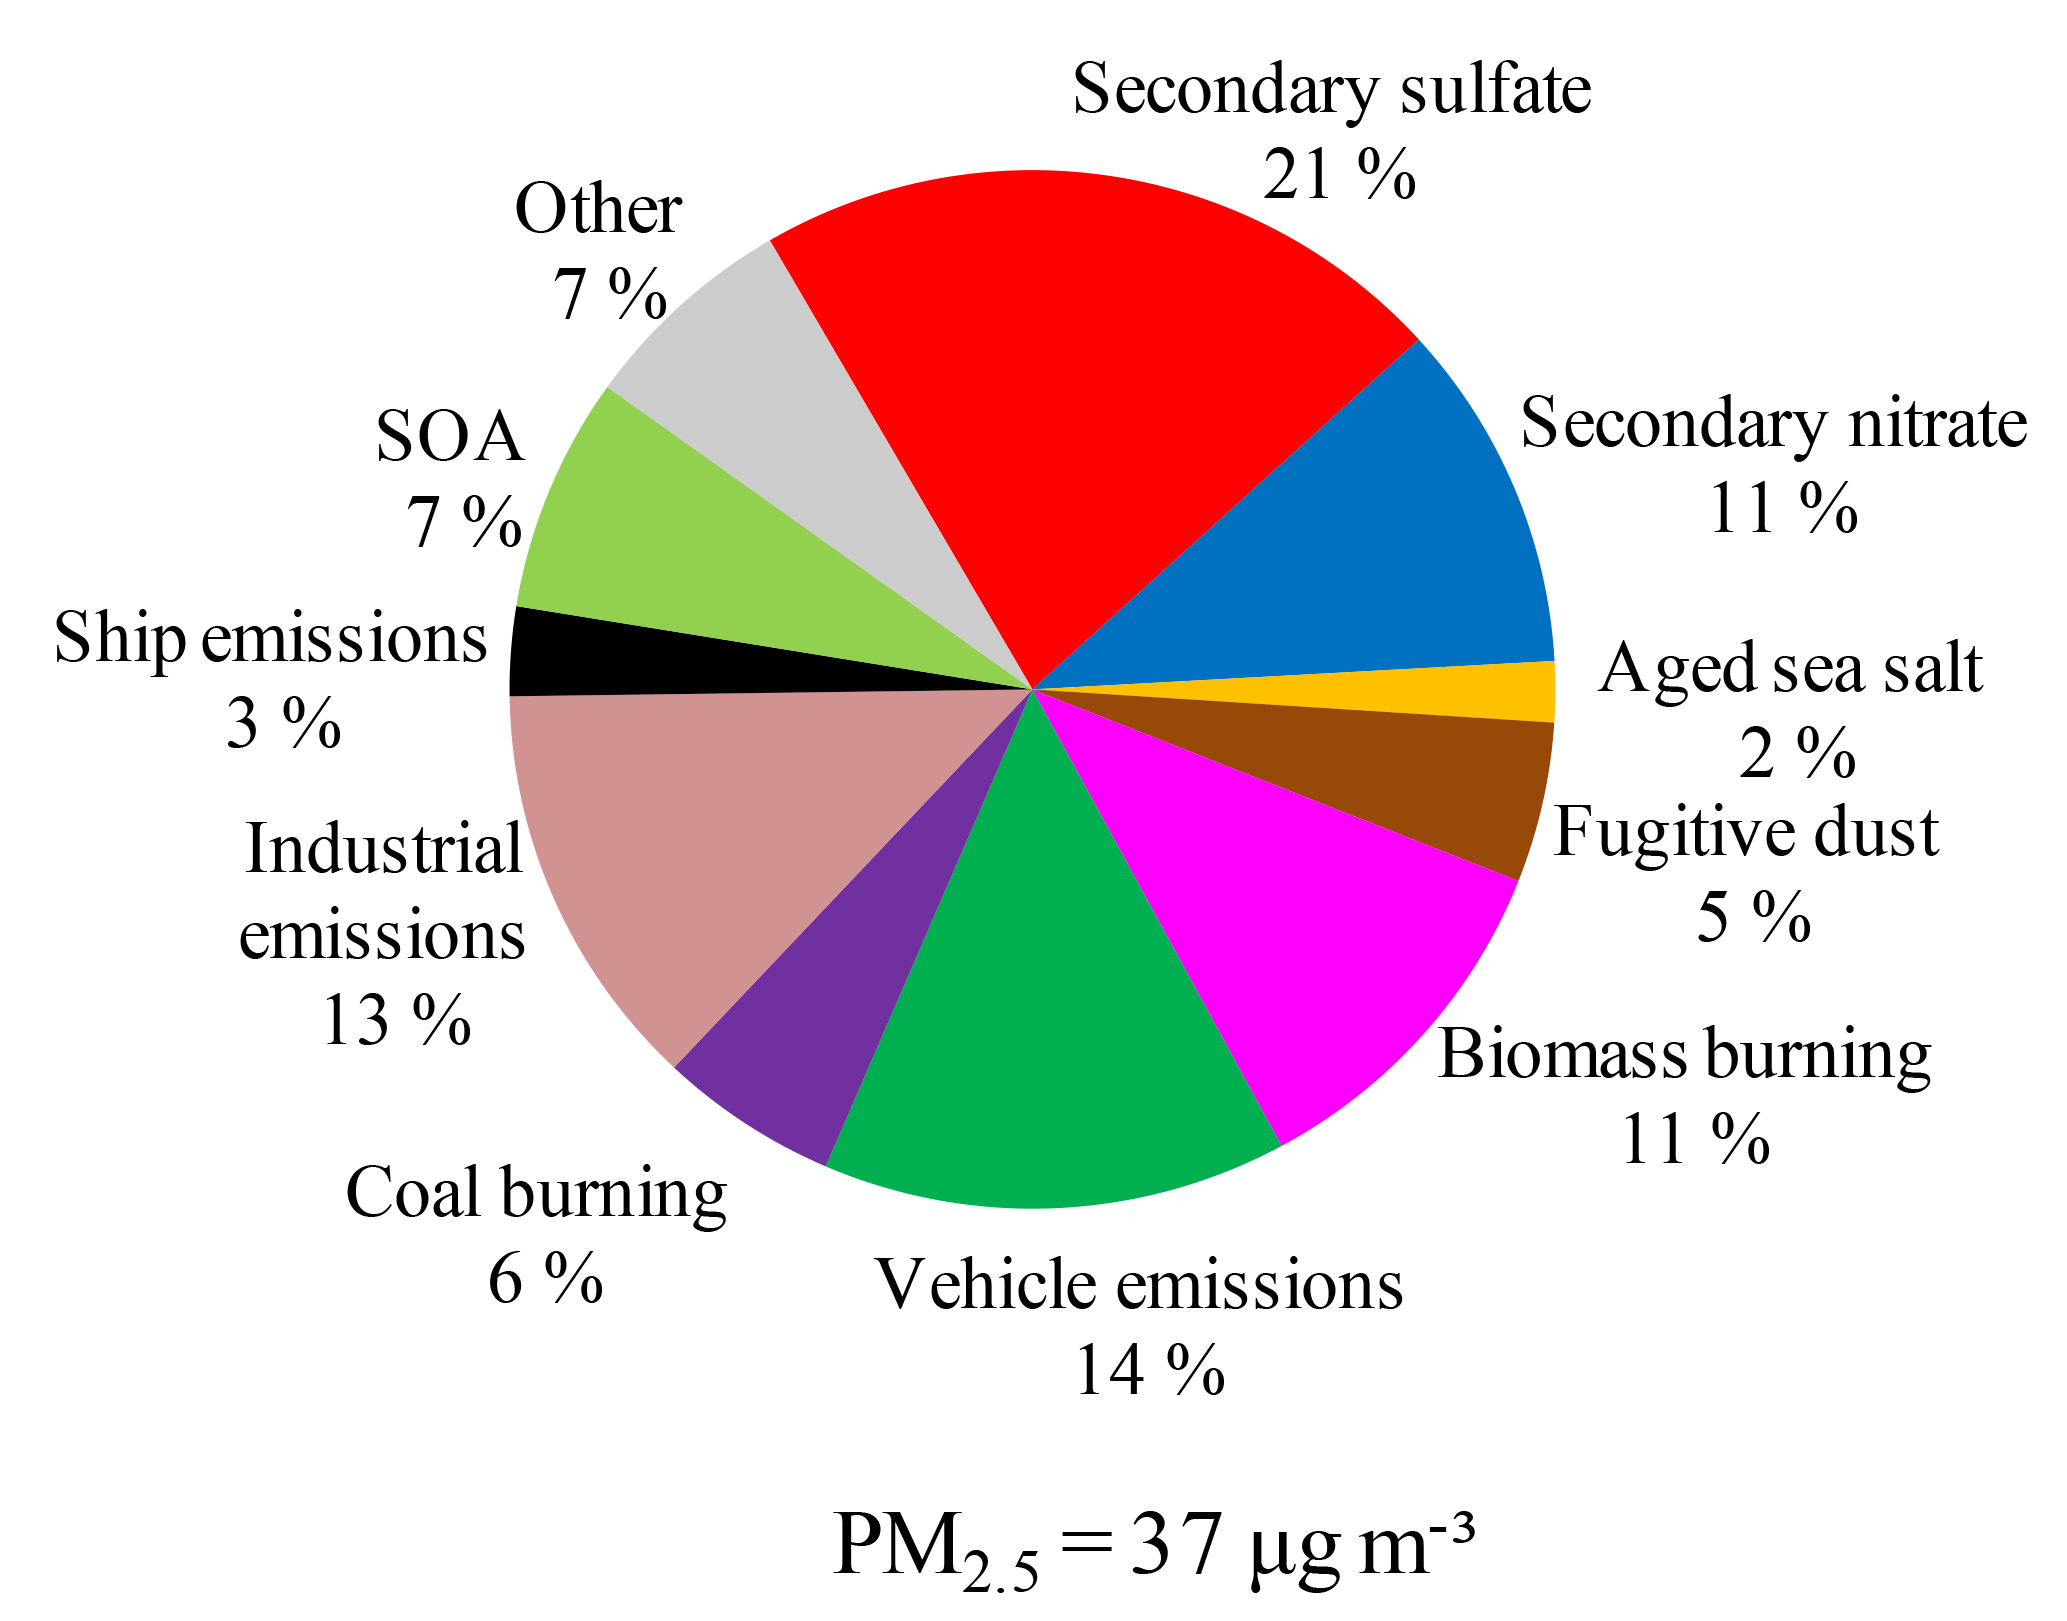
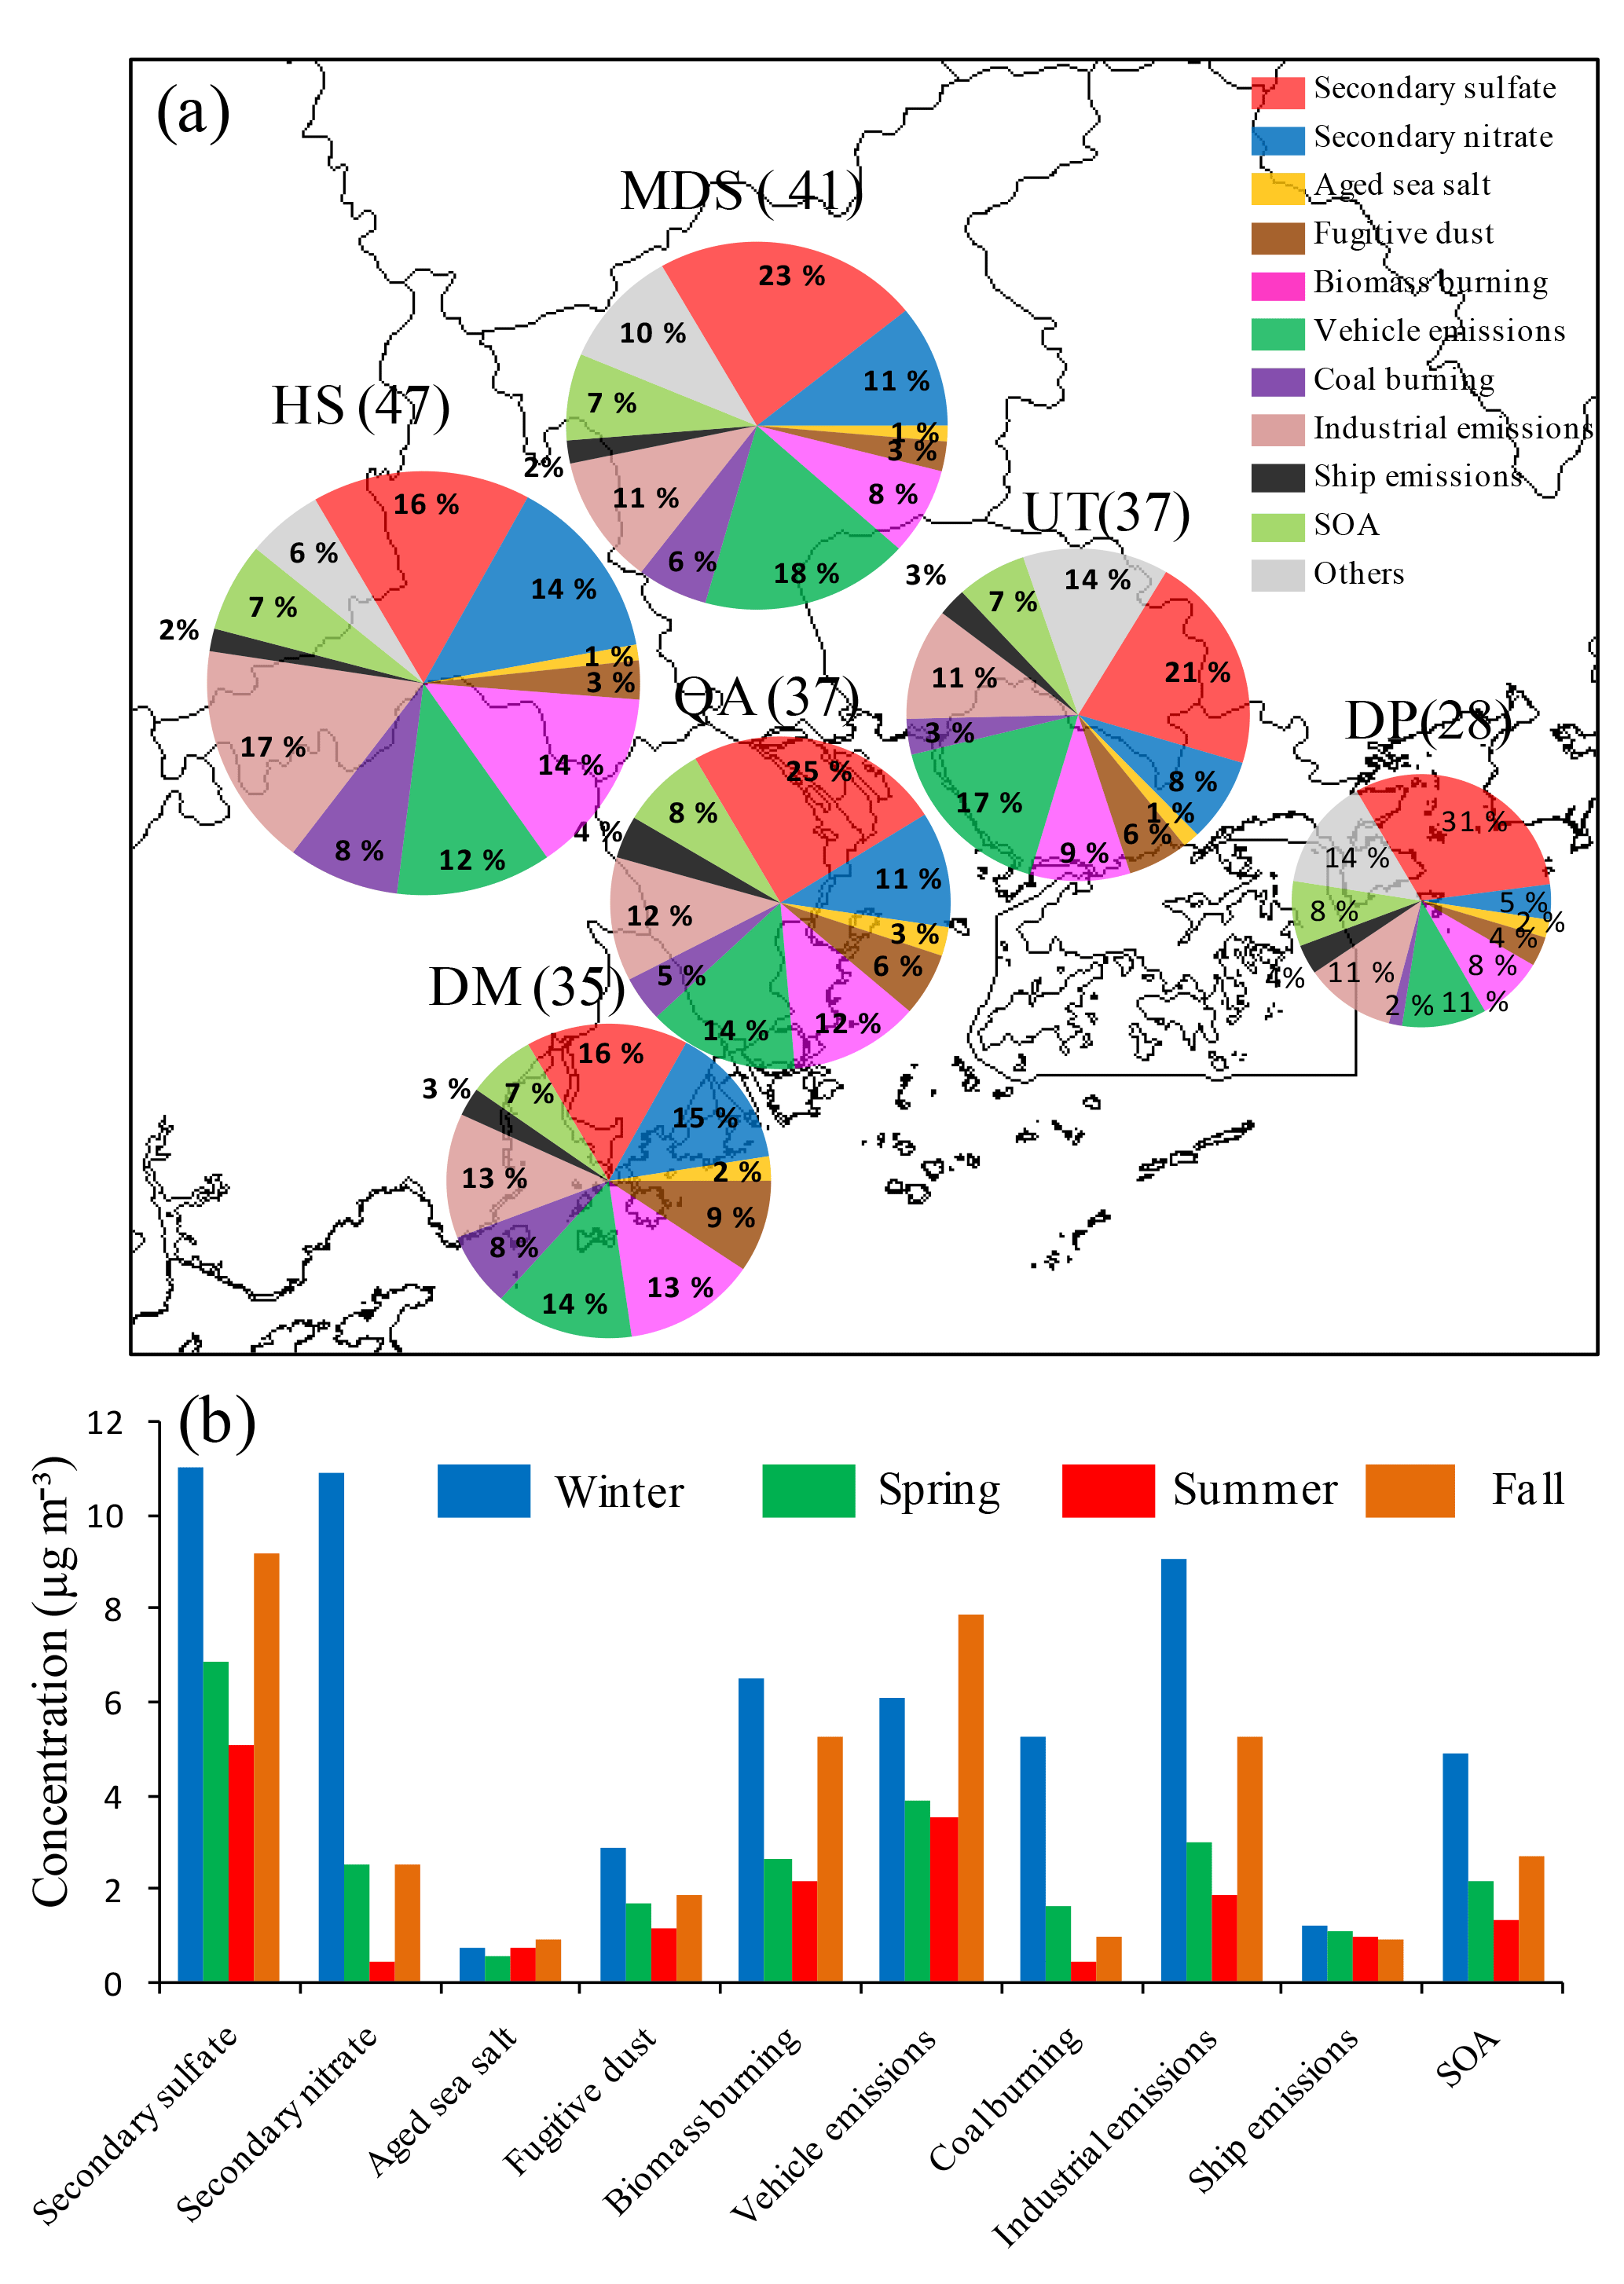
Figure 6The spatial distributions of (a) and seasonal variations in (b) PM2.5 sources in the PRD. Sizes of the pie charts indicate the concentrations of PM2.5 at the six sites, with the detailed numbers (unit: µg m−3) in brackets.
Figure 5 shows the 4-month average contributions of the PM2.5 sources in the PRD in 2015 based on the source apportionment of ME-2. The total secondary aerosols accounted for 39 % of PM2.5 in the PRD, which were secondary sulfate (21 %), secondary nitrate (11 %) and SOA (7 %). However, the identified primary particulates contributed 54 % of PM2.5, which comprised vehicle emissions (14 %), industrial emissions (13 %), biomass burning (11 %), coal burning (6 %), fugitive dust (5 %), ship emissions (3 %) and aged sea salt (2 %). The unidentified sources, including both the residual from ME-2 and the unmeasured species, accounted for 7 %.
3.3 Spatiotemporal variations in sources in the PRD
The spatial distributions of the PM2.5 sources among the six sites are shown in Fig. 6a. Secondary sulfate represented the largest fraction (31 %) of PM2.5 at DP, indicating that it was a major air pollutant in the air mass transported to the PRD. Vehicle emissions also contributed relatively highly to urban sites (18 % in MDS and 17 % in UT). Industrial emissions, biomass burning, secondary nitrate and coal burning contributed larger fractions of PM2.5 at HS, which could be attributed to both strong local sources (e.g., the surrounding township factories and farmlands) and regional transport from upwind cities at this site. Fugitive dust, which is primarily related to construction activities, was relatively high at DM (9 %). The contributions of ship emissions and aged sea salt were the highest at QA due to the site being located on Qi'ao Island in the Pearl River estuary, which records the greatest impact from the sea. SOA contributed similar amounts (7 %–8 %) at all sites. It should be noted that, although QA was a background site without local anthropogenic sources, its PM2.5 level was moderate in the PRD, indicating that QA was impacted by severe regional transport from the surrounding cities.
Figure 6b shows the seasonal variations in the major sources of PM2.5 in the PRD. The contributions of most sources were higher in winter and lower in summer, e.g., secondary sulfate, secondary nitrate, fugitive dust, biomass burning, vehicle emissions, coal burning, industrial emissions and SOA; these sources were greatly influenced by the seasonal variations in monsoon, rainfall and PBL, as discussed in Sect. 3.1. For example, although secondary sulfate was proven to be a typical regional pollutant in the PRD (X. F. Huang et al., 2014; Zou et al., 2017), the more polluted continental air mass in the winter monsoon made its concentrations in winter much higher than in summer. The semi-volatile secondary ammonium nitrate was also significantly affected by seasonal ambient temperatures. In contrast, the average contributions of aged sea salt and ship emissions for the whole region displayed few seasonal variations, consistent with the fact that the emissions were from local surrounding sea areas.
Previous studies of the source apportionment of bulk PM2.5 in the PRD have mainly focused on Guangzhou, Dongguan and Shenzhen, as seen in Table 6. It can be seen that in those studies, PM2.5 was apportioned to six to nine sources and that secondary sulfate was the prominent source, although the results of different studies exhibited certain differences due to the use of different models or data inputs. Compared with the study of X. F. Huang et al. (2014) in Shenzhen in 2009, the contributions of secondary sulfate and vehicle emissions in Shenzhen in this study were obviously lower due to power plant desulfurization and motor vehicle oil upgrades in recent years (People's Government of Shenzhen Municipality, 2013). Compared with previous studies in Guangzhou, this study attained more PM2.5 sources, which can more clearly describe the source structure of PM2.5 in this region, especially industrial emissions (11 %). The PRD region has experienced a high degree of industrialization; thus, industrial sources should be a major source, contributing 8.1 % of PM2.5 reported by the Guangzhou Environmental Protection Bureau (2017), similar to our results. Tao et al. (2017) apportioned PM2.5 to six sources using PMF in Guangzhou, including some mixed sources. For example, ship emissions in Tao's study may not actually represent a primary source due to the significant contribution of some secondary inorganics and sea salt in the source profile; thus, they obtained a significantly higher contribution (17 %) than that in our study. Ship emissions were unidentified in R. Huang's study (2014) in Guangzhou.
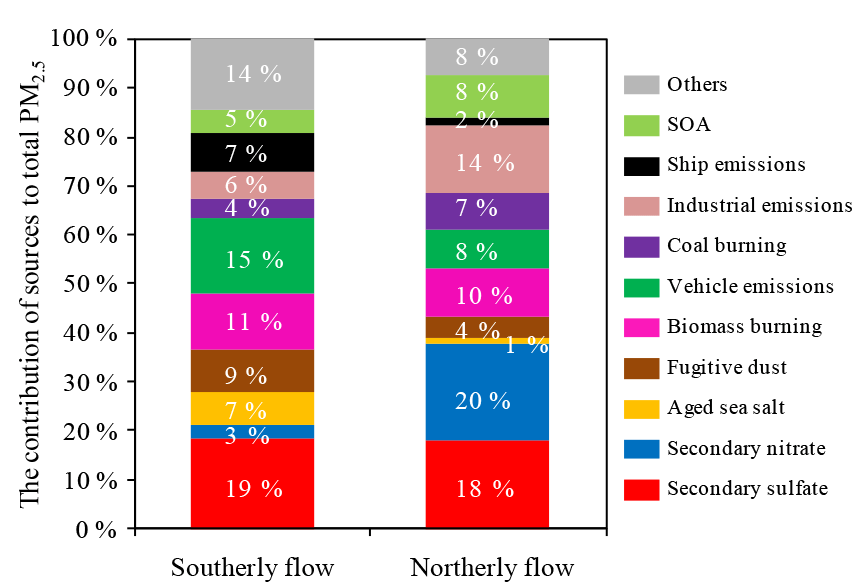
Figure 7The contributions of PM2.5 sources under southerly flow and northerly flow conditions in the PRD.
3.4 Identification of high-emission areas in the PRD in typical meteorological conditions
Figure 7 shows the contributions of PM2.5 sources under southerly flow and northerly flow conditions in the PRD, based on the classification of weather types in Sect. 2.2. Southerly flow primarily originated from the South China Sea and carried clean ocean air masses to the PRD with overall PM2.5 values of 15 µg m−3. As shown in Fig. 7, secondary sulfate (19 %), vehicle emissions (15 %) and biomass burning (11 %) had higher contributions under southerly flow. In contrast, in northerly flow, the level of PM2.5 (82 µg m−3) was 4.5 times higher than that of southerly flow due to the transport of polluted air masses southward from the northern mainland. Under northerly flow, secondary sulfate (18 %) and biomass burning (10 %) were still the major sources, but secondary nitrate became the dominant source of PM2.5, accounting for 20 % of PM2.5. In addition, industrial emissions also exhibited a relatively high contribution (14 %).
The spatial distributions of the PM2.5 sources under southerly flow and northerly flow are shown in Fig. 8. The high-emission areas for different sources identified by the discussion below are marked on the map in Fig. 9. The average concentration levels of aged sea salt were similar in the summer southerly flow and the winter northerly flow, reflecting local release of sea salt. The spatial distribution of aged sea salt among the different sites was a complex result of the site locations relative to the sea and meteorological conditions, e.g., wind and tide. A relatively high level of aged sea salt was observed at Qi'ao Island (QA), especially in the northerly flow, which can be attributed to the fact that the QA site was surrounded by the sea and had lower wind speeds in the northerly flow (in Table 3).
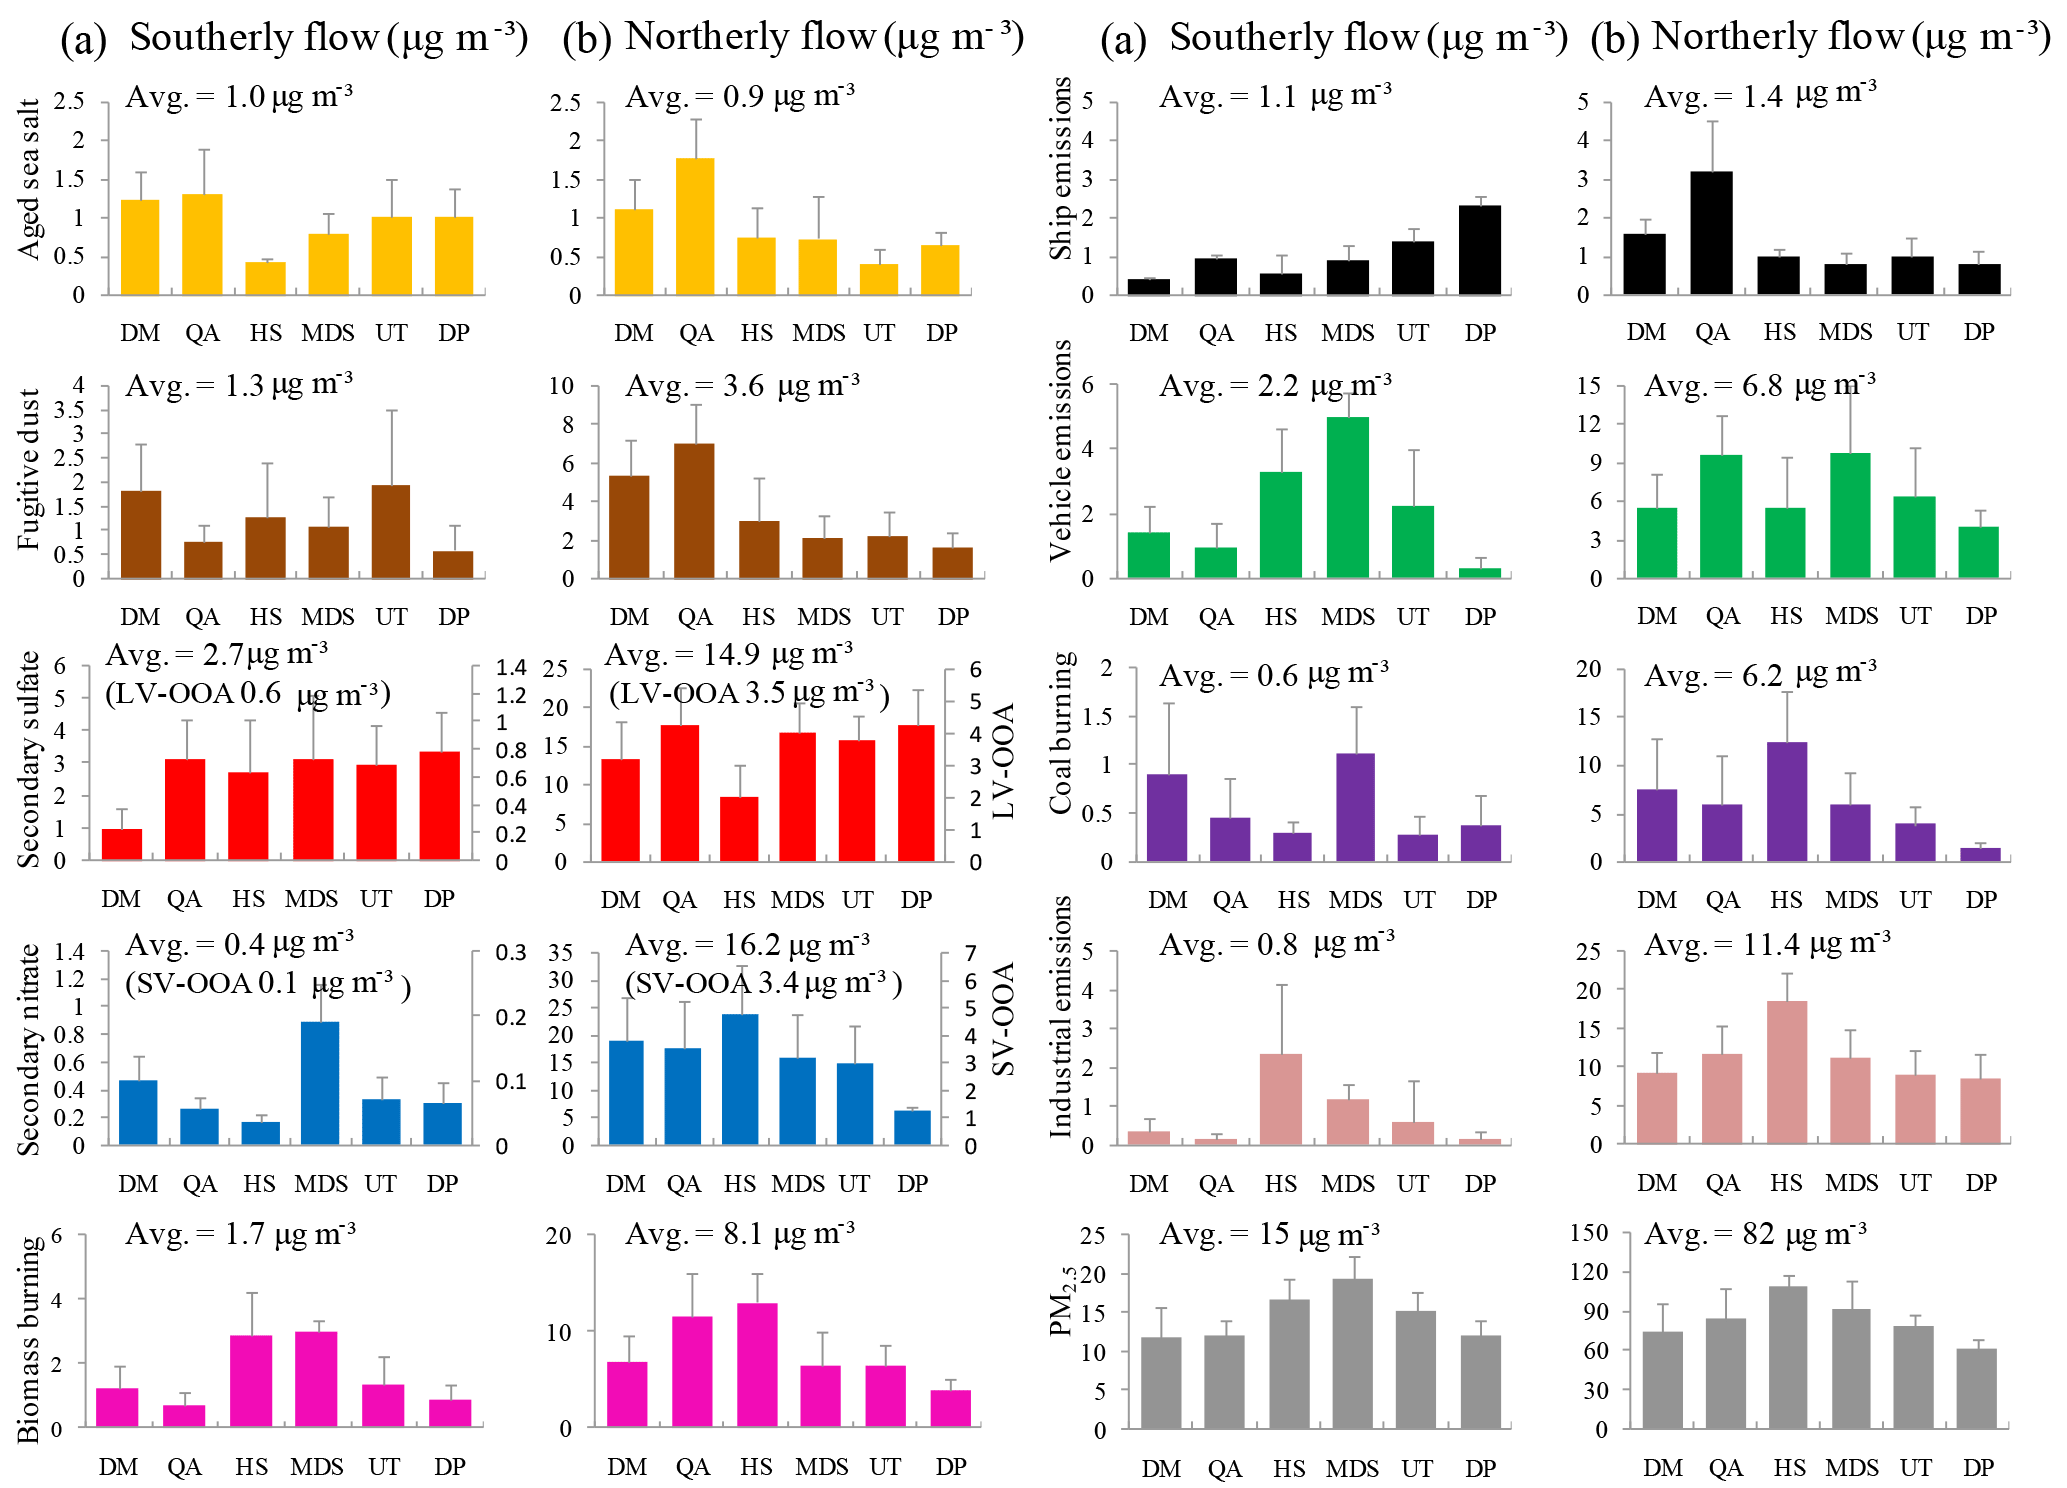
Figure 8The average contributions of PM2.5 sources at six sites in the PRD: (a) those in southerly flow and (b) those in northerly flow.
The influences of ship emissions exhibited large differences among the six sites, showing significant local characteristics. In addition, the ship emissions have similar average concentrations in the summer southerly flow and winter northerly flow, also reflecting the emissions of local ports in the PRD region. The concentrations of ship emissions were the highest at DP under southerly flow, mainly due to the impact of vessels in the upwind Yantian port, while they were the highest at QA under northerly flow, primarily due to the effects of the upwind Nansha port, as shown in Fig. 9. The Yantian port and Nansha port are among the 10 largest ports in the world (Hong Kong Marine Department, 2012).
The contributions of fugitive dust also exhibited significant differences among the six sites, which are consistent with local construction activities. DM is located in a newly developed zone that has experienced relatively high levels of fugitive dust during southerly flow and northerly flow due to active construction activities. Sample records indicate that the high value of fugitive dust at UT under southerly flow may be related to its surrounding short-term road construction project, while the high value at QA under northerly flow may be related to the reconstruction project of the adjacent Nansha port (Guangzhou Municipal People's Government, 2015).
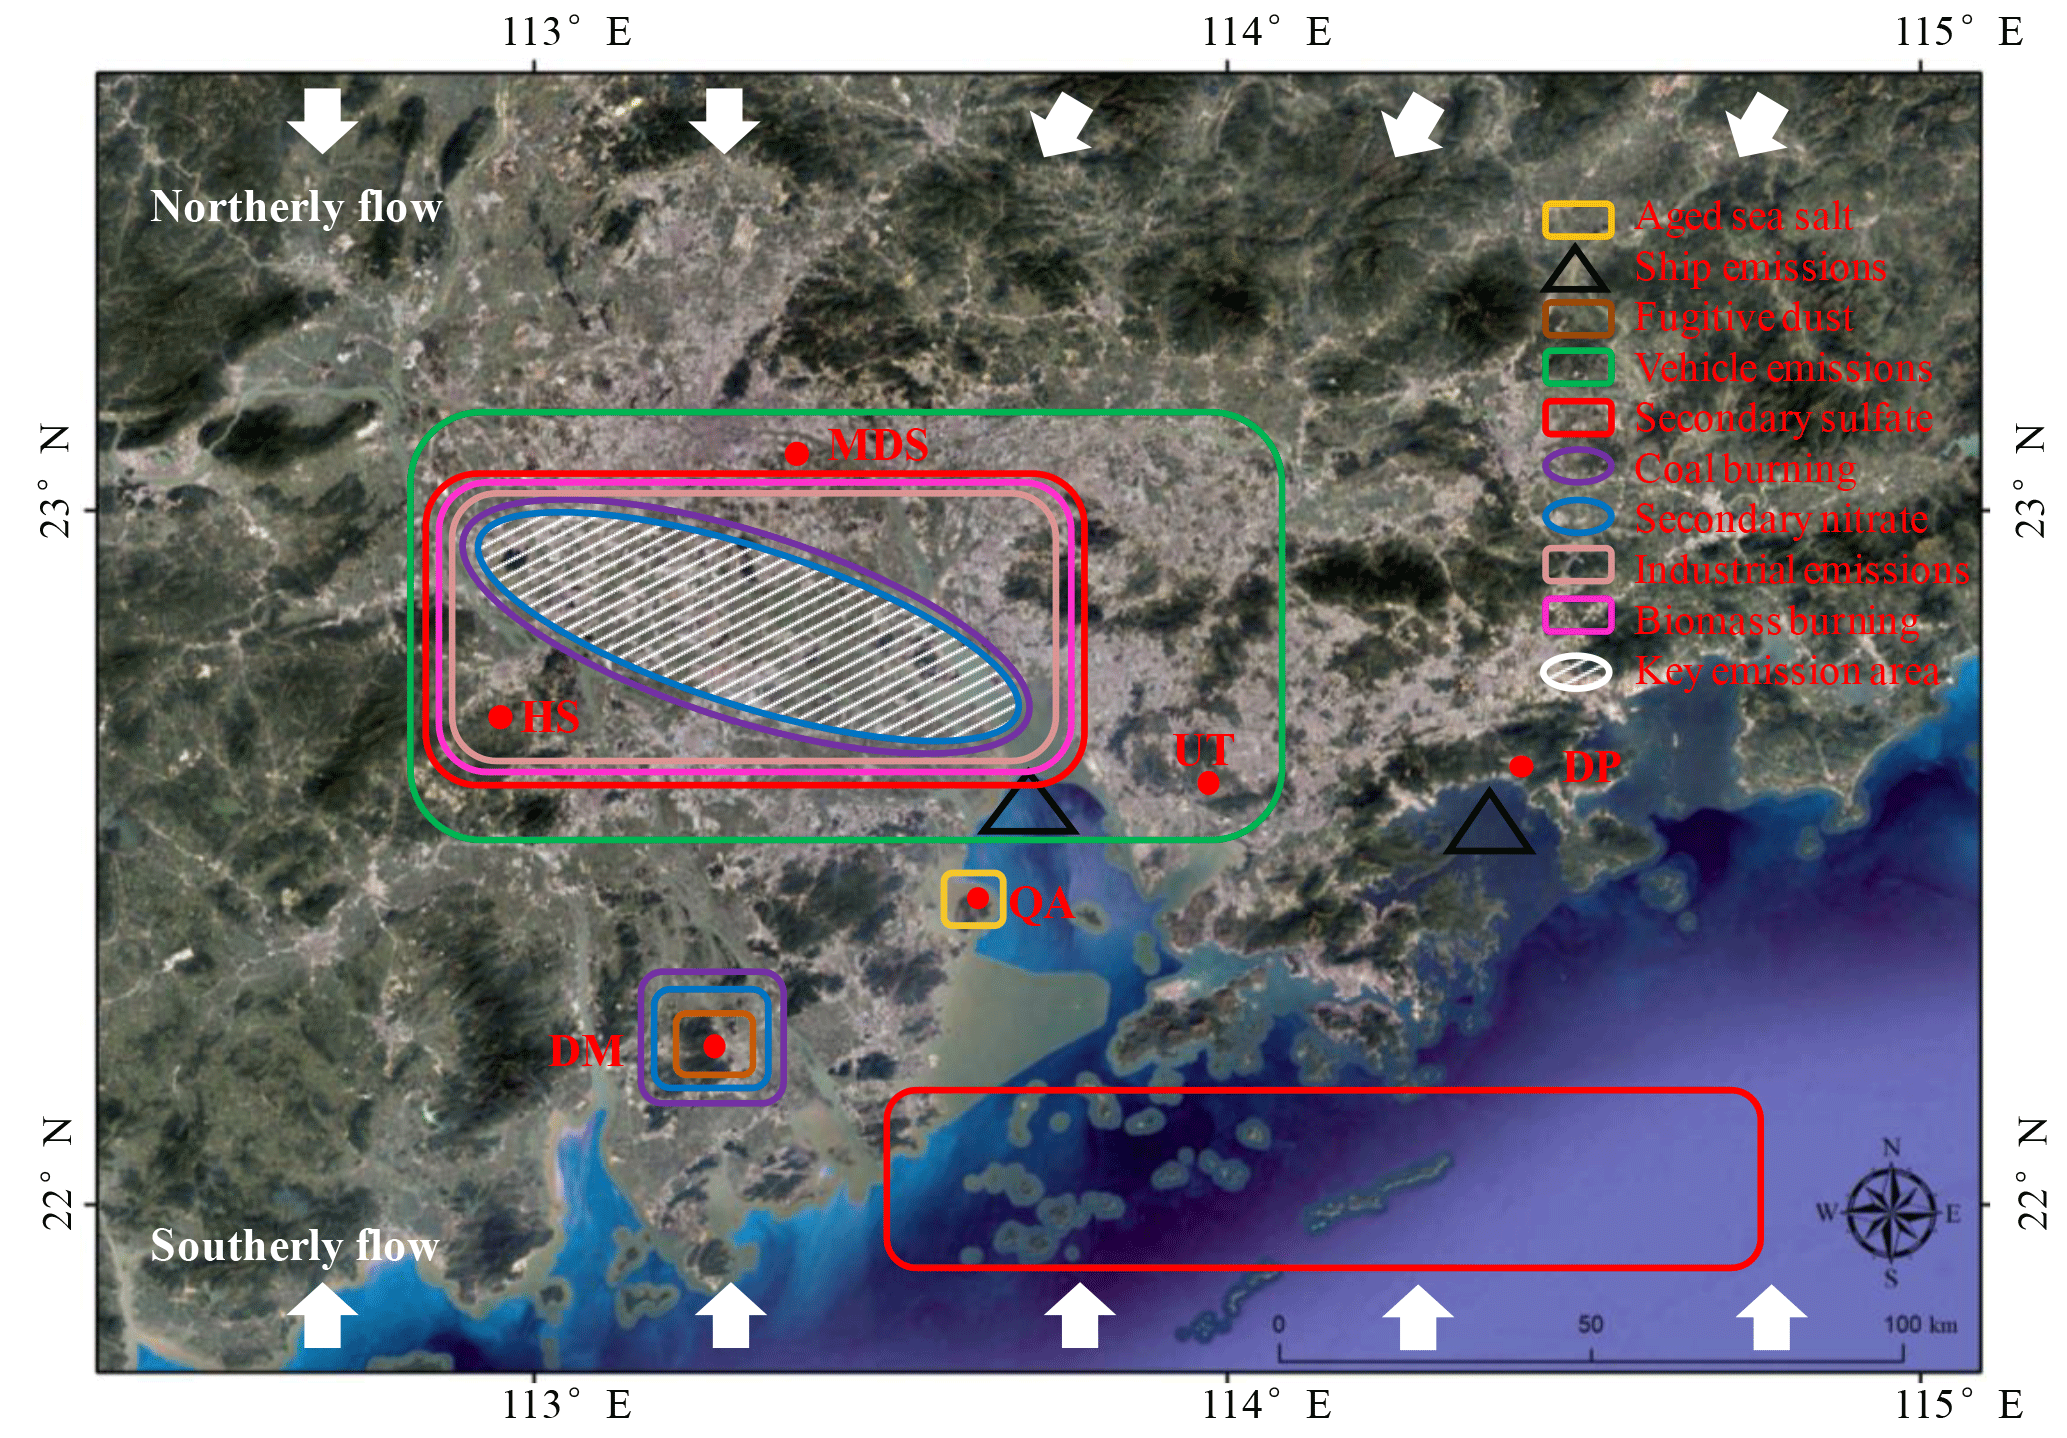
Figure 9The schematic diagram of high-emission areas in the PRD (map from Google Earth). The white shaded area indicates the key emission area for the multiple sources of SO2, NOx, coal burning, biomass burning, industrial emissions and vehicle emissions and is explained further in the text.
Motor vehicles are a common source of air pollution in the highly urbanized and industrialized PRD region. The average concentration of vehicle emissions during northerly flow was nearly 3-fold that during southerly flow. Under southerly flow, MDS, HS and UT, which are located in the hinterland of the PRD, had much higher levels of vehicle emissions than the other three sites; in particular, the highest level at the urban MDS site was caused by the high density of motor vehicles in Guangzhou. Under northerly flow, the highest concentration of vehicle emissions was still at the urban MDS site, while QA also recorded a prominent contribution of vehicle emissions, which was probably closely related to the container trucks in the neighboring Nansha port. It should be noted that the concentration of vehicle emissions at the background DP site exceeded half the regional average value, approaching 4 µg m−3, thus indicating that vehicle emissions had a significant impact on the regional transport of air masses from the north.
During southerly air flow, the background DP and QA sites and the urban UT site all recorded similar concentrations of secondary sulfate, suggesting that the secondary sulfate at these sites was dominated by regional transport from the Southern Ocean with heavy vessel transport and had little to do with the urban emissions at UT. Kuang et al. (2015) also found that ship emissions could be a major source of secondary sulfate in the PRD in summer. HS and MDS had significantly higher concentrations than their upwind site, DM, suggesting that the area between MDS and HS could be a high-SO2-emission area, which is consistent with the fact that this area is an intensive industrial area. During northerly air flow in winter, HS and DM had lower concentrations than the four upwind sites, i.e., MDS, QA, UT and especially DP (the background site), indicating that secondary sulfate could mainly be derived from regional transport from outside the PRD in this season. Although the industrial area between HS and MDS could emit significant amounts of SO2, the lower temperatures and dry air in winter did not appear to favor the quick conversion of SO2 to secondary sulfate. Since both secondary sulfate and LV-OOA belong to a mixed factor with fixed proportions, the spatial distribution of secondary sulfate also reflects the corresponding characteristics of LV-OOA.
The spatial distributions of coal burning were significantly different among the six sites during periods of both south wind and north wind, thus showing conspicuous local characteristics. The contribution of coal burning was higher at MDS under southerly flow and higher at HS under northerly flow. Most of the coals in the PRD were consumed by thermal power plants, but there were no coal-fired power plants near the urban MDS and background DP sites. Therefore, it is speculated that the high-emission areas of coal burning sources mainly exist in the region between HS and MDS, as shown in Fig. 9. The distribution of coal-fired power plants in Guangdong (Wang et al., 2017) reveal that some important coal-fired power plants are distributed in this region. Additionally, DM also exhibited relatively obvious contributions of coal burning during southerly flow and northerly flow, which is also consistent with the distribution of coal-fired power plants in the vicinity.
The average concentration of secondary nitrate during northerly flow in winter was 40 times greater than that during southerly flow in summer; this occurred not only because of the unfavorable conditions of atmospheric diffusion in winter but also due to the high semi-volatility of ammonium nitrate, which cannot stably exist in fine particles in the PRD during hot summer weather (Huang et al., 2006). Under southerly flow conditions, the concentrations of secondary nitrate presented prominent differences among the six sites, showing local characteristics. Moreover, the relatively low concentrations at the background DP site during northerly flow also indicated that secondary nitrate mainly originated from the interior of the PRD. The spatial distribution characteristics of secondary nitrate were very similar to those of coal burning, with the highest occurring at MDS under southerly flow, the highest occurring at HS under northerly flow and significantly high values occurring at DM under southerly and northerly flow, showing that the NOx emissions produced by coal burning may be the main reason for the high nitrate levels in those areas. Since both secondary nitrate and SV-OOA belong to a mixed factor with fixed proportions, the spatial distribution of secondary nitrate also reflects the corresponding characteristics of SV-OOA.
Under southerly flow, the influence of industrial emissions differed vastly among the six sites, showing obvious local characteristics. Under northerly flow, the average concentration of industrial emissions reached 14-fold that of southerly flow, and the high contributions at background DP suggested that regional transport probably dominated the industrial sources of fine particulate matter in the PRD in winter. HS had the highest concentration of industrial emissions during southerly flow and northerly flow conditions, which is consistent with the dense factories present in the surrounding area (Hu, 2004; Environmental Protection Agency of Jiangmen City, 2017). In addition, the contribution of industrial emissions was relatively high at MDS during southerly flow and relatively high at QA during northerly flow, which supports the inference that a high-emission region of industrial sources was located between MDS and QA, as seen in Fig. 9.
The impacts of biomass burning exhibited relatively large differences among the six sites during both south and north wind conditions, presenting somewhat local characteristics. The suburban HS site had relatively high biomass burning levels during southerly flow and northerly flow, which should be related to the presence of many farmlands in its vicinity and thus the popular events of open burning and residential burning of biomass wastes. The concentrations of biomass burning were relatively high at the urban MDS site during southerly flow and relatively high at the background QA site during northerly flow, implying that there was a high-emission area of biomass burning between MDS and QA, as shown in Fig. 9. Those spatial distribution characteristics of biomass burning were similar to those of industrial emissions in the PRD, suggesting that not only the combustion of residential biomass but also the use of industrial biomass boilers could make important contributions to PM2.5 in the PRD.
As a summary, the central PRD area, i.e., the middle region in between MDS, HS and QA (the shaded region in Fig. 9), represents the most important pollutant emission area in the PRD; these emissions include SO2, NOx, coal burning, biomass burning, industrial emissions and vehicle emissions, thus leading to high pollution levels in the PRD. Therefore, this area is a key area for pollution control in the PRD. Primary fine particulate matter and SO2 from ship emissions had significant impacts on PM2.5 in the southern coastal area of the PRD during summer southerly flow, and special attention must be paid to them.
3.5 Distinguishing local and regional PM2.5 pollution in the PRD
The analyses presented in Sect. 3.4 indicate that the secondary sulfates at the four southern coastal sites (DM, QA, UT and DP) in the PRD were almost entirely derived from the conversion of SO2 from the emissions of ships in the Southern Ocean during southerly flow, contributing approximately 20 % of the average PM2.5 (13 µg m−3) at the four sites. Considering that the ship emissions directly contributed approximately 10 % of the average PM2.5 at the four sites, the total ship emissions contributed approximately 30 % of PM2.5 in the southern coastal PRD area and acted as the largest source of PM2.5. Under northerly flow conditions, the background DP site, which was barely affected by pollution emissions within the PRD, reflected regional transport from the north air mass outside the PRD, while the background QA site reflected the superposition effect of regional background pollution and the input of the most serious pollution area in the PRD. The consistency of the secondary sulfate concentrations at the background QA and DP sites was interpreted to reflect almost the same regional background effect during northerly flow; thus, the differences in the six anthropogenic sources between the two background sites, including secondary nitrate (and SV-OOA), biomass burning, industrial emissions, coal burning, vehicle emissions and ship emissions, could be used to trace the internal inputs from the most serious pollution area within the PRD to the downwind area. The internal inputs of six anthropogenic sources to the corresponding sources of PM2.5 at the background QA site were 66 %, 67 %, 28 %, 76 %, 59 % and 75 %, and the total internal input of 37.7 µg m−3 accounted for 45 % of PM2.5 at the background QA site (83 µg m−3), showing that the local contributions of anthropogenic pollution emissions in the key source area of the PRD were still crucial in winter but lower than the contribution of the regional background. Ignoring natural sources, such as aged sea salt and fugitive dust, under northerly flow, the contributions of other anthropogenic sources to DP were considered to represent regional background pollution (47.5 µg m−3), and the differences in their corresponding source concentrations between QA and DP were expected to represent the local emissions of source areas in the PRD. Therefore, the source structures in the regional background air mass and local emissions of heavy pollution sources area in the PRD are shown in Fig. 10. Secondary sulfate and LV-OOA occupied the vast majority (45.6 %) of the regional background air mass from the northern mainland, followed by industrial emissions (17.8 %), secondary nitrate and SV-OOA (15.5 %). However, the major sources between the sources output by local emissions from the heavy pollution source area of the PRD were secondary nitrate and SV-OOA (37.3 %), biomass burning (20.6 %), vehicle emissions (14.9 %) and coal burning (11.9 %). Therefore, measures implemented for the effective control of PM2.5 in the PRD should focus on local controls and regional joint prevention and control under winter northerly flow conditions.
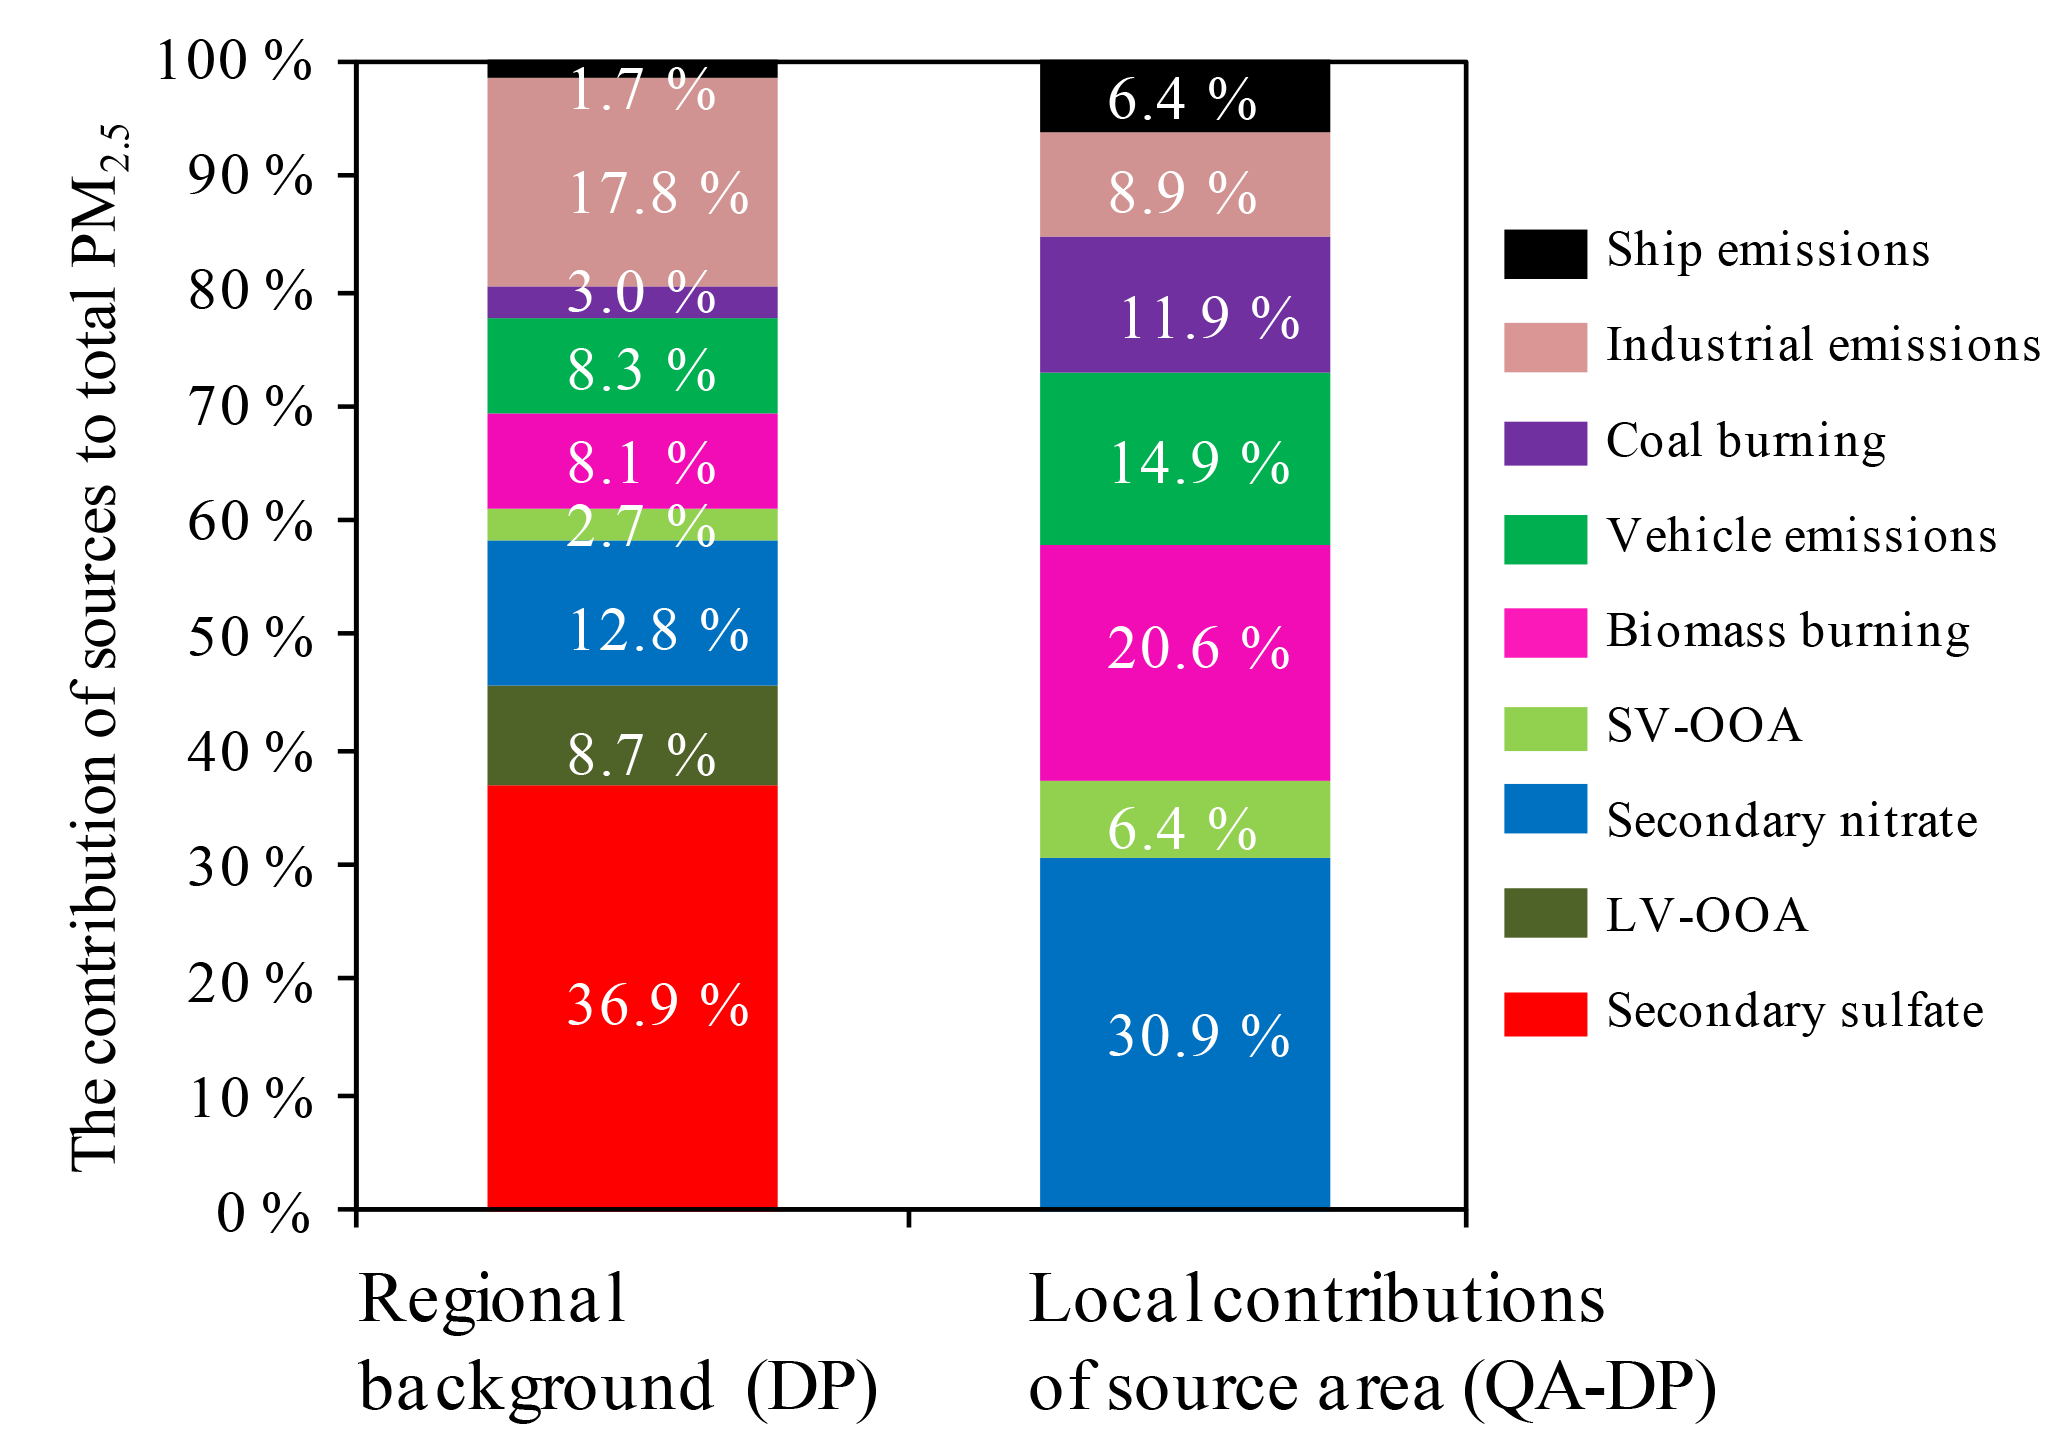
Figure 10The PM2.5 source structures in regional background air and local contributions of the central PRD area under northerly flow.
The PRD is one of the largest agglomerations of cities in the world, and its air quality has largely improved in the past 10 years. To reveal the current PM2.5 pollution characteristics on a regional scale in the PRD, six sampling sites were selected to conduct 4 months (one for each season) of sampling and chemical analysis in 2015; then, the source exploration of PM2.5 was performed using a novel method. The conclusions are described below.
- 1.
The 4-month average PM2.5 concentration for all six sites in the PRD was 37 µg m−3, of which OM, , , , EC, metal elements and Cl− contributed 36.9 %, 23.6 %, 10.9 %, 9.3 %, 6.6 %, 6.5 % and 0.9 %, respectively. The spatiotemporal PM2.5 variations were generally characterized as being higher in the northern inland region and higher in winter.
- 2.
This study revealed that the ME-2 model produced more environmentally meaningful and statistically robust results of source apportionment than the traditional PMF model. Secondary sulfate was found to be the dominant source of PM2.5 in the PRD, at 21 %, followed by vehicle emissions (14 %), industrial emissions (13 %), secondary nitrate (11 %), biomass burning (11 %), SOA (7 %), coal burning (6 %), fugitive dust (5 %), ship emissions (3 %) and aged sea salt (2 %). Only aged sea salt and ship emissions did not show obvious seasonal variations.
- 3.
Based on the spatial distribution characteristics of PM2.5 sources under typical southerly and northerly airflow conditions, the central PRD area in between MDS, HS and QA is identified as a key area for source emissions, including SO2, NOx, coal burning, biomass burning, industrial emissions, and vehicle emissions, and thus deserves more attention when implementing local pollution control in the PRD. In addition, ship emissions should be controlled more strictly during summer due to their contribution of approximately 30 % of PM2.5 in the southern coastal area of the PRD under southerly air flow.
- 4.
Under typical northerly winter flow, the contributions of anthropogenic pollution emissions in the central PRD area contributed 37.7 µg m−3 (45 % of PM2.5) to the regional background air. Secondary sulfate (36.9 %), industrial emissions (17.8 %) and secondary nitrate SV-OOA (12.8 %) were the major PM2.5 sources for the PM2.5 transported in the regional background air mass, while secondary nitrate (30.9 %), biomass burning (20.6 %), vehicle emissions (14.9 %) and coal burning (11.9 %) were the major sources for the PM2.5 produced in the central PRD area. Therefore, effective control measures of PM2.5 in the PRD in the future should pay more attention to both local controls and regional joint prevention.
Datasets are available by contacting the corresponding author, Ling-Yan He (hely@pku.edu.cn).
The supplement related to this article is available online at: https://doi.org/10.5194/acp-18-11563-2018-supplement.
X-FH, B-BZ, and L-YH analyzed the data and wrote the paper. L-YH, MH, and Y-HZ designed the study. B-BZ performed the chemical analysis. ASHP helped with the ME-2 running. All authors reviewed and commented on the paper.
The authors declare that they have no conflict of interest.
This work was supported by the National Natural Science Foundation of China
(91744202, 41622304) and the Science and Technology Plan of Shenzhen
Municipality (JCYJ20170412150626172, JCYJ20170306164713148).
Edited by: James Allan
Reviewed by: two anonymous referees
BIPM, IEC, IFCC, ILAC, ISO, IUPAC, IUPAP, and OIML: Evaluation of measurement data – Guide to the expression of uncertainty in measurement, available at: https://www.bipm.org/utils/common/documents/jcgm/JCGM_100_2008_E.pdf (last access: 5 August 2018), 2008.
Bressi, M., Sciare, J., Ghersi, V., Bonnaire, N., Nicolas, J. B., Petit, J.-E., Moukhtar, S., Rosso, A., Mihalopoulos, N., and Féron, A.: A one-year comprehensive chemical characterisation of fine aerosol (PM2.5) at urban, suburban and rural background sites in the region of Paris (France), Atmos. Chem. Phys., 13, 7825–7844, https://doi.org/10.5194/acp-13-7825-2013, 2013.
Burnett, R. T., Pope, C. A. I., Ezzati, M., Olives, C., Lim, S. S., Mehta, S., Shin, H. H., Singh, G., Hubbell, B., Brauer, M., Anderson, H. R., Smith, K. R., Balmes, J. R., Bruce, N. G., Kan, H., Laden, F., Prüss-Ustün, A., Turner, M. C., Gapstur, S. M., Diver, W. R., and Cohen, A.: An Integrated Risk Function for Estimating the Global Burden of Disease Attributable to Ambient Fine Particulate Matter Exposure, Environ. Health Persp., 122, A235–A235, https://doi.org/10.1289/ehp.122-A235, 2014.
Canonaco, F., Crippa, M., Slowik, J. G., Baltensperger, U., and Prévôt, A. S. H.: SoFi, an IGOR-based interface for the efficient use of the generalized multilinear engine (ME-2) for the source apportionment: ME-2 application to aerosol mass spectrometer data, Atmos. Meas. Tech., 6, 3649–3661, https://doi.org/10.5194/amt-6-3649-2013, 2013.
Cao, L.-M., Huang, X.-F., Li, Y.-Y., Hu, M., and He, L.-Y.: Volatility measurement of atmospheric submicron aerosols in an urban atmosphere in southern China, Atmos. Chem. Phys., 18, 1729–1743, https://doi.org/10.5194/acp-18-1729-2018, 2018.
Cho, S. H., Kim, P. R., Han, Y. J., Kim, H. W., and Yi, S. M.: Characteristics of Ionic and Carbonaceous Compounds in PM2.5 and High Concentration Events in Chuncheon, Korea, Journal of Korean Society for Atmospheric Environment, 32, 435–447, https://doi.org/10.5572/KOSAE.2016.32.4.435, 2016.
Chow, J. C. and Watson, J. G.: Review of PM2.5 and PM10 Apportionment for Fossil Fuel Combustion and Other Sources by the Chemical Mass Balance Receptor Model, Energ. Fuel., 16, 222–260, https://doi.org/10.1021/ef0101715, 2002.
Chow, J. C., Watson, J. G., Pritchett, L. C., Pierson, W. R., Frazier, C. A., and Purcell, R. G.: The DRI thermal/optical reflectance carbon analysis system: description, evaluation and applications in U.S. Air quality studies, Atmos. Environ., 27, 1185–1201, https://doi.org/10.1016/0960-1686(93)90245-T, 1993.
Crippa, M., Canonaco, F., Lanz, V. A., Äijälä, M., Allan, J. D., Carbone, S., Capes, G., Ceburnis, D., Dall'Osto, M., Day, D. A., DeCarlo, P. F., Ehn, M., Eriksson, A., Freney, E., Hildebrandt Ruiz, L., Hillamo, R., Jimenez, J. L., Junninen, H., Kiendler-Scharr, A., Kortelainen, A.-M., Kulmala, M., Laaksonen, A., Mensah, A. A., Mohr, C., Nemitz, E., O'Dowd, C., Ovadnevaite, J., Pandis, S. N., Petäjä, T., Poulain, L., Saarikoski, S., Sellegri, K., Swietlicki, E., Tiitta, P., Worsnop, D. R., Baltensperger, U., and Prévôt, A. S. H.: Organic aerosol components derived from 25 AMS data sets across Europe using a consistent ME-2 based source apportionment approach, Atmos. Chem. Phys., 14, 6159–6176, https://doi.org/10.5194/acp-14-6159-2014, 2014.
Elser, M., Huang, R.-J., Wolf, R., Slowik, J. G., Wang, Q., Canonaco, F., Li, G., Bozzetti, C., Daellenbach, K. R., Huang, Y., Zhang, R., Li, Z., Cao, J., Baltensperger, U., El-Haddad, I., and Prévôt, A. S. H.: New insights into PM2.5 chemical composition and sources in two major cities in China during extreme haze events using aerosol mass spectrometry, Atmos. Chem. Phys., 16, 3207–3225, https://doi.org/10.5194/acp-16-3207-2016, 2016.
Environmental Protection Agency of Jiangmen City: Key pollution sources basic information in Jiangmen, available at: http://hbj.jiangmen.gov.cn/thirdData/hbsjzx/hjjc/fs/201712/t20171218_268676.html (last access: 5 August 2018), 2017.
Fröhlich, R., Crenn, V., Setyan, A., Belis, C. A., Canonaco, F., Favez, O., Riffault, V., Slowik, J. G., Aas, W., Aijälä, M., Alastuey, A., Artiñano, B., Bonnaire, N., Bozzetti, C., Bressi, M., Carbone, C., Coz, E., Croteau, P. L., Cubison, M. J., Esser-Gietl, J. K., Green, D. C., Gros, V., Heikkinen, L., Herrmann, H., Jayne, J. T., Lunder, C. R., Minguillón, M. C., Mocnik, G., O'Dowd, C. D., Ovadnevaite, J., Petralia, E., Poulain, L., Priestman, M., Ripoll, A., Sarda-Estève, R., Wiedensohler, A., Baltensperger, U., Sciare, J., and Prévôt, A. S. H.: ACTRIS ACSM intercomparison – Part 2: Intercomparison of ME-2 organic source apportionment results from 15 individual, co-located aerosol mass spectrometers, Atmos. Meas. Tech., 8, 2555–2576, https://doi.org/10.5194/amt-8-2555-2015, 2015.
Gao, B., Guo, H., Wang, X., Zhao, X., Ling, Z., Zhang, Z., and Liu, T.: Tracer-based source apportionment of polycyclic aromatic hydrocarbons in PM2.5 in Guangzhou, southern China, using positive matrix factorization (PMF), Environ. Sci. Pollut. R., 20, 2398–2409, https://doi.org/10.1007/s11356-012-1129-0, 2013.
Guangzhou Environmental Protection Bureau: The Results of Source apportionment on PM2.5 in Guangzhou in 2016, available at: http://www.gz.gov.cn/gzgov/s5837/201706/1dcb25be6dd14dc6ab6506e0a5383745.shtml (last access: 5 August 2018), 2017.
Guangzhou Municipal People's Government: Three-year Action Plan for the Construction of Guangzhou International Shipping Center (2015-2017), available at: http://www.gz.gov.cn/gzgov/s2811/201509/19601daa69c84e439fe2fb8baea448bb.shtml (last access: 5 August 2018), 2015.
Hagler, G., Bergin, M., Salmon, L., Yu, J., Wan, E., Zheng, M., Zeng, L., Kiang, C., Zhang, Y., and Lau, A.: Source areas and chemical composition of fine particulate matter in the Pearl River Delta region of China, Atmos. Environ., 40, 3802–3815, https://doi.org/10.1016/j.atmosenv.2006.02.032, 2006.
Hasheminassab, S., Daher, N., Ostro, B. D., and Sioutas, C.: Long-term source apportionment of ambient fine particulate matter (PM2.5) in the Los Angeles Basin: A focus on emissions reduction from vehicular sources, Environ. Pollut., 193, 54–64, https://doi.org/10.1016/j.envpol.2014.06.012, 2014.
He, L., Huang, X., Xue, L., Hu, M., Lin, Y., Zheng, J., Zhang, R., and Zhang, Y.: Submicron aerosol analysis and organic source apportionment in an urban atmosphere in Pearl River Delta of China using high-resolution aerosol mass spectrometry, J. Geophys. Res., 116, D12304, https://doi.org/10.1029/2010JD014566, 2011.
Hong Kong Marine Department: Ranking of container ports of the world, https://www.mardep.gov.hk/hk/publication/pdf/portstat_2_y_b5c.pdf (last access: 5 August 2018), 2012.
Hu, Z. Y.: Studies on the Discharging and Distribution of Heavy Metal Pollution in the Pearl River Delta, Doctoral dissertation, Graduate School of the Chinese Academy of Sciences (Guangzhou Institute of Geochemistry), 2004.
Huang, R., Zhang, Y., Bozzetti, C., Ho, K., Cao, J., Han, Y., Daellenbach, K. R., Slowik, J. G., Platt, S. M., Canonaco, F., Zotter, P., Wolf, R., Pieber, S. M., Bruns, E. A., Crippa, M., Ciarelli, G., Piazzalunga, A., Schwikowski, M., Abbaszade, G., Schnelle-Kreis, J., Zimmermann, R., An, Z., Szidat, S., Baltensperger, U., Haddad, I. E., and Prévôt, A. S. H.: High secondary aerosol contribution to particulate pollution during haze events in China, Nature, 514, 218–222, https://doi.org/10.1038/nature13774, 2014.
Huang, X., Liu, Z., Liu, J., Hu, B., Wen, T., Tang, G., Zhang, J., Wu, F., Ji, D., Wang, L., and Wang, Y.: Chemical characterization and source identification of PM2.5 at multiple sites in the Beijing–Tianjin–Hebei region, China, Atmos. Chem. Phys., 17, 12941–12962, https://doi.org/10.5194/acp-17-12941-2017, 2017.
Huang, X., Yu, J. Z., He, L., and Yuan, Z.: Water-soluble organic carbon and oxalate in aerosols at a coastal urban site in China: Size distribution characteristics, sources, and formation mechanisms, J. Geophys. Res., 111, D22212, https://doi.org/10.1029/2006JD007408, 2006.
Huang, X.-F., He, L.-Y., Hu, M., Canagaratna, M. R., Kroll, J. H., Ng, N. L., Zhang, Y.-H., Lin, Y., Xue, L., Sun, T.-L., Liu, X.-G., Shao, M., Jayne, J. T., and Worsnop, D. R.: Characterization of submicron aerosols at a rural site in Pearl River Delta of China using an Aerodyne High-Resolution Aerosol Mass Spectrometer, Atmos. Chem. Phys., 11, 1865–1877, https://doi.org/10.5194/acp-11-1865-2011, 2011.
Huang, X. F., Hui, Y., Gong, Z. H., Xiang, L., He, L. Y., Zhang, Y. H., and Min, H.: Source apportionment and secondary organic aerosol estimation of PM2.5 in an urban atmosphere in China, Sci. China Earth Sci., 57, 1352–1362, https://doi.org/10.1007/s11430-013-4686-2, 2014.
Jimenez, J. L., Canagaratna, M. R., Donahue, N. M., Prevot, A. S., Zhang, Q., Kroll, J. H., Decarlo, P. F., Allan, J. D., Coe, H., and Ng, N. L.: Evolution of organic aerosols in the atmosphere, Science, 326, 1525–1529, https://doi.org/10.1126/science.1180353, 2009.
Kuang, B. Y., Lin, P., Huang, X. H. H., and Yu, J. Z.: Sources of humic-like substances in the Pearl River Delta, China: positive matrix factorization analysis of PM2.5 major components and source markers, Atmos. Chem. Phys., 15, 1995–2008, https://doi.org/10.5194/acp-15-1995-2015, 2015.
Lanz, V. A., Alfarra, M. R., Baltensperger, U., Buchmann, B., Hueglin, C., and Prévôt, A. S. H.: Source apportionment of submicron organic aerosols at an urban site by factor analytical modelling of aerosol mass spectra, Atmos. Chem. Phys., 7, 1503–1522, https://doi.org/10.5194/acp-7-1503-2007, 2007.
Leiva, M. A., Araya, M. C., Alvarado, A. M., and Seguel, R. J.: Uncertainty estimation of anions and cations measured by ion chromatography in fine urban ambient particles (PM2.5), Accredit. Qual. Assur., 17, 53–63, https://doi.org/10.1007/s00769-011-0844-4, 2012.
Lelieveld, J., Evans, J. S., Fnais, M., Giannadaki, D., and Pozzer, A.: The contribution of outdoor air pollution sources to premature mortality on a global scale, Nature, 525, 367–371, https://doi.org/10.1038/nature15371, 2015.
Liu, J., Li, J., Zhang, Y., Liu, D., Ding, P., Shen, C., Shen, K., He, Q., Ding, X., and Wang, X.: Source apportionment using radiocarbon and organic tracers for PM2.5 carbonaceous aerosols in Guangzhou, South China: contrasting local- and regional-scale haze events, Environ. Sci. Technol., 48, 12002, https://doi.org/10.1021/es503102w, 2014.
Mason, B.: Principles of Geochemistry, 4nd edition, John Wiley and Sons, New York, 1982.
MEE (Ministry of Ecology and Environment): Ambient air and stationary source emission – Determination of metals in ambient particulate matter – Inductively coupled plasma/mass spectrometry (ICP-MS) (HJ 657-2013), available at: http://kjs.mep.gov.cn/hjbhbz/bzwb/jcffbz/201308/t20130820_257714.shtml (last access: 5 August 2018), 2013a.
MEE (Ministry of Ecology and Environment): Technical Specifications for gravimetric measurement methods for PM2.5 in ambient air (HJ 656-2013), available at: http://kjs.mep.gov.cn/hjbhbz/bzwb/jcffbz/201308/t20130802_256857.shtml (last access: 5 August 2018), 2013b.
MEE (Ministry of Ecology and Environment): Ambient Air-Determination of the water soluble anions (F−, Cl−, Br−, , , , , ) from atmospheric particles-Ion chromatography (HJ 799-2016), available at: http://kjs.mep.gov.cn/hjbhbz/bzwb/jcffbz/201605/t20160519_337906.shtml (last access: 5 August 2018), 2016a.
MEE (Ministry of Ecology and Environment): Ambient air-Determination of the water soluble cations (Li+, Na+, , K+, Ca2+, Mg2+) from atmospheric particles-Ion chromatography (HJ 800-2016), available at: http://kjs.mep.gov.cn/hjbhbz/bzwb/jcffbz/201605/t20160519_337907.shtml (last access: 5 August 2018), 2016b.
Ming, L., Jin, L., Li, J., Fu, P., Yang, W., Liu, D., Zhang, G., Wang, Z., and Li, X.: PM2.5 in the Yangtze River Delta, China: Chemical compositions, seasonal variations, and regional pollution events, Environ. Pollut., 223, 200–212, https://doi.org/10.1016/j.envpol.2017.01.013, 2017.
Ministry of Environmental Protection: Report on the State of the Environment in China 2015, available at: http://www.zhb.gov.cn/hjzl/zghjzkgb/lnzghjzkgb/201606/P020160602333160471955.pdf (last access: 5 August 2018), 2016.
Nanfang Daily: PM2.5 level fluctuations down in PRD region in the past decade, available at: http://epaper.southcn.com/nfdaily/html/2016-01/03/content_7504954.htm (last access: 5 August 2018), 2016.
Norris, G. and Duvall, R.: EPA Positive Matrix Factorization (PMF) 5.0 Fundamentals and user guide, available at: https://www.epa.gov/sites/production/files/2015-02/documents/pmf_5.0_user_guide.pdf (last access: 5 August 2018), 2014.
Paatero, P.: The Multilinear Engine – A Table-Driven, Least Squares Program for Solving Multilinear Problems, Including the n-Way Parallel Factor Analysis Model, J. Comput. Graph. Stat., 8, 854–888, https://doi.org/10.1080/10618600.1999.10474853, 1999.
Paatero, P. and Tapper, U.: Positive matrix factorization: A non-negative factor model with optimal utilization of error estimates of data values, Environmetrics, 5, 111–126, https://doi.org/10.1002/env.3170050203, 1994.
People's Government of Guangdong Province: Major Pollutants Emission Reduction implementation plan during the 12th Five-year Plan in Guangdong Province, available at: http://zwgk.gd.gov.cn/006939748/201212/t20121219_359131.html (last access: 5 August 2018), 2012.
People's Government of Shenzhen Municipality: Air quality improvement plan in Shenzhen, available at: http://zwgk.gd.gov.cn/007543382/201309/t20130930_407564.html (last access: 5 August 2018), 2013.
Physick, W. L. and Goudey, R.: Estimating an annual-average RSP concentration for Hong Kong using days characteristic of the dominant weather patterns, Atmos. Environ., 35, 2697–2705, https://doi.org/10.1016/S1352-2310(00)00413-1, 2001.
Polissar, A. V., Hopke, P. K., Paatero, P., Malm, W. C., and Sisler, J. F.: Atmospheric aerosol over Alaska: 2. Elemental composition and sources, J. Geophys. Res., 103, 19045–19057, https://doi.org/10.1029/98JD01212, 1998.
Reyes-Villegas, E., Green, D. C., Priestman, M., Canonaco, F., Coe, H., Prévôt, A. S. H., and Allan, J. D.: Organic aerosol source apportionment in London 2013 with ME-2: exploring the solution space with annual and seasonal analysis, Atmos. Chem. Phys., 16, 15545–15559, https://doi.org/10.5194/acp-16-15545-2016, 2016.
Rodríguez, S., Van Dingenen, R., Putaud, J.-P., Dell'Acqua, A., Pey, J., Querol, X., Alastuey, A., Chenery, S., Ho, K.-F., Harrison, R., Tardivo, R., Scarnato, B., and Gemelli, V.: A study on the relationship between mass concentrations, chemistry and number size distribution of urban fine aerosols in Milan, Barcelona and London, Atmos. Chem. Phys., 7, 2217–2232, https://doi.org/10.5194/acp-7-2217-2007, 2007.
Sarnat, J. A., Marmur, A., Klein, M., Kim, E., Russell, A. G., Sarnat, S. E., Mulholland, J. A., Hopke, P. K., and Tolbert, P. E.: Fine Particle Sources and Cardiorespiratory Morbidity: An Application of Chemical Mass Balance and Factor Analytical Source-Apportionment Methods, Environ. Health Persp., 116, 459–66, https://doi.org/10.1289/ehp.10873, 2008.
Tan, J., Duan, J., Ma, Y., He, K., Cheng, Y., Deng, S., Huang, Y., and Si-Tu, S.: Long-term trends of chemical characteristics and sources of fine particle in Foshan City, Pearl River Delta: 2008–2014, Sci. Total Environ., 565, 519–528, https://doi.org/10.1016/j.scitotenv.2016.05.059, 2016.
Tao, J., Zhang, L., Cao, J., Zhong, L., Chen, D., Yang, Y., Chen, D., Chen, L., Zhang, Z., Wu, Y., Xia, Y., Ye, S., and Zhang, R.: Source apportionment of PM2.5 at urban and suburban areas of the Pearl River Delta region, south China – With emphasis on ship emissions, Sci. Total Environ., 574, 1559–1570, https://doi.org/10.1016/j.scitotenv.2016.08.175, 2017.
Taylor, S. R. and Mclennan, S. M.: The geochemical evolution of the continental crust, Rev. Geophys., 33, 293–301, https://doi.org/10.1029/95RG00262, 1995.
Ulbrich, I. M., Canagaratna, M. R., Zhang, Q., Worsnop, D. R., and Jimenez, J. L.: Interpretation of organic components from Positive Matrix Factorization of aerosol mass spectrometric data, Atmos. Chem. Phys., 9, 2891–2918, https://doi.org/10.5194/acp-9-2891-2009, 2009.
Villalobos, A. M., Barraza, F., Jorquera, H., and Schauer, J. J.: Chemical speciation and source apportionment of fine particulate matter in Santiago, Chile, 2013, Sci. Total Environ., 512–513, 133–142, https://doi.org/10.1016/j.scitotenv.2015.01.006, 2015.
Visser, S., Slowik, J. G., Furger, M., Zotter, P., Bukowiecki, N., Canonaco, F., Flechsig, U., Appel, K., Green, D. C., Tremper, A. H., Young, D. E., Williams, P. I., Allan, J. D., Coe, H., Williams, L. R., Mohr, C., Xu, L., Ng, N. L., Nemitz, E., Barlow, J. F., Halios, C. H., Fleming, Z. L., Baltensperger, U., and Prévôt, A. S. H.: Advanced source apportionment of size-resolved trace elements at multiple sites in London during winter, Atmos. Chem. Phys., 15, 11291–11309, https://doi.org/10.5194/acp-15-11291-2015, 2015.
Wang, H., Tian, M., Chen, Y., Shi, G., Liu, Y., Yang, F., Zhang, L., Deng, L., Yu, J., Peng, C., and Cao, X.: Seasonal characteristics, formation mechanisms and source origins of PM2.5 in two megacities in Sichuan Basin, China, Atmos. Chem. Phys., 18, 865–881, https://doi.org/10.5194/acp-18-865-2018, 2018.
Wang, J., Ho, S. S. H., Ma, S., Cao, J., Dai, W., Liu, S., Shen, Z., Huang, R., Wang, G., and Han, Y.: Characterization of PM2.5 in Guangzhou, China: uses of organic markers for supporting source apportionment, Sci. Total Environ., 550, 961–971, https://doi.org/10.1016/j.scitotenv.2016.01.138, 2016.
Wang, Q. Q., Huang, X. H. H., Zhang, T., Zhang, Q., Feng, Y., Yuan, Z., Wu, D., Lau, A. K. H., and Yu, J. Z.: Organic tracer-based source analysis of PM2.5 organic and elemental carbon: A case study at Dongguan in the Pearl River Delta, China, Atmos. Environ., 118, 164–175, https://doi.org/10.1016/j.atmosenv.2015.07.033, 2015.
Wang, Q., Feng, Y., Huang, X. H. H., Griffith, S. M., Zhang, T., Zhang, Q., Wu, D., and Yu, J. Z.: Nonpolar organic compounds as PM2.5 source tracers: Investigation of their sources and degradation in the Pearl River Delta, China, J. Geophys. Res.-Atmos., 121, 11862–11879, https://doi.org/10.1002/2016JD025315, 2017.
Yamasoe, M. A., Artaxo, P., Miguel, A. H., and Allen, A. G.: Chemical composition of aerosol particles from direct emissions of vegetation fires in the Amazon Basin: water-soluble species and trace elements, Atmos. Environ., 34, 1641–1653, https://doi.org/10.1016/S1352-2310(99)00329-5, 2000.
Yuan, Z., Lau, A., Zhang, H., Yu, J., Louie, P., and Fung, J.: Identification and spatiotemporal variations of dominant PM10 sources over Hong Kong, Atmos. Environ., 40, 1803–1815, https://doi.org/10.1016/j.atmosenv.2005.11.030, 2006.
Yuan, Z. B., Yu, J. Z., Lau, A. K. H., Louie, P. K. K., and Fung, J. C. H.: Application of positive matrix factorization in estimating aerosol secondary organic carbon in Hong Kong and its relationship with secondary sulfate, Atmos. Chem. Phys., 6, 25–34, https://doi.org/10.5194/acp-6-25-2006, 2006.
Zou, B. B., Huang, X. F., Zhang, B., Dai, J., Zeng, L. W., Feng, N., and He, L. Y.: Source apportionment of PM2.5 pollution in an industrial city in southern China, Atmos. Pollut. Res., 8, 1193–1202, https://doi.org/10.1016/j.apr.2017.05.001, 2017.