
the Creative Commons Attribution 4.0 License.
the Creative Commons Attribution 4.0 License.
 | 16 Jul 2026
Measurement report: Investigation of regional pollutant transport to Beijing, China based on a unique 528 m platform
Xiaoxue Liu
Pengkun Ma
Yubing Pan
Qianqian Wang
Lei Zhang
Observations at elevated altitudes can capture the chemical characteristics of regional aerosols more effectively than ground-level measurements, but in situ measurements of aerosols over megacities remain scarce. In this work, aerosol composition and gaseous pollutants measured from 2020 to 2024 at a 528 m landmark tower in downtown Beijing, together with ground-level observations, are analyzed to understand regional pollutant transport. The results reveal that both aerosol mass concentration and composition differ significantly among air masses originating from different directions. Further analysis of sulfur and nitrogen oxidation ratios showed that both were significantly higher in air masses from the south and northeast compared to those from the northwest. This difference is likely attributable to higher relative humidity (RH) in the former, which promotes heterogeneous oxidation of SO2 and NO2 during transport. Regional aerosols were downwards transported to ground efficiently through planetary boundary layer (PBL) process during daytime, thereby exacerbating air pollution in Beijing. These findings underscore the critical role of regional transport in shaping Beijing's aerosol burden and highlight how the chemical signatures of transported aerosols reflect their diverse source regions and formation mechanisms.
- Article
(5773 KB) - Full-text XML
-
Supplement
(677 KB) - BibTeX
- EndNote


The megacity of Beijing and the surrounding North China Plain (NCP) constitute one of the world's most polluted and intensively studied regions for regional air pollution dynamics, owing to its dense population, rapid industrialization, and complex meteorology (Li et al., 2016). In addition to local emissions, regional transport is a major contributor to Beijing's air pollution (Quan et al., 2020). Model simulations indicate that the regional contribution to PM2.5 in Beijing ranges from 27 % to 78 % and has been increasing annually (Li et al., 2013; Zhang et al., 2018a, 2024). This contribution is particularly important during haze events, when regional transport has sometimes been identified as the primary driver. Observation-based studies further show that pollutants such as sulfur dioxide (SO2) and fine particles (PM2.5; particle matter with the radius equal/less 2.5 µm) are transported northwards along the Taihang mountains, exacerbating air pollution in Beijing (Li et al., 2015; Tan et al., 2021). These studies underscore that mitigating Beijing's air pollution cannot rely on local emission controls alone (Li et al., 2015).
Regional pollutant transport is not merely a local environmental issue but a systemic atmospheric process governed by interactions among anthropogenic emissions, synoptic-scale weather patterns, topographic constraints, and PBL process (Li et al., 2016). Among these processes, the vertical transport between the PBL and free troposphere (FT) is critically important, but remains poorly understudied (Wang et al., 2024; Quan et al., 2025). This gap stems largely from the need for vertical profiling of atmospheric pollutants to fully characterize the composition and evolution of aerosols, a requirement that poses significant challenges for observational systems, as most measurements have been conducted at ground level. Regional pollutant transport occurs more efficiently in the lower FT, which is supported by both observations and model simulations (Quan et al., 2020; Sun et al., 2022). Quan et al. (2020) observed an elevated pollutant layer (EPL) at an altitude of 1.4–1.7 km over Beijing by lidar and aircraft measurements. Model simulations indicate the EPL in the lower FT formed over the NCP due to a mountain-induced vertical vortex and was subsequently transported to Beijing by southerly winds. Sun et al. (2022) observed high concentrations of sulfate-dominated aerosols in the FT over Northeast China, in contrast to the low aerosol loadings, primarily composed of organic compounds, in the PBL. Their simulations indicate that these elevated pollutants in the lower FT were transported directly from the North China Plain (NCP) by warm, moist air masses. While downward transport of pollutants from the FT to the PBL may be influenced by PBL process or local circulation, the underlying mechanisms remain poorly understood.
Moreover, the chemical composition of aerosol varies substantially in different regions, depending on emission sources and atmospheric chemical reactions (Zhang, 2014). For example, coal combustion emits SO2, which is oxidized in the atmosphere to form sulfate, while vehicle exhaust releases nitrogen oxides (NOx), a precursor to nitrate. Numerous studies utilizing the Hybrid Single-Particle Lagrangian Integrated Trajectory (HYSPLIT) model have demonstrated that synoptic-scale meteorology strongly influences the chemical characteristics of particulate matter in Beijing (Ma et al., 2021; Kang et al., 2023). For instance, air masses arriving from southern and southeastern industrial corridors, including provinces such as Hebei, Shandong, and Henan, are consistently associated with elevated concentrations of secondary inorganic aerosols (SIAs), including nitrate (NO), sulfate (SO), and ammonium (NH), due to high precursor emissions of NOx, SO2, and ammonia (NH3) from coal combustion, vehicle exhaust, and agricultural activities (Du et al., 2019). Conversely, air masses originating from northern or northwestern regions, such as Inner Mongolia or the Gobi Desert, are typically linked to dust-laden conditions and higher contribution of mineral dust components to aerosol loading (Wang et al., 2017). Notably, most observations are conducted at ground level, where local and transported pollutants are well mixed (Quan et al., 2020, 2025). Aircraft observations showed that aerosol compositions varied drastically with altitude, especially near the top of PBL (Liu et al., 2019). Therefore, observations in high layer may capture chemical characteristics of transported aerosols from different regions much better.
To address these research gaps, aerosol composition and gaseous pollutants measured from 2020 to 2024 at a 528 m landmark tower in downtown Beijing, together with ground-level observations of pollutants such as nitrogen dioxide (NO2), SO2, and PM2.5, are analyzed in this study to understand regional pollutant transport to Beijing and thereby improve our understanding of near-surface air pollution.
The comprehensive field campaign was conducted from October 2020 to December 2024 on the roof of the CITIC Tower (528 m a.g.l.). The CITIC Tower (longitude: 116.47°, latitude: 39.92°) is situated adjacent to the East Third Ring Road (Fig. 1), in a mixed residential and commercial area with no large point source nearby. The measurements included aerosol mass concentration and composition (SO, NO, NH, Chl−, and organic aerosols (Org)), trace gases, including SO2, NO2, ozone (O3), and meteorological variables (temperature (T) and relative humidity (RH)). The observations were conducted mainly in autumn, winter and spring, when air pollution in Beijing is more severe, resulting in fewer data points were collected in summer (Table 1). All pollutants were measured simultaneously, with the same data coverage.
Table 1Total Observation days at the CITIC station from 2020 to 2024.
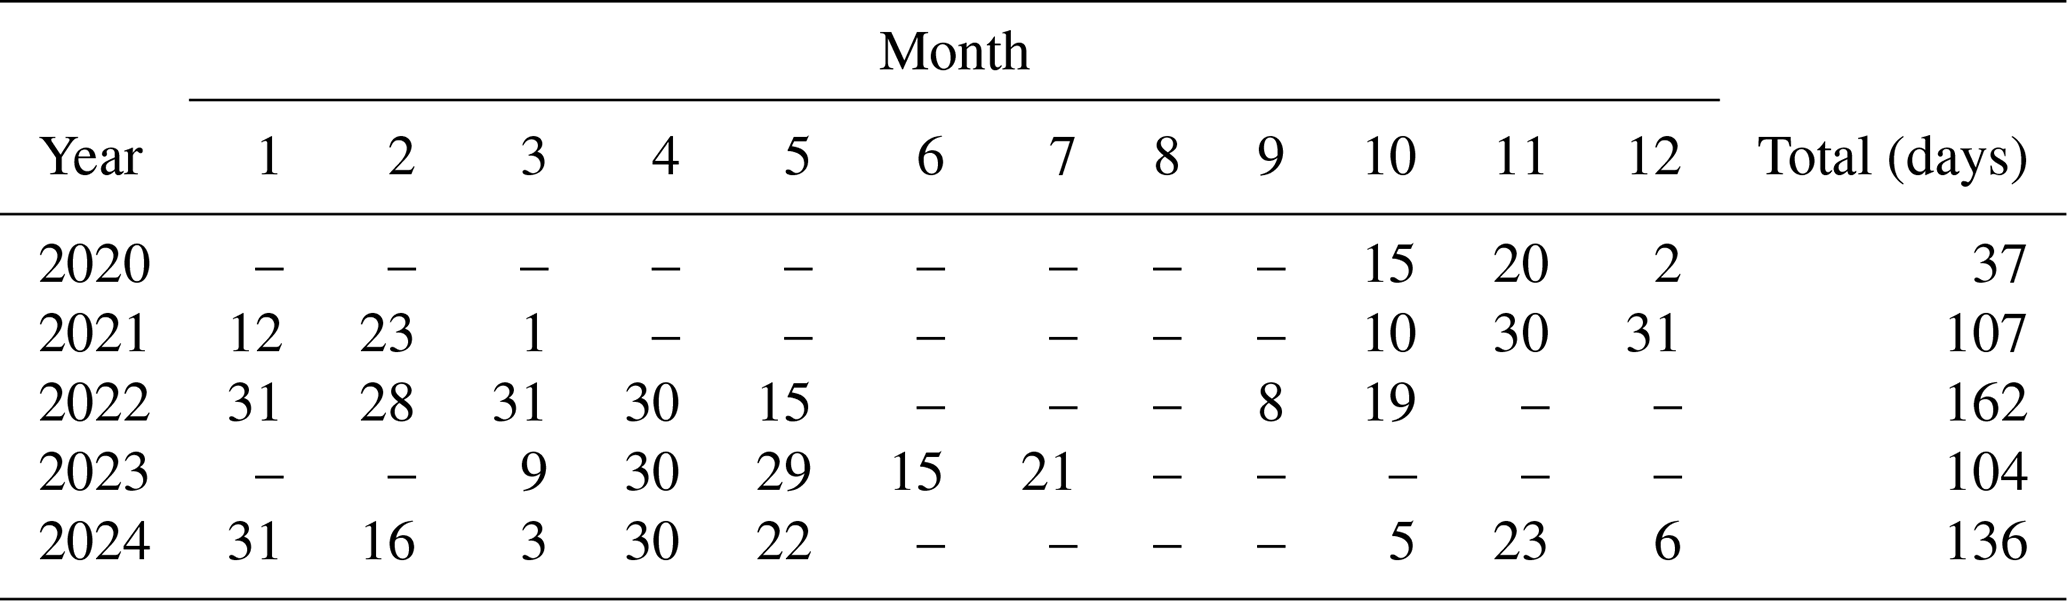
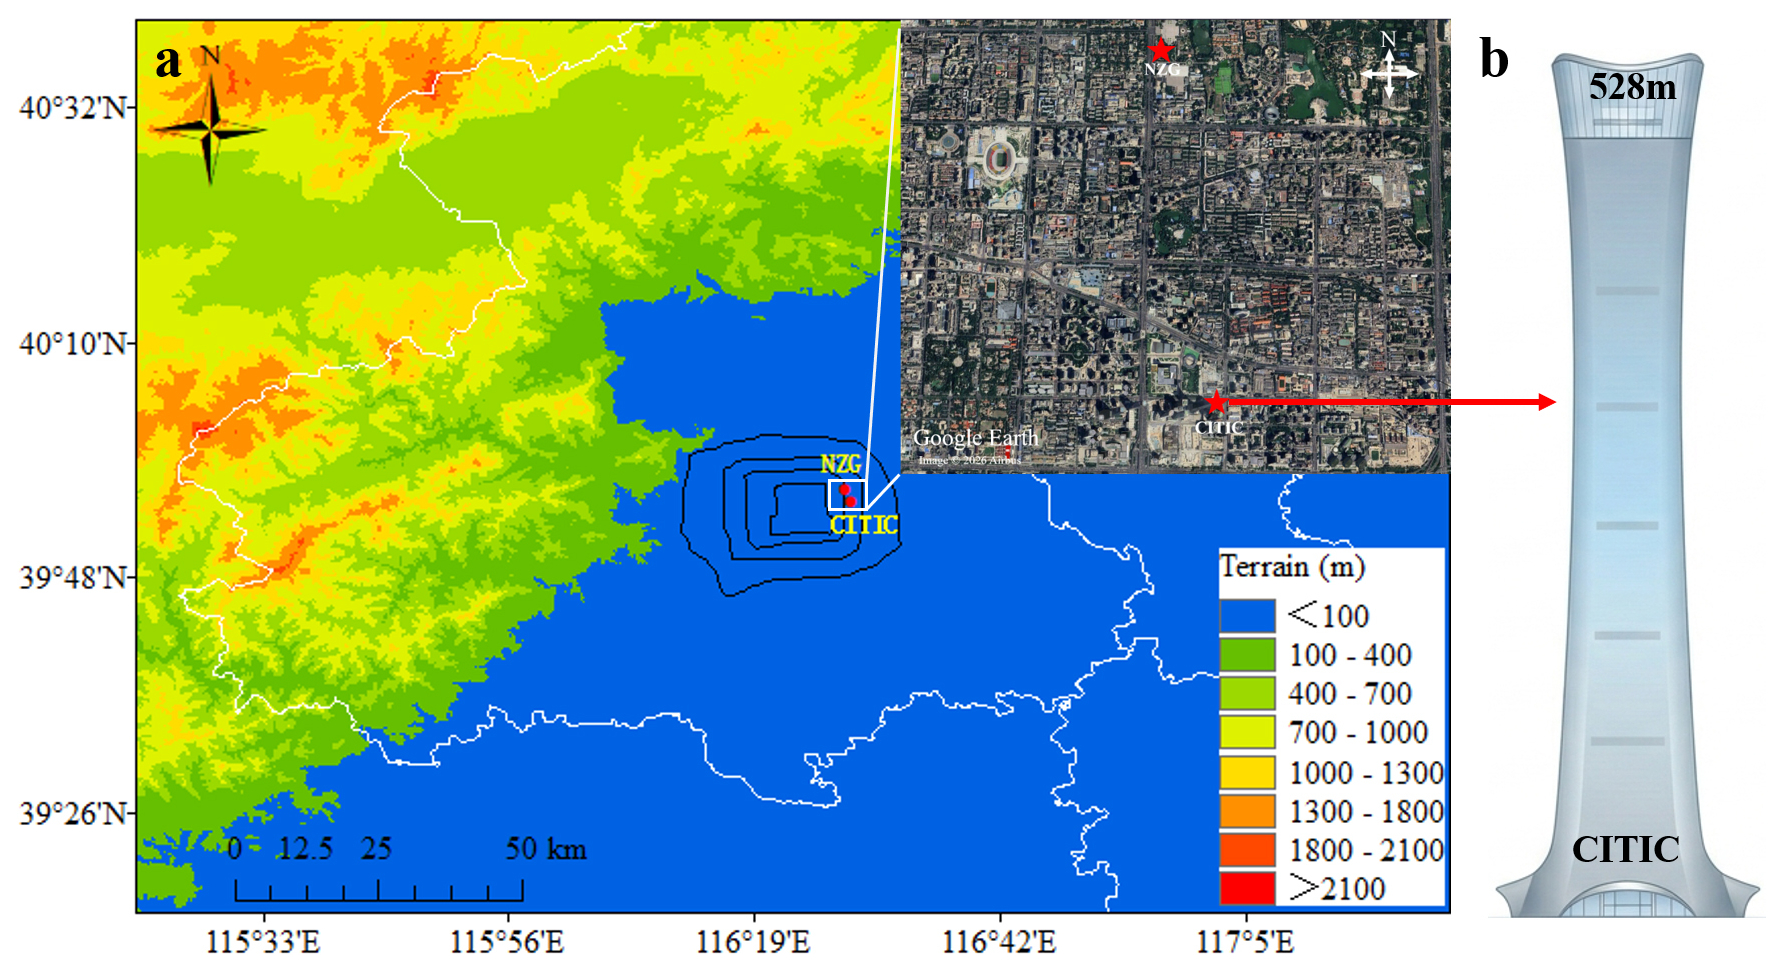
Figure 1Locations of the monitoring sites used in this study with lack lines, red dots representing the second to fifth rings surrounding central Beijing, and CITIC and NZG stations, respectively (a); sketch map of the 528 m CITIC Tower (b).
The real-time chemical composition of non-refractory fine particles (NR-PM2.5), including SO, NO, NH, Chl−, and Org, was measured with a ToF-ACSM (Aerodyne Co. Ltd., USA), which relies upon thermal vaporization and 70 eV electron-impact ionization (EI) (Jayne et al., 2000). The ambient particles were sampled into the ToF-ACSM through a PM2.5 cyclone (by URG), followed by a multi-bore Nafion dryer (Perma Pure, Model MD-700-24F-3) to dry the aerosols. The PM2.5 cyclone and the Nafion dryer were connected via a 2 m-long stainless steel tube with an inner diameter of approximately 7.8 mm (outer diameter: inch), and the total sampling flow rate was about 3 L min−1. Based on these parameters, the residence time of the sampled air in this tube section is estimated to be approximately 2 seconds. For such a relatively short straight tube and for the predominantly submicron particles (PM2.5) in the aerosol, particle losses caused by turbulent deposition, diffusion losses, or gravitational settling are generally negligible. Therefore, no additional correction for particle losses in the sampling line was applied in this study. Inside the Nafion dryer, the sample aerosol passes through the inner tubes, while a dry purge gas flows counter-currently on the shell side. The concentration gradient drives water vapor across the Nafion membrane, effectively reducing the sample's RH to below 40 % (Lin et al., 2021). The dried ambient aerosol particles are focused into the 600 °C standard vaporizer through PM2.5 aerodynamic lenses with a 100 µm critical orifice at a flow rate of 1.4 cm3 s−1, where they are thermally vaporized to produce gaseous fragments. These vapors are subsequently ionized by electron impact at 70 eV using a tungsten filament, after which the resulting ions are analyzed in a time-of-flight mass spectrometer based on their mass-to-charge ratio. The detected ion signals are then converted into mass concentrations using standard calibration and ionization efficiency procedures, as described in Fröhlich et al. (2013) and Williams et al. (2013). The relative ionization efficiency (RIE) calibration of the ToF-ACSM was performed once two weeks.
The mass concentration of PM2.5 was monitored by an R&P model 1400a Tapered Element Oscillating Microbalance (TEOM, Thermo Fisher Scientific Co., USA) at a time resolution of 1 min. This instrument was operated with a hydrophobic filter material to reduce the humidity of the incoming sampled air. The filter was replaced and flow rates of TEOM were checked once two weeks. The collocated gaseous species, including SO2 (TL43i), NOx (TL42i), and O3 (TL49i), were measured by various gas analyzers (Thermo Fisher Scientific Co., USA) at a time resolution of 1 min. Meteorological parameters (T and RH) were measured by an Automatic Weather Station (Huayunshengda, China). All instruments at the CITIC are calibrated once two weeks. Data analysis was performed using Python (version 3.13). All raw observations at the CITIC station were averaged to a temporal resolution of 1 h. Prior to analysis, quality control (QC) procedures were applied to the dataset, which included corrections based on zero calibrations and the removal of anomalous data.
Additionally, ground level observations at NZG station, including PM2.5, SO2, NO2, and O3, with time resolution of 1 h. The NZG station is located at north of the CITIC with a distance of 4 km (Fig. 1). The NZG station (longitude: 116.47°, latitude: 39.97°) is one of the national-level ambient air quality monitoring stations operated by the China National Environmental Monitoring Centre (CNEMC). All measurements at the NZG follow mandatory national technical specifications. The QC of observations includes routine zero calibrations, multi-point precision checks, annual accuracy audits, traceable standard-gas transfer through regional QC laboratories, and parallel manual gravimetric comparison for PM2.5. The reliability of CNEMC data has been independently verified in peer-reviewed literature through cross-validation against measurements from the U.S. Embassy (Liang et al., 2016). To maintain consistency, observations at the NZG station during the same period listed in Table 1 were analyzed.
The 2 d (48 h) back trajectories were calculated every hour at 500 m height using the Hybrid Single-Particle Lagrangian Integrated Trajectory (HYSPLIT, NOAA) 4.9 model (Draxler and Hess, 1998), and Global Data Analysis System (GDAS) outputs with 1° × 1° resolution and observed PM2.5 concentration are used as input (Stein et al., 2015). The trajectories during our observations (shown in Table 1) were then grouped into six clusters using the total spatial variance (TSV) method (Draxler et al., 2012). This method minimizes the inter-cluster differences among trajectories while maximizing the inter-cluster differences, which has been widely used in previous studies (Chen et al., 2015; Kang et al., 2023). The potential source contribution function (PSCF) was used to identify the potential source area (Stohl, 1996). The PSCF method divides the research area into i×j grids, and the number of air mass trajectories passing through the grid during the research period is counted to calculate the probability of occurrence of pollution trajectories. The time coverage in trajectories clustering and PSCF is same as observations shown in Table 1.
3.1 Aerosol composition in the 528 m layer over Beijing
The mean mass concentration of NR-PM2.5 at the CITIC station was 19.14 ± 28.24 µg m−3 during observational period (Fig. 2a). The mass concentrations of Org, SO, NO, NH, and Chl− were 7.0 ± 9.3, 2.0 ± 3.0, 6.7 ± 10.8, 3.0 ± 4.1, and 0.4 ± 1.1 µg m−3 respectively, accounting for 36.8 ± 33.0 %, 10.5 ± 10.5 %, 34.8 ± 38.1 %, 15.9 ± 14.6 %, and 2.1 ± 3.7 % in mass fraction. The fraction of SIAs, including SO, NO, and NH, was 61.2 % in NR-PM2.5. This proportion is notably higher than observations at ground stations in urban Beijing. For example, in the observation of Ma et al. (2021), SIAs mass fraction ranged from 42 % to 56 % during two months experiment in Beijing (from 14 January to 6 March 2019). Seasonal aerosol composition in Beijing during 2012 to 2018 shows SIAs mass fractions were 52 %, 55 %, 49 %, and 45 % in spring, summer, autumn, and winter, respectively (Zhou et al., 2020).
The diurnal variations of aerosol components are shown in Fig. 2b, which offer insight into potential emission sources, local and regional transport, and aerosol chemical processing. Compared with observations at ground level, the diurnal variations in aerosol components at the CITIC station were remarkably weak (Fig. 2b). For example, the ratio of the peak (12:00 LT) to trough (06:00 LT) in Org was 1.15, and the ratios in SO, NO, NH, and Chl− were 1.09, 1.13, 1.09, and 1.15 respectively. Whereas, such ratios was about 2.0 at ground level (Zhou et al., 2020). Moreover, the peaks of Org, SO, and Chl− appear in the daytime, which are also contrary to that at ground level (Zhou et al., 2020; Quan et al., 2024).
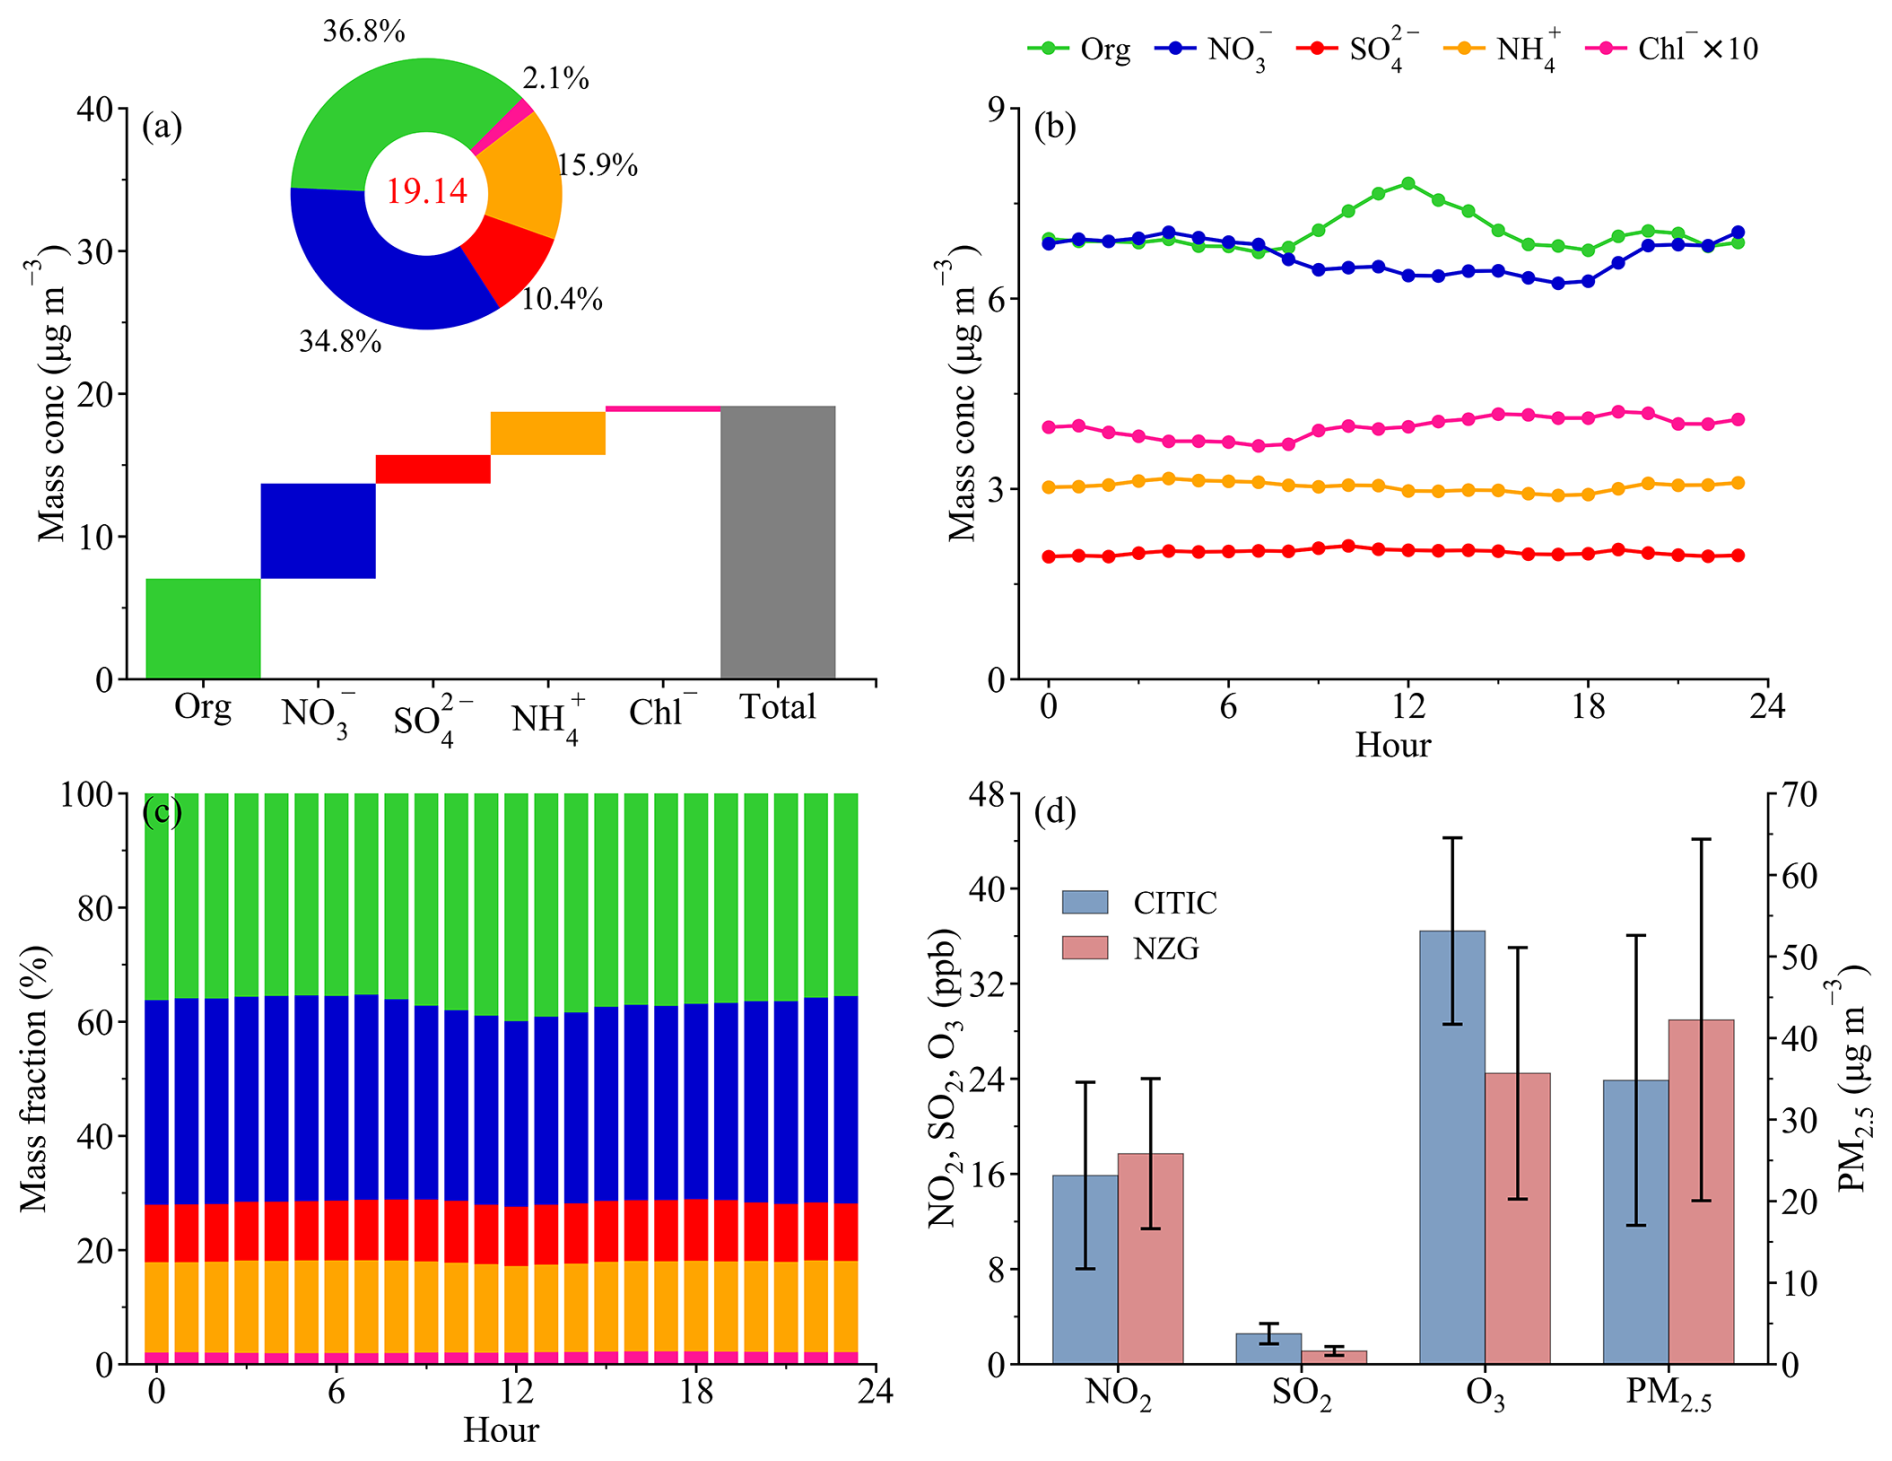
Figure 2The mean mass concentration and aerosol composition of NR-PM2.5 observed at the CITIC station (a); diurnal variations of the mean mass concentration (b) and fraction (c) of aerosol components; and comparisons of the mean NO2, SO2, O3, and PM2.5 between the CITIC and NZG stations (d) during observational period (2020–2024). The error bars are the 50 % standard deviations.
The diurnal variability in aerosol components is strongly modulated by meteorology, particularly the PBL process (Quan et al., 2013). The PBL height (PBLH) typically decreases at night and grows during the daytime (Stull, 1988). This daytime expansion in PBLH enhances the vertical mixing and dilution of pollutants, thereby reducing their near-surface concentrations (Habineza et al., 2025). However, the circumstances differ significantly at the elevated CITIC station (528 m a.g.l.), which lies above the PBL at night but within it during the daytime. Our previous observations (17 October–12 November 2020) indicated that the nocturnal PBLH was typically below 300 m, whereas the daytime PBLH was around 1000 m (Ma et al., 2023). At night, near-ground emissions are trapped within the shallow nocturnal PBL, while vertical transport to the overlying layer is substantially suppressed (Quan et al., 2025), resulting in low concentrations of pollutants at the CITIC station. In the morning, the PBL gradually develops due to increasing solar radiation. During this process, near-ground pollutants are vertically transported up to the CITIC station, thereby enhancing their concentrations. Additionally, enhanced formation of secondary organic aerosol (Cai et al., 2023) and sulfate (Liu et al., 2025) during daytime may also contribute to their daytime peaks.These processes jointly result in weak diurnal variations in aerosol components at the CITIC station. It is noteworthy that NO at the CITIC station remained at a high level at night but decreased slightly in daytime, which may be related to active nocturnal nitrogen chemistry above the PBL (Ma et al., 2023). Elevated NO3 levels in the RL (Wang et al., 2018) may also promote organic nitrate formation (Cai et al., 2023), thereby further contributing to the enhanced nighttime nitrate concentrations in this layer. More details on vertical mixing of pollutants will be presented in Sect. 3.4.
Moreover, pollutants in the 528 m layer may be more strongly influenced by regional transport compared to ground level. To examine this, we compared measurements between the CITIC station and the nearby ground-level NZG station, located approximately 4 km to the north (Fig. 1a). Due to the lack of concurrent aerosol composition measurements at ground station in the same period, only PM2.5 and gaseous pollutants were compared. As shown in Fig. 2d, PM2.5 at the CITIC station (34.8 ± 35.6 µg m−3) was lower than that at the NZG station (42.2 ± 44.4 µg m−3) while O3 showed the opposite trend. For NO2 and SO2, NO2 at the CITIC station (15.9 ± 7.8 ppb) was 10.4 % lower than that at the NZG station (17.7 ± 6.3 ppb), while SO2 showed a contrasting pattern. SO2 in the 528 m layer (2.6 ± 0.9 ppb) was 130 % higher than that at the NZG station (1.1 ± 0.4 ppb) (Fig. 2d). As a megacity with 7 million vehicles, NOx, including NO2 and NO, are key atmospheric pollutants to air quality in Beijing (Shen et al., 2024). Vehicle-emitted NO2 is rapidly diluted through vertical mixing, explaining its lower concentrations aloft. In contrast, SO2 emissions in Beijing have been stringently controlled over the past decade. Consequently, ambient SO2 is now predominantly derived from regional transport rather than local sources (Zhang et al., 2019). The observed pattern, enhanced SO2 and reduced NO2 in the 528 m layer relative to ground, confirms that pollutants in the 528 m layer over Beijing are influenced by a combination of regional transport and vertical mixing of locally emitted pollutants.
During regional transport, gaseous pollutants such as SO2, NO2, and NH3 undergo chemical reactions to form SIAs (Tan et al., 2021), resulting in a high SIAs fraction in the 528 m layer. Aerosols and their precursors vary substantially across regions due to differences in source and atmospheric processing (Tao et al., 2017). Consequently, aerosol components over Beijing are expected to differ depending on the origin of incoming air masses. To improve our understanding of these processes, aerosol composition under distinct transport pathways is analyzed in the following sections.
3.2 Aerosol composition under different transport pathways
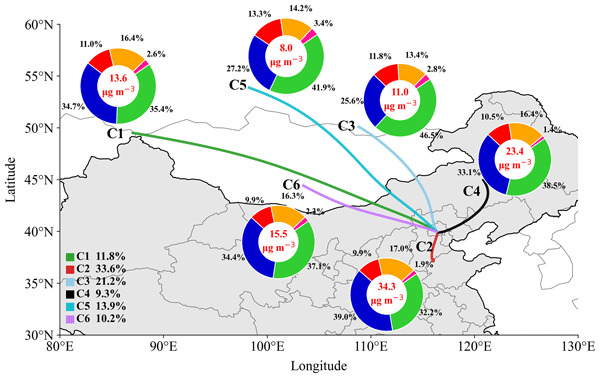
To investigate the regional transport of fine particles to Beijing, the HYSPLIT model (Draxler and Hess, 1998) was used to identify the source regions and transport pathways of air masses arriving over Beijing at altitude of 500 m. Figure 3 shows the six clustered transport routes. Clusters 1, 3, and 5 correspond to air masses originating from the northwest of Beijing, whereas Clusters 2, 4, and 6 correspond to air masses originating from the south, northeast, and west of Beijing. The trajectory lengths of each cluster reflect the transport speed of the air masses: longer trajectories indicate faster movement. This is corroborated by the mean wind speed (WS) in Beijing under each cluster (Table 2). Wind speeds were higher for Clusters 1 (3.6 ± 2.5 m s−1), 3 (3.0 ± 2.0 m s−1), and 5 (4.1 ± 2.7 m s−1) compared to Clusters 2 (2.2 ± 1.4 m s−1), 4 (2.7 ± 1.6 m s−1), and 6 (2.4 ± 1.6 m s−1). The spatial distribution of potential source contributions at altitude of 500 m in the six clusters was consistent with this classification (Fig. 4). As a comparison, we also investigated the spatial distribution of potential source contributions at the ground level in the six clusters for the same period (Fig. S1). The results show that potential source contributions at the ground level originated more from local sources than those in the aloft layer.
Table 2The mean wind speed at NZG station, and temperature and RH at the CITIC station in the six clusters.
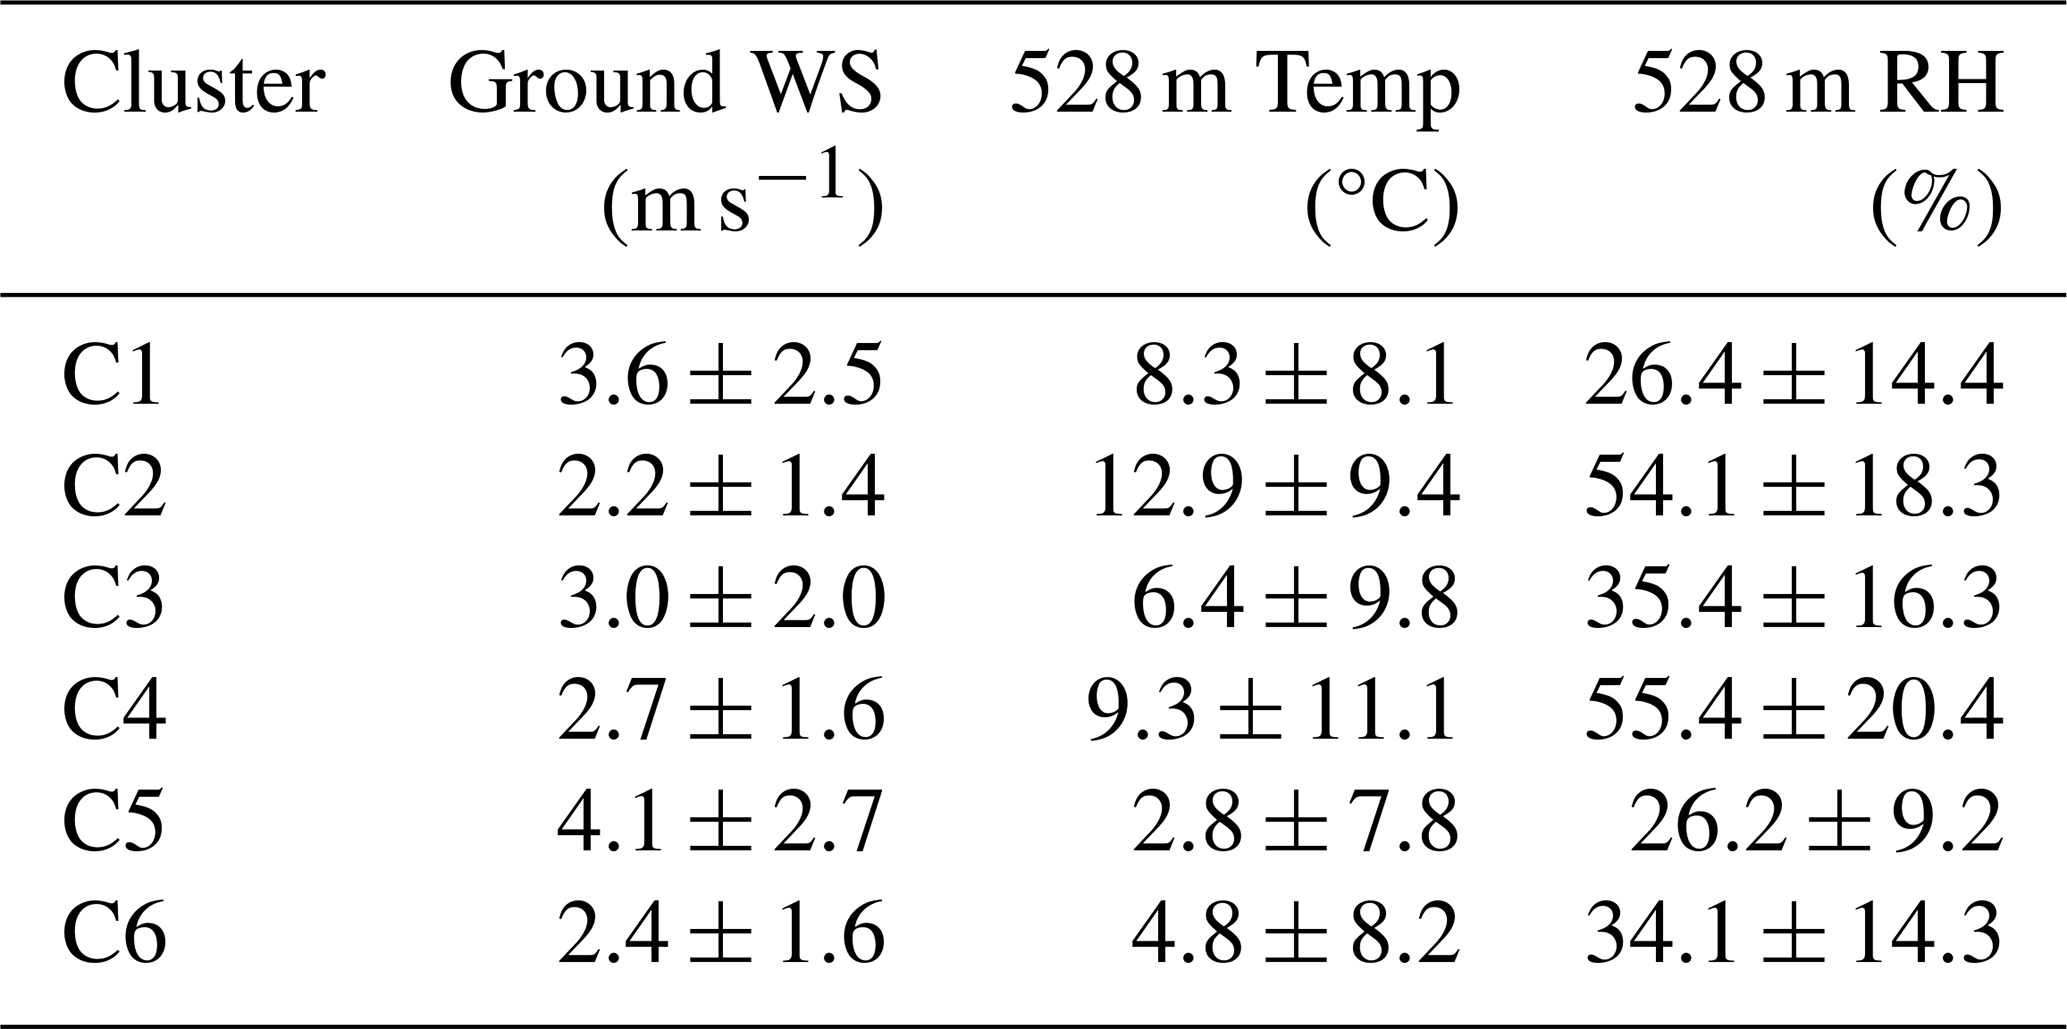
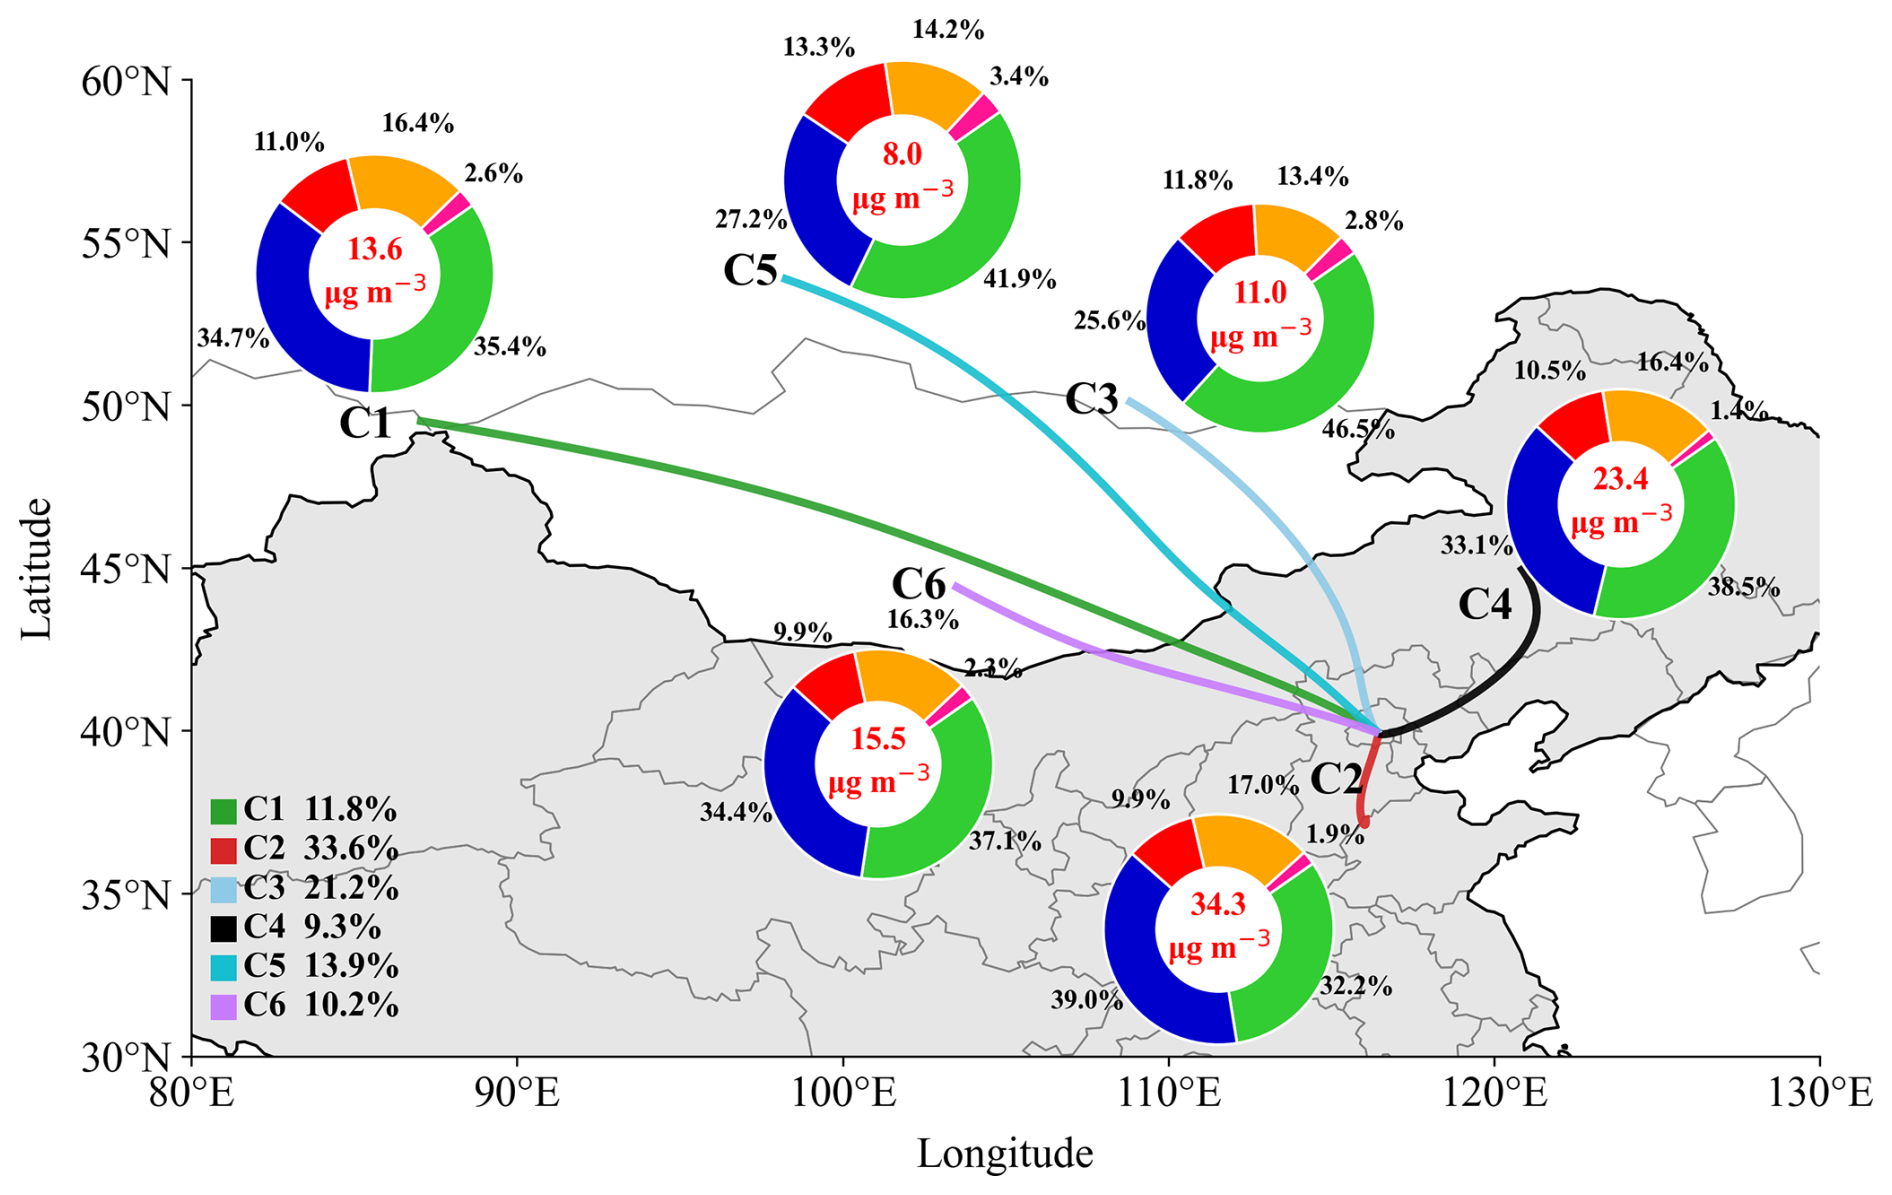
Figure 3Forty-eight hours back trajectories of air masses over Beijing at altitude of 500 m in the six clusters (C1–C6), together with the mean NR-PM2.5 mass concentration and composition at the CITIC station in each cluster.
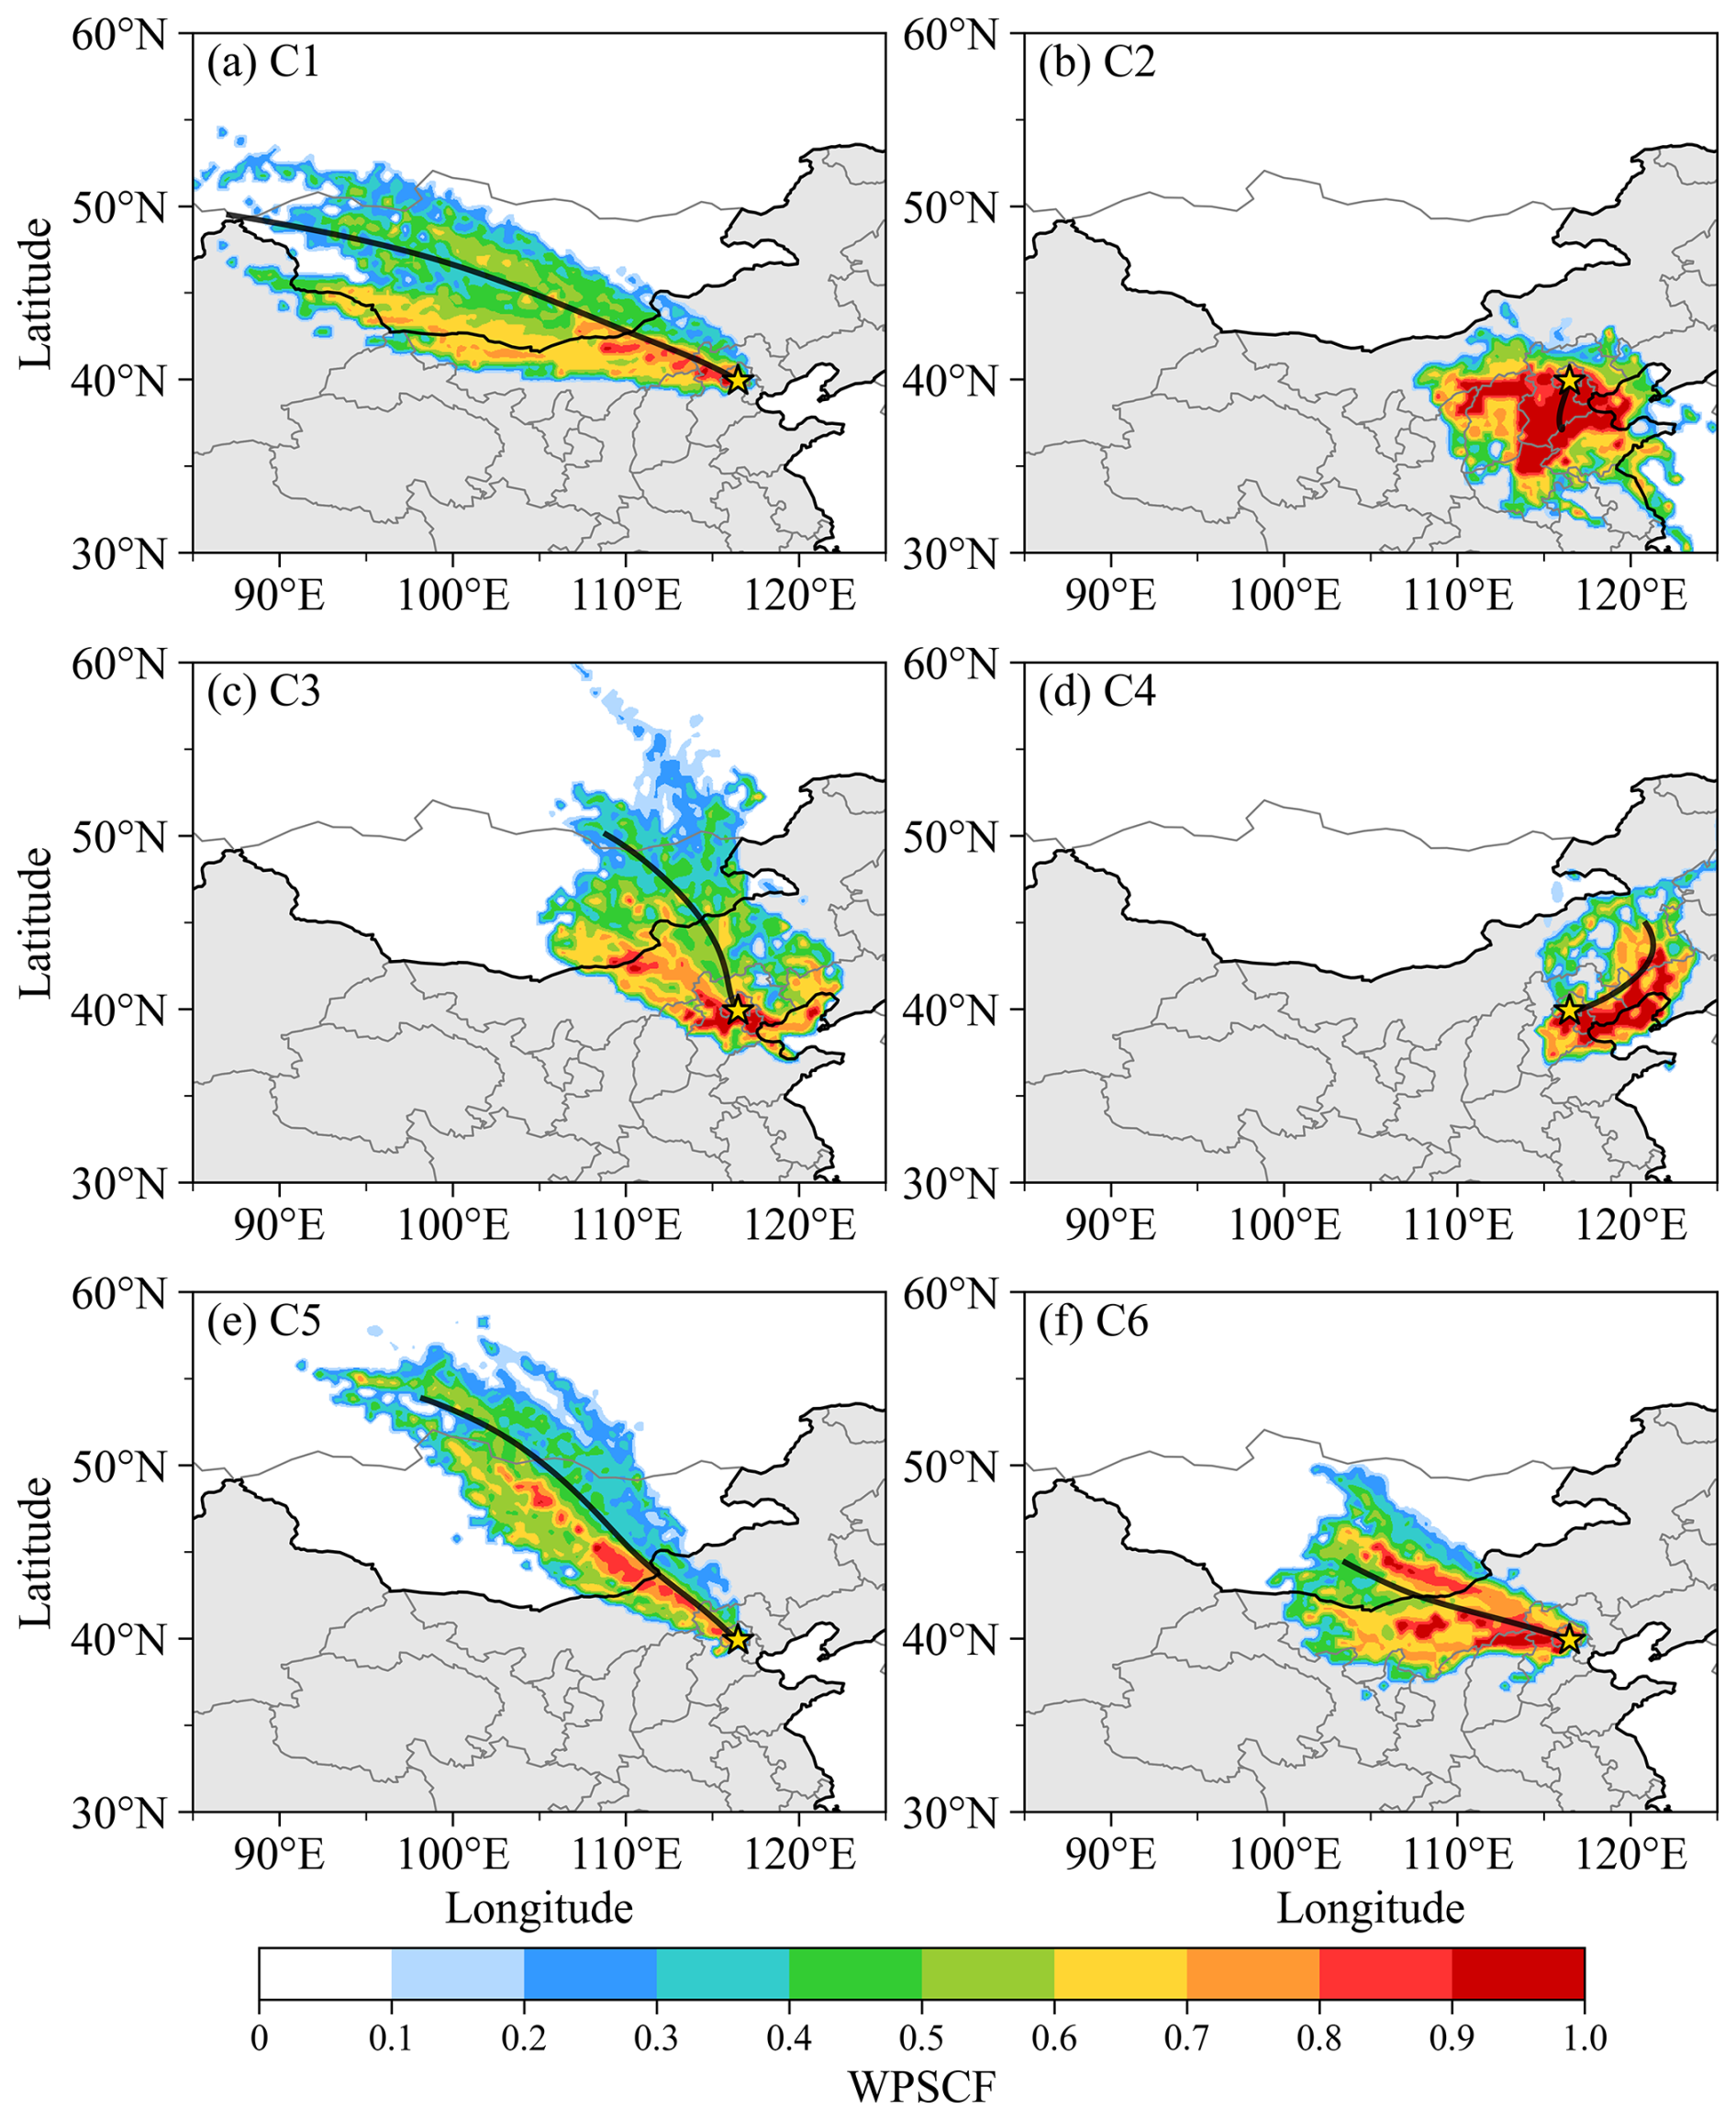
Figure 4Potential source contribution at altitude of 500 m over Beijing in the six clusters. The color bar (WPSCF) represents weighted potential source contribution function.
The mass concentrations of NR-PM2.5 were 9.9 ± 14.5, 12.5 ± 12.0, and 5.4 ± 6.8 µg m−3 in Clusters 1, 3, and 5, respectively, substantially lower than in Clusters 2 (38.1 ± 32.7 µg m−3), 4 (28.8 ± 29.5 µg m−3), and 6 (15.5 ± 18.4 µg m−3) (Fig. 3). These results are consistent with regional emission patterns (Zhang, 2014). The northwestern source regions (including northwestern China, Mongolia, and Siberia) are relatively pristine, and air masses from these areas delivered cleaner air to Beijing (Zhang, 2014). Strong winds associated with these clusters also enhanced the dispersion of local pollutants, further contributing to lower aerosol loading. In contrast, air masses arriving from the south, northeast, and west originated from heavily polluted regions, thereby transporting polluted air to Beijing. Weaker winds under these clusters favored the accumulation of locally emitted pollutants. Besides mass concentrations, distinct differences in aerosol chemical composition were observed in the six clusters. The fraction of SIAs was lower in the three northwestern clusters (55.7 ± 84.3 % in Cluster 1, 52.1 ± 54.4 % in Cluster 3, and 46.3 ± 63.1 % in Cluster 5), compared to the other three clusters(65.2 ± 54.1 % in Cluster 2, 58.1 ± 56.7 % in Cluster 4, and 59.0 ± 71.7 % in Cluster 6) (Fig. 3). Organic aerosol fractions exhibited the opposite trend. Among SIAs, the northwestern clusters showed lower NO and NH, but higher SO contributions. Specifically, NO accounted for 30.2 ± 67.6 %, 27.7 ± 43.0 %, and 18.3 ± 47.4 % of NR-PM2.5 in Clusters 1, 3, and 5, respectively, which was lower than in Clusters 2 (38.8 ± 43.4 %), 4 (31.3 ± 40.8 %), and 6 (33.4 ± 58.4 %). Conversely, SO fractions were higher in the northwestern clusters (10.2 ± 16.1 %, 10.7 ± 13.0 %, and 14.3 ± 19.6 %) than in Clusters 2 (10.1 ± 11.6 %) and 6 (9.5 ± 12.4 %), though slightly lower than in Cluster 4 (11.7 ± 17.7 %). NH reached its highest fraction in Cluster 2 (16.4 ± 16.3 %).
In addition to aerosol composition, differences of PM2.5, and gas pollutants in the six clusters were also examined (Fig. 5). Similar to NR-PM2.5, PM2.5 concentrations exhibited pronounced variability among the six clusters, ranging from a maximum of 68.2 ± 40.2 µg m−3 in Cluster 2 to a minimum of 12.6 ± 12.1 µg m−3 in Cluster 5, yielding a maximum-to minimum of 5.62. In contrast, SO2 showed much weaker variability, with concentrations ranging from 3.0 ± 1.9 ppb (Cluster 2) to 2.0 ± 1.3 ppb (Cluster 5), corresponding to a ratio of only 1.47. NO2 variability was moderate, with a maximum of 22.1 ± 15.2 ppb in Cluster 2 and a minimum of 9.7 ± 11.7 ppb in Cluster 5 (ratio = 2.27). To access the relative contributions of SO2 and PM2.5 under different transport clusters, the ratio was calculated. The ratio was higher in the three clusters originating from the northwest, 0.10 ppb µg−1 m3 (Cluster 1), 0.11 ppb µg−1 m3 (Cluster 3), and 0.16 ppb µg−1 m3 (Cluster 5), than in the other three clusters: 0.04 ppb µg−1 m3 (Cluster 2), 0.07 ppb µg−1 m3 (Cluster 4), and 0.07 ppb µg−1 m3 (Cluster 6). This indicates that northwesterly air masses carried relatively less PM2.5, but proportionally more SO2, consistent with the enhanced sulfate mass fractions observed in aerosols under these clusters (Fig. 3). Similar pollutant variations in the six clusters were also observed at the ground-level NZG station (Fig. S2); however, the variances of NO2 and PM2.5 were reduced, which is likely attributed to strong local emissions and chemical formations.
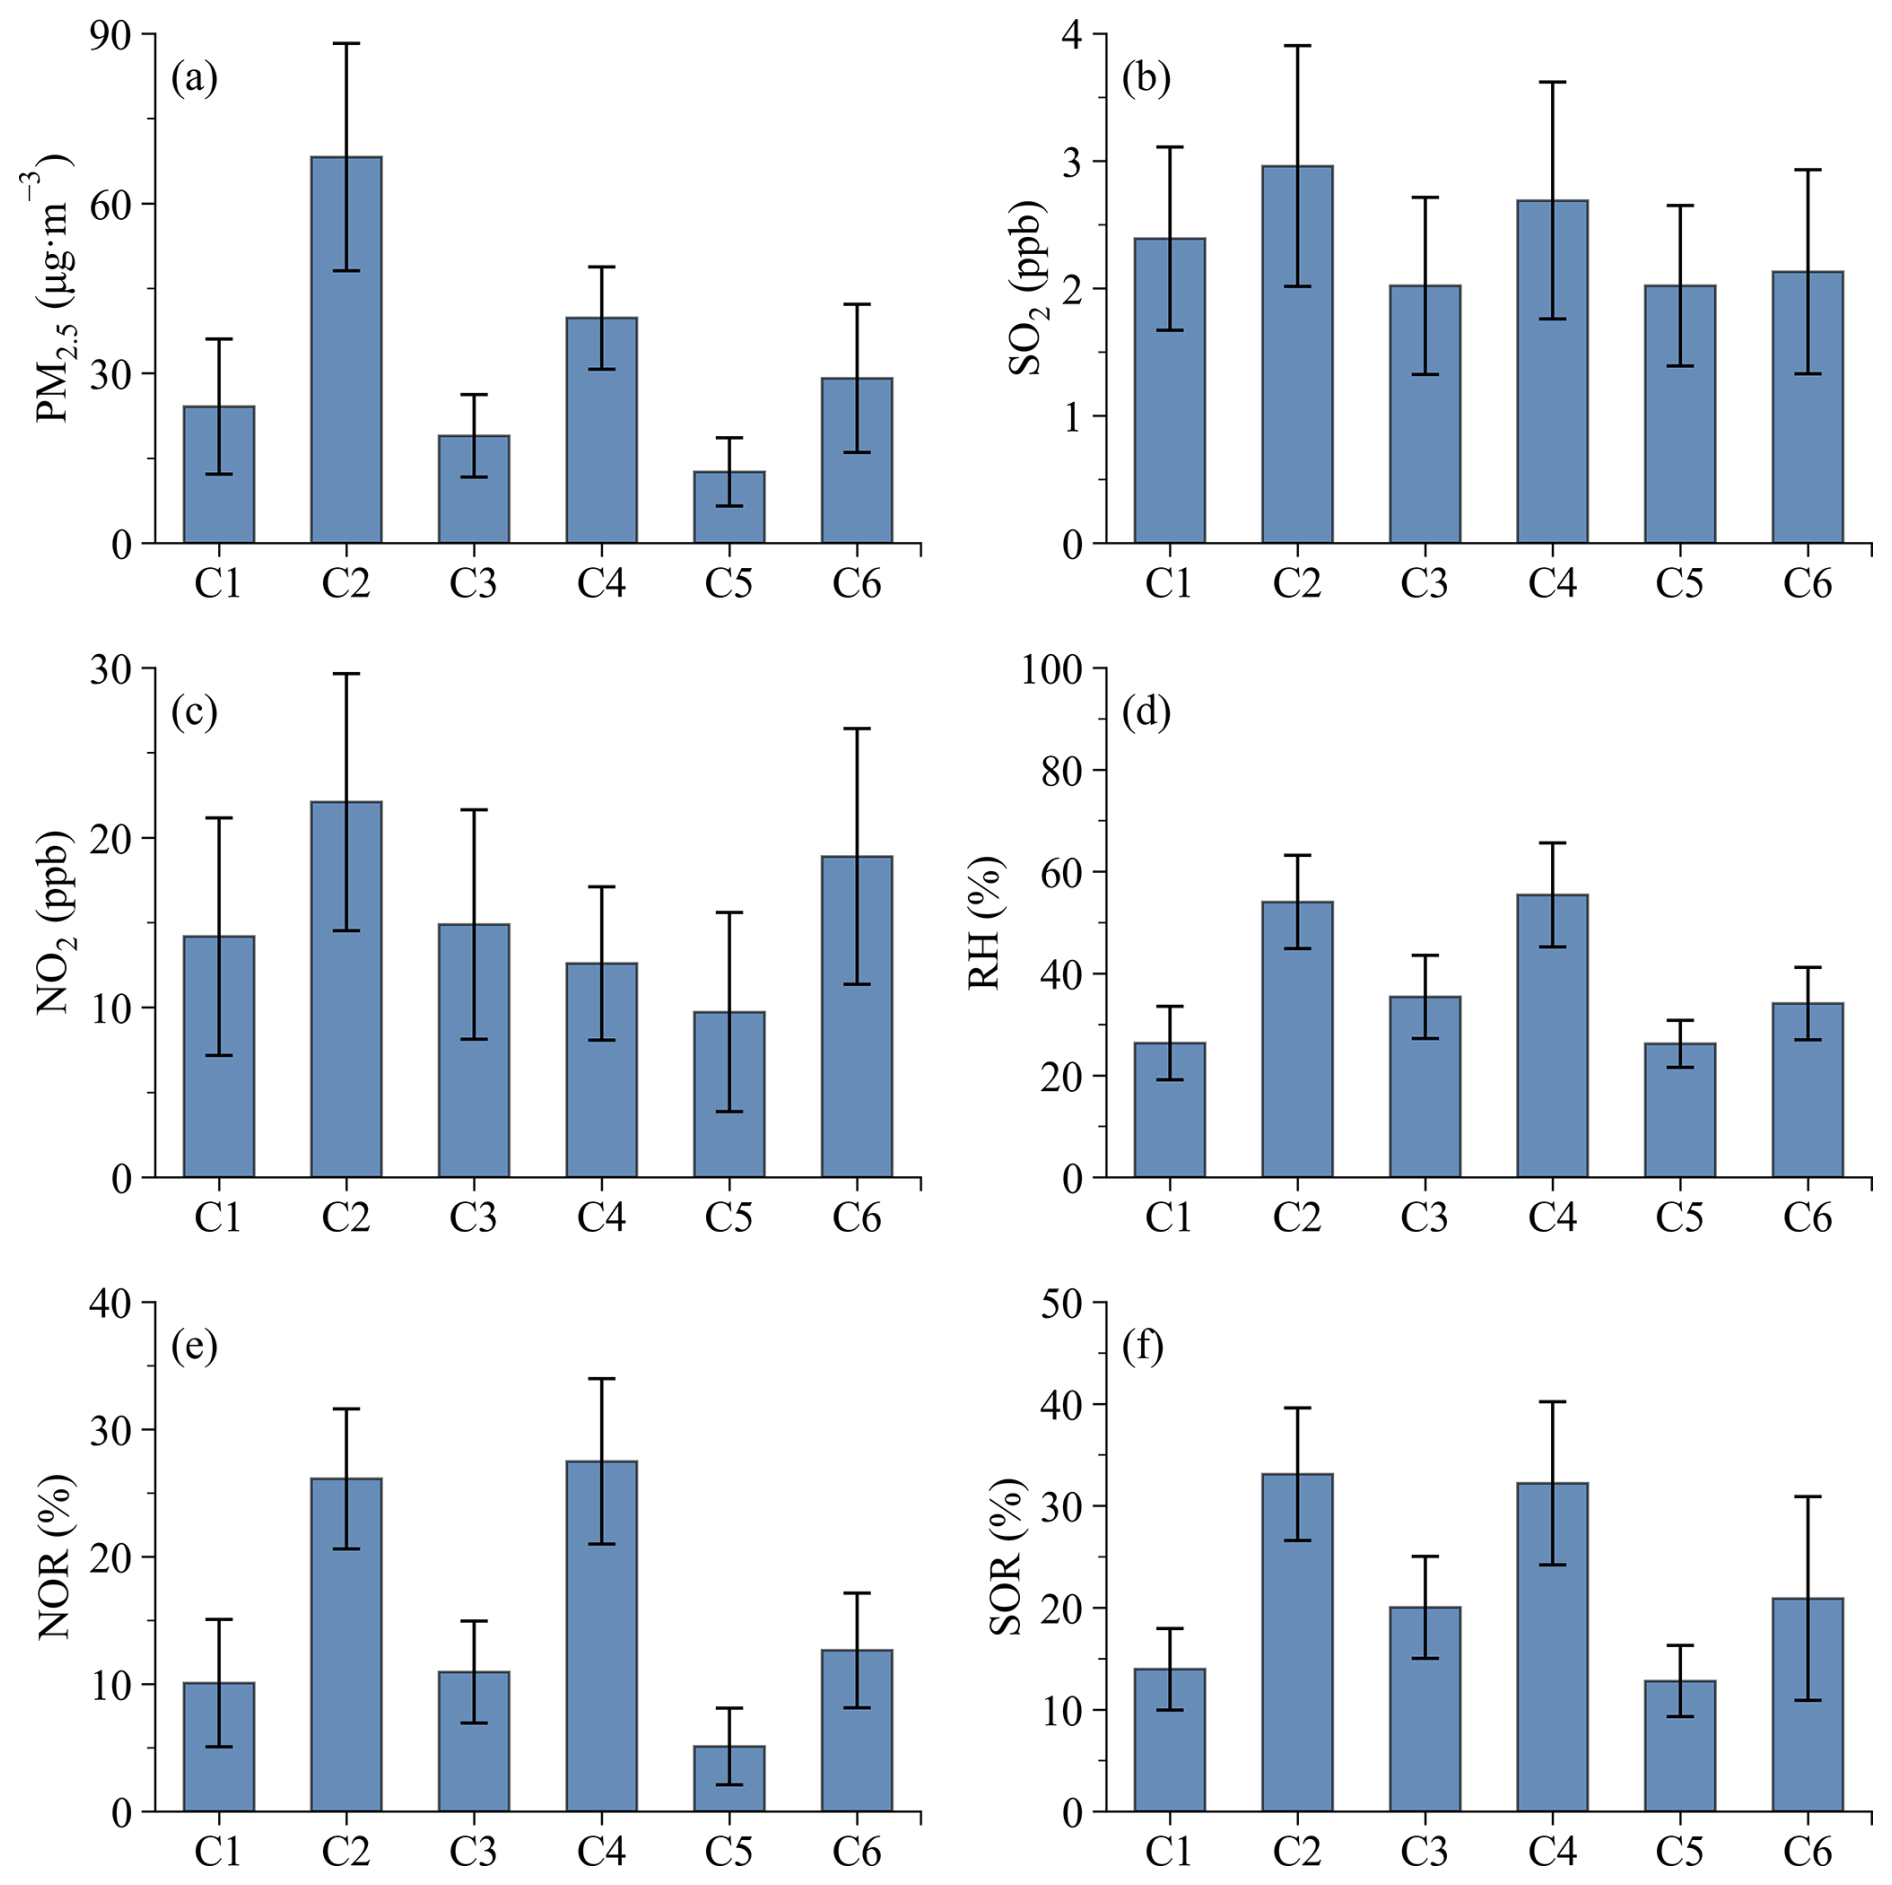
Figure 5Variations of PM2.5, SO2, NO2, RH, NOR and SOR at the CITIC station in the six clusters, respectively. The error bars are the 50 % standard deviations.
The distinct pollutants across clusters reflect the differing emission characteristics of their source regions. Air masses originating from the northwest exhibited a high sulfate mass fraction in aerosols and relatively high SO2, suggesting that coal combustion dominates emissions in this region. In contrast, air masses from the south and northeast carried higher PM2.5, thereby exacerbating air pollution in Beijing. Regarding aerosol composition, the mass fraction of SIAs increased when air masses arrived from the south and northeast. NO is form through the oxidation of NOx, which is predominantly emitted from combustion-related sources, primarily vehicle exhaust, coal combustion, and biomass burning. Similarly, NH derives from the neutralization of NH3, which is mainly released from combustion-related sources, agricultural activities (e.g., fertilized soils and animal waste), natural soils, and nitrogen-enriched water bodies (Chen et al., 2022). Consequently, emissions in the southern and northeastern regions are more complex, involving contributions from coal combustion, vehicle exhaust, agricultural practices, and natural sources.
Gaseous pollutants are converted to particles during transport through photochemical and heterogeneous reactions (Tan et al., 2021). To access the influence of chemical reactions on aerosol composition in the six clusters, oxidation ratios of nitrogen (NOR) and sulfur (SOR) were calculated. The NOR and SOR were defined as the ratios of particle phase of nitrogen and sulfur to total nitrogen and sulfur (both gas and particle phases), respectively (Chen et al., 2015); a higher SOR or NOR indicates a stronger conversion of SO2 or NOx to their particulate phase. As shown in Fig. 5f, SOR values were higher in Clusters 2 (0.33 ± 0.13) and 4 (0.32 ± 0.16) than in Clusters 1 (0.13 ± 0.08) and 5 (0.12 ± 0.07), suggesting SO2 was converted efficiently to SO in the former clusters during transport. A similar pattern was observed for NOR (Fig. 5e). Notably, the RH in Clusters 2 (54.1 ± 18.3 %) and 4 (55.4 ± 20.4 %) was the highest among these six clusters. Further analyses show that both SOR and NOR are closely related to RH (Fig. 6). RH increases markedly when air masses originated from the south and northeast (Fig. 5d), which likely promotes aqueous-phase heterogeneous oxidation of both SO2 and NO2 (Pathak et al., 2011; Ma et al., 2021, 2023). Collectively, these results indicate that the observed differences in aerosol composition over Beijing in the six transport clusters are governed by a combination of regional emission sources and chemical reactions during transport.
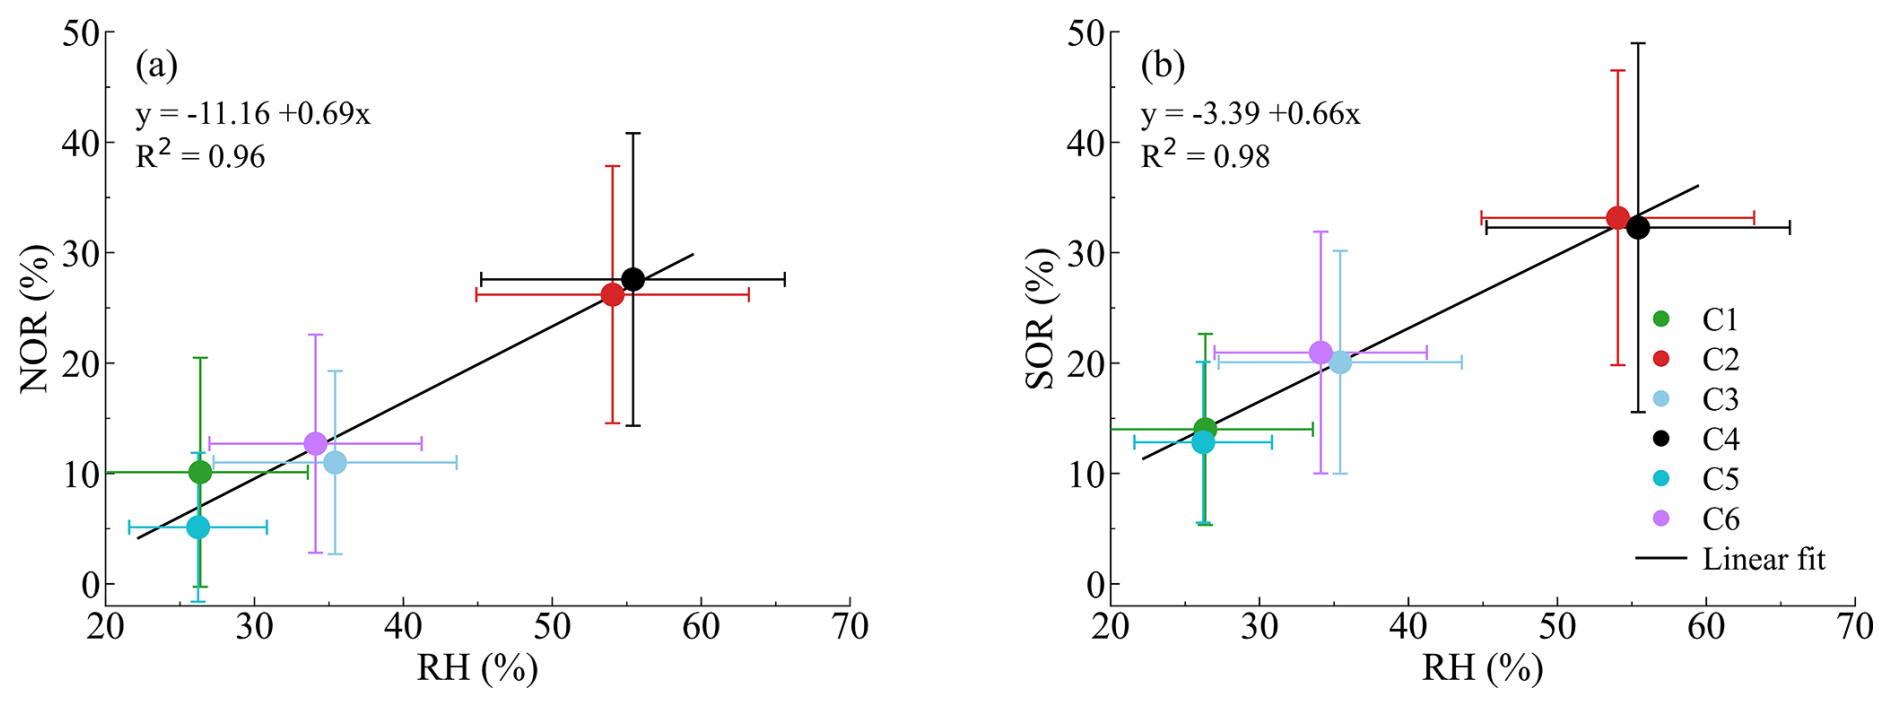
Figure 6Relationships of the NOR (a), SOR (b) to RH. The colors of dot represent distinct clusters as shown in Fig. 3. The error bars are the 50 % standard deviations.
3.3 Seasonal aerosol composition
As shown in Fig. 7, both mass concentration and fraction of NR-PM2.5 reflected clear seasonal variations. The mass concentration was lowest in summer (9.8 ± 8.2 µg m−3), followed by winter (15.6 ± 19.0 µg m−3), spring (20.6 ± 22.2 µg m−3) and autumn (25.4 ± 37.1 µg m−3). In summer, frequent precipitation enhanced wet deposition, while increased atmospheric instability promoted vertical diffusion of pollutants, resulting in low aerosol concentration. NO mass fraction was lowest in summer (15.1 ± 23.4 %), likely due to its semi-volatile property; gas-particle partitioning of nitrate is strongly temperature-dependent, and higher temperature favors the gaseous phase, thereby reducing particulate nitrate. In contrast, SO mass fraction peaked in summer (21.9 ± 23.2 %), likely due to enhanced aqueous reactions under high RH (Zhang et al., 2018b). In autumn, atmospheric instability decreases gradually with decreasing solar radiation, leading to aerosol accumulation. For aerosol components, NO mass fraction increased to 37.9 ± 71.4 %, while SO decreased to 8.1 ± 18.7 %, likely driven by concurrent decreases in temperature and RH. In winter and spring, SO mass fraction increased again (10.9 ± 17.7 % in winter; 10.9 ± 13.7 % in spring), primarily due to increased SO2 emissions from intensified coal combustion for residential heating. These observations demonstrate that marked seasonal variations in aerosol species over Beijing are closely linked to differences in emission sources and formation mechanisms.
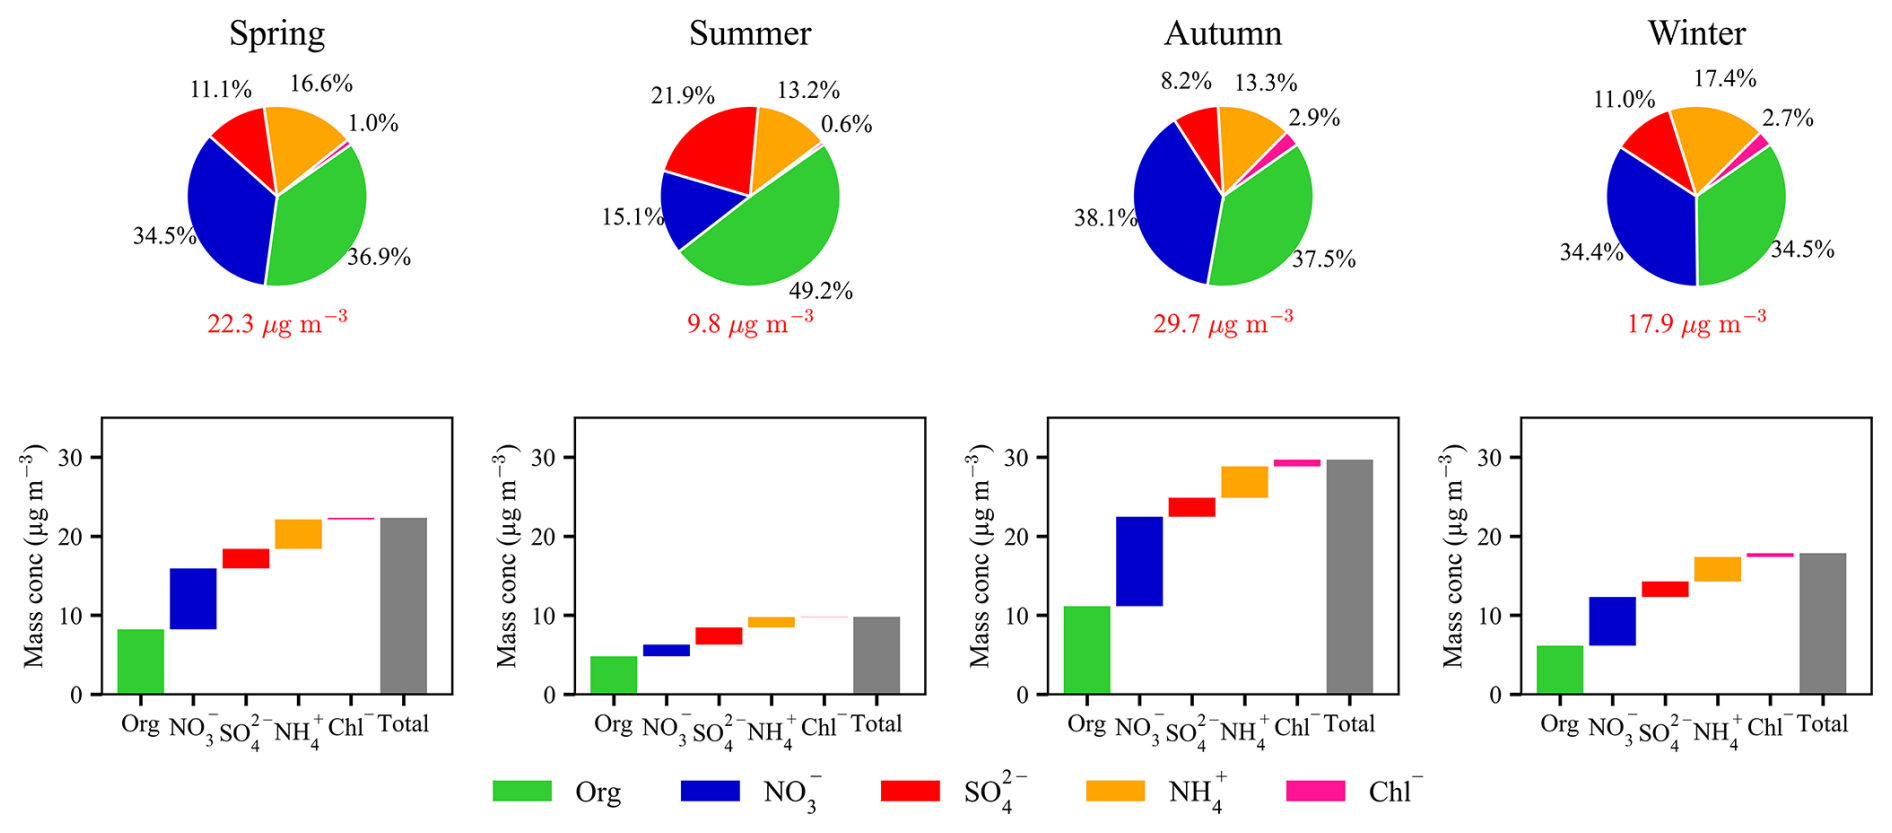
Figure 7The mean mass concentration and composition of NR-PM2.5 in four seasons during observational period (2020–2024).
As discussed in Sect. 3.2, aerosols in the 528 m layer are strongly influenced by regional transport. To further examine how transport pathways modulate aerosol properties across seasons, we analyzed differences in both mass concentration and chemical composition under distinct air mass trajectories (Fig. 8). Due to limited samples, air mass origins were classified into four clusters for each season. In summer, SO mass fraction exceeded that of NO in three of the four clusters, with the exception of Cluster 1. Specially, SO accounted for 23.0 ± 19.3 %, 15.3 ± 23.0 %, 15.7 ± 13.7 %, and 23.6 ± 18.6 % , while NO accounted for 23.8 ± 25.8 %, 5.8 ± 16.1 %, 8.5 ± 17.7 %, and 11.9 ± 15.0 % in Clusters 1–4, respectively. Notably, the two clusters originating from the south (Clusters 1 and 4) exhibited higher SO fractions than the northwest-derived cluster (Cluster 3). This reversal of the typical pattern is likely attributable to enhanced sulfate formation through aqueous-phase oxidation, as southerly airflows in summer transport moist air masses into Beijing (Fig. 5d).
In autumn, NO mass fraction increased while SO decreased sharply in all four clusters. Specifically, SO accounted for 8.1 ± 13.4 %, 13.0 ± 24.6 %, 6.9 ± 10.7 %, and 8.1 ± 16.5 %, whereas NO accounted for 29.3 ± 77.4 %, 16.5 ± 44.6 %, 40.3 ± 54.3 %, and 40.7 ± 65.6 % in Clusters 1–4, respectively. Consistent with the pattern shown in Fig. 3, NR-PM2.5 mass concentrations were higher in the south-originating cluster (Cluster 3, 40.7 ± 46.4 µg m−3) and west-originating cluster (Cluster 4, 31.8 ± 41.2 µg m−3) than in the two northwest-originating clusters (Cluster 1, 9.7 ± 15.7 µg m−3; Cluster 2, 10.2 ± 16.1 µg m−3). In terms of aerosol composition, the two northwest-originating clusters exhibited lower NO, but higher SO fractions. In winter and spring, SO mass fraction increased slightly in all four clusters. Consistent with autumn, NR-PM2.5 concentrations in the northwest-originating cluster were lower than those in clusters arriving from the south and northeast. Similarly, aerosols in the northwest-originating clusters consistently showed lower NO and higher SO fractions. These results demonstrate that seasonal variations in aerosol composition over Beijing are governed by differences in emission sources, formation mechanisms, and the influence of regional transport.
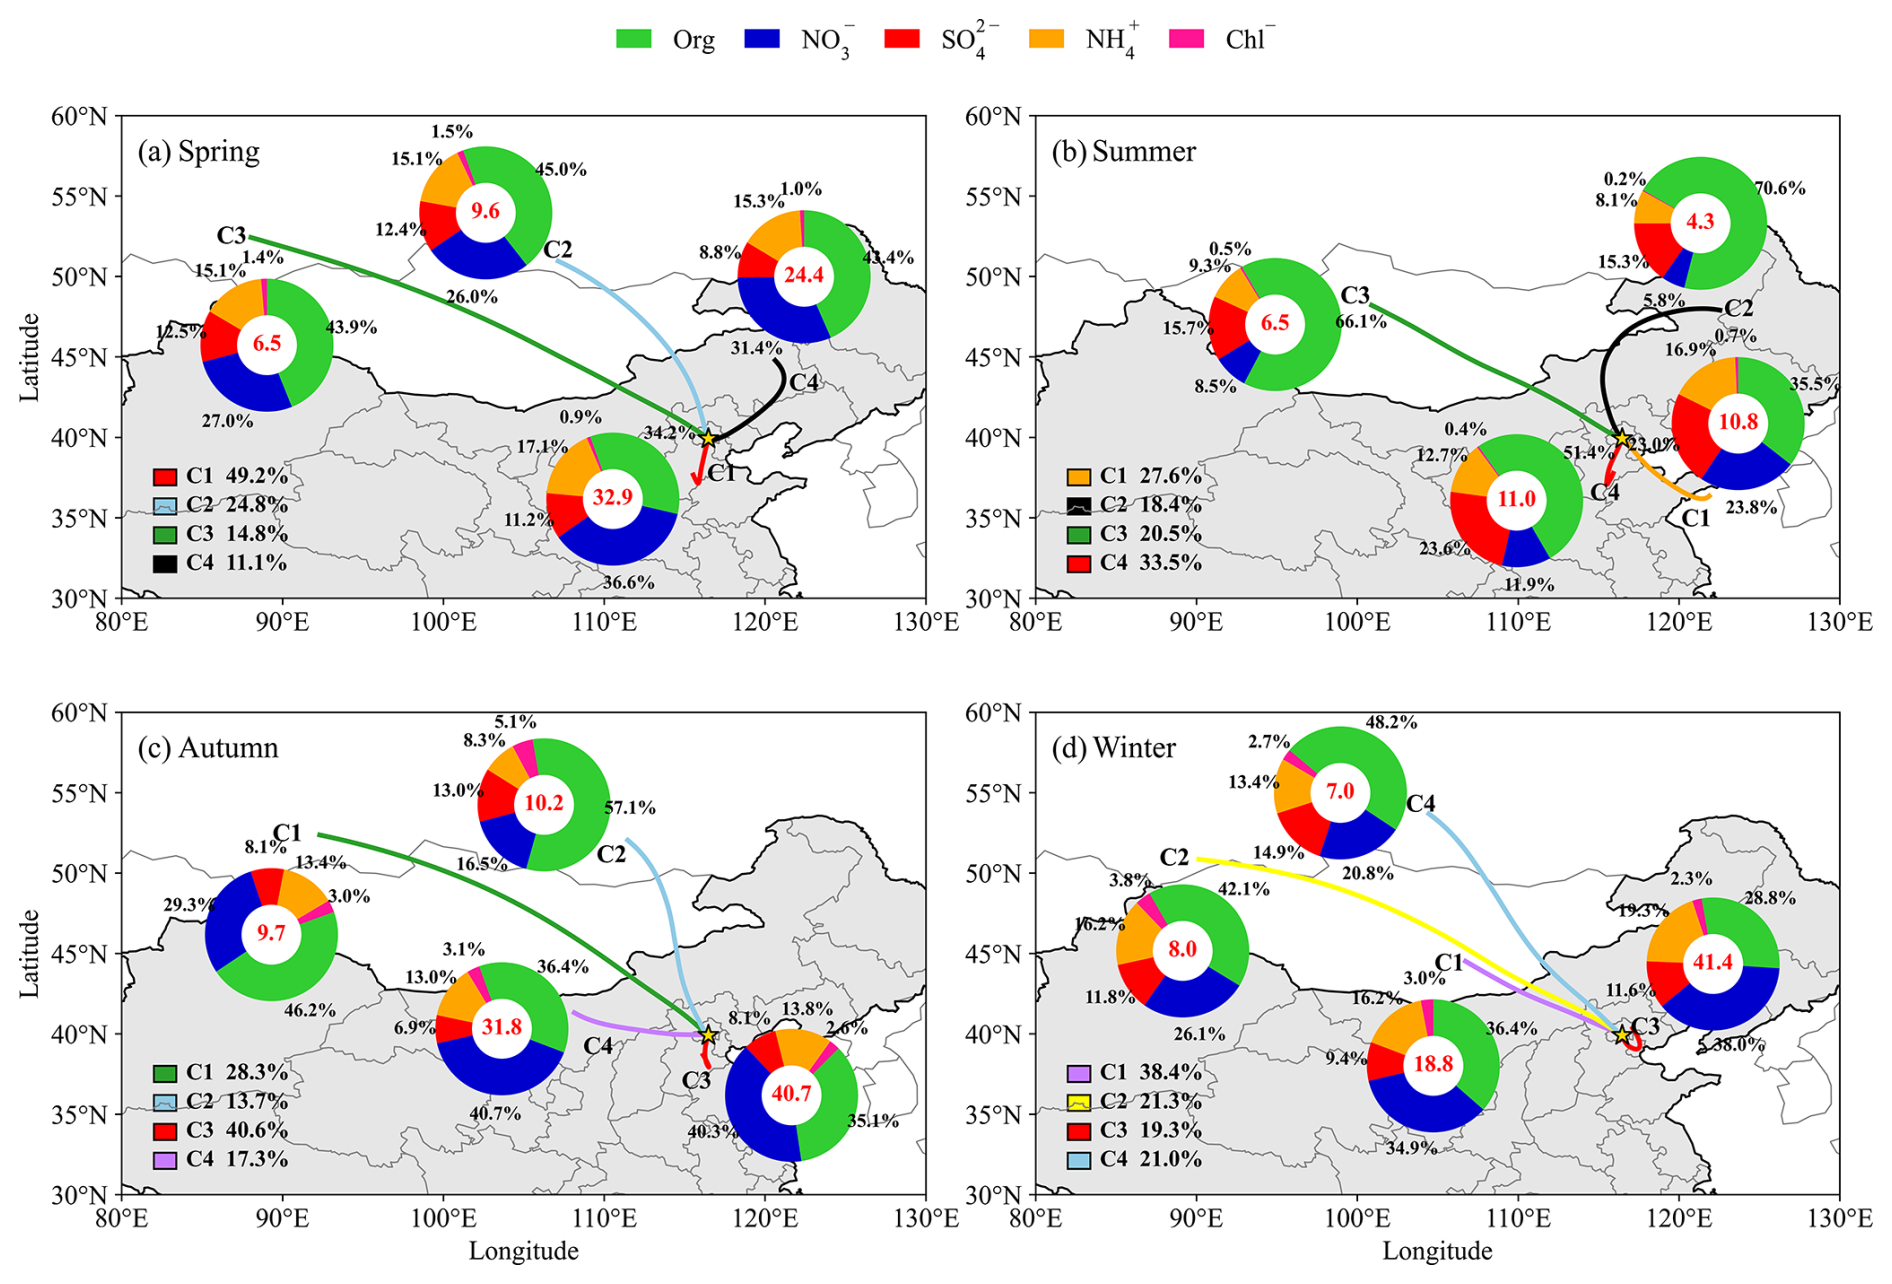
Figure 8Forty-eight hours back trajectories of air masses over Beijing at altitude of 500 m in four seasons, together with mean mass concentration and composition of NR-PM2.5 in each cluster.
3.4 Vertical mixing of pollutants through the PBL process
Regional pollutants may be transported downwards, thereby exacerbating air pollution in Beijing. To understand this process, diurnal variations of pollutants at the two stations were investigated. Due to the lack of concurrent aerosol composition measurements at ground station in the same period, only PM2.5 and gaseous pollutants were compared. Observations showed the differences of pollutants between the two stations decreased in the daytime but increased at night, particularly for gaseous pollutants (Fig. 9). At the NZG station, NO2 remained high concentration at night and decreased in the morning, and reached a minimum of 11.0 ± 9.1 ppb around 15:00 LT. After that, its concentration gradually increased. In contrast, NO2 at the CITIC station exhibited an opposite diurnal pattern. NO2 increased in the morning, peaked at 13:00 LT (17.3 ± 17.8 ppb), and then decreased, remaining low concentration throughout the night. It is noteworthy that daytime NO2 at the CITIC station is higher than at the NZG station, likely due to the conversion of NO to NO2 during vertical mixing. NO accounts for about 39 % of total NOx at ground level, but decreases to 22 % at the CITIC station (Ma et al., 2023). SO2 showed a contrasting trend to NO2. At the NZG station, SO2 increased in the morning, peaked at 13:00 LT (1.36 ± 0.97 ppb), then decreased and kept in low concentration at night. However, SO2 was relatively stable, with only a slight decrease around noon, at the CITIC station. SO2 at the CITIC station is higher than at the NZG station throughout the day, likely due to regional transport. O3 also exhibited marked differences between the two stations; its concentration at the NZG station was close to the CITIC in daytime, but much lower than the latter at night (Fig. 9c), likely due to NO titration (Brown and Stutz, 2012). Compared with short-lived gaseous pollutants, the difference in PM2.5 between the two stations was less significant (Fig. 9d).
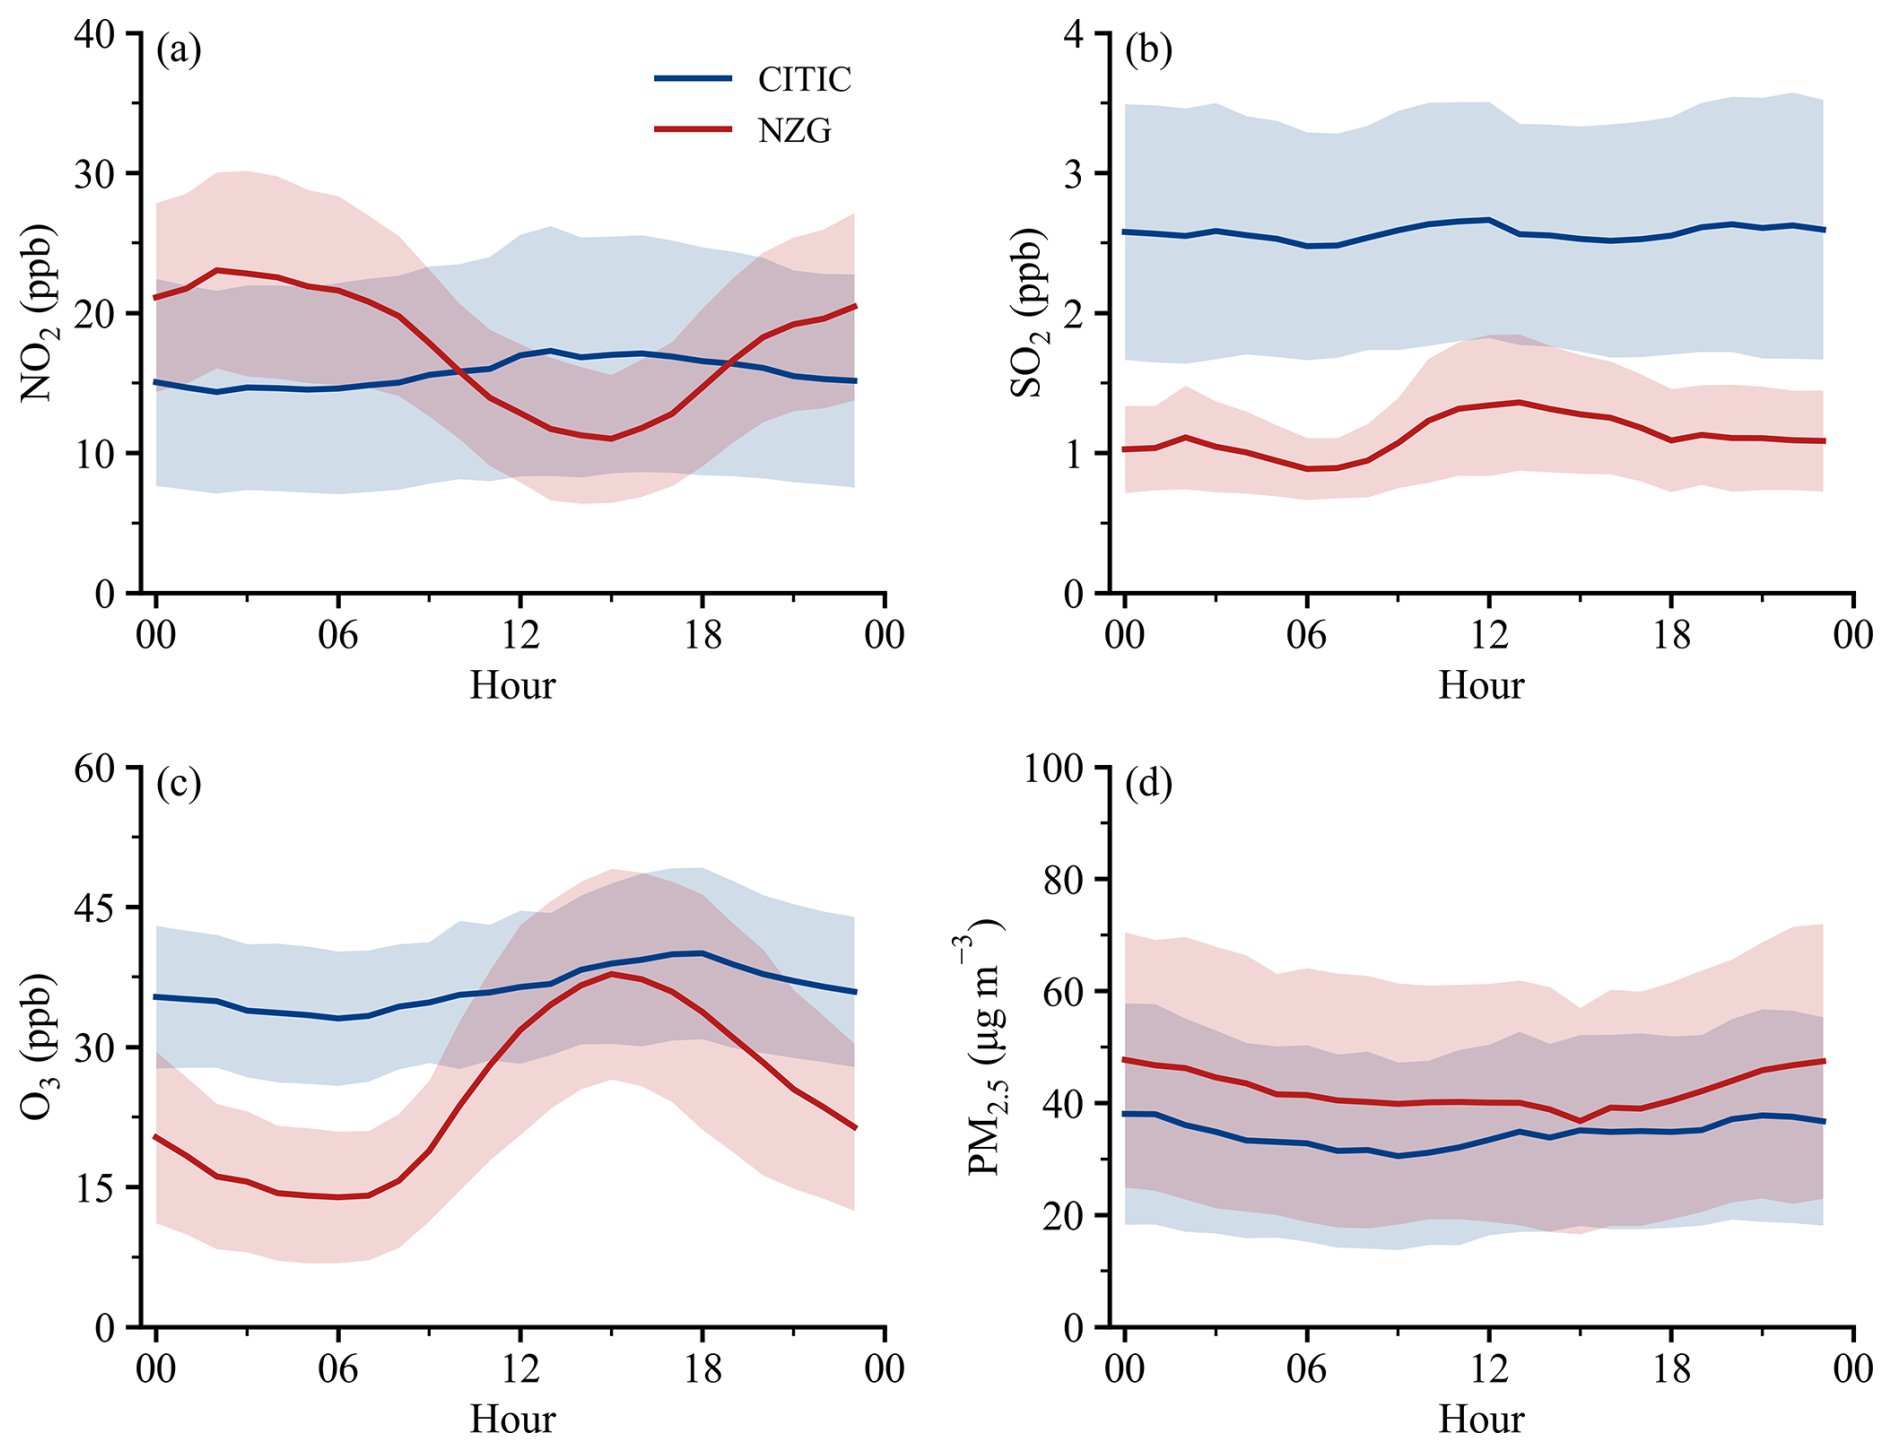
Figure 9Diurnal variations of NO2, SO2, O3, and PM2.5 during observational period (2020–2024) at the CITIC (blue) and NZG (red) stations, respectively. The shaded areas denote 50 % standard deviation.
The opposite patterns of NO2 and SO2 at the two stations may be caused predominantly by the PBL process. Our previous studies show that the CITIC station resides in the residual layer (RL) at night (Ma et al., 2023; Quan et al., 2025). The decoupling between the RL and nocturnal stable boundary layer (SBL) substantially suppresses vertical exchange of pollutants between the two layers, leading to large differences of pollutants between the CITIC and NZG stations. In the morning, the daytime convective boundary layer (CBL) develops gradually under increasing solar radiation, and eventually couples the overlying RL. This coupling strongly enhances vertical mixing of pollutants. In this process, locally emitted NO2 at ground level was upwards transported, leading to the contrasting diurnal patterns of NO2 between the two stations. By contrast, regional transported SO2 was transported downwards in this process. Notably, NO2 at the CITIC exceeded that at the NZG between 11:00 and 18:00 LT, likely due to the conversion of NO to NO2 during vertical mixing in the presence of high O3 concentration aloft (Fig. 9c). For PM2.5, its difference between the two stations also decreased at afternoon (Fig. 9d), consistent with enhanced vertical mixing in this period.
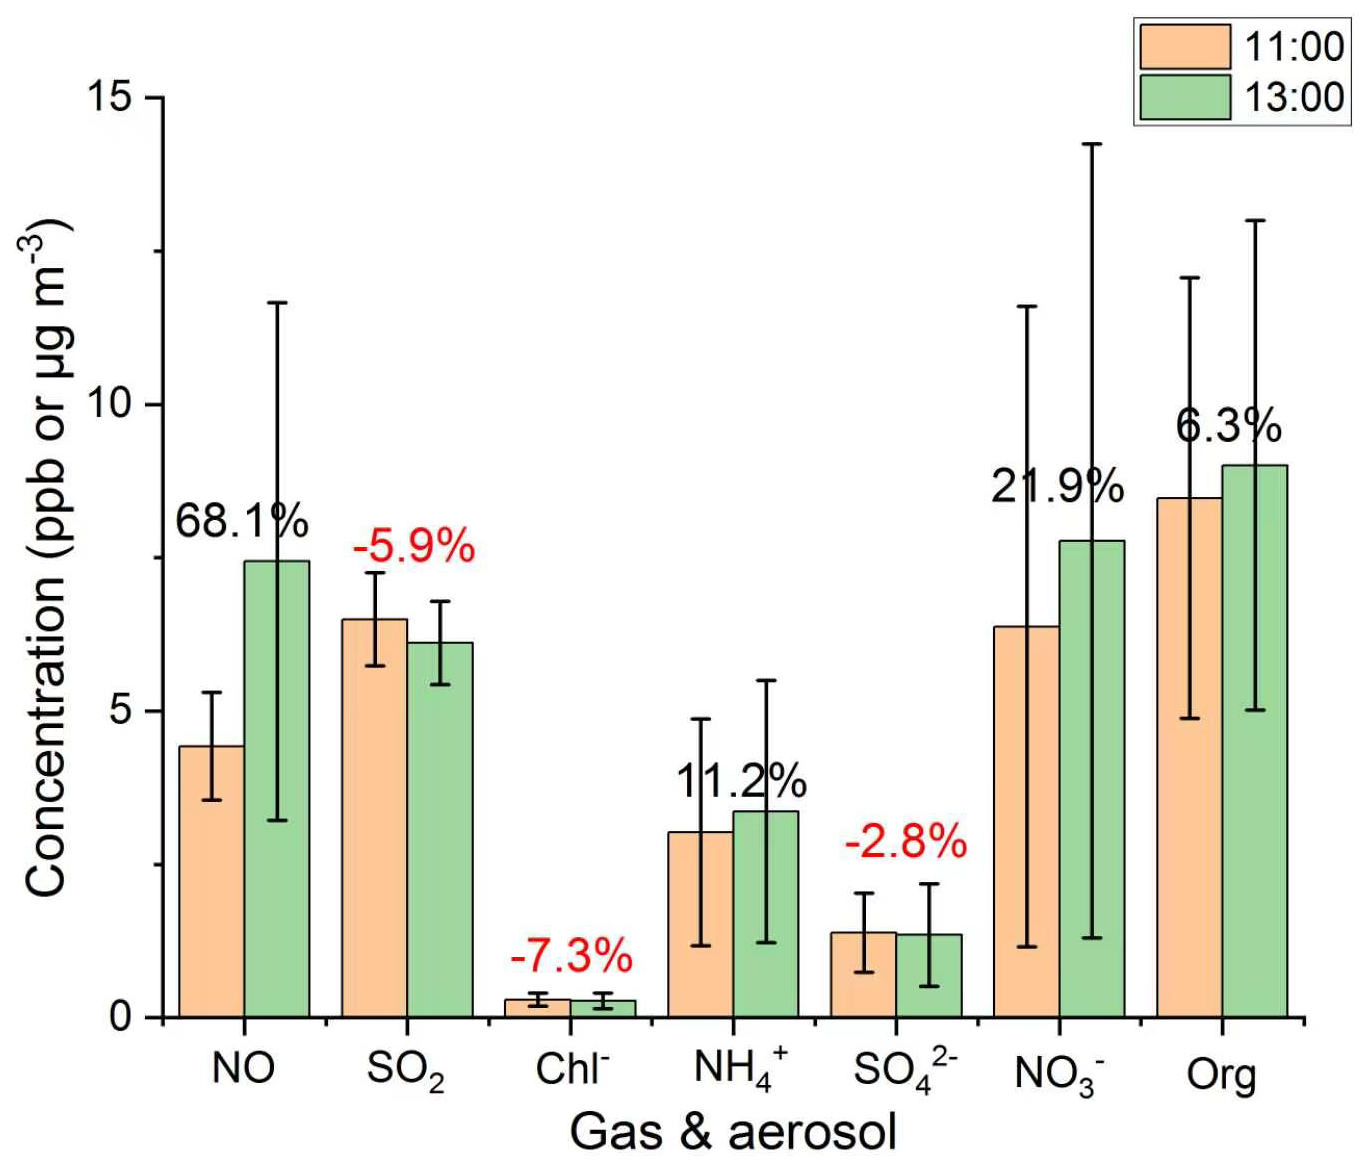
Figure 10Mean concentrations of gases and aerosol components at the CITIC station at 11:00 and 13:00 LT from 17 October to 12 November 2020. Values indicate the percentage variations of pollutants between 11:00 and 13:00 LT. Error bars represent 50 % of the standard deviations.
To better understand the vertical mixing of pollutants, we further analyzed the diurnal variations in aerosol components from 17 October to 12 November 2020. Driven by the daytime expansion of the PBL in the morning, strong vertical transport typically occurred. This process was identified by an abrupt increase in NO. Given that NO is a short-lived gaseous pollutant, its sharp increase in the 528 m layer serves as an indicator of upward transport from the surface. Based on the temporal evolution of NO, the strong vertical transport period was determined as 11:00–13:00 LT (Fig. S3). Accordingly, the variations in pollutants at the CITIC station during this specific period were investigated.
As illustrated in Fig. 10, the NO concentration at the CITIC station surged by 68.1 % between 11:00 and 13:00 LT, whereas SO2 decreased by 5.9 % during the same period. These observations substantiate the distinct emission sources of NOx and SO2 in Beijing. This divergence is further corroborated by the variations in NO and SO; NO increased by 21.9 %, while SO declined by 2.8 %. Additionally, the mass concentration of Chl− decreased by 7.3 % during the same period, indicating its primary origin from regional transport. Although the mass concentrations of Org and NH also increased, their growth rates (Org: 6.3 %; NH: 11.2 %) were notably lower than that of NO, suggesting that regionally transported aerosols are particularly enriched in Org and NH. Consequently, the downward entrainment of these regionally transported aerosols from the upper layer via PBL processes exacerbates surface air pollution in Beijing.
Regional transport of pollutants to Beijing was investigated in this study based on comprehensive observations of aerosol components and gaseous pollutants conducted at a unique 528 m platform over urban Beijing from 2020 to 2024. The main findings are summarized as follows:
-
Aerosol mass concentration and chemical composition varied markedly with air mass origin. Air masses from the northwest delivered relatively clean air to Beijing, characterized by low aerosol levels but relatively high SO2. In terms of composition, these northwesterly flows exhibited lower NO and NH fractions but higher SO and Chl−. In contrast, air masses from the south, and northeast transported high aerosols with increased SIAs fractions, including NO, NH, and SO. These results suggest that emissions in the northwest are dominated by coal combustion, whereas those in the south and northeast involve multiple sources, including coal combustion, vehicle exhaust, agricultural and natural soils, and animal waste.
-
Both the SOR and NOR were higher in air masses originating from the south and northeast than in those from the northwest, likely due to higher RH in the former, which promotes aqueous-phase heterogeneous oxidation of SO2 and NO2. These results indicate that differences in aerosol properties in the six transport pathways are governed by a combination of regional emissions and chemical reactions during transport.
-
Contrasting diurnal patterns of SO2 and NO2 between the 528 m layer and ground level confirm that pollutants are well mixed during the day but strongly suppressed at night due to the decoupling of the RL and SBL. Driven by the development of PBL, locally emitted NO2 is transported upward during daytime, while regionally derived SO2 aloft is transported downward toward the surface. These findings demonstrate that regional aerosols over Beijing are transported downward primarily through PBL processes, thereby exacerbating surface air pollution.
The observational data at the CITIC station are available from https://doi.org/10.5281/zenodo.18424062 (Quan, 2026). Pollutant data (PM2.5, SO2, NO2 and O3) at NZG station are available from the China National Environmental Monitoring Centre (http://www.cnemc.cn/, last access: 1 December 2025).
The supplement related to this article is available online at https://doi.org/10.5194/acp-26-9981-2026-supplement.
JQ and PT initiated and conceived the research; JQ, XL and PM led the observations, analyses and writing; YP and QW analyzed the data; PT and LZ revised the manuscript.
The contact author has declared that none of the authors has any competing interests.
Publisher's note: Copernicus Publications remains neutral with regard to jurisdictional claims made in the text, published maps, institutional affiliations, or any other geographical representation in this paper. The authors bear the ultimate responsibility for providing appropriate place names. Views expressed in the text are those of the authors and do not necessarily reflect the views of the publisher.
This research is supported by Key Projects in the National Science and Technology (2023YFC3711000), National Natural Science Foundation of China (42475122), Beijing Natural Science Foundation (8242027), and Beijing Nova Program (20250484803).
This paper was edited by James Allan and reviewed by Theobard Habineza and two anonymous referees.
Brown, S. S. and Stutz, J.: Nighttime radical observations and chemistry, Chem. Soc. Rev., 41, 6405–6447, https://doi.org/10.1039/c2cs35181a, 2012.
Cai, Y., Ye, C., Chen, W., Hu, W., Song, W., Peng, Y., Huang, S., Qi, J., Wang, S., Wang, C., Wu, C., Wang, Z., Wang, B., Huang, X., He, L., Gligorovski, S., Yuan, B., Shao, M., and Wang, X.: The important contribution of secondary formation and biomass burning to oxidized organic nitrogen (OON) in a polluted urban area: insights from in situ measurements of a chemical ionization mass spectrometer (CIMS), Atmos. Chem. Phys., 23, 8855–8877, https://doi.org/10.5194/acp-23-8855-2023, 2023.
Chen, C., Sun, Y. L., Xu, W. Q., Du, W., Zhou, L. B., Han, T. T., Wang, Q. Q., Fu, P. Q., Wang, Z. F., Gao, Z. Q., Zhang, Q., and Worsnop, D. R.: Characteristics and sources of submicron aerosols above the urban canopy (260 m) in Beijing, China, during the 2014 APEC summit, Atmos. Chem. Phys., 15, 12879–12895, https://doi.org/10.5194/acp-15-12879-2015, 2015.
Chen, Z., Song, W., Hu, C., Liu, X., Chen, G., Walters, W. W., Michalski, G., Liu, C., Fowler, D., and Liu, X.: Significant contributions of combustion related sources to ammonia emissions, Nat. Commun., 13, 7710, https://doi.org/10.1038/s41467-022-35381-4, 2022.
Draxler, R. R. and Hess, G. D.: An overview of the HYSPLIT4 modeling system for trajectories, dispersion, and deposition, Aust. Met. Mag., 47, 295–308, 1998.
Draxler, R., Stunder, B., Rolph, G., Stein, A., and Taylor, A.: HYSPLIT4 user's guide, version 4, report, NOAA, Silver Spring, Md, https://www.ready.noaa.gov/hysplitusersguide/ (last access: 25 October 2025), 2012.
Du, H., Li, J., Chen, X., Wang, Z., Sun, Y., Fu, P., Li, J., Gao, J., and Wei, Y.: Modeling of aerosol property evolution during winter haze episodes over a megacity cluster in northern China: roles of regional transport and heterogeneous reactions of SO2, Atmos. Chem. Phys., 19, 9351–9370, https://doi.org/10.5194/acp-19-9351-2019, 2019.
Fröhlich, R., Cubison, M. J., Slowik, J. G., Bukowiecki, N., Prévôt, A. S. H., Baltensperger, U., Schneider, J., Kimmel, J. R., Gonin, M., Rohner, U., Worsnop, D. R., and Jayne, J. T.: The ToF-ACSM: a portable aerosol chemical speciation monitor with TOFMS detection, Atmos. Meas. Tech., 6, 3225–3241, https://doi.org/10.5194/amt-6-3225-2013, 2013.
Habineza, T., Robinson, A. L., DeWitt, H. L., Gasore, J., Croteau, P. L., and Presto, A. A.: Chemical characterization and source apportionment of fine particulate matter in Kigali, Rwanda, using aerosol mass spectrometry, Atmos. Chem. Phys., 25, 15953–15968, https://doi.org/10.5194/acp-25-15953-2025, 2025.
Kang, Z., Ma, P., Quan, J.N., Jia, X., Liao, Z., Cheng, Z., Wang, Q., Dai, L., Zhao, X., Zhang, Z., Yuan, T., and Pan, Y.: Observational evidence of the regional transported black carbon in high layer over Beijing, Atmos. Environ., 311, 120000, https://doi.org/10.1016/j.atmosenv.2023.120000, 2023.
Jayne, J. T., Leard, D. C., Zhang, X., Davidovits, P., Smith, K. A., Kolb, C. E., and Worsnop, D. R.: Development of an Aerosol Mass Spectrometer for Size and Composition Analysis of Submicron Particles, Aerosol Sci. Technol., 33, 49–70, 2000.
Li, J., Wang, Z., Huang, H., Hu, M., Meng, F., Sun, Y., Wang, X., Wang, Y., and Wang, Q.: Assessing the effects of trans-boundary aerosol transport between various city clusters on regional haze episodes in spring over East China, Tellus B., 65, 20052, https://doi.org/10.3402/tellusb.v65i0.20052, 2013.
Li, Y., Ye, C., Liu, J., Zhu, Y., Wang, J., Tan, Z., Lin, W., Zeng, L., and Zhu, T.: Observation of regional air pollutant transport between the megacity Beijing and the North China Plain, Atmos. Chem. Phys., 16, 14265–14283, https://doi.org/10.5194/acp-16-14265-2016, 2016.
Li, P., Yan, R., Yu, S., Wang, S., Liu, W., and Bao, H.: Reinstate regional transport of PM2.5 as a major cause of severe haze in Beijing, P. Natl. Acad. Sci. USA, 112, 2739–2740, https://doi.org/10.1073/pnas.1502596112, 2015.
Liang, X., Li, S., Zhang, S., Huang, H., and Chen, S. X.: PM2.5 data reliability, consistency, and air quality assessment in five Chinese cities, J. Geophys. Res.-Atmos., 121, 10220–10236, 2016.
Lin, Z., Wang, Y., Zheng, F., Zhou, Y., Guo, Y., Feng, Z., Li, C., Zhang, Y., Hakala, S., Chan, T., Yan, C., Daellenbach, K. R., Chu, B., Dada, L., Kangasluoma, J., Yao, L., Fan, X., Du, W., Cai, J., Cai, R., Kokkonen, T. V., Zhou, P., Wang, L., Petäjä, T., Bianchi, F., Kerminen, V.-M., Liu, Y., and Kulmala, M.: Rapid mass growth and enhanced light extinction of atmospheric aerosols during the heating season haze episodes in Beijing revealed by aerosol–chemistry–radiation–boundary layer interaction, Atmos. Chem. Phys., 21, 12173–12187, https://doi.org/10.5194/acp-21-12173-2021, 2021.
Liu, Q., Quan, J. N., Jia, X.C., Sun, Z., Li, X., Gao, Y., and Liu, Y.: Vertical profiles of aerosol composition over Beijing, China: Analysis of in-situ aircraft measurements, J. Atmos. Sci., 76, 231–245, 2019.
Liu, P., Jia, S., Li, S., Ma, P., Ma, Y., Liu, Y., Liao, Z., Wang, Y., Chu, B., Ma, Q., Quan, J., Mu, Y., and He, H.: Unexpectedly high levels of H2O2 drive sulfate formation over the residual layer in Beijing, Environ. Sci. Technol., 59, https://doi.org/10.1021/acs.est.4c09004, 2025.
Ma, P., Quan, J. N., Jia, X., Liao, Z., Wang, Q., Cheng, Z., Dou, Y., Su, J., and Pan, Y.: Effects of ozone and relative humidity in secondary inorganic aerosol formation during haze events in Beijing, China, Atmos. Res., 264, 105855, https://doi.org/10.1016/j.atmosres.2021.105855, 2021.
Ma, P., Quan, J. N., Dou, Y., Pan, Y., Liao, Z., Cheng, Z., Jia, X., Wang, Q., Zhan, J., Ma, W., Zheng, F., Wang, Y., Zhang, Y., Hua, C., Yan, C., Kulmala, M., Liu, Y., Huang, X., Liu, Y., Brown, S. S., Liu, Y., Brown, S. S., and Liu, Y.: Regime-dependence of nocturnal nitrate formation via N2O5 hydrolysis and its implication for mitigating nitrate pollution, Geophys. Res. Lett., 50, e2023GL106183, https://doi.org/10.1029/2023GL106183, 2023.
Pathak, R. K., Wang, T., and Wu, W. S.: Nighttime enhancement of PM2.5 nitrate in ammonia-poor atmospheric conditions in Beijing and Shanghai: Plausible contributions of heterogeneous hydrolysis of N2O5 and HNO3 partitioning, Atmos. Environ., 45, 1183–1191, 2011.
Quan, J. N., Gao, Y., Zhang, Q., Tie, X., Cao, J., Han, S., Meng, J., Chen, P., and Zhao, D.: Evolution of planetary boundary layer under different weather conditions, and its impact on aerosol concentrations, Particuology, 11, 34–40, 2013.
Quan, J. N., Dou, Y., Zhao, X., Liu, Q., Sun, Z., Pan, Y., Jia, X., Cheng, Z., Ma, P., Su, J., Xin, J., and Liu, Y.: Regional atmospheric pollutant transport mechanisms over the North China Plain driven by topography and planetary boundary layer processes, Atmos. Environ., 221, 117098, https://doi.org/10.1016/j.atmosenv.2019.117098, 2020.
Quan, J. N., Huo, J., Zhang, C., Pan, Y., Ma, P., Liao, Z., Cheng, Z., Jia, X., Wang, Q., Fu, Q., Mu, Y., and Hu, F.: High organic aerosol in the low layer over a rural site in the North China Plain (NCP): Observations based on large tethered balloon, Sci. Total Environ., 915, https://doi.org/10.1016/j.scitotenv.2024.170039, 2024.
Quan, J. N., Ma, P., Pan, Y., Cheng, S., Wang, Q., Lan, L., Dai, L., Wang, Y., and Liu., Y.: Vertical mixing of pollutants and secondary inorganic aerosol formations over Beijing, China, Atmos. Environ., 357, 121312, https://doi.org/10.1016/j.atmosenv.2025.121312, 2025.
Quan, J.N.: Observations at CITIC station, Beijing during 2020 to 2024, Zenodo [data set], https://doi.org/10.5281/zenodo.18424062, 2026.
Shen, Y., Wu, T., Lian, A., Gao, J., Peng, F., Song, G., Wu, X., Cui, Y., Liu, X., Wan, Y., Yan, J., and Xue, Y.: Dynamic emission characteristics and control strategies of air pollutants from motor vehicles in downtown Beijing, China, J. Environ. Sci., 136, 637–646, 2024.
Stein, A. F., Draxler, R. R., Rolph, G. D., Stunder, B. J. B., Cohen, M. D., and Ngan, F.: NOAA'S HYSPLIT atmospheric transport and dispersion modeling system, B. Am. Meteorol. Soc., 96, 2059–2077, 2015.
Stohl, A.: Trajectory statistics – a new method to establish source-receptor relationships of air pollutants and its application to the transport of particulate sulfate in Europe, Atmos. Environ., 30, 579–587, 1996.
Stull, R. B.: An introduction to boundary layer meteorology, Springer Netherlands, https://doi.org/10.1007/978-94-009-3027-8, 1988.
Sun, P., Nie, W., Chi, X., Huang, X., Ren, C., Xue, L., Shan, Y., Wen, L., Li, H., Chen, T., Qi, Y., Gao, J., Zhang, Q., and Ding, A.: Aircraft study of secondary aerosols in long-range transported air masses from the North China Plain by a mid-latitude cyclone, J. Geophys. Res., 127, e2021JD036178, https://doi.org/10.1029/2021JD036178, 2022.
Tan, Q., Ge, B., Xu, X., Gan, L., Yang, W., Chen, X., Pan, X., Wang, W., Li, J., and Wang, Z.: Increasing impacts of the relative contributions of regional transport on air pollution in Beijing: Observational evidence, Environ. Pollut., 292, 118407, https://doi.org/10.1016/j.envpol.2021.118407, 2021.
Tao, J., Zhang, L., Cao, J., and Zhang, R.: A review of current knowledge concerning PM2.5 chemical composition, aerosol optical properties and their relationships across China, Atmos. Chem. Phys., 17, 9485–9518, https://doi.org/10.5194/acp-17-9485-2017, 2017.
Wang, H., Lu, K., Chen, X., Zhu, Q., Wu, Z., Wu, Y., and Sun, K.: Fast particulate nitrate formation via N2O5 uptake aloft in winter in Beijing, Atmos. Chem. Phys., 18, 10483–10495, https://doi.org/10.5194/acp-18-10483-2018, 2018.
Wang, S., Zhao, W., Xu, X., Fang, B., Zhang, Q., Qian, X., Zhang, W., Chen, W., Pu, W., and Wang, X.: Dependence of columnar aerosol size distribution, optical properties, and chemical components on regional transport in Beijing, Atmos. Environ., 169, 128–139, 2017.
Wang, Y., Meng, J., Liu, Q., Wang, Y., Ma, J., Zhang, X., Liu, X., Yang, K., and Hou, Z.: Effect of vertical transport on sources and evolutionary mechanism of organic aerosols in the wintertime atmosphere of Mt. Huang in East China, Atmos. Environ., 334, 120702, https://doi.org/10.1016/j.atmosenv.2024.120702, 2024.
Williams, L. R., Gonzalez, L. A., Peck, J., Trimborn, D., McInnis, J., Farrar, M. R., Moore, K. D., Jayne, J. T., Robinson, W. A., Lewis, D. K., Onasch, T. B., Canagaratna, M. R., Trimborn, A., Timko, M. T., Magoon, G., Deng, R., Tang, D., de la Rosa Blanco, E., Prévôt, A. S. H., Smith, K. A., and Worsnop, D. R.: Characterization of an aerodynamic lens for transmitting particles greater than 1 micrometer in diameter into the Aerodyne aerosol mass spectrometer, Atmos. Meas. Tech., 6, 3271–3280, https://doi.org/10.5194/amt-6-3271-2013, 2013.
Zhang, H., Cheng, S., Wang, X., Yao, S., and Zhu, F.: Continuous monitoring, compositions analysis and the implication of regional transport for submicron and fine aerosols in Beijing, China, Atmos. Environ., 195, 30–45, 2018a.
Zhang, Y., Tong, S., Ge, M., Jing, B., Hou, S., Tan, F., Chen, Y., Guo, Y., and Wu, L.: The influence of relative humidity on the heterogeneous oxidation of sulfur dioxide by ozone on calcium carbonate particles, Sci. Total Environ., 633, 1253–1262, 2018b.
Zhang, Q., Zheng, Y., Tong, D., Shao, M., and Hao, J.: Drivers of improved PM2.5 air quality in China from 2013 to 2017, P. Natl. Acad. Sci. USA, 116, 24463–24469, 2019.
Zhang, Z., Wang, S., Wang, P., Zhu, S., Zhang, H., and Wang, S.: Regional transport dominates air pollution events in all seasons in Beijing in 2020, Atmos. Environ., 323, 120395, https://doi.org/10.1016/j.atmosenv.2024.120395, 2024.
Zhang, X.: Characteristics of the chemical components of aerosol particles in the various regions over China, Acta Meteorol. Sin., 72, 1108–1117, 2014.
Zhou, W., Xu, W., Kim, H., Zhang, Q., Fu, P., Worsnop, D. R., and Sun, Y.: A review of aerosol chemistry in Asia: insights from aerosol mass spectrometer measurements, Environ. Sci.: Processes Impacts, 22, 1616, https://doi.org/10.1039/d0em00212g, 2020.